Embed Size (px)
Citation preview
Overcapacities in the steel industry
Paris, July 2, 2013
CONFIDENTIAL AND PROPRIETARYAny use of this material without specific permission of McKinsey & Company is strictly prohibited
OECD Steel committee74th session
McKinsey & Company | 1
Disclaimer
While McKinsey & Company developed the outlooks and scenarios in
accordance with its professional standards, McKinsey&Company does not
warrant any results obtained or conclusions drawn from their use. The analyses
and conclusions contained in this document are based on various assumptions
that McKinsey&Company has developed regarding economic growth, and steel
demand, production and capacities which may or may not be correct, being
based upon factors and events subject to uncertainty. Future results or values
could be materially different from any forecast or estimates contained in the
analyses.
The analyses are partly based on information that has not been generated by
McKinsey&Company and has not, therefore, been entirely subject to our
independent verification. McKinsey believes such information to be reliable and
adequately comprehensive but does not represent that such information is in all
respects accurate or complete.
McKinsey & Company | 2
Contents
▪ Overcapacities in the steel industry – a challenge that will persist
▪ Industry restructuring – financial
situation of many steel companies will
require help from outside of the industry
McKinsey & Company | 3
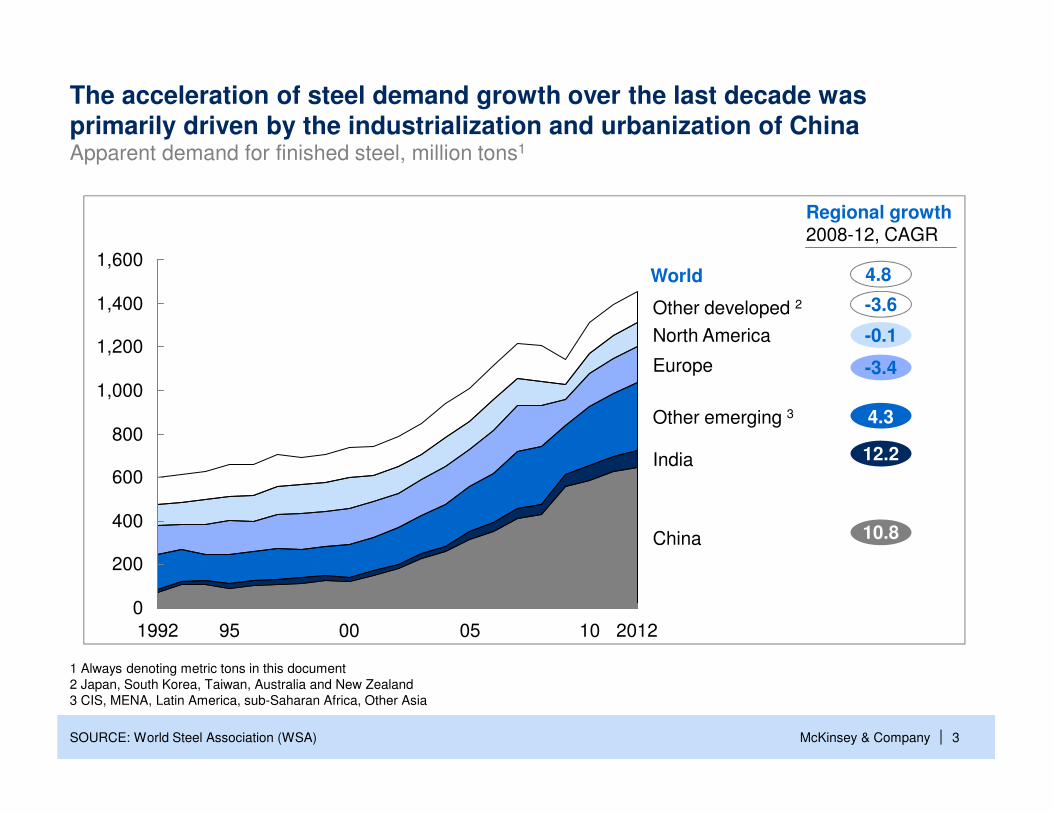
The acceleration of steel demand growth over the last decade was primarily driven by the industrialization and urbanization of ChinaApparent demand for finished steel, million tons1
SOURCE: World Steel Association (WSA)
1 Always denoting metric tons in this document
2 Japan, South Korea, Taiwan, Australia and New Zealand
3 CIS, MENA, Latin America, sub-Saharan Africa, Other Asia
400
200
0
China
India
Other emerging 3
Europe
North America
Other developed 2
20121005
1,600
00951992
1,400
1,200
1,000
800
600
Regional growth2008-12, CAGR
World
-3.6
-0.1
-3.4
4.3
12.2
10.8
4.8
McKinsey & Company | 4
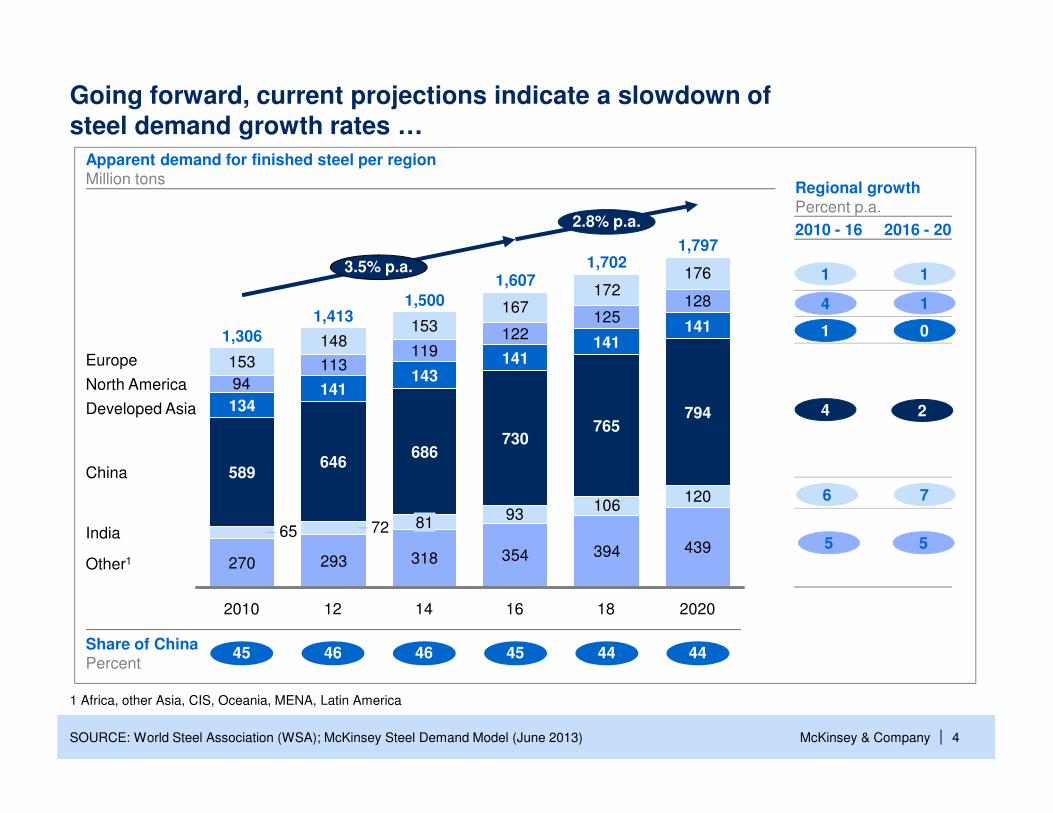
Going forward, current projections indicate a slowdown ofsteel demand growth rates …
270 293 318 354 394 439
93106
120
94113
119122
125128
153
148153
167172
176
7265
2.8% p.a.
3.5% p.a.
Other1
India
China
Developed Asia
North America
Europe
2020
1,797
794
141
18
1,702
765
16
1,607
730
141
14
1,500
81
686
143
12
1,413
646
141
2010
1,306
589
134
141
SOURCE: World Steel Association (WSA); McKinsey Steel Demand Model (June 2013)
Regional growthPercent p.a.
0
1
1
Share of ChinaPercent
45 46 45 4446 44
1
4
1
7
2
6
4
Apparent demand for finished steel per regionMillion tons
1 Africa, other Asia, CIS, Oceania, MENA, Latin America
5 5
2010 - 16 2016 - 20

McKinsey & Company | 5
… while capacities will continue to increase – mostly in markets in the emerging economies
1 Baseline capacity additions that have been announced in the press and which have a high likelihood to come to the market (C0,C1,C2)
2 Capacities that are needed to match demand by key region (assumption: 87% utilization rate for developed, 90% for China, and 65% for
developing regions)
3 Developed world defined as Europe, North America, Developed Asia
Crude steel capacity, million tons
SOURCE: McKinsey Crude Steel Capacity database; WSA
3,000
2,500
2,000
1,500
1,000
500
0
20201918171615141312112010
Known capacity additions1 Potential capacity additions2
2011 - 15 2016 - 20
3.5
1.4
8.3
2.4
1.4
5.6
CAGR
Emerging economies
China
Developed economies
McKinsey & Company | 6
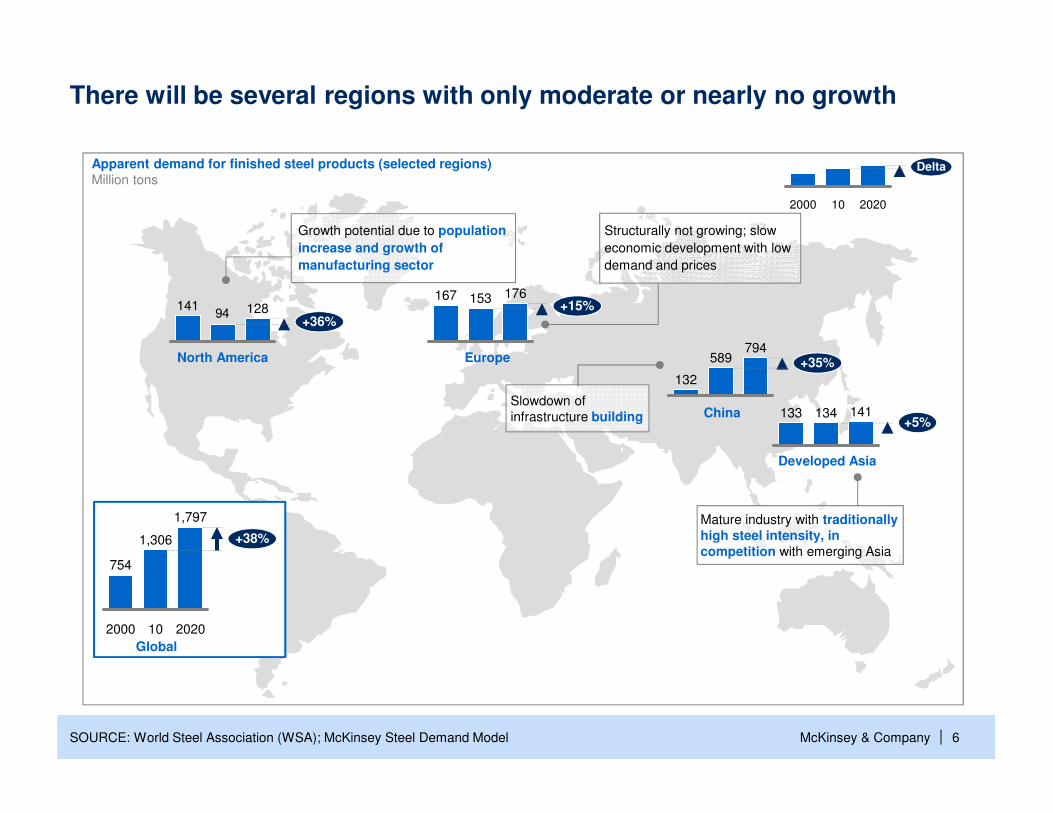
Global
Developed Asia
North America Europe
Growth potential due to population
increase and growth of
manufacturing sector
China
Apparent demand for finished steel products (selected regions)Million tons
There will be several regions with only moderate or nearly no growth
SOURCE: World Steel Association (WSA); McKinsey Steel Demand Model
Slowdown of
infrastructure building
1,797
+38%
202010
1,306
2000
754
Delta
2020102000
141+5%
134133
94 128+36%
141176
+15%153167
Structurally not growing; slow
economic development with low
demand and prices
794+35%589
132
Mature industry with traditionally high steel intensity, in competition with emerging Asia
Global
McKinsey & Company | 7
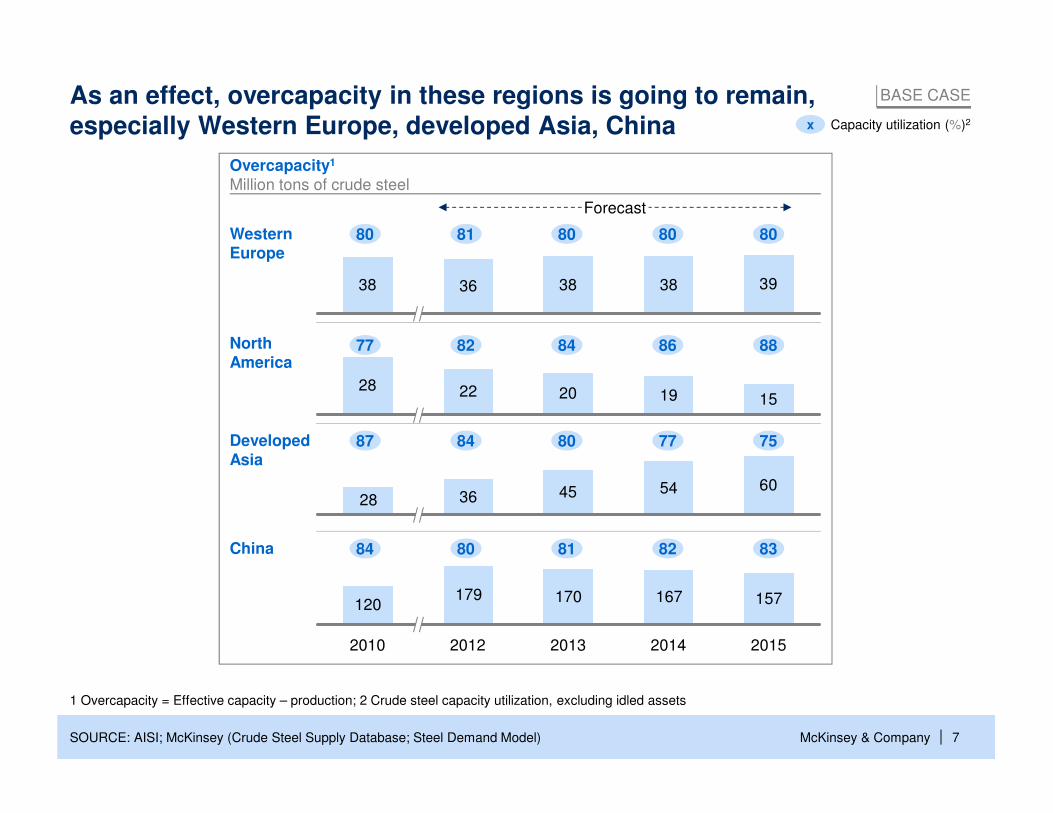
As an effect, overcapacity in these regions is going to remain,especially Western Europe, developed Asia, China
SOURCE: AISI; McKinsey (Crude Steel Supply Database; Steel Demand Model)
1 Overcapacity = Effective capacity – production; 2 Crude steel capacity utilization, excluding idled assets
BASE CASE
x Capacity utilization (%)2
38 36 38 38 39
Overcapacity1
Million tons of crude steel
80 81 80 80 80
Forecast
28 22 20 19 15
36 45 54 6028
120179 170 167 157
20152014201320122010
77 82 84 86 88
87 84 80 77 75
84 80 81 82 83
Western Europe
North America
Developed Asia
China
McKinsey & Company | 8
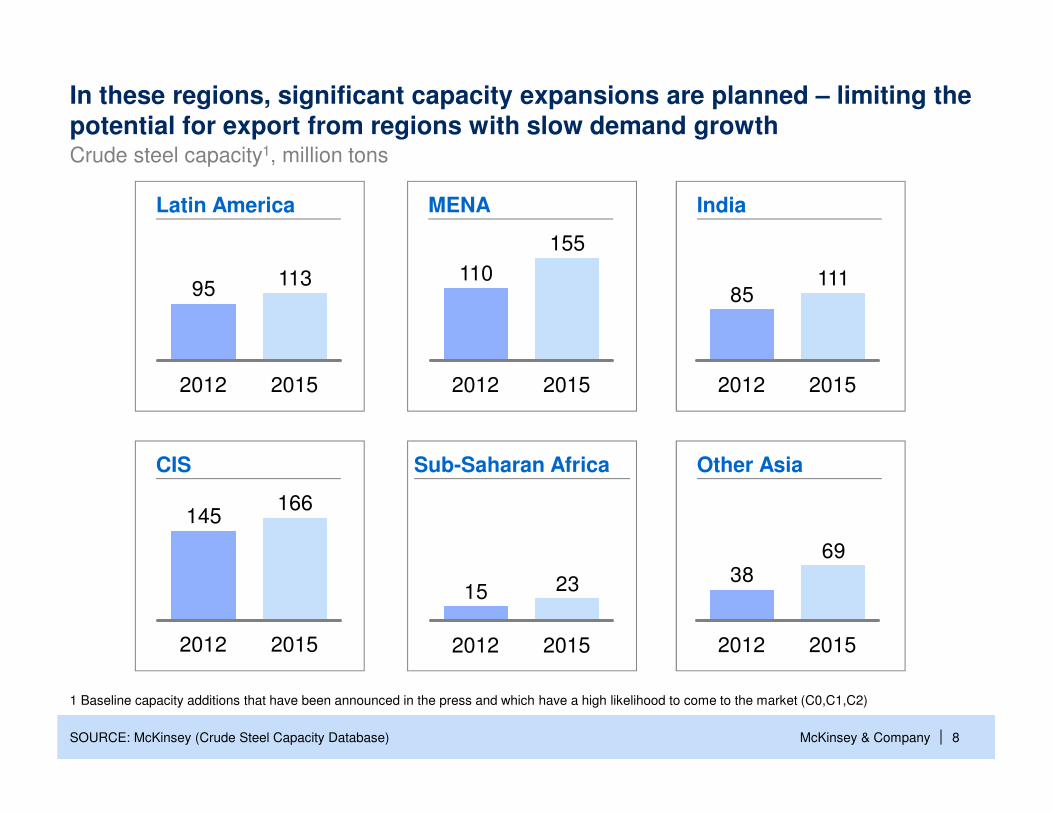
In these regions, significant capacity expansions are planned – limiting the potential for export from regions with slow demand growth Crude steel capacity1, million tons
SOURCE: McKinsey (Crude Steel Capacity Database)
95113
20152012
Latin America
2012
110
155
2015
MENA India
85
20152012
111
2315
2012 2015
Sub-Saharan Africa Other Asia
6938
201520122012 2015
145166
CIS
1 Baseline capacity additions that have been announced in the press and which have a high likelihood to come to the market (C0,C1,C2)
McKinsey & Company |SOURCE: McKinsey
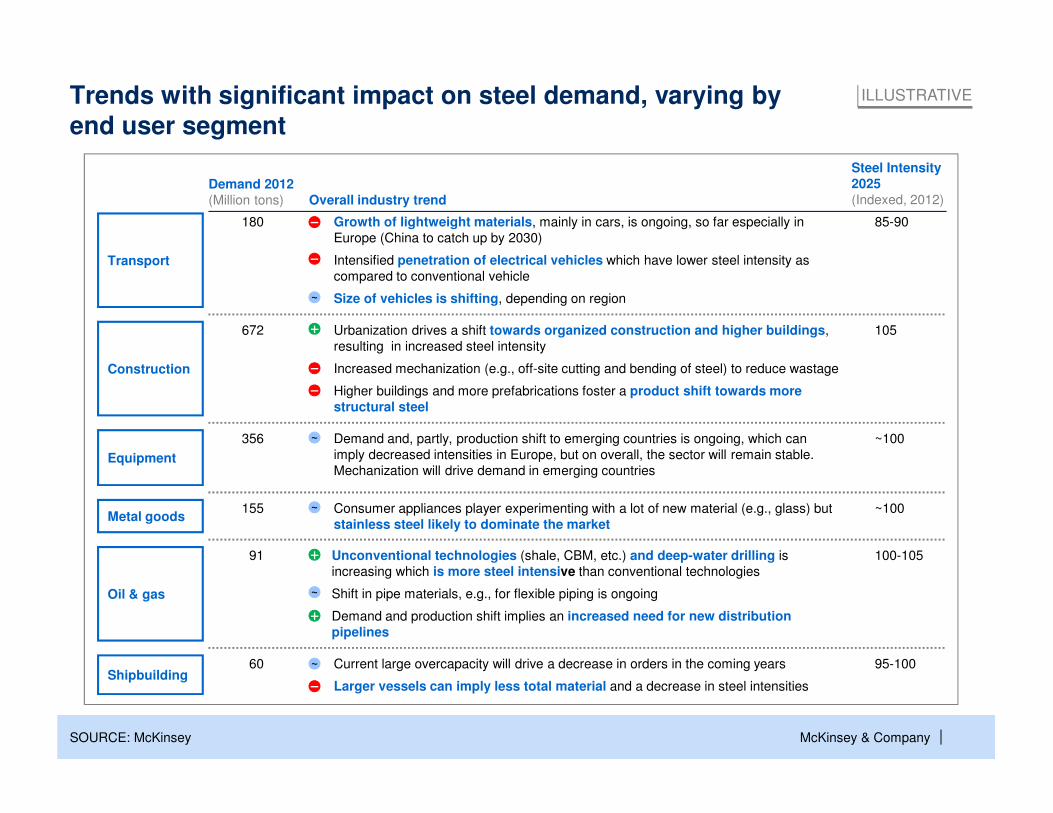
Trends with significant impact on steel demand, varying by end user segment
ILLUSTRATIVE
Transport
Construction
Equipment
Metal goods
Shipbuilding
Oil & gas
180
672
356
91
60
155
Demand 2012 (Million tons)
Steel Intensity 2025(Indexed, 2012)
85-90
105
~100
100-105
95-100
~100
Overall industry trend
Urbanization drives a shift towards organized construction and higher buildings,
resulting in increased steel intensity
Increased mechanization (e.g., off-site cutting and bending of steel) to reduce wastage
Higher buildings and more prefabrications foster a product shift towards more structural steel
Demand and, partly, production shift to emerging countries is ongoing, which can
imply decreased intensities in Europe, but on overall, the sector will remain stable.
Mechanization will drive demand in emerging countries
Unconventional technologies (shale, CBM, etc.) and deep-water drilling is
increasing which is more steel intensive than conventional technologies
Shift in pipe materials, e.g., for flexible piping is ongoing
Demand and production shift implies an increased need for new distribution pipelines
Current large overcapacity will drive a decrease in orders in the coming years
Larger vessels can imply less total material and a decrease in steel intensities
Consumer appliances player experimenting with a lot of new material (e.g., glass) but
stainless steel likely to dominate the market
Growth of lightweight materials, mainly in cars, is ongoing, so far especially in
Europe (China to catch up by 2030)
Intensified penetration of electrical vehicles which have lower steel intensity as
compared to conventional vehicle
Size of vehicles is shifting, depending on region
McKinsey & Company | 10
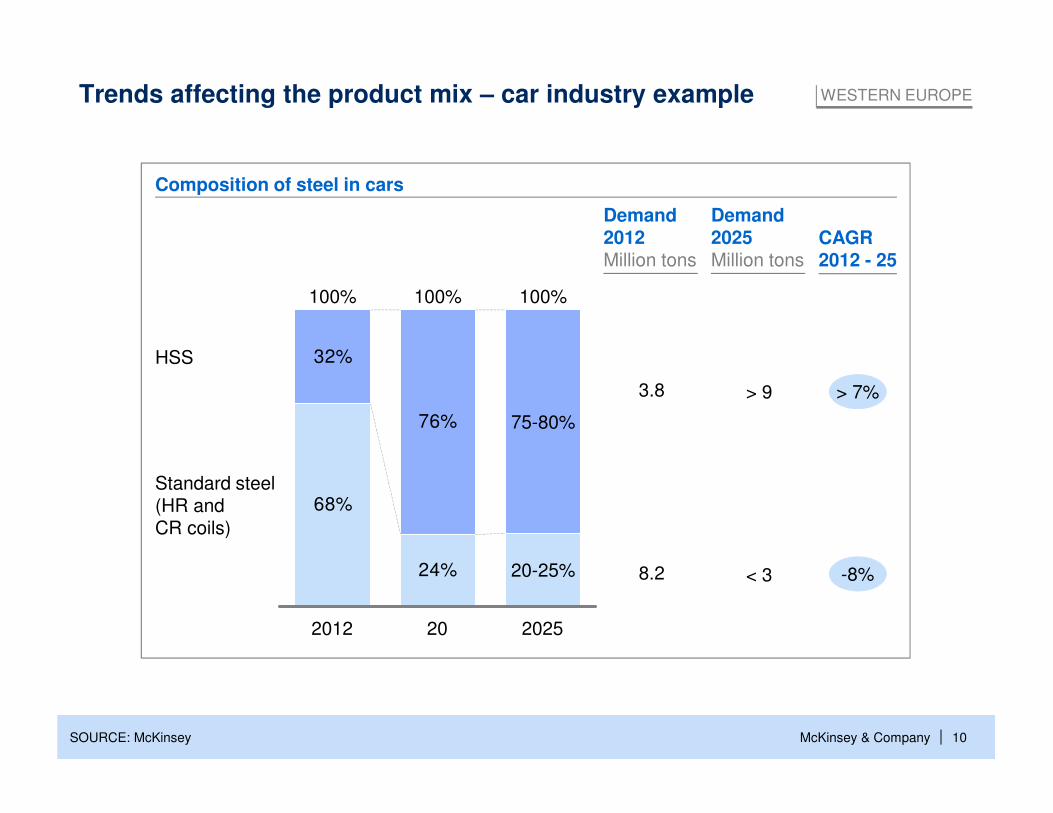
Trends affecting the product mix – car industry example
Demand2012Million tons
Demand2025Million tons
CAGR2012 - 25
68%
24%
32%
76%
Standard steel (HR and CR coils)
HSS
2025
100%
20-25%
75-80%
20
100%
2012
100%
3.8
8.2
> 7%
-8%
> 9
< 3
WESTERN EUROPE
SOURCE: McKinsey
Composition of steel in cars
McKinsey & Company | 11
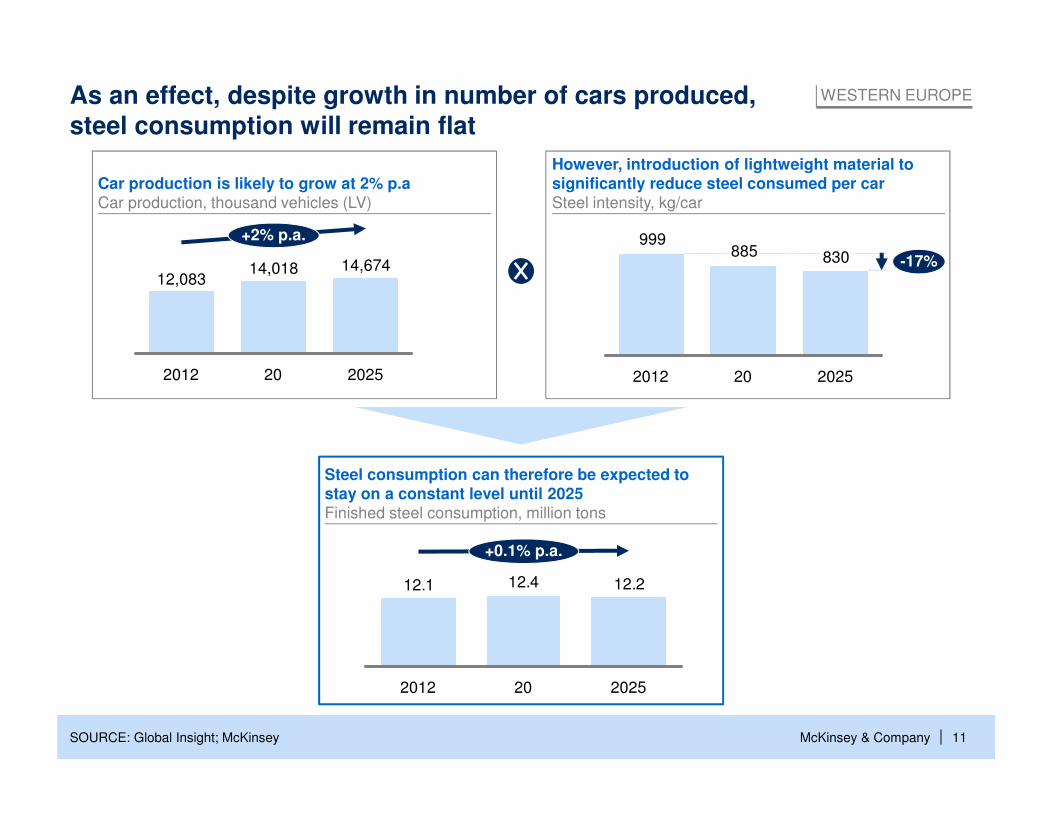
As an effect, despite growth in number of cars produced, steel consumption will remain flat
+2% p.a.
2025
14,674
20
14,018
2012
12,083
12.212.412.1
+0.1% p.a.
2025202012
830885999
-17%
2025202012
WESTERN EUROPE
SOURCE: Global Insight; McKinsey
However, introduction of lightweight material to significantly reduce steel consumed per carSteel intensity, kg/car
Car production is likely to grow at 2% p.aCar production, thousand vehicles (LV)
Steel consumption can therefore be expected to stay on a constant level until 2025Finished steel consumption, million tons
McKinsey & Company | 12
▪ Overcapacities in the steel
industry – a challenge that will persist
▪ Industry restructuring – financial situation of many steel companies will require help from outside of the industry
Contents
McKinsey & Company | 13
06
18.5
07
10.0
08
-2.7
09 10
-24.1
-16.2
11
-29.8
11.3
13E
0.6
12E 2014E04
24.8
05
18.820.9
03
9.3
02
1.3
01
-0.9
2000
0.9
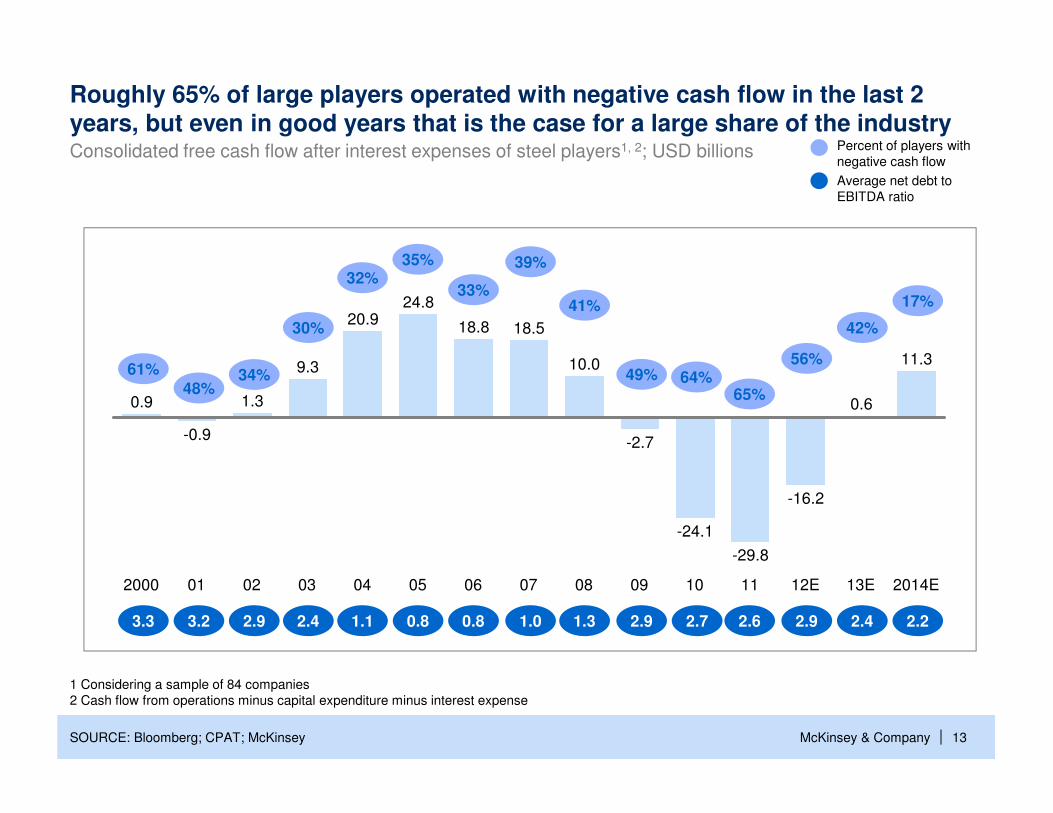
Roughly 65% of large players operated with negative cash flow in the last 2 years, but even in good years that is the case for a large share of the industry
SOURCE: Bloomberg; CPAT; McKinsey
Consolidated free cash flow after interest expenses of steel players1, 2; USD billions
1 Considering a sample of 84 companies
2 Cash flow from operations minus capital expenditure minus interest expense
Percent of players with
negative cash flow
Average net debt to
EBITDA ratio
3.3 3.2 2.9 2.4 1.1 0.8 0.8 1.0 1.3 2.9 2.7 2.9 2.4 2.22.6
61%
48%34%
30%
32%33%
39%
41%
49%
65%
56%
42%
17%
64%
35%
McKinsey & Company | 14
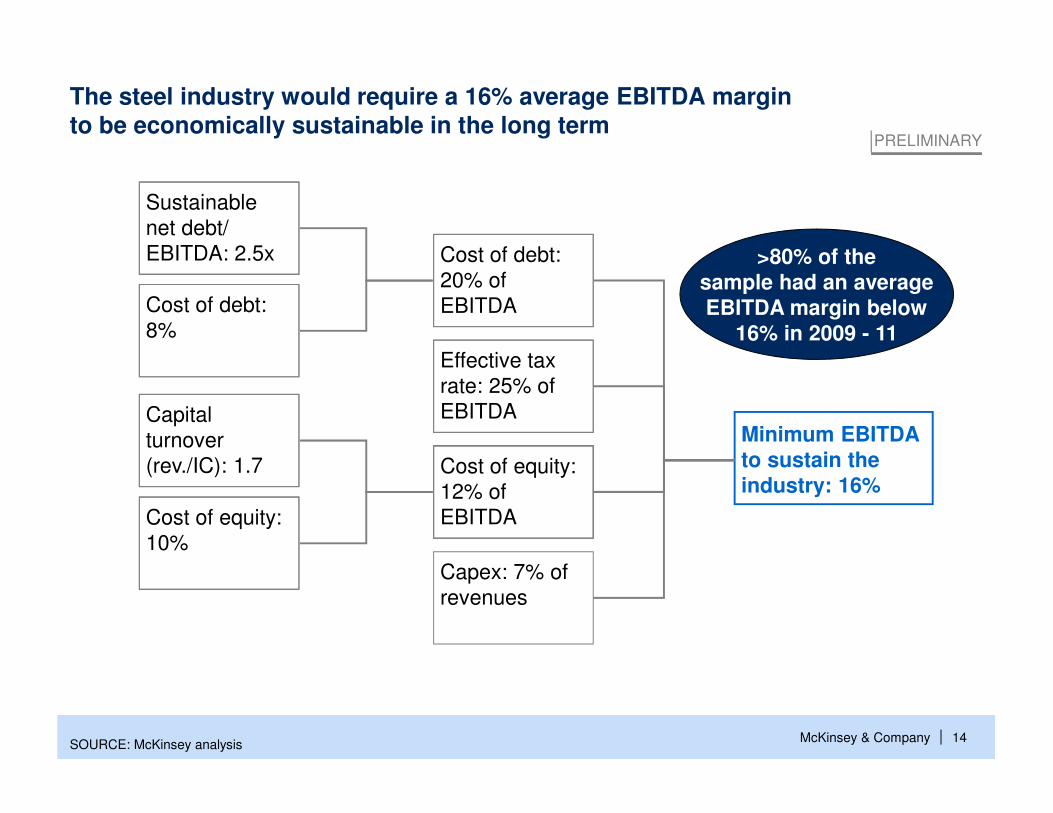
The steel industry would require a 16% average EBITDA margin to be economically sustainable in the long term
SOURCE: McKinsey analysis
Sustainable
net debt/
EBITDA: 2.5x
Cost of debt:
8%
Minimum EBITDA to sustain the industry: 16%
Capex: 7% of
revenues
Effective tax
rate: 25% of
EBITDA
Cost of debt:
20% of
EBITDA
Cost of equity:
12% of
EBITDA
Capital
turnover
(rev./IC): 1.7
Cost of equity:
10%
PRELIMINARY
>80% of thesample had an average EBITDA margin below
16% in 2009 - 11
McKinsey & Company | 15
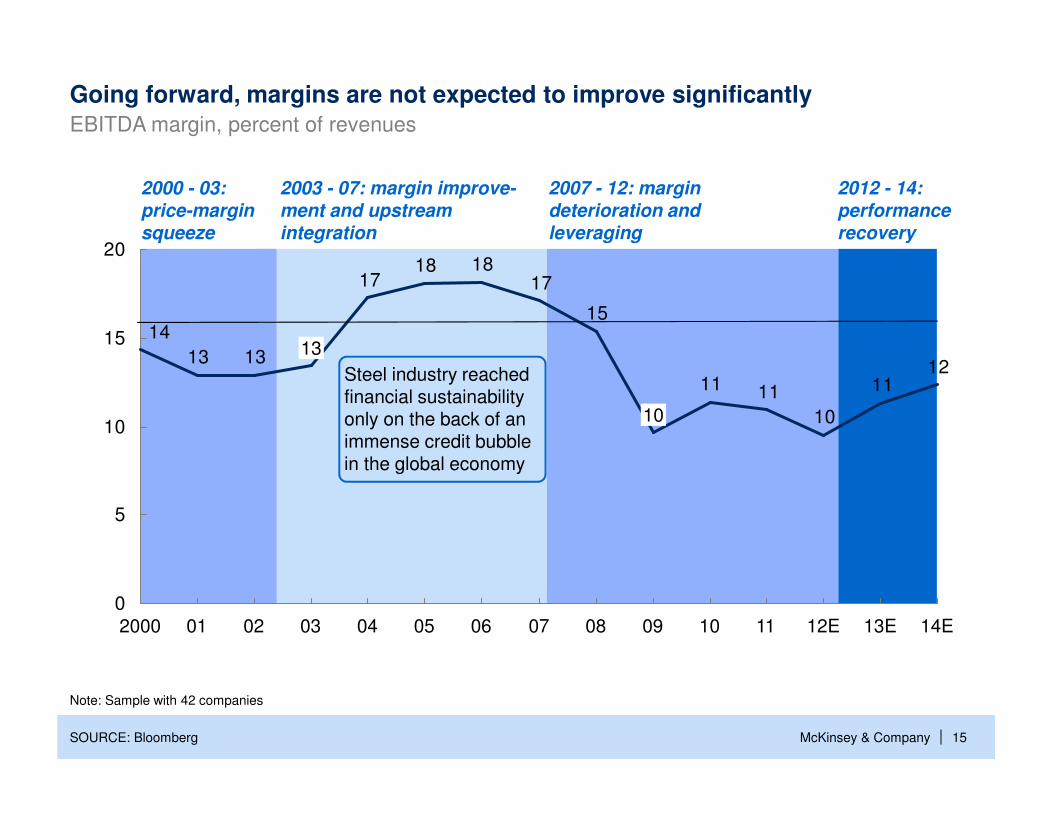
Going forward, margins are not expected to improve significantly
SOURCE: Bloomberg
EBITDA margin, percent of revenues
2000 - 03:
price-margin
squeeze
2003 - 07: margin improve-
ment and upstream
integration
2007 - 12: margin
deterioration and
leveraging
2012 - 14:
performance
recovery
1211
10
1111
15
171818
17
1313
14
0
5
10
15
20
10
14E13E12E11100908070605040302012000
13
Note: Sample with 42 companies
Steel industry reached financial sustainability only on the back of an immense credit bubble in the global economy
McKinsey & Company | 16
-2
-1
0
1
2
3
4
5
6
7
8
9
10
11
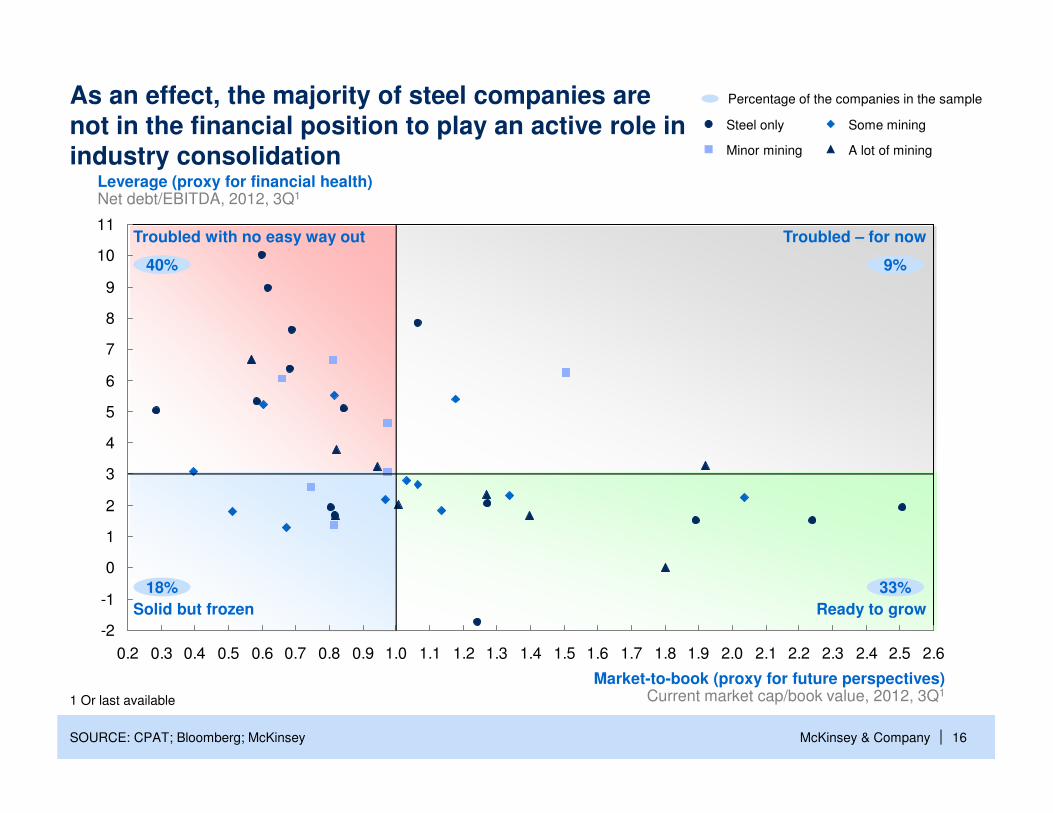
0.2 0.3 0.4 0.5 0.6 0.7 0.8 0.9 1.0 1.1 1.2 1.3 1.4 1.5 1.6 1.7 1.8 1.9 2.0 2.1 2.2 2.3 2.4 2.5 2.6
Leverage (proxy for financial health)Net debt/EBITDA, 2012, 3Q1
Market-to-book (proxy for future perspectives)Current market cap/book value, 2012, 3Q1
As an effect, the majority of steel companies are not in the financial position to play an active role in industry consolidation
SOURCE: CPAT; Bloomberg; McKinsey
Troubled with no easy way out Troubled – for now
Solid but frozen Ready to grow
Percentage of the companies in the sample
A lot of mining
Some mining
Minor mining
Steel only
9%
1 Or last available
40%
18% 33%
McKinsey & Company | 17
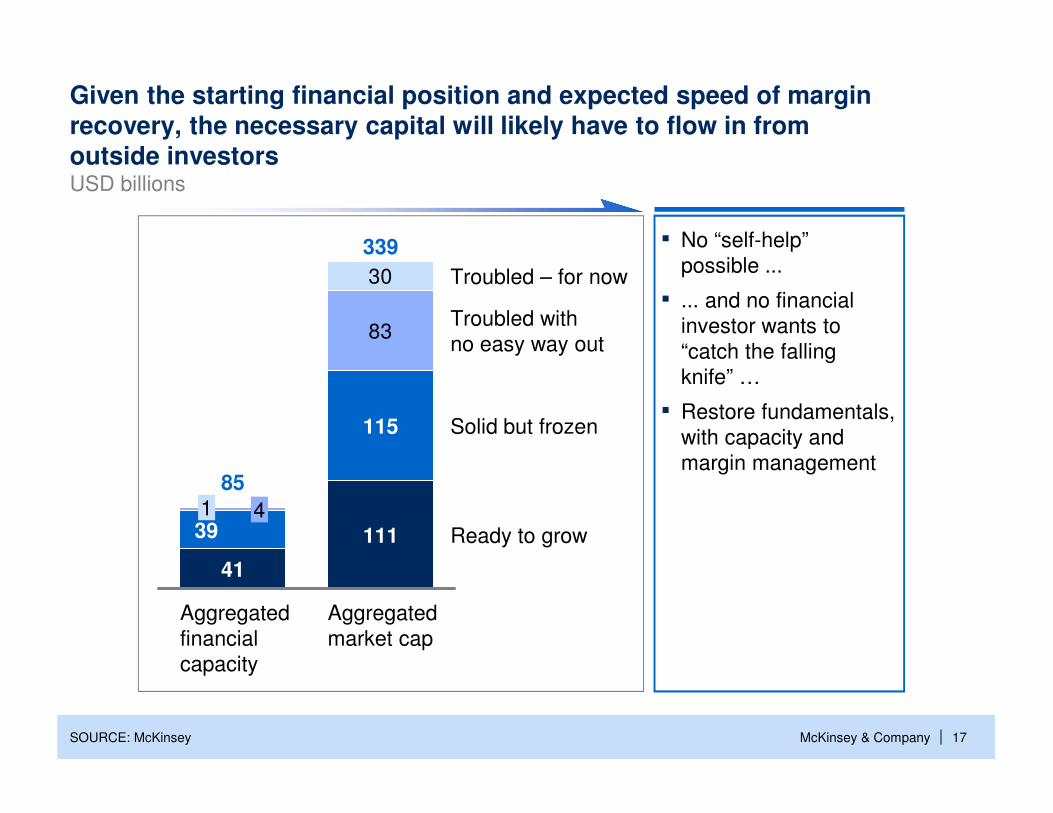
Given the starting financial position and expected speed of margin recovery, the necessary capital will likely have to flow in from outside investors
83
30
Ready to grow
Solid but frozen
Troubled with
no easy way out
Troubled – for now
Aggregated
market cap
339
111
115
Aggregated
financial
capacity
85
41
3941
SOURCE: McKinsey
USD billions
▪ No “self-help”
possible ...
▪ ... and no financial
investor wants to
“catch the falling
knife” …
▪ Restore fundamentals,
with capacity and
margin management