Embed Size (px)
Citation preview

TENNESSEE
SOME ACTIONS ALREADY TAKEN
WEAKNESSES
• The state’s Hazard Mitigation Plan, technical assistance programs, disaster response plans, emergency communications materials, and sector-specific programs are helping the state address current risks across sectors.
• Tennessee Department of Transportation participated in an FHWA Extreme Weather Vulnerability Assessment Pilot Project. The project included a statewide climate change vulnerability assessment the for transportation sector.
• The North Central Water Resources Regional Planning Pilot discusses potential increased pressure on drinking water supplies and environmental uncertainties because of climate change.
• The Tennessee Department of Health (DOH) tracks heat-related illness. This tracking data can be used to monitor changes over location and time, monitor vulnerable areas and populations, and evaluate the results of local climate adaptation strategies.
• Limited evidence of detailed statewide climate change vulnerability assessments across the sectors examined.
• No evidence of detailed statewide climate change adaptation plans across the sectors examined.
• No evidence of dedicated state funding, policies, or guidelines to improve resilience to climate change-related extreme heat, drought, wildfire, or inland flooding.
• No evidence of action to incorporate climate change projections associated with extreme heat, drought, wildfire, or inland flooding into state-level programs, investments, and activities.
• No evidence of public outreach about climate change-related risks.
Implementing Resilience Actions
Addressing Current Risks
Conducting VulnerabilityAssessments
Planning for Adaptation
Extensive
Strong
Limited
Fair
None
ACTION TAKEN:
Extreme Heat
Drought
Wildfire
Inland Flooding
Coastal Flooding
EXTREME HEAT:
DROUGHT:
WILDFIRE:
INLAND FLOODING:
COASTAL FLOODING:
OVERALL: CC+
C+
C+
D
—
ABCDF
OVERALL GRADE:
CTennessee faces considerable and significantly increasing threat levels from extreme heat, drought, wildfire, and inland flooding between now and 2050. Tennessee scores an overall grade of C on the Report Card, with grades ranging from a D for inland flooding to a C+ for extreme heat, drought, and wildfire. The grades are relative to other states, and relative to the magnitude of the climate threats themselves. Tennessee has taken strong action to address its current climate risks, including a comprehensive Hazard Mitigation Plan and threat-specific programs like Firewise (wildfire), Silver Jackets (inland flooding), and the Tennessee Drought Management Plan (drought). Tennessee has also taken limited action to assess its climate change vulnerabilities for the transportation sector. Tennessee has not assessed climate change vulnerabilities for other sectors, and it has taken no action to develop or implement an adaptation plan.

0510152025 million
OVERALL:
DROUGHT:
WILDFIRE:
INLAND FLOODING:
EXTREME HEAT:
COASTAL FLOODING:
EXTREME HEAT: C+C
C+
C+
D
—
C+
KEY FINDINGS:
Lowest Highest
ABOVE AVERAGE
THREAT LEVEL:
0% 100%
AVERAGE
PREPAREDNESS LEVEL:
The preparedness grade represents how well a state is preparing for its threat level, relative to all states evaluated for that threat. It compares a state’s position in the distribution of threat levels to its position in the distribution of preparedness scores. Thus two states with the same absolute preparedness score might receive different grades, depending on their levels of threat—a state with a higher threat level would receive a lower grade. For details, see the methodology.
Tennessee earns a C+ for its average level of preparedness in the face of an above average overall extreme heat threat. Currently, Tennessee faces an above average threat among the lower 48 states; like most states, it has taken strong action to address its current heat risks through its Hazard Mitigation Plan and communication materials for residents to help prepare for and deal with extreme heat. By 2050, Tennessee is projected to see an above average increase in threat level, and continue to face an above average threat. However, Tennessee has taken limited action to prepare for its future heat risks. There is no evidence that the state has completed a detailed climate change vulnerability assessment, or that it has developed a statewide adaptation plan that covers its future heat risks.
ABCDF
TENNESSEE COMPARED TO OTHER STATES:
EXTREME HEAT THREAT DID YOU KNOW?Extreme Heat Threat to Vulnerable Populations†
Rank(among states) 8th 9th
† Average number of heat wave days per year times total vulnerable popula-tion. A score of 1 represents 1 vulnerable person exposed to 1 heat wave day.
8th
• Currently, Tennessee averages 10 days a year classified as dangerous or extremely dangerous according to the NWS Heat Index. By 2050, Tennessee is projected to see 55 such days annually, a more than 5-fold increase.
• By 2050, the typical number of heat wave days in Tennessee is projected to increase from nearly 15 to more than 70 days per year.
• Tennessee has more than 200,000 people 65 and older, or under 5 years old, living below the poverty line. These groups are considered to be especially vulnerable to extreme heat.
Average annual number of heat wave days: Average number of days each year on which the maximum temperature exceeds the 95th percentile of daily maximum temperature in the baseline period (1991-2010) for at least three consecutive days.
TENNESSEE
2000 2030 2050

n/a
n/a
n/a
n/a
n/a
n/a
n/a
n/a
n/a
n/a
n/a
n/a
NO
NO
NO
NO
NO
NO
NO
NO
NO
NO
NO
NO
NO
NO
NO
NO
NO
NO
NO
NO
NO
n/a
NO
NO
NO
NO
NO
NO
NO
NO
n/a
EXTREME HEAT:EXAMPLE CRITERIA
C+A subset of the criteria used to develop Tennessee’s extreme heat preparedness grade.
Tran
spor
tatio
n
Ener
gy
Wat
er
Health
Com
mun
ities
Does the State Hazard Mitigation Plan cover extreme heat?
Does the state have an extreme heat emergency response plan that is updated routinely?
Does the state provide extreme heat emergency communication materials for citizens?
Has the state published information on how the frequency or severity of extreme heat events may change in the future?
Has the state conducted extreme heat vulnerability assessments for each sector?
Is the state tracking extreme heat impacts?
Is there a statewide climate change adaptation plan covering extreme heat?
Is there a statewide implementation plan for climate change adaptation?
Does the state have sector-specific extreme heat adaptation plans?
Are there optional state guidelines for resilient activities (e.g., construction)?
Are there state requirements for resilient activities (e.g., construction)?
Is there evidence that the state is implementing extreme heat adaptation policy/guidelines?
ADDRESSING CURRENT RISKS
IMPLEMENTING RESILIENCE ACTIONS
PLANNING FOR ADAPTATION
CONDUCTING VULNERABILITY ASSESSMENTS
“n/a” indicates that the sector is either insensitive to the threat or the state does not have a significant role.
TENNESSEE
OVERALL:
DROUGHT:
WILDFIRE:
INLAND FLOODING:
COASTAL FLOODING:
EXTREME HEAT: C+
C
C+C+
D
—
TENNESSEE
DROUGHT: C+
Lowest Highest
BELOW AVERAGE
THREAT LEVEL:
0% 100%
AVERAGE
PREPAREDNESS LEVEL:
The preparedness grade represents how well a state is preparing for its threat level, relative to all states evaluated for that threat. It compares a state’s position in the distribution of threat levels to its position in the distribution of preparedness scores. Thus two states with the same absolute preparedness score might receive different grades, depending on their levels of threat—a state with a higher threat level would receive a lower grade. For details, see the methodology.
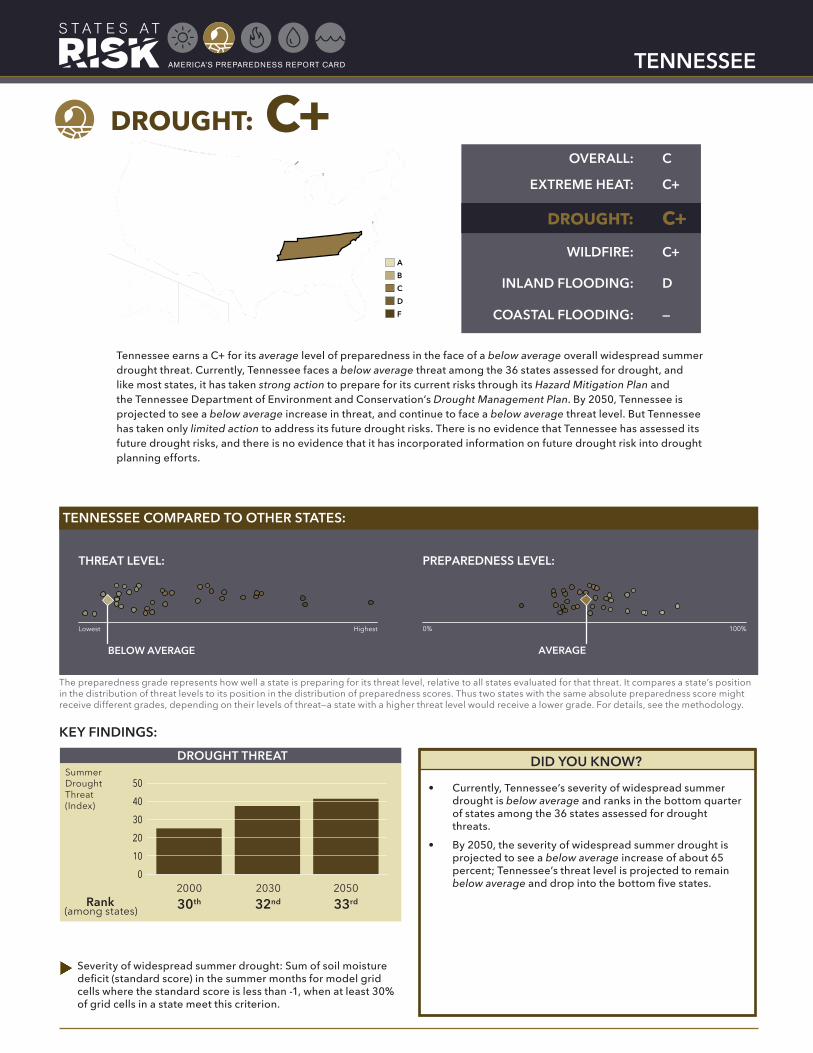
Tennessee earns a C+ for its average level of preparedness in the face of a below average overall widespread summer drought threat. Currently, Tennessee faces a below average threat among the 36 states assessed for drought, and like most states, it has taken strong action to prepare for its current risks through its Hazard Mitigation Plan and the Tennessee Department of Environment and Conservation’s Drought Management Plan. By 2050, Tennessee is projected to see a below average increase in threat, and continue to face a below average threat level. But Tennessee has taken only limited action to address its future drought risks. There is no evidence that Tennessee has assessed its future drought risks, and there is no evidence that it has incorporated information on future drought risk into drought planning efforts.
ABCDF
TENNESSEE COMPARED TO OTHER STATES:
KEY FINDINGS:
01020304050
DROUGHT THREATSummer Drought Threat (Index)
Rank(among states) 30th 32nd 33rd
• Currently, Tennessee’s severity of widespread summer drought is below average and ranks in the bottom quarter of states among the 36 states assessed for drought threats.
• By 2050, the severity of widespread summer drought is projected to see a below average increase of about 65 percent; Tennessee’s threat level is projected to remain below average and drop into the bottom five states.
DID YOU KNOW?
Severity of widespread summer drought: Sum of soil moisture deficit (standard score) in the summer months for model grid cells where the standard score is less than -1, when at least 30% of grid cells in a state meet this criterion.
2000 2030 2050

DROUGHT:
TENNESSEE
C+EXAMPLE CRITERIAA subset of the criteria used to develop Tennessee’s drought preparedness grade.
“n/a” indicates that the sector is either insensitive to the threat or the state does not have a significant role.
n/a
n/a
n/a
n/a
n/a
n/a
n/a
n/a
n/a
n/a
n/a
n/a
NO
NO
NO
NO
NO
NO
NO
NO
NO
NO
NO
NO
NO
NO
NO
NO
NO
NO
NO
NO
NO
n/a
NO
n/a
n/a
n/a
n/a
n/a
n/a
n/a
n/a
n/a
n/a
n/a
n/a
Tran
spor
tatio
n
Ener
gy
Wat
er
Health
Com
mun
ities
Does the State Hazard Mitigation Plan cover drought?
Does the state have a drought emergency response plan that is updated routinely?
Does the state provide drought emergency communication materials for citizens?
Has the state published information on how the frequency or severity of drought may change in the future?
Has the state conducted drought vulnerability assessments for each sector?
Is the state tracking drought impacts?
Is there a statewide climate change adaptation plan covering drought?
Is there a statewide implementation plan for climate change adaptation?
Does the state have sector-specific drought adaptation plans?
Are there optional state guidelines for resilient activities (e.g., construction)?
Are there state requirements for resilient activities (e.g., construction)?
Is there evidence that the state is implementing drought adaptation policy/guidelines?
ADDRESSING CURRENT RISKS
IMPLEMENTING RESILIENCE ACTIONS
PLANNING FOR ADAPTATION
CONDUCTING VULNERABILITY ASSESSMENTS
OVERALL:
DROUGHT:
WILDFIRE:
INLAND FLOODING:
COASTAL FLOODING:
EXTREME HEAT: C+
C
C+
C+D
—
TENNESSEE
C+
Lowest Highest
BELOW AVERAGE
THREAT LEVEL:
0% 100%
AVERAGE
PREPAREDNESS LEVEL:
The preparedness grade represents how well a state is preparing for its threat level, relative to all states evaluated for that threat. It compares a state’s position in the distribution of threat levels to its position in the distribution of preparedness scores. Thus two states with the same absolute preparedness score might receive different grades, depending on their levels of threat—a state with a higher threat level would receive a lower grade. For details, see the methodology.
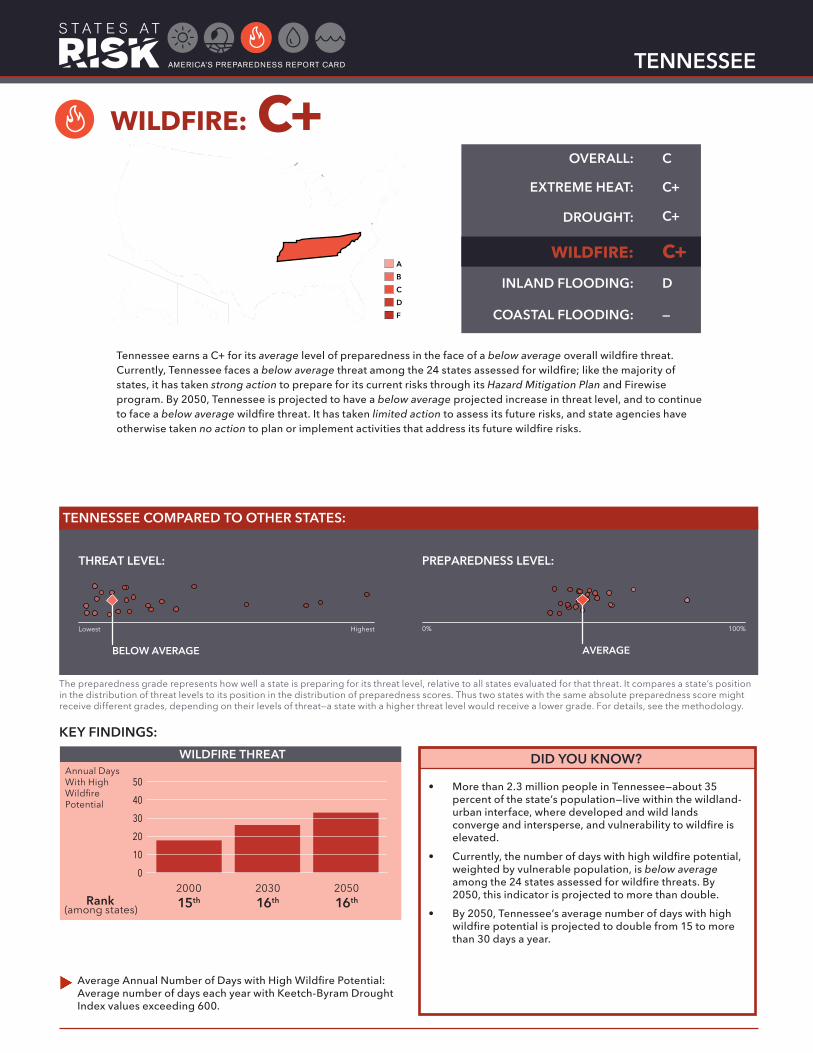
Tennessee earns a C+ for its average level of preparedness in the face of a below average overall wildfire threat. Currently, Tennessee faces a below average threat among the 24 states assessed for wildfire; like the majority of states, it has taken strong action to prepare for its current risks through its Hazard Mitigation Plan and Firewise program. By 2050, Tennessee is projected to have a below average projected increase in threat level, and to continue to face a below average wildfire threat. It has taken limited action to assess its future risks, and state agencies have otherwise taken no action to plan or implement activities that address its future wildfire risks.
ABCDF
TENNESSEE COMPARED TO OTHER STATES:
KEY FINDINGS:
WILDFIRE:
01020304050
WILDFIRE THREATAnnual Days With High Wildfire Potential
Rank(among states) 15th 16th 16th
• More than 2.3 million people in Tennessee—about 35 percent of the state’s population—live within the wildland-urban interface, where developed and wild lands converge and intersperse, and vulnerability to wildfire is elevated.
• Currently, the number of days with high wildfire potential, weighted by vulnerable population, is below average among the 24 states assessed for wildfire threats. By 2050, this indicator is projected to more than double.
• By 2050, Tennessee’s average number of days with high wildfire potential is projected to double from 15 to more than 30 days a year.
DID YOU KNOW?
Average Annual Number of Days with High Wildfire Potential: Average number of days each year with Keetch-Byram Drought Index values exceeding 600.
2000 2030 2050
TENNESSEE
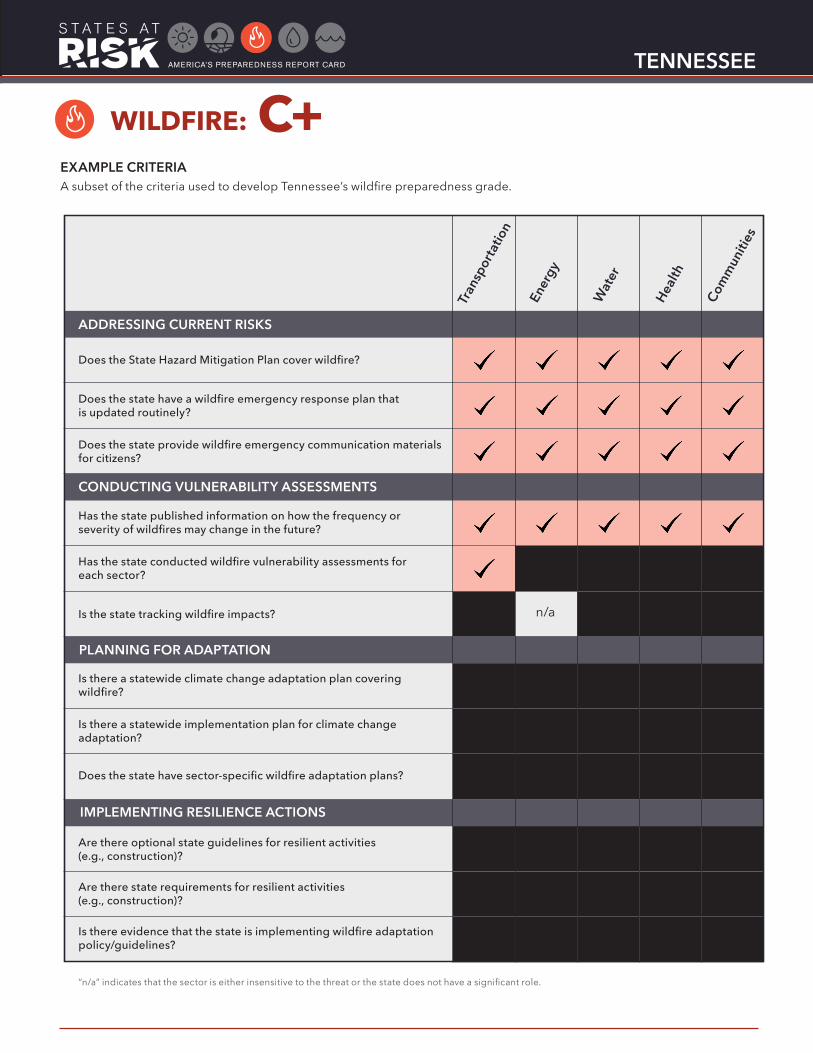
C+EXAMPLE CRITERIAA subset of the criteria used to develop Tennessee’s wildfire preparedness grade.
WILDFIRE:
“n/a” indicates that the sector is either insensitive to the threat or the state does not have a significant role.
NO
NO
NO
NO
NO
NO
NO
NO
NO
NO
NO
NO
NO
NO
NO
NO
NO
NO
NO
NO
NO
NO
NO
NO
NO
NO
NO
NO
NO
NO
n/a
NO
NO
NO
NO
NO
NO
NO
NO
Tran
spor
tatio
n
Ener
gy
Wat
er
Health
Com
mun
ities
Does the State Hazard Mitigation Plan cover wildfire?
Does the state have a wildfire emergency response plan that is updated routinely?
Does the state provide wildfire emergency communication materials for citizens?
Has the state published information on how the frequency or severity of wildfires may change in the future?
Has the state conducted wildfire vulnerability assessments for each sector?
Is the state tracking wildfire impacts?
Is there a statewide climate change adaptation plan covering wildfire?
Is there a statewide implementation plan for climate change adaptation?
Does the state have sector-specific wildfire adaptation plans?
Are there optional state guidelines for resilient activities (e.g., construction)?
Are there state requirements for resilient activities (e.g., construction)?
Is there evidence that the state is implementing wildfire adaptation policy/guidelines?
ADDRESSING CURRENT RISKS
IMPLEMENTING RESILIENCE ACTIONS
PLANNING FOR ADAPTATION
CONDUCTING VULNERABILITY ASSESSMENTS
OVERALL:
DROUGHT:
WILDFIRE:
INLAND FLOODING:
COASTAL FLOODING:
EXTREME HEAT: C+
C
C+
C+
D—
TENNESSEE
INLAND FLOODING: D
Lowest Highest
ABOVE AVERAGE
THREAT LEVEL:
0% 100%
BELOW AVERAGE
PREPAREDNESS LEVEL:
The preparedness grade represents how well a state is preparing for its threat level, relative to all states evaluated for that threat. It compares a state’s position in the distribution of threat levels to its position in the distribution of preparedness scores. Thus two states with the same absolute preparedness score might receive different grades, depending on their levels of threat—a state with a higher threat level would receive a lower grade. For details, see the methodology.
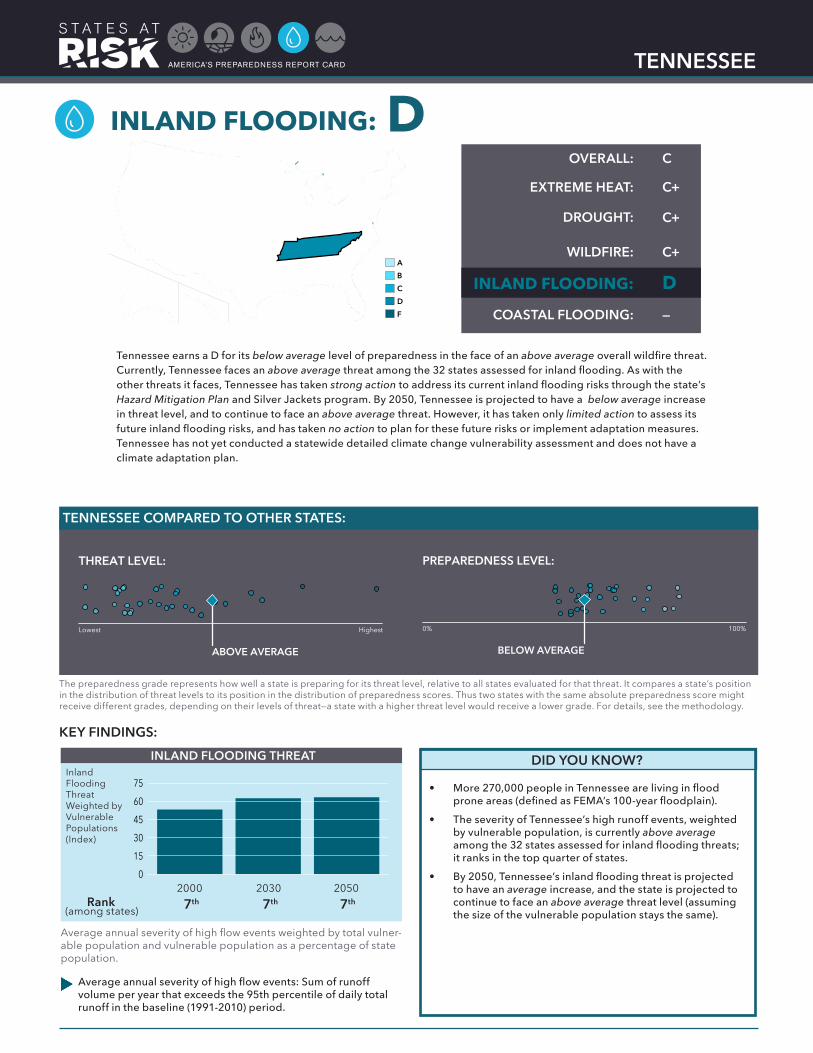
Tennessee earns a D for its below average level of preparedness in the face of an above average overall wildfire threat. Currently, Tennessee faces an above average threat among the 32 states assessed for inland flooding. As with the other threats it faces, Tennessee has taken strong action to address its current inland flooding risks through the state’s Hazard Mitigation Plan and Silver Jackets program. By 2050, Tennessee is projected to have a below average increase in threat level, and to continue to face an above average threat. However, it has taken only limited action to assess its future inland flooding risks, and has taken no action to plan for these future risks or implement adaptation measures. Tennessee has not yet conducted a statewide detailed climate change vulnerability assessment and does not have a climate adaptation plan.
ABCDF
TENNESSEE COMPARED TO OTHER STATES:
KEY FINDINGS:
01530456075
INLAND FLOODING THREATInland Flooding Threat Weighted by Vulnerable Populations (Index)
Rank(among states) 7th 7th
Average annual severity of high flow events weighted by total vulner-able population and vulnerable population as a percentage of state population.
7th
• More 270,000 people in Tennessee are living in flood prone areas (defined as FEMA’s 100-year floodplain).
• The severity of Tennessee’s high runoff events, weighted by vulnerable population, is currently above average among the 32 states assessed for inland flooding threats; it ranks in the top quarter of states.
• By 2050, Tennessee’s inland flooding threat is projected to have an average increase, and the state is projected to continue to face an above average threat level (assuming the size of the vulnerable population stays the same).
DID YOU KNOW?
Average annual severity of high flow events: Sum of runoff volume per year that exceeds the 95th percentile of daily total runoff in the baseline (1991-2010) period.
2000 2030 2050
TENNESSEE
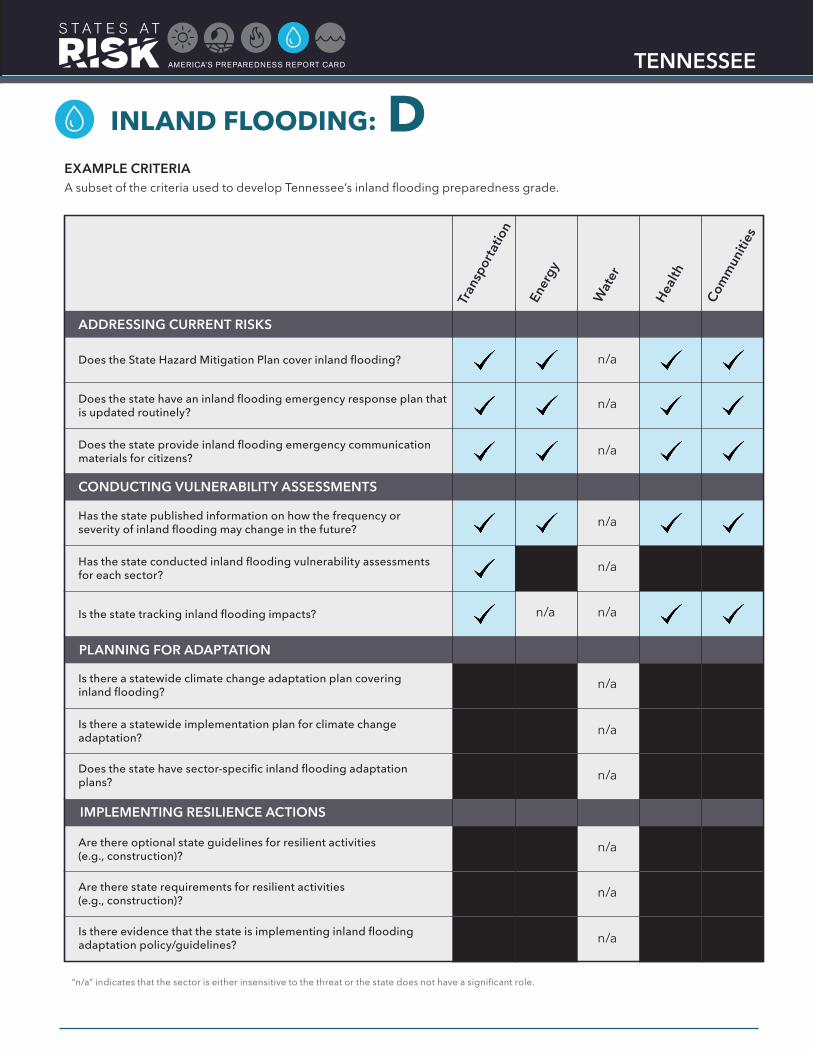
INLAND FLOODING: DEXAMPLE CRITERIAA subset of the criteria used to develop Tennessee’s inland flooding preparedness grade.
“n/a” indicates that the sector is either insensitive to the threat or the state does not have a significant role.
NO
NO
NO
NO
NO
NO
NO
NO
NO
NO
NO
NO
NO
NO
n/a
n/a
n/a
n/a
n/a
n/a
n/a
n/a
n/a
n/a
n/a
n/a
NO
NO
NO
NO
NO
NO
n/a
NO
NO
NO
NO
NO
NO
NO
Tran
spor
tatio
n
Ener
gy
Wat
er
Health
Com
mun
ities
Does the State Hazard Mitigation Plan cover inland flooding?
Does the state have an inland flooding emergency response plan that is updated routinely?
Does the state provide inland flooding emergency communication materials for citizens?
Has the state published information on how the frequency or severity of inland flooding may change in the future?
Has the state conducted inland flooding vulnerability assessments for each sector?
Is the state tracking inland flooding impacts?
Is there a statewide climate change adaptation plan covering inland flooding?
Is there a statewide implementation plan for climate change adaptation?
Does the state have sector-specific inland flooding adaptation plans?
Are there optional state guidelines for resilient activities (e.g., construction)?
Are there state requirements for resilient activities (e.g., construction)?
Is there evidence that the state is implementing inland flooding adaptation policy/guidelines?
ADDRESSING CURRENT RISKS
IMPLEMENTING RESILIENCE ACTIONS
PLANNING FOR ADAPTATION
CONDUCTING VULNERABILITY ASSESSMENTS