Embed Size (px)
Citation preview

Over the last half a century, Asia and the Pacific region has shown remarkable resolve and results in providing plentiful inexpensive supplies of food and improving the quality of life for its citizens. But the future challenges of ensuring food and nutrition security for all its people remain equally daunting. At the same time, rapidly increasing demand for animal protein and the concomitant changes in the nature of production and marketing systems for livestock products are placing huge pressures on the natural resource base, biophysical environment and human, animal and ecosystem health in the region. To discuss effective ways of informing policy choices to promote sustainable livestock sector development, an international policy forum was organized in Bangkok on 16-17 August 2012. The forum brought together critical thinkers, policy makers and practitioners from around the region and a number of international agencies and networks. The group strongly recommended creating a neutral regional policy platform for facilitating regional cooperation, knowledge exchange, policy dialogue and catalytic action in pursuit of shared goals. This publication presents the discussions and conclusions of the policy forum and brings together a rich body of background analytical work prepared in support of the dialogue.
Vinod Ahuja is Livestock Policy Officer at the FAO Regional Office for Asia and the Pacific, Bangkok. Thailand

Asian livestockChallenges, opportunities and the response
Proceedings of an international policy forum held in Bangkok, Thailand, 16-17 August 2012
RAP Publication 2012/28
Editor: Vinod Ahuja

Ahuja, Vinod (Editor). 2013. Asian Livestock: Challenges, opportunities and the response. Proceedings of an International Policy Forum held in Bangkok, Thailand, 16-17 August 2012, Animal Production and Health Commission for Asia and the Pacific, International Livestock Research Institute and Food and Agriculture Organization of the United Nations.
The designations employed and the presentation of material in this information product do not imply the expression of any opinion whatsoever on the part of the Food and Agriculture Organization of the United Nations (FAO) concerning the legal or development status of any country, territory, city or area or of its authorities, or concerning the delimitation of its frontiers or boundaries. The mention of specific companies or products of manufacturers, whether or not these have been patented, does not imply that these have been endorsed or recommended by FAO in preference to others of a similar nature that are not mentioned.
The views expressed in this information product are those of the author(s) and do not necessarily reflect the views of FAO.
ISBN 978-92-5-107454-1
All rights reserved. FAO encourages reproduction and dissemination of material in this information product. Non-commercial uses will be authorized free of charge, upon request. Reproduction for resale or other commercial purposes, including educational purposes, may incur fees. Applications for permission to reproduce or disseminate FAO copyright materials, and all queries concerning rights and licences, should be addressed by e-mail to [email protected] or to the
Chief, Publishing Policy and Support Branch, Office of Knowledge Exchange, Research and Extension, FAO, Viale delle Terme di Caracalla, 00153 Rome, Italy.
© FAO 2013

iii
Contents
Foreword ivAcknowledgements viAbbreviations and acronyms viiContributors and participants ix
Background and summary 1 Vinod Ahuja and Purvi Mehta
Opening and keynote addresses 11Welcome address 13 Ayuth HarintharanonOpening Address 14 Man Ho SoAddress by the guest of honor: Livestock development in ASEAN countries 16 Yukol Limlamthong Livestock industrialization in Asia: Growth, scaling up, competitiveness 20 and outlook for smallholders Nipon PoapongsakornHealth at the Livestock Policy Interface 26 Jimmy SmithLivestock and Natural Resources 32 Henning Steinfeld
Special contribution to the proceeding 36Long Term Food Security in Developing Asia 36 D. Roland-Holst and Songsak Sriboonchitta
Technical papers 51Structural changes in the Indian dairy sector 53 Anjani Kumar, P.K. Joshi and R.J. Jongeneel Hog farming in transition: The case of China 74 Kevin Chen and Jimin WangFeed and Fodder Challenges for Asia and the Pacific 82 Harinder P.S. MakkarPoverty, food security, livestock and smallholders: Issues and options 98 for Asia and the Pacific region Vinod Ahuja and Steve StaalLivestock resources and environmental issues in Asia 108 Benjamin Henderson and Henning SteinfeldHuman health risks from the human-animal interface in Asia 121 Joachim Otte and Delia GraceAnnexure 1: Good practices: List of presentations 161

iv
Foreword
It is perhaps no exaggeration to say that livestock is central to some of the major challenges the world faces today and how we deal with these challenges will have far reaching implications on the well-being of future generations. The demand for livestock products is growing rapidly and this trend is expected to continue in the foreseeable future. Given the resource intensity of modern livestock production systems, this growth is putting tremendous pressure on global natural resources and the biophysical environment. This challenge is perhaps most severe for Asia and the Pacific region considering that the region houses more than 60 percent of the world’s 925 million hungry people with high levels of undernutrition and malnutrition. The majority of these poor people live in rural areas and rely on agricultural activities for their food and income. For many of them, livestock income is essential for buying inputs for crop production, paying for school fees, covering medical bills, and overcoming temporary food shortages. Animals also serve as a capital reserve for the good and bad times in life when a family has to face large expenses such as a wedding or a medical emergency. While undernutrition and malnutrition concerns remain high on the policy agenda in the region, there are also emerging concerns about unhealthy consumption patterns stemming from poor awareness about proper nutrition and rapid emergence of non-communicable diseases and vitamin and mineral deficiencies. At the same time, recent years have seen the emergence of an anti-livestock global narrative. Livestock has been blamed for emerging diseases, global warming, environmental pollution and continuing food insecurity and deprivation due to the competition for resources between food and feed. Abstracting from the blame game, it can be said that while the emerging narrative does have elements of truth, the claims and counter claims remain much too general and generalized and of little practical significance. For example, while it is true that excessive consumption of animal products may increase the risk of heart and other non-communicable diseases, it is also true that children in many developing countries do not receive enough meat and milk in their diets and may grow up physically and mentally compromised by inadequate protein intake. Similarly, while it is true that intensive livestock production systems are creating nutrient overloads and deficits in different parts of the world, it is also true that animals are crucial in completing nutrient cycles, particularly in mixed crop-livestock farming systems. Policy emphasis on enhanced livestock productivity in these systems can add value to natural resources and food systems in many ways. Debates often become polarized depending on the ideologies, experiences and perspectives of those making the arguments. Rarely does one observe balanced dialogue that is so essential for making more pragmatic choices in diverse contexts. The Regional Livestock Policy Forum organized in Bangkok on 16 and 17 August 2012 was an attempt to address the need for balanced dialogue on livestock sector policy in Asia and the Pacific region. The forum brought together more than 60 participants from diverse stakeholder groups and partner organizations from within and outside the region; it discussed various

v
issues in the livestock-livelihoods-environment-diseases interface. This publication summarizes the outcomes of the forum and brings together background papers prepared in support of the dialogue. We hope this document will be of value in strengthening our roles as custodians of our future by improving the governance of the livestock sector so that the sector’s growth contributes to economic and social equity, environmental sustainability and improved human, animal and ecosystem health. The Food and Agriculture Organization of the United Nations (FAO) and the International Livestock Research Institute (ILRI) remain committed to working with all stakeholders in this endeavour and hope that together we can make a visible contribution towards more balanced and sustainable livestock sector development in the region.
Jimmy Smith Hiroyuki Konuma Director General Assistant Director-General International Livestock and Regional Representative Research Institute FAO Regional Office for Asia and the Pacific Nairobi, Kenya Bangkok, Thailand

vi
Acknowledgements
This volume is based on the discussions and background work for the International Policy Forum on Asian Livestock: Challenges, Opportunities and Response, held in Bangkok in August 2012. The forum was organized with organizational and financial support of a number of organizations – FAO, ILRI, Animal Production and Health Commission for Asia and the Pacific (APHCA), International Food Policy Research Institute (IFPRI), Asia Pacific Association Agricultural Research Institutes (APAARI), Asia-Pacific Rural and Agricultural Credit Association (APRACA), and the European Union (EU). Their support and partnership is gratefully acknowledged.

vii
Abbreviations and acronyms
AEC ASEAN Economic CommunityAMR Antimicrobial ResistanceASF Animal Source FoodsAPHCA Animal Production and Health Commission for Asia and the PacificASEAN Association of Southeast Asian NationsCAGR Compound Annual Growth RateCoV CoronavirusCP Consumption PricesDALYs Disability-adjusted Life YearsDCS Dairy Cooperative Societies (India)DFID Department for International DevelopmentDTMRB Densified Total Mixed Ration BlocksDTMRP Densified Total Mixed Ration PelletsEID Emerging Infectious DiseaseEV Equivalent VariationFAO Food and Agriculture Organization of the United NationsFDI Foreign Direct InvestmentFMD Foot-and-Mouth DiseaseGAP Good Agricultural PracticeGBD Global Burden of Disease (WHO report)GDP Gross Domestic ProductHACCP Hazard Analysis and Critical Control PointsI&P Infectious and ParasiticIFPRI International Food Policy Research InstituteILRI International Livestock Research InstituteISO International Standards OrganizationJE Japanese EncephalitisJEV Japanese Encephalitis VirusLPAI Low Pathogenic Avian InfluenzaNDDB National Development Dairy Board (India)NFI National Feed InventoryNiV Nipah VirusNPC Nominal Protection CoefficientNPCBB National Project for Cattle and Buffalo Breeding (India)NSSO National Sample Survey Organization (India)OECD Organisation for Economic Co-operation and DevelopmentOIE World Organization for Animal HealthPEP Postexposure Prophylactic Treatments
viii
SAARC South Asian Association for Regional CooperationSARS Severe Acute Respiratory SyndromeSPS Sanitary and Phytosanitary measuresTDRI Thailand Development Research InstituteUAE United Arab EmiratesUN REDD United Nations Collaborative Programme on Reducing Emissions from
Deforestation and Forest Degradation in Developing CountriesVF Virulence-associated FactorsWFP World Food ProgrammeWHO World Health OrganizationWTO Word Trade OrganizationYLD Years of Life Lived with a DisabilityYLL Years of Life Lost
ix
BANGLADESH
EHSANUL BARI Managing Director(Grameen Fisheries and Livestock Foundation)Dhaka, Bangladesh
KHAN SHAHIDUL HUQUE Director GeneralBangladesh Livestock Research InstituteSavar, Dhaka, Bangladesh
BHUTAN
TASHI DORJEE Chief Veterinary OfficerDepartment of LivestockGovernment of BhutanThimpu, Bhutan
CAMBODIA
KHIEU BORIN AdvisorCentre for Livestock and Agriculture Development Phnom Penh, Cambodia
SUON SOTHOEUN Deputy Director Department of Animal Health and ProductionMinistry of Agriculture, Forestry and FisheriesPhnom Penh, Cambodia
CHINA
SONG HUChina RepresentativeCanadian Swine Exporters AssociationBeijing, P.R. China
ZHANG LUBIAO Director GeneralDepartment of International CooperationChinese Academy of Agricultural Sciences Beijing 100081, P.R. China
JIMIN WANG Deputy Director GeneralInstitute of Agricultural Economics and Development of Chinese Academy of Agricultural SciencesBeijing, China
INDIA
SANJAY BHOOSREDDYJoint Secretary, Animal Husbandry, Dairying & Fisheries,Government of India, New Delhi
KML PATHAK Deputy Director General (Animal Sciences)Indian Council of Agricultural ResearchNew Delhi
TINNI SAWHNEY Programme DirectorSouth Asia Pro Poor Livestock Policy ProgrammeNDDB House, New Delhi
Contributors and participants

x
JAGDEESH RAO Executive DirectorFoundation for Ecological SecurityAnand, Gujarat
GIRISH SOHANI PresidentBAIF Development Research FoundationWarje, Pune
SAGARI RAMDAS DirectorANTHRASecunderabad Andhra Pradesh
MANISH KAKKAR Senior Public Health Specialist (Infectious Diseases)Public Health Foundation of IndiaVasant Kunj, New Delhi
ANJANI KUMARPrincipal ScientistInternational Crop Research Institute for Semi Arid TropicsPusa, New Delhi
INDONESIA
MURSYID MA’SUMDirector of Animal FeedDirectorate General of Livestock and Animal Health Services
REPUBLIC OF KOREA
IN-SHIK NAM General ManagerLivestock Consulting DepartmentNational Agricultural Cooperatives FederationRepublic of Korea
LAO PDR
SITHONG PHIPHAKAVONGDeputy Director GeneralDepartment of Livestock and FisheriesMinistry of Agriculture and FisheryGovernment of Lao PDR
MYANMAR
MYA HANChairmanMyanmar Livestock FederationYangon, Myanmar
WIN SEINVice ChairmanMyanmar Livestock FederationBayintnaung Rd., West GyogoneInseinTownship, Yangon, Myanmar
KHIN ZAWDeputy Director Nay Pyi Taw CouncilLivestock Breeding & Veterinary DepartmentMyanmar
NEPAL
BANSHI SHARMARegional DirectorWestern Regional Directorate of Livestock ServicesMinistry of Agriculture DevelopmentMatepani, Pokhara, Nepal
PAKISTAN
RAFIQ-UL-HASSAN USMANI Member (Animal Sciences)Pakistan Agriculture Research CouncilIslamabad, Pakistan

xi
PHILIPPINES
PEDRO O OCAMPO Former Director/Consultant Livestock Development Council, Department of Agriculture Elliptical Road, Diliman, Quezon City,
DANILO V. FAUSTO ChairmanDairy Confederation of the Philippines
SRI LANKA
D.R.T.G. RATNAYAKE Addt. Director GeneralDepartment of Animal Production & HealthPeradeniya
THAILAND
YUKOL LIMLAMTHONGAdvisor to Agriculture MinisterGovernment of ThailandBangkok
AYUTH HARINTHARANONDeputy Director GeneralDepartment of Livestock DevelopmentBangkok
WIMOLPORN THITISAK Deputy Director GeneralDepartment of Livestock DevelopmentBangkok
NIPON POAPONGSAKORNPresidentThailand Development Research Institute Wangthonglang, Bangkok
BOONPENG SANTIWIWATHANATHAM Advisor to CP Food group of companiesBangkok
PAYUNGSAK SOMYANONTANAGULVice PresidentTechnical Service-Poultry IntegratedCP Food Group of CompaniesBangkok
ARAYAN TRANGANSenior Executive Vice PresidentBETAGRO, Bangkok, Thailand
TAWEESAK SONGSERMSenior Researcher Kasetsart University
NARONGRIT WONGSUWANChief, Planning and Policy OfficeDairy Farming Promotion Organization of Thailand, Bangkok
AMPHON WARITTHITHAM Animal Husbandry Technical OfficerAnimal Nutrition Research and Development CenterHangchat, Lampang
DAVID STEANEHon. Adviser to DLD99 Moo 7 Baan Rong Dua, Thakwang Saraphi, Chiang Mai
VIPAWAN PANAPOLSenior Economic OfficerDepartment of Livestock Development, Ministry of Agriculture and Cooperatives, Bangkok
SIRIPORN RATSAMEEMONTHONEconomic OfficerBureau of Livestock Extension and Development, Department of Livestock Development, Ministry of Agriculture and Cooperatives, Bangkok
xii
VIET NAM
NGUYEN DO ANH TUAN Director Center for Agricultural PolicyInstitute of Policy and Strategy for Agriculture and Rural DevelopmentHanoi
DO HUU DUNG Head Planning DivisionDepartment of Animal HealthHanoi
PATRICE GAUTIERDirectorAsian Veterinary & Livestock ServicesHanoi
DAPHNE DERNISONAgriculture Counselor for Thailand and Viet NamEmbassy of Netherlands, Hanoi
AAHA (Asian Animal Health Association)
MOSHE COIFMANExecutive DirectorBangkok, Thailand
APAARI (Asia-Pacific Association of Agricultural Research Institutions)
RAJ PARODAExecutive SecretaryBangkok, Thailand
APRACA (Asia Pacific Rural and Agricultural Credit Association)
WON-SIK NOHSecretary GeneralBangkok, Thailand
COLORADO STATE UNIVERSITY
MO SALMAN Professor of Veterinary EpidemiologyAnimal Population Health InstituteCollege of Veterinary Medicine and Biomedical Sciences, Colorado State University
FAO (Food and Agriculture Organization of the United Nations)
HENNING STEINFELDChiefLivestock Information and PolicyFAO, Rome, Italy
HARINDER MAKKARSenior Animal Production OfficerFAO, Rome, Italy
SUBHASH MORZARIARegional ManagerEmergency Centre for Transboundary Animal Disease (ECTAD)FAO Regional Office for Asia and the Pacific Bangkok, Thailand
WANTANEE KALPAVRIDHRegional CoordinatorEmergency Centre for Transboundary Animal Disease (ECTAD)FAO Regional Office for Asia and the Pacific Bangkok, Thailand
JAN HINRICHSAnimal Health EconomistEmergency Centre for Transboundary Animal Disease (ECTAD)FAO Regional Office for Asia and the Pacific Bangkok, Thailand

xiii
BORIPAT SIRIAROONRATWildlife Health and Ecology CoordinatorEmergency Centre for Transboundary Animal Disease (ECTAD)FAO Regional Office for Asia and the Pacific Bangkok, Thailand
KACHEN WONGSATHAPORNCHAI ASEAN Regional Support Unit Coordinator Emergency Centre for Transboundary Animal Disease (ECTAD)FAO Regional Office for Asia and the Pacific Bangkok, Thailand
JOACHIM OTTESenior Animal Production and Health OfficerFAO Regional Office for Asia and the Pacific Bangkok, Thailand
VINOD AHUJALivestock Policy OfficerFAO Regional Office for Asia and the Pacific Bangkok, Thailand
CAROLYN BENIGNOAnimal Health Officer FAO Regional Office for Asia and the Pacific Bangkok, Thailand
SUMITER BROCAPolicy Officer, FAO Regional Office for Asia and the Pacific Bangkok, Thailand
VISHNU SONGKITTIAnimal Production and HealthFAO Regional Office for Asia and the Pacific Bangkok, Thailand
NIRAN NIRANOOTRegional CoordinatorEnhancing Agriculture Competitiveness of Rural Households in the Greater Mekong Sub-RegionFAO Regional Office for Asia and the Pacific Bangkok, Thailand
THANAWAT TIENSINRegional Programme CoordinatorSmall Holder Dairy DevelopmentFAO Regional Office for Asia and the Pacific Bangkok, Thailand
IFPRI (International Food Policy Research Institute)
KEVIN CHENSenior Research Fellow, China Program LeaderInternational Food Policy Research InstituteBeijing, P.R. China
PRAMOD KUMAR JOSHIDirector (South Asia)International Food Policy Research Institute (IFPRI)Pusa, New Delhi India
ILRI (International Livestock Research Institute)
JAMES WILSON SMITHDirector GeneralInternational Livestock Research InstituteNairobi, Kenya
THOMAS RANDOLPHDirectorCGIAR Research Program on Livestock and FishNairobi, Kenya

xiv
PURVI MEHTADirector (Asia) International Livestock Research InstituteAggarwal Corporate Tower, New Delhi
DELIA GRACETeam LeaderMGL, International Livestock Research InstituteComponent Leader, CRP4.Nairobi, Kenya
STEVE STAALDirectorMarket Opportunities Research Theme,International Livestock Research InstituteNairobi, Kenya
MEKONG ARCC (Mekong Adaptation and Resilience to Climate Change Project)
PAUL HARTMAN Chief of Party USAID Contractor Mekong ARCC Project
CHRISTY OWEN Deputy Chief of Party USAID Contractor Mekong ARCC Project
OIE (World Organization for Animal Health)
ALEXANDRE BOUCHOTDVM-EU/HPED Project ManagerSEACFMD Technical AdviserOIE (World Organization for Animal HealthBangkok
DIRK VAN AKENProgramme CoordinatorOIE Sub-Regional Representation for South East Asia Bangkok

Background and summary

3
Background and summaryVinod Ahuja and Purvi Mehta*
Growing populations, rising disposable incomes and progressive urbanization in Asia and the Pacific region have spurred rapid growth in the consumption of animal source foods. The region has generated more than half the gains in global livestock production since the early 1990s and this growth is expected to continue in the foreseeable future. However, the manner of supply growth has also imposed considerable social, health and ecological costs. Signs of resource stress are now becoming visible and are raising new challenges for food and nutrition security of the poor. There are also growing concerns of real and potential marginalization of small producers in the process, resulting in missed opportunities for supporting rural livelihoods. Climate change, water scarcity, land degradation and increased resource competition for food, feed and fuel production pose major additional challenges for the sector in the long run. The environmental and natural resource implications of livestock production have come under intense public scrutiny in recent years and the debate on climate change has been particularly passionate. Similarly, in view of the widespread prevalence of a number of production-limiting and trade-preventing diseases in the region and growing health concerns resulting from zoonotic and food-borne diseases, support for the development of policies and response systems for enhancing food safety and minimizing disease burdens is another area that is receiving growing attention. Asia is a highly heterogeneous region with widely varying income levels, prospects for future economic growth, production and marketing systems, and technical and institutional capacities. This diversity is also reflected in the consumption and production trends of livestock products, trading patterns and the aspirations of countries in meeting multiple needs from the sector. Finding the right balance amongst these multiple needs requires better policies, institutions and regulations. There is no size that fits all and hence regulators and policy-makers need to weigh the entire range of economic, environmental, social and health issues associated with livestock production and manage the conflicts and trade-offs. To discuss and debate these issues, promote collaboration and knowledge exchange among relevant national and international agencies and to discover ways of addressing future challenges, FAO, together with ILRI, IFPRI and other partners, organized the Regional Livestock Policy Forum in Bangkok on 16-17 August 2012. The forum was attended by about 70 participants from over 11 countries comprising stakeholders from governments, national
* Vinod Ahuja, Food and Agriculture Organization of the United Nations (FAO). E-mail: [email protected]
Purvi Mehta, International Livestock Research Institute (ILRI). E-mail: [email protected]

4
and international research agencies, civil society organizations, multilateral institutions, think tanks, private sector and regional and global networks. The forum provided a platform to share experiences, debate issues of key concern, and provide guidance on the nature of required policy responses in different countries and growth scenarios.
KEYNOTE ADDRESSESThree keynote addresses briefly reviewed livestock sector trends and highlighted social, health and environmental aspects of rapid growth and policy-induced structural changes in Asia. Using the case of the poultry industry, the first keynote address by Nipon Poapongsakorn, President, Thailand Development Research Institute (TDRI), argued that the profit efficiency of smallholder farmers can substantially increase if they can move from traditional backyard to more commercial operations. This process must however be supported by public or private organizational structures that can link them to remunerative markets. Based on the evidence from Thailand, it was argued that despite substantial scaling up in the poultry industry, smallholders have not been unfairly treated in Thailand. Although the numbers of smallholders in poultry and swine industries have declined substantially, those who have remained in the business have managed to successfully improve their competitive advantage. This has been made possible by policy support from the government in technology adoption and ensuring that the markets remained sufficiently competitive to avoid malpractices. The second keynote address by Jimmy Smith, Director General, International Livestock Research Institute (ILRI), noted that many poor people depend on livestock and, despite scaling up and industrialization trends, smallholders persist all over the world, but particularly in Asia. This is true even in those countries and those subsectors where there has been rapid industrialization and scaling up. Smallholders therefore remain central to livestock sector policy. He then focused attention on health issues at the livestock-policy interface and highlighted the linkages between livestock, human health and nutrition, animal health and ecosystem health. It was noted that health is not simply the absence of disease but involves constant nurturing of approaches and environments to support healthy humans, animals and ecosystems. The greatest burden of unhealthy environments in the form of animal and human diseases falls on poor livestock keepers and their communities and hence it is essential to support them to reduce the health risks from agriculture as well as to improve the productivity of their enterprises. It is also essential to manage diseases at source instead of at the infected victim, to promote risk- and incentive-based food safety systems, and build better surveillance for animal, human and ecosystem health. The third keynote address by Henning Steinfeld, Chief, Livestock Information and Policy Branch of FAO, focused on natural resources and the environmental implications of uncontrolled rapid growth of the sector in the region. He argued that the livestock sector is particularly resource hungry and makes substantial demands on the global natural resource base and the biophysical environment. The implications of these demands often go beyond the livestock sector when seen in the context of growing scarcities and resource competition with other users and sectors. This requires measures to increase the efficiency of natural resource use in the livestock sector and policy and regulatory measures that can (i) internalize the external costs imposed by livestock production systems, (ii) encourage

5
recovery of nutrients from livestock waste and (iii) restore grasslands and pastures for livelihood support and sustainable livestock sector development. For making more concrete progress on these issues, however, there is a need to distinguish between different growth scenarios due to the diversity of production and market conditions across the region. Henning Steinfeld outlined three scenarios in this context − ‘no growth’, ‘growth’ and ‘post growth’ − and the potential policy instruments for these different scenarios. More important, however, he argued that the environmental policy in all these scenarios must be seen in specific social and political contexts. Given the integrated nature of social, environmental and health issues, and given the limited space for stand-alone livestock or environmental policies, the real challenge is to integrate the livestock sector into mainstream, economic, social, health and education policies.
TECHNICAL PRESENTATIONSA number of presentations covered ongoing changes in the Asian livestock sector, new challenges, good practices and initiatives from national and local perspectives. The presentations highlighted the importance of livestock for food and nutrition security both at national and at household levels. Dairy products in India and pork in China, for example, are essential items in human diets and hence these sub-sectoral policies remain critically important for the governments in these countries. Any rapid rises in the price of milk in India or of pork in China usually make headline news and can have political ramifications. In this context, the presentations by P.K. Joshi and Kevin Chen reviewed the policy context of these subsectors and outlined the future investment and policy scenarios including the need for government commitment and leadership for shaping the future dairy and pork agendas in India and China. Growing scarcity of feed and fodder is often identified as one of the most serious challenges for the region for meeting growing demands and for mitigating adverse environmental impacts. Harinder Makkar reviewed feed and fodder trends for the Asia region and presented a number of options to enhance availability of feed and fodder, tap new feed resources and enhance nutrient availability from the intestinal tracts of animals. Take it back ‘to the community’ and ‘to the small entrepreneur’ was the key message of a series of presentations that followed. These presentations highlighted elements of good practices that, although sometimes specific to special contexts, had important lessons for policy-makers across the region. The presentations reiterated the importance of smallholder producers and small entrepreneurs across the value chain in poverty reduction, employment generation, building social capital and nurturing a more inclusive and sustainable livestock sector in the region. While acknowledging the importance of scale economies and high standards of food safety in the context of changing regional and global market environments, the presentations argued for a central place for local communities and smaller players in national and international policies. Another important message was that services for which end users pay or contribute are more sustainable in the long run. All the presentations on good practices were video recorded and are available for viewing at the video links indicated in Annexure 1.

6
PANEL DISCUSSIONS Three thematic panel discussions were organized to further elaborate on selected key issues. A brief summary of the discussions on the thematic areas and the broad messages that emerged from the deliberations are given below.
Theme 1: Improving market participation and livelihood resilience of smallholder livestock producers
There was strong consensus that despite the ongoing structural changes and scaling up of livestock production in many parts of the region, smallholder producers continue to be an important and critical part of livestock production systems and market chains. Investing in these systems to raise their productivity and bargaining power must remain an essential component of the policies and strategies for dealing with poverty and malnutrition. This consensus provides an opportunity for new momentum and an evidence base to create a voice and a platform that can argue more strongly for the need for targeted investment for supporting and enabling smallholders. For designing smarter policies, however, there is a need to better understand the ‘risks and incentives’ faced by smallholder producers and other value chain agents. At a fundamental level, policy mechanisms should aim at mitigating the downside risk to increase smallholder capacity to specialize in and raise the returns to their enterprises. Similarly, policy research needs to focus better on identifying specific market failures throughout the value chain and the mechanisms to address them so as to facilitate better uptake of technologies by smallholders to enable them to move into more commercial production systems and market chains. Due care must be taken in this context, however, to ensure that the diversity of local markets and peoples’ choices in maintaining diversified livelihoods are not compromised. Going beyond economic and social policies, there is also a need to better recognize the new kinds of organizational structures and forms for linking smallholders to markets. The classic models of collective action such as cooperatives and producer groups remain important and there is a continuing need for public support for these models in terms of finance, credit, capacity building and mechanisms to reduce risks; but, at the same time, there are new sets of private sector initiatives and organizational models that are not fully integrated into the discussions on smallholder market participation. A closer understanding of these initiatives and models can help discover new opportunities for involving smallholders through innovative public-private partnerships and for refocusing pure public support measures to areas which may not yet be sufficiently attractive for private investors. Finally, targeted public support will need to be guided by a more nuanced and differentiated articulation of the target group and of the support strategies. The definition of the smallholder target group and the nature of public support measures such as livelihood protection vis-à-vis commercialization will vary from one context to another and a clearer common understanding of such objectives is necessary for better design of policy and support measures across diverse contexts.
Theme 2: Environmental considerations for Asian livestock
The deliberations related to livestock-environment issues were particularly passionate and reflected diversity of views, knowledge gaps, uncertainties and stakeholder vision about

7
future development. They also reflected an emerging sense of urgency in the region to deal with pollution, climate change, biodiversity losses and resource-use efficiency issues. It was recognized that livestock production is one of the many factors responsible for these problems and multiple effects make it difficult to measure true impacts and to devise appropriate policy instruments. It was clear from the discussions that environmental policy needs to take into account the social context so that policy does not take measures against specific target groups simply because they may have higher pollution or emission intensity per unit of output. There was consensus on the need for more detailed information on the extent of environmental impacts differentiated by production systems (including scale and size), commodities and commodity chains, and geographical regions. The need for similar differentiation was also reflected in the discussions related to policy responses. In marginal areas where there may be very low returns to intensification and where land degradation problems are severely affecting ecological sustainability, instruments such as payment for ecosystem services may potentially offer a way forward for restoring the production base while protecting livelihoods and stimulating income generation. In areas where market-led intensification is rapidly proceeding, economic policy needs to factor in external costs and channel them to the consumer through prices. And in areas where unregulated sector growth has resulted in severe pollution and nutrient overloads, the policy response would need to take the form of stronger regulation for environmental and public health protection. But incentive-based systems of managing resources need to be complemented with policies and legislations that can strengthen the governance of natural resources by enforcing a shared collective responsibility of resource management. This is particularly true in the context of common property resources where national policies and international conventions must aim at putting ‘people’ and ‘local communities’ at the centre of managing and sustaining these resources. The panellists and participants further emphasized a greater sense of urgency for the region to move beyond dialogue to action by setting clearer priorities, targets and performance indicators; this must be done by taking a comprehensive view of production systems and associated value chains in assessing social and environmental performance instead of focusing on specific production systems and parts of the value chain. Finally, there is a need to examine these issues from the consumption side. In many parts of the region, the consumption of animal source foods is already beginning to exceed levels that may be characterized as ‘healthy’; policies that encourage production response to meet burgeoning demand for livestock products without due regard to negative impacts of high consumption levels on the nutritional well being of people would further exacerbate the environmental and social costs associated with livestock sector growth.
Theme 3: Spotlight on health risks at the animal-human-ecosystem interface
An important implication of rapid uncontrolled livestock sector growth in the region is that it generates increased risks to animal and human health stemming from larger interfaces between people, livestock and wildlife; increased movement of livestock and livestock products; and high densities of genetically homogeneous livestock and rapid turnover. All favour the development of rapidly replicating, highly contagious disease agents. Further, in most countries, intensifying livestock production is accompanied by an increased use of antimicrobial substances, which are losing their effectiveness as resistant genes are
8
selected for and transferred between micro-organisms. These risks are compounded by the co-existence and interaction between traditional and industrial production systems and the abundance of wet and live animal markets in the region. Reducing (i) the burden of food-borne diseases and infectious parasitic diseases, (ii) the risk of novel and emerging diseases and (iii) the abuse of antimicrobials should therefore be at the core of policies aimed at dealing with health risks at the animal-human-ecosystem interface. This requires a more holistic approach towards health and closer multisectoral and interdisciplinary collaboration. Bringing about such collaboration remains a major challenge in the region. The second element of dealing with health risks would be to shift focus from treating the symptoms and reacting to emergencies to addressing the root causes of disease emergence and spread. In this context it was pointed out that overuse of antimicrobials in industrial systems is probably one of the causes of disease emergence and that governments must strive towards instituting policies and legislations that promote more prudent use of antimicrobials in farm animals. Such policies should further be complemented with smart surveillance systems including incentivised disease reporting. Given the ‘public good’ nature of disease control and limited capacity in the region, there would need to be stronger public sector investment in these systems, although the private sector must also share its responsibility both in investment and system design. This necessitates stronger public-private partnerships in moving the ‘one health approach’ from concept to action. Costs of inaction both in terms of direct economic costs and lost opportunities would be immense.
VALEDICTORY SESSION The valedictory session sought to synthesize the key messages from presentations and panel discussions and collect ideas on possible future steps towards sector policy support. It was re-emphasized that in light of the production and consumption trends and growing role of livestock in agricultural GDP in many countries, there is a need to correct sectoral imbalances in resource allocation and to raise the profile of livestock sector in national and international policy forums. This requires more rigorous sector analysis, knowledge dissemination, and policy advocacy − especially towards reorienting research to meet the needs of smallholder livestock producers, instituting more systematic instruments for improvement and conservation of animal genetic resources, identifying new sources of feed and fodder for a range of agro-ecosystems and designing and implementing mechanisms and products to mitigate against production- and market-related risks. Future agendas in the livestock policy interface must therefore focus on creating awareness and sensitivity about such issues at the highest levels of policy-making at national, regional and international levels. Nurturing community creation and facilitation of dialogue would require a coalition of national and regional organizations who are willing to make long-term commitment to this vision. There is perhaps no alternative to creating such a coalition and giving it time to evolve and establish credibility among stakeholders. It was pointed out that the organizing partners of the forum in general, and FAO, APHCA and ILRI in particular, bring unique and complementary strengths to this debate and are best positioned for creating such a coalition and providing a neutral platform for facilitating regional cooperation, knowledge

9
exchange, policy dialogue and catalytic action in pursuit of shared goals. In this context, it is important to understand that such intellectual change usually has a long gestation period; therefore organizations and individuals who represent the next generation must become active partners in this coalition.

Opening and keynote addresses

13
Welcome addressAyuth Harintharanon*
Distinguished guests, ladies and gentlemen, On behalf of Dr Tritsadee Chaosuancharoen, Director General of Thailand’s Department of Livestock Development, Ministry of Agriculture and Cooperatives and my own behalf, I would like to extend our warm welcome to you to Bangkok. It is our privilege and pleasure that FAO, ILRI and other international organizations are jointly organizing the Regional Policy Forum on Asian Livestock. The sector is full of challenges and opportunities and it is our collective responsibility to mobilize and direct public and private interest and investment in the livestock sector towards common goods. As you know, the Asian economy comprises more than 4.2 billion people or 60 percent of the world’s population living in 46 different countries and states. Asia is the world’s fastest growing economic region. Today we are in Bangkok, Thailand. But in 2015 Southeast Asian countries will become the ASEAN Economic Community or AEC. We foresee that the AEC will envisage a single market, a highly competitive economic region, a region of equitable economic development and a region fully integrated into the global economy. In this context, economic growth in Asia has also generated growing trends of livestock production and increased demands for livestock products in Asia. While these trends can potentially create new opportunities for farmers and livestock industries for the future, this will also require a more complex response of livestock-related stakeholders to steer the direction of livestock industries in Asia. I would like to take this opportunity to express our sincere thanks on behalf of the Department of Livestock Development, Thai and ASEAN livestock industries to FAO, ILRI and other international organizations to carry forward the momentum and discussion on Asian livestock policy. I once again thank you for your presence today and your active participation to discuss and advocate on the key regional policy issues on livestock. In addition, I would like to acknowledge the effort and support of FAO for organizing this event. Thank you very much.
* Deputy Director General, Department of Livestock Development, Royal Thai Government, Bangkok.

14
Opening addressMan Ho So*
Distinguished delegates, colleagues, ladies and gentlemen, On behalf of Assistant Director-General and Regional Representative for Asia and the Pacific, Mr Hiroyuki Konuma, and on my own behalf, I have great pleasure in welcoming you to this Policy Forum on Asian Livestock. I think this meeting is very timely and at the outset, I would like to thank our collaborators for their support in its organization. In particular I would like to thank the Director General of the International Livestock Research Institute for his personal presence and unconditional support. Similar thanks go to the Director General, Department for Livestock Development, Royal Thai Government. I am sure this meeting will mark the beginning of a multistakeholder consultative process on livestock sector issues in the region and FAO remains committed to that process. Being closely associated with livestock sector issues, I am sure you all would agree that the sector is central to many challenges the region faces today. At FAO, we are both optimistic and concerned about the future prospects of livestock sector growth and development in the Asia-Pacific region. While we are encouraged by the region’s remarkable progress in augmenting food supplies and reducing poverty, we are also hugely concerned about continuing high levels of poverty and under nutrition. As incomes increase and urban society grows, dietary habits are changing in many Asian countries. Demand for livestock products has grown in recent decades. For example in China and India meat consumption has grown at a rate of 5 percent and dairy products at a rate of 3.5-4 percent annually. This has led to competition for use of land for food or animal feed production. Intensive livestock production systems have also resulted in pollution from manure. Some of this is now being addressed through treatment and recycling technologies but we need more such innovations to efficiently use economic and natural resources, reduce pollution and benefit society. Asia is also home to a plethora of production-limiting and trade-preventing diseases and there are growing health concerns resulting from zoonotic and food-borne diseases. Animal health services face new challenges of battling animal diseases that cause mortality, reduce animal productivity and harm human health. Unfortunately, animal and human health systems in a number of countries in the region are not fully equipped to deal with these challenges and need support in the development of policies and delivery systems for enhancing food safety and minimizing the animal disease burden. The most important concern however relates to poverty reduction and livelihood support. Livestock rearing is a key livelihood and risk mitigation strategy for small and
* Deputy Regional Representative for Asia and the Pacific, Food and Agriculture Organization of the United Nations.

15
marginal farmers and poor rural families in the region. Livestock is also one of the most important productive assets in rural areas and serves as an insurance mechanism for coping with household-related crises. But in the growth process, small producers seem to be missing the train. Technology development in general has been driven by the needs of large-scale production systems. This must be addressed. The region has a number of successful models to demonstrate the potential of the livestock sector in empowering the rural poor and generating poverty-alleviating growth but much work still remains to be done in scaling up and scaling out these experiences. We must also recognize that the poor face different risks and have different incentives and capacities to respond compared to intensive commercial farmers. Therefore, policies and institutional structures have to face the additional challenge of recognizing the differences between their stakeholders and developing mechanisms to reach them all. In conclusion I wish to emphasize two points. One, while we discuss various issues we must remain very conscious of the diversity of livestock production systems and the aspirations of those whose livelihoods depend on their animals. Our response will therefore need to be highly differentiated and much more nuanced. Second, and equally important, there is often a tendency to regard livestock as being separate from other agricultural activities. But we must remember that, despite the structural changes we have seen in the past, there will always need to be an overriding balance between crops and livestock. We must therefore consider the sector in its full social, economic and ecological complexity. This makes this meeting particularly important and challenging. I am pleased to note the presence of many national, regional and global stakeholders. I thank you for accepting our invitation and taking the time to be here. But we must also remember that the ultimate test of this and similar efforts will be the empowerment of those who really matter. This means that we must work towards enabling local institutions to drive the action on the ground. I wish you success in your deliberations and a pleasant stay in Thailand. Thank you.

16
Address by the guest of honor Livestock development in ASEAN countries
Yukol Limlamthong*
With limited arable land for growing crops and livestock-raising, continuous human population growth, climate change, rising demand for fossil fuels and so forth, we face unique challenges in ensuring food security for our people. With growing incomes in the region, the demand for food is rising rapidly and we are faced with the challenge of meeting this demand with limited and sometime declining natural resources. In addition we must recognize that food security includes good nutrition and meeting true food security will require educating people on the nutritive values of foods and good eating habits as imbalanced diets or malnutrition can cause a number of non-infectious diseases. These include obesity, micronutrient and/or trace element deficiencies, diabetes, cardiovascular disease and cancer. Foods of animal origin – meat, milk and eggs – are good sources of protein, fat, minerals and trace elements, which are vital for human health. In this context, ASEAN countries comprise one of the significant subregions in Asia and the Pacific. The region is home to
Table 1: Livestock Population in ASEAN countries
* Minister of Agriculture, Royal Thai Government, Bangkok. Dr Yukol was the Advisor to the then Agriculture Minister at the time of the meeting.
(in thousands)
Country HumanPopulation Chicken Duck Buffalo Cattle Pig Goat
Brunei 409 16000 F 220 F 4.6 F 1 F 1.3 F 2.7 F
Cambodia 14 952 17 448 7 000F 702 3 484 2 057
Indonesia 248 216 1 622 750 45 292 2 005 13 63 7 212 16 821
Lao PDR 6 586 23 000F 3 200 F 1 200 F 1 400 F 3 400 F 289 F
Malaysia 29 180 225 790 48 200 F 130 909 1 711 537
Myanmar 54 584 125 000 F 12 600 F 3 000 F 13 000 F 7 900 F 2 750 F
Philippines 103 775 158 984 10 268 3 270 2 570 13 398 4 177
Singapore 5 353 3 300 F 750 F .. 0.2 F 270 F 0.7 F
Thailand 67 091 231 918 29 233 1 622 6 498 7 623 380
Viet Nam 91 519 218 201 68 633 2 913 5 916 27 373 1 288
F = FAO estimateSource: FAOSTAT | © FAO Statistics Division 2010

17
2.6 billion chickens, 225 million ducks, 15 million head of buffalo, 47 million head of cattle, 71 million head of pigs, 26 million head of sheep and 12 million head of goats to feed over 620 million ASEAN inhabitants. Although growing rapidly, average meat consumption in ASEAN countries is still low when compared to industrialized countries. Nevertheless, ASEAN countries (with the exception of Brunei and Singapore), have good potential to produce livestock and livestock products. Some of these countries are already livestock and livestock product exporters – Thailand, for example, is exporting processed chickens, chicken meat and pork, worldwide.In the context of livestock sector development in ASEAN countries, I would like to highlight the following issues.1. The region has diverse livestock breeds which need to be conserved. These native
animals can browse and better utilize locally available feeds and are resistant to diseases. However, their productivity is low. While conserving genetic resources, it is equally important to institute measures to increase productivity of these animals.
2. Agricultural land in ASEAN countries is under intense competition with non-agricultural uses (construction of infrastructure, buildings, housing) and hence productivity of land must increase without jeopardizing the quality of natural resources. Research and development on animal feed crops is therefore of prime importance. Introduction of ‘Least-cost Feed Formulation’ is an important technical strategy of the livestock feed industry to produce price-competitive products.
3. The tropical environment of ASEAN countries is conducive for pathogen growth. Productive hybrid animals for high yields of meat, milk and eggs unfortunately tend to have poor resistance to diseases and hence there is a need to pay special attention to putting in place adequate biosecurity measures. In this context, it is also necessary to strengthen regional cooperation on animal identification, biosecurity, animal health and several other measures.
4. The presence of drug residues in the food of animal origin and antimicrobial resistance are emerging as serious problems in the region. It is therefore essential to institute measures for proper use of veterinary biological practices and drugs.
5. Governments should consider promulgation and enforcement of laws and regulations on slaughterhouses and animal slaughtering. A good food chain from slaughterhouses to markets will safeguard food safety and prevent possible spread of pathogens.
6. It is important to put in place traceability mechanisms and other measures such as GAP, HACCP and ISO for enhancing food safety and quality as well as consumer confidence.
7. Livestock production in all categories generates animal waste from farms, slaughterhouses and processing plants and so forth. Greenhouse gas impacts from methane emitted from ruminant and some monogastric livestock is contributing to global warming; this is a significant issue of concern besides other direct ill-effects of farm and slaughterhouse wastes on neighbouring communities.
For sustainable livestock production and for food security, we need to carefully consider the socio-economic and cultural conditions of each country. ASEAN countries have their own attitudes and faiths in relation to nature. With regard to livestock production, the production systems within this region can be categorized as:

18
1. Production for own or domestic consumption: The number of animals raised is minimal but enough for family consumption and surplus animals can be sold for cash income. This type of production is relevant to His Majesty the King of Thailand’s Self-sufficiency Economy Theory, with which he has graciously guided small-scale and marginal Thai farmers to achieve sustainable and self-sufficient livelihoods. However, basic biosecurity measures should be adopted even in this system as the animals produced are raised in close contact with the farmers. This practice is applicable to almost all ASEAN countries where small-scale and marginal farmers live.
2. Commercial production: A cluster of farmers raise their livestock for own consumption until they are experienced and extend their production for sale in their localities. This production system is more developed with systematic and standard animal housing, husbandry and management. A higher level of biosecurity and Good Farming Practices are required in such systems. These farmer clusters could be further strengthened through the formation of farmer cooperatives. This will enhance production volumes and the bargaining power of these farmers.
3. Industrialized or intensive production: This category produces large volumes of livestock products and uses sophisticated technology in production practices. Farmers under this category are mostly contract farmers under production scheme(s) of major entrepreneurs. This production category requires productive breeds of animals. Good examples are poultry and pig production by conglomerate groups of companies such as the CP and the BETAGRO groups of Thailand.
Among these three systems, I would like to further stress that for small-scale producers and farmers, native breeds of livestock (poultry, small and large ruminants) should be encouraged for their own consumption and the surplus for sale in their neighbourhoods; and if possible, in niche markets. This will avoid competition with business and industrial production and small farmers will survive; larger scale production, using commercial breeds, shall be production-based for domestic urban markets and for export. In conclusion: 1. Biosecurity and Good Farming Practices are key tools in prevention and control of animal
diseases in livestock production systems. All the ASEAN countries should consider upgrading and harmonizing standards on biosecurity and Good Farming Practices in compliance with SPS measures such as the FAO/WHO Codex Alimentarius and OIE international codes.
2. Food security is an important issue to be addressed. In Thailand, the Self-sufficiency Economy Theory initiated by His Majesty the King has been applied nationwide and to livestock raising, using native breeds of poultry, pigs, small and large ruminants.
3. For industrial livestock production, private companies and large producers have their roles in helping farmers under their contract schemes. Governments can complement this type of production through public-private partnership policy.
4. With regard to the environment, ‘Zero-waste’ or ‘Green Ecology Livestock Production’ approaches need to be introduced and encouraged by governments.
5. With regard to animal feed production, ASEAN countries should mutually consider self-reliance in agricultural production within the region – taking into consideration crop production for feed as well as for energy. ASEAN countries shall then be able to produce food from animal origin to meet regional as well as global demands.

19
6. Veterinary services and animal health systems within ASEAN should be harmonized based on OIE guidelines on ‘Performance of Veterinary Services’. ASEAN countries must help each other to improve their veterinary services to meet international standards.
7. Vaccine banks for emergency use in ASEAN should be considered as an option to prevent and control any potential outbreak of animal disease in the region. The APHCA FMD Vaccine Bank is a good example.
8. Capacity building of national laboratories on animal disease, food safety and veterinary drug research should be developed and strengthened for rapid detection and early warning of outbreaks. Regional reference laboratories within ASEAN must be further improved and upgraded to be able to provide technical support to member states.
9. For research on animal genetics, biodiversity, breeding, husbandry and diseases, we need strong coordination, collaboration and communication in the region. In addition, external support from international organizations and academic institutions will enhance technical capacity in the region.
I sincerely wish that this Regional Forum will deliver consolidated outcomes and sound advocacy for policy-makers. I thank you very much for your time and your attention.

20
Keynote address Livestock industrialization in Asia: Growth, scaling up, competitiveness and outlook for smallholders
Nipon Poapongsakorn*
Distinguished delegates, ladies and gentlemen: The topic that I am going to speak about today is livestock industrialization in Asia, growth, scaling up, factors affecting scaling up and competitiveness and the outlook for smallholders. Most of what I am going to say is based on the research I have done with IFPRI and FAO many years ago. Although I would speak broadly about Asia, my emphasis will be basically on Thailand because I know much more about the issues in Thailand than in other countries. For more than 20 years, poultry meat, eggs, and milk have been at the forefront of livestock production growth in many countries in Asia. Poultry production suffered in the aftermath of the avian flu outbreak, but it bounced back quite quickly. For example, in Thailand, production of broilers dropped from 22 million per week to 15 million during the avian flu outbreak but has now surged to almost 25 million birds. On an annual basis, swine production increased by 5 percent, eggs by almost 5 percent and milk by more than 3 percent from 1980 to 2009. The stock of layers is now 40 to 45 million birds compared to 35 to 36 million birds before liberalization on import of parent stock in 2010. Similarly, the standing stock of sows was 0.8 million in 2011 with production of fattening pigs reaching 12 to 13 million pigs per year in the last few years. This has been at a constant level in the last few years for swine. The scaling up of livestock production became apparent in developing countries after the introduction of modern livestock some 30 years ago. In developing Asia outside Japan, I believe livestock industrialization first took place in Taiwan Province of China and then in Thailand. In Thailand, it was introduced in the period 1975-1978 and in other countries in the 1980s and 1990s. As a result, farm size has increased dramatically in all sectors of the livestock industry and almost everywhere in Asia. For example, in Thailand the average size for broiler farms is now 10 000 birds per house while corporate farm size is 20 000 to 100 000 birds. The broiler industry has been completely dominated by a dozen vertically-integrated companies, three of which are dominant oligopolists. Integrators now control 20 to 30 percent of the layer industry. There are now 22 importers of day-old chicks compared to nine when there was a monopolized egg board a few years ago. An average swine farm size for contract farmers is 300 sows up from 100 sows in the early 2000s as the integrators have to minimize their transaction costs, they do not want to deal with too many smallholders. The swine sector is still dominated by independent growers, many of whom have very large modern farms with full production cycles, thanks to imported pure lines from Europe and extension and breeding services provided by Kasetsart University.
* President, Thailand Development Research Institute, Bangkok.

21
Figure 1. Dairy, Swine and Chicken farm sizes in ThailandSource NSO, Agricultural censal and intercensal survey.
The dairy industry is still dominated by small- and medium-scale growers, thanks to the perishability of milk; effective and successful cooperatives have been formed at the district level with an average farm size of more than 50 cows in 2008. Similarly, in the Philippines, I believe large integrators control more than 80 percent of the broiler market although the Philippines hog sector is less concentrated than the broiler sector. Large-scale vertically-integrated farms have become more important particularly in the high value modern retail market. India has also participated in the global livestock revolution through rapid growth in production and consumption of eggs and poultry meat. The production of eggs and broilers has grown much faster than the production of crops and an increase in poultry farm size has also been observed; now units with 5 000 to 50 000 birds per cycle are very common both for broiler and layer farms. But milk production is still dominated by smallholders and cooperatives, thanks to the cultural significance of the Indian diet and heavy regulation and high level of protection similar to Thailand. China has also seen an enormous increase in production of poultry meat and eggs in the last two decades through a combination of large farms and higher productivity per bird. Large-scale commercial farms with annual production of 10 000 birds now account for probably around 50 percent of the production and the commercial broiler market is dominated by large and integrated companies. It is estimated that between 1985 and
Dairy Farm Sizes
Percentage Share in no. of dairy cows Percentage Share in Number of holdings
Percentage Share in no. of swine Percentage Share in Number of holdings
Percentage Share in no. of chickens Percentage Share in Number of holdings
Swine Farm Sizes
Chicken Farm Sizes
1-49%
1-455% 1-4
54%
1-42%
50 and over1%
1993 2008 1988 2008
1993 2008 1988 2008
1993 2008 1988 2008
5-944%
1-1955%
1-9926%
1-9924%
1-9999%
1-9997%
100,000 and over
39%
100,000 and over
57%
100,000 and over
0%
10,000-999929%
10,000-999915%
10,000-99990%
1-1920%
1-1997%
1-1986%
100 and over16%
100 and over63%
22-4921%
22-4914%
100 and over0%
100 and over2%
22-492%
50-998%
100-9996%
100-9994%
100-9991%
50-993%
50-991% 22-49
11%
50-991%
5-912%
5-940%
5-941%20-49
27% 20-4948%
20-494%
50 and over20%
50 and over38%
50 and over1%20-49
4%
100,000 and over
0%
10,000-99990%100-999
3%

22
2005, some 70 million small poultry grower left the sector, as occurred in Thailand. There are still more than 34 million rural households in China that keep backyard poultry but they play a marginal role in meeting the increasing market demand. Livestock is becoming less important as a source of income for small-scale farmers. What are the key drivers of Asian livestock industrialization? I believe there are five main factors: (i) growth in domestic and export markets due to increasing per capita income, (ii) technological change, (iii) institutional change, particularly contract farming and vertical coordination, (iv) policy distortion or policy support and (v) transaction costs arising from asymmetric information. In most Asian countries, the livestock revolution has been mainly driven by the growth of domestic demands, thanks to sustained economic growth in the last three to five decades and introduction of foreign technology in broiler production. In Thailand the livestock revolution is attributed to a combination of four factors: export markets, investment promotion, technology and contractual arrangements. The Thai poultry revolution began with the introduction of modern poultry farms by Charoen Pokphand (CP), which saw the export opportunities in Japan in the mid-1970s. It applied at the time for investment privilege to establish the first chicken export processing plan. At that time, the Board of Investment allowed CP to bypass the domestic law requiring that all slaughterhouses have to be owned by local government. So CP was given an exemption. Even with the exemption, however, the export opportunity would not have been realized without imported technology from Arbor Acres, which drastically increased broiler productivity. The imported technology came in the form of imported breeds, improved feed, medicine and so forth. An economic study by my colleague at the International Food Policy Research Institute (IFPRI) found that imported technology is one of the most important factors explaining high productivity of poultry in 24 countries. Yet to capture the economic rent from technology, CP had to introduce contract farming with farmers which required them to buy day-old chicks, modern/efficient feed, as well as animal drugs at higher prices. To attract farmers to enter into contract farming, CP introduced the price guarantee and wage contract system which substantially reduced the price risk for farmers. The contract was the copy of the one used by Arbor Acres in the United States. Farmers under contract also had access to credit from commercial banks and following the success of CP, other integrators entered into the poultry industry, thus creating the competitive poultry industry with CP being the largest player at every stage of the supply chain except the export of fresh chicken. Most of the contract farms in the 1980s were smallholders, thanks to plentiful family labour and landownership of smallholders which allowed them to borrow money from the commercial banks using land as the collateral for their long-term loan. Note that there was almost no government regulation of contract farming at that time. Yet smallholders were not unfairly treated because of the competition among integrators. CP later on went on to transfer poultry technologies through FDI in Viet Nam, Indonesia, China, Cambodia and Lao PDR. The development of swine industry in Thailand occurred much later—around 1990, thanks to the expansion of domestic demand. Unlike the broiler sector, its growth was due to the increase in domestic demand and the independent producers’ access to modern

23
technology. But there are two major factors limiting its growth—the slaughterhouse law and the difficulty of controlling food and mouth disease (FMD). The success of the dairy industry is attributed to long-term government support and high tariff and non-tariff protection, exactly like India. Government support includes free land allocation for poor farmers, access to cheap long-term credit, veterinarian services, price and marketing support, etc. As in the case of pigs and eggs, the rapid growth of the dairy industry in Thailand is attributed to the rise in per capita income and the school milk campaign. The expansion of poultry production in most Asian countries has also been caused by the same driver, that is, rise in per capita income together with the introduction of foreign technology and government support. In India, the joint ventures between local and foreign companies introduced imported grandparent stock to produce pure line parent stock in 1980 and since then the dairy industry in India has been supported and highly protected. In China besides increasing per capita income and agricultural reform, the dramatic improvement in transport infrastructure has also facilitated the rapid intensification of the poultry industry, so this is an important lesson for developing countries. CP first introduced modern broiler farms and established animal feed factories in China. What about the competitiveness of small-scale producers? I will only discuss some major findings from the IFPRI and FAO study on determinants and implications of the growing scale of livestock farms in four countries. The study showed that smallholders typically have higher profit per unit of output than large-scale producers with and without costing of family labour. Thus smallholders have a chance to compete with large producers although higher profit in this case is a necessary condition for the survival of smallholders, it is not a sufficient condition. A sufficient condition for smallholders to survive is the ability to use their farm resources more efficiently than the large-scale producers and this is the hypothesis taken by the study using the stochastic profit frontier to explain the relative inefficiency. The bad news for smallholders is that the results support the view that small farms are less efficient in securing profits than large farms. In other words, the transaction costs of smallholders are higher than that of the large scale producers.. Relative efficiency is fairly static in medium-size farms and it rises again only with much larger sizes of operation. Only one case shows larger profit efficiency for smallholder − small independent swine farmers in the Philippines. But there is some hope. The overall results for the swine industry in Brazil and Thailand, poultry in Thailand and India, milk in India and Thailand show that the efficiency advantage of smallholders increases substantially when you go from a very small backyard producer to a small commercial producer. In nearly all countries small producers have benefited from moving from backyard production to small-scale commercial production. For example, it appears that in Thailand there has been significant profit efficiency in moving from 15-20 to 150-200 pig farms. Thus, a viable route in Asia is technology and institutional development that targets improving the efficiency of smallholders. Other conditions such as availability of farm labour are equally important. The second important finding is that contract farming is more efficient than independent farming except in one case of the Philippines. So contract farming and cooperatives (also a form of contract farming) seem to improve farm efficiency by reducing transaction costs

24
faced by smallholders. This is because the capital costs and risks are shared by the integrator. Another important question is why some farms are more efficient at making profit than others. Two important factors are environmental externalities and transaction costs or asymmetric information. I am not going to discuss the issues of environmental mitigation efforts but with respect to transaction costs, the main conclusion is that the transaction costs matters more to small producers. These include access to various sources of market information, having a cell phone, education, experience, access to credit, etc. At the same time, the impact of transaction cost differs across countries and sectors. For example, smallholders’ profits are more sensitive to transaction cost than those of large farmers and secondly transaction cost plays a much more important role in the production of monogastrics where timing of sale is more discretionary and quality input is critical to quality of output. So, what is the outlook and what are the challenges for smallholders? The smallholders still have a good chance in milk production in countries where scaling up has not progressed to the point that has already been achieved in Thailand and Brazil. Although large dairy farms have higher profit efficiency, smallholders, I think, do have a good chance in milk production, thanks to the advantage of family labour, the nature of care-intensive dairy farming and the coordination role of cooperatives. Note that milk cooperatives are successful largely because of the perishable nature of milk which forces smallholders to form successful cooperatives. Yet it is likely that the one to five (cow) dairy farms will have to grow in size to 10 to 30 or 40 cows per farm as is already happening in India and in Thailand. As the markets tends to gravitate to the higher end of quality, smallholders need to be associated with an institution that can supply technology, information and accreditation which are necessary for them to compete in higher value markets. In Thailand the small independent weaner farms are reasonably efficient and can survive in the local market. Contract farms are more profit-efficient than independent farms at comparable scales because contract farming reduces transaction costs for farmers and this is why the broiler industry in several countries is now almost completely dominated by integrators. Therefore it is likely that monogastric livestock development will continue to see increasing vertical integration and coordination to overcome the high transaction costs faced by farmers in securing quality inputs on credit and achieving market recognition for quality outputs. What are the concerns? The main concern is that the forces promoting the scaling up of livestock production may drive small producers out of business. Evidence from Thailand and China shows that the numbers of smallholders have significantly declined. But the good news is that livestock income distribution across farms is becoming more equitable in Thailand because those who remained in business successfully improved their competitiveness and the data consistently show this. But the issue is not whether such displacement will occur or not as it has already occurred. The real issue is whether it is accelerated artificially by policy distortions. A number of contract farmers in Thailand have complained that they were asked by contractors to invest more in their farm and the integrators explained that they were following the government policy of farm biosafety which requires more investment. So I think there is a need for research on viable technology on food safety at a minimum scale that allows

25
smallholders to survive. For smallholders to stay involved with the rapidly growing demand for safe food and quality products, they need to meet evolving food safety standards and establish market trust and reputation and this requires some form of innovative institutional arrangement that involves the private sector, the government, farmers and probably social entrepreneurs. Research on livestock is still limited by data availability at farm levels and therefore most research has to depend on small sample surveys, which is a serious drawback. Thus, there is a need for national farm surveys of modern livestock farms. Thank you.

26
Keynote address Health at the livestock-policy interface
Jimmy Smith*
Distinguished guests, ladies and gentlemen, I have the honour and the pleasure to deliver one of the keynote addresses in this important regional meeting. I want to thank FAO colleagues for their leadership and the partnership that was established in preparing for this seminar. Crisis and sensationalization have tended to influence the vicissitudes of the livestock sector. Scarcely have we had the dialogue that we are going to have over the next two days to forge the path we may pursue. It is therefore a great pleasure to be here and to be part of this dialogue. I was asked to speak on the topic ‘Health at the Livestock-Policy Interface’. I wish to note at the outset that much of what I am going to say I have derived from my colleagues at ILRI and Dr Delia Grace, who is also present at this meeting and has been a key supporter in preparation of this discussion. In discussing this topic, I wish to briefly discuss the ‘three healths’ of the livestock sector (i) human health and nutrition, (ii) animal health and (iii) ecosystem health, and offer some prescriptions and policy advice. Before I delve into the topic however, I will take a short detour and do a quick survey of trends in and characteristics of the livestock sector so as to provide a background for the discussion on three healths.
BRIEF SURVEY OF TRENDS IN LIVESTOCK SECTORLet me begin by recalling that livestock are numerous, and they are more numerous in developing countries than in the developed countries. And there is no region in which they are more numerous than in Asia which accounts for 70 percent of world’s poultry, 44 percent of sheep and goats, 49 percent of bovines and 84 percent of pigs. Next, I would note that a large number of poor people depend on livestock. Those who depend on livestock – the poor, living on less than $2 a day – 70 percent of them live in rural areas. Among the poor people, 600 million are in South Asia and 300 million in sub-Sharan Africa. And if we were to categorize livestock production systems in three categories, (i) traditional societies, (ii) transforming societies and (iii) urbanized societies, it is quite clear that while the agriculture sector’s GDP declines as societies transform from traditional to more urbanized lifestyles, the share of livestock as a proportion of agricultural GDP increases. This presents smallholders with a particular opportunity in traditional and transforming societies. In this context, it is also important to note that while it is true that the livestock sector is industrializing rapidly, the role of and opportunities for smallholders remain important. For example, even in poultry − the most industrialized part of the livestock sector − the presence of flocks in rural households is predominant. In the cases of Viet
* Director General, International Livestock Research Institute, Nairobi, Kenya.

27
Nam and Cambodia, for example, both in terms of meat production and number of flocks, smallholder backyard systems predominate. Even in Thailand, which has one of the most modern poultry production systems, while most of the meat is produced in industrial systems, there are many flocks in smallholder systems.
Figure 1. Role of poor livestock keepers in the transtition from traditional to urbanized societySource: adapted from: McDermolt, J., Staal, S.J., Freeman, H.A., and van de Steeg.J., 2010 Sustaining intensification in smallholder livestock system in the tropics. Livestock, Science. DOI:10.1016/j.livsci,2010.02.014
Four billion people living on less than US$10 a day (primarily in developing countries) represent an aggregate purchasing power of US$2.9 trillion. Even with that buying power, however, per capita consumption of meat is low in developing countries compared to developed countries. However, the total amount of meat consumed in developing countries is much larger and given the relatively low per capita consumption in relation to the developed world, it will continue to increase in the near to long term. So, given the numerability and rapid growth in demand for livestock products, you can well imagine what the numerability of livestock will look like in 50 years time. And it is in that context that we need to examine the implications of all the health systems that I will come to in a moment. When we talk about the livestock sector in many countries, people like to go to the export sector very quickly. Clearly, countries would like to use the livestock sector to earn foreign exchange and grow their economies rapidly. However, it is also true to say that while trade is growing rapidly, it is only about 10 percent of aggregate livestock production. So, while trade is important, it is the local markets in most developing countries which deserve much more attention including the crucial question of food safety.
Developmentstage
Traditionalagriculturalsocieties
Transformingsocieties
Urbanizedsocieties
Demand for livestockproducts
Smallholder roles
Rural and urban poor-small quantities
Increased quantitydemanded
Quantity but especiallyquality demands
Smallholders haveadvantages-butnot everywhere
Smallholderscompetitive:informal markets
Complex valuechains; verticalcoordination;smallholders notcompetitive unlesslabour and inputs benefit
Share of agric in GDP (%)
Share of livestock in agric GDP (%)
30-50 15-45
15-25 18-50
6-9 30-50

28
While it is common understanding that smallholders and poor people do not care about quality, we have evidence that this is not true. And they are just as inclined to pay for safe products as are those who in more sophisticated markets. Let me turn now to the three healths I mentioned, and livestock is crucially related to all three of them. The underlying point here is that health is not simply the absence of disease. It is much more. Health of people, animals and ecosystems is clearly interdependent. It is the interaction between livestock health, human health and ecosystem health through which health threats emerge or subside and how we manage these collectively and interrelatedly has become an important topic that many have tried to resist for some time. But it is becoming increasingly clear that if we wish to strive to achieve good health in the broad sense then we must relate these three healths as we proceed. The point of departure with respect to the first health − human health and nutrition − is that livestock makes a major contribution to protein consumption (between 6 and 36 percent across a range of developing countries). For poor people who often consume small amounts of livestock products in developing countries, this consumption makes a significant contribution to their nutrition. Small amounts of animal protein have large benefits for child growth, cognitive development and pregnancy outcomes. Unfortunately, however, a small number of countries continue to bear most of the burden of malnutrition and a large proportion of that burden is in Asia. In this context, it is also important to recall that while 1 billion people are hungry, there are about 2 billion who are overnourished and some attribute this overnourishment to excessive consumption of livestock products. So we must strive to achieve good awareness about the implications of both under- and overconsumption of livestock products for human nutrition. The second point about the first health relates to the interaction and association between animal and human diseases. In this context I would like to note the following scientific facts: • 60 percent of human diseases are shared with animals. • 75 percent of emerging diseases are zoonotic and 25 percent of human infectious
disease burdens in least developing countries are zoonotic. • The top 13 zoonoses are responsible for at least 2.4 billion cases of illness and
2.2 million deaths every year. • Emerging zoonotic diseases associated with intensive systems are found not just in
the intensive systems in developing counties but also in parts of the United States and Europe. Thus hotspots for emerging zoonotic diseases exist throughout the world.
• The high burdens of zoonotic diseases are associated with poor livestock keepers and many of the hotspots are indeed in the developing world.

29
Greatest Burden of Zoonoses Falls on One Billion Poor Livestock KeepersAn ILRI study shows that zoonotic diseases are major obstacles in pathways out of poverty for one billion poor livestock keepers. The diseases mapped cause 2.3 billion human illnesses and 1.7 million human deaths a year. In poor countries, the diseases also infect more than one in seven livestock every year.
Map by ILRI, from original published in an ILRI report to DFID: Mapping of Poverty and Likely Zoonoses Hotspots,
2012.
Figure 2. Global zoonose distribution
Let me now turn to the second health, animal health itself. In this context, often the discourse is about transboundary diseases. These are no doubt important and how to control them largely influences how we control diseases at home. As important however are the other endemic diseases where the poor bear the brunt. So while we pay considerable attention to transboundary diseases and emerging diseases of pandemic potential, we must also equally consider the endemic diseases that affect the poor most. Now to the third health, ecosystem health, and here is where there has been considerable discourse in the past about the livestock sector. As is widely known by now, livestock is a significant source of greenhouse gas emissions. Livestock feed competes with staple and energy crops and competes heavily for natural resources such as land and water. Also, livestock can be a source of disease spill-over to wildlife. On the other hand, livestock contribute organic matter, especially for small livestock producers. For example, about 50 percent of nitrogen used in India comes from manure. Permanent pastures are important for carbon sequestration and production efficiency is key in reducing the livestock footprint. By 2050, we will need twice as much grain as we produce today but half of that will go to the livestock sector. So the environmental footprint of livestock will grow further. But, it is possible to reduce this footprint. Data from the United States have shown clearly that while the carbon footprint per animal has gone up, the footprint per unit of output has declined significantly due to higher productivity. This offers a great opportunity for us in the developing world. The lesson is clear – improving productivity of livestock is a key means of reducing its environmental footprint.
LEGENDNumber of poor livestock keepers per square kilometre
One or more people or animals out of 100 infected by one or more zoonotic diseases per year
1-55-2020-5050-100Above 100

30
Figure 3. Global needs for additional food to 2050 and production effi ciency in developed countries
So, for dealing with future challenges in the livestock sector, there are a few things we must do:1. Manage disease at animal source and not when it occurs in humans.2. Invest in a one health approach for zoonoses and prevention control.3. Promote incentive-based systems for food safety.4. Support smallholder systems to improve production and productivity.5. Promote better technologies and encourage innovation in delivery of livestock
services.6. Take a whole value chain approach rather than just treating the diseases from a clinical
standpoint.7. Better manage externalities and apply the ‘polluter pays’ principle to the extent
feasible.8. Invest heavily in productivity of ruminant animals.9. Reduce livestock-induced deforestation.10. Deal with manure management. 11. Control the use of feed additives and wanton use of antibiotics.12. Help livestock better its overall environmental performance by entitling it to payment
for ecosystem services. Finally, as this is a meeting about livestock sector policy, I wish to offer the following key advice to policy-makers:1. We need to invest heavily in better surveillance not only for animal health but also for
human and ecosystem health.2. We need better resource allocation between endemic diseases and emerging diseases,
and 3. We need cross-cutting support and innovation at all levels.
1944
Carbon footprint per billion kg milk
Carbon footprint per animal
00.5
Kg
CO
2 per
bill
ion
kg m
ilk
11.5
22.5
3
43.5
Additional grains1048 million tonnes
more to 2050
Humanconsumption
458 million MT
Livestock430 million MT
Monogastrics mostly
Biofuels160 million MT
Rice8%
Wheat26%
Othercoarsegrains21% Maize
45%
2007
Capperet al., 2009
1944
Production efficiency - developed countries
1 billion tonnes of additional cereal grains to2050 to meet food and feed demands (IAASTD 2009)
Additional food needed
0CO
2 eq
kg p
er c
ow
10
20
30
40
50
2007Feed, breed,
health =4 fold milkincrease

31
In conclusion, as we continue the discourse on how we would feed the world to stabilization of population, it is our belief that feeding the world is possible. We can do so in an environmentally sustainable way; we can do so whilst we reduce absolute poverty; and we can do so while improving the health of people, animals and the planet. Thank you very much.
32
Keynote address Livestock and natural resources
Henning Steinfeld*
Distinguished guests, ladies and gentlemen, I wish to thank the organizers, sponsors and partners of this forum and particularly to my previous speakers who have already touched upon some of the environmental issues I wanted to cover. This gives me an opportunity to spend some more time on policy issues and perhaps more importantly on the context of policy issues. I wish to begin by reminding ourselves that the livestock sector is particularly resource-hungry in a number of ways. It occupies a large share of the terrestrial surface of the planet − approximately 70 percent of all agricultural land if one includes pastureland; about one-third of cropland is dedicated to producing feed. That percentage rises to about 60 percent in some industrialized countries. About 60 percent of all anthropogenic biomass appropriation goes to livestock and this includes pastures and crop residues. About 30 percent of agricultural water use is dedicated to livestock. FAO estimates about greenhouse gas contribution by livestock are at 18 percent.1 Livestock is also a driver of deforestation, particularly in Latin America where pasture expansion and soybean arable land expansion comes at the expense of forest loss and associated degradation. Further, livestock is a major source of water pollution, particularly in East Asia where wet pig production systems predominate. So what we see is that the global demand for livestock products is growing rapidly and is projected to grow by 70 to 80 percent by 2050 – slightly lower in Asia because part of that growth has already occurred in the last 20 to 30 years. In developed countries we are seeing either a stagnation in demand, or slow increase/decline in some places. There has been declining demand in the United States and Europe for three consecutive years. However the demand is very strong in emerging countries. In Asia, India could possibly replace China as a locomotive for livestock sector growth depending on how diets develop in India. In low income countries in Africa and South Asia, the livestock revolution has only just started and this is where growth potential is highest. At the same time, natural resources are becoming scarce. Land, oil, water, energy and phosphorus reserves all seem to have peaked or are close to their peaks and the real question is whether we can continue to use these resources as we have done over the last 200 years. Environmental degradation and pollution are also compromising the quality of natural resources and climate change injects uncertainty that makes projections very difficult for the years to come. These effects are already beginning to manifest themselves in rising feed prices. Maize peaked last month
* Chief, Livestock Information and Policy, Food and Agriculture Organization of the United Nations, Rome.
1 This figure is currently under review and the best estimate as of today is 15 percent.

33
with the highest ever recorded prices due to drought in the United States and less than satisfactory harvests in the Russian Federation and India. For soybean as well, we are on track in reaching a new peak. In addition, we are on course to registering 2012 as the warmest year on record in the world. So there are real concerns in the context of the state of natural resources globally. We need to also remind ourselves that livestock differs from other commodities for various reasons and hence natural resource concerns are very important for the livestock sector. Thus it should be noted that:1. Production of animal protein, particularly when raised on concentrate feed, is typically
less efficient than plant protein. 2. The contribution of livestock to natural resource degradation is often exacerbated due
to livestock presence in very remote and marginal areas which are often out of reach of authorities. These include mountainous areas, dry areas, and so forth. Remoteness also contributes to expansion of livestock into forest areas and is a factor in overgrazing.
3. Intensive systems are often detached from the land. Countries import feed rather than livestock products. The share of trade in the total production of livestock is 10 percent but that of feed is 25 percent and for soybeans it is 60 percent. This indicates that feed is imported to production systems that are often disconnected from the feed base resulting in nutrient depletion where feed is produced and overloads where livestock is raised.
Considering the growing demand for livestock products and increasing natural resource scarcity, there are potentially significant gains in investing in measures to improve resource-use efficiency in livestock production − the efficiency with which land, nutrients, water and so forth are converted into animal products. Currently there are substantial gaps between attainable and realized efficiency and these gaps can be closed by existing technology. Given that there are many suboptimal producers, there are substantial gains to be made by making this technology available to the plethora of producers and investing heavily in improving productivity. Similarly, grasslands are areas where people usually have the highest incidence of poverty and environmental degradation but when it comes to environmental services, these are not recognized. We believe that improved range management can help restore soil carbon and provide other environmental services including water and biodiversity but for that we need carbon financing and other forms of payments for ecosystem services. This requires investment in methodologies and certification protocols. Finally, let us consider the issue of animal manure management, especially from intensive systems in concentrated clusters. The total amount of nutrients in livestock excreta actually exceeds that applied in synthetic fertilizers. So this is a huge resource that is very poorly utilized. About 50 to 90 percent of nutrients contained in feed are excreted as manure and 30 percent of energy is contained in manure compared to what is found in feed. The technology to recover most of the energy and most of the nutrients (with the exception of nitrogen) is available but for this we need policies to address the spatial distribution of livestock so as to create opportunities for recovery and recycling. Let me turn now to the policy issues that relate to the livestock-environment interface. More generally these issues relate to market failures, externalities and the need for equitable

34
growth but we need to place these in specific contexts, and these contexts are very diverse. There is no bill that fits all and a useful way of thinking about this diversity may be that we distinguish between different growth scenarios. First, there is the ‘no growth’ scenario − areas of endemic poverty where there is no growth. In these areas livestock is mainly a provider of livelihoods and a safety net for people who have very few alternative livelihood options. Second there are areas where there is strong demand for livestock products and where livestock can be an important source of income and employment generation opportunities. These are the areas where livestock can be linked into the growth process and can become a locomotive for rural broad-based growth. And then there are areas which may be characterized as ‘post growth’ and sometimes these areas may be suffering the consequences of growth in terms of pollution, poor food safety etc. Here the policy focus shifts away from the producer to the needs of urban consumers and the need for safe, clean and healthy foods. These three scenarios can also be useful in looking at specific policy objectives and instruments. First, in the no-growth areas social policies such as social protection programmes, subsidies, hand outs, education and health care policies take precedence over others. Very often in these areas we simply have to acknowledge that the carrying capacity of these areas in terms of people is exceeded and that in the absence of other industries or economic activities, the only viable option is to facilitate outmigration. In these areas, the prospects for productivity improvement and links to modern markets are limited. Therefore, the focus must remain on social policies as a way to address human suffering and human needs. At the same time, from the livestock point of view, there is a need to stabilize resource base − pasture areas in particular and investment in prevention of killer livestock diseases, simply because the impact of animal mortality on poor people’s livelihoods can be devastating. In the growth context where livestock is a source of income and employment, we need to focus on economic policies. Some of these would include stimulus policies to generate growth, investment in infrastructure and market development, as well as necessary technology development and transfer. But, from the livestock point of view, it would make sense to focus on preventing productivity-limiting and trade-restricting diseases and to invest in measures to enhance resource-use efficiency of livestock production, such as precision feeding and advanced genetics. In the post growth scenario the focus will primarily be on regulatory policies. The role of public policies here will mainly be to ensure sustainable and healthy diets and to reduce waste and, more generally, the environmental footprint of livestock. So what follows from the previous discussion is that ‘livestock policies don’t really exist per se’. These policies need to be put in specific socio-economic contexts and we need to look for ways to integrate livestock policies into other, more mainstream policies such as health policies, social policies, education policies, economic policies, trade policies etc. It is really our task as livestock practitioners and policy-makers to ensure that specific livestock sector concerns are recognized in other policies.

35
The main message is that livestock today is a key component of major global questions we are trying to answer − poverty, food security, pandemics, climate change, resource scarcity, economic growth, stability and so on. At the core of all these, to some extent, we have livestock issues. But, at the same time, the sector is driven by drivers over which we have no control. These include population growth, industrialization, globalization, growing wealth and persisting poverty, spread of knowledge and technology. These drivers are external to the livestock sector and we need to accept this. It follows that the operating space for the livestock sector is quite small; which means we need to adjust. We cannot really shape. Livestock sector practitioners and professionals are just not powerful enough and we must fit into the context that is given to us. And that means we have to look for integrated policies instead of stand-alone livestock sector policies. We need to be smart where we put our efforts, look for opportunities and pool our talents and resources through multistakeholder processes. Thank you.

36
Special contribution to the proceedingsLong-term food security in developing Asia
D. Roland-Holst and Songsak Sriboonchitta*
Recent instability of food prices has drawn attention to food security issues around the world and particularly in South and Southeast Asian economies. Across the developing world, a high proportion of household income is dedicated to the purchase of food products. For this reason, rising costs of such products disproportionately burden lower income earners, causing many such households to decrease amounts of daily food intake or sell productive assets to purchase food. This in turn means increased number of people experiencing nutrition vulnerability worldwide and worsening economic conditions in the poorest countries. Such vulnerability is concentrated among the poor, who spend much larger percentages of their real incomes on food (Figure 1).
Figure 1. Food expenditure as percent of income (118 countries)Source: Based on FAO and World Bank data.
After having fallen from their 2008 heights, global food prices returned to an upward trend in tandem with the global economic recovery from mid-2010, led by demand from emerging market economies. The causes of high food prices, including rising food, feed and fuel demand, and elevated weather/climate uncertainties remain in place. Indeed, the Russian Federation’s decision to ban exports after widespread crop losses from drought and fires * David Roland Holst, Professor, Department of Agricultural and Resource Economics, University
of California Berkeley Songsak Sriboonchitta, Faculty of Economics, Chiang Mai University, Chiang Mai, Thailand
Figure 1: Food Expenditure as a percent of Income (118 countries)
0
0 10 20 30 40 50 60
10
20
30
40
50
60
70
10
Perc
ent o
f Inc
ome
Spen
t on
Food
80%
2005 Per Capita (PPP) Income in Thousands
50%
of w
orld
Pop
ulat
ion

37
intensified pressure on already volatile wheat prices as they reached a 23-month high in August and raised concerns about food prices worldwide. Coordinated and comprehensive policy action will be necessary to mitigate the adverse impacts of future food price rises on the welfare of poor people. At the same time, in many areas of low-income Asia, agricultural yields are far below potential, a differential referred to as the ‘yield gap’. Increased demand in higher income Asian economies and higher food prices has the potential to incentivize higher agrifood production in lower income countries. In low-income countries, agriculture accounts for an extremely large proportion of employment particularly in rural communities. Therefore increased production would lead to improved employment opportunities, incomes and livelihoods. Thus, such production increases may achieve the twin objectives of promoting development and improved long-term food security. This paper explores these issues in three parts. It first gives a brief overview of the food price crisis of 2007-2008 as a background to the long-term outlook. This is followed by long-term forecasts of regional agrifood growth and development, evaluated from the perspectives of food security and livelihoods. The closing section offers concluding remarks.
FOOD SECURITY AND PRICE VOLATILITY: THE 2007-2008 FOOD CRISISBeginning in 2007 and peaking in mid-2008, food prices worldwide skyrocketed (Figure 2). There were many factors contributing to this price escalation. Depletion of many countries’ stocks of cereals coincided with rapidly growing emerging market demand (particularly for animal feed), increasing biofuel production and use and the declining value of dollar. These market stresses were seriously aggravated, however, by policy interventions. Major rice producers began imposing restrictions on rice exports in an effort to tamper domestic rice price increases. Export restrictions also triggered ‘distress buying’ as importing countries escalated orders, creating a perfect story for global rise prices, which peaked at over US$1 000/tonne in April of 2008 (Brahmbhatt and Christiaensen, 2008).
Figure 2. Food Price index and cereal prices 2001-2011Source: FAO data.
0.0
Food Price Index
Cereals
1/20
016/
2001
11/2
001
4/20
029/
2002
2/20
037/
2003
5/20
0410
/200
43/
2005
8/20
051/
2006
6/20
06
4/20
079/
2007
2/20
08
5/20
0910
/200
93/
2010
8/20
101/
2011
7/20
0812
/200
8
11/2
006
12/2
003
50.0
100.0
150.0
200.0
250.0
300.0
Viet Nam places partialban on new rice sales

38
Demand for food on a global basis has been increasing steadily for decades. One reason for sustained robust growth in demand for cereals has been per capita income growth in many countries in the Asia-Pacific region. With rising incomes, many in the region are eating more meat, inducing higher production of grain-fed livestock (ESCAP 2009). As a result, demand has outpaced production resulting in depletion of global cereal stocks. From 1999 into the early 2000s, the world stocks of wheat, maize and rice fell by 31, 59 and 50 percent respectively resulting in the lowest level of worldwide cereal stocks in 30 years (ESCAP 2009). This caused prices of food to begin their upward trend in the 2000s. According to studies by the World Bank, rising energy and fertilizer costs and the decline in value of the dollar have contributed to some 35 percent of food price rises. Higher fuel costs to supply agricultural machinery, irrigation systems and transport increase the cost of agricultural production as does the increased price of fertilizers of which production energy is a major input (Brahmbhatt and Christiaensen 2008). Other studies have claimed that decline in the value of the dollar increases dollar commodity prices with an elasticity of 0.5 to 1.0 (Baffes 1997; Brahmbhatt and Christiaensen, 2008). Food price increases were 9 percent in 2006, 23 percent in 2007 and 51 percent “between January-June 2007 and January-June 2008” (ESCAP 2009). The most rapid increases of late 2007 and January to April 2008 were largely due to export restrictions of rice-exporting countries. In September of 2007 Viet Nam, the second-largest rice exporter placed a partial ban on new sales. India, the third-largest exporter, followed with an imposed minimum export price in October. In December, China, a mid-level exporter imposed a tax on rice exports. At the height of the crisis in March of 2008 Viet Nam, India, Egypt and Cambodia all imposed or re-imposed bans on rice exports (USDA 2008). This sequence of rice export restrictions had a massive impact on world rice prices. Imposing export restrictions or export taxes may be a first response of a food-exporting country facing a rapid increase in food prices. The purpose of such policy is to control domestic prices and secure domestic supply. This may benefit domestic consumers; however it will adversely affect domestic producers and consumers in food-importing countries and more broadly it will have a negative impact on regional and global food security (ESCAP 2009). This also creates a domino effect provoking other exporters to also implement such policy and distress buying by importers which causes prices to rise further (Brahmbhatt and Christiaensen, 2008). High prices benefit the terms of trade of countries that export agricultural products but the groups such as the rural landless and urban poor are negatively impacted by such price rises. Within such groups 50 percent or more of income may be spent on food and price increases heavily impact such family budgets. The high prices of food impact lower income countries most heavily. During the 2007-2008 crisis such high prices contributed to “social turbulence or even food riots in over 30 countries from Bangladesh to Indonesia and contributed to the fall of at least one elected government” (ESCAP 2009).

39
LONG-TERM RISKS TO FOOD SECURITYAlthough agrifood prices over the last decade have exhibited volatility for a variety of reasons, long-term global capacity to meet nutritional needs will be determined by more fundamental issues. Among these, the most prominent are population growth, technological change and the capacity of the natural resource base to sustain food production in concert with demand growth. As demonstrated in Figure 3, our historic successes in this regard have come from a stable resource base and ever-rising agricultural yields.
Figure 3. Total world grain and oilseed yieldsSource: based on data from USDA.
As Table 1 indicates, the world managed its food security with relatively modest annual productivity increases, averaging 2-2.3 percent per annum since the 1970s. Whether or not this will be sufficient for the future depends on several factors. The first of these will be population growth, which is slowing globally, but at varying speeds (Table 2). If humankind can moderate its growth to about 9 billion people, this growth will have converged to about 1 percent per annum. In this case, food production for today’s diets could be sustained with historical yield growth. However, large emerging economies are rapidly changing their food consumption patterns, in particular shifting toward meat and specialty crops. These products are much more resource intensive, and if such trends are to be sustained much higher yield growth would be required. Thus the main threat to food security from the demand side would arise not from simple population growth but changing taste and rising purchasing power. On the supply side, long-term threats to food security are dominated by climate factors, particularly water availability and attendant risks that can be expected from rising average global temperatures. The leading global climate models have somewhat divergent views regarding temperature and precipitation trends, yet conclusions regarding global agricultural yields are more harmonious because of the prominence of the so-called CO2
fertilization effect. Generally speaking, temperature and precipitation trends will induce shifting of agricultural capacity, mainly from equatorial to polar latitudes. Increased CO2 concentrations, however, will have a more uniform and positive yield effect, moderating local adverse consequences and amplifying benefits.
100
1975 1980 1985 1990 1995 2000 2005 2010 2015
120
140
160
180
200Index: 1975 = 100
80
Area HarvYield
Peak
Peak
PopulationProductionPercap Use

40
Table 1. Average annual growth of agricultural output1970-1979 1980-1989 1990-1999 2000-2006
Sub-Saharan Africa 1.31 2.60 3.10 2.20
Latin America and the Caribbean 3.07 2.37 2.87 3.13
Brazil 3.83 3.73 3.29 4.41
Near East and North Africa 2.94 3.37 2.73 2.34
East Asia 3.11 4.60 5.06 3.85
China 3.09 4.60 5.17 3.87
Southeast Asia 3.68 3.59 3.13 3.54
South Asia 2.56 3.39 3.00 2.19
India 2.69 3.52 2.94 2.00
North America 2.17 0.73 2.03 1.10
Oceania 1.79 1.25 2.93 -0.04
Western Europe 1.54 0.94 0.46 -0.35
Eastern Europe 1.80 0.25 -2.18 -0.19
Russian Federation 1.32 0.98 -4.62 2.70
Developing countries 2.82 3.46 3.64 3.09
Developed countries 1.88 0.86 1.21 0.39
World 2.23 2.13 2.04 2.22
Sources: USDA, World Bank.
Table 2. Global human population projectionsTotal population (millions)
2000 2010 2020 2030 2040 2050
North America 306 337 367 392 413 430
Europe & Russia 752 762 766 761 748 729
Pacific OECD 150 153 152 148 142 135
Sub-Saharan Africa 655 842 1 056 1 281 1 509 1 723
Latin America 505 574 638 689 725 744
Middle East & North Africa 303 370 442 511 575 629
East Asia 1 402 1 500 1 584 1 633 1 630 1 596
South/Southeast Asia 1 765 2 056 2 328 2 553 2 723 2 839
Rest of World 210 233 249 262 272 280
Developed countries 1 141 1 177 1 202 1 211 1 210 1 198
Developing countries 4 696 5 417 6 132 6 758 7 257 7 627
Rest of World 210 233 249 262 272 280
World 6 047 6 827 7 582 8 231 8 739 9 105
Source: United Nations.

41
As shown in Table 3, despite significant estimated changes in temperature and rainfall patterns, increased CO2 concentration will spontaneously contribute to agriculture yields in a way that significantly or in some cases fully offsets agricultural resource productivity declines. While these results give comfort to many who are concerned about the impact of climate change on global food security, it must be emphasized that the same research suggests that food prices will rise substantially during the same period, a predictable market response to animate needed resource shifting for adaptation in this sector.
Table 3. Impacts of climate change on cereal production, with and without CO2
fertilizationChange in cereal procuction compared to the Reference scenario (percent)
Hadley A2 CSIRO A2 Hadley A2,without CO2 fertilization
2020 2030 2050 2080 2020 2030 2050 2080 2020 2030 2050 2080
North America 1.9 -2.9 -2.9 -0.8 2.8 0.1 5.8 7.1 0.9 -3.9 -4.6 -4.8
Europe & Russia 0.8 2.0 1.8 1.5 0.5 1.7 1.0 3.1 0.1 1.0 0.1 -1.1
Pacific OECD -2.2 2.4 9.5 14.0 2.5 6.9 7.0 18.2 -1.8 2.8 9.3 13.6
Sub-Saharan Africa -1.3 0.3 -2.0 -2.5 -0.6 0.4 -2.9 -7.2 -0.9 0.6 -2.0 -2.2
Latin America 0.9 4.7 5.5 6.0 1.3 3.5 -0.7 0.9 1.3 5.0 6.4 8.0
Middle East & North Africa -0.5 0.7 1.1 -1.0 5.2 7.7 7.4 -1.0 -0.7 0.3 0.3 -2.2
East Asia 0.1 0.7 2.0 -2.8 -2.2 -2.8 -3.4 -7.2 -0.6 -0.4 0.2 -5.3
South/Southeast Asia -1.3 -1.3 -3.7 -12.2 -4.8 -5.9 -8.9 -12.8 -1.6 -1.9 -4.6 -13.2
Rest of World -1.6 -1.7 -3.1 -4.6 -2.4 -2.8 -3.4 -4.6 -2.6 -3.4 -6.1 -9.0
Developed countries 1.2 -0.7 -0.3 0.5 1.7 1.1 4.2 5.9 0.3 -1.7 -2.0 -2.8
Developing countries -0.3 0.7 0.2 -3.9 -1.8 -1.8 -4.2 -7.3 -0.6 0.2 -0.6 -4.9
World 0.3 0.1 -0.2 -2.2 -0.4 -0.6 -0.8 -2.1 -0.3 -0.7 -1.4 -4.3
Source: Fischer (2009).
LONG-TERM SCENARIOS FOR ASIAN FOOD SECURITY In order to understand, somewhat more systematically, the possible future scenarios, we calibrated a dynamic CGE model to a baseline time series reflecting a business-as-usual scenario over 2006–2020. This baseline comprised consensus forecasts for real GDP obtained from independent sources (e.g. the International Monetary Fund, Data Resources International and Cambridge Econometrics). The model was then run forward to meet these targets, making average capital productivity growth for each country and/or region endogenous. This calibration yielded productivity growth that would be needed to attain the macro trajectories, and these were then held fixed in the model under other policy scenarios. As the main objective of this exercise was to assess the prospects for improving food security in Asia, we considered a combination of external risks and opportunities, comprising six scenarios shown in Table 4 below. The risks are generic – rising energy prices and supply shocks to global agrifood markets. On the opportunity side, we considered four sources of greater efficiency and productivity for the region.

42
Table 4. Core scenariosScenario Name Description
1 Energy price escalation (EPrice) Assume prices of global fossil fuels rise 100% above baseline trends by 2030
2 Agrifood supply shock (SShock) Assume non-Asian nations experience declining agrifood exports, falling 20% below baseline trends by 2030
3 Infrastructure investment for trade facilitation (TMarg)
Assume that investments and institutional changes effect a 50% reduction in trade, transport, and transit margins for Asian countries
4 Trade liberalization (TrLib) Assume Asia achieves abolition of nominal trade distortions (import taxes and subsidies) across the region
5 Agrifood productivity (AgProd) Assume that total factor productivity grows at 4% annually in agriculture and food-processing sectors
6 Supply chain integration (SCI) In addition to Scenario 2, assume that, for countries, the stock of SCI rises to at least 15% of GDP by 2030.
ResultsThe simulation results for the six scenarios, stated in terms of real GDP growth, are summarized in Table 5. Generally speaking, these results are consistent with intuition and a large body of related work on regional trade, agrifood productivity and investment. The most salient findings are summarized as follows:
Table 5. Real GDP by country, cumulative percent change, 2010-2030
EPrice SShock TMarg TrLib AgProd SCI
Bangladesh 0.2 0.5 1.2 1.2 6.9 11.4
Cambodia -0.4 0.0 4.9 13.1 40.9 61.0
China 0.2 0.3 1.1 1.4 5.5 13.6
India 0.1 0.2 0.8 2.4 14.8 22.5
Indonesia 0.2 0.7 1.4 1.6 12.7 20.0
Kazakhstan -0.7 -0.7 -0.1 0.0 2.3 10.1
Lao PDR 0.1 0.8 1.8 4.4 49.0 55.1
Malaysia -0.2 0.0 0.8 3.8 8.0 9.5
Pakistan 0.0 0.2 0.6 0.9 13.4 17.9
Philippines 1.1 1.7 3.2 2.5 15.7 32.7
Sri Lanka 0.2 0.9 1.6 1.9 28.9 30.1
Thailand -0.2 0.4 1.7 3.3 13.6 15.1
Viet Nam 2.1 2.8 6.2 12.3 27.4 33.3
All Asia 0.1 0.2 0.6 1.0 4.8 8.8
Note: In this and subsequent tables, countries/regions are listed in order of increasing per capita income.Source: Author estimates.
43
Energy price increases (EPrice): If they emerge as part of a steady trend, higher oil prices can be accommodated without significant adverse impacts on regional economies. In particular, a 100 percent increase in global fossil fuel prices would trigger the expected structural adjustments needed to reduce conventional energy intensity of GDP and keep Asian economies on their expected growth trajectories. Noteworthy in this case is intensification of comparative advantage in less energy-intensive production, which benefits countries like Viet Nam and Philippines, while being adverse to conventional energy exporters like Malaysia and Kazakhstan. Overall, however, aggregate impacts are quite moderate.
Supply Shock (SShock): Decline in food exports from non-Asian countries generally induces higher output in the region, which is to be expected from the significant underutilized agrifood capacity in the region. Overall, this impact is moderate, however, because the region is relatively self-sufficient in food.
Reduction in trade, transport, and tariff margins (TMarg and TrLib): As many studies of regional and global trade liberalization have already demonstrated, removing hard and soft institutional and price barriers to trade would realize substantial efficiency gains and increase regional incomes. The benefits depend on two factors: prior protection/margin levels and export competitiveness. The region as a whole would only increase GDP by 1 percent, but many lower income countries would see much greater gains because they face higher margins and trade barriers and they have significant export cost advantages. These results strongly support the argument that Asian regional trade is welfare enhancing and promotes regional livelihood convergence – good for every country, small in overall impact, but more positive for poorer countries (Figure 4).
Agrifood Productivity Growth (AgProd): Given the importance of agrifood to incomes of most of Asia’s poor (rural dwellers still constitute a significant majority of the total population), it is hardly surprising that rising productivity for agrifood has a dramatic effect on regional real GDP. Because higher income countries are more diversified and less impacted on the income side, the aggregate impact is modest, but again we see much larger benefits for lower income economies. Even moderate productivity growth like that specified in Scenario 5 would increase cumulative GDP by double digit percentages in most countries. Again we see a welfare improving impact, improving real incomes across the entire region, but primarily among lower income economies.

44
Figure 4. Real GDP by country, cumulative percent change, 2010-2030Source: Author estimates.
Greater Asian regional supply chain integration (SCI): More intensive use of SCI within Asia would significantly increase long-term growth in the region. The simulation indicated that SCI can potentially bring about US$1.8 trillion of additional external investment into the Asian region (about half of today’s Asian dollar reserves) over a 20 year period. This money would significantly increase real growth rates, particularly in lower income countries where domestic savings are a serious constraint.
Table 6, 7 and 8 give more detailed macroeconomic results for scenarios, 4, 5, and 6. Scenario 4 can be thought to represent the composite of external risks (energy and food prices), combined with a first set of policy responses (regional trade facilitation). We see from the results in Table 6 that such regional integration is a credible first line of defense in the sense that it benefits every member country and some significantly so. Indeed, real GDP benefits understate the gains to Asian households, more accurately reflected in the Equivalent Variation (EV) income effects of the last column. Although consumption prices (CPI) increase because of the adverse shocks, trade facilitation expands income opportunities to more than offset this. Significantly if not surprisingly, trade volumes increase sharply for member countries, further accelerating regional integration.
-20%
TrLib AgProd SCI
20%
40%
60%
80%
100%
0%
Other DMC
Banglad
esh
Cambodia
Lao PDR
Pakist
an
Viet N
am India
Philippines
Indonesia
Sri Lan
kaChina
Thailan
d
Kazak
hstan
Malays
ia
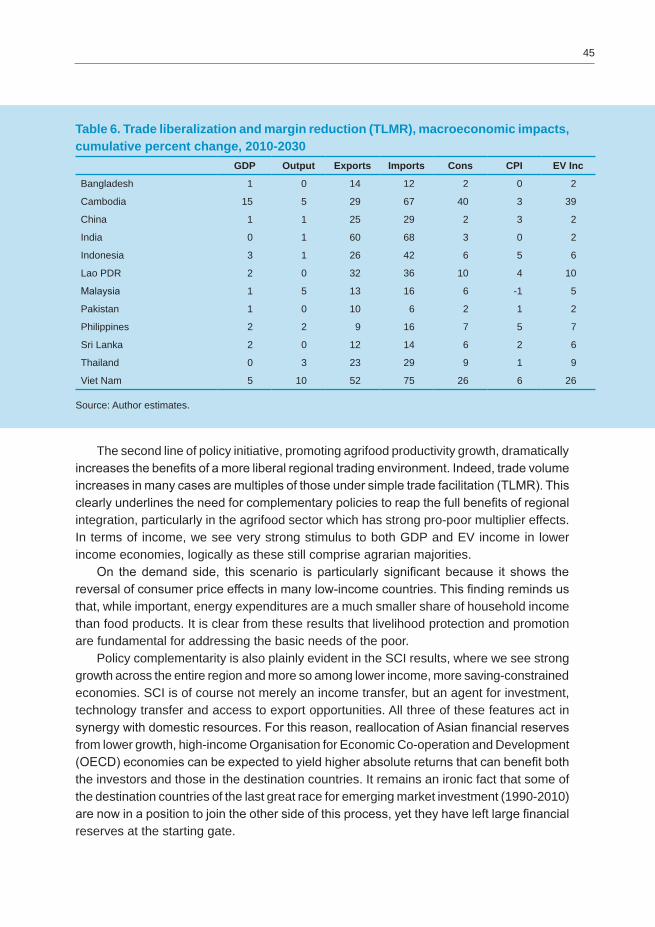
45
Table 6. Trade liberalization and margin reduction (TLMR), macroeconomic impacts, cumulative percent change, 2010-2030
GDP Output Exports Imports Cons CPI EV Inc
Bangladesh 1 0 14 12 2 0 2
Cambodia 15 5 29 67 40 3 39
China 1 1 25 29 2 3 2
India 0 1 60 68 3 0 2
Indonesia 3 1 26 42 6 5 6
Lao PDR 2 0 32 36 10 4 10
Malaysia 1 5 13 16 6 -1 5
Pakistan 1 0 10 6 2 1 2
Philippines 2 2 9 16 7 5 7
Sri Lanka 2 0 12 14 6 2 6
Thailand 0 3 23 29 9 1 9
Viet Nam 5 10 52 75 26 6 26
Source: Author estimates.
The second line of policy initiative, promoting agrifood productivity growth, dramatically increases the benefits of a more liberal regional trading environment. Indeed, trade volume increases in many cases are multiples of those under simple trade facilitation (TLMR). This clearly underlines the need for complementary policies to reap the full benefits of regional integration, particularly in the agrifood sector which has strong pro-poor multiplier effects. In terms of income, we see very strong stimulus to both GDP and EV income in lower income economies, logically as these still comprise agrarian majorities. On the demand side, this scenario is particularly significant because it shows the reversal of consumer price effects in many low-income countries. This finding reminds us that, while important, energy expenditures are a much smaller share of household income than food products. It is clear from these results that livelihood protection and promotion are fundamental for addressing the basic needs of the poor. Policy complementarity is also plainly evident in the SCI results, where we see strong growth across the entire region and more so among lower income, more saving-constrained economies. SCI is of course not merely an income transfer, but an agent for investment, technology transfer and access to export opportunities. All three of these features act in synergy with domestic resources. For this reason, reallocation of Asian financial reserves from lower growth, high-income Organisation for Economic Co-operation and Development (OECD) economies can be expected to yield higher absolute returns that can benefit both the investors and those in the destination countries. It remains an ironic fact that some of the destination countries of the last great race for emerging market investment (1990-2010) are now in a position to join the other side of this process, yet they have left large financial reserves at the starting gate.

46
Table 7. TLMR and agrifood productivity growth, macroeconomic impacts, cumulative percent change, 2010-2030
GDP Output Exports Imports Cons CPI EV Inc
Bangladesh 8 7 39 24 9 -3 9
Cambodia 44 33 56 66 65 -3 62
China 6 4 25 29 11 0 11
India 16 12 110 82 15 -4 14
Indonesia 15 11 56 49 15 4 15
Lao PDR 47 33 124 50 48 0 45
Malaysia 6 8 16 19 15 -5 11
Pakistan 15 12 51 13 12 -4 10
Philippines 16 13 30 18 17 3 16
Sri Lanka 34 21 86 32 25 3 23
Thailand 9 12 42 35 16 1 16
Viet Nam 24 23 74 84 42 3 41
Source: Author estimates.
In any case, increasing the depth and scope of Asian SCI should be a high priority for regional policy-makers, particularly in an era of global growth uncertainty. Taken together, Asian economies are no longer small relative to their historical destination markets, and it is not realistic to expect high growth rates via rapid expansion of domestic market share in slow-growing OECD economies. For this reason, Asia represents a logical source of investment diversification for itself, not only for the usual portfolio risk reduction benefits, but because the region represents most of the world’s superior national growth rates already.
Table 8. TLMR, APG, and SCI, macroeconomic impacts, cumulative percent change, 2010-2030
GDP Output Exports Imports Cons CPI EV Inc
Bangladesh 15 7 -9 43 17 3 16
Cambodia 71 49 47 97 88 -3 85
China 23 10 6 52 21 3 21
India 29 18 53 134 27 0 25
Indonesia 31 16 36 84 26 7 26
Lao PDR 53 42 64 84 64 3 60
Malaysia 7 10 20 23 18 -4 13
Pakistan 19 16 18 39 22 1 20
Philippines 35 30 26 52 38 5 37
Sri Lanka 38 22 69 48 31 7 28
Thailand 10 13 44 37 19 3 19
Viet Nam 31 25 68 96 50 5 49
Source: Author estimates.

47
FOOD SECURITYNational policies in all countries are strongly influenced by the most basic forms of economic security, i.e. personal health, safety and nutrition. In lower income countries, the risks associated with these basic needs are higher because a larger proportion of the population is vulnerable, not meeting basic needs. We have seen in the above discussion that the Asian region faces many uncertainties regarding food output and availability, and that there are many ways to measure the attendant risks. In this section we examine the long-term forecasts from this perspective. We saw that trade facilitation, agrifood productivity growth, and greater SCI all have the potential to contribute substantially to Asian livelihoods. What they can do for food security is suggested first by the results of Table 9, which presents national changes in total agrifood output for each scenario and country/region analysed. Again, we focus attention on the last three scenarios.
Table 9. Agrifood output by country, cumulative percent change 2010-2030EPrice SShock TMarg TrLib AgProd SCI
Bangladesh 0.6 1.7 -0.6 -0.3 14.3 15.4
Cambodia -2.3 -1.2 -3.9 -35.2 49.9 63.9
China -0.4 1.2 0.6 -1.1 27.0 30.6
India -0.2 0.4 0.3 -11.3 13.9 16.7
Indonesia -0.1 1.2 0.4 1.2 25.6 27.9
Lao PDR 0.4 0.5 -0.9 -9.0 27.9 51.7
Malaysia 2.1 7.8 13.2 18.2 31.1 44.4
Pakistan 0.0 0.8 0.3 0.1 24.0 30.7
Philippines -0.2 0.9 -1.6 -1.1 22.8 42.2
Sri Lanka -0.6 -0.8 -5.1 -4.1 21.0 28.4
Thailand 0.2 2.1 -2.0 -12.5 6.9 6.0
Viet Nam -1.0 -0.3 2.4 -24.5 14.5 15.4
All Asia -0.3 1.0 0.4 -4.0 22.0 26.0
Source: Author estimates.
The impact of trade facilitation on national agrifood output is ambiguous, as would be expected from the logic of basic Ricardian trade theory. Although trade regional facilitation increases efficiency and thus induces higher aggregate income in all member countries, simply removing trade distortions has the effect of intensifying pre-existing patterns of comparative advantage. Thus countries with established and emerging competitiveness and low resource costs in rural areas will see resources pulled from agriculture toward light and heavy manufacturing. Even countries like Thailand, with high levels of agrifood industrialization, are more constrained by trade margins and tariffs against other industries. When these come down, the latter expand at the expense of agrifood. This threat to agrifood competitiveness has been a persistent controversy in trade agreements, particularly between (heavy agrosubsidy) North and South partners, for decades.

48
Agrifood’s loss of competitiveness is by no means inevitable, however, and the most constructive approach to realizing the aggregate gains from greater regional trade efficiency is to promote agrifood productivity growth as a complementary policy. When this is done (AgProd scenario), our results indicate that the benefits will be uniformly positive across the region (Figure 5). In particular, even moderate productivity growth (4 percent per annum) is enough to reverse large adverse effects and achieve over 30 percent higher cumulative agrifood output in some countries by 2030. The intuition behind this process is simple. Higher farm productivity not only keeps domestic agrifood production competitive, but it enables the release of labour resources to other sectors stimulated by trade facilitation, creating a win-win growth setting for both rural and urban sectors. Finally, higher levels of SCI consolidate these gains in both sectors, improving national efficiency, further raising labour productivity and real wages.
Figure 5. Agrifood output changes, cumulative percentage, 2010-2030Source: Author estimates.
As discussion of the adjustment mechanisms suggests, the primary agrifood benefits in these scenarios relate to more efficient recruitment of relatively low wage and low price resources in the rural sectors of low-income countries. This logic has a corollary that the policies should be pro-poor across Asian countries. The concept of regional economic convergence is of particular importance to Asia, which comprises countries with very diverse livelihood conditions. Our results show that the policies considered will make important contributions to this convergence, enhancing relative growth in low-income countries more than in high-income countries (Figure 6). Although outcomes vary for reasons other than average income levels, there is a clear downward trend in these national results, particularly when weighted by population. Of particular importance is the SCI scenario, where regional capital mobility and expanded contractual networks help lower income countries overcome local capital constraints and more fully realize their agrifood potential.
TrLib AgProd SCIOther
DMC
Banglad
esh
Cambodia
Lao PDR
Pakist
an
Viet N
am India
Philippines
Indonesia
Sri Lan
kaChina
Thailan
d
Kazak
hstan
Malays
ia20%
50%
100%
150%
200%
250%
-50%

49
Figure 6. Changes in agrifood output resulting from productivity growth (blue) and supply chain integration (black), cumulative percent, 2010-2030Source: Author estimates.
CONCLUSIONSWith greater regional integration in Asia, agrifood-exporting countries could benefit from increased foreign investment and technology transfer in agricultural supply chains while achieving greater market access in large, rising income economies, most notably China. Attaining food security in a world with high and volatile food prices will remain a challenge, but proper policy, appropriately targeted investment and improvements in agricultural supply chains hold the potential for improved livelihoods and food security across the region. Using a global dynamic forecasting model, we examined the long-term nature of Asian food security in the context of energy and food price risk, as well as policy responses including regional integration, agrifood productivity growth and greater regional SCI. Our results strongly support these three types of policies as essential to sustained regional growth, greater food security and economic convergence or pro-poor Asian growth. These results have many detailed lessons at the national and sector level, but a few salient conclusions emerge:
-50%365 3,650 36,500
365 3,650 36,500
0%
50%
100%
150%
200%
250%
300%
-50%
0%
50%
100%
150%
200%
250%
300%
Perc
ent C
hang
e, R
eal A
grof
ood
Out
put
Perc
ent C
hang
e, R
eal A
grof
ood
Out
put
Per Capita Annual Income (2012 USD) - Logarithmic
Per Capita Annual Income (2012 USD) - Logarithmic
ChinaIndiaPakistan
Other DMC
Hilnc Asia
MalaysiaThailand
Sri Lanka
Indonesia
Kazakhstan
China
IndiaPhilippines
PakistanBangladesh
Viet NamLao PDR
Cambodia
Other DMC
Hilnc Asia
MalaysiaThailand
Sri Lanka
Indonesia
KazakhstanPhilippines
Bangladesh
Viet NamLao PDR
Cambodia

50
• Energy price increases − if they emerge as part of a steady trend, they can be accommodated without significant adverse impacts on Asian developing economies.
• Declining food exports from non-Asian countries generally induce higher output within the region due to their significant underutilized agrifood capacity in the region.
• Reduction in trade, transport and tariff margins would realize substantial efficiency gains and increase regional incomes. The benefits depend on two factors: prior protection/margin levels, and export competitiveness.
These results strongly support the argument that Asian integration is welfare improving and promotes regional livelihoods. Given the importance of agrifood to incomes of most of Asia’s poor, where rural dwellers still constitute a significant majority of the total population, it is hardly surprising that rising productivity for agrifood has a dramatic positive effect on regional real GDP. Even moderate productivity growth like that specified in our scenarios would increase cumulative GDP by double digit percentages in most countries. More intensive and extensive use of SCI within Asia would significantly increase long-term growth in the region. Our results show clearly that regional supply chain expansion, with its attendant benefits of technology transfer and enhanced market access, can be a potent catalyst for growth, particularly in lower income countries where domestic savings and food purchasing power are serious constraints. These policies significantly increase the region’s food output and availability as well as being good for growth, good for every country and better for the poor.
REFERENCESBaffes, J. 1997. Explaining stationary variable with non-stationary regressors. Applied
Economics Letters, 4: 69-75.Brahmbhatt, M. & Christiaensen, L. 2008. Rising food prices in East Asia: challenges
and policy options. World Bank. May 2008.ESCAP. 2009. Sustainable agriculture and food security in Asia and the Pacific. Bangkok,
Thailand, United Nations Economic and Social Commission for Asia and the Pacific. Fischer, G. 2009. World food and agriculture to 2030/50: how do climate change and
bioenergy alter the long-term outlook for food, agriculture and resource availability? in FAO, How to feed the World in 2050. Proceedings of a technical meeting of experts, Rome, Italy, 24-26 June pp. 1-49
United States Department of Agriculture (USDA). 2008. U.S. rice industry: background statistics and information. 30 Apr 2008. <http://www.ers.usda.gov/news/ricecoverage.htm>. Accessed 13 Feb 2011.

Technical papers

53
Structural changes in the Indian dairy sectorAnjani Kumar, P.K. Joshi and Roelof J. Jongeneel*
Livestock is an important subsector of agriculture in India; it accounts for more than one-fourth of agricultural gross domestic product and provides employment to 21 million people, the majority of whom are landless labourers, and marginal and small farmers. Diversification of agricultural production with more emphasis on livestock is considered as one of the pathways to enhance agricultural growth and reduce poverty. The sector has been growing at a rate faster than the crop sector and its contribution to the agricultural economy has been increasing over time. Milk and milk products are the major components of the livestock sector and account for more than two-thirds of the value of output of livestock products. Milk production in India increased from 17 million tonnes in 1950-1951 to 127.3 million tonnes in 2011-2012; per capita availability of milk increased from 124 grams per day to 281 grams per day during this period. India emerged as the largest milk-producing country in 1998 with production of 74.1 million tonnes, overtaking the United States and has maintained that position ever since. The demand for milk and milk products has been increasing consistently: their share in monthly per capita expenditure increased from 11.5 percent in 1983 to 16.0 percent in 2009-2010 in rural areas and from 15.7 percent to 19.2 percent in urban areas during the same period (GoI 2010). Looking at the evolution of the Indian dairy sector, it is quite evident that it has undergone structural changes and there are some interesting patterns unfolding all along the value chain. This paper is an attempt to document these changes.
OVERVIEW OF THE INDIAN DAIRY SECTORThe structural transformation of Indian agriculture and the growing importance of livestock and dairying in the agricultural economy of India is clearly evident from Table 1. Livestock now generates a higher value of output than foodgrains. In 2010 to 2011, livestock output was valued at Rs2 207 billion or approximately US$49.6 billion (at 2004-2005 prices) – about 22.7 percent more than the value of foodgrains. Milk, which accounts for more than two-thirds of the value of livestock output has emerged as the largest agricultural commodity in the country. And since the mid-2000s the value of milk has been larger than the combined value of rice and wheat − the main cereals of India. These changes are mainly attributed to the changes in the food consumption pattern away from cereals towards high-value food commodities including milk and milk products. The share of milk in agriculture value of output increased from 12 percent during 1979-1981 to 19 percent in 2009-2011.
* Anjani Kumar, Principal Scientist, International Crops Research Institute for the Semi-Arid Tropics (ICRISAT)
P.K. Joshi, Director (South Asia), International Food Policy Research Institute (IFPRI) Roelof J. Jongeneel, Senior Economist, Landbouw-Economisch Instituut B.V., The Netherlands

54
Table 1. Value of output at constant 2004-2005 prices (Rs billion)
Period Livestock Milk Food-grains Rice Wheat
Share of milk in
agricultural value added
(%)
1979-1981 688 431 1 020 440 247 12.40
1989-1991 1 083 727 1 407 651 372 15.37
1999-2001 1 568 1 101 1 666 777 506 17.46
2009-2011 2 270 1 539 1 854 828 570 19.30
Source: National Accounts Statistics, Government of India (GoI).
The value of output of livestock has grown at a much faster rate of 4 percent compared to the crop sector which grew at 2.9 percent between 1980 to 2010-2011. The growth in the value of milk was 4.35 percent per annum during this period (Figure 1).
Figure 1. Growth trends of major subsectors of Indian agriculture, 1980-2011
Dairy enterprises are very important in improving the socio-economic status of the rural poor by reducing the longstanding problems of unemployment and underemployment. As the distribution of livestock is more equitable than that of land, growth in the livestock sector is deemed to be antipoverty and equity-oriented (Ahuja 2004). According to the National Sample Survey Office (NSSO) survey in 2009-2010, slightly more than 22 million persons were employed in the livestock sector, 88 percent being employed in dairying. Dairying seems to also promote gender and social equity: about 68 percent of the total workers engaged in the dairying subsector are women. The participation of women in other activities, including agriculture, is low compared to that in dairying. Further, most dairy workers belong to socially and economically disadvantaged communities. Scheduled tribes, scheduled castes and other marginalized classes together constitute about 70 percent of the persons employed in the dairy sector.
Eggs
5.1
0.0
1.0
2.0
3.0
4.0
5.0
6.0
Com
poun
d A
nnua
l Gro
wnt
h R
ate
(% p
er a
nnum
)
Milk Meat
4.3 4.2
Livestock
4.0
Fruits & vegetables
3.9
Crops
2.6
Fisheries
1.3
Cereals
1.9

55
BEGINNING OF A STRUCTURAL TRANSFORMATION IN THE INDIAN DAIRY SECTORDairying in general and its modernization in particular have been a high priority of the government ever since the first Five Year Plan of India in 1951. Initiatives for dairy development through producers’ cooperatives and milk production based on milk sheds in rural areas became the basis of the dairy development strategy. The strategy of dairy development through cooperatives got a further boost with the establishment of a National Dairy Development Board in 1965 and its subsequent efforts brought significant change in the Indian dairy industry. Indeed, the structural transformation of the Indian dairy sector started with the launching of ‘Operation Flood’ in 1970. Operation Flood (OF) ushered in the white revolution and was successful in bringing about a breakthrough in milk production and marketing across India. The programme was launched in three phases as discussed below.
Operation Flood Phase-I (1970-1981) was launched in Anand, Gujarat; it was funded by the World Food Programme (WFP), which provided 126 000 tonnes of skim milk powder and 42 000 tonnes of butter oil as aid. About Rs1.2 billion was generated from the sale proceeds of milk powder and butter oil and invested in the implementation of this programme. Nearly 13 300 dairy cooperative societies in 39 milk districts were formed, with about 1.8 million farmers registered as members, providing a peak of 3.4 million litres of milk per day and permitting the marketing of 2.8 million litres.
Operation Flood Phase-II (1981-1985) introduced a three-tier model of cooperative milk production, comprising milk societies, unions and federations. Operation Flood-II helped market milk to 148 cities and towns covering a population of 15 million people. This involved 136 rural milk districts comprising 3.6 million farmers within 34 500 cooperative societies. Milk procurement increased to 7.9 million litres per day and the amount of milk marketed went up to 5.0 million litres per day.
Operation Flood Phase-III (1985-1996) was funded by the World Bank with a credit loan and as food aid by the European Economic Community. By organizing 70 000 primary dairy cooperative societies, 170 milk districts of the country were covered. This phase focused on improving productivity by enhancing research and development in animal health and animal nutrition, along with improving the availability of key inputs, training, monitoring and evaluation and market promotion.
After 26 years of Operation Flood from 1970-1996, the Intensive Dairy Development Programme was launched to promote the dairy sector in underdeveloped, hilly and backward regions. In order to further accelerate the growth in milk production, a national perspective plan for dairy development was developed and launched to increase milk production to meet the upcoming consumer demand for milk. As a part of the 15-year national plan, milk production is expected to reach 180 million tonnes by 2021; the first phase of the plan is scheduled from April 2011 to March 2017. The plan focuses on increasing productivity through scientific breeding and feeding of animals. The aim is a 66 percent increase in milk production by 2021.

56
STRUCTURAL TRANSFORMATION IN MILCH POPULATIONTrends in livestock population India has one of the world’s largest combined populations of different livestock species. In 2007 it had 199 million cattle, 105 million buffalo, 141 million goats, 72 million sheep, 11 million pigs and 649 million poultry. In fact 57, 16 and 17 percent of the world’s buffalo, cattle and goat populations respectively are reared in India. Cattle have always dominated the livestock production system in India. However, the structure of the livestock population has been changing over time. In absolute terms the cattle population kept increasing until 1992, from 155 million in 1951 to 205 million in 1992 (Table 2). This trend was reversed during the 1990s and between 1992 and 2003 the cattle population declined to 185 million. However, this decline was attributed to the decline of indigenous stock, particularly of male cattle. The share of adult female cattle in the total cattle stock increased from 29 percent in 1961 to 37 percent in 2007. The declining trend of cattle population was reversed in 2003 and between 2003 and 2007, the population increased from 185 million to 199 million. The population of buffalo increased from 43.4 million in 1951 to 105 million in 2007. Buffalo are reared mainly for milk production and the share of adult female buffalo accounted for 48 to 52 percent of total buffalo numbers during different time periods. The share of buffalo in total bovine numbers increased from 22 percent in 1951 to about 35 percent in 2007.
Table 2. Livestock population in India (million heads)Year Cattle Adult
female cattle
Buffalo Adult female buffalo
Total cattle and
buffalo
Sheep Goat Pigs Poultry
1951 155 54 43 21 199 39 47 4 74
1961 176 51 51 24 227 40 61 5 114
1972 178 53 57 29 236 40 68 7 139
1982 192 59 70 33 262 49 95 10 208
1992 205 64 84 44 289 49 96 11 307
2003 185 65 98 51 283 62 124 14 489
2007 199 73 105 54 304 72 141 11 649
% annual growth
1951-61 1.2 -0.64 1.67 1.47 1.33 0.3 2.6 1.7 4.5
1961-72 0.1 0.42 1.04 1.49 0.35 -0.1 0.9 2.6 1.8
1972-82 0.7 1.04 1.97 1.29 1.08 2.0 3.5 3.9 4.1
1982-92 0.6 0.84 1.90 3.03 0.97 0.0 0.0 0.9 4.0
1992-03 -0.9 0.02 1.38 1.39 -0.19 2.3 2.7 2.0 4.8
2003-07 1.8 3.12 1.84 1.67 1.83 3.9 3.1 -4.7 7.3
Source: Livestock census (different years), Department of Animal Husbandry, Dairying and Fisheries, GoI.
Adoption of crossbreedsConcerted efforts were made to popularize crossbreeding programmes to meet the challenges of a rising demand for milk. The National Commission on Agriculture estimated

57
around 2 million crossbred cattle in the early 1970s in the country. This population grew at an annual growth rate of 4 percent during 1982 to 1992 and 6.5 percent during 1992 to 2003. The growth further accelerated between 2003 and 2007 and registered an impressive growth of 8 percent per annum. In percentage terms, the share of crossbred animals in the total cattle population increased from 4.6 percent in 1982 to 20 percent in 2007 (Table 3).This accelerated growth of crossbred bovines altered the composition of the cattle population.
STRUCTURAL TRANSFORMATION IN MILK PRODUCTIONStructure of milk production India: The role of marginal and smallholdersIndia’s dairy industry is largely traditional, local and informal. Milk production is dominated by smallholders. About 80 percent of raw milk comes from farms having only two to five cows/buffalo. Approximately 78 percent of milk producers are marginal and small farmers and they together contribute around 68 percent to total milk production, (Table 4). This trend holds true more or less across all the states.
Table 3. Trends in the adoption of crossbred cattleYear Population crossbred (million heads) % share of crossbred cottle in farm
Total Female Total Female
1982 8.8 4.8 4.6 5.3
1992 13.2 8.9 8.0 10.3
2003 24.7 19.7 16.0 22.9
2007 33.1 26.2 20.0 27.0
CAGR (%)
1982-92 6.3 5.4 5.7 6.9
1992-03 7.5 4.7 6.5 7.5
2003-07 7.3 7.6 5.7 4.2
1982-07 7.0 5.4 6.1 6.7
Source: Livestock Census.
In some states like Bihar, Himachal Pradesh, Jammu and Kashmir, Jharkhand, Orissa, Tamil Nadu, Uttarakhand and West Bengal, marginal and small farmers constitute about 90 percent or more of the total milk producing households. And they contribute more than 85 percent to the total milk production in these states. These small farmers traditionally do not have access to organized markets due to the lack of an effective system to procure milk produced in the rural areas. A series of efforts have been made to promote organized milk marketing in the country and several policy initiatives have been taken to develop formal milk marketing and processing institutions in the country.

58
Trends in milk productionThe Indian dairy industry has undergone significant changes and milk production has witnessed a quantum jump over time. The real push in milk production came in the 1970s, when milk production grew at the rate of 4.4 percent per annum as a result of the launch of Operation Flood. The growth accelerated further during the 1980s, when it reached 4.9 percent. Milk production in India grew at an annual growth rate of 4 percent during the 1990s and at 4.4 percent between 2001 and 2011. This high growth in milk production ushered the country into an era of self-sufficiency towards the late-1990s. The dependence on milk imports was reduced considerably. With sustained increase in milk production, India became a net exporter of dairy products although the level of Indian dairy exports is still quite small.
Table 4. Contribution of marginal farmers and smallholders in milk productionStates Share of marginal farmers and smallholders (%)
Milk production Milk-producing households
Andhra Pradesh 63.2 68.6
Assam 84.7 85.2
Bihar 84.3 89.8
Chhattisgarh 52.9 65.0
Gujarat 69.7 75.2
Haryana 68.0 73.7
Himachal Pradesh 89.9 91.1
Jammu and Kashmir 88.9 90.0
Jharkhand 67.4 89.4
Karnataka 64.4 62.7
Kerala 83.5 92.5
Maharashtra 51.8 59.5
Madhya Pradesh 51.2 57.9
Orissa 88.7 89.2
Punjab 51.0 73.4
Rajasthan 46.5 60.3
Tamil Nadu 75.9 81.3
Uttar Pradesh 77.2 86.2
Uttarakhand 95.1 95.8
West Bengal 92.9 95.5
North-Eastern Regions 92.8 96.1
Union Territories 82.2 90.7
All India 68.8 77.4
Source: Kumar and Joshi (2012).

59
Table 5. Growth in milk production and milk availability in India (percent per annum)
Period Milk production Milk availability
1950-1960 1.5 -0.3
1960-1973 1.1 -1.0
1973-1981 4.4 2.4
1981-1991 4.9 2.7
1991-2001 4.3 2.3
2001-2011 4.4 2.9
Source: BAHS (2012).
Sources of milk productionMain sources of milk in India are cows and buffalo. These account for about 97 percent of total milk production. The rest is provided by goats. The milk production from crossbred milch cows grew at an impressive annual rate of about 8 percent during 1999-2000 to 2009-2010. Buffalo milk production also registered a growth of 4 percent per annum. Because of the differential growth rate in milk production from different species and breeds, changes in the contribution of different species/breeds was observed. The changing structure of milk production clearly indicated the growing contribution of crossbreed cattle from 13 percent in 1992-1993 to 23 percent in 2009-2010. The overall share of cattle slightly increased and that of buffalo slightly declined. Among cattle the share of crossbreeds in milk production has been increasing consistently, and during the last two decades its share in cattle milk production increased from 31 percent in 1992-1993 to 53 percent in 2009-2010.
Milk productivityIndian milch cows produce low amounts of milk. The productivity of cattle in terms of milk yield is about half of the global average. The milk yield of crossbred cattle, buffalo and nondescript cattle at the national level was 6.9 kg/day, 4.6 kg/day and 2.1 kg/day respectively. The productivity of milk animals in 2009-2010 (cattle and buffalo) was highest in Punjab (8.9 kg/day), followed by Kerala (7.6 kg/day) and Haryana (6.5 kg/day) and lowest in Assam (1.3 kg/day) (Table 6). However, productivity has increased over time as shown in Table 6.

60
*includes crossbreeds.Source: Computed from BAHS (various issues).
Contribution of population and productivity to milk growthAnother dimension of looking at sources of growth is to assess the contribution of population and productivity to incremental milk production. Between 1992 and 2010, 56 percent of the incremental production was contributed by increase in milk productivity and 43 percent by the population of milch animals. The remaining 1 percent was contributed by the effect of interaction between the increase in population and in productivity of milch animals. During the period 1992-2009, crossbred cows accounted for 34 percent of the additional milk production and 14 percent of this came from improvement in their milk productivity (Figures 2 and 3). On the other hand, indigenous cows contributed 11 percent to the increase in milk production and about 80 percent of this came from enhanced milk productivity. Buffalo accounted for 55 percent of the increased milk production and improvement in yield contributed to 41 percent of this increase. These results indicate that the growth in milk production has come largely from replacement of low-yielding indigenous cows with crossbred cattle and buffalo.
Table 6. Productivity of animals in-milk across states States Milk yield (kg/day) Growth rate (% per annum)
1992-93 2009-10 1992-93 to 1999-00
2000-01 to 2009-10
1992-93 to 2009-10
Andhra Pradesh 1.87 3.80 5.70 3.03 4.13
Assam 1.16 1.27 0.18 0.56 0.25
Bihar 2.58 3.42 1.27 0.52 1.27
Gujarat 3.47 4.63 1.20 2.67 1.63
Haryana 5.06 6.54 1.72 1.37 1.34
Himachal Pradesh 2.39 2.99 1.43 0.46 1.08
Jammu & Kashmir 2.81 4.51 3.05 3.07 3.01
Karnataka 2.11 3.22 4.76 0.33 2.31
Kerala 3.89 7.59 5.82 3.01 4.06
Madhya Pradesh 1.70 2.69 4.11 1.49 1.62
Maharashtra 2.50 3.62 1.89 1.87 2.74
Orissa 0.73 2.06 5.62 7.55 6.64
Punjab 5.83 8.88 1.77 3.26 2.16
Rajasthan 3.34 4.99 0.92 4.14 2.20
Tamil Nadu 3.07 5.13 3.33 3.49 3.21
Uttar Pradesh 3.00 3.93 2.10 1.06 1.76
West Bengal 2.24 2.76 3.57 0.72 1.67
All India 2.71 3.94 2.83 1.93 2.10
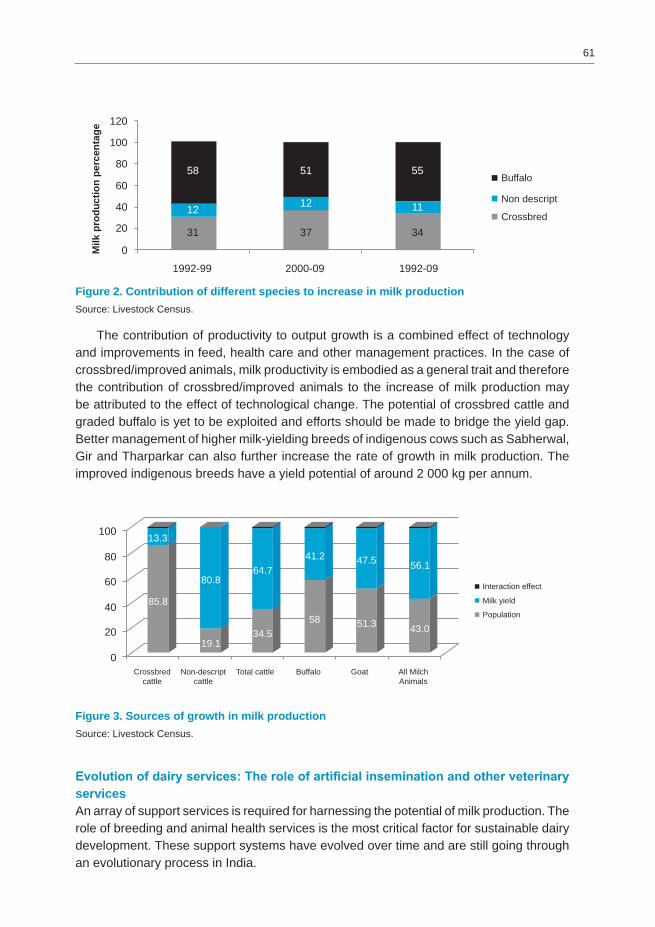
61
Figure 2. Contribution of different species to increase in milk productionSource: Livestock Census.
The contribution of productivity to output growth is a combined effect of technology and improvements in feed, health care and other management practices. In the case of crossbred/improved animals, milk productivity is embodied as a general trait and therefore the contribution of crossbred/improved animals to the increase of milk production may be attributed to the effect of technological change. The potential of crossbred cattle and graded buffalo is yet to be exploited and efforts should be made to bridge the yield gap. Better management of higher milk-yielding breeds of indigenous cows such as Sabherwal, Gir and Tharparkar can also further increase the rate of growth in milk production. The improved indigenous breeds have a yield potential of around 2 000 kg per annum.
Figure 3. Sources of growth in milk productionSource: Livestock Census.
Evolution of dairy services: The role of artificial insemination and other veterinary servicesAn array of support services is required for harnessing the potential of milk production. The role of breeding and animal health services is the most critical factor for sustainable dairy development. These support systems have evolved over time and are still going through an evolutionary process in India.
Milk
pro
duct
ion
perc
enta
ge
1992-99 2000-09 1992-09
Buffalo
Non descript
Crossbred
0
20
40
60
80
100
120
58
12
31
51
12
37
55
11
34
0
20
40
60
80
100
Crossbredcattle
Non-descriptcattle
Total cattle Buffalo Goat
Interaction effect
Milk yield
Population
All MilchAnimals
13.3
85.8
80.8
19.1
64.7
34.5
41.2
58
47.5
51.3
56.1
43.0

62
Artificial insemination (AI)The introduction of exotic breeds and crossing them with local breeds has been considered as one of the most important elements of the breed improvement strategy in India. Efforts for providing breeding services started during the pre-independence period. But more systematic efforts were made after 1970. The number of AI centres increased from about 4 000 during the 1970s to nearly 7 000 in 2010. The increase in the AI centres led to the substantial increase in the delivery of AI services. The number of AIs performed increased tremendously from 16 million in 1991-1992 to 44.6 million in 2009-2010. The institutional framework for delivery of AI services has been dominated by animal husbandry departments. In 1997 out of 48 243 AI centres, 45 666 centres (accounting for about 96 percent of the total AI centres) were controlled by government departments. However, in recent years a significant increase in the AI centres run by other organizations such as cooperatives, NGOs and the private sector has taken place. In 2010 there were about 18 000 AI centres functioning under the control of cooperatives or NGOs. The dominance of government departments in running AI centres has been diminishing over time. All the agencies in the country carried out about 44.6 million inseminations in 2009-2010 (GoI 2010). Considering an average number of 2.5 services per conception, the AI services cover only about 22 percent of the milch dairy animal population (127 million). About 90 percent of the inseminations are reported to be done in cows and only about 10 percent in buffalo (Bansil and Malhotra 2006). This implies that about 9 percent of the milch buffalo (47 million) and 22 percent of the total cows (80 million) are inseminated each year, indicating a low coverage of breeding services. Besides the low coverage, the quality of service provided is also poor. The success of inseminations in terms of conception rate and cost per calf born is still not encouraging. The conception rates in most of the states, by and large, range from 40-49 percent in field conditions. The problems of inadequate quantity and poor quality of semen doses and poorly trained inseminators have been widely reported as serious constraints for success and spread of artificial inseminations (Singh et al. 2006; Singh and Chauhan 2006). The high incidence of reproductive disorders in animals also poses technological constraints to the adoption and efficiency of AI services. Singh et al. (1998) found that the problems of repeat breeding, anoestrus condition and the incidence of reproductive disorders were all common among nearly one-fourth to one-third of the sample farmers adopting crossbreeding in Punjab, Karnataka and West Bengal. Concerned over the poor status of breeding services in the country, the government initiated the National Project for Cattle and Buffalo Breeding (NPCBB) in October 2000 to strengthen the coverage and efficacy of breeding services. Unfortunately, the NPCBB has suffered from a number of problems such as lack of quality bulls for semen production, inability to provide uninterrupted supply of liquid nitrogen, etc. Another weakness of the breeding policies and strategies in India is reflected in the neglect of buffalo in breed development programmes. However, there is anecdotal evidence that dairy farmers are themselves selecting good buffalo breeds. But as with indigenous cattle, current breeding policy and research has given little support to such farmers to exploit the genetic potential of local breeds.

63
Veterinary servicesThere has been substantial growth in veterinary services. Between 1972 and 2010, the number of veterinary institutions and veterinarians increased by six times (Table 7). But veterinary facilities in the country are still poor. One veterinary centre caters to the need of more than 6 000 animals. Furthermore, the veterinary centres are not equipped with an adequate number of trained veterinary professionals.
Table 7. Trends in veterinary servicesCattle equivalent units
Year No. of veterinary institutions
No. of veterinarians Cattle equivalent
unitsPer institution Per veterinarian
1972 9 495 10 800 26 174 23 012
1982 33 323 18 000 8 394 15 540
1992 40 586 33 600 7 632 9 219
1997 50 846 37 200 6 129 8 377
2003 51 973 38 100 5 926 8 084
2010 54 906 57 509 - -
Source: BAHS (various issues).
Feed and fodder market in India The adequate provision of feed and fodder is necessary for harnessing the potential of the dairy sector in India. India has remained in chronic deficit of feed and milch animals have been traditionally underfed. The estimates of demand and supply of different feedstuffs by Birthal et al. (2006) showed a significant reduction in the deficit of dry fodder to only 10 percent. Deficits in green fodder and concentrates, however, were reported to be 32 and 40 percent respectively.
STRUCTURAL CHANGES IN MILK MARKETING AND PROCESSINGEvolution of the milk marketing system in IndiaNearly one-third of the milk produced is retained on the farm for consumption and the remaining two-thirds enters the market. Milk marketing historically has been an unorganized activity in India. The present structure of milk marketing in India is an outcome of demographics, tradition, religion, infrastructure development, constraints and limitations (Figure 4). A primary characteristic of milk marketing and distribution in India is the dominance of the informal sector. The cooperative movement which originated in a small town called Anand in the state of Gujarat became popular as the ‘Anand Pattern’ of dairy development. Subsequently, dairy development through producers’ cooperatives and milk production based on milk districts in rural areas, modelled on the successful experience of dairy cooperatives in Gujarat, became the cornerstone of the dairy development policy. This policy initiative helped to turn Indian milk marketing around. The strategy for organized milk marketing got a further boost with the establishment of the National Dairy Development

64
Board (NDDB) in 1965 and the launching of the Operation Flood programme in 1970. Another boost for milk marketing came in the early 1990s when the government introduced major economic reforms that favoured increasing privatization and liberalization of the economy. The Indian dairy industry too was opened for private/foreign investments and this facilitated the entry of organized private dairies in the Indian milk market. Thus, several marketing chains have evolved operated by the government, cooperative and private/multinationals termed as the organized dairy sector. But the traditional or unorganized informal sector still predominates.
Role of the organized sector in milk marketingOperation Flood revolutionized liquid milk marketing in India, primarily led by the cooperative sector. The operation helped India not only to become the largest producer of milk but also and most importantly to link the smallest milk producer with the markets. While the bulk of milk production takes place in rural areas and the consumption centres are concentrated in urban areas, the challenge lies in linking the two. The cooperative network has expanded over time and many private players have also entered the Indian dairy sector. Over time, dairy policies have facilitated a structural change and created opportunities for the private sector.
CooperativesDairy cooperatives are the most important component of organized milk markets. The network of dairy cooperatives has expanded considerably since the launch of Operation Flood in 1970. An 11-fold increase in the number of dairy cooperative societies and an eight-fold increase in their membership have been recorded during the past three decades. In 2010, cooperatives had about 14 million farmer members, including about 4 million women, spread over 140 227 village cooperative societies in about 350 districts. During this period, annual milk procurement by cooperatives increased more than ten times, from 935 000 tonnes to 9 441 000 tonnes. Milk procurement by cooperatives accounted for about 3 percent of total production in 1980-1981. In 2010, milk procurement by cooperatives accounted for 8.4 percent of the milk production, and about 15 percent of the marketed milk surplus. The cooperatives handle about 50 percent of the total milk marketed and processed by formal or modern milk marketing chains. However, despite horizontal expansion and the impressive performance of dairy cooperative societies (DCS), no significant changes have occurred in the average size and scale of village-level dairy cooperative. Between 1980 and 2010, the number of members/DCS varied between 100 and 132, and milk procurement between 56 and 70 tonnes/DCS/year. Similarly, milk procurement/member reached 670 kg/year. Lopsided growth of cooperatives is another concern.
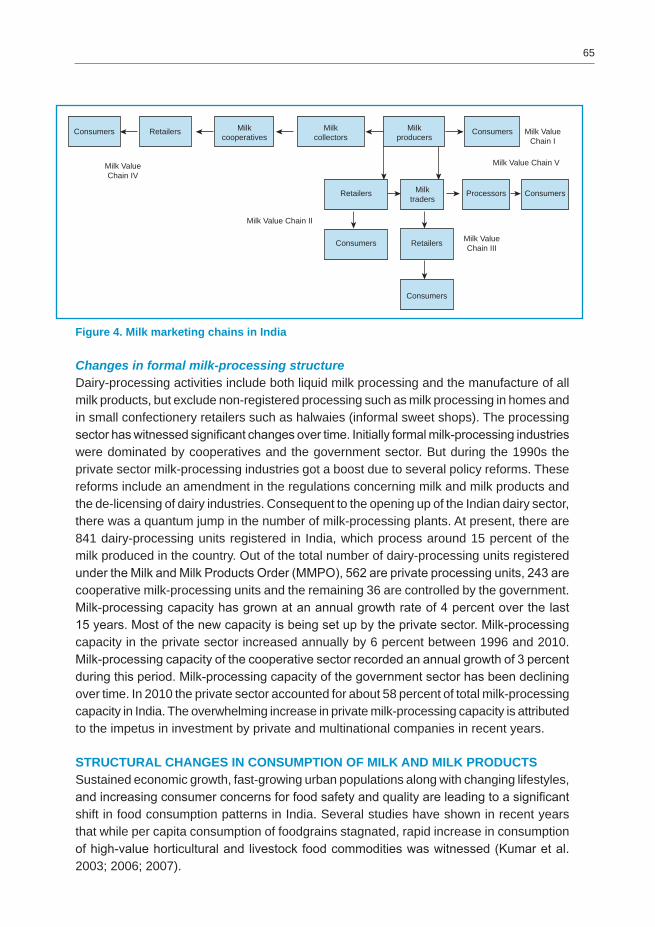
65
Figure 4. Milk marketing chains in India
Changes in formal milk-processing structureDairy-processing activities include both liquid milk processing and the manufacture of all milk products, but exclude non-registered processing such as milk processing in homes and in small confectionery retailers such as halwaies (informal sweet shops). The processing sector has witnessed significant changes over time. Initially formal milk-processing industries were dominated by cooperatives and the government sector. But during the 1990s the private sector milk-processing industries got a boost due to several policy reforms. These reforms include an amendment in the regulations concerning milk and milk products and the de-licensing of dairy industries. Consequent to the opening up of the Indian dairy sector, there was a quantum jump in the number of milk-processing plants. At present, there are 841 dairy-processing units registered in India, which process around 15 percent of the milk produced in the country. Out of the total number of dairy-processing units registered under the Milk and Milk Products Order (MMPO), 562 are private processing units, 243 are cooperative milk-processing units and the remaining 36 are controlled by the government. Milk-processing capacity has grown at an annual growth rate of 4 percent over the last 15 years. Most of the new capacity is being set up by the private sector. Milk-processing capacity in the private sector increased annually by 6 percent between 1996 and 2010. Milk-processing capacity of the cooperative sector recorded an annual growth of 3 percent during this period. Milk-processing capacity of the government sector has been declining over time. In 2010 the private sector accounted for about 58 percent of total milk-processing capacity in India. The overwhelming increase in private milk-processing capacity is attributed to the impetus in investment by private and multinational companies in recent years.
STRUCTURAL CHANGES IN CONSUMPTION OF MILK AND MILK PRODUCTSSustained economic growth, fast-growing urban populations along with changing lifestyles, and increasing consumer concerns for food safety and quality are leading to a significant shift in food consumption patterns in India. Several studies have shown in recent years that while per capita consumption of foodgrains stagnated, rapid increase in consumption of high-value horticultural and livestock food commodities was witnessed (Kumar et al. 2003; 2006; 2007).
Consumers Retailers
Milk ValueChain IV
Milk Value Chain V
Milk Value Chain I
Milk Value Chain III
Milk Value Chain II
Milkcooperatives
Milkcollectors
Retailers
Consumers Retailers
Consumers
Milktraders
Processors Consumers
Milkproducers
Consumers

66
Trends in consumption of milk and milk productsThere has been a considerable shift in the food consumption pattern in India, and the share of high-value commodities has been consistently increasing in the food budget of Indian households. The share of milk and milk products accounted for about 17 percent of the household food expenditure in 2009-2010 up from 8 percent in 1983. The increasing share of milk and milk products in household food expenditure is reflected in the increase of per capita consumption of dairy products. The per capita consumption of milk increased from 43 kg in 1983 to 64 kg in 2009-2010 (Table 8).
Table 8. Per capita consumption and expenditure on milk and milk products in India
Consumption (kg/annum) Expenditure (Rs/annum at constant prices 1993-94)
Years Rural Urban All Rural Urban All
1983 38.7 55.6 44.7 238.5 434.0 282.6
1993-1994 50.3 66.4 54.3 325.0 546.0 379.8
2004-2005 50.2 69.3 55.0 311.0 547.5 370.9
2009-2010 58.8 71.6 63.8 380.9 900.6 453.4
Source: NSSO (various rounds).
The per capita consumption of milk has remained higher in urban areas. The average annual per capita milk consumption of rural households in 1983 was 39 kg, which increased to 58.8 kg in 2009-2010. During the same period the annual per capita consumption of dairy products of urban households increased from 55.6 kg to 71.6 kg. It was noted that in 2009-2010, the per capita consumption of dairy products in urban households was about 20 percent higher than their rural counterparts. This implies that urbanization would continue to be an important source of growth in the demand for dairy products, but sustained growth in rural per capita income would also be critical to accelerate growth in the demand for dairy products.
Diversity in the consumption of milk and milk productsFurther details of milk and milk products consumption are given in Table 9. Milk and milk products include liquid milk, curd, ghee, butter, ice-cream, condensed milk/powder, baby food and other milk products. The consumption of dairy products is dominated by liquid milk both in rural- and urban-consuming households. The changing pattern of milk consumption is reflected in the disaggregated changes in the consumption of milk products. Although the consumption level of ice-cream is not significant, the change in its consumption between 1993-1994 and 2009-2010 is truly significant. The expenditure on its consumption registered an enormous increase of 350 percent. Growing health concerns seem to have reduced or levelled the per capita consumption expenditure on butter and ghee. The increase in expenditure on consumption of milk and milk products depicts a distinct variation in rural and urban areas. It was observed that the expenditure on ice-cream increased by 150 percent in rural areas and 542 percent in urban areas. In fact, in urban areas, the consumption of all milk products increased faster than that in rural areas during this period.

67
Table 9. Per capita expenditure of milk and milk products in India at 1993-1994 prices(Rupees)
Rural Urban All
1993-94 2009-10
Change over
1993-94 (%)
1993-94 2009-10
Change over
1993-94 (%)
1993-94 2009-10
Change over
1993-94 (%)
Liquid milk 302.8 360.1 18.9 475.6 785.0 65.1 345.6 415.7 65.1
Curd 1.9 1.9 0.0 5.8 9.6 65.5 2.9 3.3 65.5
Ghee 15.8 13.6 -13.9 49.0 76.2 55.5 24.0 24.8 55.5
Butter 0.5 0.2 -60.0 4.0 3.7 -7.5 1.3 0.8 -7.5
Ice-cream 0.2 0.5 150.0 1.2 7.7 541.7 0.4 1.8 541.7
Condensed milk/powder 2.1 2.4 14.3 6.3 5.8 -7.9 3.1 2.9 -7.9
Baby food 0.9 1.3 44.4 2.9 6.9 137.9 1.4 2.3 137.9
Source: NSSO (various rounds).
Demand projections for milk in IndiaThe total demand for milk can be divided into two categories. First, milk consumed by the household at home in various forms, also referred to as ‘direct demand’; second, milk is used in industrial processing, and includes the quantity that goes to waste. This is referred as ‘indirect demand’. Various projections have been made on future demand for milk in India. Kumar, Rai & Chaudhary (2011) estimated the demand for milk to be about 209 million tonnes by the end of 2026-2027 (Table 10)
Table 10. Demand projections for milk in India (million tonnes)Year Household demand Indirect demand Total demand
2011-12 68.8 47.5 116.3
2016-17 81.7 56.4 138.1
2021-22 99.4 68.7 168.1
2026-27 123.6 85.4 209.0
Source: Kumar et al. (2011).
An important question now is whether the expected milk supply would be able to meet the domestic demand in India. To meet the projected domestic demand, India needs to maintain an annual growth rate of 3.7 percent in milk production. The supply projections under different scenarios indicate that with the existing growth rate of milk production during the previous decade, India would continue to remain self-sufficient in milk even in 2026-2027 (Table 11). However, any deceleration in milk production growth would jeopardize the self-sufficiency status of milk production in the country. However, if concentrated efforts are made to accelerate the growth of milk production, India can turn out to be an important exporter of milk and milk products.

68
Table 11. Prospects of future milk production in India (million tonnes)
Year Existing growth rateCompound annual growth rates
3% 4% 5%
2011-12 120.6 119.7 120.8 122.0
2016-17 145.4 138.7 147.0 155.7
2021-22 175.3 160.8 178.9 198.7
2026-27 211.4 186.5 217.6 253.7
Source: Authors’ estimates.
COMPETITIVENESS OF MILK PRODUCTIONIndia has a competitive advantage in the production of milk. Producer prices of milk are lower in India than in the leading exporting countries (Table 12). The price advantage of India vis-à-vis other leading countries enhances its prospects of export of milk to countries belonging to the South Asian Association for Regional Cooperation (SAARC), most of which are deficient in meeting their domestic requirements. A comparison of producer prices does not reveal the real strength of export competitiveness, therefore Nominal Protection Coefficients (NPCs) were also computed and are given in Table 12.
Table 12. Producer prices of milk in India vis-à-vis major exporters of the world (US$/tonnes)
Country Triennium Ending (TE) 1993 Triennium Ending 2002 Triennium Ending 2009
India 227 240 303
France 358 297 455
Germany 383 299 426
Australia 210 156 334
Denmark 415 312 469
United States 283 290 372
New Zealand 139 171 331
Source: Base data from FAOSTAT.
The indicators for export competitiveness for dairy products suggest that the Indian dairy industry has been protected from distorted world prices. The value of NPCs hovered around 1.02 to 1.25 for SMP and 1.15 to 1.27 for WMP (Table 13). The NPCs for SMP and WMP were 0.72 and 0.83, respectively, in 2007 due to a high spurt in the international prices of these commodities. The price increase for these commodities in 2007 was relatively lower compared to the world market. India can emerge as significant exporter by subsidizing its own exports to compete with other exporters, or by negotiating a substantial reduction in subsidies by the major exporters of WMP and SMP in the World Trade Organization (WTO) (Rakotoarisoa and Gulati 2006). But the possibility of export of butter does not exist. The

69
NPC for butter was 1.98 in TE 1993 and reached 2.59 in TE 2002; it then witnessed a declining trend down to 1.77 in TE 2007. This implies that butter prices have been possibly more protected than those of SMP and WMP or that the world market prices for butter have been heavily subsidized.
Table 13. Nominal protection coefficients of dairy productsPeriod/Item Exportable hypotheses Importable hypotheses
Butter WMP SMP Butter WMP SMP
TE 1996 1.87 1.16 1.06 1.79 1.13 1.04
TE 1999 2.15 1.27 1.25 2.02 1.21 1.18
TE 2002 2.59 1.16 1.02 2.37 1.11 0.98
TE 2005 2.14 1.26 1.14 2.03 1.23 1.11
TE 2007 1.77 1.15 1.02 1.72 1.14 1.01
SMP = skimmed milk powder; WMP = whole milk powder.Source: Kumar, Rai & Chaudhary (2011).
Dairy trade policyExports of milk and milk products were earlier totally prohibited, but later on exports of milk, baby milk and sterilized milk were permissible, subject to licensing requirements. The export of powdered milk, prohibited earlier, was channelled through the NDDB, Anand, and has been subsequently liberalized. Restrictions on butter exports have been similar to those for powdered milk and quota restrictions were removed after March 2002. The export of ghee was subjected to quantitative restrictions in the 1980s, followed by channelling through the NDDB and, finally, liberalized. Presently, no minimum export price restriction exists for the export of dairy products. Sometimes India issues ad-hoc prohibitions on exports of sensitive products. For example, recently export prohibitions have been issued for export of milk powders when exports were banned in February 2007, but were lifted in October 2007. Sanitary and phytosanitary (SPS) standards are governed and enforced through a number of laws and agencies in India. The Prevention of the Food Adulteration Act 1954 is the main law on food safety and food quality, and it also takes into account livestock commodities. Imports and quarantines are regulated through other additional legislations as well. The multiplicity of laws and regulations leads to overlapping responsibilities and lack of coordination among implementation agencies. In order to streamline SPS procedures and their enforcement, the Food Safety and Standards Act was passed in August 2006 and the Food Safety and Standards Authority of India was established in 2011. Tariffs on most milk products were brought down considerably, consequent to domestic reforms and WTO agreements (Table 14). The import tariff was 55 percent for dairy products. It has been gradually reduced and brought down to 30 percent for all dairy products. However, the surge in the import of milk products, especially SMP in subsequent years, forced the government to renegotiate the fixed Tariff Rate Quota for SMP and WMP within the WTO during 2000/2001.
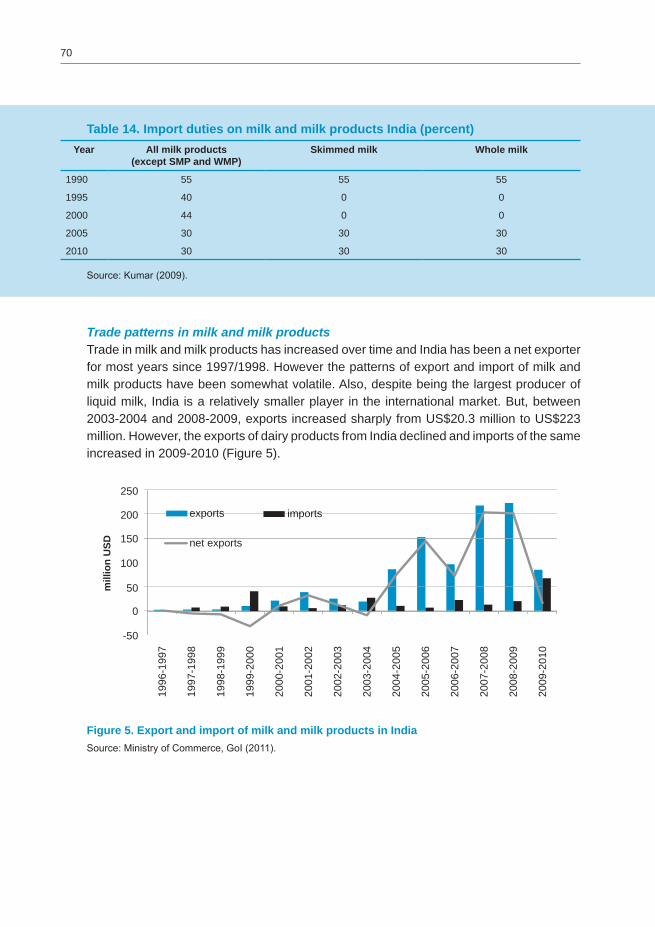
70
Table 14. Import duties on milk and milk products India (percent)Year All milk products
(except SMP and WMP)Skimmed milk Whole milk
1990 55 55 55
1995 40 0 0
2000 44 0 0
2005 30 30 30
2010 30 30 30
Source: Kumar (2009).
Trade patterns in milk and milk products Trade in milk and milk products has increased over time and India has been a net exporter for most years since 1997/1998. However the patterns of export and import of milk and milk products have been somewhat volatile. Also, despite being the largest producer of liquid milk, India is a relatively smaller player in the international market. But, between 2003-2004 and 2008-2009, exports increased sharply from US$20.3 million to US$223 million. However, the exports of dairy products from India declined and imports of the same increased in 2009-2010 (Figure 5).
Figure 5. Export and import of milk and milk products in IndiaSource: Ministry of Commerce, GoI (2011).
exports
net exports
imports
1996
-199
7
1997
-199
8
1998
-199
9
1999
-200
0
2000
-200
1
2001
-200
2
2002
-200
3
2003
-200
4
2004
-200
5
2005
-200
6
2006
-200
7
2007
-200
8
2008
-200
9
2009
-201
0
exports imports
mill
ion
USD
0
50
100
150
200
250
-50

71
The key products traded (both exported and imported) are milk and cream (concentrated and containing sugar and sweetening matter), butter, other fats and oil derived from milk and dairy spreads. While the two product groups together account for more than 80 to 97 per cent of the milk products traded (except for a few years of import), the trends are somewhat mixed. Emerging market demand for cheese in India is reflected in the growing imports of cheese and curd (as one product group but largely cheese). Imports of cheese and curd increased from US$0.18 million in 1997-1998 to US$5.3 million in 2009-2010. The share of cheese and curd in total imports of dairy products increased from 2.2 percent to 7.7 per cent during the above period and touched a peak of 36 percent in 2005-2006. Also, in less than a decade, cheese and curd in import of dairy products increased from 2.5 percent to nearly 21 per cent (Figure 6). During this period, export of cheese increased from less than 2 percent to almost 6 percent.
Figure 6. Percent share of products in total import of milk and milk productsSource: GoI (2011).
Key trade destinations of Indian milk and milk products The Asia and ASEAN region (including Australia and New Zealand) is the key destination for export and imports of milk and milk products. It accounted for nearly 50 percent of the imports by India and 93 percent of the exports from India in TE 2009-2010. Imports from the Asia and ASEAN region increased between 2007-2008 and 2009-2010 from 28.3 percent to 69.1 percent; those from the European Union (EU-27) declined from 54.3 percent to 21.5 percent during this period. Among Asian countries, Bangladesh, United Arab Emirates (UAE) and Singapore are the top export destinations for India. Of the most exported dairy products, Bangladesh accounted for nearly 21 percent of milk and cream (concentrated or containing sugar or added sweetener) during TE 2009-2010. UAE accounted for nearly 28 percent of butter, other fats and oils exported from India during TE 2009-2010. Trade between the countries in the region is of interest for the provision of dairy supplies to some of the milk-deficit countries from those that have a surplus.
Butter &other fats &oils, 62.0
Cheese &curd, 2.5
TE 1999-2000 TE 2009-10milk &
cream notconc nor
added sugar,etc, 0.2 Cheese &
curd, 20.8
milk & creamconc &
added sugar,etc, 16.4
Butter milk,yogurt, etc,
2.2
Whey &other
products,18.6
Butter &other fats &oils, 41.1
milk &cream conc
& addedsugar, etc,
34.5
Butter milkyogurt, etc,
0.2
milk & creamnot conc noradded sugar,
etc, 1.0
Whey &other
products,0.6
72
CONCLUSIONSIndia’s production of milk has strongly increased over time with significant technical, policy and institutional support. This led to significant changes in the Indian dairy sector. In fact, the Indian dairy sector has undergone significant structural changes over time and some interesting patterns are unfolding along the milk value chain. Noteworthy among them are the changes in production of milk, composition of the livestock population (increase in the crossbred population), marketing of liquid milk pioneered by cooperative networks and increase in participation of private players in the milk-processing sector. Despite breakthroughs in milk production, increase in crossbreeds and high-yielding livestock species, productivity of milch animals is quite low in India. This low productivity could be the result of many factors which include: poor genetic make-up of animals, shortage of feed and fodder, inadequate animal health care coverage, inappropriate dairy development policies, lack of market integration between producers and consumers, and lack of appropriate environment. With increase in income and urbanization, the demand for milk will increase further. The domestic demand of milk could be 209 million tonnes in 2026-2027, up from 127.3 million tonnes in 2011-2012. Supply projections indicate that with the existing growth rate of milk production during the last decade, India will be self-sufficient in milk by 2026-2027. However, any deceleration will jeopardize the self-sufficiency status of milk production in the country. If concentrated efforts are made to accelerate the growth of milk production, India can turn out to be an important exporter of milk and milk products. India has competitive advantage in the production of milk. Producer prices of milk are lower in India than in the leading international exporting countries. Prospects for export of milk to neighbouring, particularly SAARC, countries, most of which are deficient in meeting their requirements with domestic production, are very promising. Achieving higher growth of the dairy sector is essential to ensure long-term inclusive agricultural growth. Productivity-led growth is the only viable option for accelerated sustainable growth of the Indian dairy sector. The status of supporting infrastructures and their delivery is still inadequate and concerted efforts are required to bring desired improvement. The strengthening of market linkages, either through expansion of cooperatives or by facilitating contract farming arrangements, would go a long way to ensuring sustainable growth of the Indian dairy sector. India can emerge as an important exporter of milk and milk products. For SAARC countries, inclusion of milk in the South Asian Free Trade Area may increase trade among South Asian countries. Attendant non-tariff measure would be pre-requisite for tapping the markets in developed countries.
REFERENCES Ahuja, V., editor. 2004. Livestock and livelihoods: challenges and opportunities for Asia
in the emerging market environment. National Dairy Development Board of India and Food and Agriculture Organization of the United Nations. 372 p.
Bansil, P.C. & Malhotra, S.P. 2006. Livestock economy of India. New Delhi, CBS Publication.
(BAHS) Basic Animal Husbandry Statistics. 2012. Department of Animal Husbandry, Dairying and Fisheries. Ministry of Agriculture, GoI.

73
Birthal, P.S., Taneja, V.K. & Thorpe, W. 2006. Smallholder livestock production in India: opportunities and challenges. Proceedings of an ICAR-ILRI international workshop. No 14. National Centre for Agricultural Economics and Policy Research. Nairobi, International Livestock Research Institute.
GoI (Government of India). 2005. Access to Modern Technology for Farming: Situation Assessment Survey of Farmers. NSS Report No. 499, National Sample Survey Organisation, Government of India.
GoI. 2010. National accounts statistics. Central Statistical Organization. New Delhi, Government of India.
GoI. 2011. Trade data (website). Ministry of Commerce. Government of India. Access date, 3rd December 2010. New Delhi.
Kumar, A. and Joshi, P.K. 2012. Structural transformation in Indian dairy sector. Report submitted to IFPRI. New Delhi, National Centre for Agricultural Economics and Policy Research.
Kumar Anjani. 2009. India’s Livestock Sector Trade: Opportunities and Challenges, NCAP Policy Paper 24. National Centre for Agricultural Economics and Policy Research, New Delhi .
Kumar, Anjani, Rai , D.C., & Choudhary, K.L. 2011. Prospects and Opportunities for Exports of Dairy products from India. Indian Journal of Animal Sciences 81(2):188-193.
Kumar, Anjani, P K Joshi, & Praduman Kumar. 2012. Will India Remain Self-Sufficient in Milk Production? Paper submitted to Agricultural Research.
Kumar Praduman, Mruthyunjaya & Birthal, P.S. 2003. Changing consumption pattern in South Asia. Paper presented in the International Workshop on Agricultural Diversification and Vertical Integration in South Asia, organized by FICCI, ICRISAT & IFPRI in New Delhi, India.
Kumar, A., Staal, S.J., Singh, N.P. & Singh, D.K. 2007.Livestock sector trade of India: surging momentum in the new liberalised regime. Subject II. Trading in livestock and livestock products. Indian Journal of Agricultural Economics, 62(3): 395-410.
Rakotoarisoa, M. & Gulati. A. 2006. Competitiveness and trade potential of India’s dairy industry. Food Policy, 31(3): 216-227.
Singh, M. & Chauhan, A. 2006. Constraints faced by dairy owners in adoption of scientific dairy farming practices. Indian Journal of Dairy Science, 59(1): 49-51.
Singh, C.B., Agarwal, S.B., Chandra, N., Jha, S.K. & Dey, R.A. 1998. Crossbreeding technology adoption and constraints identification in different regions of India. Karnal, India, Dairy Economics, Statistics and Management Division, National Dairy Research Institute. Mimeo
Singh, N., Singh, K.B., Verma, H.K. & Singh, J. 2006. Adoption pattern of artificial insemination in Punjab. Indian Journal of Animal Reproduction, 27(1): 23-26.

74
Hog farming in transition: The case of ChinaKevin Chen and Jimin Wang*
Pork is a food of great economic, cultural and political significance in China. Indeed, the term food security in China’s context can be more simply described as ‘rice security’ + ‘pork security’. Traditionally, rice and pork have been considered economic and political stabilizers for the country and hence ensuring sufficient pork supplies at cheap prices remains a top national concern. China is the world’s largest hog producer and pork consumer, accounting for almost half of global pork consumption and production. As can be seen in Figure 1, production has grown consistently since the implementation of the household responsibility system in 1978, but recent years have seen fluctuating herd levels and slowing hog production growth, raising concerns about a sharp increase in pork prices. Although some of the recent price surges may be attributable to cyclical price and weather variations, some observers believe that high pork prices are a manifestation of long term underlying structural factors and increasing resource scarcity − particularly that of land and water. The Chinese hog industry is at an important turning point and faces new challenges. In order to contextualize these developments, this paper reviews historical trends in China’s hog and pork production including the factors that contributed to its remarkable growth during the last few decades and raises some questions about and options for facilitating its future development.
Figure 1. Increasing hog and pork production in ChinaSource: National Bureau of Statistics of China (various years).
* Kevin Chen, Senior Research Fellow, China Program Leader, International Food Policy Research Institute, Beijing, China
Jimin Wang, Deputy Director General, Institute of Agricultural Economics and Development of Chinese Academy of Agricultural Sciences, Beijing, China
1000 10000
0
20000
30000
40000
50000
60000
70000
1978
1979
1980
1985
1990
1991
1992
1993
1994
1995
1996
1997
1998
1999
2000
2001
2002
2003
2004
2005
2006
2007
2008
2009
2010
2000
3000
4000
5000
6000
7000
8000
9000meat output
pork output
hog inventory
slaughtered hog
10,000 t 10,000 heads
0

75
BRIEF HISTORICAL OVERVIEW OF CHINA’S HOG SECTORPig farming in China has a long history as pork is a traditional meat for the country’s Han Chinese population. Although the share of pork in total meat consumption has been declining over time, it still accounts for approximately two-thirds of meat production and consumption in the country. For the purposes of this paper, it is useful to divide the historical overview of pork production into four subperiods (Wang and Xiao 2008):1. Reform period (1978-1984): The year 1978 marked the adoption of the household
responsibility system in China − moving away from collective to household-based farming. The household responsibility system granted pig farmers the powers to manage their own production and marketing operations. Due to the individual incentives influencing pig farmers and additional measures instituted by the government, the pig population grew rapidly and China increased its pig inventories by nearly 30 million pigs in just two years (1978-1980). Inventories declined between 1980 and 1984, but the number of pigs slaughtered continued to grow. Between 1978 and 1984, the number of slaughtered pigs grew at a compound annual growth rate of approximately 5 percent and pork production grew by close to 10 percent per annum due to additional growth in productivity.
2. Expansionary period (1985-1997): The Communist Party of China’s Central Committee issued ‘10 policies for stimulating the rural economy.’ Among other measures, the policy favoured the liberalization of markets and trade over the old system of compulsory contract purchase. As a result, the pig population and the number of pigs slaughtered grew very rapidly during this period, raising pig production growth above 7 percent per annum. Per capita consumption of pork during this period reached nearly 29 kg per annum.
3. Structural adjustment period (1997-2006): Rapid growth during the reform and expansionary period increased the complexity of operations and the factors that determined it. In 1997, China faced a structural surplus supply of animal products accompanied by rising feed and energy prices and growing wage costs for the first time. In addition, the changing nature of consumer demand brought into focus the demand for safe and high-quality products. Growing threats in the form of livestock and poultry diseases and pressures emanating from environmental issues further complicated the production and marketing environment for the Chinese hog sector. To deal with these factors, the Chinese Government shifted its focus to promoting improved pig breeds, improving efficiency and product quality and safety with modern technology, and addressing the long-term problems of feed scarcity and disease proliferation.
4. Industrialization period (2007 to present): Since the beginning of the industrialization period, the Chinese hog industry has begun to consolidate its operations and change the mode of future development. New and emerging features of the industry include scaling up, industrialization and vertical integration. Despite these efficiency-enhancing measures, growth in production has slowed and prices remain stubbornly high and continue to rise. For the first time in decades, China’s pig production dropped in 2006 despite the prevalence of relatively high prices. This period has also seen a withdrawal of backyard households from pig breeding and raising operations and a declining share of small-scale producers. These developments point to new challenges for hog

76
production in China and the need for new policy instruments. More important, however, is the growth of production costs due to rising feed prices (Figure 2), which reflects the growing scarcity of key production inputs.
Figure 2. Rising costs of China’s hog productionSource: Gale et al. (2012).
PRODUCTION COSTSPig farming costs have continued to grow in China, especially since 2006, due to the rising costs of feed and labour. As a result, the profitability of the hog industry has decreased and average hog prices in China have risen considerably higher than those in the United States for the first time, triggering large imports of pork into China. This has raised serious concerns about ‘pork security’ and the future of the hog industry in China. Some of the factors that affect the costs and benefits of pig-farming operations include the global slowdown in grain production and rising energy prices. As feed costs account for more than 50 percent of pig production costs, the decline of global cereal output by approximately 33 million tonnes as well as the diversion of maize for ethanol production led to soaring food and feed prices. While prices declined in 2008, many of the fundamental factors prompting higher prices will underpin market fundamentals in the pig sector in China over the medium to long term. Epidemics have led to further cost increases associated with losses and animal deaths. Since the second half of 2006, blue ear pig disease outbreaks in the main pig-producing areas have greatly affected piglet health and have resulted in piglet shortages. Diseases have also led to lower slaughtering rates and increased disease prevention costs. Industrialization and urbanization further exacerbate pig production costs in China by pushing up labour costs. As China’s industrialization and urbanization accelerate and rural-urban migration continues, this trend is likely to continue in the foreseeable future.
Feed
20020
0.10
0.20
0.30
0.40
0.50
0.60
0.70
0.80
03 04 05 06 07 08 09 10
Feeder pig
Labor
Other
USS/lb
Feed, feeder pig, and labor are three main determinants of hog production costs, accounting for more than 90% of the total production cost. Rising labor and feed costs are largely responsible for the increased procuction cost.

77
THE POLICY RESPONSEConsidering the importance of pork in Chinese diets and its implications for national food security, the Chinese Government has adopted an aggressive policy stance since 2007 with a view to modernizing hog production units through vertical integration and scaling up, so as to control quality and reduce costs. Relevant policy instruments involve specific targeted subsidies and tax exemptions, and public systems to monitor hog trends and stabilize prices (Xie 2012). Some specific measures include: • A sow subsidy started in 2007. The subsidy per sow was 50 yuan in 2005 and
increased to 100 yuan per head in 2008. The policy was halted in 2009-2010 and then resumed in 2011-2012 with the same level of subsidy per head. In 2011, the total subsidy amount dispensed was about 2.6 billion yuan.
• Subsidized insurance for sows and finishing hogs. There is a national coverage programme for subsidized sow insurance but only a pilot programme for subsidized insurance for finishing hogs. The coverage per sow is 1 000 yuan with a premium of 60 yuan. In the Central and Western regions, the central government covers 50 percent of the premium, while local governments cover 30 percent. In 2011, the total subsidy amount dispensed for the sow insurance scheme was about 1.4 billion yuan.
• Industrial pig farming funding for major hog-producing counties started in 2007. The grant can be used for breed improvement, enhancing pig barns, interest subsidies for production loans and local pig industry development initiatives. From 2007 to 2012, the number of major hog-producing counties benefiting from this support has increased from 253 to 536, while the total support amount dispensed has grown from 1.5 billion to 5.4 billion yuan.
• Grants for larger hog operations. The average grants per farm are 200 000 yuan for operations with a total number of slaughtered hogs between 500 and 999, 400 000 yuan for operations between 1 000 and 1999, 600 000 yuan for operations between 2 000 and 2 999 and 800 000 yuan for operations with a total number of 3 000 and above. The total value of grants dispensed amounted to 15 billion yuan for the period 2007-2012.
• Free mandatory immunization. • Subsidies for 300 key breeding farms or centres. • A 25 percent corporate income tax waiver for pig operations. • Other promotional measures such as subsidized loans, provision of methane
digesters, assistance in disposal of diseased hogs, grants to returning migrants to enter into the large-scale hog business, etc.
• Establishment of a national pork reserve system designed to maintain pork reserves for up to seven days of consumption and to support market interventions to stabilize prices by buying pork for reserves when prices are low and sell pork when prices are high (see Table 1 for more detailed information on the relevant intervention guidelines).

78
Table 1. Intervention guidelinesHog-grain price ratio Color code Government action
Over 9:1 Sell frozen pork reserves into the market; issue subsidies to low-income consumers.
6:1 to 9:1 Green (“normal”) Monitor markets and price fluctuations; issue information. Pork reserves mainly used for emergencies and disasters.
5.5:1 to 6:1 Blue Add to central and local pork reserves when ratio is in this range for 4 consecutive weeks.
5:1 to 5.5:1 Yellow Subsidize interest on loans to large meat processing companies to encourage them to add to commercial reserves and increase pork processing.
Under 5:1 Red Increase central reserves and require large and medium cities to increase local reserves of frozen pork when the ratio is in this range for 4 consecutive weeks. The number of live hogs kept in reserve may be increased. If the ratio is still in this range after reserve purchases, a temporary subsidy of 100 yuan per sow may be given to farms in main hog-producing counties when sow inventory is down 5 percent year-on-year. Appropriately limit pork imports to reduce the market supply; “imporve” the food safety system to encourage pork exports.
Source: Gale et al. (2012).
REGIONAL SHIFTS IN HOG PRODUCTIONChina’s pig production area consists of six major districts/categories − the middle and lower reaches of the Yangtze River (including Sichuan, Hubei, Hunan, Jianxi, Jiangsu, Zhejiang and Anhui provinces); North China (including Shanxi, Shandong and Henan provinces); Northeast China (including Liaoning, Jilin and Heilongjiang provinces); Southeast China (including Fujian, Guangdong, Guizhou, and Hainan provinces); municipalities (Beijing, Tianjin and Shanghai); and other areas (including the remaining ten provinces). As can be seen from the data in Table 2, the Yangtze River region’s share of hog production has declined over the years while those of North, Northeast and Southeast China have risen. Some of this shift has been due to easier access to feed and improved infrastructure. Within the Yangtze River area however, Sichuan and Hunan remain major producing areas due to advantages associated with small, miscellaneous grains and land. North China is primarily a maize- and wheat-producing area, which could facilitate the region’s transformation into a pig production area in the near future. Southeast China has developed rapidly due to better endowment of resources and market advantages. On the other hand, the region is at a disadvantage due to increasing environmental awareness and new pressures to move pig production away from urban areas. In this context, Northeast China may have some advantages due to its abundance of maize and soybeans and lax attitude toward environmental concerns.
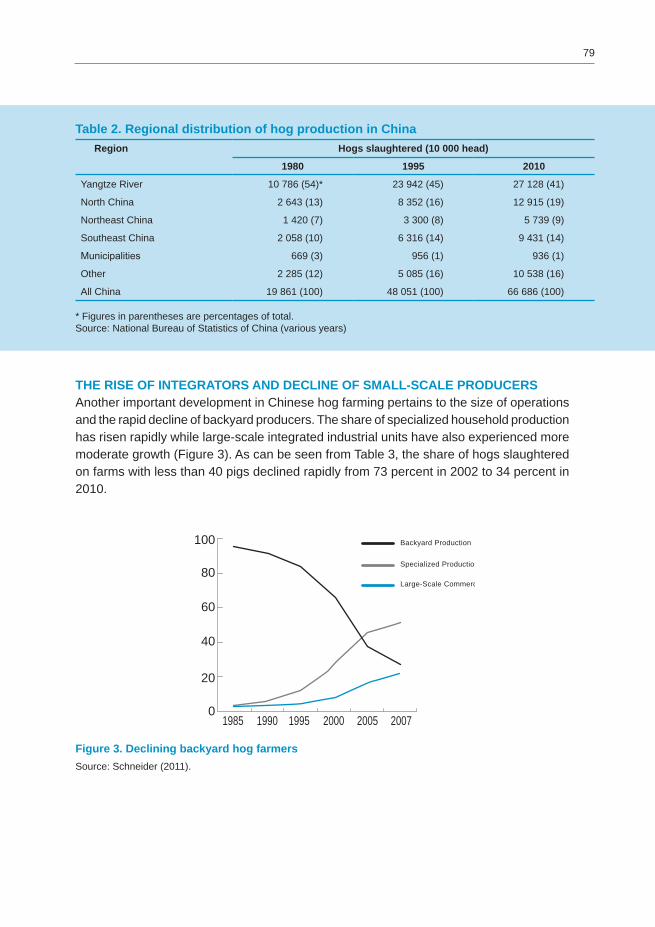
79
Table 2. Regional distribution of hog production in ChinaRegion Hogs slaughtered (10 000 head)
1980 1995 2010
Yangtze River 10 786 (54)* 23 942 (45) 27 128 (41)
North China 2 643 (13) 8 352 (16) 12 915 (19)
Northeast China 1 420 (7) 3 300 (8) 5 739 (9)
Southeast China 2 058 (10) 6 316 (14) 9 431 (14)
Municipalities 669 (3) 956 (1) 936 (1)
Other 2 285 (12) 5 085 (16) 10 538 (16)
All China 19 861 (100) 48 051 (100) 66 686 (100)
* Figures in parentheses are percentages of total.Source: National Bureau of Statistics of China (various years)
THE RISE OF INTEGRATORS AND DECLINE OF SMALL-SCALE PRODUCERSAnother important development in Chinese hog farming pertains to the size of operations and the rapid decline of backyard producers. The share of specialized household production has risen rapidly while large-scale integrated industrial units have also experienced more moderate growth (Figure 3). As can be seen from Table 3, the share of hogs slaughtered on farms with less than 40 pigs declined rapidly from 73 percent in 2002 to 34 percent in 2010.
Figure 3. Declining backyard hog farmersSource: Schneider (2011).
01985 1990 1995 2000 2005 2007
20
40
60
80
100 Backyard Production
Specialized Production
Large-Scale Commercial Production

80
Table 3. Share of hogs slaughtered by farm size
Number of hogs slaughtered
Hogs slaughtered by farm size (percent)
2002 2008 2010
1-49 73 44 34
50 and above 27 56 66
50-99 9 13 13
100-499 8 16 17
500-2 999 5 15 19
3 000-9 999 3 7 9
Source: National Bureau of Statistics of China (various years)
In another randomized survey from Zizhong County in Sichuan Province, it was reported that almost 32 percent of smallholders exited from pig production in just one year due to continuing rural-urban migration, rising wage costs, price volatility and high risk in the hog business due to disease outbreaks (Chen et al. 2012). The Ministry of Agriculture predicts this trend to continue, and that it will be led by large pork production companies in China (Table 4).
Table 4. Leading pork companies in China AGFEED 31 hog farmers with annual production capacity of 550 000
COFCO 3 operations, 500 000 sows and 12 million hogs
Xinchengjinluo Group 22 million hogs slaughtered
New Hope 1.7 million pigs slaughtered
Shineway group 30 million hogs slaughtered
Transgrenshen group 10 million hogs
Wen’s foodstaffs group 3.5 million hogs through own base and specialized farmers
Yunan group Total capacity of 28 million. 7 million slaughtered in 2012
Source: National Bureau of Statistics of China (various years).
The leading companies have been partnering with specialized pig households through various organizational models (contracts with farmers, farmer cooperatives, promotion of pig producer associations, etc.) and investing in technology, technical expertise, breeding bases, feed production, etc. Although there is a wide range of organizational models, the general trend is towards scaling up and moving towards integrated companies with control over the entire value chain.

81
FUTURE CHALLENGESWhile the trend in Chinese hog production is towards large-scale integrated units, the question of smallholder market participation remains relevant. The key question is not whether, but how to facilitate the transformation of backyard farms into specialized household farms and how to assist large-scale commercial farms and specialized household farms in integrating backyard farms into mainstream operations. The policy instruments in that respect would include the provision of technical and advisory services to backyard farms, the development of integrated risk management tools, the promotion of superior breeds and the provision of credit services to alleviate cash flow difficulties faced by small-scale producers. At the macro level, the government will need to look into ways and means to manage trade more effectively and creating a fair market environment between large and small and domestic and foreign players.
REFERENCESChen, K., Liu, Y., Ruth, H. & Xiao, C. 2012. Can we relax liquidity constraints in micro-
insurance demand? Piloting an innovative design for agricultural insurance. The final report submitted to ILO Micro-insurance Innovation Facility. July, 2012.
Gale, F., Marti, D. & Hu, D. 2012. China’s volatile pork industry. Washington, DC, United States Department of Agriculture, Economic Research Service.
National Bureau of Statistics of China. Various years. Livestock statistical yearbook of China. Beijing, Chinese Agriculture Publishing House.
Schneider, M. 2011. Feeding China’s pigs implications for the environment, China’s smallholder farmers and food security. Ithaca and Beijing, Institute for Agriculture and Trade Policy and Mindi Schneider.
Wang, Jimin & Xiao, Hongbo. 2008. Development of the hog industry and its integration in China. In Jimin Wang & Mariko Watanabe, eds. Pork production in China - a survey and analysis of the industry at a Lewis turning point. ASEDP, Institute of Developing Economies, Japan External Trade Organization.
Xie, Shuanghong. 2012. Chinese animal husbandry in 2012: Development and policy focus. Guide to Chinese Poultry, Issue 17, 2012.

82
Feed and fodder challenges for Asia and the PacificHarinder P.S. Makkar*
Feed and fodder play a central role in providing proper nutrition to livestock. The feeding of a diet balanced in all nutrients and at a level that meets the production objective considering the animal’s physiological state is imperative for achieving high and sustained livestock productivity. The success of animal reproduction and health programmes rests on proper nutrition. Improper feeding leads to productivity losses and increase in emission of pollutants in the form of methane (up to 12 percent of feed energy is lost in the form of methane) and nitrogen and phosphorus release (60 to 70 percent of the nitrogen and phosphorus fed in intensive production systems is lost to the environment) in soil and water channels, which if not managed properly could cause water pollution, resulting in erosion of biodiversity, deterioration of human health and decrease in agricultural productivity (Van Horn 1998; IAEA 2008). Proper animal nutrition therefore plays an important role in addressing ongoing and emerging challenges imposed by increasing human population, global warming, land degradation, water shortage and pollution, biodiversity erosion and increasing energy prices. During the last couple of decades both production and consumption of animal products have substantially increased. In 1975, Asia’s contribution towards world meat production was 18 percent which increased to 42 percent in 2010, and the corresponding values for milk production were 12.7 percent and 35.9 percent respectively (FAOSTAT 2010). The average per annum consumption of animal products of a person in Asia is lower than the world average – meat consumption is lower by approximately 25 percent and milk consumption by approximately 40 percent. In the next four decades the world consumption of animal products is projected to double what it is today (FAO 2011a) and a large part of this increase will be in Asia. If we take feed conversion ratios of approximately 2, 4 and 9 for poultry, pigs and cattle respectively and also consider carcass percentages, a high demand for feed will ensue by 2050. It is a challenge especially when we are faced with: a) increase in population, b) decrease in arable land for crop production, c) water shortage, d) food-feed-fuel competition, e) limited supply of phosphorus, f) frequent climate extremes, g) increasing animal and human health risks and h) economic instability. This paper attempts to propose some options to address feed and fodder challenges.
FEED TRADE AND FEED SHORTAGE AND THEIR IMPLICATIONSIn 2011, China imported approximately 5 million tonnes of maize (in 2012 a decrease in import was recorded), largely for use as feed; and a sharp increase in demand for animal products in China could increase its maize import four-fold by 2020 (USDA 2012). The
* Animal Production Officer, FAO, Rome.

83
Philippines, Thailand and Viet Nam are also projected to import 1.9, 1.2 and 0.7 million tonnes of maize respectively by 2025 (Falcon 2008). In the last 20 years import of soybean in Asia has also increased by seven-fold (FAOSTAT 2010). The animal industries in emerging economies in Asian are heavily dependent on import of feed and feed ingredients. Any disruption in trade or increase or extreme volatility in cost of feed could be detrimental for the animal food industry and therefore impact food security. There is a chronic shortage of feed in Asian countries. As an example, in 2009 shortage of feed in India was of the order of 162.6 million tonnes of crop residues and 79 million tonnes of green fodder as dry matter. In 2020 India is expected to need 526 million tonnes of dry matter, 56 million tonnes of concentrate feed and 855 million tonnes of green fodder (as fed) (Dikshit and Birthal 2010). In 2011 in China maize and soybean shortages were estimated to be 15 million tonnes and 60 million tonnes respectively. By 2015 feed requirement by the swine industry in China is projected to be 75 million tonnes, with a shortage of 7 million tonnes (C. Wang, Institute of Dairy Science, Zhejiang University; personal communication). The same is the situation with Thailand, which is, and will remain a major meat-exporting nation in Asia. There is need for Asian countries to enlarge their indigenous feed resource base and rely more on locally available feed resources and their efficient use. To this end, Asian countries should also consider increasing fodder production, which would decrease reliance on imported feed ingredients and also decrease cost of feeding. Lower costs of protein and energy supply from fodder/forages than from concentrates has been recorded (Salgado et al., 2012). Development of the animal industry based on locally available feed resources is expected to decrease livestock’s carbon footprint and reliance on the trade. By 2020 the projected increase in poultry meat requirement in India is 9 million tonnes and in order to meet this requirement an additional 27 million tonnes of feed would be required (Robinson and Makkar 2012), which translates to an additional protein requirement of approximately 6 million tonnes (equivalent to 60 million tonnes of cereals or 2.4 million tonnes of soybean; Makkar 2012a). For meeting the 2020 production targets of meat from poultry and pig sectors in Asia, feed protein requirement is expected to be 132 million tonnes – double that consumed by these two sectors in 2009. To obtain 132 million tonnes of protein, 1.32 billion tonnes of cereals or 330 million tonnes of soymeal are required. With the currently used monogastric feeding systems, almost 100 percent of the feed protein required competes with food. A huge increase in the requirement of feed protein for monogastric animals in the future could further adversely impact food security. Policy and research attention must be paid to decreasing dependence of livestock production on feed ingredients that compete with human food.
OPTIONS FOR ENHANCING FEED AND FOOD SECURITY
Make the best use of the available feed resources Enhance efficiency of available feed resource use: According to a famous management quote: “If you cannot measure it, you cannot manage it” and most developing countries do not have a National Feed Inventory (NFI). The inventory should contain information on type and quantity of feed resources and during which period of the year (when) these are

84
available. Information provided by livestock feed inventories would be of immense use for policy-makers, government agencies, non-government organizations, intergovernmental agencies and development agencies, among others in formulating and implementing sustainable livestock development activities and in preparing and coping with climatic variations such as droughts, floods, severe winter weather events and global climate change. Spatial and temporal assessments of current and forecasted feed resources, including forages, will assist in disaster management and policy-making. Feed assessments would also enable informed decision-making related to the nature and quantities of commodities, the feed resources that could be traded locally, potential areas for feed markets and feed resources involved in imports and exports. Estimates of feed resources and demands are needed to assess the fractions of foodgrain that is used for feed. Although livestock feed shortages have clearly constrained productivity in many countries, the impacts of feed shortages at national levels have been poorly characterized due to the lack of national-scale feed assessments. In addition, information on the availability of feed ingredients at the country level will enhance the efficiency and profitability of the animal feed industry and assist researchers to formulate sustainable feeding strategies. Such information would also be useful for determining the input-output relations for countries, e.g. the estimation of edible protein outputs versus protein inputs. Estimates of feed resources would also improve the accuracy of assessments of the environmental impacts of livestock resulting from land-use transformations as well greenhouse gas emissions and element fluxes (e.g. nitrogen) associated with livestock production. Production and consumption of feed significantly affects the potential of ecosystems to sequester carbon. Country-level feed balances based on feed inventory data will facilitate planning within the livestock industry, e.g. in determining how many animals can be supported or produced based upon existing feed resources, and in identifying what feed resources would and could be developed to achieve production objectives. Such efforts will, in turn, translate into enhanced food security balanced with environmental sustainability. A manual containing methodologies, tools and guidelines for establishing and maintaining NFIs is available (FAO 2012a), the use of which would assist countries to generate the required feed-related information. Implement balanced feeding: In addition to shortage of feed, imbalanced nutrition is one of the major factors responsible for low livestock productivity. Balanced nutrition (supply of nutrients based on the physiological conditions of the animal and keeping in view the objective of raising an animal) contributes to improving animal output as well as to reducing both the cost of production and the emission of greenhouse gases per unit of animal product produced. A number of software programs are available for preparing balanced rations, which are used by professionals looking after big commercial farms, both in the monogastric and ruminant sectors. However, in the smallholder dairy and beef sectors the feeding of imbalanced feed is widely prevalent as many farmers are unskilled in preparation and feeding of balanced diets. As a result animal productivity is low and feed C and N get wasted and are not utilized efficiently in animal products, causing excessive release of greenhouse gases. Imbalanced feeding also causes metabolic and behavioural stress in animals. A ration-balancing programme, being implemented by the National Dairy Development Board of India in 50 villages and on 3 100 animals, has demonstrated an increase in net

85
daily income of farmers by 10 to 15 percent through an increase in milk production and a decrease in feed cost. Milk production efficiency (fat corrected milk yield/feed dry matter intake) of cows increased by 34 percent, implying that more milk was produced from 1 kg of feed when using balanced rations. Feeding a balanced ration to dairy animals reduced faecal egg counts of internal parasites and increased levels of the serum immunoglobulins IgG, IgM and IgA, suggesting improved animal immunity. Furthermore, feeding balanced rations also reduced enteric methane emissions by 15-20 percent per kilogram of milk produced and increased efficiency of microbial protein synthesis (FAO 2012b; Garg et al. 2013). Large-scale implementation of such programmes can help improve the productivity of livestock raised by smallholder farmers. It has also been recorded that correction of mineral imbalances enhances animal productivity (FAO 2011b). Similar approaches can also be adopted for adolescent and beef animals, by taking into consideration local feeding and management conditions. Smallholder production systems contribute over 65 percent of the milk production and over 55 percent of meat production and hence targeting smallholder farmers should be the priority. Concerted efforts in other countries and donor participation in the programme will be catalytic to delivering the benefits of ration-balancing programmes to farmers. In addition, implementation of such a programme at the grassroots level will enhance resource-use efficiency and decrease the release of environmental pollutants from livestock production systems. Integrate quality control system in feed analysis: In preparing and feeding a balanced ration it is imperative that the chemical composition of feed ingredients is reliably known. Field experiences show that such data originating from many laboratories in Asian countries are not reliable because quality control systems and good laboratory practices are not integrated in the feed analysis. A manual to address these issues has been produced by FAO (FAO 2011c). Science managers and feed industries must ensure that the quality control systems and good laboratory practices are used on a routine basis in feed analysis laboratories. Reduce loss of feeds: In many Asian countries, for example India, Bangladesh, Pakistan, Myanmar and Indonesia, ruminant production is largely based on feeding of crop residues and agro-industrial by-products. However, these resources need to be properly managed. Straw worth millions of dollars is burned every year in many parts of Asia, causing environmental problems and soil degradation, in addition to loss of this valuable feed resource. In India alone, burning of crop residues releases CO2, CO, CH4, N2O and SO2, equivalent to 6.6 million tonnes of CO2 annually (INCCA 2007). Improving the management of crop residues as animal feed should be one of the main priorities. There is an urgent need to optimize use of the limited feed resources, including straw for ruminant feeding. Crop residue management could include the use of specially-designed balers for collection of straw from the field, followed by the use of processing technologies for the manufacture of balanced complete feed for ruminants. In this respect, the technology for making densified total mixed ration blocks (DTMRBs) or densified total mixed ration pellets (DTMRPs) based on straw and oilseed meals is an innovative approach, which provides an opportunity for feed manufacturers and entrepreneurs to remove regional disparities in feed availability and to supply the balanced feed to dairy and other livestock farmers

86
on a large scale. The DTMRB or DTMRP technology can also be effective in disaster management and emergency situations that arise due to natural calamities, for example floods, droughts and human conflicts. Feed banks could be set up to overcome the problem of feeding animals during these natural calamities, which are common in the tropics. The method for preparation of DTMRBs and DTMRPs and advantages of their feeding are given in FAO (2012c). Their feeding increases animal productivity and decreases wastage of feed ingredients, including straws. From the discussions at the FAO e-conference on ‘Successes and failures with animal nutrition practices and technologies in developing countries’ (FAO, 2011b) it could be surmised that application of technologies such as urea-ammoniation of straw and urea-molasses blocks that aid in enhancing the efficiency of utilisation of crop residues and low quality forages has been success in areas where the extension services and farmers’ linkages to the market were good. In addition, the discussions suggested that adoption of these technologies would be higher if the straw treatment and preparation of the blocks are conducted at a community/cooperative level or by private entrepreneurs since it reduces the operational cost and relieves the farmers from devoting time and efforts for the treatment of straw or preparation of the blocks. Despite overall negative impression prevailing about the relevance of these technologies, there seems to be potential, under some situations, for generating impact at the farmer’s level using these technologies. In addition, feeding of total mixed rations has also been shown to have several advantages such as decrease in feed loss, higher nutrient availability, lower enteric methane production and higher animal performance over feeding ingredients separately (FAO 2011b; FAO 2012b), which is conventionally practised in most Asian countries. Information on the production and feeding of these rations should be widely disseminated. Other simple technologies, such as chopping of forages, increase animal productivity and reduce waste of forage. Animals consume considerable energy in chewing forage and chaffing allows saving of this energy and its diversion for productive purposes. Intake of chopped forage is higher compared to unchopped forage (FAO 2011b). Silage-making, especially using locally available resources as done in Bangladesh (FAO 2011b), is also an attractive approach for reducing wastage of forages whose availability is high in rainy seasons. In some months of the year availability of vegetable and fruit wastes is also high which can also be converted into a valuable resource through silage making. These resources can be used for feeding during the dry season when availability is low. These approaches convert ‘disposal problems into opportunities for development’. Due to lack of proper storage conditions fungal infestation of feed ingredients such as cotton seed cake and maize is a chronic problem in many Asian countries. Moist conditions lead to production of mycotoxins by the fungus present, which decrease productivity and animal and human health. According to an estimate, losses in the Philippines, Indonesia and Thailand are approximately US$900 million per annum due to aflatoxin alone (Schmale and Munkvold 2012). Aflatoxin is one of the many toxins produced by fungus. Substantial feed losses in Asian countries can be prevented by using proper postharvest technologies. The application of afore-mentioned approaches will also contribute to producing more animal products per animal unit.

87
Tap new feed resourcesThe interest in the search for alternative/additional food and feed ingredients is of paramount importance mainly because of the global demand for grains which has exceeded production and the stiff competition between humans and the livestock industry for existing food and feed. Biofuel co-products as livestock feed: Much grain is being diverted to biofuel production, for example in 2011 in the United States more than one-third of the maize produced was used for ethanol production. However, there are many opportunities for using the co-products of the biofuel industry as livestock feed. Our in depth study over the last two years in this area has revealed some novel co-products that could be used as livestock feed. These are: distillers’ grains from various grains, glycerol, gluten meal, cassava residue, Camelina sativa meal, sweet sorghum residue, kernel meal from toxic Jatropha after detoxification and from non-toxic Jatropha, pongamia meal, castor meal, palm kernel meal and algae residue (FAO 2012d). Distillers’ grains from maize are produced in the United States while Europe produces distillers’ grains from wheat and barley. The weight of distillers’ grains that is available from grains is one-third the weight of the grains taken for ethanol production. The distillers’ grains are being used extensively in the diets of ruminants, poultry and pigs. They are rich in protein and can be a good substitute for soybean in animal diets. Among Asian countries, only in China are distillers’ grains produced in considerable amounts (7 million tonnes, USGC 2012). However they are being imported and used by other Asian countries such as Republic of Korea, Japan (in 2011 import increased by 31 percent in one year), Indonesia, Thailand and Viet Nam (Hammamoto 2012). Since mycotoxins, pesticides and antibiotic residues present in grains become concentrated in distillers’ grains (yeast used in conversion of starch to ethanol does not degrade these compounds), caution is required in using distillers’ grains. The potential of other co-products listed above has been discussed extensively in FAO (2012d). During the 1980s a number of seed cakes, for example neem, castor and pongamia, were detoxified in India for use in livestock feed (FAO 2012d); however none of these methods were upscaled to industrial scale. During the 1980s and 1990s grain and oilseed prices were low which probably discouraged upscaling of the detoxification processes. Now with the changed scenarios of high cost of feed and grains there is a need to revisit those technologies and develop a business model for detoxification of unconventional feed resources. India is the largest producer of castor beans. A low cost detoxification process using calcium oxide is available and incorporation of the detoxified cake in animal diets has shown satisfactory results. Setting up of a pilot-scale detoxification plant and subsequently a large-scale plant could be an option. The same could also be considered for other unconventional cakes. A number of countries in Asia have planted or are in the process of planting Jatropha curcas as an energy plant. The seed of this plant has approximately 30 percent oil which can be converted to high quality biodiesel. However, almost all the plantations have been implemented using the toxic genotype and after extraction of oil, the seed cake or kernel meal left cannot be used as a livestock feed because they are highly toxic due to the presence of phorbol esters. These feed resources could be used after detoxification. On the other hand, a non-toxic genotype of J. curcas is present in Mexico. The seed cake and

88
kernel meal from this genotype have been demonstrated to be excellent protein-rich feed resources for addition to poultry, swine, turkey, fish and shrimp diets. It can also be safely fed to small and large ruminants (FAO 2012d). The seeds of this non-toxic genotype have oil and protein contents similar to those in the toxic genotype. Germplasm improvement for yields and other useful traits and cultivation of the non-toxic genotype of J. curcas should also be considered. Glycerol, a co-product of biodiesel production, is produced in a volume that is one-tenth of the original oil taken for biodiesel. A substantial amount of glycerol is available for the feed industry. It is a good energy source for animals and guidelines for its safe use for different animal categories are discussed in FAO (2012d). It may be noted that glycerol produced from biodiesel production from oil obtained from the toxic genotype of J. curcas should be used with caution as it could contain toxic constituents (Makkar et al. 2009). Other novel feed resources: Barley is fed to animals as grain, green foliage and fodder (hay and silage) and often has quality superior to that of other fodder crops (McCartney and Vaage 1994; Abbeddou et al. 2011). It is a rapid crop and has high nutritive value for both food and feed uses and requires fewer supplements for nutritive balance than many other fodder sources. Barley is already a viable green fodder crop in developed countries, e.g. in Australia, Europe and North America, but this use is not widespread in developing countries. Barley occupies specific niches in cropping systems because of its response to cool weather, low water availability and productivity in marginal soil; it offers potential in enhancing land-use efficiency. Also mutants with low lignin, without awns and reduced lodging are available (Meyer et al. 2006; Franckowiak et al. 2010; Sameri et al. 2009). These useful traits could be considered for introduction in local varieties in use in Asian countries. The improved lines of barley could be valuable feed resources that could fit well in the feeding calendar for the winter months especially in hilly areas where other feed resources are scarce. Winter oat also enjoys many traits common to winter barley and it is also a useful forage (Salgado et al., 2012). Further integration and incorporation of research work on other food-feed crops such as sorghum, millet, oat, wheat etc being conducted in a number of CGIAR and other international institutions with the aim to enhance nutritional quality of crop residues into the work of National Agricultural Research Systems will contribute to further increasing the utilization of crop residues. In addition, spill-over effects of the intensive research efforts on utilization of crop residues for generation of second generation biofuel is expected to benefit livestock feed industry in future. Azolla also needs to be promoted, and thornless cactus is a good feed for small ruminants in the dry areas (FAO, 2011b). Leaves of Moringa oleifera are high in crude protein and almost all the crude protein is present in the form of true protein. In addition, the amino acid composition and protein digestibility is as good as soybean (over 92 percent). Furthermore the leaves are rich in carotenoids, vitamin C and other antioxidants (Makkar and Becker 1997; Foidl et al. 2002). Its intensive cultivation (dense plantation) with the application of fertilizer and water supply, gives a dry matter yield of up to 120 tonnes per hectare, with seven to eight cuttings in a year (Foidl et al. 2002). This is a novel approach in which a fast-growing tree such as moringa was densely planted and was not allowed to turn into a tree by cutting the plant every 45 to 50 days to obtain high forage biomass of high quality for feeding to livestock.

89
This approach of turning a fast-growing tree into a forage plant after dense plantation and frequent cuttings should also be tried on other fast-growing plants that give high quality forage. Examples of such plants are mulberry and leucaena, among others. Using forages such as moringa that have high leaf yield with high protein of as good a quality as soybean, an integrated monogastric and ruminant feeding system can be supported. The protein content of moringa leaves is 25 percent and that of soybean is 40 percent (both on dry matter basis). The fibre content of moringa leaves is also very low (and so is lignin). Dry matter yield of 120 tonnes/ha/year of moringa forage, if containing approximately 6 percent leaves and the remainder soft stems and twigs, would give approximately 7.2 tonnes of moringa leaves (on protein equivalent basis this equals 4.5 tonnes of soymeal), which could be used as feed for poultry or pigs. The remaining 112.8 tonnes of soft twigs and stems containing approximately 15 percent crude protein may be used as good quality forage for ruminants. Average soybean yield is 2 tonnes/ha; while that of moringa leaves on a protein equivalent basis could be more than two-fold. This is one of the examples wherein a feed ingredient that competes with human food can be replaced in the diets of monogastric animals with a lesser-known or unconventional feed resource. Similarly, protein isolates prepared from unconventional oilseed cakes and agro-industrial by-products with the addition of synthetic amino acids, in case they are deficient in an amino acid (s), could be attractive options for feeding monogastric animals. Scientific options are available to implement the concept of ‘sustainable animal diets’ being developed at FAO which consider the suggestion of reducing grains and other food materials in diets of monogastric animals as they compete with human food (Makkar 2012b). Lesser known plants: A challenge facing animal nutritionists is to introduce and promote alternative feed resources that have high nutritive value and are adapted to harsh environmental conditions. The ongoing climate change development is also expected to create harsher conditions: high temperature, drought, floods and drastic climatic variations, with the greatest impact to be felt among ‘subsistence’ or ‘smallholder’ farmers in developing countries. Wild underutilized plant resources should therefore receive more attention. A number of other lesser-known and underutilized plants adapted to local, harsh conditions are available today. The neglect of such potentially excellent animal feed resources also results in loss of biodiversity. In lieu of this, the cultivation and judicious use of such plants as feed resources is expected to enhance plant biodiversity. Thus, there is a need to identify such potential feed resources and use them to conserve biodiversity. Many lesser-known plants with good nutritional values and high palatability are already in use in some pockets of the world; if their use as animal feed is promoted, they would enhance animal productivity in addition to contributing to conservation of plant biodiversity. Twenty lesser-known plants with potential for use as livestock feed have been identified (FAO 2012e). Collaborative efforts among scientists and farmers must particularly be directed towards establishing and developing innovative feeding systems using high protein fodders from promising species of trees and shrubs that are adapted to harsh environmental conditions. The ultimate objective of future research on lesser-known plants should be to: a) improve the availability of feed resources to provide an adequate strategic feed supplement to animals during critical periods, b) increase biodiversity and c) meet the challenges of ongoing climate change.

90
In addition, tropical and subtropical areas house plants that have a wide range of bioactive compounds. Due to harsh environmental conditions the levels and distribution of compounds with bioactivities are much higher in tropical areas than in temperate zones. Most developing countries have tropical and subtropical climates and they need to recognize the tremendous plant wealth they have. The use of natural plant products in the developed world is in vogue and tropical plants could be valuable sources of a number of bioactive compounds that could replace synthetic ones that have adverse effects on humans, animals and the environment. Concerted efforts including South-South cooperation are required to exploit these untapped and hidden resources present in the form of lesser-known or lesser-used tropical plants. Insects: Some insects such as the black soldier fly or Hermetia illucens, maggots (larvae of the housefly Musca domestica), yellow mealworm (Tenebrio molitor), silkworms (Anaphe infracta) and grasshoppers (e.g. Oxya hyla hyla) are also good sources of protein and macro-and microminerals. The protein content of insects could range from 40 to 60 percent on a dry matter basis, with protein quality as good as muscle protein (Feedipedia 2012). They are also good sources of iron, zinc, vitamin A and polyunsaturated fatty acids; and have been found to be good feed ingredients for poultry and pig diets (Newton et al. 2005; Hwangbo et al. 2009; Ijaiya and Eko 2009). In addition, insects are considered to be better converters of feed into protein than conventional livestock and they may also release lower greenhouse gases per unit of protein production than ruminants. The challenge at present is to establish economically viable insect mass-rearing techniques that give large and regular outputs of insects for use by the feed industry. Also, a regulatory framework needs to be developed for safe use of the insects as animal feed, which also includes registration of insects as a feed. Preparation of protein isolates from non-edible insects and feeding to monogastric animals including aquaculture species could also be an attractive option. Preparation of protein isolates from such insects could be a way to eliminate toxins and antinutritional factors present in non-edible insects. In addition, insects could also be a source of several bioactive compounds with agricultural and pharmaceutical applications.
Enhance fodder productionCultivated land under fodder production has decreased in Asia. In India the area under cultivated fodder has decreased by approximately 10 percent in the last decade (GOI 2009). This means that more fodder needs to be produced from a smaller area. However, in Asia fodder production is largely carried out using uncertified seeds. As a result the fodder yields are low. A number of steps (e.g. production of nucleus seeds, breeder seeds and foundation seeds) and contributions from a number of organizations such as research institutions, ministries of agriculture, production agencies, seed growers, seed certification and seed marketing agencies are required in the production of these seeds. There is a need to strengthen the fodder seed production system through enhancing coordination between these organizations. Also strengthening collaboration between crop and animal husbandry research institutions and public-private institutions will further strengthen the production and distribution of certified and transparently-labelled fodder seeds. In addition, policies must encourage private companies to produce and market fodder seeds. From the same land

91
area, use of certified or transparently-labelled seeds could double fodder production. In addition, common lands should be developed for fodder production. Globally, out of 14 billion ha, 4 billion ha of land are classified as common land. Rao (2012) describes approaches for using common lands for fodder production. Production and use of Napier grass in the dairy areas around Chiang Mai in Thailand, promoted through an FAO project, have also resulted in increased availability of fodder and higher profit for farmers (Waritthitham 2012). The farmers have been successful in reducing the cost of feeding while obtaining the same or slightly higher milk yield (personal observations). In many situations, the cost of nutrients (protein, calcium, phosphorus and vitamin A) supplied through green fodder is expected to be much lower than that from other sources. Use of green fodder could decrease the cost of feed and contribute to decreasing dependence of livestock industry on imported feed ingredients, thus enhancing their sustainability and making them more resilient.
Increase nutrient availability from intestinal tracts Control of intestinal parasites: Internal parasites divert feed nutrients from the production of animal products to their own development. In addition, the presence of parasites decreases intake and digestibility of feed. Apparently there is no reliable quantitative information on the impact of the presence of internal parasites in animals on decrease in productivity in developing countries, however the strategic addition of fenbendazole and other helmentics in diets has been shown to increase animal productivity and farmers’ profits (Knox 1995; IAEA 2006). Smallholder farmers find anthelmintics expensive and under such systems the use of validated herbs and plant materials could be used to control internal parasites. A study conducted in Bangladesh, the Philippines and Indonesia showed that the efficacy of pineapple leaves in controlling helminthes is equivalent to fenbendazole (IAEA 2006, 2010), and also feeding of calliandra, sericea and cassava leaves and other tannin-containing plants was also effective in controlling helmintics (Min et al. 2004, 2005, 2008; Athanasiadou et al. 2009). The antiparasitic effect of pineapple leaves is attributed to the presence of bromolein (a cystein protease) (Makkar et al. 2007). These and other tropical leaves could be effective substitutes for expensive synthetic anthelmintics, against which resistance of internal parasites has also been increasingly recorded. Mineral addition in the diet: For maximum nutrient availability in the rumen for the production of microbial protein and other fermentation products required for productive purposes such as milk production, growth, reproduction etc., optimum rumen fermentation is necessary. Deficiency of minerals such as Co, Mo, Mg, Zn, Na, Cl etc. could decrease rumen fermentation because these are vital for various activities of rumen microbes. Suboptimal rumen fermentation can decrease nutrient availability from feed by up to 15 percent, which is a loss of valuable nutrients. It may be noted that for ruminants: ‘we feed the microbes and microbes feed the animals’. Correction of mineral deficiency in the field has been shown to increase milk production by 10 to 15 percent in dairy cows. In sheep 60 percent of anoestrus females came into oestrus within 15 to 21 days and the remaining 40 percent after 42 days of mineral supplementation (FAO 2011b).

92
Greater emphasis on development of ruminantsConventionally, when compared to ruminants, monogastric animals are considered to have higher efficiency of protein production from feed. However, following the current feeding practices, almost all the sources that provide protein to the diets of monogastric animals compete with human food, while this is not the case for ruminant diets. If we define efficiency of protein production as: Human edible protein produced/human edible protein fed, the efficiency is higher for ruminants than for monogastrics. Over 1 billion people go to bed hungry every day for want. mainly of grains. On the other hand, meat plays an important role in meeting protein and mineral requirements of pregnant mothers and growing children in developing countries. Therefore, producing meat from ruminants using feed that does not compete with human food would be a viable and attractive option for enhancing food security. Furthermore, in future, increase in cost of cereals, energy and other inputs compounded by increasing competition for arable land for fuel, food and fuel will impose a challenge on economic viability and overall sustainability of the present monogastric production system. Two billion tonnes of straw are produced worldwide and considering feed conversion efficiency of 10:1 potential exists to produce 200 million tonnes of live animal annually (100 million tonnes of meat), which could support 4 billion people at 25 kg/year (Devendra and Leng 2011). A study on the effects of supplementation of a low-quality pasture hay with cottonseed meal (CSM), barley or sorghum grain (young cattle were given poor quality pasture hay and minerals and then given graded amounts of the various supplements according to their live weight − McLennan et al. 1995 cited in Leng 2004) showed: a) efficiency of conversion of the supplement to live weight gain with increasing amounts of CSM was approximately four-fold greater as the increments were increased progressively to 0.5 percent of live weight when compared with the efficiency of conversion above this level, and b) the response with CSM meal was higher than that with sorghum or barley grains. Using data from a number of growth trials on the effect of supplementing young cattle (200 kg live weight, grazing dry pasture or given straw) with a protein meal such as CSM, the analysis of Leng (2004) can be summarized as: • With up to 0.7 kg/day of CSM meal the response in live weight gain would be
approximately 0.84 kg/day or a conversion efficiency of supplement to live weight gain of 1.2 kg live weight gain/kg CSM consumed. It may be noted that 0.7 kg/day of the seed meal supplementation to 200 kg live weight steer is 0.35 percent of the body weight per day.
• Above this level of supplementation the improvement is approximately 0.35 kg live weight gain/kg CSM.
In practice, a supplement such as oilseed meal, which is usually more expensive then the basal feed (here basal feed being crop residues), should rarely be fed at above 0.5 percent of the animal’s live weight. Interestingly, daily oilseed cake supplementation in the diet at a level of 0.5 percent of the body weight of the animal produced four-fold growth, a response of 1.2 kg live weight gain per kilogram of the supplement (up to 0.35 percent of the body weight). When used strategically, the utilization of oilseed cakes as useful products in ruminants should not be undervalued. The absolute value of the efficiency of

93
oilseed meal conversion into body weight will depend on the type and quality of the crop residues and genetic potential of animals, and hence call also for enhancing the genetic potential of local ruminant livestock. In a similar vein, rabbit production also needs the attention of policy-makers and science managers as they can be reared on a diet containing high content of forages (Makkar and Singh 1987; de Blas and Wiseman 1998) and their reproductive efficiency is very high. Greater emphasis on development of ruminants and rabbit production for meat production would also contribute substantially to pulling smallholder farmers out of poverty and in making economic growth inclusive because these species are generally reared by poor farmers. It is evident from the aforesaid discussion that technological options are available to meet the high demand for animal products while conserving the environment, biodiversity and natural resources; however for optimal delivery of solutions proper institutional support and sound policies are required. Technology and institutions must work together, and policies must provide an enabling environment for this to come about.
Main messages and general remarksMake efficient use of available feed resources by: • Establishing national feed inventories through institutional support and
infrastructure; • Implementing the concept of feeding balanced rations in the field; and • Integrating quality control systems in feed analysis laboratories. Reduce feed losses by: • Securing crop residues from fields and converting them to densified complete feed
blocks; • Promoting use of total mixed rations and methods for silage making and chopping
of forages; and • Using proper postharvesting technologies to prevent losses due to mycotoxins. Enlarge the feed resource base by: • Using co-products of the biofuel industry and conducting R&D on efficient use of
the co-products; • Upscaling proven laboratory-scale detoxification processes to pilot and industrial
scales; • Promoting the use of forages such as moringa leaves, thornless cactus, azolla and
winter barley; and • Tapping local knowledge to identify lesser-known feeds adapted to harsh climates
and by creating business models to use them. Enhance fodder availability by: • Strengthening certified fodder seed production and marketing systems, including
bringing on board the private sector; • Strengthening extension and training of farmers on good agronomic and cultivation
practices to grow high-yielding fodder varieties/hybrids; and • Developing policies and mechanisms to develop common land for fodder
production.

94
Increase nutrient availability from intestinal tracts by: • Preventing ‘grabbing’ of nutrients by helminthes; and • Using mineral mixtures. Give greater emphasis to ruminant production by: • Supplementing strategically oilseed meals/cakes to low quality roughages; • Enhancing fodder production; and • Enhancing use of agro-industrial by-products that do not compete with human food,
as animal feed. General remarks. Commonsense must prevail. Animal diets have the same importance for animals as human diets have for humans. Animal nutrition must get due attention, especially at the policy level and funding by donors. So far this area has remained neglected. As a result of this neglect the full genetic potential of animals is not realized in the field and the animal health and animal reproductive interventions are not as effective as they should be. Animal feeding is the foundation of livestock production systems and animal breeding and reproduction and animal health are the two pillars. If the foundation is weak, the building is likely to crumble.
REFERENCES Abbeddou, S., S. Rihawi, S., H.D. Hess, H.D., L., Iňiguez, L., A.C, Mayer, A.C. &and
M. Kreuzer, M. 2011. Nutritional composition of lentil straw, vetch hay, olive leaves and saltbush leaves and their digestibility as measured in fat-tailed sheep. Small Rum. Res., 96: 126-–135.
Athanasiadou, S., Githiori, J. & Kyriazakis, I. 2009. Medicinal plants for helminth parasite control: facts and fiction. Animal, 1(9): 1392-1400.
de Blas, C. & Wiseman, J. 1998. The nutrition of the rabbit, New York, USA, CABIDevendra, C. & Leng, R. 2011. Feed resources for animals in Asia: issues, strategies
for use, intensification and integration for increased productivity. Asian-Aust. J. Anim. Sci., 24: 303-321.
Dikshit, A.K. & Birthal, P.S. 2010. India’s livestock feed demand: estimates and projections. Agric. Economics Res. Rev., 23: 15-28.
Falcon, W.P. 2008. The Asian maize economy in 2025. Available at: http://foodsecurity.stanford.edu/publications/the_asian_maize_economy_in_2025
Food and Agriculture Organization of the United Nations (FAO). 2011a. World livestock 2011 – livestock in food security. Rome, FAO.
FAO, 2011b. Successes and failures with animal nutrition practices and technologies in developing countries. In H.P.S Makkar, ed. Proceedings of the FAO Electronic Conference, 1–30 September 2010.
FAO. 2011c. Quality assurance for animal feed analysis laboratories. FAO Animal Production and Health Manual No. 14.
FAO. 2012a. Conducting national feed assessments. By Michael B. Coughenour & Harinder P.S. Makkar. FAO Animal Production and Health Manual No. 15.
FAO. 2012b. Balanced feeding for improving livestock productivity – increase in milk production and nutrient use efficiency and decrease in methane emission. By M.R. Garg. FAO Animal Production and Health Paper No. 173.

95
FAO. 2012c. Crop residue based densified total mixed ration – a user-friendly approach to utilise food crop by-products for ruminant production. By T.K. Walli, M.R. Garg & Harinder P.S. Makkar. FAO Animal Production and Health Paper No. 172.
FAO. 2012d. Biofuel co-products as livestock feed – opportunities and challenges. Rome, FAO.
FAO. 2012e. Use of lesser-known plants and plant parts as animal feed resources in tropical regions. By Emmanuel S. Quansah & Harinder P.S. Makkar. Animal Production and Health Working Paper. No. 8.
FAOSTAT. 2010. FAO database, Rome. Available at: http://faostat.fao.org/ Feedipedia. 2012. Animal feed resource information system. Available at: www.feedipedia.
comFoidl, N., Makkar, H.P.S. & Becker, K. 2002. The potential of Moringa oleifera for agricultural
and industrial uses. In L.J. Fuglie, ed. The miracle tree, pp.45-76. CTA Publication. Franckowiak, J.D., Forster, B.P., Lundqvist, U., Lyon, J., Pitkethly, I. & Thomas,
W.T.B. 2010. Developmental mutants as a guide to the barley phytomer. pp. 46-60 In S. Ceccarelli & S. Grando, eds. Proc. 10th International Barley Genetics Symposium, 5-10 April 2008, Alexandria Egypt, pp.46-60. Aleppo, Syria, ICARDA.
Garg, M.R., Sherasia, P.L., Bhanderi, P.M., Phondba, B.T., Shelke, S.K. & Makkar, H.P.S. 2013. Effect of feeding balanced rations on animal productivity, feed conversion efficiency, feed-nitrogen use efficiency, rumen microbial protein supply, parasitic load, immunity and enteric methane emission to milch animals under field conditions. Anim. Feed Sci. Technol., (in press). DOI:10.1016/j.anifeedsci,2012.11.005
Government of India (GOI). 2009. Department of Agriculture & Cooperation, Ministry of Agriculture, Government of India, New Delhi, India.
Hammamoto, T. 2012. DDGS sales to Japan at record levels. US Grains Council. Available at: http://www.feedandgrain.com/news/10715646/ddgs-sales-to-japan-at-record-levels
Hwangbo, J., Hong, E.C., Jang, A., Kang, H.K., Oh, J.S., Kim, B.W. & Park, B.S. 2009. Utilization of house fly-maggots, a feed supplement in the production of broiler chickens. J. Environmental Biol., 30(4): 609-614.
International Atomic Energy Agency (IAEA). 2006. Improving animal productivity by supplementary feeding of multinutrient blocks, controlling internal parasites and enhancing utilization of alternate feed resources. IAEA-TECDOC-1495, pp. 280, Vienna, Austria.
IAEA. 2008. Guidelines for efficient manure management in Asia, IAEA-TECDOC-1582, pp.137, Vienna, Austria.
IAEA. 2010. Improving livestock production using indigenous resources and conserving the environment. IAEA-TECDOC-1640, pp. 162, Vienna, Austria.
Ijaiya, A.T. & Eko, E.O. 2009. Effect of replacing dietary fish meal with silkworm (Anaphe infracta) caterpillar meal on performance, carcass characteristics and haematological parameters of finishing broiler chicken. Pakistan J. Nutr., 8: 850-855.
Indian Network for Climate Change Assessment (INCCA). 2007. Indian Network for Climate Change Assessment. India: Greenhouse Gas Commission 2007. Ministry of Environment & Forests, Government of India, May 2010.
96
Knox, M. 1995. The use of medicated blocks to control nematode parasites of ruminants. In Recent advances in animal nutrition in Australia: July 1995, p. 166-121. Armidale NSW 2351, Australia, University of New England.
Leng, R. 2004. Protein sources for the animal feed industry. FAO Animal Production and Health Proceedings. 1 390 pp.
Makkar, H.P.S, Francis, G. & Becker, K. 2007. Bioactivity of phytochemicals in some lesser-known plants and their effects and potential applications in livestock and aquaculture production systems. Animal, 1(9): 1371-1391.
Makkar, H.P.S. & Singh, B. 1987. Comparative enzymatic profile of rabbit cecum and the rumen. J. Appl. Rabbit Res., 10: 172-174.
Makkar, H.P.S. & Becker, K. 1997. Nutritional value and antinutritional components in different parts of Moringa oleifera tree. J. Agric. Sci. Camb., 128: 311-322.
Makkar, H.P.S. 2012a Assessing the potential of insects as food/feed in assuring food security. Rome, Italy, FAO.
Makkar, H.P.S. 2012b. Sustainable animal diets: an FAO initiative towards sustainable intensification of livestock sector. AAAP Conference, 26-30 November 2012, Bangkok, Thailand.
Makkar, H.P.S., Maes, J., Greyt, W.D. & Becker, K. 2009. Removal and degradation of phorbol esters during pre-treatment and transesterification of Jatropha curcas oil. J. Am. Oil Chem. Soc., 8: 173-181.
McCartney, D.H. & Vaage, A.S. 1994. Comparative yield and feeding value of barley, oat and triticale silage. Can. J. Anim. Sci., 74: 91-96.
McLennan et al. 1995. Protein and energy utilisation by ruminants at pasture. J. Anim. Sci., 73: 278-290.
Meyer, D.W., Franckowiak, J.D. & Nudell, R.D. 2006. Forage quality of barley hay. Agronomy Abstracts 2006.
Min, B.R., Hart, S.P., Miller, D., Tomita, G.M., Loetz, E. & Sahlu, T. 2005. The effect of grazing forage containing condensed tannins on gastrointestinal parasite infection and milk composition in Angora does. Vet. Parasitol., 130: 105-113.
Min, B.R., Pomroy, W.E., Hart, S.P. & Sahlu, T. 2004. The effect of short term consumption of a forage containing condensed tannins of gastrointestinal nematode parasite infections in grazing wether goats. Small Rumin. Res., 51: 279-283.
Moore, D.A., Terrill, T.H., Kouakou, B., Shaik, S.A., Mosjidis, J.A., Miller, J.E., Vanguru, M., Kannan, G. & Burke, J.M. 2008. The effects of feeding sericea lespedeza hay on growth rate of goats naturally infected with gastrointestinal nematodes. J. Anim. Sci., 86: 2328-2337.
Newton, L, Sheppard, C., Watson, D.W., Burtle, G. & Dove, R. 2005. Using the black soldier fly, Hermetia illucens, as a value-added tool for the management of swine manure. Waste Management Programs. North Carolina State University. Available at: http://www.cals.ncsu.edu/waste_mgt/smithfield_projects/phase2report05/cd,web%20files/A2.pdf
Rao, J. 2012. Rehabilitation of degraded pasture and community lands in India. Regional Policy Forum on Asian Livestock Challenges, Opportunities and the Response, 16-17 August 2012, Bangkok, Thailand.

97
Robinson, T. & Makkar, H.P.S. 2012. Demand growth for animal-source foods: Implications for livestock feed production. In Conducting national feed assessments, pp.59-65. FAO Animal Production and Health Manual No. 15.
Salgado, P., Vu Q. Thang, Tran V. Thu, Nguyen X. Trach, Vu C. Cuong, Philippe Lecomte and Didier Richard. 2012. Oats (Avena strigosa) as winter forage for dairy cows in Vietnam: an on-farm study. Trop. Anim. Health Prod. (DOI:10.1007/s11250-012-0260-8).
Sameri, M., Nakamura, S., Nair, S.K., Takeda, K. & Komatsuda, T. 2009. A quantitative trait locus for reduced culm internode length in barley segregates as a Mendelian gene. Theor. Appl. Genet., 118: 643-652.
Schmale, D.G. & Munkvold, G.P. 2012. Mycotoxins in crops: A threat to human and domestic animal health. Available at: http://www.apsnet.org/edcenter/intropp/topics/Mycotoxins/Pages/ EconomicImpact.aspx
United States Department of Agriculture (USDA). 2012. USDA agricultural projections to 2021. February 2012. Available at: http://www.usda.gov/oce/commodity/archive_projections/ USDAAgriculturalProjections2021.pdf
US Grains Council (USGC). 2012. US Grains Council, outlook for China DDGS supply & demand. Available at: http://www.grains.org/index.php/chart-of-the-week/3648-outlook-for-china-ddgs-supply-a-demand
Van Horn, H.H. 1998. Factors affecting manure quantity, quality, and use. Proceedings of the Mid-South Ruminant Nutrition Conference, Dallas-Ft. Worth, May 7–8, 1998. Texas Animal Nutrition Council. pp. 9-20.
Waritthitham, A. 2012. Fodder production in Northern Thailand. Regional Policy Forum on Asian Livestock Challenges, Opportunities and the Response, 16-17 August 2012, Bangkok, Thailand.

98
Poverty, food security, livestock and smallholders: Issues and options for Asia and the Pacific regionVinod Ahuja and Steve Staal*
Asia and the Pacific is a region of contrasts. The region has experienced rapid economic growth, impressive technological achievements, notable decline in poverty and hunger rates, yet millions are still mired in poverty. The region is home to more than 60 percent of the world’s 925 million hungry people and the levels of undernutrition and malnutrition − protein and micronutrient deficiencies, in particular − remain unacceptably high. At the same time, there are emerging concerns about unhealthy consumption patterns stemming from poor awareness about proper nutrition. Many people in the region now consume excessive amounts of sugar and fats, leading to obesity and poor health. Nutritional well-being is being threatened by the rapid emergence of non-communicable diseases and vitamin, mineral and micronutrient deficiencies, creating a simultaneous double burden of over- and undernutrition. That economic growth is a necessary, but not sufficient, condition for reducing poverty and hunger is now well understood and appreciated. It is clear that the poor do not always benefit from economic growth either because of the nature and sectoral composition of growth or because of social, political and economic barriers in accessing productive assets, skills and services. This means sustainable poverty reduction cannot be achieved without active targeted public interventions that can navigate and guide public and private investment in sectors with the most potential for generating rapid poverty alleviating growth. Such avenues are limited. Among the few such avenues available, livestock still offers a promising pathway out of poverty and towards strengthening food and nutritional security at the household level. Unfortunately the experience over the last few decades in capitalizing on this potential has been less than encouraging. A large proportion of the growth in production of meat, milk and eggs has been captured by large-scale intensive production systems to the exclusion of smaller scale producers.1 This has often been exacerbated by the prevailing policy discourse in the region that considers livestock as an addition to rather than an essential component of smallholder agriculture. Also, policy response to ensure adequate access to nutritious food by the poorer sections of society has been less than commensurate. The role of livestock in the region, as pointed out by a number of observers, goes beyond income generation. There are linkages between livestock production, asset accumulation, household nutrition and risk management that are not fully mediated by the market. Hence,
* Vinod Ahuja, Livestock Policy Officer, FAO Regional Office for Asia and the Pacific, Bangkok Steve Staal, Director, Market Opportunities Research Theme, International Livestock Research
Institute, Nairobi, Kenya1 According to some rough estimates, at the global level, industrial systems provide approximately
75 percent of poultry meat and eggs and 60 percent of pork production.

99
policy and institutional responses need to go beyond simple promotion of productivity and market access enhancing measures and must be based on a fuller understanding of the complexity of rural livelihoods, the role of livestock and their linkages to nutritional status and broader measures of welfare.
GROWTH, LIVESTOCK AND FOOD SECURITYDespite rapid economic growth in the region, nearly two-thirds of the world’s 1.2 billion poor live in the Asia and Pacific region − mostly in rural areas. Reducing or eliminating these high and stubborn levels of poverty remains the key development objective of policy-makers and development practitioners in the region. This cannot happen without a strong focus on the identification and implementation of national and international policies in support of small producers. Indeed, there is no example of mass poverty reduction in modern history that has succeeded without sustained rises in employment and income on small farms (Lipton 2005). Yet, in many circumstances, it remains a major challenge to identify and implement policies in support of smallholder livestock producers and these challenges have been accentuated by the processes of globalization, emergence of private standards and a policy paradigm in the sector that continues to favour large players in the market. It is by now more or less the conventional wisdom that it is agricultural and rural growth that increases employment and reduces poverty. The famous Mellor hypothesis maintains that the impact on poverty comes from the contribution of agricultural growth to the non-tradable, rural non-farm sector. Economists call this the ‘multiplier effect’ (Mellor 1976; Mellor 2004); if the basis of this growth is more equitable and wider, usually the multiplier effect and the impact on poverty is higher. Table 1 presents estimates of household multipliers from livestock production and from other sectors of the economy.2 It is clear that in nearly all parts of the world, primary livestock production generates the highest multiplier effect. This is at least partly because livestock is generally more equitably distributed than land and also because smallholder livestock production is more labour intensive than crop production.
Table 1. Estimated household multipliers for various subsectors across regions Region/country Household multiplier for
Primary livestock
production
Crops Fruit & veg Manufact-uring
Services
East Asia and the Pacific 2.7 1.8 2.4 2.4 2.7
China 2.2 1.6 1.4 1.8 1.8
Latin America and the Caribbean 3.2 2.0 2.9 2.3 2.9
South Asia 4.7 3.6 4.3 2.9 3.1
India 4.7 3.6 4.3 2.9 2.9
Sub-Saharan Africa 2.9 1.6 2.6 1.9 2.6
High income countries 3.1 2.2 3.4 2.2 3.4
Source: FAO (2012).
2 The multiplier is defined as an additional effect of US$1 spending on national household income.
100
The size of this multiplier depends, among other things, on the size and consumption patterns for livestock products and the extent of linkages with the market. This means, within the context of growing markets for animal source foods, that investment in strengthening market linkages for smallholder livestock producers can indeed have high payoffs. But it must also be remembered that the demand for livestock products is generally price elastic and hence smallholders can benefit only if they can augment supply without increasing their prices. With growing scarcity of human and natural resources in the region, the production costs and margins are under tremendous pressure. Measures − both technological and institutional − to reduce cost of production must therefore become a major objective of governments wishing to promote smallholder livestock production. It should be also recognized that perishability of livestock products demands much higher level of infrastructure support; investment in rural power supply and all-weather roads should be seen as a priority. This investment of course is not exclusively for livestock products and is also essential for other parts of agriculture, for provision of many other social services and for overall rural development. What types of technologies are generated and who gets access to them depends, at least in part, on the financing mechanisms for technology development. Private sector-led technology development over the last two to three decades has driven technology developments that are highly scale-intensive to the exclusion of those that may be suited for smallholder production systems. For example, the private sector-led research in advanced breeding and feeding technology has spurred significant productivity gains in the broiler and pig subsectors but the same result has not been achieved with beef and meat from small ruminants. Similarly, in the dairy subsector, significant advances have been made in the breeds developed for temperate regions, but much work remains to be done to improve the performance of dairy breeds in tropical low-input environments. Technology development towards improving genetics and nutrition of ruminant animals in the tropical environment therefore must become another area for priority action.3 Overall, there has been a tendency to underinvest in livestock research and for that research to be concentrated in disease control and breeding at the expense of nutrition and management. Raising the profile of livestock research and reorienting its focus remains a major challenge. With rapid growth in all aspects of private sector research, it is also essential that synergies be developed between public and private sector research.
MARKETS AND VALUE CHAINSAn efficient value chain linking input and service provision to production to processing to distribution is essential for any sector or subsector of economy and the same is also true for the smallholder livestock sector. Indeed, the literature on smallholder market access in general has emphasized the challenges of efficient transaction making between smallholder producers and the upstream and downstream players in the value chains, over production-level constraints. However, there is some debate on the organization of an inclusive value chain to support smallholder livestock production, in particular public-private roles and the 3 In this context, a distinction should be made between technology development suited to local
conditions and introduction of technologies from disparate environments. For example, exclusive focus on productivity has in a number of countries resulted in the introduction of animal breeds that were poorly suited to the needs and constraints of poorer smallholder producers (Hoffman et al 2003).

101
size of enterprises. Massive investments may be required in setting up market infrastructure that can support smallholder producers. Some observers argue that the private sector will not come up with the type of investment needed for a major impact on growth and poverty. They point to the central role played by the public sector during the green revolution in Asia when governments took a proactive role in market development and providing policy support to absorb downside risks. Based on such experiences they insist on the public sector taking a more active, responsible and direct role in promoting (and perhaps also subsidizing) investment in smallholder livestock production. Others however argue that production conditions have altered substantially since the time of the green revolution. The world is now more integrated, rural infrastructure has considerably improved, the pace of technical change is much more rapid, supply chains transcend national boundaries, scale economies are a major determinant of competitiveness, farmers are now engaged in a myriad of other activities and market failures are of a different nature. Hence the roles of the public and private sectors have to be seen with a new lens. They further argue that we need a new model and in some cases this may not be a smallholder model.4 And wherever we need to promote smallholder producers, we must strategize and prioritize because there are hard budget constraints on public money that need to be respected. Smallholder livestock producers and other small entrepreneurs in the livestock product value chain also suffer from poor access to credit and high interest rates. This discourages investment in the sector and possibly creates a non-level playing field with large producers who can access low-cost capital from international capital markets. Further, livestock production and processing often require intermediate term credit, something the banks are generally unwilling to finance, particularly for small market actors with little collateral. In this context, microcredit schemes can help facilitate technology adoption, enterprise modernization and product quality improvements. There are also several other innovations in value-chain financing and making credit available to players who formerly had limited access, which create new opportunities for value-chain development. New information technology and market information tools are similarly creating new opportunities. The region has a myriad of market and value-chain arrangements ranging from rural village markets to traditional retail outlets to so called “wet” markets selling fresh livestock products to highly sophisticated and integrated supermarkets. The emergence of supermarkets and their impact on the production landscape has been a subject of intense policy debate in the region but the informal and traditional markets are usually left out of policy attention. According to some estimates, nearly 60 percent (and in many countries more than 80 percent) of consumers actually purchase animal source foods in live animal and informal markets and only occasionally consume processed or semi-processed products, some of which are also traditionally processed. These markets are often mediated by informal networks and are fraught with information asymmetries resulting in serious adverse selection and moral hazard issues. Finding ways to overcome some of these imperfections can potentially stimulate investment in these markets and value chains and unlock hitherto unexploited potential for small producers. In addition to improving the bargaining power of smallholders by exploiting scale economies and improved access 4 Indeed, some observers have argued that the continued focus on smallholders might actually be
hindering large-scale poverty reduction by trapping them into low productivity activities rather than equipping them with newer skills and moving them out of agriculture.

102
to information and technology, institutions such as producer cooperatives and member organizations can also be instrumental in overcoming some of these market imperfections and asymmetries. But this is unlikely to happen in the absence of explicit policy and investment support from governments in favour of producer organizations, provision of technical and business advisory services and maintaining a generally small enterprise-friendly business environment. This would also require strengthening of livestock services, reputation building through labelling or branding programmes and improving access to information with respect to pricing and product quality. Another peculiarity of the policy discussions is to equate the ‘private sector’ with large-scale industry. In reality however small-scale actors in Asian livestock markets control by far the largest market share in aggregate. In many cases small-scale private actors are regarded as ‘exploiters’ while the large-scale private actors are regarded as ‘investors’, even though they may be playing very similar roles in providing market access, credit, technical support, etc. Any pro-poor livestock policy needs to proactively engage with small-scale actors in terms of capacity development in terms of product handling for quality and safety, as well as business skills, adoption of standards, organization and collective action to upgrade value chains. The impact of tariff reduction and market liberalization processes on smallholder livestock producers continues to be heavily debated. While for exporting countries tariff reduction often means a larger market and a lower cost of doing business, the impact on local producers supplying local markets has been mixed at best.5 Differential impact on producers in trading countries usually arises from poor technical and institutional capacity, poor access to resources and other policy barriers including high compliance costs for product standards and competition from international competitors. These pressures have, in a number of cases, triggered an upscaling response from domestic corporate investors, but more often than not, this has happened at the cost of smallholder market access. Simultaneously however, informal markets and the demand for local fresh products that drive them have been demonstrated to provide some natural protection from livestock products imports and so to some extent shielded smallholder producers (Tisdell et al 2010)
TARGETING FARMERS THROUGH COLLECTIVE ACTION Various forms of collective action have long been a central mechanism for improving market access and productivity of smallholder producers.6 The advantages are generally known to be improved bargaining power, opportunity for more professional management, improved access to larger volume end markets and access to higher quality and more reliable inputs and services, including Business Development Services (BDS). At the more ambitious end, they may also provide a platform for knowledge management, joint learning, and innovation in both production and value addition. Finally, they may offer smallholders access to additional financial resources, (generally from public funds schemes which often see collectives as the main avenue for channeling resources to rural producers) and opportunities for new savings mechanisms.5 This is more so when trading partners are at different stages of technological and institutional
development. Beyond tariffs, the increasingly stringent food safety and health standards pose additional barriers, some of which are heavily contested.
6 Forms of collective action or Farmer Based Organisations (FBOs) variously include cooperatives, producer companies, farmer business associations, self-help groups, and many others.

103
Collective action however creates some new areas of risk for producers. These include some loss of control over assets and cash flow, and opportunities for fraud, corruption and theft when collectives acquire larger resources. Related risks are interference by politically-connected individuals or those with significant community authority. Leadership that is incompetent or uncommitted can create some of the same risks. Curiously, even though collectives are usually promoted to improve market access, they often create additional marketing costs and may lead to lower prices for producers. This is particularly true when collectives are competing primarily with traditional markets that incur lower processing and marketing costs. Finally, collectives that aggregate significant volumes of product may face marketing risks as the range of buyers who can reliably absorb that quantity may be very small, and may be limited to formal market players who often have a relatively small market share overall. Collectives that try to get around this problem by setting up their own marketing channels and infrastructure may very easily find themselves well outside their areas of comparative advantage and ability, creating additional risks to resources. In the livestock sector, as well as in others, the story of collective action is very mixed, with some strong successes, but many failures due to some of the factors mentioned above. The well-known Operation Flood approach was very successful in some states of India, but essentially failed in others. There seems little evidence that the much-heralded Producer Company concept in India has led to significant new group formation. Some successes may be seen elsewhere but these are mostly linked to the strong ties between buyers and producers. Some principles that seem to emerge from the livestock experience with collectives in Asia and elsewhere are: • Collectives should generally refrain from asset- and management-intensive
enterprises that may be difficult to manage sustainably. • Loyalty and farmer-ownership may not be enough to sustain participation;
sustainability is generally dependent on prices offered to farmers and transactions costs.
• New business-oriented models offer advantages including bounded owner-membership.
TARGETING FARMERS THROUGH INNOVATION PLATFORMS AND HUBSThe use of ‘Innovation Platforms’ (IPs) as mechanisms to stimulate and support multistakeholder collaboration has been gaining ground in agricultural research for development in the last few years. The terminology used is different in different contexts – ‘innovation networks’ or ‘stakeholder networks’ or ‘multistakeholder platforms’, reflecting the fact that they can been used for various functions. Described simply, an IP is a mechanism to enhance communication and innovation capacity among mutually dependent actors, by improving interactions, coordination and coherence among all actors to facilitate learning and contribute to production and use of knowledge (Lynam et al. 2010; Nederlof et al. 2011; Tenywa et al. 2011; Van Rooyen and Homann 2009). IPs are generally not designed to be sustainable over the long run, but rather to support short- to medium-term project-driven intervention. Having initially been used primarily to support innovation and technology uptake among farmers, IPs are now being used to address underlying institutional constraints to overcome market failures within the context of value chains. The aims of IPs are to improve

104
linkages of farmers to other value chain actors, including buyers; suppliers of inputs, services and knowledge; and public decision-makers and regulators. The ultimate goal is improving the innovation capacity of participants, in access and use of new technology, market development, negotiation and joint learning, and increased capacity to identify and interact positively and remuneratively with selected value chain actors.. Evidence suggests the need for credible independent brokers to facilitate IP processes (Anandajayasekeram and Gebremedhim 2010), and that IP facilitation involves significant transactions costs and project investment and thus unsustainable resources. Although some synthesis of lessons and best practices for IPs have been published recently (Nederlof et al. 2011), the jury is still out as to whether these project-based intervention mechanisms can effectively catalyse sustainable change and outcomes, either in improved market access, or improved productivity on farm. In order to improve sustainability, IPs can be coupled with some sort of collection ‘hub’ that aggregates producer outputs for marketing and which can form the sustainable component. A producer’s hub is generally formed around some collection point and infrastructure (the most obvious livestock example being a milk chilling plant), which forms a focal point around which service and input providers can organize their delivery of services. These would include veterinary services, artificial insemination or other breeding services, feed supply and also extension. Other innovative adaptations include financial services through village banks, microcredit schemes and BDS. The hubs can be owned and managed either through private sector investors, or through some form of collective such as a cooperative or farmer business group. Services may be provided to hub members by public agencies or private actors, or in some cases the hub members may choose to collectively develop their own capacity, such as to set up a collective feed and agrovet shop (thus in-house service provision). Some of the experiences of such hubs are similar to the collective action lessons. In cases where farmers themselves invest in hub infrastructure, there is need to handle issues of raising equity among farmers carefully – disclosure, transparency, consequences for benefits, ownership.The choice of in-house service provision versus outsourcing might involve trade-offs between control versus efficiency orsustainability, and would be determined by hub management capacity among other factors. While focusing on group organizational capacity and sustainability, it is important not to lose sight of producer performance.
TARGETING FARMERS THROUGH CONTRACT FARMINGIn many agricultural systems contract farming is now used as a mechanism for facilitating smallholders participating in higher value vertically-integrated markets. Some of the incentives driving the use of contract farming include: a) managing market risks for both producer and buyer by setting price and quantity expectations and ensuring reliable transactions; b) providing producers access to quality services and inputs; and c) managing disease risk and product quality for increasingly demanding higher-end markets. Noted successes of this approach are observed in many high-value crops, such as vegetables and cut flowers for export. In livestock systems successes are more difficult to identify, with the more visible examples in the poultry sector, particularly broilers, where batch

105
production, short production cycles and the need for close control of disease and feed quality all provide incentives for contract arrangements. In Southeast Asia contract farming approaches have been applied to pig production systems, where batch production and disease control create some of the same incentives. However, studies have shown some significant constraints. Lapar and Tioncgo. (2011) in a study of pig production under contract farming in Viet Nam found that contracting buyers required very large batches of animals and scale of production, and large investment by a producer in production and biosafety facilities. Additionally, economic analysis did not find any consistent higher returns to labour among contract farmers compared to smallholders. Overall, the study found that there were very large barriers to entry and that these enterprises were limited to large investors (most of whom were not actually farmers) so there were very limited opportunities in this approach for smallholders. In another study, Birthal et al. (2009) investigated contract farming among dairy producers in India. However, given that they were unable to identify contract dairy farmers outside of very large commercial producers, the study focused on cooperative farmers and those working with commissioned buyer agents of private sector processors, neither of which had any actual contract agreement with producers, but bought milk based on transparent quality standards and prices. The study found that these ‘contract farmers’ had higher profits in spite of receiving lower prices, most likely linked to greater reliability of the market, because no improvement in farm productivity was observed compared to other farmers. A key reason for the difficulty in identifying smallholder contract farming schemes in the dairy sector in particular, or in many other livestock systems besides poultry, is the issue of ‘leakage’, whereby the contracting buyer is unable to ensure that some of the output does not go to other buyers. Smallholders who produce only small volumes per day or per month and who typically operate in areas where traditional market agents are available to buy local production at the farm gate are often easily able to take their output to more remunerative buyers than the ‘contractor’. As a result, cooperatives and private processors often find that much of local surplus production is going through traditional market agents. Potential contract buyers thus have little incentive to invest in providing services or extension to increase productivity, simply because they cannot easily capture all the output. This “leakage” may be the most significant barrier to wider use of contract farming approaches in smallholder livestock systems.
TARGETING SMALL-SCALE MARKET ACTORS THROUGH BDSThe concept of ‘private sector’ when applied in an agricultural development context often necessarily implies large and modern/formal players, at least among decision-makers and donors. This assumption ignores the reality that small-scale or traditional agents often occupy by far the largest market share in livestock systems in developing countries, including in some of the fast-growing Asian economies. In some cases, they provide in an informal manner services such as credit, linkages to feed and other input providers, and even ad hoc extension advice on production. However, they are generally poorly equipped to provide some of these and rarely have access to any training or capacity building in some of these skills. Recent efforts have been made to use a BDS approach to develop

106
small-scale actors’ capacity to upgrade value chains, provide better services to clients and deliver higher quality/safer products to consumers. A BDS approach involves third party providers of services that contrast with typical development project approaches which pay NGOs or others to deliver services to clients, which typically end at project end (this is the second party approach). Instead a project pays a private sector service provider who in turns builds that service into a sustainable business. This requires a change in mind-set away from the ‘evil intermediaries’ view of small-scale market actors and instead a recognition of the role they play. In Northeast India such an approach is being applied to small milk market agents through a training and certification programme, which has garnered strong support from local governments (Puskur et al 2011).
POLITICAL ECONOMY OF POLICY-MAKINGGood economics is only one of the many inputs in national policy-making processes. The process of policy-making is influenced heavily by political self-interests and structures, cultural values and people’s belief systems in specific national and subnational contexts. While the science that deals with economics of good policies and design of policy instruments is rather well advanced, understanding of political processes and instruments for influencing policies in favour of pro-poor outcomes remains limited. Enhanced understanding of the political economy of policy-making through empirical testable theories is critical for improving understanding of the political and technocratic space for engagement in the policy processes. The challenge really is to strengthen the triangle of leadership/institutions and the policy environment and to sensitize policy-makers at very high levels of the potential smallholder livestock keepers can play in national progress and the constraints they face in realizing that potential.
REFERENCESAnandajayasekeram, P. and Gebremedhin, B. 2010. “Integrating innovation systems
perspective and value chain analysis in agricultural research for development.” ILRI Research Report. Nairobi: ILRI.
Birthal, PS, AK Jha, Marites M. Tiongco and Clare Narrod. 2009. Farm-level impacts of vertical coordination of the food supply chain: Evidence from contract farming of milk in India. Indian Journal of Agricultural Economics, 64(3).
Food and Agriculture Organization of the United Nations (FAO). 2012. Livestock sector development for poverty reduction: an economic and policy perspective—livestock’s many virtues. By J. Otte, A Costales, J. Dijkman, U Pica Ciamarra, T. Robinson, V. Ahuja, C. Ly & D. Roland-Holst. Rome, FAO. pp. 161.
Hoffman, D., P. Riethmuller, and D. Steane. 2003. Some issues associated with the livestock industries of the developing countries of Asia: Opening Pandora’s Box. J. Food Agric. Environ.1(3&4):148–154.
Lapar MLA and Tiongco MM. 2011. Private standards in pork value chains: Role, impact and potential for local innovation to improve food safety and enhance smallholder competitiveness. Farm Policy Journal 8(3): 39-53.

107
Lipton, M. 2005. From policy aims and small farm characteristics to farm science needs. In The future of small farms: Proceedings of a research workshop, Wye, UK, June 26–29, 2005. Washington, DC: International Food Policy Research Institute. http://www.ifpri.org/events/seminars/2005/smallfarms/sfproc.asp.
Lynam, J.K., Harmsen, K. & Sachdeva, P. 2010. Report of the Second External Review of the Sub-Saharan Africa Challenge Program (SSA-CP). CGIAR Independent Science Partnership Council.
Mellor, John W. 1976. The New Economics of Growth, Cornell University Press, Ithaca, N.Y.
Mellor, John W. 2004. Agricultural Growth and Poverty Reduction: The Rapidly Increasing Role of Smallholder Livestock, in Ahuja, Vinod (Editor). 2004. Livestock and Livelihoods: Challenges and Opportunities for Asia in the Emerging Market Environment, National Dairy Development Board of India and FAO of the United Nations. 372p
Nederlof, S., Wongtschowski, M. & van der Lee, F. eds. 2011. Putting heads together: agricultural innovation platforms in practice. Bulletin 396, KIT publishers.
Puskur, R, Baker, D., Omore, A., and Staal, S. 2011. Changing approaches to pro-poor livestockmarket development:Innovation and upgrading in the value chain. ILRI Issue Brief. Nov. 2011.
Tenywa, M.M., Rao, K.P.C., Tukahirwa, J.B., Buruchara, R., Adekunle, A,A., Mugabe, J., Wanjiku, C., Mutabazi, S., Fungo, B., Kashaija, N.I.M., Pali, P., Mapatano, S., Ngaboyisonga, C., Farrow, A., Njuki, J. & Abenakyo, A. 2011. Agricultural innovation platform as a tool for development oriented research: lessons and challenges in the formation and operationalization. Learning Public Journal of Agriculture and Environmental Studies, 2(1): 117-146.
Tisdell, C. L. Lapar, S. Staal and N. N. Que. 2010 Natural protection from international competition in the livestock industry: Analysis, examples and Vietnam’s pork market as a case. In Agricultural Economics: New Research, Edited by Tomas H. Lee. 2010 Nova Science Publishers, Inc., Chapter 7.
van Rooyen, A. & Homann-Kee Tui, S. 2009. Promoting goat market and technology development in semiarid Zimbabwe for food security and income growth. Tropical and Subtropical Agroecosystems, 11: 1-5.

108
Livestock resources and environmental issues in AsiaBenjamin Henderson and Henning Steinfeld*
Asia has experienced dramatic increases in the production and consumption of livestock products in recent decades. As shown in Table 1, the production of milk and meat in East Asia proceeded at a faster pace for both meat and milk compared with other Asian regions, and compared to developing countries as a whole, between 1991 and 2007. South Asia has also experienced fast growth in the production and consumption of dairy products over this period. The rapid rate of growth for meat and dairy products in East Asia is attributable mainly to China, which has had the fastest growth in the production and consumption of all major livestock products, due mainly to very rapid per capita income growth and associated diversification away from food staples towards animal products (Pingali and McCullough 2010).
Table 1. Growth in production/consumption of meat and milk in Asia and developing countries
* Benjamin Henderson, Livestock Policy Officer, FAO Rome. Henning Steinfeld, Chief, Livestock Information and Policy Branch, FAO Rome
Production Consumption
Meat Milk Meat Milk
1991-2007
2005/2007-2030
1991-2007
2005/2007-2030
1991-2007
2005/2007-2030
1991-2007
2005/2007-2030
Developing countries 4.2 2.1 1.6 1.3 4.1 2.2 3.9 2.1
East Asia 4.5 1.9 9.5 2.2 4.7 1.9 7.9 2.2
South Asia 1.6 4.4 4.1 2.3 1.2 4.5 4.1 2.3
Southeast Asia 4.7 2.6 5.4 4.7 n.a. n.a. n.a. n.a.
Source: Adapted from data used in FAO (2011a).
Growth in the production and consumption of both meat and milk is projected to slow quite considerably in East Asia from 2005/2007 to 2030, due to a combination of slower population growth and already quite high per capita consumption rates in places such as China, which increased from 14 kg/year in the early 1970s to 52 kg presently (FAO 2011a). While milk production and consumption is also projected to decline in South Asia, an acceleration in meat production and consumption could occur mainly due to the region’s continued participation in the global upsurge in poultry production (FAO 2011a). As shown
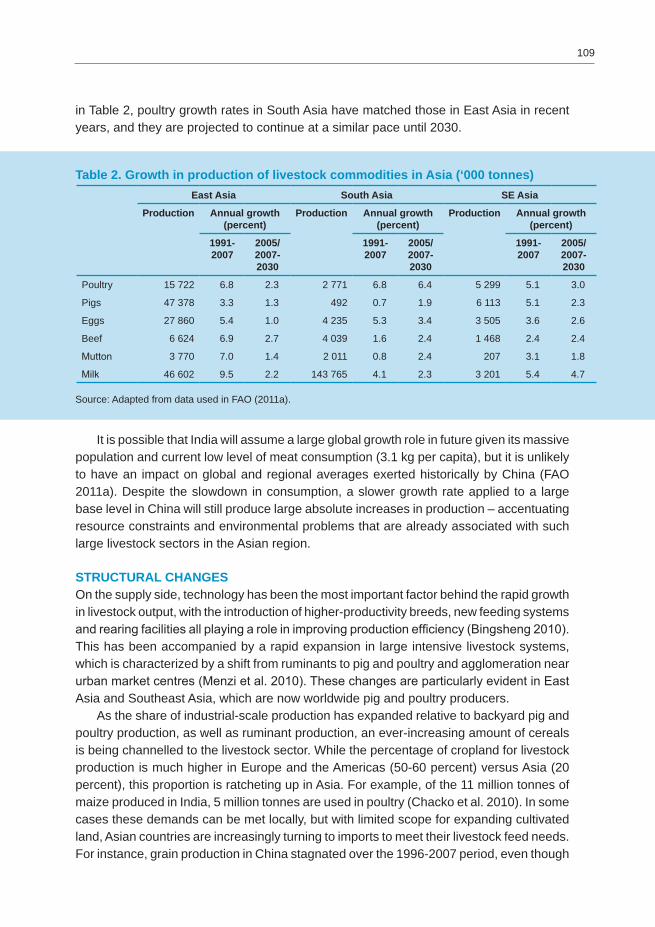
109
in Table 2, poultry growth rates in South Asia have matched those in East Asia in recent years, and they are projected to continue at a similar pace until 2030.
Table 2. Growth in production of livestock commodities in Asia (‘000 tonnes)East Asia South Asia SE Asia
Production Annual growth (percent)
Production Annual growth (percent)
Production Annual growth (percent)
1991-2007
2005/2007-2030
1991-2007
2005/2007-2030
1991-2007
2005/2007-2030
Poultry 15 722 6.8 2.3 2 771 6.8 6.4 5 299 5.1 3.0
Pigs 47 378 3.3 1.3 492 0.7 1.9 6 113 5.1 2.3
Eggs 27 860 5.4 1.0 4 235 5.3 3.4 3 505 3.6 2.6
Beef 6 624 6.9 2.7 4 039 1.6 2.4 1 468 2.4 2.4
Mutton 3 770 7.0 1.4 2 011 0.8 2.4 207 3.1 1.8
Milk 46 602 9.5 2.2 143 765 4.1 2.3 3 201 5.4 4.7
Source: Adapted from data used in FAO (2011a).
It is possible that India will assume a large global growth role in future given its massive population and current low level of meat consumption (3.1 kg per capita), but it is unlikely to have an impact on global and regional averages exerted historically by China (FAO 2011a). Despite the slowdown in consumption, a slower growth rate applied to a large base level in China will still produce large absolute increases in production – accentuating resource constraints and environmental problems that are already associated with such large livestock sectors in the Asian region.
STRUCTURAL CHANGESOn the supply side, technology has been the most important factor behind the rapid growth in livestock output, with the introduction of higher-productivity breeds, new feeding systems and rearing facilities all playing a role in improving production efficiency (Bingsheng 2010). This has been accompanied by a rapid expansion in large intensive livestock systems, which is characterized by a shift from ruminants to pig and poultry and agglomeration near urban market centres (Menzi et al. 2010). These changes are particularly evident in East Asia and Southeast Asia, which are now worldwide pig and poultry producers. As the share of industrial-scale production has expanded relative to backyard pig and poultry production, as well as ruminant production, an ever-increasing amount of cereals is being channelled to the livestock sector. While the percentage of cropland for livestock production is much higher in Europe and the Americas (50-60 percent) versus Asia (20 percent), this proportion is ratcheting up in Asia. For example, of the 11 million tonnes of maize produced in India, 5 million tonnes are used in poultry (Chacko et al. 2010). In some cases these demands can be met locally, but with limited scope for expanding cultivated land, Asian countries are increasingly turning to imports to meet their livestock feed needs. For instance, grain production in China stagnated over the 1996-2007 period, even though

110
meat production increased by 50 percent. This growth was partly accommodated through gains in feed conversion efficiency, but also through a dramatic increase in import of feed commodities, soybeans in particular. Chinese imports as a share of global soybean exports, increased from just 1 percent in 1995 to 42 percent by 1995 (Bingsheng 2010).
NATURAL RESOURCE AND ENVIRONMENTAL ISSUESOne of the consequences of historical and recent rapid growth of livestock consumption and production is the emergence and intensification of natural resource issues and environmental degradation in the Asian region. These constraints include falling availability of both the amount and the quality of land and water resources, due to the use and degradation of these resources by both agriculture and competing sectors. A significant share of the increased land requirements is driven by rapid growth in livestock production, as between five to ten times more cultivated land is required for livestock products compared to food crops in terms of food energy content (Fischer et al. 2010). Further, livestock production requires much more water than crops, with milk and meat needing 10-50 times more water than crop production to produce the same nutritional output, especially when based on intensive grain feed and irrigated forage (Chacko et al. 2010). Further, as will be discussed later, livestock production is a significant and growing source of nitrogen and phosphorus pollution, range degradation and greenhouse gases.
NATURAL RESOURCE ISSUES
Land scarcityThe per capita availability of land by different land-use classes (Table 3) is a useful indicator of land scarcity. As shown in Table 3, there is very little per capita land available in the Asian region compared to the world average. This land scarcity is particularly acute for cultivated land in East Asia and South Asia and, under such conditions the further decline in per capita availability that is projected in each Asian region by 2050 will further exacerbate environmental and development objectives.
Table 3. Per capita land by major land cover types for 2000/2050 populations(hectares/person)
Type of land Year East Asia South Asia SE Asia World
Cultivated land 2000 0.10 0.16 0.19 0.25
2050 0.09 0.09 0.13 0.17
Grassland/woodland 2000 0.26 0.08 0.21 0.75
2050 0.24 0.05 0.15 0.50
Forest land 2000 0.15 0.06 0.41 0.61
2050 0.14 0.03 0.27 0.41
Sparse veg. & barren land 2000 0.24 0.13 - 0.49
2050 0.22 0.08 - 0.33
Total land 2000 0.75 0.43 0.81 2.10
2050 0.69 0.25 0.55 1.41
Source: Adapted from Fischer et al. (2010).

111
While land scarcity among different land uses is high and increasing in Asia, the capacity of the land base to meet the large forecast demands for livestock commodities is heterogeneous across the region. In Table 4 the suitability of land for the production rainfed crops is presented by land cover class. One-third or more of the cultivated land is already considered to be marginal in East Asia and South Asia (the latter region having an unusually high area of cultivated land compared to other regions in Asia and the world) and only a limited share of unprotected grassland/woodland and forest land areas are considered to be of prime or good quality in these regions. The prospects are somewhat brighter in Southeast Asia where there are greater shares of unprotected grassland/woodland and forest land areas that are suitable for crop production (Table 3). However, the conversion of these areas into cultivation for feed or food can lead to losses of biodiversity, ecosystem services and a significant release of greenhouse gases.
Table 4. Land suitability for rainfed crops by cover classLand type East Asia South Asia SE Asia World
Cultivated land
Total Million hectares
151 229 97 1 559
Prime GoodMarginal %
17 25 28 28
48 42 55 52
35 33 17 19
Unprotected grassland/ woodland
Total Million hectares
386 118 111 4 612
Prime GoodMarginal %
2 3 13 8
17 12 18 24
81 85 69 68
Unprotected forest land
Total Million hectares
224 83 210 3 736
Prime GoodMarginal %
7 10 16 12
15 19 17 31
78 72 67 57
Source: Adapted from Fischer et al. (2010).
Livestock growth is expected to continue to place pressures on these land resources, as feed deficits continue to grow in the region. For example, it is estimated that there was a deficit in terms of animal feed requirements and actual consumption by animals in India in 2002-2003 of 157 million tonnes of green fodder, 44 million tonnes of dry fodder and 25 million tonnes of concentrates. This deficit is anticipated to worsen as a consequence of increase competition for land (Chacko et al. 2010).
Water scarcityWhile large gains in land productivity in crop and livestock production have been delivered through productivity improvements, much of the gains have been possible due to more intensive application of non-land inputs, such as irrigated water and inorganic fertilizers,

112
to land (i.e. a substitution of non-land inputs for land). Globally, all of the net increase in cultivated land area can be attributed to increases in the area of irrigated land (FAO 2011b). Agriculture is a significant user of water resources, accounting for 70 percent of withdrawals globally. In Southeast Asia and Southern Asia in particular, agriculture accounts for a substantially larger share of total withdrawals (Table 5). However, prospects for irrigation development are constrained by the faster growing demands for water in other uses as developing countries continue to industrialize (Fischer et al. 2010).
Table 5. Water withdrawal by major water-use sectors (2003)Water withdrawal Unit East Asia South Asia SE Asia World
Municipalkm3/yr 93 70 23 429
% 14 7 7 11
Industrialkm3/yr 150 20 30 723
% 22 2 9 19
Agricultural km3/yr 434 914 287 2 710
% 64 91 84 70
Total km3/yr 677 1 004 340 3 856
% 20 57 17 9
Source: Adapted from FAO (2011b).
As shown in Table 6 the area equipped for irrigation across Asia has increased substantially, with gains of 96, 134 and 160 percent for East Asia, South Asia and Southeast Asia, respectively, with similarly large gains in irrigated land as a percentage of cultivated land. Further, as surface water sources have become depleted, the share of irrigated water from groundwater sources has grown steadily since 1961. Much of these increases in withdrawals is attributed to expanding livestock production, particularly because livestock is a much more inefficient user of water than crop production. For instance there has been a strong increase in livestock populations and areas of fodder crops in irrigated areas of Asia for milk production (de Haan 2010).
Table 6. Area equipped for irrigation in Asia and the worldEast Asia South Asia SE Asia World
Equipped area (million ha)
1961 34.5 36.3 8.0 139.0
2006 67.6 85.1 20.8 300.9
2050 76.2 85.6 23.9 318.4
As % of cultivated land1961 29.7 19.1 11.7 10.2
2006 51.0 41.7 22.5 19.7
Of which groundwater (2006)
Million hectares 19.3 48.3 1.0 112.9
equipped % of irrigated land 28.6 56.7 4.7 37.5
Source: Adapted from FAO (2011b).

113
It is estimated that withdrawals rates that exceed 20 percent of renewable water resources put substantial pressure on water resources, and rates that exceed 40 percent are critical, causing serious adverse effects on ecosystem functions. As shown in Table 7, irrigation withdrawals in South Asia account for more than half of renewable water resources, because large areas of cultivated land have reached or expanded beyond their potential. Overall figures give an overly optimistic impression for other regions in Asia (FAO 2011b). For example, on average China’s extraction rates are below these critical thresholds, however, there are areas in the North China Plain with excessive extraction rates. In addition to water scarcity, soil and water salinity problems have been reported in association with large irrigation schemes in Pakistan, China and India.
Table 7 Annual long-term average renewable water resources and irrigation water withdrawal
Eastern Asia South Asia SE Asia World
Precipitation (mm) 634 1 602 2 400 809
Renewable water res. (km3) 3 410 1 766 6 490 43 022
Water-use efficiency (%) 37 55 19 44
Irrigation water use (km3) 434 914 287 2 710
Pressure on water resources from irrigation (%) 13 52 4 6
Source: Adapted from FAO (2011b).
Fertilizer use and yieldsIn addition to the use of irrigation water extractions, fertilizer use has also intensified as yields on ever scarcer land resources struggle to meet the growing demands from livestock and humans for cultivated crop outputs. As shown in Figure 1, fertilizer application rates across the world are closely linked with yields. What is striking about this figure are the extremely high rates of fertilizer application rates applied in China, which have recently exceeded the rates of all other world regions, allowing East Asia to obtain yields that are comparable or higher than most developed regions.

114
Figure 1. Regional differences in fertilizer use and cereal yieldsSource: Fischer et al. (2010).
NUTRIENT LOADINGAs discussed, much of the massive increase in livestock production in the Asian region has been accompanied by land intensification and geographical clustering of pig, poultry and dairy sector operations (de Haan 2010). These structural changes, which have been particularly rapid in large parts of Asia, have also been accompanied by a shift from litter-based to slurry-based systems, and a decline in effective manure management as livestock production has become increasingly less integrated with crop production (Menzi et al. 2010). The threats from industrial dairy and piggery operations pose more serious threats than poultry, because manure from the former are handled in liquid form and can therefore enter waterbodies more easily(Chacko et al. 2010). The geographic concentration of intensive production units and their disconnection of the land base, result in nutrient waste outputs surpassing the nutritive requirements and assimilative capacity of local surrounding land. Thus livestock waste must either undergo treatment to remove surplus nutrients, be transported elsewhere, or, more commonly, discharged to other areas (Menzi et al. 2010). Poor manure management and its resultant discharge to the environment has serious consequences including: water pollution; eutrophication of surface water, groundwater and coastal marine ecosystems; emissions of ammonia, methane and nitrous oxide; and soil pollution through accumulation of heavy metals. These impacts in turn lead to impaired human health and loss of biodiversity, climate change, acidification and ecosystem degradation (Menzi et al. 2010). From a global perspective, these environmental risks associated with intensive livestock production are greatest in East and Southeast Asia because of current high concentration of animals, the rapid expansion of intensive monogastric production and a general lack of well-enforced regulatory safeguards, along with limited public awareness of environmental impacts and the absence of a tradition of recycling liquid manure to crops (Menzi et al. 2010). Indeed, waste from industrial piggery operations is the primary source of nutrient loading affecting waterways in China, Thailand and Viet Nam, contributing from 14 to 72
0 0.5
1.5
2.5
3.5
4.5
5.5
1999-20012004-2006Yield 1999-2001Yield 2004-2006
6.5
7.5
50
100
200
250
300
150
Ferti
lizer
use
per
har
vest
ed a
rea (kg/Ha)
Cer
eal Y
ield
(t/H
a)
Northe
rn Ameri
ca
Easter
n Euro
pe
Northe
rn Euro
pe
Southe
rn Euro
pe
Wester
n Euro
pe
Carribe
an
Centra
l Ameri
ca
South
America
Austra
lia &
N Zea
land
Melane
sia
Easter
n Afric
a
Middle
Africa
Northe
rn Afric
a
Southe
rn Afric
a
Wester
n Afric
a
South-
Easter
n Asia
Southe
rn Asia
Easter
n Asia
Centra
l Asia
Wester
n Asia

115
percent of nitrogen and 61 to 94 percent of phosphorus accumulations (Reid et al. 2010). Moreover, with increasing reliance on imported feedstuffs, the disruption of nutrient cycles, which typifies these production systems, is increasingly shifting from local to national and global scales, as the recycling of nutrients becomes ever more challenging for industrial operations with little land. These problems are particularly acute in China, which as shown above, already has very high rates of fertilizer application, especially in its eastern provinces. As shown in Figure 2, the total nitrogen load, including nitrogen from manure and fertilizer sources, exceeds 400 kg/ha in many provinces located in the eastern part of the country (Bingsheng 2010). The significant feed requirements of increasingly prevalent industrial livestock production systems exert additional pressures on cultivated land, which is increasingly dependent on huge importation of fertilizers to boost cereal production. Indeed half of fertilizer nitrogen that is traded globally is now used to produce feed for intensive animal production systems (Galloway et al. 2010). Consequently, livestock is not only responsible for environmental impacts associated with the direct discharge of urine and manure, but also indirectly through nitrates, pesticides and other chemicals used on croplands that run off into waterways (Reid et al. 2010).
Figure 2. Nirtogen load from livestock manure and chemical fertilizer in China, kg/ha cropland, 2005Source: Bingsheng (2010).
GREENHOUSE GAS (GHG) EMISSIONS Livestock production is the world’s largest source of methane (CH4) emissions and is also responsible for release of significant nitrous oxide (N2O) and carbon dioxide (CO2) emissions. The GHG contributions vary considerably between livestock systems and regions according to animal physiology, agroclimatic conditions, quality of feed resources,
kg/ha412 to 457 (5)323 to 412 (7)237 to 323 (6)149 to 237 (5)49 to 149 (7)

116
manure management practices and degree of intensification. Asian livestock is estimated to emit about one-third of all livestock GHGs globally, more GHGs than any other region in the world (Reid et al. 2010). Enteric CH4 emissions among all ruminants are closely related to the feed regime, particularly feed quantity and quality, and ultimately the productivity of the production system. The fraction of feed converted to CH4 emissions generally decreases as both the amount of feed intake and the feed quality increases (US EPA 2006a). Manure handling and storage are significant sources of both CH4 and N2O emissions. CH4 emissions are generated by the decomposition of manure under anaerobic conditions and the quantity of emissions depends on the type of treatment or storage facility, the composition of the manure and ambient climate (US EPA 2006b). Pig and dairy enterprises can be significant emission sources due to their handling and storage of manure in liquid/slurry systems. N2O, however, is derived from the microbial transformation of nitrogen in manure deposited on soils by grazing livestock or application on soils for the production of feed (Steinfeld et al. 2006). Agricultural CO2 emissions are mainly derived indirectly from land use, land-use change and forestry, due to forest clearing for pasture and feed crops and from rangeland degradation. Approximately 20 percent growth in both enteric and manure emissions occurred between 2005 and 2020, with falling contributions from Organisation for Economic Co-operation and Development (OECD) and non-EU Eastern European countries; this was more than offset by significant emission increases in China, Latin America, Africa, South Asia, Southeast Asia and the Near East (Smith et al. 2007). As shown in Figure 3, there is a robust relationship between GHG emission intensity (including all GHG emissions along the dairy food chain) and milk yields in the dairy sector, globally. Within Asia, highly productive countries in East Asia and Southeast Asia, including Japan, Thailand and China perform well globally with respect to their emission intensities.
GRASSLAND DEGRADATIONIn 2009, China and Mongolia combined had more than 500 million ha of grasslands, comprising 15 percent of the world’s and 84 percent of Asia’s (excluding central and west Asia) grasslands (FAOSTAT 2012). Two-thirds of the Asian region’s grassland area is found in China alone, which has around 40 percent of its total land devoted to grasslands. Institutional and regulatory weakness often lead to management practices that promote overgrazing, consequently a large share of the region’s grazing lands are suffering from degradation. Overgrazing reduces vegetation cover, exposing soils to water and wind erosion, which decreases their capacity to retain moisture and thus contributes to declining vegetation yields. This process of degradation oxidizes soil carbon, contributing to atmospheric CO2 emissions. An estimated 50 percent of northern China’s grasslands were degraded to different degrees between the 1960s and 1990s (Li 1997). Further, overgrazing and conversion of grassland to cropland have caused a loss of 30-35 percent of total grassland soil organic carbon in China (Wang et al. 2011). Problems of overgrazing are particularly acute in the Inner Mongolia region where numbers of small ruminants have more than doubled in the past two decades, from around 25 million head in 1985 to over 56 million head in 2006, and in Tibet Autonomous Region of China, where the numbers of yaks increased from 5.4 million to 6.3 million from 1995 to 2005 (Bingsheng 2010).

117
Figure 3. Relationship between milk yield and GHG emission intensity per unit of fat and protein-corrected milkSource: FAO (2010).
SOLUTIONS AND RESPONSEWhile the precise management and policy solutions to the environmental issues outlined must obviously be tailored to regional and local situations and contexts, they can be generalized into three broad thematic areas including measures that: 1) improve the efficiency with which natural resources are used in the livestock production process; 2) restore degraded grasslands; and 3) reduce manure discharges from intensive animal production systems.
Improved natural resource-use efficiencyAs discussed earlier, the transfer and adoption of technology have been instrumental in raising both animal yields and crop yields over the past few decades, allowing the extraction of larger quantities of animal protein from an increasingly constrained agricultural land base in the Asian region. However, many of these improvements have been made possible through substitution by artificial inputs such as fertilizers, which may result in the replacement of one natural resource constraint with another (e.g. scarcities of rock phosphate, fossil fuels, clean water and biodiversity). However, as demonstrated by the inverse relationship with milk yields and emission intensities, intensification of the relatively unproductive traditional dairy production systems found in less developed parts of the Asian region, may provide a potential avenue for large GHG mitigation gains. Where access to markets and capital are sufficient, this can be progressed through the application of science and advanced technology in feeding and nutrition, genetics, reproduction and animal health control, to improve feed conversion efficiency (Ugalde et al. 2008). Nevertheless, the pursuit of improved yields and other conventional measures of productivity will not be sufficient to raise the efficiency of many natural resources which,
0
0 1,000 2,000 3,000 4,000 5,000 6,000 7,000 8,000 9,000 10,000
2
4
6
8
10
12
14
Productivity (kg/cow/year)
China
Mongolia
Japan
Thailand
India
Pakistan
Netherlands
Kg
CO
2-eq
./kgF
PCM

118
due to market and regulatory failures, do not enter the profit-maximizing calculus of most livestock producers. For example, as shown by Hoang and Coelli (2009) in a study on OECD agriculture, a number of countries (Australia, United States, Canada, Portugal) increased their total factor productivity between 1990 and 2003, but reduced their nutrient-use efficiency at the same time. Nevertheless, the prevalence and persistence of large gaps in efficiency with which resources are used by livestock producers indicate that, if backstopped by appropriate resource pricing and regulatory incentives, the transfer of technology and knowledge from the region’s most to least efficient producers could allow the sector to reap a ‘double dividend’ by simultaneously enhancing producer profits and environmental outcomes.
Grassland restorationAs discussed grassland degradation is a source of CO2 emissions and biodiversity loss. It also reduces long-term productivity and economic returns, and reduces the capacity of landholders to adapt to climate change. Grassland restoration and enhancement have the potential to address each of these issues and thus deliver mitigation, adaptation and producer (livelihood) benefits. Further, given the significant potential for grassland restoration and enhancement to sequester carbon, there is great potential to support these actions with mitigation finance accessed through carbon markets. As discussed in Wang et al. (2011), techniques for reversing soil organic carbon losses, such as the management of grazing intensities (Conant and Paustian 2002) and measures that raise the primary productivity of grasslands (and therefore plant litter returns to soil) such as the introduction of improved pastures (Conant 2010) are well understood and therefore rapidly deployable strategies. Wang et al. (2011) estimate that improved grazing and conversion of cropland to cultivated pasture would sequester 0.24 Pg C/year equivalent to 16 percent of fossil CO2 emissions in China in 2006, which is larger than the sequestration potential of no-till and residue management (0.025-0.037 Pg C/year) and larger than the 0.165 Pg C/year potential identified for the technical sequestration potential of afforestation in China. However, presently, this vast potential remains untapped, mainly due to the absence of (1) carbon accounting methodology that is affordable but sufficiently accurate to support credit creation and trade in carbon markets and (2) an international programme (e.g. UN REDD, for forestry) to overcome these and other barriers and to coordinate R&D and implementation.
Reduced discharge from intensive animal production systemsTechnical options exist to recover nutrients and energy from manure, but the economics of their adoption vary greatly with production systems and access to land, from net costs to net benefits. A big obstacle is that many parts of the Asia-Pacific region’s manure is treated as waste rather than as a valuable source of crop nutrients. Consequently, only a fraction of excreted nutrients is managed properly in the region (Menzi et al. 2010). Further, regulatory options are also well understood such as: restriction zones around sensitive areas; the application of waste discharge standards; the application of economic incentives for proper waste management; and the training of owners/employees on proper waste management. Within the region these options are either absent or poorly enforced.

119
For example, due to lack of location restrictions half of the pig farms in Jianxi Province, China, were found to be located less than a kilometre from residential areas (Bingsheng 2010). Further, government standards for waste emissions from livestock farms along with emission tax instruments were introduced in China in 2003, however, as yet these standards have not been enforced and neither have any waste disposal fees been collected (Bingsheng 2010). Given these obstacles a reduced discharge programme may be more effective if it were driven by the private sector through voluntary commitments, but supported by public policies. To lower adoption costs, policies need to ensure that livestock densities within any particular area are kept within the absorptive capacity of available land. Further, there is a need to better understand the reasons for industry agglomeration and the policy tools which can balance geographic distribution. Technical and policy guidelines need to be developed, technologies transferred and capacities developed.
REFERENCESBingsheng, K. 2010. China: the East-West dichotomy. In P. Gerber et al., eds. Livestock
in a changing landscape: experiences and regional perspectives, volume 2, p. 55 Island Press.
Chacko, C. et al. 2010. India: growth, efficiency gains, and social concerns. In P. Gerber et al., eds. Livestock in a changing landscape: experiences and regional perspectives, volume 2, p. 96. Island Press.
Conant, R. & Paustian, K. 2002. Potential soil carbon sequestration in overgrazed grassland ecosystems. Global Biogeochemical Cycles, 1143.
Conant, R. 2010. Challenges and opportunities for carbon sequestration in grassland systems: A technical report on grassland management and climate change mitigation. Integrated Crop Management Vol. 9. Prepared for the Plant Production and Protection Division, FAO.
de Haan, C., Gerber, P. & Opio, C. 2010. Structural change in the livestock sector. In H. Steinfeld et al., eds. Livestock in a changing landscape: drivers, consequences, and responses, volume 1, p. 35. Island Press.
Food and Agriculture Organization of the United Nations (FAO). 2010. Greenhouse gas emissions from the dairy sector: a life cycle analysis. Unpublished FAO report; 2010.
FAO. 2011a. Looking ahead in world food and agriculture: perspectives to 2050. Rome, FAO.
FAO. 2011b. The state of the world’s land and water resources for food and agriculture: managing systems at risk. Rome, FAO.
FAOSTAT. 2012. http://faostat.fao.org/, accessed 7 August 2012.Fischer, G., Hizsnik E., Prieler S. & Wiberg, D. 2010. Scarcity and abundance of land
resources: competing uses and the shrinking resource base. SOLAW Background Thematic Report – TR02, FAO, 2010.
Galloway, J., Dentener, F., Burke, M., Dumont, E., Bouwman, A., Kohn, R., Mooney, H., Seitzinger, S. & Kroeze, C. 2010. The impact of animal production systems on the nitrogen cycle. In H. Steinfeld et al., eds. Livestock in a changing landscape: drivers, consequences, and responses, volume 1, p. 83. Island Press.

120
Huang, V-N, & Coelli, T. 2009. Measurement of agricultural total factor productivity growth incorporating environmental factors: a nutrients balance approach. Centre for Efficiency and Productivity Analysis, working paper series No. WP03/2009, University of Queensland, Australia.
Li, B. 1997. Degradation of northern temperate grasslands and protection strategies in China. Agric. Sci. China, 30: 1-10.
Menzi, H., Oenema, O., Burton, C., Shipin, O., Gerber, P., Robinson, T. & Franceschini G. 2010. Impacts of intensive livestock production and manure management. In H. Steinfeld et al., eds. Livestock in a changing landscape: drivers, consequences, and responses, volume 1, p. 139. Island Press.
Pingali, P. & McCullough, E. 2010. Drivers of change in global agriculture and livestock systems. In H. Steinfeld et al., eds. Livestock in a changing landscape: drivers, consequences, and responses, volume 1, p. 5. Island Press.
Reid, R., Bedelian, C., Said, M., Kruska, R., Mauricio, R., Castel, V., Olson, J. & Thornton, P. 2010. Global livestock impacts on biodiversity. In H. Steinfeld et al., eds. Livestock in a changing landscape: drivers, consequences, and responses, volume 1, p. 111. Island Press.
Smith, P., Martino, D., Cai, Z., Gwary, D., Janzen, H., Kumar, P., McCarl, B., Ogle, S., O’Mara, F., Rice, C., Scholes, B. & Sirotenko, O. 2007. Agriculture. In B. Metz et al., eds. Climate change 2007: mitigation. Contribution of Working Group III to the Fourth Assessment Report of the Intergovernmental Panel on Climate Change. Cambridge, United Kingdom and New York, NY, USA, Cambridge University Press.
Steinfeld, H., Gerber, P., Wassenaar, T., Castel, V., Rosales, M. & De Haan, C. 2006. Livestock’s long shadow: environmental issues and options. Rome, FAO.
Ugalde, D, van Vliet, J., McGregor, A. & Slattery, B. 2008. Policy options to manage greenhouse gas emissions from the livestock sector: an Australian perspective. Australian Journal of Experimental Agriculture (Greenhouse Gases and Animal Agriculture) 2008, 48: vii-xii.
United States Environmental Protection Agency (US EPA). 2006a. Global mitigation of non-CO2 greenhouse gases. EPA 430-R-06-005. Washington DC, US EPA.
US EPA. 2006b. Global anthropogenic non-CO2 greenhouse gas emissions: 1990–2020. EPA 430-R-06-003. Washington DC, US EPA. 2006.
Wang, S., Wilkes, A., Zhang, Z., Chang, X., Lang, R., Wang, Y. & Niu, H. 2011. Management and land use change effects on soil carbon in northern China’s grasslands: a synthesis. Agriculture, Ecosystems and Environment, 142: 329-340.

121
Human health risks from the human-animal interface in AsiaJoachim Otte and Delia Grace*
By 2050 global human population will be 50 percent greater than in 2000 (Table 1) with a 2.4 times higher per capita income. Growing populations and rising living standards in developing countries are fuelled by increasing consumption of food, particularly of higher value food items such as fruit, vegetables and animal source food (meat, milk, eggs and fish). Asia, with more than half of the world’s population and its high growth in disposable incomes (average incomes have grown three- and five-fold between 1990 and 2008 in India and China respectively) takes a central position in shaping global development of the agrifood sector.
Table 1. Human populations in Asian subregions, 1990 to 2050 (in thousands)Region Population 1990 2000 2010 2030 2050
South Asia Total 1 195 985 1 460 200 1 704 146 2 141 801 2 393 885
Rural 879 375 1 037 150 1 164 215 1 252 262 1 064 340
Urban 316 614 423 052 539 932 889 540 1 329 544
East Asia Total 1 359 149 1 495 281 1 573 970 1 625 464 1 511 963
Rural 922 977 892 840 784 738 587 970 385 733
Urban 436 172 602 440 789 231 1 037 492 1 126 228
SE Asia Total 445 362 523 831 593 414 705 987 759 208
Rural 304 694 323 514 344 189 330 591 259 060
Urban 140 666 200 318 249 226 375 397 500 145
Australia & New Zealand Total 20 494 23 022 26 636 32 982 37 063
Rural 3 014 3 013 3 028 2 879 2 452
Urban 17 480 20 010 23 608 30 103 34 611
World Total 5 296 249 6 122 769 6 895 888 8 321 382 9 306 131
Rural 3 044 820 3 287 027 3 412 018 3 405 370 2 906 691
Urban 2 251 425 2 835 751 3 483 869 4 916 004 6 399 422
Source: FAOSTAT (2012).
Global demand for animal source food (ASF) is projected to nearly double to 2030 and to almost treble to 2050 (from 2000 as the base year). Projections of increases in
* Joachin Otte, Senior Animal Production and Health Officer, FAO Regional Office for Asia and the Pacific. Secretary Animal Production and Health Commission for Asia and the Pacific (APHCA);
Delia Grace, Team Leader, Markets, Gender and Livelihoods, ILRI. Component Leader, CGIAR Research Program 4: Agriculture for Nutrition and Health.

122
demand for ASF in South, East and Southeast Asia are shown in Figure 1 (Australia and New Zealand are included as examples of trends in developed countries). Global grain demand is projected to double until 2050, mostly due to the increased demand for ASF, much of which will be grain-fed.
Percentage MTs (million)
Figure 1. Projected demand growth for different types of meat and eggs by Asian subregions, 2000 to 2030Source: Alexandratos et al. (2006).
Increasing livestock production by 270 percent and doubling global grain production without compromising environmental integrity, social stability/equity and public health is a tremendous challenge, complicated by the multiple and intricate linkages between these public goods. Given the magnitude of the challenge and its implications for human and animal welfare, public policy at local, national and international levels has to guide and set boundaries for individual actions. Effective policy-making requires judicious analysis of economic and ecological trends, technical and policy options, their impacts and trade-offs and their acceptance by various stakeholder groups. Environmental and social impacts of Asia’s dynamic livestock sector growth and development are dealt with elsewhere. The focus of this paper is on potential risks to humans occasioned by infectious disease from micro-organisms and parasites originating in animals and foreseeable changes in these risks resulting from livestock sector growth and development trends in Asia. This paper does not address food security and economic aspects of transboundary animal diseases that do not infect humans nor risks to human health associated with excessive consumption of animal products. The paper first starts with an overview of livestock sector trends in Asia, broken down into three major subregions, namely South, East and Southeast Asia. Then it reviews the human health consequences of Asia’s livestock sector growth and development stemming from emerging infectious diseases, established (endemic) zoonoses and from emergence and proliferation of antimicrobial resistance associated with production of ASF. This is followed by attempts to qualify and to some degree quantify the impact of these health consequences. The next section outlines responses required to mitigate these risks to human health. The paper concludes with a brief synthesis and some conclusions.
0S Asia E. Asia SE. Asia Aus&NZ S Asia E. Asia SE. Asia Aus&NZ
100
200
300
400
500
0
5
10
15
20
25BeefMuttonPorkPoultryEggs
BeefMuttonPorkPoultryEggs
0S Asia E. Asia SE. Asia Aus&NZ S Asia E. Asia SE. Asia Aus&NZ
100
200
300
400
500
0
5
10
15
20
25BeefMuttonPorkPoultryEggs
BeefMuttonPorkPoultryEggs

123
GROWTH AND DEVELOPMENT OF ASIA’S LIVESTOCK SECTORSAsian livestock populations (including farmed aquatic animals) have exhibited remarkable growth over the past 20 years (Table 2). This growth has however not been uniform across Asia’s subregions, livestock types and time. Poultry numbers have shown the strongest growth in all three subregions and over both decades, numbers doubling in South Asia over the past decade. In East Asia, the growth of livestock numbers appears to be decelerating across all species (and in the case of large ruminants numbers are even declining), while in South and Southeast Asia livestock population growth was stronger in the decade 2000-2010 than in the decade 1990-2000 (with the exception of pig populations in India, which have declined). In South Asia, small ruminant populations have exhibited the second largest increase in numbers, 45 percent growth over 20 years, while in Southeast Asia pig populations have grown by 75 percent over the same period. East Asia saw a strong growth in small ruminant populations in the decade 1990-2000 but small ruminant numbers appeared to have stabilized while pig populations still exhibited moderate growth in the decade 2000-2010.
Table 2. Livestock populations and livestock population growth in Asian sub-regions, 1990-2010 (in 1 000s)
Region Species 1990 2000 2010 2000/1990
2010/2000
South Asia LRs 364 130 377 647 438 780 104 116
SRs 338 641 399 416 490 289 118 123
Pigs 12 619 14 393 10 798 114 75
Poultry 670 637 997 164 2 031 550 149 204
East Asia LRs 111 497 138 274 117 880 124 85
SRs 232 475 308 750 317 104 133 103
Pigs 383 235 460 065 498 190 120 108
Poultry 2 970 138 4 866 944 6 387 309 164 131
SE Asia LRs 52 066 52 652 62 521 101 119
SRs 24 899 29 392 38 107 118 130
Pigs 40 577 52 374 71 361 129 136
Poultry 1 042 326 1 719 507 2 871 319 165 167
Australia & New Zealand LRs 31 196 36 603 36 597 117 100
SRs 230 842 162 900 105 243 71 65
Pigs 3 042 2 880 2 624 95 91
Poultry 70 652 100 110 100 288 142 100
World LRs 1 446 587 1 478 928 1 622 805 102 110
SRs 1 799 114 1 811 200 2 000 380 101 110
Pigs 855 962 898 813 965 855 105 107
Poultry 11 791 809 16 078 447 21 488 551 136 134
LR = large ruminant; SR = small ruminant.Source: FAOSTAT (2012).

124
Asia’s livestock sectors are not only growing but also intensifying, a process that has started earlier and progressed furthest in East Asia as illustrated for poultry in Figure 2 by comparing increments in chicken meat production with increases in chicken numbers. In contrast to East Asia, where chicken numbers have doubled while meat output has tripled, much of the growth in chicken meat production in South Asia was a result of increasing chicken numbers, many of which are raised in extensive systems. Robinson et al. (2011) estimated that in 2005, 80 percent of poultry in East Asia were reared under intensive conditions while in South Asia the corresponding fi gure was 30 percent. In terms of intensifi cation processes, Southeast Asia lies between the East and South Asian regions.
East Asia Southeast Asia South Asia
Figure 2. Poultry sector growth, chicken numbers and chicken meat in the Asian subregion, 1990 to 2010 (1990 = 100)Source: FAOSTAT (2012).
The pig sectors of East and Southeast Asia are undergoing similar processes, again with higher rates of intensifi cation in East Asia vis-à-vis Southeast Asia. Larger farming units and concentration of units in proximity of feed sources, increased animal throughput/turnover and stratifi cation of production (breeders, multipliers, fi nishers), often with vertical integration and contract farming are hallmarks of livestock sector intensifi cation. Increases in animal turnover in intensive livestock production systems are the result of selection for production traits and enhanced management, particularly disease control and rations with a higher nutrient density compared to traditional livestock raising systems. As Asia’s agricultural areas have little potential for expansion, intensifi cation of livestock production has led to major increases in feed imports as can be seen in Table 3. China now accounts for almost 60 percent of global soy meal imports (up from 8 percent in 1990).
100
1990
1995
2000
2005
2010
200
300
400
500
East Asia
MeatChicken
Southeast Asia South Asia
100
1990
1995
2000
2005
2010
200
300
400
500
100
1990
1995
2000
2005
2010
200
300
400
500

125
Table 3. Value (in US$1 000) of feed imports 1990, 2000 and 2009 by Asian subregions
Region 1990 2000 2009 2000/1990
2009/2000
South Asia 112 132 214 822 959 869 192 447
East Asia 1 734 245 3 023 139 5 797 128 174 192
SE Asia 648 323 1 544 730 5 830 958 238 377
Australia & New Zealand 55 678 124 627 687 924 224 552
World 16 196 569 20 136 778 51 940 302 124 258
Source: FAOSTAT (2012).
Economic development is linked to stronger integration into international supply networks, which allow for regional specialization with concomitant increase and shift of local, regional and global trade patterns. Thus, Asia’s intraregional trade and trade with the rest of the world have grown tremendously over the past two decades (trade volumes grow faster than production). Figure 3 displays total and agricultural exports (in value terms) for 1990, 2000 and 2010.
Value of exports (billion US$) Value of agric exports (billion US$)
Source: UN-ESCAP (2012). Source: FAOSTAT (2012).
Figure 3. Total and agricultural export values 1990, 2000 and 2010 by major world regions (exports include intraregional trade)
While in 1990 more than half of Asia-Pacific exports went to other world regions, presently more than 50 percent of Asia-Pacific exports are to other countries in the region. These export figures do not include unofficial cross-border trade which, for livestock and livestock products can be quite substantial as price differentials between Asian countries are high for certain livestock types/products.
1,000
Asia Paci
fic
Europe
N.America
ROW
Asia Paci
fic
Europe
N.America
ROW
2,000
3,0004,0005,0006,000
0
1990
2000
2010
1990
2000
2010
0
100
200
300
400
500

126
An assessment of the International Agro-Food Trade Network by Ercsey-Ravez et al. (2012), concludes that this network has evolved into a highly heterogeneous, complex supply-chain network, which provides a vehicle suitable for the fast distribution of potential contaminants and pathogens but unsuitable for tracing their origin. The authors warn that even if food contamination was less frequent, for example due to better local control of production, its dispersion/spread has become more efficient.
HUMAN HEALTH CONSEQUENCES OF ASIA’S LIVESTOCK SECTOR GROWTHThe rapid expansion of and structural changes in Asia’s livestock sectors has ensured increased supplies of ASF for Asia’s growing and more affluent populations. This remarkable development has, however, come at the expense of increased risks to human health from pathogens harboured by animals, either wildlife or livestock themselves. These evolving disease risks can broadly be grouped into three interconnected categories (i) emerging infectious zoonotic1 diseases, (ii) established (endemic) zoonoses and food-borne diseases transmitted via ASF and (iii) emergence of resistance of micro-organisms to antimicrobial compounds used in animal production (similarly, disease vectors are developing resistance to chemicals used for their control). The intensification of agriculture and livestock production is not always a risk amplifier and a number of zoonotic diseases actually decrease as livestock systems intensify and animals are moved into highly regulated environments (e.g. trichinellosis). However, the rapid growth and intensification of livestock production within a poorly regulated environment and without the concomitant strengthening of public health systems as is the case in many Asian countries, not only generates health risks for local populations but compromises regional and global health security.
Emerging infectious zoonotic diseasesHumans, livestock and wildlife share large pools of micro-organisms and parasites, many of which, given the opportunity, can infect and potentially establish a new host species (opportunistic invasion, e.g. SARS and Nipah virus), or, if ecological changes occur, adapt to new population structures and contact patterns of existing host species (adaptive evolution, e.g. avian influenza viruses), which in turn leads to changes in manifestation (increased incidence and/or virulence) of otherwise known diseases. Both processes result in so-called ‘emerging infectious diseases’ (EIDs), a phenomenon which has declined over the past two decades after increasing for the previous five decades (Grace et al. 2012). Viruses are more likely to be emerging than other types of pathogen, due to their wide host range and rapid evolution. Viruses that have received most attention include coronaviruses, lentiviruses, flaviviruses, paramyxoviruses and influenza A viruses. Fortunately, with the exception of the 2009 H1N1 virus, the capability of human-to-human transmission of recently-emerged zoonotic diseases is moderate to low. The majority (about 75 percent) of EIDs affecting humans have their origin in wildlife but livestock often play an important bridging role between wildlife and humans, either through amplification of wildlife parasites or by providing a host population in which wildlife
1 Zoonoses are diseases that are naturally transmitted between humans and vertebrate hosts. Around 60 percent of all human infectious diseases and 75 percent of emerging diseases are zoonoses (Taylor et al. 2001; Woolhouse et al. 2005).

127
parasites evolve and adapt. Parasite evolution and adaptation in livestock leads to increased exposure of humans, and, as livestock themselves are exposed to human pathogens, livestock provide a major ‘breeding ground’ for amplifying novel pathogens that are relatively well adapted to human hosts (the continuous exchange of influenza virus genes between pigs and humans and resulting emergence of virus variants is a prime example). Livestock can also act as a ‘mixing vessel’ where exchange can occur between pathogens adapted to different species, for example the human influenza virus and avian influenza virus can co-infect pigs allowing gene exchange and new variant emergence. Expansion of agricultural areas, e.g. through deforestation, can lead to increased wildlife-human and livestock-wildlife contact with livestock-human transmission (e.g. the Nipah virus). So far, around 2 000 viruses infecting vertebrate species have been described. Although this number appears large, it is likely to be only a small fraction of existing viruses. Given that there are around 50 000 known vertebrate species and assuming each has 20 endemic viruses, there are likely over 1 million vertebrate viruses. Thus, 99.8 percent of vertebrate viruses remain to be discovered, and even if only 0.1 percent of these can infect humans, this would still represent a pool of around 1 000 undiscovered potential human pathogens (Daszak 2009). Intensification of agricultural land use through irrigation can lead to an increase in endemic water-borne (e.g. leptospirosis) and vector-borne (e.g. Japanese encephalitis) zoonoses, which then may acquire characteristics of ‘emerging’ zoonoses. Similarly, the increasing scale of livestock operations, accelerated turnover (‘industrialization’) and the spatial concentration of these units close to feed sources or markets can lead to an increase in prevalence (e.g. Campylobacter jejuni, Streptococcus suis) and virulence (e.g. avian influenza virus) of ‘endemic’ zoonotic pathogens. A major objective of intensive livestock production is disease control and this can paradoxically foster disease emergence. For example, Salmonella serovars Gallinarium and Pullorum were an important cause of poultry mortality in emerging intensive poultry systems of Europe during the last century. Fortunately, these were virtually eradicated by vaccination. Unfortunately, but ecologically predictably this created a vacant niche and the Salmonella serovar Enteritidis became established in poultry populations. This is not associated with disease in poultry but is very commonly associated with human disease. In the 1990s, several Enteritidis epidemics linked to poultry were observed in European countries and the United States (Gannon et al. 2012). Once ‘established’ in local animal populations, new pathogens can be rapidly disseminated across a region or even the globe through trade in live animals (more than live 75 000 pigs and nearly 2 000 000 live poultry are shipped from North America to Eurasia each year), animal products and wildlife. If a novel pathogen develops the capacity for human-to-human spread, it can rapidly disseminate though ever-expanding global air travel. There is no strong link with poverty, smallholders and emerging disease. Over the last 72 years, most cases of zoonotic disease emergence have been in the western seaboard of the United States and Western Europe (Figure 4). This may reflect better reporting or it may be related to high densities of genetically homogeneous livestock providing a suitable milieu for emergence.

128
Potential Hotspots in US, Western Europe, Brazil, Southeast AsiaMost emerging human diseases come from animals. This map locates zoonotic events over the past 72 years, with recent events (identified by an ILRI-led study in 2012) in blue. Like earlier analyses, the study shows western Europe and western USA are hotspots; recent events, however, show an increasingly higher representation of developing countries.
Map by IOZ, published in an ILRI report to DFID: Mapping of Poverty and Likely Zoonoses Hotspots, 2012.
Figure 4. Emerging zoonotic disease events, 1940-2012
It appears, however, that live and wet markets in which many different animal species are congregated in close proximity and also come into contact with humans may constitute a risk factor for disease emergence, maintenance and spread (e.g. bird flu, SARS). Some examples of disease emergence and its link to agricultural intensification now follow.
Japanese Encephalitis (JE) JE is a vector-borne viral disease that occurs in South Asia, Southeast Asia, East Asia and the Pacific. The JE virus (JEV) is mainly transmitted by the mosquito Culex tritaeniorrhynchus, which prefers to breed in irrigated rice paddies. This mosquito species and members of the Culex gelidus complex are zoophilic. Wading ardeid water birds (e.g. herons and egrets) serve as virus reservoirs, but the virus regularly spills over into pigs, members of the family Equidae and humans. Humans and horses are dead-end hosts but pigs develop high-level viraemia and are amplifying hosts for human infection (Pfeffer and Dobler 2010).
1 EVENT 2-3 EVENTS 4-5 EVENTS 6 EVENTS EVENTS IDENTIFIED IN 2012(recent emergance)
129
Two distinct epidemiologic patterns of JE have been described. In temperate zones, such as the northern part of the Korean peninsula, Japan, China, Nepal and northern India, large epidemics occur in the summer months; in tropical areas of southern Viet Nam, southern Thailand, Indonesia, Malaysia, the Philippines, and Sri Lanka cases occur more sporadically and peaks are usually observed during the rainy season. JE incidence is increasing in South Asia and Southeast Asia while in East Asian countries, which implement control programmes, incidence has declined or remained stable (Erlanger et al. 2009). Because infected pigs act as amplifying hosts, domestic pig rearing is an important risk factor in transmission to humans. The expansion of JEV in Southeast Asia in the last few decades has been associated with increasing irrigated rice production and pig farming (Pfeffer and Dobler 2010). The combination of irrigated fields, which increases the population density of mosquito vectors and water birds, and pig farming, which provides an amplifier host, increases the risk of spill-over into the human population. In Indonesia, the incidence of JE in rural communities is closely related to the ratio of humans to pigs (Xu and Liu undated).
Nipah
Pteropus bats (fruit bats) are reservoir hosts for henipaviruses in Australasia and transmission to pigs, horses and humans (directly or indirectly) has been confirmed. Infected bats shed the virus in excretion and secretion such as saliva, urine, semen and excreta but they are symptomless carriers. As bats get stressed and hungry, their immune system gets weaker, their virus load rises and the virus spills out in their urine and saliva (WHO undated). Disease emergence may occur through simple host switching: bat and human isolates are identical in some outbreaks (Grace et al. 2011). Outbreaks are generally associated with changing ecology and landscapes, with habitat degradation forcing bats to encroach upon agricultural zones for survival and into contact with humans through contamination of foodstuffs (Breed et al. 2006). Nipah outbreaks have occurred in South Asia (Bangladesh and neighbouring India) and in Malaysia. Outbreaks of Nipah in South Asia have a strong seasonal pattern and a limited geographical range (WHO undated). A suspected mode of transmission is indirect contact with bats through contaminated palm sap. The Nipah virus (NiV) can infect pigs and other animals. The virus is highly contagious among pigs, in which it causes the porcine respiratory and neurologic syndrome (barking pig syndrome) and spreads by coughing. The amplification of NiV by pigs, with associated mortality and related human infection led to devastating economic impact and public health concern in Malaysia between September 1998 and April 1999. Direct contact with infected pigs was identified as the predominant mode of transmission in the Malaysia outbreak. Ninety percent of the infected people were pig farmers or had contact with pigs. The morbidity and mortality data of human NiV infection is presented in Table 4 (up to 2008). The case fatality rate of NiV ranges from 40-70 percent although it has been as high as 100 percent in some outbreaks. NiV has infected 477 people and killed 252 since 1998.

130
Table 4. Nipah cases and deaths, 1998 to 2008Country Period Cases Deaths CFR (%)
Malaysia Sep. 1998 - Apr. 1999 276 106 38
India (Siliguri) Feb. 2001 66 45 68
Bangladesh (Meherpur) Apr. - May 2001 13 9 69
Bangladesh (Naogaon) Jan. 2003 12 8 67
Bangladesh (Gaolando) Jan. 2004 29 22 76
Bangladesh (Faridpur) Apr. 2004 36 27 75
Bangladesh Tangail) Jan. - Mar. 2005 12 11 92
Bangladesh (Thakurgaon) Jan. - Feb. 2007 7 3 43
Bangladesh (Kushtia) Mar. - Apr. 2007 8 5 63
India (Nadia) Apr. 2007 5 5 100
Bangladesh (Manigonj & Rajbari) Feb. 2008 11 6 55
Bangladesh (Shatkira & Jessore) Apr. 2008 2 1 50
CFR = case fatality rate.Source: WHO (undated).
There is circumstantial evidence of human-to-human transmission in India in 2001. During the outbreak in Siliguri, 33 health workers and hospital visitors became ill after exposure to patients hospitalized with Nipah virus illness, suggesting nosocomial infection. Strong evidence indicative of human-to-human transmission of NiV was also found in Bangladesh in 2004.
SARS
Severe Acute Respiratory Syndrome (SARS), caused by a coronavirus (CoV), first occurred in November 2002 in China. In March 2003 the disease (re-)emerged in Hong Kong Special Administrative Region (S.A.R.). Between March and July 2003, the virus dramatically spread, reaching 30 countries all over the world and rapidly obtained the status of first pandemic of the twenty-first century. Six months after its second emergence in Hong Kong S.A.R., more than 8 500 cases had been identified and 800 people had died from the ‘new’ coronavirus. The earliest human cases of SARS were associated with wildlife contact and SARS coronavirus-like viruses were isolated from wild animals in a live animal market. Several surveys were conducted in domestic animals, poultry and wildlife to identify the natural reservoir of the SARS coronavirus and a SARS coronavirus-like virus was found in several species of insectivorous horseshoe bats (Rhinolophus sp.) from different locations in southern China (Lau et al. 2005; Li et al. 2005; Bennett 2006). Using genomics and phylogenetic analysis of known strains, virus transmission and adaptation have been demonstrated among bat species and between bats and other mammals e.g. palm civet, domestic animals and humans. In the case of SARS-CoV, this appears to have occurred via an intermediate, perhaps rodent, host (Guan et al. 2003).

131
Highly pathogenic avian influenza (‘Bird Flu’)
Wild aquatic birds are believed to be the primary reservoir of influenza A viruses, and all influenza A viruses in mammals likely have ancestral links to avian lineages (Webby and Webster 2001; Alexander 2006). An important feature of influenza A viruses is their capacity to undergo molecular transformation through recombination and reassortment, which facilitates adaptation to new host populations and thereby the potential to cause major disease outbreaks in humans and other species (Vana and Westover 2008). Strains that cause severe disease and high levels of mortality are classified as highly pathogenic avian influenza while viruses causing milder disease in domesticated poultry are classified as low pathogenic avian influenza (LPAI). The introduction of LPAI viruses into domestic poultry populations usually requires direct or indirect contact with infectious wild waterfowl or from wild waterfowl to domestic ducks (Alexander 2006). Incursions of LPAI virus into domestic poultry have been reported over the past decade, mostly in North America and Europe, but also in Mexico, Chile and Pakistan, as summarized by Capua and Alexander (2004). The transition from LPAI to HPAI can result from a single point mutation affecting the haemagglutinin surface protein. The probability of such a mutation is amplified in the setting of industrial poultry production due to the rapid viral replication that occurs in an environment of thousands of confined, susceptible animals. In Mexico in 1994, an LPAI H5N2 virus mutated into a HPAI virus and spread to Guatemala in 2000 and to El Salvador in 2001, presumably via trade in poultry (Lee et al. 2004). LPAI H5N2 is now established in domestic chicken populations in Central America. In both the 2003 H7N7 HPAI epidemic in the Netherlands (Stegeman et al. 2004) and the 2004 H7N3 HPAI epidemic in British Columbia, Canada (Power 2005), LPAI infections in poultry preceded the emergence of HPAI in different poultry houses on the same commercial farms. In Italy, the 1999/2000 H7N1 HPAI epidemic was preceded by 199 reported outbreaks of LPAI H7N1 in the same region. A similar process appears to have started the ongoing HPAI H7N3 epidemic in Mexico, which has led to the culling of around 8 million birds so far. Large-scale industrial poultry production systems display many of the factors determining selection for increased virulence as identified in a review by Galvani et al. (2003). Live bird markets, with their rapid turnover of birds, may act as surrogates for ‘large farms’. HPAI caused by the notorious H5N1 virus was first reported in Southeast Asia in late 2003, although the virus is now considered to have emerged as early as 1996, when it was first identified in geese in Guangdong Province in southern China. It then caused disease in the Hong Kong Special S.A.R., where poultry and humans were affected in 1997, poultry only in 2001 and early 2002 and poultry and captive wild birds in 2002-2003. From 2003 onwards, the disease spread widely, initially through East and Southeast Asia in 2003-2004 and then into Mongolia, southern Russian Federation, the Near East and to Europe, Africa and South Asia in 2005-2006, with outbreaks recurring in various countries in 2007. To date, 60 countries have reported outbreaks of HPAI H5N1 in domestic poultry, wild birds or both. In most of these cases, the H5N1 virus could be eliminated through swift and determined interventions of national animal health systems, or through natural burn-out (Bett et al. in press) whereas in some countries the virus appears to have become endemic in specific eco- and production systems, probably because these have unusual

132
epidemiological features that allow maintenance of infection (e.g. high density, clandestine vaccination, mixing poultry with ducks). The HPAI H5N1 virus has the ability to infect humans, in which it produces severe disease with a case-fatality rate of above 50 percent. Fortunately the H5N1 virus has not acquired the capacity of efficient human-to-human spread but recent (controversial) experiments have shown that only a limited number of mutations may be needed to acquire this trait, the consequences of which would be devastating. The cost of a severe global pandemic has been estimated at US$3 trillion (World Bank 2010).
Novel H1N1 (‘Swine Flu’)
Pigs may potentially assume an important role in the emergence of novel influenza A viruses as they can be infected by both avian and human viruses (Alexander 2006; Kida et al. 1994; Schulz et al. 1991). Gilchrist et al. (2007) note the proximity of concentrated poultry and swine operations as a source of disease risk from influenza A viruses, although to date there have only been reports of avian influenza viruses in pigs, not swine influenza in poultry. Classical H1N1 swine influenza viruses are very similar to the virus implicated in the 1918 human influenza pandemic and circulate predominantly in the United States and Asia. H3N2 viruses of human origin have been isolated from pigs in Europe and the Americas shortly after their emergence in humans (Webby and Webster 2001) and are now endemic in pigs in southern China (Peiris et al. 2001), where they co-circulate with H9N2 viruses with the potential of re-assortment with H5N1. Evidence for the concurrent circulation of H1N2, H1N1 and H3N2 influenza A viruses in pigs has been reported from Spain (Maldonado et al. 2006). In the United States, outbreaks of respiratory disease in swine herds have been caused by influenza A viruses which arose from re-assortment of human, swine and avian viral genes (Zhou et al. 1999). Evidence for viral re-assortment of avian, human and swine influenzas within pigs has been published by Zhou et al. (1999) and Shieh et al. (2008). In March and early April 2009, a new swine-origin influenza A (H1N1) virus (S-OIV) emerged in Mexico and the United States. During the first few weeks of surveillance, the virus spread worldwide to 30 countries by human-to-human transmission, causing the World Health Organization to raise its pandemic alert to level 5 of 6. This virus was derived from several viruses circulating in swine (see Figure 5), and the initial transmission to humans occurred several months before recognition of the outbreak (Garten et al. 2009). A phylogenetic estimate of the gaps in genetic surveillance indicates a long period of unsampled ancestry before the S-OIV outbreak, suggesting that the re-assortment may have occurred years before emergence in humans (Smith et al. 2009). This highlights the need for systematic surveillance of influenza in swine, and provides evidence that the mixing of new genetic elements in swine can result in the emergence of viruses with pandemic potential in humans. Nelson et al. (2012) undertook a large-scale phylogenetic analysis of pandemic A/H1N1/09 (H1N1pdm09) influenza virus genome sequence data to determine the extent to which influenza viruses jump between humans and swine hosts. At least 49 human-to-swine transmission events occurred globally during 2009-2011, highlighting the ability of the H1N1pdm09 virus to repeatedly transmit from humans to swine, even following

133
adaptive evolution in humans. Similarly, Lycett et al. (2012) identified at least 23 separate introductions of human seasonal (non-pandemic) H1 and H3 influenza viruses into swine globally since 1990. These findings indicate that humans make a substantial contribution to the genetic diversity of influenza viruses in swine, and emphasize the need to improve biosecurity measures at the human-swine interface, including influenza vaccination of swine workers.
Figure 5. Host and lineage origins for the gene segments of the 2009 A(H1N1) virus Source: Garten et al. (2009).
Established (endemic) zoonoses and food-borne diseasesA recent study identified 56 priority zoonoses that are together responsible for around 2.5 billion cases of human illness and 2.7 million human deaths a year (Grace et al. 2012). On a global scale, the ten most important were in descending order: zoonotic bacterial gastrointestinal disease; leptospirosis; cysticercosis; zoonotic tuberculosis; rabies; leishmaniasis; brucellosis; echinococcosis; toxoplasmosis; and Q-fever. All are present in Asia. Food-borne trematodiases, although globally not in the top ten, constitute an important class of zoonoses in East and Southeast Asia. We briefly review these ‘top’ zoonoses from the perspective of their importance in Asia and also the likely trends under intensification and climate change. In contrast to emerging zoonoses, there is a strong relation between endemic zoonoses and poor smallholder livestock keepers (Figure 6).
Zoonotic gastro-intestinal disease
This category includes the bacterial zoonotic diseases, which are transmitted mainly through food. Among the most important are Salmonella, toxigenic Escherichia coli, Listeria, Campylobacter and Toxoplasma. Of somewhat lesser importance are: Staphylococcus aureus, Bacillus cereus and Clostridium spp. Hepatitis E is an emerging zoonoses although the role of the reservoir host (pigs) in transmission is not fully understood. Most of the classical endemic zoonoses can be food-borne (brucellosis, Q-fever, zoonotic tuberculosis) but have other important transmission pathways and are considered separately.
Gene Segments, Host,and Years of Introduction
TripleReassortant
2009 A(H1N1)
ClassicalSwine
EurasianSwine
PB2, PAPB2, PA
PB2PB1PAHANPNAMNS
~1998
~1918
~1979
~1968 ~1998PB1
PB1PB1
HA, NP, NSHA, NP, NS
NA, MNA, M

134
As animal food value chains become longer, more complex, transport larger, more diversely-sourced volumes of food and place larger distances between producers and consumers, food-borne hazards increase. Food-borne diseases are expected to increase with intensification and increasing importance of monogastrics (Grace et al. 2012). With regard to climate change, campylobacteriosis and salmonellosis are thought to most likely increase with air temperature; campylobacteriosis and non-cholera vibrio infections with water temperature; cryptosporidiosis followed by campylobacteriosis with increased frequency of rainfall; and cryptosporidiosis followed by non-cholera vibrio in association with precipitation events. Listeria spp. is not associated with temperature thresholds, extreme precipitation events or temperature limits (ECDC 2012).
Greatest Burden of Zoonoses Falls on One Billion Poor Livestock KeepersAn ILRI study shows that zoonotic diseases are major obstacles in pathways out of poverty for one billlion poor livestock keepers. The diseases mapped cause 2.3 billion human illnesses and 1.7 million human deaths a year. In poor countries, the diseases also infect more than one the seven livestock every year.
Map by ILRI, from original published in an ILRI report to DFID: Mapping of Poverty and Likely Zoonoses Hotspots,
2010.
Figure 6. Burden of endemic zoonoses and density of poor livestock keepers
Leptospirosis
Leptospirosis is an infectious disease caused by pathogenic organisms belonging to the genus Leptospira. There are many serovars (>250) but typically only around 10-20 are found in a given region. Most mammalian species are natural carriers of pathogenic leptospires. These include feral, semi-domestic and farm and pet animals as important
LEGENDNumber of poor livestock keepers per square kilometre
One or more people or animals out of 100 infected by one or more zoonotic diseases per year
1-5
5-20
20-50
50-100
Above 100

135
infection sources. Therefore, leptospirosis is an important occupational disease, especially affecting farmers, slaughterhouse workers, pet traders, veterinarians, rodent catchers and sewer workers. The risk of acquiring leptospirosis is associated with contact with animals and the main route of infection is probably by transmission through indirect contact with leptospires secreted into the environment. Pathogenic leptospires survive longer in a warm and humid environment. Hence, they are mainly a problem in tropical countries where stagnant water can be found and where cattle, pigs or rodents abound. In livestock, leptospirosis is associated with pasture grazing and may be reduced by intensification. It is considered one of the most climate-sensitive zoonoses and is likely to increase with water temperature, precipitation and extreme weather events (flooding).
Cysticercosis
Cysticercosis is a systemic parasitic infestation caused by tapeworms of pigs and cattle (Taenia solium and T. saginata). The main health risk for humans is not consumption of pork with cysts but consumption of tapeworm eggs shed by themselves or another human carrier. The disease persists in poor, pig-keeping communities where pigs have access to human faeces. Northeast India appears to be a hot spot, as is Papua New Guinea and tribal areas of Viet Nam and Thailand. Intensification of swine production would be expected to reduce prevalence of the disease; it is not climate-sensitive.
Zoonotic tuberculosis
Worldwide and historically, most human tuberculosis (TB) is caused by Mycobacterium tuberculosis and maintained by human-to-human transmission. M. bovis is responsible for cattle tuberculosis. It affects a wide range of animals and is responsible for zoonotic TB in humans. Zoonotic TB is mainly a problem where cattle are important and is especially problematic in South Asia (Jou et al. 2008; Tipu et al. 2012). Intensification is a risk factor, but there is no special climate sensitivity, although increased temperature and humidity may increase survival in the environment.
Rabies
Rabies is one of the most feared zoonoses. Most cases are concentrated in a handful of countries with much of the burden in Asia (Bangladesh, India, Myanmar, Pakistan, China). The recent introduction to Bali has led to over 100 deaths and is not yet under control (Susilawathi et al. 2012). Most human infections are from canids or wildlife.
Leishmaniasis
Leishmaniases are diseases caused by around 25 species of the protozoan genus Leishmania and transmitted by bites of sandflies. The symptoms range from localized skin ulcers to lethal systemic disease. Outbreaks may be associated with conflict. India and Bangladesh are hotspots for visceral leishmaniasis, but the disease is exclusively anthroponotic. In China and Central Asia the disease is a zoonoses transmitted mainly from canids. Cutaneous leishmaniasis (dog and rodent reservoirs) is endemic in Rajasthan and has been newly recognized in South India (Singh et al. 2010). Incidence is likely to decrease with agricultural intensification (if dog and rodent populations decrease) and increase with

136
climate change, indeed the re-emergence in India has been linked with climate change (Singh et al. 2011).
Brucellosis
The most important species of Brucella are zoonotic: B. abortus, responsible for bovine brucellosis; B. melitensis, the main etiologic agent of ovine and caprine brucellosis and an increasing cause of cattle brucellosis; and B. suis, causing pig brucellosis. Human brucellosis appears to be mostly a problem where ruminants are important (Africa and South Asia). However, it has been reported in Thailand, Indonesia, Malaysia and Viet Nam. Brucellosis is more problematic in intensive systems than extensive and pasture-based systems. There is no marked climate sensitivity, although increased temperature and humidity may increase survival in the environment
Echinococcosis
Cystic echinococcosis in humans is caused by the larval stage of E. granulosus, E. ortleppi, E. intermedius or E. canadensis. All these parasites have canines (usually domestic dogs) as definitive hosts and a variety of ungulates, particularly farm animals, as intermediate hosts. Humans are generally an aberrant intermediate host in which the hydatid cyst develops, usually in the liver or lungs as a space-occupying lesion, which can result in considerable morbidity. More than 90 percent of human cases occur in eight endemic regions, two of which are found in Asia. In descending order: China (Tibetan Plateau), Turkey, India, Iraq, Iran and Afghanistan. Intensification would be expected to reduce prevalence of the disease; it is not climate-sensitive.
Toxoplasmosis
Toxoplasmosis is a disease caused by the parasite Toxoplasma gondii whose definitive host is felids. It is found worldwide with higher prevalences in tropical countries. Up to one-third of the world’s population is infected with toxoplasma, but the disease is rare in otherwise healthy people. However, it is an important cause of illness in immune-compromised people and pregnant women. Consumption of undercooked meat is a common transmission pathway. The disease may be more common in extensive and organic systems (where animals can contact cat faeces or rodents) (Jones and Dubey 2012). It is not climate-sensitive.
Q-fever
Q fever is an infectious, highly contagious, disease of animals and humans caused by a species of bacteria (Coxiella burnetii). C burnetii is most frequently found in ruminants (sheep followed by goats then cattle) but can also be detected in wildlife and companion animals. India appears to be a hotspot but it is also reported in Thailand, Lao PDR and Indonesia. It is more common in extensive systems but became a major problem in the Netherlands after intensification of goat production. Climate change may affect survival of the causative agent in the environment.

137
Food-borne trematodiases
Food-borne trematodiases are a group of tropical diseases caused by liver, lung and intestinal parasitic fluke infections. From a public health point of view, the most important species are Clonorchis sinensis, Opisthorchis felineus, Opisthorchis viverrini, Fasciola gigantica and Fasciola hepatica among the liver flukes; Echinostoma spp., Fasciolopsis buski, Heterophyes spp. and Metagonimus spp. among the intestinal flukes; and Paragonimus spp. among the lung flukes. The life cycle of these trematodes includes two intermediate hosts, normally an aquatic snail and a freshwater fish or crustacean. Humans and animals are infected by consumption of the second intermediate host. Pathological changes include inflammatory lesions, tissue damage, and damage of the target organs caused either directly through mechanical and chemical irritation by the parasites or indirectly through the hosts’ immune response.
Antimicrobial use and resistance Increasing stocking density and confinement of livestock, a corollary of production intensification, is often accompanied by increased use of antimicrobials to treat or prevent disease or to promote growth. Long-lasting exposure to antimicrobial compounds favours selection of microbial strains which are resistant to the compound, a trait they can pass on to human pathogens. Exposure to antimicrobials occurs not only to enteric bacteria in the guts of domestic animals but also to microbes in the environment through excreted antimicrobial residues. In swine faeces lagoons, liquid manure and soil amended with manure, Tello et al. (2012) found concentrations of certain antibiotics that may act to extend the antibiotic selective pressure on bacteria within their treated hosts to wild-type bacterial populations. Many classes of antimicrobial drugs commonly used for people are also used for farm animals to treat illnesses and prevent production losses. Antimicrobial resistance of animal pathogens thereby not only reduces the efficiency of animal production but also increases human disease burdens. In high-income countries the largest share of total antimicrobial production is for veterinary use. In the United States for example, Mellon et al. (2001) estimated that total antibiotic use reached 17.5 000 tonnes, of which only 1.5 million (8.5 percent) were used for therapy in humans, the remainder in animals. The vast majority of veterinary antimicrobials are used in farm and aquatic animals (>90 percent), and mostly for non-therapeutic purposes. In the United States, where antimicrobials are used as growth promotants, around 80 percent of veterinary antimicrobial use was for non-therapeutic purposes. A very crude estimate of the intensity of antimicrobial use in livestock production, expressed as kilograms of antimicrobial use per tonne of meat produced, is given in Table 5.
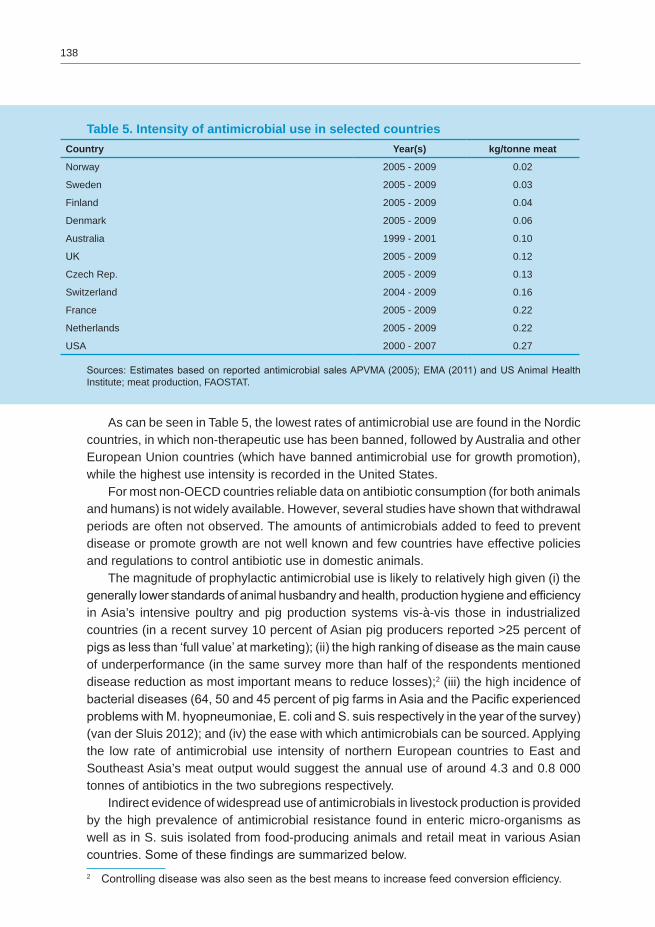
138
Table 5. Intensity of antimicrobial use in selected countriesCountry Year(s) kg/tonne meat
Norway 2005 - 2009 0.02
Sweden 2005 - 2009 0.03
Finland 2005 - 2009 0.04
Denmark 2005 - 2009 0.06
Australia 1999 - 2001 0.10
UK 2005 - 2009 0.12
Czech Rep. 2005 - 2009 0.13
Switzerland 2004 - 2009 0.16
France 2005 - 2009 0.22
Netherlands 2005 - 2009 0.22
USA 2000 - 2007 0.27
Sources: Estimates based on reported antimicrobial sales APVMA (2005); EMA (2011) and US Animal Health Institute; meat production, FAOSTAT.
As can be seen in Table 5, the lowest rates of antimicrobial use are found in the Nordic countries, in which non-therapeutic use has been banned, followed by Australia and other European Union countries (which have banned antimicrobial use for growth promotion), while the highest use intensity is recorded in the United States. For most non-OECD countries reliable data on antibiotic consumption (for both animals and humans) is not widely available. However, several studies have shown that withdrawal periods are often not observed. The amounts of antimicrobials added to feed to prevent disease or promote growth are not well known and few countries have effective policies and regulations to control antibiotic use in domestic animals. The magnitude of prophylactic antimicrobial use is likely to relatively high given (i) the generally lower standards of animal husbandry and health, production hygiene and efficiency in Asia’s intensive poultry and pig production systems vis-à-vis those in industrialized countries (in a recent survey 10 percent of Asian pig producers reported >25 percent of pigs as less than ‘full value’ at marketing); (ii) the high ranking of disease as the main cause of underperformance (in the same survey more than half of the respondents mentioned disease reduction as most important means to reduce losses);2 (iii) the high incidence of bacterial diseases (64, 50 and 45 percent of pig farms in Asia and the Pacific experienced problems with M. hyopneumoniae, E. coli and S. suis respectively in the year of the survey) (van der Sluis 2012); and (iv) the ease with which antimicrobials can be sourced. Applying the low rate of antimicrobial use intensity of northern European countries to East and Southeast Asia’s meat output would suggest the annual use of around 4.3 and 0.8 000 tonnes of antibiotics in the two subregions respectively. Indirect evidence of widespread use of antimicrobials in livestock production is provided by the high prevalence of antimicrobial resistance found in enteric micro-organisms as well as in S. suis isolated from food-producing animals and retail meat in various Asian countries. Some of these findings are summarized below.2 Controlling disease was also seen as the best means to increase feed conversion efficiency.

139
Salmonella enterica
Van et al. (2012) reviewed results of antibiotic resistance studies of non-typhoidal S. enterica in Southeast Asia the results of which are partly summarized in Table 6. Close to 50 percent of the Salmonella isolates displayed multidrug resistance.
Table 6. Resistance of non-typhoidal S. enterica isolates to different classes of antibiotics
Country No of isolates Source
Percentage of resistant isolates
TET AMP SUL MDR
Cambodia 152 Poultry 21 17 13 ND
Malaysia 33 Various livestock 64 24 48 49
Malaysia 55 Poultry 85 29 ND 75
Thailand 211 Poultry & pigs 59 49 68 66
Thailand 131 Raw pork 67 35 55 44
Viet Nam 89 Pigs 92 41 57 56
Viet Nam 91 Meat & shellfish 41 22 17 21
Viet Nam 241 Cattle, pigs & poultry 49 26 30 40
TET = Tetracyclines, AMP = Ampicillin, SUL = Sulfonamides, MDR = Multidrug resistance (resistance to at least three different classes.
Source: Van et al. (2012).
In Bangladesh, Begum et al. (2010) found that 9, 8, 7, 6 and 2 out of 12 Salmonella spp. isolates (n=12) from chicken intestines and faeces displayed resistance to Ampicillin, Nalidixit acid, Co-trimoxazole, Tetracyclines, and Kanamycin respectively while all 12 isolates were susceptible to Cephalexin, Chloramphenicol, Ciprofloxacin, Ceftriazone and Gentamycin. Rates of AMR in Salmonella spp. isolates from eggs (n=7) were much lower.
Escherichia coli
In Viet Nam, E. coli and Salmonella spp. were found to be highly prevalent in food from animal sources obtained at markets, slaughterhouses and farms, multidrug resistance reaching 50 percent in E. coli. In Thailand, Lay et al. (2012) analysed a total of 344 E. coli isolates from faecal samples of swine for antimicrobial resistance to different classes of antimicrobial agents. All isolates were resistant to at least one antimicrobial agent and 98.3 percent were multidrug resistant. Forty-two resistance patterns were observed.
Campylobacter species
Ninety-eight broiler flocks raised in Chiang Mai, Thailand, were included in a study by Chokboonmongkol et al. (2012); C. jejuni was detected as the major Campylobacter spp. both in broiler flocks and on broiler carcasses. In the 32 Campylobacter isolates, antimicrobial drug resistance to Ciprofloxacin was most common (81.3 percent), followed by tetracycline (40.6 percent), ampicillin (31.3 percent) and erythromycin (9.38 percent). Eight different antimicrobial resistance patterns were demonstrated.

140
In Cambodia, Lay et al. (2011) found high levels of resistance to Cefalotin (97 percent), Nalidixid acid (58 percent) and Ciprofloxacin (25 percent) in 139 Campylobacter isolates obtained from poultry carcasses at markets. Eleven percent of isolates were resistant to Amoxicillin while the prevalence of resistance to Azithromycin, Erythromycin and Gentamycin was below 5 percent.
Streptococcus suis
Over the past few years, the number of reported S. suis infections in humans has increased significantly, with most cases originating in Southeast Asia, infection being acquired through exposure to contaminated pigs or pig meat. S. suis strains isolated between 1997 and 2008 in Viet Nam were investigated for their susceptibility to six antimicrobial agents by Hoa et al. (2011) and a significant increase in resistance to tetracycline and chloramphenicol was observed, which was concurrent with an increase in multidrug resistance. Li et al. (2012) examined isolates of S. suis from diseased pigs in China for susceptibility to nine antimicrobials, possession of virulence-associated factors (VFs) and distribution of serotypes. The association between antimicrobial resistance (AMR) and serotypes as well as VFs was subsequently assessed. It is notable that multiple antimicrobial resistance (three or more antimicrobials) was observed in 98.7 percent of the S. suis isolates and the dominant resistance phenotype was erythromycin-tilmicosin-clindamycin-chloramphenicol-levofloxacin-ceftiofur-kanamycin-tetracycline-penicillin (35.6 percent). Presence of VFs and the possession of certain AMR phenotypes were significantly associated.
DISEASE BURDENS AND IMPACTSZoonotic diseases and disease risk affect the welfare of society through a number of pathways, some of which are not immediately apparent. Disease risk in itself imposes financial and social costs arising from publicly- and privately-funded disease risk mitigation (prevention) measures such as, for example, inspection, quarantines and vaccination campaigns. A major ‘cost’ of acute disease risk, perceived or real, is the revenue foregone through diminished economic activity in sectors and regions far removed from the original risk source. Examples of ‘disease scares’ impacting on sectors and regions other than those directly affected are provided by the SARS epidemic in 2002 and HPAI H5N1. Disease risk also deters investments in livestock production, thereby diminishing supply, a cost borne by consumers through higher prices for livestock products. Disease control activities represent another element of ‘the cost of disease’. Similar to prevention activities, control costs stem outlays for disease detection and quarantines (internal), to which costs of treatment and/or culling and safe disposal have to be added (see HPAI H5N1). In addition, disease outbreaks depress economic activity in the affected and associated sectors, for example feed producers and meat processors. These sectors, however, may be partially compensated by increased revenues in other sectors. The actual disease burden leading to reduced productivity and in some cases shortened life span represents a third element of ‘the cost of disease’. In humans, burden of disease is expressed in disability-adjusted life years (DALYs). This time-based measure combines years of life lost due to premature mortality and years of life lost due to time lived in states of

141
less than full health (diseases causing mortality in children and young adults are assigned more DALYs than diseases affecting the elderly). DALYs are often used to compare the burden of disease across diseases, disease categories, regions, socio-economic groups etc. With respect to livestock, no composite standardized measure of disease burden or losses has been developed, which severely constrains comparability of figures provided by different studies. AMR negatively affects society by leading to higher treatment costs through use of more expensive compounds and longer hospitalization and to reduced productive life (increased case fatality rates). Resistance may also affect the treatment of individuals with non-resistant organisms as in areas with high rates of resistance physicians may change empiric therapy, increasing overall treatment costs. In some instances, these costs may exceed those attributable to treatment failure (Howard et al. 2003). Generally, higher investments in disease prevention and control lead to lower disease burdens but usually the law of diminishing returns applies and a point is reached where the additional cost of prevention measures may outweigh the additional benefits of reduced disease burdens. Thus, although at first glance useful, disease burden alone is not the best indicator to guide health investment. Unfortunately, to date there are no systematic, comprehensive and comparative studies on the costs and benefits of the control of zoonotic diseases. Some examples of ‘pathways’ of disease effects and magnitude of impacts are provided hereunder.
Emerging infectious zoonotic diseasesNo DALY figures have been estimated for those zoonoses that have only emerged recently such as SARS and Nipah. For these diseases, despite high case fatality rates, due to low overall case load the aggregate impact on human health is very small compared to ‘established’ infectious and zoonotic diseases and the main impact was caused by fear and precautionary measures. A recent study estimated the costs of six emerging zoonoses between 1997 and 2009 (World Bank 2012). The average cost was US$6.7 billion.
SARS
Between November 2002 and August 2003, SARS had spread from China to 29 countries and three regions, with a cumulative total of 8 422 cases and 916 deaths. The main negative effects of SARS on China and Hong Kong S.A.R. were the drop in local demand for goods and services and the strong drop in tourism and air travel. For China, Hai et al. (2004) estimated that in 2003, tourism revenue from foreigners would decrease by about 50 to 60 percent (amounting to about US$10.8 billion) compared with the tourism revenue in 2002 and revenue from domestic tourists would decrease by around 10 percent (amounting to about US$6.0 billion). The same authors also concluded that SARS would cause, through a multiplier effect, a total loss of US$25.3 billion to China’s economy and that the growth rate of China’s GDP in 2003 would be 1-2 percentage points lower than it would have been if the SARS outbreak had not occurred. These might be overestimates as initial alarmist reports and estimates about the negative economic impacts were not borne out (Siu et al. undated). Fear and panic subsided quickly once the outbreak was under control, and the economy rebounded rapidly.

142
Nipah – Malaysia
During the outbreak in 1998-1999 in Peninsular Malaysia, the Nipah virus affected 276 people causing 106 human deaths. In order to control the outbreak, animal health authorities slaughtered about 1.1 million (out of 2.4 million) pigs and the evidence of infection in dogs led to the decision to shoot all dogs in infected areas. The value of destroyed pigs was about US$97 million. The outbreak significantly reduced the number of pig farms from 1 800 prior to January 1999 to only 796 after 21 July 1999 (Nordin 2001). A survey of ex-hog farmers revealed that many changed their business to poultry, dairy, beef cattle or frog farming while there other farmers were employed on palm farms where working conditions were poor (Hosono et al. 2006) The outbreak led to major structural changes in the Malaysian hog industry causing ‘ripple effects’ in affiliated industries. The sector that suffered the greatest was the feed industry with an approximate RM67 million (US$17.4 million) reduction in the value of its production. Next, the oils and fats sector, which uses the fat of pigs, suffered an approximately RM35 million (US$9.1 million) reduction. However, economic influence was seen not only in the industries directly related to hog raising industry but also in a wide range of business activities such as utility and real estate. The RM280 million (US$72.8 million) reduction in the production of the hog-raising industry resulted in RM541 million (US$141 million) of economic damage nationwide, nearly two times more than the direct damage (Hosono et al. 2006). A World Bank (2012) estimate of the economic losses related to the Malaysian Nipah outbreak is as high as US$671 million.
HPAI H5N1 (‘Bird Flu’)
Since its (re-)emergence in 2003 to June 2012, the World Health Organization has tallied 606 human cases of bird flu and 357 deaths. A review of HPAI H5N1 impacts on livestock production was carried out be Otte et al. in 2008. In principle, the HPAI H5N1 epidemic had the same type of impacts as the Nipah outbreak in Malaysia, only at a much larger spatial and temporal scale. In the early stages of the epidemic, the main direct losses to the poultry sector were caused by the massive culling of flocks considered ‘at risk’. In Thailand, for example, 63.8 million birds were culled from the onset of HPAI outbreaks in 2004 until 2006 (NaRanong 2007) while for Viet Nam the figure amounts to around 50 million birds (McLeod and Dolberg 2007).3 Culling not only results in the ‘wastage’ of birds, but carries a cost, which has been estimated to be about US$0.25 per bird for a 200 bird flock in Viet Nam. Disinfection of farms after depopulation was estimated to cost from US$22 to US$110 per farm in Bangladesh. Additional control costs were incurred through movement controls, surveillance and public awareness campaigns. In Malaysia, implementation of movement controls in form of roadblocks cost US$50 000 per month in 2005. Some countries embarked on vaccination campaigns. In Viet Nam, two mass vaccination campaigns were carried out by private agents under the supervision of public veterinary services per year. Investments were made in cold storage for vaccines, training of vaccinators and mass communication campaigns. 3 In the initial waves both Thai and Vietnamese authorities applied a policy of culling all poultry within
a 5-km radius of an infected premises. Over time, in both countries authorities moved to much more selective culling strategies leading to much lower numbers of poultry culled in subsequent HPAI waves.

143
The total costs of delivering 364.5 million vaccinations during the first year were estimated to be approximately US$21 million. As the HPAI H5N1 virus is able to infect humans, HPAI outbreaks in poultry have, at least in the period immediately following their notification, led to a drop in demand for poultry meat and eggs. For example a cross-country consumer survey carried out in May 2006 revealed that in most countries, not only those affected by HPAI, a significant proportion of consumers had reduced their consumption of poultry. In the European Union for example nearly 20 percent of respondents of a consumer survey conducted in 2006 stated that they had reduced consumption of poultry meat by an average of 18 percent and sales of poultry and eggs fell by 70 percent and 20 percent in Italy and France respectively. Thailand had established itself as the fourth largest exporter of poultry meat prior to the incursion of HPAI in 2004 (only Brazil, the United States and the European Union exported more). In 2003, Thailand exported nearly 485 000 tonnes of poultry meat (nearly 40 percent of production), of which around two-thirds were exported frozen and the remainder pre-cooked (NaRanong 2007). The European Union and Japan were the main export destinations for Thai poultry meat. After the notification of HPAI by Thai authorities in early 2004, Thai poultry products were immediately banned from major international trade flows and total exports in 2004 dropped to 218 000 tonnes or 45 percent of the 2003 figure. The ‘ripple’ effects on affiliated industries were similar to those described for Nipah in Malaysia and SARS in China. In the Mekong countries an important linkage exists between the poultry sector and rice production. Ducks are important for pest control in paddy rice and rice farmers in the Mekong Delta complained that the reductions of duck numbers in the rice fields resulted in increased damage from golden snails, increased occurrence of viral diseases in the spring-winter crop in 2006 and as a result lower net incomes of rice farmers (Men 2007).
2009 H1N1 (‘Swine Flu)
The 2009 pandemic influenza A H1N1 caused an estimated excess of 201 200 respiratory deaths (a range of 105 700-395 600) globally with an additional 83 300 cardiovascular deaths (46 000-179 900). In contrast to seasonal influenza, 80 percent of the respiratory and cardiovascular deaths were in people younger than 65 years (Dawood et al. 2012). Assuming a low figure of 15 years of life lost per fatal case, and not considering disability losses in recovered cases, globally the H1N1 pandemic gave rise to at least 4.5 million DALYs in 2009, i.e. around 65 DALYs/100 000 people. Reports of the H1N1 epidemic in people, coupled with the use of the term ‘swine flu’, initially caused a downturn in domestic and international pork markets. Domestic pork demand and prices dropped sharply because of consumer fears that eating pork might result in infection. Several pork-importing countries also began to consider instituting trade bans and restrictions on live pig and pork imports from certain countries, including the United States. This initial reaction further rippled throughout pork and other agricultural markets, such as feedgrain and other livestock markets (Johnson 2009). The University of Missouri estimated that the US pork industry faced losses of about US$270 million in income in the second quarter of 2009 alone.

144
Japanese Encephalitis (JE)
An estimated 3 billion persons live in countries where the JE virus is endemic and the annual incidence of the disease is 30 000 to 50 000 cases (Erlanger et al. 2009). The disease can cause irreversible neurological damage. The annual number of human deaths lies between 10 000 and 15 000, and the estimated global impact from JE in 2002 was 709 000 DALYs. However, these statistics should be interpreted with care because the transmission of JE is highly dynamic; there is considerable fluctuation in estimates of its global impact. In 1999, JE caused an estimated 1 046 000 DALYs; in the two subsequent years, it caused 426 000 and 767 000 DALYs respectively (Erlanger et al. 2009). The estimated JE burden in endemic areas of affected countries and the trend of JE incidence are shown in Table 7.
Table 7. JE burden, incidence trends and control programmes in Asian countriesCountry Pop. in JE
endemic areas (million)
DALYs in 2002 (thousand)
DALYs/100 000
Trend of JE incidence Vaccination programme
Bangladesh 106.4 24 23 Increase No
India 597.5 226 38 Increase No
Nepal 4.6 5 109 Stable Yes
Pakistan 18.5 82 443 Increase na
Sri Lanka 16.4 1 6 Decrease Yes
China 422.5 281 67 Decrease Yes
Japan 44.0 <1 Stable Yes
Korea, DPR 8.6 6 70 na na
Korea, Rep 9.2 6 65 Stable Yes
Cambodia 11.3 4 35 Increase No
Indonesia 116.1 23 20 Increase No
Lao PDR 4.6 5 109 Increase No
Malaysia 8.9 2 22 Decrease Yes
Myanmar 35.1 13 37 Increase No
Philippines 31.1 8 26 Stable No
Thailand 43.4 5 12 Decrease Yes
Viet Nam 61.7 11 18 Stable Yes
PNG 5.1 2 39 na na
Total 1 545.0 705 45
Source: Erlanger et al. (2009).
Underlying factors that might explain year-to-year fluctuations in JE incidence are contextual while incidence trends are likely to be determined by the expansion of irrigated rice and/or pig production and public health interventions, e.g. in the form of vaccination campaigns.

145
JE is not a very important disease of pigs causing only sporadic reproductive problems and pigs are asymptomatic.
Zoonoses and food-borne disease impact and burdenZoonoses have negative health impacts on humans, livestock and wildlife. Classical, endemic zoonoses, present in many places and affecting many people and animals are responsible for the great majority of human cases of illness (99.9 percent) and deaths (96 percent) as well as the greatest reduction in livestock production (Grace et al. 2012). Outbreak zoonoses are more sporadic in temporal and spatial distribution than endemic zoonoses but may be more feared because of their unpredictability and in some cases, severity. Furthermore, novel zoonoses which might be or become transmissible between humans are of concern to ‘rich’ countries because they threaten their own populations while endemic zoonoses are to a large extent localized and do not have the potential to assume pandemic proportions. The original Global burden of disease study (GBD) was commissioned by the World Bank in 1991 to provide a comprehensive assessment of the burden of 107 diseases and injuries and ten selected risk factors for the world. The GBD study, published by WHO in 2004, represents the most authoritative source of information on human illness. There are some challenges in using the GBD to assess the burden of zoonoses: • Firstly, zoonoses (especially in poor countries) are widely unreported, and under-
reporting is relatively greater for zoonoses than for non-zoonotic diseases of comparable prevalence (Schelling et al. 2007). As the GBD report is based on national information for levels of mortality and cause of illness, this under-reporting is reflected in the GBD.
• Secondly, several zoonoses with considerable burdens are not included in the GBD assessment. For example rabies, echinococcosis, cysticercosis, leptospirosis and brucellosis.
• Thirdly, the GBD is organized around diseases and not pathogens or transmission pathways. For example, diarrhoeal diseases, among the highest causes of morbidity and mortality in poor countries, comprise one category. Although the majority of important diarrhoeal pathogens are zoonotic (Schlundt et al. 2004) it is not currently possible to identify the zoonotic component of diarrhoeal disease from GBD figures.
Table 8 shows the burden (′000 DALYs) associated with selected zoonoses in the GBD for Asian subregions. It can be seen that South Asia, by a high margin, carries the highest total as well as per capita burden of infectious and parasitic (I&P) diseases, diarrhoea, leishmaniasis and JE.

146
Table 8. Burden associated with selected zoonotic diseases by Asian subregions (2004) (figure in brackets indicates percent of I&P disease burden)
I&P diseases Diarrhoea TB Leishmaniasis JE
DALYs (1 000)
DALYs/100 000
DALYs (1 000)
DALYs/100 000
DALYs (1 000)
DALYs/100 000
DALYs (1 000)
DALYs/100 000
DALYs (1 000)
DALYs/100 000
South Asia 81 440 5 453 25 084 (31)
1 680 10 923 (13)
731 1 408 (2)
94 416 82
East Asia 13 383 884 3 957 (30)
261 3 892 (29)
257 1 0 136 9
SE Asia 19 708 3 584 3 542 (18)
644 4 860 (25)
884 40 (1) 7 121 22
Australia & New Zealand
36 151 6 (17) 26 1 (2) 3 0 0 0 0
Source: Extracted from WHO (2004).
The estimated burden caused by diarrhoea surpasses the burden of nutritional deficiencies (energy-protein malnutrition, iodine, vitamin A and iron deficiency), which the same study estimated at 13.3, 3.3 and 3.2 million DALYs for South, East and Southeast Asia respectively (891, 248 and 580 DALYs/100 000 population).
Zoonotic bacterial gastro-intestinal disease
Several important bacterial zoonoses have minimal impact in livestock, notably toxigenic E. coli in cattle and S. enteritidis in poultry (Listeria, Staphylococcus, Bacillus spp., other Salmonella spp.). In humans, as summarized in Table 8, diarrhoea, from all causes, accounts for nearly one-third of disability attributed to infectious and parasitic diseases in South and East Asia and thus is the leading cause of disability related to infectious conditions. In Southeast Asia, diarrhoea in only surpassed by TB (zoonotic and non-zoonotic) as an infectious cause of human disability. Unfortunately, the WHO 2004 GBD does not provide information on age-specific burden or cause of diarrhoea. With respect to age-specific incidence of diarrhoea, Fischer Walker et al. (2012) report that incidence is highest in children of six to 11 months, 4.5 episodes/child/year, thereafter declining to 2.3 episodes/child/year in children aged 24 to 59 months. Diarrhoea is responsible for slightly above 20 percent of child mortality in Asia (Boschi-Pinto et al. 2008), diarrhoea-specific mortality per 100 child-years being 0.12 in the region (i.e. around 120 child deaths per 100 000 children per year from diarrhoea) (Fischer Walker et al. 2012). Adult mortality from diarrhoea is considerably lower at around 0.03 deaths per 100 person years. The pathogens causing most diarrhoeal disease are Entamoeba histolytica, (10.7 percent), Shigella spp. (9.3 percent) and enterotoxigenic Escherichia coli (4.6 percent). In developing countries, most deaths due to diarrhoea are attributed to enterotoxigenic E coli (28.2 percent) and Vibrio cholerae (20.7 percent); while in developed countries most deaths are caused by Campylobacter (14 percent) and Salmonella spp. (11.5 percent) (P.

147
Otto, personal communication). These estimates are however based limited data and do not account for regional differences. In developed countries, several reviews (Schlundt et al. 2004; Flint et al. 2005) argue the majority of gastrointestinal disease burden is due to zoonotic pathogens (>50 percent). A recent study from the United States estimated that 75 percent of the food-borne disease burden was due to bacterial or protozoal zoonoses (Hoffman et al. 2012). Given the lack of age-cause-region-specific information on diarrhoea DALYs, any estimate of the burden of zoonotic diarrhoea is highly uncertain. Taking 10 percent attribution to zoonotic pathogens as lower bound and 33 percent as upper bound would yield intervals of 168-560, 26-87 and 64-215 DALYs/100 000 population in South, East and Southeast Asia respectively.
Leptospirosis
In livestock, leptospirosis is associated with abortion, still-birth, infertility and milk reduction in cattle and swine. There are few good data on losses associated with leptospirosis in developing countries. In Australia, total loss was estimated at 2.2 percent at the herd level (Holroyd 1980). In Viet Nam, infection with some serovars correlated with one less live pig per litter, equivalent to 8 percent loss of production (Boqvist et al. 2002). In humans the median global incidence of endemic leptospirosis is 5 cases per 100 000 population with incidence in males exceeding that in females (WHO 2011). Table 9 displays estimated annual incidence classes of human leptospirosis in Asian countries.
Table 9. Human leptospirosis incidence in Asian countriesCountry Cases/100 000 Cases
Bangladesh >10 > 15 050
Nepal >10 > 2 650
India 1 to 10 11 170 to 111 700
Sri Lanka >10 > 1 900
China 1 to 10 13 120 to 131 200
Mongolia 1 to 10 25 to 250
Cambodia >10 > 1 370
Lao PDR >10 > 550
Indonesia 1 to 10 2 230 to 22 300
Malaysia 1 to 10 250 to 2 500
Philippines 1 to 10 830 to 8 300
Thailand >10 > 6 250
Viet Nam >10 > 8 380
Source: Victoriano et al. (2009).

148
Humans infected with Leptospira spp. normally suffer from acute febrile illness, which may be accompanied by acute renal injury (36 percent of cases) and/or acute lung injury (17 percent of cases) with case fatalities of 12 percent and 25 percent respectively (WHO 2011).
Cysticercosis
In livestock, losses are associated with condemnation of affected meat. In Mexico, prevalence of around 1.6 percent was associated with losses of US$68 million (Stabenow et al. 1987) while in Cameroon a prevalence of 5.6 percent was estimated to cost the pig industry nearly €500 000 a year (Praet et al. 2009). In humans, the most significant aspect of the findings on the neuro-cysticercosis burden, which was undertaken by way of a comprehensive review of 567 research articles between 1990 and 2008, reinforced the association between the disease and epilepsy. It showed that 30 percent of all people with epilepsy in countries where the pork tapeworm is frequent also had neuro-cysticercosis, which implied that successful interventions that reduced the burden of neuro-cysticercosis could result in concomitant decline in the burden of epilepsy.
Tuberculosis
Muller (2010) summarizes a range of early reviews from Europe and North America before control was widespread. Infected cattle lost 10 percent of milk production and 4 percent of meat production and infected cows had one fewer calves. Unfortunately, good economic data are missing from developing countries but similar losses could be anticipated. TB lesions are also an important reason for carcass condemnation but it seems likely that routine meat inspection misses most cases (Biffa et al. 2010). Agricultural losses worldwide have been estimated at US$3 billion (Garnier et al. 2003). Taking the conservative estimate of Cosivi et al. (1998), who estimated worldwide the proportion of TB caused by M. bovis at 3.1 percent, zoonotic TB is responsible for at least 330, 115 and 15 000 DALYs per year in South, East and Southeast Asia (22, 8 and 27 DALYs/100 000 population). The literature review of Grace et al. (2012) suggests the proportion of zoonotic TB to actually be higher.
Rabies
The recorded incidence of rabies deaths in Asian countries in 2004 is displayed in Table 10. Most (60 percent) cases of rabies occur in children between 0 and 12 years of age and Coleman et al. (2004) estimate a weighted average DALY of 33.1 for rabies associated mortality. This estimated DALY impact is conservative because it considers only the years of life lost (YLL) component and does not takes into account years of life lived with a disability (YLD) resulting from the illness associated with the trauma of animal bites and postexposure therapy, if available.

149
Table 10. Human rabies deaths and postexposure prophylactic treatments (PEP), Asia, 2004
Country Deaths DALYs1 DALYs/100,000 Post-exposure treatments
PEP cost2 (US$ million)
Bangladesh 1 550 50 568 33.6 60 000 2.70
India 17 000 554 621 49.7 2 500 000 11.25
Nepal 44 1 435 5.4 25 000 1.13
Pakistan 2 490 81 236 52.3 69 000 31.05
Sri Lanka 76 2 479 13.0 80 000 36.00
China 2 009 65 543 5.9 7 000 000 315.00
Mongolia 2 65 2.6 62 2.79
Cambodia 2 65 0.5 12 000 0.54
Lao PDR 2 65 1.2 3 000 0.14
Indonesia 40 1 305 0.6 8 800 0.40
Philippines 248 8 091 9.8 102 148 4.59
Thailand 26 848 1.4 200 000 9.00
Viet Nam 30 979 1.7 635 000 28.56
1 @ 33.1 YLL/rabies death2 @ US$45/treatmentSource: Miranda (2006).
The cost of postexposure treatments, which typically is around US$40 to US$49, amounted to around US$500 million in 2004.
Leishmaniasis
Equids are occasionally infected by leishmaniasis but it is not a significant disease in other livestock. According to the WHO GBD study, DALYs for leishmaniasis in Asia’s subregions are 1.4 million in South Asia, 1 000 in East Asia and 40 000 in Southeast Asia (Table 8).
Brucellosis
Sero-positive animals have higher rates of abortion, stillbirth, infertility, calf mortality and lameness. This is associated with lower milk yields (around 25 percent milk loss in aborted cows). The losses are estimated at 6-10 percent of the annual value produced per animal (Mangen et al. 2002). WHO estimates that half a million cases are reported worldwide every year, and that for every case diagnosed there are four cases which go undetected (Puvar 2007). Disease incidence and prevalence rates vary widely among nations. Because of variable reporting, true estimates in endemic areas are unknown. Incidence rates of 1.2-70 cases per 100 000 people are reported. Human brucellosis carries a low mortality rate (< 5 percent), however, brucellosis can cause chronic debilitating illness with extensive morbidity. Worldwide, brucellosis is more common in males than in females, with a ratio of 5:2-3 in endemic areas. Brucellosis in children comprises 3-10 percent of reported cases worldwide, with a heavier burden in endemic areas.

150
Echinococcosis
The loss to the global livestock industry is estimated at around US$2 billion annually and the cost of illness in people is around the same (Torgerson et al. 2010). A preliminary estimate of the global disease burden due to alveolar echinococcosis (AE) put the number of cases at 30 300 per year of which 10 381 cases were food related. More recently, Torgerson et al. (2010) estimated that there are approximately 18 235 (CIs 11 900-28 200) new cases of AE per annum globally with 16 629 (91 percent) occurring in China and 1 606 outside China. Most of these cases are in regions where there is little treatment available and therefore will be fatal. Based on disability weights for hepatic carcinoma and estimated age and gender specific incidence of AE, a median of 666 434 DALYs per annum (CIs 331 000-1.3 million) has been estimated (idem).
Toxoplasmosis
Toxoplasmosis is a leading cause of abortion in sheep and goats. A study by Reading University estimated the costs to the sheep industry of the UK at between GBP12 million and 24 million each year. The annual economic impact of toxoplasmosis in the United States livestock was estimated to be US$7.7 billion in 1996 (Buzby et al. 1996). A study in the Netherlands found that toxoplasmosis caused the highest health burden of seven pathogens investigated (including Salmonella, Campylobacter, Norovirus and Rotavirus) (Kemmeren et al. 2006).
Q-fever
The economic consequences of the Q-fever epidemic that occurred between 2007 and 2010 in the Netherlands was estimated at €161 to €336 million. Loss in quality of life of affected people amounted to about €67 to €145 million and loss of work-days to €12.5 to €96.5 million (Tempelman et al. 2011). Respiratory disease is a major cause of human sickness and death and a certain proportion is due to zoonotic diseases such as Q-fever. However, no reliable estimates on the possible contribution of zoonoses to the respiratory disease burden could be found.
Food-borne trematodiases
Fuerst et al. (2012) estimated that in 2005 about 56.2 million people were infected with food-borne trematodes, 7.9 million had severe sequelae and 7 158 died. Taken together, the global burden of food-borne trematodiasis was estimated at 665 352 DALYs. Food-borne trematodiases are relatively frequent in East and Southeast Asia, where they accounted for around 440 and 160 000 DALYs in 2005, figures that are slightly above the DALY estimates for JE.
Impact of AMRThe nature of the ‘cost’ to society associated with resistant micro-organisms has been described in the introduction to this section. Most of the losses and impacts relate to failure of treatments and disease control programmes, increased severity and longevity of diseases, increased mortality, reduced productivity, increased risk of disease spread and therefore increased costs to society as a whole.

151
Unfortunately no quantitative information on these costs could be found in the published literature for Asian countries and therefore some examples will be taken from other countries. In the United States, for example, Roberts et al. (2009) estimated infection with resistant microbes to be associated with an 11-day increase of hospitalization, increasing medical costs per patient by around US$20 000 and a 2.2-fold increased risk of death. The total attributable hospital and societal cost for 1 391 patients included in the study were: hospital, US$3.4-5.4 million; mortality, US$7.0-9.2 million; lost productivity, US$162 624-322 707; and total, US$10.7-US$15.0 million (i.e. around US$10 000 per hospitalized patient). Nationally, for the United States, the costs associated with AMR in out-patient settings, a fraction of those for hospitalized patients, have been estimated to be between US$400 million and US$18.6 billion (Okeke et al. 2005).
RESPONSES TO MITIGATE DISEASE RISKThe far-reaching and costly externalities of disease and disease risk warrant major public sector involvement and international cooperation and coordination in disease risk management. Current emphasis in disease control and prevention is on disrupting transmission, with early warning, early detection and early response mechanisms also targeting emerging pathogens. Whilst critically important, this approach does in itself not confront the root causes of disease, and as such is reactive rather than proactive leading to post-hoc corrective actions as opposed to farsighted ex-ante risk management. Public policy and international funding agencies should address this weakness and promote a more holistic, multidisciplinary approach to agriculture and health research and risk management that addresses the root causes of disease burdens and risk. In addition to the traditional elements of early detection (surveillance) and rapid response (contingency plans) this more proactive approach to disease risk management would include foresight, prevention and ex-ante impact mitigation. Foresight capacity builds on visioning exercises that systematically scan the horizons to identify sources of pathogens as well as pathways and drivers of emergence, leading to the identification of geographic hotspots and risky practices. A profound understanding of the demographic, cultural, economic, environmental, climatic, evolutionary and social factors that contribute to the emergence and intensification of infectious diseases is required for this process. Given the complex dynamics of disease emergence foresight exercises require intimate interdisciplinary collaboration and build on mining and fusion of data from a broad array of sources. Prevention and ex-ante impact mitigation build on insights gained from improved understanding of the implications of intensification and climate change on diseases to propose preventive actions aimed at reducing the likelihood of pathogen emergence and spread by specifically tackling significantly influential drivers, and to devise interventions that increase institutional, economic and environmental resilience against novel pathogens. Unfortunately, investments in prevention and impact mitigation face major incentive problems such as: (i) today’s investment costs have to be justified against the uncertainty of disease-related losses avoided at some time in the future, and (ii) sources and targets of investment funding may have to diverge to achieve the highest possible global protection from emerging diseases.
152
Given the stochastic element of infectious disease emergence and spread, even the most massive investment in disease intelligence cannot perfectly predict or entirely prevent pathogen emergence and a comprehensive system of disease risk management that couples early detection with rapid reaction capacity to swiftly and determinately tackle diseases at, or close to, source before spread has surpassed a critical threshold is needed. Early detection of potential pathogens needs to combine active scanning of a multitude of host species, which include wildlife, food and companion animals, and humans with the rapid ‘connection’ of passively obtained information on unusual health events in the socio-ecological interface that links livestock, wildlife and humans. Advances in high throughput screening and information technology systems offer the possibility of real-time epidemiology for early detection of disease events. To achieve maximum benefits, such a surveillance and rapid response system needs to operate as a global health network reporting to highest levels of decision-making. Broadening of health management towards the creation of safer, more disease-resilient landscapes goes beyond the veterinary and medical services. The aforesaid global health management system requires significant improvements in the integration of activities of the diverse organizations and institutions involved in agricultural development, food production and trade, and human and animal health protection. Alignment of activities and improvements in coordination are necessary both horizontally, i.e. between various actors operating on a similar scale and administrative level, e.g. province or national, as well as vertically, i.e. from local to national to regional and global levels. The divisions between different actors involved in agricultural development and health protection and their often narrowly defined remits stand in the way of forming broad coalitions to improve health outcomes and agreement on priorities is hampered by the lack of comprehensive and systematically collected data. This dearth of information is particularly acute in the area of zoonoses, which are neither considered priority human health problems nor priority animal health problems yet can have pervasive impacts across national economies.
SYNTHESISOver the next decades global food production has to grow significantly to feed the growing and more affluent human population. Producing more food will require expansion of agricultural areas and intensification of agricultural production. Disproportionate increases in the demand for animal source food and for other higher-value food items, such as fruits and vegetables, vis-à-vis staples are major determinants of agricultural development. Both expansion of agricultural areas, e.g. through deforestation, and intensification of food production, be it through expansion of irrigation for crops or industrialization of animal production, are associated with changing risks to human health from micro-organisms harboured by wildlife and/or domesticated animals. This process of disease emergence is as old as humankind itself and many infectious diseases of humans have their origins in animals. Agricultural expansion and intensification however are catalysts for disease emergence as established agro-ecologies are disrupted and new ecologies are established. It is therefore not surprising that over the past 70 years most zoonotic diseases emerged in ‘industrialized’ regions of the world, which experienced dramatic changes in their

153
agricultural systems in the second half of the twentieth century, while it appears that for more recent emergence events the balance tends to swing towards developing regions. Similar epidemiological transitions were seen when livestock were first domesticated (Wolfe et al. 2007) and when new frontiers were opened by war or transport innovations (Grace and McDermott 2011). A major feature of the contemporary global food system is the vast increase in trade volumes (for food and non-food commodities, the latter being a risk for vector translocation), distances and speed, greatly enhancing the potential for disease spread once it has ‘escaped’ from its original ecosystem. Increased trade in wildlife, licit and illicit, further increases the risk of micro-organisms finding a niche in a new environment. Emerging zoonoses, as well as established zoonoses, whose incidence may however also be affected by agricultural expansion and intensification (and thus qualify as ‘emerging’) have major direct and indirect economic and welfare impacts. One of the main economic impacts of novel zoonoses is revenue foregone through diminished economic activity prompted by precautionary behaviour of large segments of society (often fuelled by mass media). This reduction in economic activity is then not limited to the sector in which the disease emerged but also affects affiliated sectors and the economy at large and has international spillovers. General precautionary and preventive measures (e.g. quarantines, import bans, premovement testing, restraint in antimicrobial use etc), both public and private, constitute a second financial and economic burden of zoonotic (and other) diseases for society. Efforts to control diseases, either endemic or epidemic, impose further costs while the disease itself and resulting productivity and welfare losses, both in animals and humans in the case of zoonoses, represent a fourth category of disease cost. No metric combining the above elements exists nor has a standardized approach for the assessment of disease costs been developed and applied. Priority setting for disease control thus remains a rather arbitrary exercise. A systematic assessment of the full cost of disease across diseases, species (including humans), countries and time would face serious difficulties from the scarcity of comprehensive and comparable data. Zoonoses especially have high under-reporting in both veterinary and medical sectors. ENhanCE (undated) reviewed 12 methods of disease prioritization. Two were global (FAO/OIE and WHO), one focused on Rajasthan in India, while the rest focused on developed countries. A variety of methods were used: a risk assessment approach, multicriteria decision tools and qualitative methods. Together the studies reviewed covered animal diseases, human diseases and zoonoses. Of the 99 diseases appearing in the rankings reviewed, 33 were zoonoses. Zoonoses appearing in multiple listings according to the ENhanCE review, in declining order of number of appearances, were: • Salmonellosis • Leptospirosis = rabies • Campylobacteriosis = tuberculosis = West Nile virus = toxoplasmosis • Listeriosis = anthrax = echinococcosis = E. coli infection = BSE = botulism • Cryptosporidiosis = Japanese encephalitis = Q fever = Rift Valley fever = tetanus The DALYs method for quantification of human disease burden is useful as an initial guide to which human diseases cause relatively high losses, however in themselves they are insufficient to guide investment as the latter should be determined by DALYs averted

154
per dollar of investment. Nevertheless, comparison of DALYs across selected diseases and Asian subregions (Table 11) provides some indications as to which endemic zoonotic diseases/disease complexes might warrant particular attention by public health systems. In South Asia, conservatively assuming 10 percent of diarrhoea DALYs are of zoonotic aetiology, food-borne diseases rank highest by far, followed by leishmaniasis, JE and rabies. In East Asia, in addition to zoonotic diarrhoea, food-borne parasitic diseases appear to be the cause of considerable disease burdens. In Southeast Asia, in addition to zoonotic diarrhoea, food-borne trematode infections, zoonotic TB and JE seem to be responsible for the highest human disease burdens. It should be noted that the disease list is incomplete (e.g. no DALYs figures are available for leptospirosis or brucellosis) and therefore is at best indicative.
Table 11. DALYs/100 000 for selected zoonoses in Asian subregionsS. Asia E. Asia SE Asia
Diarrhoea (total) 1 680 261 644
Diarrhoea (33% zoonotic) 560 87 215
Diarrhoea (10% zoonotic) 168 26 64
TB (10% zoonotic) 22 8 27
TB (5% zoonotic) 11 4 13
Leishmaniasis 94 0 7
Japanese Encephalitis 82 9 22
Rabies 47 5 3
Alveolar echinococcosis 0 461 0
Food-borne trematodiases 0 34 33
1 Approximately 1/3 food-borne.
Even if the above estimates of disease burden are only indicative, it is clear that food-borne diseases cause significant disease burden; enhancing food safety (and general hygiene/sanitation) should be one of the priorities of public health systems throughout Asia. Although causing far less loss of human life and disability, recent emergence of zoonotic pathogens in East and Southeast Asia − in several cases linked to amplification of wildlife micro-organisms in livestock populations, tremendous downturn in economic activity and shock to livelihoods associated with the episodes, and the relatively high ratio of pigs to humans in these regions (the former regarded as ideal ‘mixing vessels’ for pathogens and adaptation to humans, e.g. influenza viruses) − warrant national and international efforts to minimize risks of disease emergence and to implement surveillance systems, in humans and livestock, to identify emerging pathogens before they spread widely.
REFERENCESAlexander, D.J. 2006. Avian influenza viruses and human health. Dev. Biol., 124: 77-84. Alexandratos, N. et al. 2006. World agriculture: towards 2030/2050. Interim report. Rome,
FAO.

155
Australian Pesticides and Veterinary Medicines Authority (APVMA). 2005. Quantity of antimicrobial products sold for veterinary use in Australia 1999/2000 - 2001/2002. 11 p.
Begum, K. et al. 2010. Isolation, identification and antibiotic resistance pattern of Salmonella spp. from chicken eggs, intestines and environmental samples. Bangladesh Pharmaceutical Journal, 13(1): 23-27.
Bennett, M. 2006. Bats and human emerging diseases. Epidemiol. Infect., 134: 905-907.
Bett, B., Henning, J., Abdu, P., Okike, I., Poole, J., Young, J., Randolph, T.F. & Perry, B.D. In press. Transmission rate and reproductive number of the H5N1 Highly Pathogenic Avian Influenza virus during the December 2005 – July 2008 epidemic in Nigeria. Transboundary and Emerging Diseases.
Biffa, D., Bogale, A. & Skjerve, E. 2010. Diagnostic efficiency of abattoir meat inspection service in Ethiopia to detect carcasses infected with Mycobacterium bovis: Implications for public health, BMC Public Health, 10: 462.
Boqvist, S., Thi, H.T., Vagsholm, I. & Magnusson, U. 2002. The impact of Leptospira seropositivity on reproductive performance in sows in southern Viet Nam. Theriogenol., 58: 1327-1335.
Boschi-Pinto, C. et al. 2008. Estimating child mortality due to diarrhoea in developing countries. Available at: www.who.int/bulletin/volumes/86/9/07-050054/en/index.html
Buzby, J.C. & Roberts, T. 1996. ERS updates U.S. foodborne disease costs for seven pathogens. Economic Research Service (ERS), United States Department of Agriculture (USDA). Food Rev., 19(3): 20-25.
Capua, I. & Alexander, D.J. 2004. Avian influenza: recent developments. Avian Pathology, 33(4): 393-404.
Chokboonmongkol, C. et al. 2012. Characterization of campylobacter spp. isolated from broiler flocks in Chiang Mai, Thailand. In Proceedings of the 37th ICVS, p. 88.
Coleman, P.G. et al. 2004. Estimating the public health impact of rabies. Emerging Infectious Diseases, 10(1): 140-142.
Cosivi, O., Grange, J.M., Daborn, C.J., Raviglion, M.C., Fujikura, T., Cousins, D., Robinson, R.A., Huchzermeyer, H.F.K.A., Kantor, I.D. & Meslin, F.X. 1998. Zoonotic tuberculosis due to Mycobacterium bovis in developing countries. Emerging Infectious Diseases, 4: 59-70.
Daszak, P. 2009. Can we predict future trends in disease emergence? In D.A. Relman, M.A. Hamburg, E.R. Choffnes & A. Mack, eds. Microbial evolution and co-adaptation: a tribute to the life and scientific legacies of Joshua Lederberg, pp. 252-269. Washington, DC, Institute of Medicine.
Dawood, F.S. et al. 2012. Estimated global mortality associated with the first 12 months of 2009 pandemic influenza A H1N1 virus circulation: a modelling study. Lancet Inf. Dis. Available at: http://dx.doi.org/10.1016/S1473-3099(12)70121-4
ECDC. 2012. Assessing the potential impacts of climate change on food- and waterborne diseases in Europe. Technical Report, 19p.
European Medicines Agency (EMA). 2011. Trends in the sales of veterinary antimicrobial agents in nine European countries – reporting period 2005 – 2009.

156
ENHanCE. Undated. Quantitative and qualitative approaches to the prioritisation of diseases. Position paper 1. University of Liverpool, UK, National Center for Zoonoses Research.
Erlanger, T.E. et al. 2009. Past, present, and future of Japanese encephalitis. Emerging Infectious Diseases, 15(1): 1-7.
Ercsey-Ravez, M. et al. 2012. Complexity of the International Agro-Food Trade Network and its impact on food safety. PLoS ONE, 7(5): e37810. DOI:10.1371/journal.pone.0037810.
FAOSTAT. 2012. FAO statistical databases. Available at: www.faostat.fao.org/site/452/default.aspx.
Fischer Walker, C.L. et al. 2012. Diarrhea incidence in low- and middle-income countries in 1990 and 2010: a systematic review. BMC Public Health, 12: 220. Available at: http://www.biomedcentral.com/1471-2458/12/220
Flint, J. et al. 2005. Estimating the burden of acute gastroenteritis, foodborne disease, and pathogens commonly transmitted by food: An international review. Clinical Infectious Diseases, 41: 698-704.
Fuerst, T. et al. 2012. Global burden of human food-borne trematodiasis: a systematic review and meta-analysis. Lancet Inf. Dis., 12: 210-21.
Galvani, A. et al. 2003. Epidemiology meets evolutionary ecology. TRENDS in Ecology and Evolution, 18(3): 132-139.
Gannon, V., Grace, D. & Atwill, R.W. 2012. Zoonotic waterborne pathogen loads in animal populations. In J. Bartram, ed. Animal waste, water quality and human health. Geneva, WHO.
Garnier, T. et al. 2003. The complete genome sequence of Mycobacterium bovis. PNAS USA, 100(13): 7877-82.
Garten, R.J. et al. 2009. Antigenic and genetic characteristics of swine-origin 2009 A(H1N1) influenza viruses circulating in humans. Science, 325: 197-201.
Gilchrist, M. et al. 2007. The potential role of concentrated animal feeding operations in infectious disease epidemics and antibiotic resistance. Env. Health Perspect., 115: 313-316.
Grace, D. & McDermott, J. 2011. Livestock epidemics and disasters. In Kelman et al., eds. Handbook of hazards and disaster risk reduction. Routledge.
Grace, D. et al. 2011. Zoonoses (Project 1) Wildlife/domestic livestock interactions: A final report to the Department for International Development, UK. Nairobi, International Livestock Research Institute.
Grace, D. et al. 2012. Mapping of poverty and likely zoonoses hotspots. A final report to the Department for International Development, UK. Nairobi, International Livestock Research Institute.
Guan, Y. et al. 2003. Isolation and characterization of viruses related to the SARS coronavirus from animals in southern China. Science, 302: 276-278.
Hai, W. et al. 2004. The short-term impact of SARS on the Chinese economy. Asian Economic Papers, 3(1): 57-61.
Hoa, N.T. et al. 2011. The antimicrobial resistance patterns and associated determinants in Streptococcus suis isolated from humans in southern Vietnam, 1997-2008. BMC Infectious Diseases, 11: 6. Available at: http://www.biomedcentral.com/1471-2334/11/6

157
Hoffmann, S., Batz, M.B., Morris, J. & Glenn, J. 2012. Annual cost of illness and quality-adjusted life year losses in the United States due to 14 foodborne pathogens. Journal of Food Protection, 75(7): 1292-1302.
Holroyd, R.G. 1980. Leptospira interrogans serovar hardjo vaccination of pregnant beef cows and subsequent growth rate of progeny. Australian Veterinary Journal, 56: 481-483.
Hosono, H. et al. 2006. Economic impact of Nipah virus infection outbreak in Malaysia. In Proceedings of the 11th ISVEE, 2006.
Howard, D.H. et al. 2003. The global impact of drug resistance. Clinical Infectious Diseases, 36(Supplement 1): S4-10.
Johnson, R. 2009. Potential farm sector effects of 2009 H1N1 “swine flu”: questions and answers. Congressional Research Service, www.crs.gov
Jones, J.L. & Dubey, J.P. 2012. Foodborne toxoplasmosis. Clin. Infect. Dis., 55(6): 845-851.
Jou, R. et al. 2008. Human tuberculosis caused by Mycobacterium bovis, Taiwan. Emerging Infectious Diseases, 14(3): 515-517.
Kemmeren, J.M., Mangen, M.-J.J., van Duynhoven, Y.T.H.P. & Havelaar, A.H. 2006. Priority setting of foodborne pathogens: Disease burden and costs of selected enteric pathogens. RIVM report 330080001/2006.
Kida, H. et al. 1994. Potential for transmission of avian influenza viruses to pigs. J. Gen. Virol., 75: 2183-88.
Lau, S.K.P. et al. 2005. Severe acute respiratory syndrome coronavirus-like virus in Chinese horseshoe bats. PNAS USA, 102: 14040-14045.
Lay, K.K. et al. 2012. Antibiotic resistance and virulence genes of Escherichia coli isolated from swine. In Proceedings of 37th ICVS, p. 87.
Lay, K.S. et al. 2011. Prevalence and antimicrobial susceptibilities of Salmonella serotypes and Campylobacter spp. in retail poultry, PP markets, Cambodia, 2006-2007. J. Vet. Med. Sci., 73(3): 325-329.
Lee, C.W. et al. 2004. Effect of vaccine use in the evolution of Mexican lineage H5N2 avian influenza virus. Journal of Virology, 78(15): 8372-8381.
Li, W. et al. 2005. Bats are natural reservoirs of SARS-like coronaviruses. Science (Washington), 310: 676-683.
Li, L.L. et al. 2012. Antimicrobial resistance, serotypes, and virulence factors of Streptococcus suis isolates from diseased pigs. Foodborne Pathogens and Diseases, 9(7): 583-588.DOI:10.1089/fpd.2011.1106
Lycett, S.J. et al. (2012). Estimating reassortment rates in co-circulating Eurasian swine influenza viruses. J. Gen. Virol., published online ahead of print September 12, 2012, DOI:10.1099/vir.0.044503-0
Maldonado, J. et al. 2006. Evidence of the concurrent circulation of H1N2, H1N1 and H3N2 influenza A viruses in densely populated pig areas in Spain. Vet. J., 172(2): 377-381.
Mangen, M.-J.J. et al. 2002. Bovine brucellosis in Sub-Saharan Africa. Estimation of seroprevalence and impact on meat and milk offtake potential. Livestock Policy Discussion Paper No. 8. FAO.
McLeod, A. & Dolberg, F. 2007. Future of poultry farmers in Viet Nam after HPAI. FAO and MARD workshop held at Horizon Hotel, Hanoi, 8-9 March 2007.
158
Mellon, M., Benbrook, C. & Benbrook, K.L. 2001. Hogging it. Estimates of antimicrobial abuse in livestock. Cambridge, MA, UCS Publications.
Men, B.X. 2007. Duck farming systems and avian influenza in the Mekong Delta of Viet Nam. Report Submitted to FAO. 16 p.
Miranda, E.G. 2006. Epidemiology of rabies in Asia. Presentation made at the WHO Global Vaccine Research Forum, Bangkok, December 2006.
Muller, B.I. 2010. Molecular epidemiology and diagnosis of Mycobacterium bovis infections in African cattle. Switzerland, University of Basel. PhD thesis
NaRanong, V. 2007. Structural changes in Thailand’s poultry sector and its social implications. In Proceedings of the FAO Conference ‘Poultry in the 21st Century, Avian Influenza and Beyond’, 35 p.
Nelson, M.I. et al. 2012. The evolution of novel reassortant A/H3N2 influenza viruses in North American swine and humans, 2009–2011. J. Virol. JVI.00259-12; published ahead of print 13 June 2012.
Nordin, M.N. 2001. Overview of Nipah virus infection in peninsular Malaysia. In Report of the 25th APHCA Session, pp. 123-126.
Okeke, I.N. et al. 2005. Antimicrobial resistance in developing countries. Part I: recent trends and current status. Lancet Infect. Dis., 5: 481-493.
Otte, J, et al. 2008. Impacts of avian influenza virus on animal production in developing countries. CAB Reviews: Perspectives in Agriculture, Veterinary Science, Nutrition and Natural Resources, 3, No. 080.
Pfeffer, M. & Dobler, G. 2010. Emergence of zoonotic arboviruses by animal trade and migration. Parasites and Vectors, 3(8 April 2010).
Peiris, J.S.M. et al. 2001. Cocirculation of avian H9N2 and contemporary “human” H3N2 influenza A viruses in pigs in southeastern China: potential for genetic reassortment? Journal of Virology, 75(20): 9679-9686.
Power, C. 2005. The source and means of spread of the avian influenza virus in the Lower Fraser Valley of British Columbia during an outbreak in the winter of 2004 – an interim report, Feb 2005. Available at: www.inspection.gc.ca
Puvar, S. 2007. Human brucellosis: a burden of half-million cases per year. Editorial. Southern Medical Association, 1074.
Praet, N. et al. 2009. The disease burden of Taenia solium cysticercosis in Cameroon. PLoS Negl. Trop. Dis., 3(3): e406.
Roberts, R.R. et al. 2009. Hospital and societal costs of antimicrobial-resistant infections in a Chicago teaching hospital: implications for antibiotic stewardship. Clinical Infectious Diseases, 49: 1175-1184.
Robinson, T.P. et al. 2011. Global livestock production systems. FAO and ILRI. 152 p.Schelling, E., Grace, D., Willingham, A.L. & Randolph, T.F. 2007. Which research
approaches for pro-poor control of zoonoses? Food Nutr Bull., (Supplement 2): S345-56.
Schlundt, J., Toyofuku, H., Jansen, J. & Herbst, S.A. 2004. Emerging food-borne zoonoses. Rev. Sci. et Tech. Off. Int. Epiz., 23(2): 513-533.
Schulz, U. et al. 1991. Evolution of pig influenza viruses. Virology, 183: 61-73.Shieh, H.K. et al. 2008. Surveillance of avian and swine influenza in the swine population
in Taiwan, 2004. J. Microbiol. Immunol. Infect., 41(3): 231-242.

159
Singh, B.B., Sharma, R., Sharma, J.K. & Juyal, P.D. 2010. Parasitic zoonoses in India: an overview. Rev. Sci. et Tech. Off. Int .Epiz., 29(3): 629-637.
Singh, B.B., Sharma, R., Gill, J.P.S., Aulakh, R.S. & Banga, H.S. 2011. Climate change, zoonoses and India. Rev. Sci. et Tech. Off. Int. Epiz., 30(3): 779-788.
Siu et al. Undated. Economic impacts of SARS: the case of Hong Kong.Smith, G.J.D. et al. 2009. Origins and evolutionary genomics of the 2009 swine-origin
H1N1 influenza A epidemic. Nature, 459: 1122-1126; DOI:10.1038/nature08182Stabenow, M.B. et al. 1987. Aspectos clínicos, laboratoriais, epidemiológicos e de controle
das Teníases/Cisticercoses. In Congresso Brasileiro de Zoonoses, I, Rio de Janeiro, 1987; Anais, pp. 57-60.
Stegeman, A. et al. 2004. Avian influenza A Virus (H7N7) epidemic in the Netherlands in 2003: course of the epidemic and effectiveness of control measures. J. Infect. Dis., 190: 2088-2094.
Susilawathi, N.M., Darwinata, A.E., Dwija, I.B., Budayanti, N.S., Wirasandhi, G.A., Subrata, K, Susilarini, N.K., Sudewi, R.A., Wignall, F.S. & Mahardika, G.N. 2012. Epidemiological and clinical features of human rabies cases in Bali 2008-2010. BMC Infect. Dis., 12: 81.
Taylor, L.H. et al. 2001. Risk factors for human disease emergence. Phil. Trans. R. Soc. Lond. B. Biol Sci., 356: 983-989.
Tello, A. et al. 2012. Selective pressure of antibiotic pollution on bacteria of importance to public health. Environ. Health Perspect., 120: 1100-1106. Available at: http://dx.doi.org/10.1289/ehp.1104650
Tempelman, C., Prins, J. & Koopmans, C. 2011. The economic impact of the Q fever outbreak. Netherlands, SEO Economic Research. In Dutch.
Tipu, M.Y. et al. 2012. A cross sectional study of mycobacterium bovis in and around Lahore city, Pakistan. Pakistan J. Zool., 44(2): 393-398.
Torgerson, P.R. et al. 2010. The global burden of Alveolar Echinococcosis. PLoS Negl. Trop. Dis., 4(6): e722. DOI:10.1371/journal.pntd.0000722
UN-ESCAP. 2012. www.unescap.org/stat/data/statdb/DataExplorer.aspxVan, T.T.H. et al. 2012. The antibiotic resistance characteristics of non-typhoidal Salmonella
enterica isolated from food-producing animals, retail meat and humans in South East Asia. International Journal of Food Microbiology, 154: 98-106.
Van der Sluis, W. 2012. Health challenges are top obstacles to full value pigs. Available at: www.pigprogress.net
Vana, G. & Westover, K.M. 2008. Origin of the 1918 Spanish influenza virus: a comparative genomic analysis. Mol. Phylogenet. Evol., 47(3): 1100-1110.
Victoriano, A.F.B. et al. 2009. Leptospirosis in the Asia Pacific region. BMC Infectious Diseases, 9: 147 DOI:10.1186/1471-2334-9-147
Webby, R.J. & Webster, R.G. 2001. Emergence of influenza A viruses. Phil. Trans. R. Soc. Lond. B., 356: 1817-1828.
Wolfe, N.D., Dunavan, C.P. & Diamond, J. 2007. Origins of major human infectious diseases. Nature, 447(7142): 279-283.
World Bank. 2010. People, pathogens and our planet. Volume 1: towards a one health approach for controlling zoonotic diseases. World Bank Report Number 50833-GLB, 74 p.

160
World Bank. 2012. People, pathogens and our planet. Volume 2: the economics of one health. World Bank Report Number 69145-GLB, 55 p.
World Health Organization (WHO). Undated. Nipah virus infection. WHO Regional Office for South-East Asia. Monograph. 9 p.
WHO. 2004. Global burden of disease 2004 update. Geneva, WHO.WHO. 2011. Report of the Second Meeting of the Leptospirosis Burden Epidemiology
Reference Group. Geneva, WHO.Woolhouse, M.E.J. et al. 2005. Emerging pathogens: the epidemiology and evolution of
species jumps. TRENDS in Ecology and Evolution, 20(5): 238-244.Xu, Z.Y. & Liu, W. Undated. Disease burden and cost-effectiveness of JE immunization. Zhou, N.N. et al. 1999. Genetic reassortment of avian, swine, and human influenza A
viruses in American pigs. J. Virol., 73(10): 8851-8856.

161
Annexure 1Good practices: List of presentations
Presenter Presentation titleTinni SawhneyProgramme DirectorSouth Asia Pro Poor Livestock Policy ProgrammeNDDB House, Safdarjung Enclave, New Delhi
Community-led good practices on smallholder livestock rearing
http://www.youtube.com/watch?v=H4XpdSDiGWs
Md. Ehsanul Bari Managing Director Grameen Motsho O Pashusampad Foundation (Grameen Fisheries & Livestock Foundation)Dhaka, Bangladesh
Community livestock and dairy development project
http://www.youtube.com/watch?v=NdfZsjJAEIk
Jagdeesh RaoExecutive Director Foundation for Ecological Security, India
Commoning the commons - rehabilitating community lands in India
http://www.youtube.com/watch?v=uqDxDRY3xsA
Girish Sohani, PresidentBharatiya Agroindustries Development Research Foundation
Experiences on small ruminants with reference to goats
http://www.youtube.com/watch?v=hyiWV0u76tU
Dr. Khieu BorinAdvisorCentre for Livestock and Agriculture Development Phnom Penh, Cambodia
Passing the gift: building social capital
http://www.youtube.com/watch?v=X15e-zf37Ig
Danilo “Danny” V. Fausto National Chairman Dairy Confederation of the PhilippinesFounder, Talavera Dairy Cooperative, Inc.President, DVF Dairy Farm, Inc.
DVF dairy farms
http://www.youtube.com/watch?v=YBuU6qMLDYY
Amphon Waritthitham Animal Husbandry OfficerAnimal Nutrition Research and Development CenterLampang, Thailand
Extension of grass production for dairy farms
http://www.youtube.com/watch?v=ctxC9tvMlV0
Patrice GautierDirector General – Dr VetAsian Veterinary & Livestock ServicesHanoi, Viet Nam
Experience in setting up of a small/medium for safe animal-derived products in Viet Nam
http://www.youtube.com/watch?v=5SGYEHIUSik
Over the last half a century, Asia and the Pacific region has shown remarkable resolve and results in providing plentiful inexpensive supplies of food and improving the quality of life for its citizens. But the future challenges of ensuring food and nutrition security for all its people remain equally daunting. At the same time, rapidly increasing demand for animal protein and the concomitant changes in the nature of production and marketing systems for livestock products are placing huge pressures on the natural resource base, biophysical environment and human, animal and ecosystem health in the region. To discuss effective ways of informing policy choices to promote sustainable livestock sector development, an international policy forum was organized in Bangkok on 16-17 August 2012. The forum brought together critical thinkers, policy makers and practitioners from around the region and a number of international agencies and networks. The group strongly recommended creating a neutral regional policy platform for facilitating regional cooperation, knowledge exchange, policy dialogue and catalytic action in pursuit of shared goals. This publication presents the discussions and conclusions of the policy forum and brings together a rich body of background analytical work prepared in support of the dialogue.
Vinod Ahuja is Livestock Policy Officer at the FAO Regional Office for Asia and the Pacific, Bangkok. Thailand