Embed Size (px)
Citation preview
Resources 2015, 4, 819-830; doi:10.3390/resources4040819
resources ISSN 2079-9276
www.mdpi.com/journal/resources
Article
Over Exploitation of Groundwater in the Centre of Amman Zarqa Basin—Jordan: Evaluation of Well Data and GRACE Satellite Observations
Sana’a Al-Zyoud 1,†,*, Wolfram Rühaak 2,3,†, Ehsan Forootan 4,† and Ingo Sass 2,3
1 Applied Earth and Environmental Sciences Department, Institute of Earth and Environmental
Sciences, Al al-Bayt University, P.O. Box 130040, Mafraq 25113, Jordan 2 Darmstadt Graduate School of Excellence Energy Science and Engineering,
Technische Universität Darmstadt, Jovanka-Bontschits-Straße 2, Darmstadt D-64287, Germany;
E-Mails: [email protected] (W.R.); [email protected] (I.S.) 3 Department of Geothermal Science and Technology, Technische Universität Darmstadt,
Schnittspahnstr. 9, Darmstadt D-64287, Germany 4 Institute of Geodesy and Geoinformation, Bonn University, Nussallee 17, Bonn 53115, Germany;
E-Mail: [email protected]
† These authors contributed equally to this work.
* Author to whom correspondence should be addressed; E-Mail: [email protected];
Tel.: +962-2-6297000 (ext. 2834).
Academic Editor: John A. Luczaj
Received: 2 July 2015 / Accepted: 2 November 2015 /Published: 6 November 2015
Abstract: Jordan faces a sincere water crisis. Groundwater is the major water resource in
Jordan and most of the ground water systems are already exploited beyond their estimated
safe yield. The Amman Zarqa Basin is one of the most important groundwater systems in
Jordan, which supplies the three largest cities in Jordan with drinking and irrigation water.
Based on new data the groundwater drawdown in the Amman Zarqa Basin is studied. This
basin is the most used drainage area in Jordan. Groundwater drawdown in eight central
representative monitoring wells is outlined. Based on almost continuous data for the last 15
years (2000–2015) an average drawdown for the whole basin in the order of 1.1 m·a−1 is
calculated. This result is in accordance with results of previous studies in other areas in
Jordan and shows that, until now, no sustainable water management is applied.
Groundwater management in such a basin presents a challenge for water managers and
OPEN ACCESS

Resources 2015, 4 820
experts. The applicability of satellite data for estimating large-scale groundwater over
exploitation, such as gravity products of the Gravity Recovery and Climate Experiment
(GRACE) mission, along with supplementary data, is discussed. Although the size of the
basin is below the minimum resolution of GRACE, the data generally support the
measured drawdown.
Keywords: groundwater drawdown; Amman Zarqa Basin; Jordan; GRACE
1. Introduction
Aim of this study is to present new data about the groundwater depletion in the Amman Zarqa Basin
in Jordan during 2000–2015. In addition to scattered and relatively sparse well data observations, GRACE
satellite data are evaluated to find out if a general groundwater loss is reflected in these gravity measurements.
1.1. Study Area
The Jordanian part of Amman Zarqa Basin (Figure 1) covers an area of 3739 km2 compared to
310 km2 in Syria [1]. This basin represents the transitional area between western hills and eastern
desert. The climatological conditions change from humid to arid leading to different land use patterns. The
western hilly areas are relatively densely populated, whereas the southeast areas are deserts and almost
without population. More than 60% of the population of Jordan [2] is located inside the basin. In the
areas of upper Zarqa, Baqa’a, Dhulail, and Jerash the groundwater is mainly used for irrigation.
According to [3] different agriculture products exist (cereals, vegetables, fruit trees). According to [4]
in 2010 22% of the land cover are urban, mixed rain-fed areas sum up to 37% and irrigated areas sum
up to 2.4%.
Figure 1. A simplified map of Jordan showing the location of the study area, the Amman
Zarqua Basin, and of the studied wells.

Resources 2015, 4 821
The three main aquifers in the Amman Zarqa Basin are formed by (1) a basaltic eruption at the top,
(2) a limestone aquifer in the middle, and (3) a sandstone aquifer at the bottom. The upper two aquifers
are hydraulically connected. They are underlain by a 20–35 m thick marl formation. The limestone
formation, called Amman—Wadi As Sir (B2/A7), is the most important aquifer in the basin. It has a
large and continuous extent together with a high hydraulic conductivity. It is considered as the main
source of fresh water for domestic, as well as irrigated agricultural, uses. The Amman Zarqa Basin is
underlain by the sandstones of the Kurnub-Ram Formations, which form a deeper aquifer system. The
Ajlun marl aquitard separates the sandstones from the Basalt Aquifer Complex [5].
The uppermost basaltic aquifer which is formed by highly vesicular lava flows has, based on
pumping tests, transmissivity values in the range from 5.0 × 10⁻⁵ to 5.4 × 10⁻¹ m2·s−1, the average is
about 8 × 10⁻² m2·s−1, corresponding to a mean hydraulic conductivity of 2.3 × 10⁻⁴ m·s−1. The
transmissivity of the limestone aquifer (B2/A7) varies between 5.4 × 10⁻⁵ and 2.5 × 10⁻² m2·s−1, the
average is about 5 × 10⁻³ m2·s−1, corresponding to a mean hydraulic conductivity of 8.1 × 10⁻⁵ m2·s−1 [6].
Mean discharge rate values in different areas of the basin are between 1 and 40 m3·h−1 corresponding with
transmissivity values of shallow basalt aquifer between 3.47 × 10⁻⁴ and 1.50 × 10⁻² m2·s−1.
The basalt sequence has a thickness of 100 m–300 m. Transmissivity values are estimated at around
1.0 × 10⁻² m2·s−1 with corresponding mean hydraulic conductivity of 2 × 10⁻⁴ to 6 × 10⁻⁴ m·s−1 [5].
1.2. Water Availability
Water availability is an important factor controlling human’s wealth and prosperity, especially
in arid and semi-arid regions [7]. Jordan has a water scarcity probably more serious than other
countries in the Middle East [8,9]. This shortage is due to many reasons, such as low rainfall of
100–150 mm·a−1 [9,10] with an annual rainfall decrease at an average rate of 1.2 mm [9], uneven water
distribution, high water volume losses due to evaporation, and an increasing demand on drinking and
agricultural water due to population growth [11]. Surface water resources are very limited in Jordan;
therefore, groundwater is the main water resource [6]. As a result, extensive groundwater pumping is
taking place in the Jordanian groundwater systems with the use of public and private wells. Rimawi
and Al Ansari [12] found that groundwater salinity in the upper aquifer complex in the north-eastern
part of the Al Mafraq area (Figure 1) has increased in the last decades. This is due to intensive
exploitation of groundwater for irrigation purposes. Salameh [13] showed the lowering trend for
some selected wells within the Jordanian area. He concluded that the major Jordan basins may be
beyond restoration.
El-Naqa et al. [14] found that Azraq Basin (the southeastern neighbor basin of Amman Zarqa
Basin) is suffering from groundwater drawdown due to extensive overexploitation. Bajjali et al. [15]
found that, in the central part of Amman Zarqa Basin, the groundwater level is declining
approximately one meter per year.
Ta’any et al. [1] applied geostatistics to analyze the spatial and temporal variations of groundwater
level fluctuations in 33 wells scattered in the Amman Zarqa Basin. They have been analyzed for the
period of 2001–2005. The annual drawdown in wells of [1] is ranging from 0.47 to 1.68 m. Five wells
of this study are common with the work of Ta’any et al. [1].
Resources 2015, 4 822
New groundwater level data from eight wells in the Amman Zarqa Basin have been studied. The
study area is about 28 km NE of Zarqa city (Figure 1), the second largest city in Jordan. Many
industrial infrastructures are located in the basin, such as the Jordanian Free Zone Areas, the refinery
of Jordan, and the Al Hussain power station; the main power station in Jordan. It is the largest
industrial city in Jordan. It is considered the most polluted area in Jordan.
In general, the water level is declining in almost all wells in the basin. The Ministry of Water and
Irrigation [16] reported that the declines in water level of the limestone aquifer (B2/A7) range between
0.67 m and 2.0 m per year. Al Mahamid [6] predicted that the maximum accumulative drawdown will
reach more than 70 m in the year 2025. He forecasted that some wells between Al Khalidiyya and
Umm Al Jimal—located in the middle basin area—will become completely dry. Margane et al. [17]
reported, too, that the exploitation of the limestone aquifer (A7/B2) has increased over the past decade,
so that water levels are rapidly declining in about 2 m·a−1.
The following recent data show that a continuous water level decline is happening in the upper
basaltic aquifer of Amman Zarqa Basin.
Remote sensing is a powerful technique for studying groundwater at regional scales [18]. In this
study the result of the field data is compared with GRACE satellite data.
2. Methods and Data
2.1. Well Data
The wells discussed in the following are located in the northeastern Jordanian desert in the center of
the Amman Zarqa Basin (Figure 1). Their records refer to the water level of the upper aquifer in
Amman Zarqa Basin. As this aquifer is an unconfined aquifer, a dropping water level, therefore,
reflects an actual decrease in reserves.
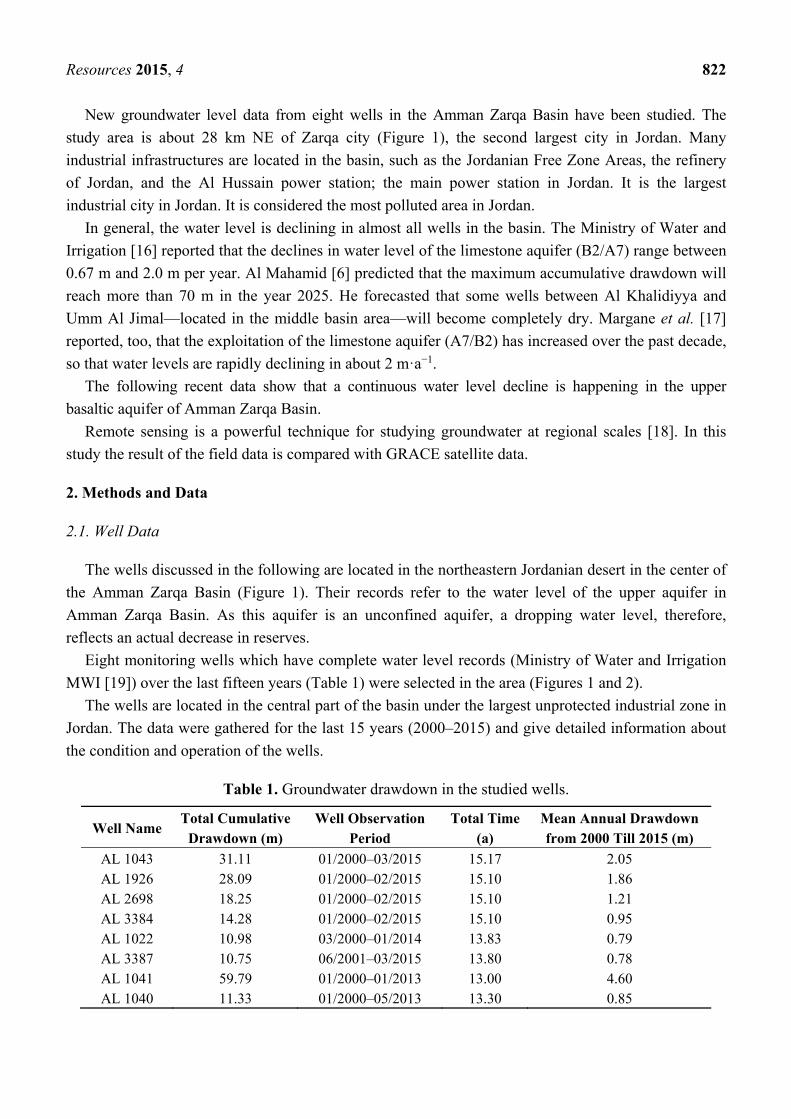
Eight monitoring wells which have complete water level records (Ministry of Water and Irrigation
MWI [19]) over the last fifteen years (Table 1) were selected in the area (Figures 1 and 2).
The wells are located in the central part of the basin under the largest unprotected industrial zone in
Jordan. The data were gathered for the last 15 years (2000–2015) and give detailed information about
the condition and operation of the wells.
Table 1. Groundwater drawdown in the studied wells.
Well Name Total Cumulative
Drawdown (m) Well Observation
Period Total Time
(a) Mean Annual Drawdown from 2000 Till 2015 (m)
AL 1043 31.11 01/2000–03/2015 15.17 2.05 AL 1926 28.09 01/2000–02/2015 15.10 1.86 AL 2698 18.25 01/2000–02/2015 15.10 1.21 AL 3384 14.28 01/2000–02/2015 15.10 0.95 AL 1022 10.98 03/2000–01/2014 13.83 0.79 AL 3387 10.75 06/2001–03/2015 13.80 0.78 AL 1041 59.79 01/2000–01/2013 13.00 4.60 AL 1040 11.33 01/2000–05/2013 13.30 0.85

Resources 2015, 4 823
Figure 2. A simplified geological map of the upper aquifer of the Jordanian Harrat basalt
showing the long-term monitoring wells discussed in this study, together with all other
available wells (coordinates UTM 36 North).
2.2. Remote Sensing
Since March 2002, the Gravity Recovery and Climate Experiment (GRACE) is routinely providing
satellite-based estimates of changes in total water storage (TWS, known as a vertical integration of
water changes due to vegetation changes, surface water, soil moisture, and groundwater changes)
within the Earth’s system. Using GRACE data it is possible to quantify amounts of groundwater usage [20].
GRACE monthly gravity products have been recently used in few studies to explore hydrological
patterns within the Middle East. For instance, Longuevergne et al. [21] and Voss et al. [22] showed a
pattern of water storage loss over a large area of Northwest Asia, including the Tigris River Basin (Iraq
and Syria), extending to Northwestern Iran, including the Urmia Basin. Forootan et al. [23] showed that
the extension of groundwater changes can be estimated using GRACE and complementary products
within a joint inversion technique. The proposed method is adopted in this study to estimate the
large-scale extension of groundwater drawdown over the study area.

Resources 2015, 4 824
Total water storage (TWS) data within a rectangular box (between 28° to 34° N and 34° to 40° E)
that includes Jordan, is extracted from each monthly GRACE-TWS map, which was computed using
the Release 5 products of the Center for Space Research (CSR, University of Texas, Austin), over
January 2003 to July 2014, following the approach in [24]. Degree one and two coefficients have been
replaced by the satellite laser ranging products following the advice given by the GRACE team [25,26].
Correlated errors in GRACE-derived TWS products were reduced using the de-correlation filter of
DDK3 [27]. The signal damping due to the application of the DDK3 filter was accounted by
computing a single scale factor (4/3 in this study) that is derived as the ratio of the spatial average of a
homogenous TWS field (filled by 1 mm within the box area) to the spatial average of the same field
after application of the DDK3 filter. Figure 3 shows the linear rate of TWS changes over January 2003
to July 2014. Please note that the scale of TWS changes is 1 mm in a 100 km × 100 km area; thus, the
vertical changes cannot be directly compared to the estimated groundwater changes from in situ wells.
Figure 3. Linear trend over January 2003 to July 2014 derived from GRACE-TWS maps
(geographic coordinates).
Over the same period, gridded altimetry data (representing surface water storage changes) derived
from the Environmental Research Division’s Data Access Program, while the terrestrial water storage
changes, including the summation of canopy and soil moisture changes, were derived from the output
of the Global Land Data Assimilation System (GLDAS [28]). The dominant independent patterns of
altimetry (including the Dead Sea and the Mediterranean Sea) and GLDAS were estimated using the
independent component analysis technique [29] and the spatial patterns were introduced as known
(base-functions) to separate GRACE-TWS maps in a least squares adjustment (LSA) procedure
(similar to [23]). This procedure makes the best use of all available datasets in a LSA framework and
reduces the leakage impact due to the implementation of mandatory filtering. Once the base-functions
(from altimetry and GLDAS) were adjusted to GRACE-TWS observation, they were used to remove
the contribution of surface and terrestrial water storage changes from TWS time-series and compute
groundwater changes. The inversion step adopts temporal variability of GLDAS to what is likely
reflected in GRACE-TWS. Therefore, it accounts for the resolution mismatch between GLDAS and

Resources 2015, 4 825
GRACE data. It should be mentioned here that the steric level changes in the Mediterranean Sea was
accounted for using sea surface temperature (SST) data as in [22], therefore, the steric changes due to
salinity changes was neglected. No SST was found over the Dead Sea; thus, the estimated volume
changes were considered as mass variability.
Groundwater signal estimated from GRACE observations might be contaminated with signals
originating from regions outside the region of interest, or the signal of the target area might be moved
out as a result of filtering that is used to post process GRACE estimations. Both effects are known as
the spatial leakage problem in GRACE related studies. However, various studies indicate that GRACE
observations can be used over small regions when care is taken of this leakage problem (see e.g., [30]).
In this study, a new methodology was applied, which allows one to mitigate the possible effect of
leakage by inversion. This method has already been used to study water storage changes over the
Middle East and the results have been evaluated with groundwater observations [23].
3. Study Results
3.1. Well Data
The groundwater level change shown in Figure 4 and Table 1 extends from different dates where
the pumping has started up to early of 2015. The average drawdown was calculated to be 1.64 m·a−1 in
the last 15 years.
Figure 4. Groundwater drawdown in all studied wells from January 2000 until April 2015.
The report of the Ministry of Water and Irrigation [16] shows that since the early 1960s groundwater
levels are declining in this basin. Each well shown in Figure 4 shows a clear water level declination.
According to [6] recharge from rainfall is approximately 45 × 106 m3·a−1 and approximately
62 × 106 m3·a−1 from lateral subsurface inflow. Accordingly, the outflow is in the order of 66 × 106 m3·a−1
into Azraq Basin (neighboring in the south-east [31]) and 3.4 × 10⁶ m3·a−1 into Yarmouk Basins
(neighboring to the north [31]). The leakage into the lower aquifer is about 12 × 106 m3·a−1. In Mafraq
and the Dhuleil—Hallabat area in the central Amman Zarqa Basin it was found that the groundwater is
transferred laterally and vertically from the basalts to the lower Amman Wadi Sir limestone [32]. In
addition there is an amount of 27 × 106 m3·a−1 underflow towards the Zarqa River.

Resources 2015, 4 826
The average drawdown trend observed at the studied wells with 1.64 m·a−1 for 15 years should not
be considered as the representative trend for the Amman Zarqa Basin, since they are concentrated on
the central basin. Furthermore, the hydrogeological settings of the Amman Zarqa Basin are complex
due to numerous large fault systems.
However, the presented results are in good agreement with previous data [1,5,6,13–17,33]. In
average all these studies stated an annual groundwater level drawdown in the order of 0.65 m to 2.0 m.
3.2. Remote Sensing
Figure 5a shows the linear trend from GRACE adjusted terrestrial water storage (including soil
moisture and vegetation changes) during January 2003 to July 2014. The results indicate a decrease in
soil moisture (approximately −15 mm per year in water column) over the country, which is dominated
mainly over the northeastern and western regions. A linear trend of groundwater is shown in Figure 5b),
which indicates a decline of groundwater at the rate of up to approximately −10 mm per year in the
water column concentrated over the study area. This value is equivalent with approximately 160 mm
per year in groundwater change concentrated over the model area.
It should be mentioned here that GRACE has usually been used for basins larger than 100,000 km2 [34];
thus, for basins such as the one studied here, estimations of terrestrial water storage might include a
significant level of uncertainty. However, the results in Figure 5 are consistent with those of previous
studies [23].
(a) (b)
Figure 5. Linear trend over January 2003 to July 2014 derived from GRACE observations
and complimentary data (compare with Figure 3). (a) From GRACE-adjusted terrestrial
water storage products (showing the variability in soil moisture and biomass); and (b) side
from groundwater storage maps (geographic coordinates).
4. Discussion
The groundwater resources in the Amman Zarqa Basin in Jordan are overused. The basin safe yield
is 87.5 million·m3, while the actual pumping is 156.3 million m3, resulting in a groundwater depletion

Resources 2015, 4 827
of 68.8 million·m3 by the end of 2013 [35]. Numerous wells in the basin document for the evaluated
15 years an average annual groundwater drawdown of 1.64 m·a−1.
In addition to the over-usage of the groundwater, rainfall has notably declined since 1995 [9]. However,
as no precise data of the total pumping exist and recharge rates are estimated [3], no valid hydrological
water balance can be calculated.
Although the basin’s size is beyond the resolution of the GRACE data, which inhibits detailed
predictions, these satellite data also indicate severe groundwater depletion.
Another indication for groundwater depletion, which can be detected by satellites, is subsidence.
InSAR or GPS data (e.g., [36,37]) could be evaluated, even if the occurring subsidence may be in the
order of the detection limit.
5. Conclusions
Decision-makers should finally recognize the serious groundwater overexploitation status in this
area, which has not changed since the last data were published. The groundwater table is still slowly
depleting. The urge to find more appropriate solutions for the groundwater management in Jordan is
seriously needed.
The major Jordan basins may have become beyond restoration. In any case groundwater extraction
should be limited to yield the remaining groundwater resources of the basin.
Measures have to be taken that the access to enough water resources is guaranteed for future
generations. To preserve the groundwater resource for future generations all reasons for the
groundwater depletion have to be studied carefully. The urgency to implement the necessary measures
is, again, proven by this study which should be understood as a part within a framework of national
and international investigations.
Acknowledgments
This work is partly supported by the Alliance of Science Organizations in Germany (DFG) in the
framework of the Excellence Initiative, Darmstadt Graduate School of Excellence Energy Science and
Engineering (GSC 1070).
Author Contributions
The authors have contributed in several ways. Ingo Sass initiated this study, Sana’a Al-Zyoud
evaluated the well data and the literature about the regional hydrogeology, Ehsan Forootan evaluated
the GRACE data set, Wolfram Rühaak initiated the combination of field data with satellite data and
compiled the paper. All authors contributed to the text.
Conflicts of Interest
The authors declare no conflict of interest.

Resources 2015, 4 828
References
1. Ta’any, R.; Tahboub, A.; Saffarini, G. Geostatistical analysis of spatiotemporal variability of
groundwater level fluctuations in Amman Zarqa basin, Jordan: A case study. Environ. Geol. 2009,
57, 525–535.
2. DOS Jordan Department of Statistics 2010. Available online: http://www.dos.gov.jo/sdb_pop/
sdb_pop_e/ehsaat/alsokan/2010/2-2.pdf (accessed on 3 November 2015).
3. Al-Abed, N.; Al-Sharif, M. Hydrological modeling of Zarqa River Basin—Jordan using the
hydrological simulation program—FORTRAN (HSPF) model. Water Resour. Manag. 2008, 22,
1203–1220.
4. Al-Bakri, J.T.; Salahat, M.; Suleiman, A.; Suifan, M.; Hamdan, M.R.; Khresat, S.; Kandakji, T.
Impact of climate and land use changes on water and food security in Jordan: Implications for
transcending “the tragedy of the commons”. Sustainability 2013, 5, 724–748.
5. UN-ESCWA and BGR (United Nations Economic and Social Commission for Western Asia;
Bundesanstalt für Geowissenschaften und Rohstoffe); Inventory of Shared Water Resources in
Western Asia: Beirut, Lebanon, 2013.
6. Al Mahamid, J. Integration of water resources of the upper aquifer in Amman—Zarqa basin based
on mathematical modeling and GIS, Jordan, Freiberg Online Geology, Germany, 2005, Available
online: http://citeseerx.ist.psu.edu/viewdoc/download?doi=10.1.1.225.991&rep=rep1&type=pdf
(accessed on 6 August 2015).
7. Sidiropoulos, P.; Mylopoulos, N.; Loukas, A. Optimal management of an overexploited aquifer
under climate change: The Lake Karla case. J. Water Resour. Manag. 2013, 27, 1635–1649.
8. Al-Weshah, R. Jordan’s water resources: Technical perspective. Water Int. 1992, 17, 124–132.
9. Rahman, K.S.M.; Gorelick, P.J.; Dennedy-Frank, J.; Yoon, B. Rajaratnam, declining rainfall and
regional variability changes in Jordan. Water Resour. Res. 2015, 51, doi:10.1002/2015WR017153.
10. Jordan Meteorological Department. Department Data Base; JMD: Amman, Jordan, 2015.
11. Al-Kharabsheh, A.; Al-Mahamid, J. Optimizing pumping rates of Hallabat-Khalidiya Wellfield
using finite-difference model: A case study for evaluating over pumped aquifers in arid areas
(Jordan). J. Arid Environ. 2002, 52, 259–267.
12. Rimawi, O.; Al-Ansari, N. Groundwater degradation in the northeastern part of Mafraq area,
Jordan. In Freshwater Contamination, Proceedings of Rabat Symposium S4; April–May 1997;
IAHS Publ.: Oxfordshire, UK, pp. 235–243.
13. Salameh, E. Over-exploitation of groundwater resources and their environmental and socio-economic
implications: The case of Jordan. Water Int. 2008, 33, 55–68.
14. El-Naqa, A.; Al-Momani, M.; Kilani, S.; Hammouri, N. Groundwater deterioration of shallow
groundwater aquifers due to overexploitation in northeast Jordan. Clean Soil Air Water 2007, 35,
156–166.
15. Bajjali, W.; Al-Hadidi, K.; Ismail, M. Water quality and geochemistry evaluation of groundwater
upstream and downstream of the Khirbet Al-Samra wastewater treatment plant/Jordan. J. Appl. Water Sci. 2015, doi:10.1007/s13201-014-0263-x.
16. Outline Hydrogeology of the Amman—Zarqa Basin, Report: Water Resources Policy Support; MWI Ministry of Water and Irrigation: Amman, Jordan, 2000.

Resources 2015, 4 829
17. Margane, A.; Hobler, M.; al Momani, M.; Subah, A. Contributions to the Hydrogeology of Northern and Central Jordan—Geologisches Jahrbuch C 68; Schweizerbart Science Publishers:
Stuttgart, Germany, 2002; p. 52.
18. Becker, M.W. Potential for satellite remote sensing of ground water. Ground Water 2006, 44,
306–318.
19. MWI Files and Personal Communications; MWI Ministry of Water and Irrigation: Amman,
Jordan, 2010.
20. Richey, A.S.; Thomas, B.F.; Lo, M.-H.; Reager, J.T.; Famiglietti, J.S.; Voss, K.; Swenson, S.;
Rodell, M. Quantifying renewable groundwater stress with GRACE. Water Resour. Res. 2015, 51,
5217–5238.
21. Longuevergne, L.; Wilson, C.R.; Scanlon, B.R.; Crétaux, J.-F. GRACE water storage estimates
for the Middle East and other regions with significant reservoir and lake storage. Hydrol. Earth Syst. Sci. Discuss. 2012, 9, 11131–11159.
22. Voss, K.A.; Famiglietti, J.S.; Lo, M.-H.; de Linage, C.; Rodell, M.; Swenson, S.C. Groundwater
depletion in the Middle East from GRACE with implications for transboundary water
management in the Tigris-Euphrates-Western Iran region. Water Resour. Res. 2013, 49,
doi:10.1002/wrcr.20078.
23. Forootan, E.; Rietbroek, R.; Kusche, J.; Sharifi, M.A.; Awange, J.; Schmidt, M.; Omondi, P.;
Famiglietti, J. Separation of large scale water storage patterns over Iran using GRACE, altimetry
and hydrological data. Remote Sens. Environ. 2014, 140, 580–595.
24. Wahr, J.; Molenaar, M.; Bryan, F. Time variability of the Earth’s gravity field: Hydrological and
oceanic effects and their possible detection using GRACE. J. Geophys. Res. 1998, 103, 30205–30229.
25. Jet Propulsion Laboratory, Geocenter-Degree 1. Available online: http://grace.jpl.nasa.gov/data/
get-data/geocenter/ (accessed on 26 September 2015).
26. Jet Propulsion Laboratory, Spherical Harmonic coefficients of Degree 2. Available online:
http://grace.jpl.nasa.gov/data/get-data/oblateness/ (accessed on 26 September 2015).
27. Kusche, J.; Schmidt, R.; Petrovic, S.; Rietbroek, R. Decorrelated GRACE time-variable gravity
solutions by GFZ, and their validation using a hydrological model. J. Geod. 2009, 83, 903–913.
28. Rodell, M.; Houser, P.R.; Jambor, U.; Gottschalck, J.; Mitchell, K.; Meng, K.; Arsenault, K.;
Cosgrove, B.; Radakovich, J.; Bosilovich, M.; et al. The global land data assimilation system.
Bull. Am. Meteorol. Soc. 2004, 85, 381–394.
29. Forootan, E.; Kusche, J. Separation of global time-variable gravity signals into maximally
independent components. J. Geod. 2012, 86, 477–497.
30. Longuevergne, L.; Scanlon, B.R.; Wilson, C.R. GRACE hydrological estimates for small basins:
Evaluating processing approaches on the High Plains Aquifer, USA. Water Resour. Res. 2010,
46, doi:10.1029/2009WR008564.
31. Goode, D.J.; Senior, L.A.; Subah, A.; Jaber, A. Groundwater-Level Trends and Forecasts, and
Salinity Trends, in the Azraq, Dead Sea, Hammad, Jordan Side Valleys, Yarmouk, and Zarqa
Groundwater Basins, Jordan; Open-File Report 2013–1061; U.S. Department of the Interior:
Washington, DC, USA; U.S. Geological Survey: Reston, VA, USA, 2013.
32. Abu Sharar, R. Water chemistry of the Dhuleil aquifer (Jordan) as influenced by long term
pumping. J. Hydrol. 1993, 149, 49–66.

Resources 2015, 4 830
33. Bajjali, W.; Al-Hadidi, K. Recharge origin, overexploitation, and sustainability of water resources
in an arid area from the Azraq basin, Jordan: Case study. Hydrol. Res. 2006, 37, 277–292.
34. Swenson, S.; Wahr, J.; Milly, P. Estimated accuracies of regional water storage variations
inferred from the Gravity Recovery and Climate Experiment (GRACE). Water Resour. Res. 2003,
39, doi:10.1029/2002WR001808.
35. MWI Ministry of Water and Irrigation Web Site, Jordan Water Sector Facts and Figures 2013.
2014. Available online: http://www.mwi.gov.jo/sites/en-us/Documents/W.%20in%20Fig.E%
20FINAL%20E.pdf (accessed on 6 August 2015).
36. Amelung, F.; Galloway, D.L.; Bell, J.W.; Zebker, H.A.; Laczniak, R.J. Sensing the ups and downs
of Las Vegas: In SAR reveals structural control of land subsidence and aquifer-system
deformation. Geology 1999, 27, 483–486.
37. Abidin, H.Z.; Andreas, H.; Gamal, M.; Wirakusumah, A.D.; Darmawan, D.; Deguchi, T.;
Maruyama, Y. Land subsidence characteristics of the Bandung Basin, Indonesia, as estimated
from GPS and InSAR. J. Appl. Geod. 2008, 2, 167–177.
© 2015 by the authors; licensee MDPI, Basel, Switzerland. This article is an open access article
distributed under the terms and conditions of the Creative Commons Attribution license
(http://creativecommons.org/licenses/by/4.0/).


![Groundwater Overexploitation and Seawater Intrusion in ... · Seawater intrusion induced by groundwater development is also known in South America [21] and Australia [22]. In Africa,](https://img.pdfslide.us/doc/110x75/5edd2c9ead6a402d66682aa2/groundwater-overexploitation-and-seawater-intrusion-in-seawater-intrusion-induced.jpg)