Embed Size (px)
Citation preview

Contents lists available at ScienceDirect
www.elsevier.com/locate/jpa
Journal of Pharmaceutical Analysis
Journal of Pharmaceutical Analysis 2014;4(2):125–131
2095-1779 & 2013 Xihttp://dx.doi.org/10.10
nCorresponding autE-mail address: ov
Peer review under r
www.sciencedirect.com
ORIGINAL ARTICLE
Reagent-free determination of amikacin contentin amikacin sulfate injections by FTIR derivativespectroscopy in a continuous flow system
José F. Ovallesa,n, Máximo Gallignanib, María R. Brunettob, Rebeca A. Rondónb,Carlos Ayalab
aDepartamento de Análisis y Control, Facultad de Farmacia y Bioanálisis, Universidad de Los Andes, Mérida 5101A, VenezuelabLaboratorio de Espectroscopia Molecular, Departamento de Química, Facultad de Ciencias, Universidad de Los Andes, Mérida 5101A,Venezuela
Received 14 February 2013; accepted 6 August 2013Available online 14 August 2013
KEYWORDS
Amikacin;FTIR derivative spectro-metry;Continuous flow system;Pharmaceuticalpreparation;Injection;Sulfate
’an Jiaotong Univer16/j.jpha.2013.08.00
hor. Tel.: þ58 274 [email protected] (J.F.
esponsibility of Xi'a
Abstract The quantitative estimation of amikacin (AMK) in AMK sulfate injection samples is reportedusing FTIR-derivative spectrometric method in a continuous flow system. Fourier transform of mid-IRspectra were recorded without any sample pretreatment. A good linear calibration (r40.999, %RSDo2.0) in the range of 7.7–77.0 mg/mL was found. The results showed a good correlation with themanufacturer's and overall they all fell within acceptable limits of most pharmacopoeial monographs onAMK sulfate.
& 2013 Xi’an Jiaotong University. Production and hosting by Elsevier B.V. All rights reserved.
1. Introduction
Amikacin (AMK) is used to treat infections caused by Gram-negativebacteria. It is a semi-synthetic aminoglycoside derived from
sity. Production and hosting by Elsev1
449145; fax: þ58 274 2403464.Ovalles).
n Jiaotong University.
kanamycin, formulated as a disulfate salt (Fig. 1). The dosage formis normally supplied as a sterile solution for parenteral use [1].
Aminoglycoside antibiotics determination has been carried out bya wide variety of methods [2–4]. However, a direct UV–vis spectro-photometric estimation is not feasible [5]. The former Pharmacopoeiaof United States (USP 24) [6] and later the European Pharmacopoeia(Ph. Eur. 6) [7] and British Pharmacopoeia (BP) [8] reportedderivatization procedures of AMK prior to reversed-phase liquidchromatographic (LC) analysis. As it is too time consuming, LCmethods based on non-derivatization procedures, such as universalaerosol-based detector [9], ligand displacement reaction [10], chargedaerosol [11], evaporative light scattering [12] and resonance Rayleigh
ier B.V. All rights reserved.

Fig. 1 FTIR spectra of the AMK sulfate injections related substances. Excipients constituted by water, 1.3 mg/mL sodium bisulfite, and 5 mg/mLsodium citrate (a). Aqueous sulfuric acid solution, pH¼4.5 (b). AMK sulfate standard (50 mg/mL) as AMK base (c). All spectra were obtainedusing water background.
J.F. Ovalles et al.126
scattering [13] have been proposed. The pulsed electrochemicaldetection method [14–16] has been adopted in the recent USPmonograph [1]. The major drawback of the detection approachcoupled to LC is that it requires skills for implementation [17].
Pharmaceutical raw materials are also tested for sulfate content[18]. The actual pharmacopoeial monographs, Eur. Ph. [7] and USP[1] refer to sulfate counter-ion content as a molar ratio between AMKand H2SO4. The sulfate ion, outside the allowed range, could indicatethat AMK is present as a free base or the sulfate ion, in excess, ispresent as an impurity [19]. Recently, our research group proposed aFourier-transform infrared (FTIR) method for determining the sulfatecounter-ion content in AMK sulfate injections [19].
FT-mid-IR in conjunction with a continuous flow system (CFS)was extensively used for quantitative estimation of active ingredientsin pharmaceutical preparations [19–28]. The spectrum is a marker foridentity and purity of the active pharmaceutical ingredient (API) andalso useful to detect impurities coming from the excipients.
A direct reagent-free determination of AMK content in parenteralformulations of AMK sulfate by CFS-FTIR-derivative spectrometry(DS) is proposed keeping in view principles of green analyticalchemistry [19,29–32]. The advantage of the present method is tosimultaneously quantify AMK base and sulfate counter-ion in AMKsulfate injections with a single spectrum.
2. Experimental
2.1. Reagents and samples
All chemicals used were of analytical-reagent grade. Water wasobtained from a Milli-Q-TOC purification system (Millipore, Bedford,MA, USA). Reference standards: AMK sulfate stating 786 μg/mg asAMK base, purchased from Sigma-Aldrich (St Louis, MO, USA) andAMK sulfate with 99.95% purity, kindly provided by a pharmaceuticalmanufacturer of the region. Standard stock solution of AMK sulfate(100 mg/mL) was prepared in water. Pharmaceutical products wereacquired from local drug stores and analyzed directly from theampoules. Commercial samples containing a concentration higher than50 mg/mL of AMK base were diluted with water to obtain requiredconcentrations.
2.2. Apparatus
A Perkin–Elmer, model Spectrum 2000, FTIR spectrophotometer(Norwalk, CT, USA) was employed for acquisition of spectra.
The FTIR equipment was connected to a monochannel flowsystem through a flow cell. A demountable liquid transmissioncell (Wilmad Labglass, Buena, NJ, USA) with ZnSe windows(38 mm� 19 mm size, 2 mm thick, and 0.05 mm optical path-length) was used. An Ismatec IPC peristaltic pump (Glattbrugg,Switzerland) equipped with Tygon tubing was employed forsample and standard propulsion. A Rheodyne manual selectingvalve (Alltech, Waukegan, USA) was used for carrying eithersample solution or standard solution into the flow cell.
2.3. General procedure
A schematic diagram of the continuous flow system and its operationsteps were presented earlier [27]. The system was optimized for leaks,air bubbles, and pump flow rate. Calibration or test sample solutionswere continuously pumped in order to reach the flow cell. Aninjection valve was switched to the solution in turn. The continuousflowing stream of either samples or standards was monitored usingthe FTIR spectrometer. Each spectrum was automatically convertedto its first-order derivative spectrum. The validation of the analyticalmethod was carried out as it was described by us earlier [19].
3. Results and discussion
3.1. Identification, FTIR spectra of AMK sulfate and relatedexcipients in aqueous phase
Infrared spectra of API were recorded under the optimum instru-mental conditions. We can see that water showed the characteristictransparency zone localized close to the fingerprint region 1600–900 cm�1 (Fig. 1). AMK sulfate has two absorption bands, one broadand intense band observed in the range of 1220–938 cm�1 with amaximum at 1100 cm�1, and the other, with lesser intensity in therange of 1590–1480 cm�1 with a maximum at 1538 cm�1. Thespectra also show that the presence of excipients, at the statedconcentrations in the formulation, do not have any additional IRbands in the fingerprint region, except the sulfate from sulfuric acid.
3.2. Selection of the analytical spectral bandand the analytical measurement criterion
The two mid-IR bands of AMK sulfate are due to contributionof carbohydrate moiety and hetero-oxy groups of the sulfate
Quantitative estimation of amikacin from pharmaceutical dosage form by CFS-FTIR spectrometry 127
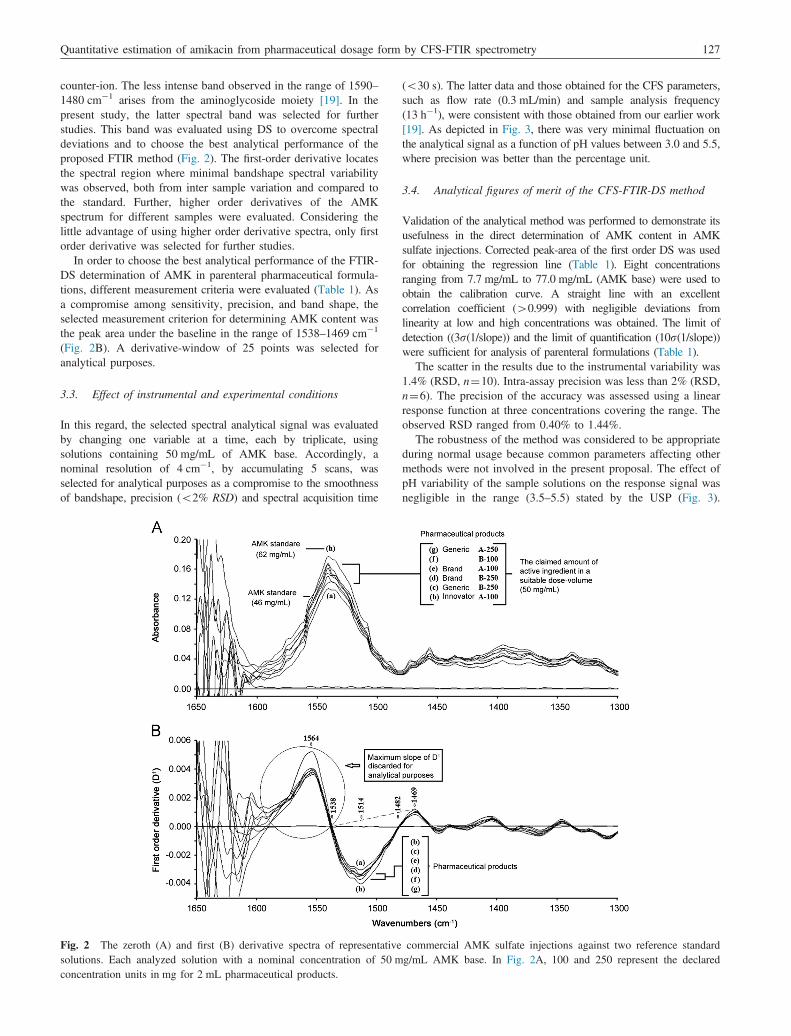
counter-ion. The less intense band observed in the range of 1590–1480 cm�1 arises from the aminoglycoside moiety [19]. In thepresent study, the latter spectral band was selected for furtherstudies. This band was evaluated using DS to overcome spectraldeviations and to choose the best analytical performance of theproposed FTIR method (Fig. 2). The first-order derivative locatesthe spectral region where minimal bandshape spectral variabilitywas observed, both from inter sample variation and compared tothe standard. Further, higher order derivatives of the AMKspectrum for different samples were evaluated. Considering thelittle advantage of using higher order derivative spectra, only firstorder derivative was selected for further studies.
In order to choose the best analytical performance of the FTIR-DS determination of AMK in parenteral pharmaceutical formula-tions, different measurement criteria were evaluated (Table 1). Asa compromise among sensitivity, precision, and band shape, theselected measurement criterion for determining AMK content wasthe peak area under the baseline in the range of 1538–1469 cm�1
(Fig. 2B). A derivative-window of 25 points was selected foranalytical purposes.
3.3. Effect of instrumental and experimental conditions
In this regard, the selected spectral analytical signal was evaluatedby changing one variable at a time, each by triplicate, usingsolutions containing 50 mg/mL of AMK base. Accordingly, anominal resolution of 4 cm�1, by accumulating 5 scans, wasselected for analytical purposes as a compromise to the smoothnessof bandshape, precision (o2% RSD) and spectral acquisition time
Fig. 2 The zeroth (A) and first (B) derivative spectra of representativesolutions. Each analyzed solution with a nominal concentration of 50 mconcentration units in mg for 2 mL pharmaceutical products.
(o30 s). The latter data and those obtained for the CFS parameters,such as flow rate (0.3 mL/min) and sample analysis frequency(13 h�1), were consistent with those obtained from our earlier work[19]. As depicted in Fig. 3, there was very minimal fluctuation onthe analytical signal as a function of pH values between 3.0 and 5.5,where precision was better than the percentage unit.
3.4. Analytical figures of merit of the CFS-FTIR-DS method
Validation of the analytical method was performed to demonstrate itsusefulness in the direct determination of AMK content in AMKsulfate injections. Corrected peak-area of the first order DS was usedfor obtaining the regression line (Table 1). Eight concentrationsranging from 7.7 mg/mL to 77.0 mg/mL (AMK base) were used toobtain the calibration curve. A straight line with an excellentcorrelation coefficient (40.999) with negligible deviations fromlinearity at low and high concentrations was obtained. The limit ofdetection ((3s(1/slope)) and the limit of quantification (10s(1/slope))were sufficient for analysis of parenteral formulations (Table 1).
The scatter in the results due to the instrumental variability was1.4% (RSD, n¼10). Intra-assay precision was less than 2% (RSD,n¼6). The precision of the accuracy was assessed using a linearresponse function at three concentrations covering the range. Theobserved RSD ranged from 0.40% to 1.44%.
The robustness of the method was considered to be appropriateduring normal usage because common parameters affecting othermethods were not involved in the present proposal. The effect ofpH variability of the sample solutions on the response signal wasnegligible in the range (3.5–5.5) stated by the USP (Fig. 3).
commercial AMK sulfate injections against two reference standardg/mL AMK base. In Fig. 2A, 100 and 250 represent the declared

J.F. Ovalles et al.128
Specificity research was conducted during the preliminary studies.As depicted in Fig. 1, the interferences study of coexisting foreigninorganic ions and organic compounds revealed no interference onthe selected spectral region for quantization purposes. Backgroundand baseline displacement that use to affect the intercept of acalibration function, but not its slope, was previously corrected byDS selecting the appropriate band wavenumber range. The IRspectroscopy studies revealed no apparent difference between thestandard spectrum and the sample spectra (Fig. 2). Similarly, inspite of any disparity in the concentration, the latter studiesrevealed no apparent change in bandshape from sample to sample.
These parameters and the satisfactory results could somehowassure the accuracy of the method. Nevertheless, we carried out arecovery experiment. On the average, recoveries were within 97%and 103%, which is similar to or better than recoveries obtained byusing other much more complicated methodologies (Table 2).
Table 1 Analytical results obtained for determining AMK base comethod.
Band peak parameters (units in cm�1) of the first derivative spectra
Measurement mode Location Baseline
Total height 1514 Zero absCorrected height 1514 1538–1469Total area 1514 Zero absCorrected area 1514 1538–1469
aCalibration curves obtained using eight standards of AMK sulfate, in tripto 77.0 (mg/mL); where X is the explanatory variable and Y is the dependentdeviation; r¼correlation coefficient; LOD¼ limit of detection in mg/mL AM
Fig. 3 Effect of the pH value of the sample solution on both signal intecriterion. The study was carried out using an AMK sulfate standard equiv
Table 2 Representative recovery of AMK base added to AMK sulf
Type of drug brand AMK base (mg/mL7SD) (n¼3) Re
Endogenous Added Found
Innovator A 11.870.6 23.08 35.470.4 1038.46 49.370.2 946.15 57.070.3 9
Brand A 11.370.2 23.08 34.670.5 1038.46 49.970.3 1046.15 57.670.4 10
3.5. Application to pharmaceutical preparations
Finally, validation of the proposed methodology was carried out byits application to pharmaceutical preparations. The results obtainedfor determining AMK content in AMK sulfate injections byinterpolation in the external calibration were in acceptable agreementwith the nominal content claimed by the pharmaceutical manufac-turers (Table 3). Moreover, all the obtained values for the commercialsamples were within the limits of official pharmacopoeias.
3.5.1. Applicability of the method in the simultaneousquantitation of AMK base and sulfate counter-ionin AMK sulfate injections
Fig. 4 shows the viability of simultaneously measuring AMK baseand sulfate counter-ion in AMK sulfate injections with one spectrum.
ntent in AMK sulfate injections by the proposed CFS-FTIR-DS
Parameters derived from linear regressiona: Y¼aþbX
a7SD (� 10�3) b7SD (� 10�3) r LOD RSD
0.0870.02 0.064870.0004 0.9996 2.1 0.0040.0570.07 0.072870.0007 0.9995 2.2 0.005
171 2.2570.02 0.9987 3.5 0.301.070.6 2.8170.01 0.9997 1.6 0.15
licate, registered as its equivalent AMK concentration ranging from 7.7variable; the slope of the line is b, and a is the Y-intercept; SD¼standardK base calculated as 3s(1/slope); RSD¼relative standard deviation (%).
nsity and spectral band shape according to the selected measurementalent to 50 mg/mL AMK base and water as background.
ate injections.
covery (%) Standard addition calibration: Y¼aþbX r
2.4 Y¼0.034 1þ0.002 79X 0.9997.77.90.8 Y¼0.032 8þ0.002 81X 0.9990.30.1

Table 3 Analytical application of the proposed CFS-FTIR-DS method for determining AMK base content in AMK sulfate injections.
Sample(Lot)
Type ofbrandeddrug a
Concentration per ampoule of AMK base Acceptance criterion
Claimed Claimed(mg/mL)
Actual result7SDb (mg/mL)
(90.0–110.0)% BP
Pass/Fail
(90.0–120.0) %USP and Ph. Int.
Pass/Fail
S1(A–D) Brand A 100 mg/2 mL 50 5072 45–55 Pass 45–60 PassS2 Innovator A 100 mg/2 mL 50 5571 45–55 Pass 45–60 PassS3 Brand B 100 mg/2 mL 50 49.870.6 45–55 Pass 45–60 PassS4 Generic B 100 mg/2 mL 50 5071 45–55 Pass 45–60 PassS5 Generic A 250 mg/2 mL 125 12272 112.5–137.5 Pass 112.5–150.0 PassS6 Brand A 500 mg/2 mL 250 25674 225–275 Pass 225–300 PassS7(A-D) Brand A 500 mg/2 mL 250 239710 225–275 Pass 225–300 PassS8 Brand B 500 mg/2 mL 250 251.070.4 225–275 Pass 225–300 PassS9 Generic B 500 mg/2 mL 250 25272 225–275 Pass 225–300 PassS10 Innovator B 1000 mg/
4 mL250 23673 225–275 Pass 225–300 Pass
aBrand, available from one or more manufacturers, distributors, and/or re-packagers by generic (nonproprietary) name; innovator “B” wasmanufactured by a foreign country; S1(A–D) and S7(A–D) mean parenteral products from different lots.
bSD, standard deviation (n¼3). The mean and the standard deviation of S1 and S7 belong to a set of lot data, each also analyzed by triplicate. BP,British Pharmacopoeia. USP, United States Pharmacopoeia. Ph. Int., The International Pharmacopoeia.
Fig. 4 Proposal for simultaneously determining the content of both AMK free base and sulfate counter-ion in AMK sulfate injections. Zerothorder spectra (A). First order spectra (B). The calibration curve was constructed with AMK sulfate standards at concentrations of 0, 20, 40, 60, 80and 100 mg/mL (a)-(f). The left hand insert shows additionally a spectrum of a representative pharmaceutical sample with a nominalconcentration of 50 mg/mL AMK base. The right hand insert shows how the AMK carbohydrate moiety does not interfere in the determination ofsulfate counter-ion (discontinuous line).
Quantitative estimation of amikacin from pharmaceutical dosage form by CFS-FTIR spectrometry 129
The two major spectral bands were monitored simultaneously. Thepossibility of measuring sulfate counter-ion in the presence of theAMK moiety in the spectral range, where carbohydrates presentstrong IR absorption, was discussed earlier by us [19].
4. Conclusion
The determination of active content of compounds in pharmaceu-tical preparations of AMK sulfate is often achieved by HPLC with

J.F. Ovalles et al.130
electrochemical detection or pre-column derivatization. In thispaper, we reported a simple, precise, and accurate methodology forthe CFS-FTIR-DS determination of AMK content in aqueousAMK sulfate injections. The actual proposal is based on directmeasurements of untreated samples. This green analytical methodis an alternative to those that employ separating techniquescoupled with either uncommon detection modes or those requiringderivatization procedures.
Since sulfate content is also subject to control as mandated inthe pharmacopoeias, one of the strengths of the proposal is that theassay for AMK in AMK sulfate injections can be employedsimultaneously to determine the sulfate counter-ion by monitoringtwo different spectral bands in just one spectrum. Therefore, theproposed CFS-FTIR-DS strategy represents a promising tool forcharacterizing the quality of both bulk drug materials andpharmaceutical formulations containing AMK sulfate. In addition,it can significantly reduce both expensive laboratory analysis andchemical waste.
Acknowledgments
The authors are grateful to the CDCHTA of the University of LosAndes for providing financial support through several approvedprojects. The authors are also thankful to the National Fund forScience, Technology and Innovation (FONACIT) of VenezuelanMinistry of Science and Technology for providing financialsupport, SPE 112–370 and Project G-2005000641.
Appendix A. Supporting information
Supplementary data associated with this article can be found in theonline version at http://dx.doi.org/10.1016/j.jpha.2013.08.001.
References
[1] The United States Pharmacopeia, USP, 34th ed., United StatesPharmacopeial Convention, Rockville, MD, USA, 2011.
[2] N. Isoherranen, S. Soback, Chromatographic methods for analysis ofaminoglycoside antibiotics, J. AOAC Int. 82 (5) (1999) 1017–1045.
[3] L. Soltés, Aminoglycoside antibiotics—two decades of their HPLCbioanalysis, Biomed. Chromatogr. 13 (1) (1999) 3–10.
[4] D.A. Stead, Current methodologies for the analysis of aminoglyco-sides, J. Chromatogr. B 747 (1-2) (2000) 69–93.
[5] J.F. Ovalles, M.R. Brunetto, M. Gallignani, A new method for theanalysis of amikacin using 6-aminoquinolyl-N-hydroxysuccinimidylcarbamate (AQC) derivatization and high-performance liquid chro-matography with UV-detection, J. Pharm. Biomed. Anal. 39 (1–2)(2005) 294–298.
[6] The United States Pharmacopeia, USP, 24th ed., United StatesPharmacopeial Convention, Rockville, MD, USA, 2000.
[7] European Pharmacopoeia, Ph. Eur., sixth ed., European Pharmaco-poeia Commission, Strasbourg, Council of Europe, Strasbourg,France, 2008. Available from: http://www.uspbpep.com/ep60/amikacin%20sulphate%201290e.pdf.
[8] British Pharmacopoeia Commission, British Pharmacopoeia, BP, vol.III, The Stationery Office, London, UK, 2012. Available from: http://bp2012.infostar.com.cn/Bp2012.aspx?a=query&title=%22Amikacin+Injection%22&tab=a-z+index&l=A&xh=1.
[9] J. Olšovská, Z. Kameník, T. Cajthaml, Hyphenated ultra high-performance liquid chromatography–nano quantity analyte detectortechnique for determination of compounds with low UV absorption,J. Chromatogr. A 1216 (30) (2009) 5774–5778.
[10] M. Yang, S.A. Tomellini, Non-derivatization approach to high-performance liquid chromatography-fluorescence detection for ami-noglycoside antibiotics based on a ligand displacement reaction,J. Chromatogr. A 939 (1-2) (2001) 59–67.
[11] C. Crafts, M. Plante, I. Acworth, et al., Rapid and Sensitive Analysisof Aminoglycoside Antibiotics using RRLC with Corona UltraDetection, LPN 2545-01, ESA—A Dionex Company, Chelmsford,MA, USA, 2010. Available from: ⟨http://www.dionex.com/en-us/webdocs/83431-PO-HPLC-Corona-ultra-08July2010-LPN2545-01.pdf⟩ (accessed 23.01.13).
[12] E.G. Galanakis, N.C. Megoulas, P. Solich, et al., Development andvalidation of a novel LC non-derivatization method for the determi-nation of amikacin in pharmaceuticals based on evaporative lightscattering detection, J. Pharm. Biomed. Anal. 40 (5) (2006) 1114–1120.
[13] L. Zhang, J. Peng, J. Tang, et al., Description and validation ofcoupling high performance liquid chromatography with resonanceRayleigh scattering in aminoglycosides determination, Anal. Chim.Acta 706 (2) (2011) 199–204.
[14] E. Adams, G. Van Vaerenbergh, E. Roets, et al., Analysis of amikacinby liquid chromatography with pulsed electrochemical detection,J. Chromatogr. A 819 (1–2) (1988) 93–97.
[15] Dionex Corporation, Analysis of the Aminoglycoside Antibiotics Kana-mycin and Amikacin Matches USP Requirements, Application Note 267,LPN 2663, Sunnyvale, CA, USA, 2011. Available from: ⟨http://www.dionex.com/en-us/webdocs/109787-AN267-IC-KanamycinAmikacin-HPAEPAD-18Jan2011-LPN2663-R2.pdf⟩ (accessed 23.01.13).
[16] N.H. Zawilla, B. Li, J. Hoogmartens, et al., Improved reversed-phaseliquid chromatographic method combined with pulsed electrochemi-cal detection for the analysis of amikacin, J. Pharm. Biomed. Anal. 43(1) (2007) 168–173.
[17] A. Nicolas, Control of the quality of antibiotics in the EuropeanPharmacopoeia: recent development in the case of aminoglycosides,Ann. Pharm. Fr. 65 (3) (2007) 174–182.
[18] M.J. Rocheleau, Analytical methods for determination of counter-ionsin pharmaceutical salts, Curr. Pharm. Anal. 4 (1) (2008) 25–32.
[19] J.F. Ovalles, M. Gallignani, R. Rondón, et al., Proposal fordetermining sulfate counter ion in amikacin sulfate formulations byFourier-transform infrared derivative spectroscopy, Curr. Pharm.Anal. 9 (1) (2013) 20–30.
[20] F. Cadet, S. Garrigues, M. de la Guardia, Quantitative Analysis,Infrared, in: R.A. Meyers (Ed.), Encyclopedia of Analytical Chem-istry, Wiley & Sons, Chichester, 2012.
[21] R. Schindler, B. Lendl, FTIR spectroscopy as detection principle inaqueous flow analysis, Anal. Commun. 36 (4) (1999) 123–126.
[22] M. Gallignani, M.R. Brunetto, Infrared detection in flow analysis—developments and trends (review), Talanta 64 (5) (2004) 1127–1146.
[23] S. Armenta, S. Garrigues, M. de la Guardia, Recent developments inflow-analysis vibrational spectroscopy, Trends Anal. Chem. 26 (8)(2007) 775–787.
[24] E. Konoz, A.H. Mohsen, M. Samadizadeh, et al., Quantitativeanalysis of lorazepam in pharmaceutical formulation through FTIRspectroscopy, E-Journal of Chemistry 9 (4) (2012) 2232–2238.
[25] J.F. Ventura-Gayete, M. de la Guardia, S. Garrigues, On-line sampletreatment and FT-IR determination of doxylamine succinate inpharmaceuticals, Talanta 70 (5) (2006) 1100–1106.
[26] J. Moros, S. Garrigues, M. de la Guardia, Quality control Fouriertransform infrared determination of diazepam in pharmaceuticals,J. Pharm. Biomed. Anal. 43 (4) (2007) 1277–1282.
[27] F. Ovalles, M. Gallignani, R. Rondón, et al., Determination ofsulphate for measuring magnesium sulphate in pharmaceuticals byflow analysis-Fourier transforms infrared spectroscopy, Lat. Am. J.Pharm. 28 (2) (2009) 173–182.
[28] C. Ayala, M.R. Brunetto, F. Ovalles, et al., Determinación de atenololen productos farmacéuticos por espectrometría infrarroja con trans-formada de Fourier (FTIR), Rev. Tec. Fac. Ing. Univ. Zulia 32 (3)(2009) 238–248.

Quantitative estimation of amikacin from pharmaceutical dosage form by CFS-FTIR spectrometry 131
[29] F.M. Silva, P.S.B. Lacerda, J. Jones-Junior, Desenvolvimento sus-tentável e química verde, Quim. Nova 28 (1) (2005) 103–110.
[30] S. Armenta, S. Garrigues, M. de la Guardia, Green analyticalchemistry, Trends Anal. Chem. 27 (6) (2008) 497–511.
[31] J. Moros, S. Garrigues, M. de la Guardia, Vibrational spectroscopyprovides a green tool for multi-component analysis, Trends Anal.Chem. 29 (7) (2010) 578–591.
[32] M. Cascant, J. Kuligowski, S. Garrigues, et al., Determination ofsugars in depilatory formulations: a green analytical method employ-ing infrared detection and partial least squares regression, Talanta 85(4) (2011) 1721–1729.


![INDEX [nostarch.com]INDEX 611 armlinux_server server component, 570 array access operations, 135, 172 array elements accessing, 131 selecting size for, 125 Array option, 125 array](https://img.pdfslide.us/doc/110x75/600851de5eb8775edf36c675/index-index-611-armlinuxserver-server-component-570-array-access-operations.jpg)