Embed Size (px)
Citation preview

OUTSOURCING PERFORMANCE 2017
Presentation - 18th of September

© GIARTE
TIMING
Feb – Apr Online data collection
Apr - June Analysis and reporting
July – Sep Client interviews
Sep - Oct Presentations
OUTSOURCING PERFORMANCE 2017
| Outsourcing Performance 2017 | SogetiSlide 2
PARTICIPATION 2017 - OVERALL
822 Respondents
631 Organizations
928 Unique relations evaluated
PARTICIPATION 2017 – Sogeti (29 organizations)
28 Application Management
9 Infrastructure Management
7 End User Management
PARTICIPATION 2016 - Sogeti
21 Application Management
PARTICIPATION 2016 - OVERALL
717 Respondents
645 Organizations
916 Unique relations evaluated

© GIARTE
ASKED ONCE PER PROVIDER
Value as a Partner
Trust Scores
Cloud competence
Customer Effort Score
(non-standard services)
Satisfaction with services
Relationship Development
Value of Services Provided
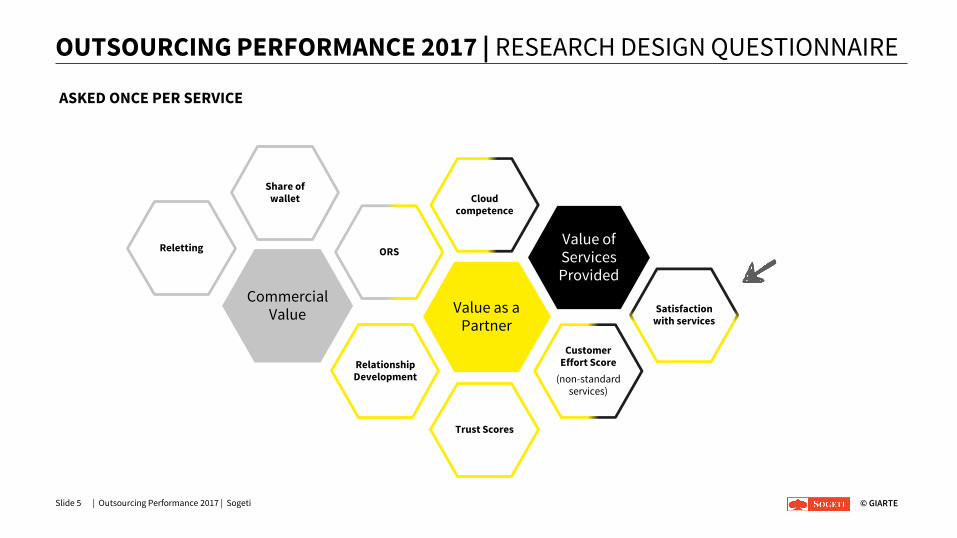
OUTSOURCING PERFORMANCE 2017 | RESEARCH DESIGN QUESTIONNAIRE
| Outsourcing Performance 2017 | SogetiSlide 3
Commercial Value
ORS
Share of wallet
Reletting

© GIARTE
Commercial Value
ORS
Share of wallet
Reletting
Value as a Partner
Trust Scores
Cloud competence
Customer Effort Score
(non-standard services)
Satisfaction with services
Relationship Development
Value of Services Provided
OUTSOURCING PERFORMANCE 2017 | RESEARCH DESIGN QUESTIONNAIRE
| Outsourcing Performance 2017 | SogetiSlide 4
ASKED ONCE PER DOMAIN
© GIARTE
Commercial Value
ORS
Share of wallet
Reletting
Value as a Partner
Trust Scores
Cloud competence
Customer Effort Score
(non-standard services)
Satisfaction with services
Relationship Development
Value of Services Provided
OUTSOURCING PERFORMANCE 2017 | RESEARCH DESIGN QUESTIONNAIRE
| Outsourcing Performance 2017 | SogetiSlide 5
ASKED ONCE PER SERVICE

© GIARTE
NUMBER OF SERVICE PROVIDERS WITH SEVEN OR MORE EVALUATIONS
Slide 6
APPLICATION MANAGEMENT INFRASTRUCTURE MANAGEMENT END USER MANAGEMENT
| Outsourcing Performance 2017 | Sogeti
14 13
1917
23
2013 2014 2015 2016 2017
21 22
25
29
32
2013 2014 2015 2016 2017
1012
1517
23
2013 2014 2015 2016 2017

© GIARTE
NUMBER OF SERVICE PROVIDERS WITH SEVEN OR MORE EVALUATIONS
Slide 7
APPLICATION MANAGEMENT INFRASTRUCTURE MANAGEMENT END USER MANAGEMENT
| Outsourcing Performance 2017 | Sogeti
14 13
1917
23
2013 2014 2015 2016 2017
21 22
25
29
32
2013 2014 2015 2016 2017
1012
1517
23
2013 2014 2015 2016 2017
+ NEH Group
+ PeopleWare
+ RAM Infotechnology
+ Sogeti
- Broad Horizon
+ Cognizant
+ DXC Technology
+ Fujitsu
+ NEH Group
+ Sentia
+ Solvinity
+ Axians
+ Macaw
+ NEH Group
+ PeopleWare
+ RAM Infotechnology
+ Schuberg Philis
+ Sogeti
- Broad Horizon

© GIARTE
DOMAINS IN WHICH SERVICE PROVIDERS RECEIVE A SATISFACTION SCORE
| Outsourcing Performance 2017 | SogetiSlide 8
Application Management
AccentureCognizant
EndavaLevi9
Tata Consultancy Services (TCS)
Wipro
Infrastructure Management
End User Management
BT
IBM
Proact
T-Systems
CGI
Ctac
myBrand
Ordina
SentiaAxians
Cegeka
Detron
OGD
Open Line
PeopleWare
Pink Elephant
RAM Infotechnology
Simac
Valid
Xcellent
Atos
Capgemini
Centric
Conclusion
DXC Technology
Fujitsu
KPN
Macaw
NEH Group
Schuberg Philis
Sogeti
Solvinity

© GIARTE
Endava Proact
Levi9 RAM Infotechnology
Macaw Sentia
myBrand Simac
NEH Group Solvinity
Open Line Valid
PeopleWare Xcellent
Pink Elephant
Peer Group IIMedium Size
Peer Group ILarge Size
PEER GROUPS | BASED ON ANNUAL REVENUE
Slide 9
Annual revenue between 45M and 55M Euros: choice for Peer Group up to Service Provider
| Outsourcing Performance 2017 | Sogeti
ANNUAL REVENUEMedium Size
Annual Revenue < 45M Euros
Large SizeAnnual Revenue > 55M Euros
Accenture Detron
Atos DXC Technology
Axians Fujitsu
BT IBM
Capgemini KPN
Cegeka OGD
Centric Ordina
CGI Schuberg Philis
Cognizant Sogeti
Conclusion Tata Consultancy Services (TCS)
Ctac T-Systems
Wipro

© GIARTE
29
3
23
9
2016 Min Plus 2017
Responses 2016 vs. 2017
=
Slide 10 | Outsourcing Performance 2017 | Sogeti
# OF RESPONDENTS INCREASED | COMPARED TO 2016
20
▪ 3x: did not (want to) participate
▪ 5x: new client organization (i.e. new on client list)
▪ 4x: existing client, but did notparticipate before

© GIARTE
OUTSOURCING RECOMMENDATION SCORE
| Outsourcing Performance 2017 | SogetiSlide 11
Detractors
No way!
No
Promoters
Yes
Absolutely
Passives
Probably not
Partially

© GIARTE
Positive Negative
Absolutely
Yes
Partially
No Way!
No
Probably not
OUTSOURCING RECOMMENDATION SCORE | SOGETI
Slide 12 | Outsourcing Performance 2017 | Sogeti
‘Would you recommend Sogeti?’
29SCORE 2017 N=
positiverecommendations
negativerecommendations
3
21
3
2
93%
7%

© GIARTE
PEER GROUPLARGE SIZE
ORS | PERCENTAGE PROMOTERS
| Outsourcing Performance 2017 | SogetiSlide 13
Providers with ORS of 100%
Providers without ORS of 100%

© GIARTE
RELATIONSHIP DEVELOPMENT
Slide 14 | Outsourcing Performance 2017 | Sogeti
7%
52%
41%
Much decreased Decreased It stayed the same Increased Much increased
‘Compared to last year, has your satisfaction with Sogeti decreased or increased?’
© GIARTE
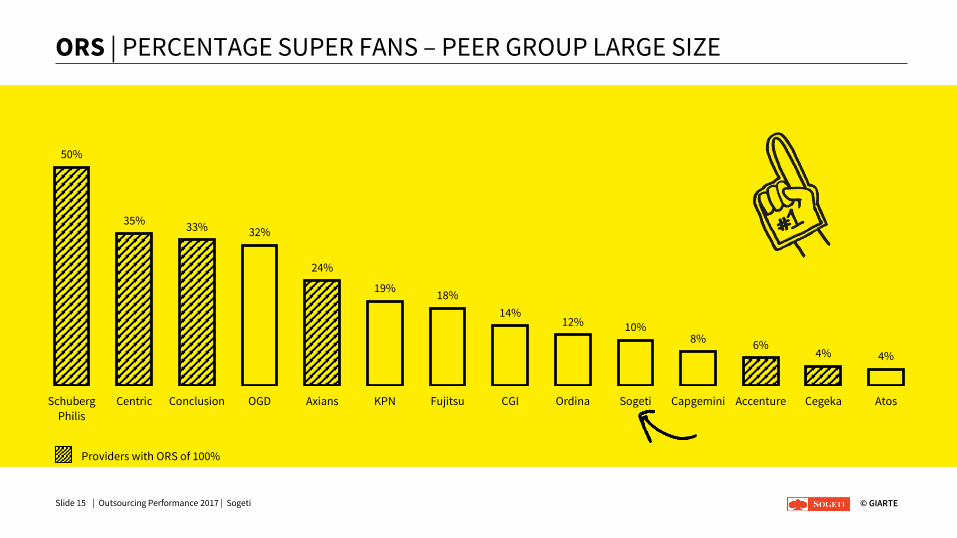
50%
35%33% 32%
24%
19%18%
14%12% 10%
8%6%
4% 4%
Schuberg
Philis
Centric Conclusion OGD Axians KPN Fujitsu CGI Ordina Sogeti Capgemini Accenture Cegeka Atos
ORS | PERCENTAGE SUPER FANS – PEER GROUP LARGE SIZE
| Outsourcing Performance 2017 | SogetiSlide 15
Providers with ORS of 100%

© GIARTE
ORS BENCHMARK | PEER GROUP I – LARGE SIZE
Slide 16 | Outsourcing Performance 2017 | Sogeti
19%15%
5%
26%
17% 18%13%
10%4% 4% 7% 8%
40%
100% 81% 100% 85% 100% 100% 95% 100% 74% 83% 82% 87% 90% 96% 96% 100% 93% 92% 60%
N=16 N=27 N=25 N=39 N=23 N=23 N=22 N=21 N=19 N=18 N=17 N=15 N=83 N=28 N=26 N=16 N=29 N=13 N=10
0%
10%
20%
30%
40%
50%
60%
70%
80%
90%
100%
NegativePositive

© GIARTESlide 17 | Outsourcing Performance 2017 | Sogeti
SATISFACTION SCORES | APPLICATION MANAGEMENT
8.17.6
7.07.5
7.07.3 7.3
7.9
N= 7 N= 12 N= 3 N= 4 N= 1 N= 11 N= 6 N= 14
0
1
2
3
4
5
6
7
8
9
10
11
Development of
front-end
applications
Development
back-end
applications
Implementation
Cloud Enterprise
Systems
Implementation
non-cloud
Enterprise
Systems
Functional
Management of
Enterprise
Systems
System Integration
and middleware
Cloud
transformation
and rationalization
of business
applications
Testing
mean

© GIARTE
SatisfactionScore AM:
Slide 18 | Outsourcing Performance 2017 | Sogeti
SATISFACTION SCORES | APPLICATION MANAGEMENT
8.0
6.0 6.0 7.0
7.0
4.0
6.0
7.0
9.0 9.0
8.08.0
7.0
8.0 8.0
9.0
8.17.6
7.07.5
7.07.3 7.3
7.9
N= 7 N= 12 N= 3 N= 4 N =1 N= 11 N= 6 N= 14
0
1
2
3
4
5
6
7
8
9
10
11
Development of
front-end
applications
Development
back-end
applications
Implementation
Cloud Enterprise
Systems
Implementation
non-cloud
Enterprise
Systems
Functional
Management of
Enterprise
Systems
System Integration
and middleware
Cloud
transformation
and rationalization
of business
applications
Testing
min max mean
7.6 Peer Group Average = 7.2

© GIARTESlide 19 | Outsourcing Performance 2017 | Sogeti
SATISFACTION SCORES | INFRASTRUCTURE MANAGEMENT
7.0
8.0 8.0 8.0
7.0
7.7
7.0 7.0
N= 3 N= 1 N= 1 N= 2 N= 1 N= 3 N= 3 N= 4
0
1
2
3
4
5
6
7
8
9
10
11
Non-cloud
datacenter hosting
and storage
Private cloud
hosting and
storage
100% pure public
cloud
orchestration
Orchestration of
hybrid clouds
Connectivity Cloud connectivity Security and threat
management
Infrastructure
transformation
mean

© GIARTE
SatisfactionScore IM:
Slide 20 | Outsourcing Performance 2017 | Sogeti
SATISFACTION SCORES | INFRASTRUCTURE MANAGEMENT
4.0
8.0 8.0 8.0
7.0 7.0
6.0 6.0
9.0
8.0 8.0 8.0
7.0
8.08.0 8.0
7.0
8.0 8.0 8.0
7.0
7.7
7.0 7.0
N= 3 N= 1 N= 1 N= 2 N= 1 N= 3 N= 3 N= 4
0
1
2
3
4
5
6
7
8
9
10
11
Non-cloud
datacenter hosting
and storage
Private cloud
hosting and
storage
100% pure public
cloud
orchestration
Orchestration of
hybrid clouds
Connectivity Cloud connectivity Security and threat
management
Infrastructure
transformation
min max mean
7.3 Peer Group Average = 7.4

© GIARTE
8.08.3
7.5 7.58.0
7.0
8.0
N= 1 N= 4 N= 0 N= 2 N= 4 N= 2 N= 1 N= 2
0
1
2
3
4
5
6
7
8
9
10
11
Classical local
workspace
Remote
workspace
Internet-centric
workspace
Unified
communication
Business
application
provisioning
Support services Physical device
management
Federated access
mean
Slide 21 | Outsourcing Performance 2017 | Sogeti
SATISFACTION SCORES | END USER MANAGEMENT

© GIARTE
8.0
7.07.0
6.0 6.0
7.0
8.08.0
9.0
8.09.0
10.0
7.0
8.08.08.3
7.5 7.58.0
7.0
8.0
N= 1 N= 4 N= 0 N= 2 N= 4 N= 2 N= 1 N= 2
0
1
2
3
4
5
6
7
8
9
10
11
Classical local
workspace
Remote
workspace
Internet-centric
workspace
Unified
communication
Business
application
provisioning
Support services Physical device
management
Federated access
min max mean
SatisfactionScore EUM:
Slide 22 | Outsourcing Performance 2017 | Sogeti
SATISFACTION SCORES | END USER MANAGEMENT
7.8 Peer Group Average = 7.3

© GIARTE
BENCHMARK SATISFACTION – CES | APPLICATION MANAGEMENT
Slide 23 | Outsourcing Performance 2017 | Sogeti
Accenture
Atos CapgeminiCentric
CGICognizant
Conclusion
CtacDXC Technology Fujitsu
KPN,
Tata Consultancy Services (TCS)
Ordina
Schuberg Philis
Sogeti
Wipro
Endava Levi9, Macaw
myBrandNEH Group
SentiaSolvinity
4.0
4.5
5.0
5.5
6.0
6.5
7.0
7.5
8.0
8.5
25 30 35 40 45 50 55 60 65 70 75 80 85 90
Sa
tisf
act
ion
Sco
re A
M s
ervi
ces
Customer Effort Score Non-standard Services AM
0
0
Low effortHigh effort
Sogeti 2016
© GIARTE
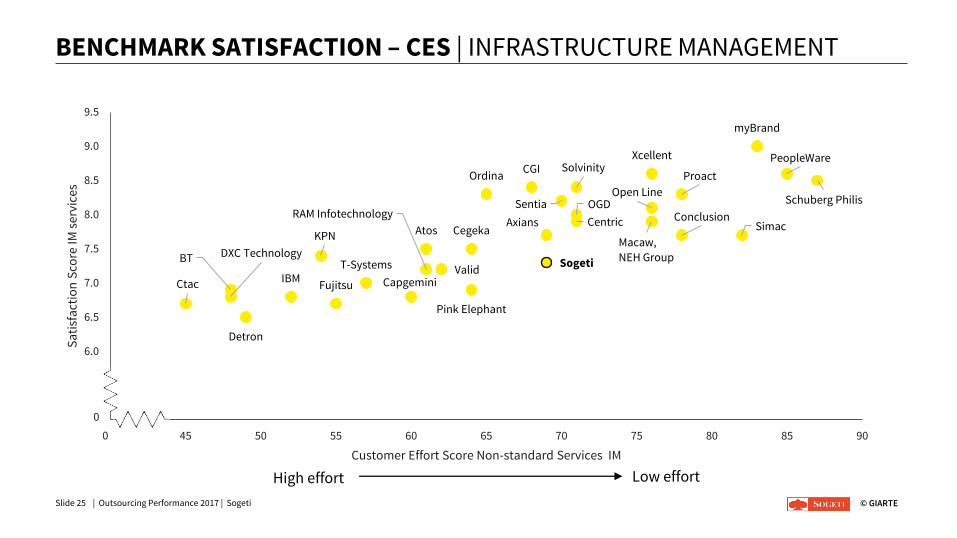
BENCHMARK SATISFACTION – CES | INFRASTRUCTURE MANAGEMENT
Slide 25 | Outsourcing Performance 2017 | Sogeti
AtosAxians
BT
Capgemini
CegekaCentric
CGI
Conclusion
Ctac
Detron
DXC Technology
FujitsuIBM
KPN
OGD
Ordina
Schuberg Philis
SogetiT-Systems
Macaw,
NEH Group
myBrand
Open Line
PeopleWare
Pink Elephant
Proact
RAM InfotechnologySentia
Simac
Solvinity
Valid
Xcellent
5.0
5.5
6.0
6.5
7.0
7.5
8.0
8.5
9.0
9.5
40 45 50 55 60 65 70 75 80 85 90
Sa
tisf
act
ion
Sco
re IM
ser
vice
s
Customer Effort Score Non-standard Services IM
0
0
Low effortHigh effort

© GIARTE
BENCHMARK SATISFACTION – CES | END USER MANAGEMENT
Slide 27 | Outsourcing Performance 2017 | Sogeti
Atos
Axians
Capgemini
Cegeka
Centric
Conclusion
Detron
DXC Technology
Fujitsu
KPN
OGD
Schuberg Philis
Sogeti
Macaw
NEH Group
Open Line
PeopleWare
Pink ElephantRAM Infotechnology
Simac
Solvinity
Valid
Xcellent
4.5
5.0
5.5
6.0
6.5
7.0
7.5
8.0
8.5
35 40 45 50 55 60 65 70 75 80 85 90
Sa
tisf
act
ion
Sco
re E
UM
ser
vice
s
Customer Effort Score Non-standard Services EUM
0
0
Low effortHigh effort
© GIARTE
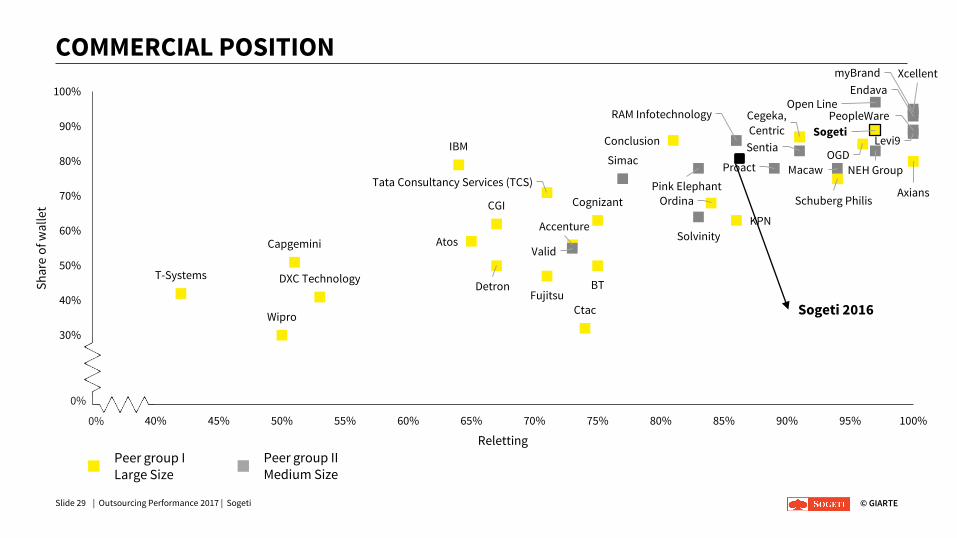
COMMERCIAL POSITION
Slide 29 | Outsourcing Performance 2017 | Sogeti
Accenture
Atos
Axians
BT
Capgemini
Cegeka,
Centric
CGI Cognizant
Conclusion
Ctac
DetronDXC Technology
Fujitsu
IBM
KPN
OGD
Ordina Schuberg Philis
Sogeti
Tata Consultancy Services (TCS)
T-Systems
Wipro
Endava
Levi9
Macaw
myBrand
NEH Group
Open LinePeopleWare
Pink Elephant
Proact
RAM Infotechnology
SentiaSimac
Solvinity
Valid
Xcellent
10%
20%
30%
40%
50%
60%
70%
80%
90%
100%
35% 40% 45% 50% 55% 60% 65% 70% 75% 80% 85% 90% 95% 100%
Sh
are
of w
all
et
Reletting
Peer group ILarge Size
Peer group IIMedium Size
0%
0%
Sogeti 2016

© GIARTE
TRUST IS THE NEW ORS
| Outsourcing Performance 2017 | SogetiSlide 31
RELIABILITY WILLINGNESS
OPENNESS
EMPATHY
COMMUNICATION
COMPETENCE
Relationship(Cognitive)
Partnership(Affective)

© GIARTESlide 32 | Outsourcing Performance 2017 | Sogeti
7983
79
8681
77
69 68 67 69 71 70
0
10
20
30
40
50
60
70
80
90
100
Openness Willingness Empathy Communication Skills Reliability
2017 vs 2016
2017 2016
GIARTE TRUST INDICATORS | SOGETI
81GTS 2017
69GTS 2016

© GIARTE
GIARTE TRUST SCORE | PEER GROUP – LARGE SIZE
Slide 33 | Outsourcing Performance 2017 | Sogeti
55
56
61
61
62
64
68
69
70
71
72
74
75
76
76
77
77
78
80
80
81
82
82
Wipro
Detron
DXC Technology
Ctac
Atos
IBM
Capgemini
BT
Fujitsu
KPN
T-Systems
Accenture
Ordina
CGI
Cegeka
Centric
Axians
OGD
Tata Consultancy Services (TCS)
Cognizant
Sogeti
Schuberg Philis
Conclusion
Accenture
Atos
Axians
BT
Capgemini
Cegeka
CentricCGI
Cognizant
Conclusion
Ctac
Detron
DXC Technology
Fujitsu
IBM
KPN
OGD
Ordina
Schuberg Philis
Sogeti
Tata Consultancy
Services (TCS)
T-Systems
Wipro
45
50
55
60
65
70
75
80
85
50 55 60 65 70 75 80 85 90
Ma
ture
Rel
ati
on
ship
Mature Partnership
Partnership vs. Relationship
0
0

© GIARTE
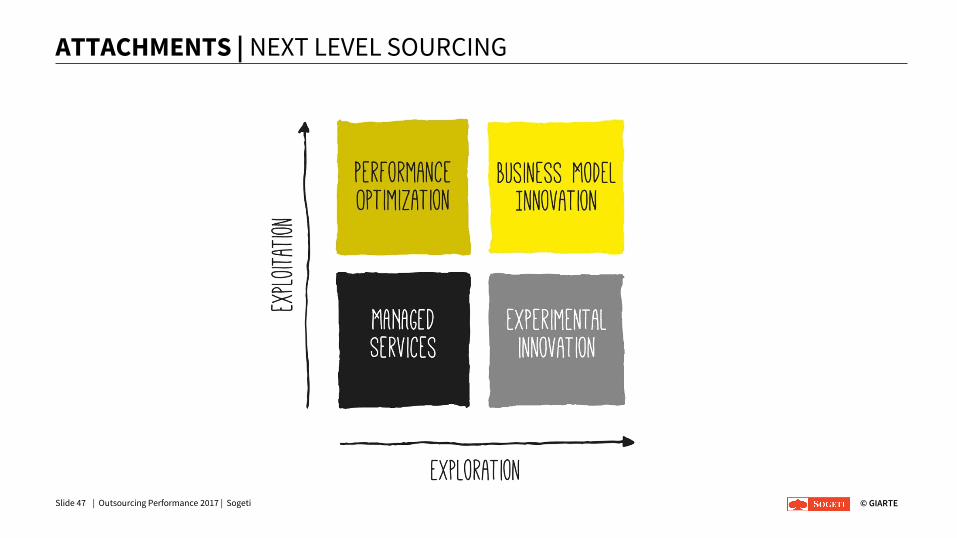
NEXT LEVEL SOURCING
| Outsourcing Performance 2017 | SogetiSlide 35
Performance Optimization Business Model Innovation
Managed Services Experimental Innovation

© GIARTE
NEXT LEVEL SOURCING | CURRENT STATE
| Outsourcing Performance 2017 | SogetiSlide 36
Performance Optimization Business Model Innovation
Managed Services Experimental Innovation

© GIARTE
NEXT LEVEL SOURCING | WISH
| Outsourcing Performance 2017 | SogetiSlide 37

Smaller providers set the tone in taking on digital
and cloud projects
A vivid contrast in presentation
content and style sets them apart
They position presentations as do-experiments
(demo’s, MVPs, challenges)
They activate their audiences by participating
It’s not who you know, but how they
remember your pitch
Non-IT decision makers are in favor of the unusual suspects
New kids in town

Leadership DNA Account & Sales
Truly understand what drives and disrupts businesses
Be at ease with ambiguity and uncertainly: don’t play defense
Experiment, take smart risks and learn to capitalize on value-creation
Advocate a strong vision with compelling narratives
Master soft innovation: the touch in tech delivers the wow
Own your personal success, inspire others and celebrate together


ATTACHMENTS

© GIARTE
ATTACHMENTS | RESEARCH DESIGN
Slide 42
Satisfaction with standard services
Recommendation
Relationship development
Customer Effort Score(non-standard services)
The research design of the benchmark is shown in the figure on the left. Per service provider respondents answer single questions about: ‒ The level of recommendation of the service provider (the Outsourcing
Recommendation Score - ORS);‒ The development of the relationship with the service provider; ‒ The amount of trust in the service provider (the Giarte Trust Score - GTS:
consisting of six trust indicators).
In addition, respondents are asked what services they receive from the service provider. These services are categorized in different domains: Application Management (AM), Infrastructure Management (IM) and End User Management (EUM). Questions are asked about: ‒ The satisfaction with the specific service; ‒ The Customer Effort Score (with respect to the provision of non standard
services).
RESEARCH DESIGN
6 trustindicators
A single question per service provider
A question per service provider for every relevant service
A question per service provider for every relevant service domain
| Outsourcing Performance 2017 | Sogeti

© GIARTE
ATTACHMENTS | CONDITIONS ORS
Slide 43
ORS
N ≥ 15
ORS
≥ 30 millioneuros
N ≥ 10N < 15
CONDITIONS FOR A PUBLIC OUTSOURCING RECOMMENDATION SCORE (ORS)
ORS
< 30 million euros
N ≥ 10N < 15
ORS
N ≥ 7N < 10
An Outsourcing Recommendation Score -comprehensive profile in the yearbook
No Outsourcing Recommendation Score -brief profile in the yearbook
The Outsourcing Recommendation Score (ORS) Respondents are asked to what extent they would recommend their service provider(s). This question is no longer asked per service domain, but per service provider, which means that this year’s Outsourcing Recommendation Score is not comparable to the ones from previous editions.Service providers that received evaluations from at least 15 different client organizations – or 10 in case the sum of the contract values is at least 30 million euros on average (see the figure on the left) – are awarded an Outsourcing Recommendation Score (ORS). All recommendations from the total respondents group form the basis for the calculation of the Outsourcing Recommendation Score.
| Outsourcing Performance 2017 | Sogeti

© GIARTE
ATTACHMENTS | PEER GROUPS
Slide 44
PEER GROUPS
Overview of service providers with a public Outsourcing Recommendation Score
IPeer groupLarge Size
IIPeer groupMedium Size
Accenture Endava
Atos Levi9
Axians Macaw
Capgemini myBrand
Cegeka NEH Group
Centric Open Line
CGI PeopleWare
Conclusion Pink Elephant
Ctac Proact
DXC Technology RAM Infotechnology
Fujitsu Sentia
IBM Solvinity
KPN Xcellent
OGD
Ordina
Schuberg Philis
Sogeti
T-Systems
Wipro
Service providers who did not receive a public Outsourcing Recommendation Score
BT Simac
Cognizant Valid
Detron
Tata Consultancy Services (TCS)
This year, Outsourcing Performance presents the results of 38 different service providers. Not all service providers serve the same customer groups. Therefore, we have chosen to organize them and their results in so-called peer groups.
Depending on the annual turnover reported in 2016 in the Netherlands, a service provider is classified in either the benchmark for Medium Size providers (revenue of up to 45 mln. Euros) or the benchmark for Large Size providers (revenue from 55 mln. Euros). Service providers with a revenue between 45 and 55 million euros can choose in which peer group they want to be included.
The table on the left shows which service provider is included in which peer group.
| Outsourcing Performance 2017 | Sogeti

© GIARTE
ATTACHMENTS | ORS, SATISFACTION, CES
Slide 45
OUTSOURCING RECOMMENDATION SCORE (ORS)“Would you recommend < service provider > ?” Unlike previous years, this question was asked once per service provider, instead of per service domain.
No Way! No Probably not Partially Yes Absolutely
These answers make up the Outsourcing Recommendation Score (as a percentage ofpositive recommendations out of the total amount of answers that are given)
Detractors Passives PromotersSuper fans
SATISFACTION“Please rate the level of satisfaction with the services that you outsource to < service provider>. The number 1 stands for extremely dissatisfied and a 10 stands for extremely satisfied.”
CUSTOMER EFFORT SCORE (CES)“How much effort does it take your organization to get things done form <service provider> that fall outside the contracted <domain> services?
Much effort (Almost)no effort
0 points 20 points 40 points 60 points 80 points 100 points
Scores are calculated as an average, where the leftmost scale represents a value of 0 points and the rightmost scale a value of 100 points. When opposing scales are chosen exactly as often, this yields a final score of 50 points. The higher the score, the less effort it takes to receive a non-standard service from the service provider.
Respondents indicate which services they receive in each domain. Next, for each of these services, the level of satisfaction is indicated on a scale of 1 to 10. Based on this, an average grade per service is calculated. The average of these grades, where the weight of the grade for the service depends on the number of evaluations, then constitutes the satisfaction score for the domain in which the services are classified.
| Outsourcing Performance 2017 | Sogeti

© GIARTE
ATTACHMENTS | GIARTE TRUST SCORE
Slide 46
GIARTE TRUST SCORE (GTS)
For each trust indicator (in bold), a statement is presented about which the respondent can indicate on a six point scale to what extent he/she agrees or disagrees with it. Per indicator, the service provider gets a score. The average of the six scores is the GiarteTrust Score. The peer group average is an average of the Giarte Trust Scores of all providers in the relevant peer group.
Reliability
“The service provider sticks to the agreements made”
Communication
“Communication between the service provider and us runs smoothly”
Skills
“The service provider has the right expertise and skills to provide the services”
Empathy
“The service provider really understands our organization and challenges”
Willingness
“The service provider puts in the effort to satisfy us as a customer and takes our interests into account”
Openness
“The service provider has the ability to resolve conflicts and differences of opinion with us in a constructive manner”
Strongly disagree
Disagree Slightly disagree
Slightly agree
Agree Strongly agree
0 points 20 points 40 points 60 points 80 points 100 points
Scores are calculated as an average, where the leftmost scale represents a value of 0 points and the rightmost scale a value of 100 points. When opposing scales are chosen exactly as often, this yields a final score of 50 points.
| Outsourcing Performance 2017 | Sogeti
© GIARTE
ATTACHMENTS | NEXT LEVEL SOURCING
| Outsourcing Performance 2017 | SogetiSlide 47
© GIARTE
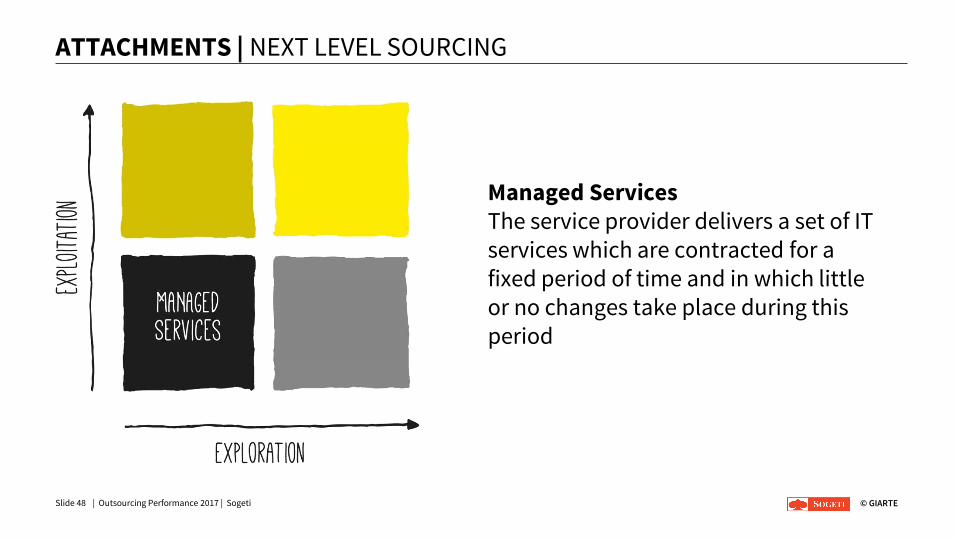
ATTACHMENTS | NEXT LEVEL SOURCING
| Outsourcing Performance 2017 | SogetiSlide 48
Managed ServicesThe service provider delivers a set of IT services which are contracted for a fixed period of time and in which little or no changes take place during this period

© GIARTE
ATTACHMENTS | NEXT LEVEL SOURCING
| Outsourcing Performance 2017 | SogetiSlide 49
Performance OptimizationDuring the collaboration the service provider delivers a set of IT services, which are continuously improved in terms of quality, efficiency and profitability

© GIARTE
ATTACHMENTS | NEXT LEVEL SOURCING
| Outsourcing Performance 2017 | SogetiSlide 50
Experimental InnovationIn collaboration with the service provider technology is experimented with to discover new opportunities

© GIARTE
ATTACHMENTS | NEXT LEVEL SOURCING
| Outsourcing Performance 2017 | SogetiSlide 51
Business Model InnovationIn collaboration with the service provider there is purposefully being worked on business model improvements with the application of new technology