Embed Size (px)
Citation preview
Formerly SPSS Ireland
Output Management System
(OMS) in SPSS 20
Conor McCarthy
Services Consultant
What is OMS ?
The Output Management System (OMS) provides the ability
to automatically write selected categories of output to
different output files in different formats
Can write output files into the following formats:
• Word, Excel, PDF, SPSS (.sav) , Output file (.spv), web report
format (.spw), XML, html and text
OMS provides a means to automatically writing pivot table
output from a specific procedure (e.g. Frequencies) to files in
the above formats
2
Why use OMS ?
You might want to generate a table of summary statistics not
available through the aggregate procedure and merge them
back with the original dataset
You might want to automatically exclude selected categories
of output or specific items from the Output viewer. i.e. you
may want to exclude case processing summaries or some
other output
OMS is very powerful
3
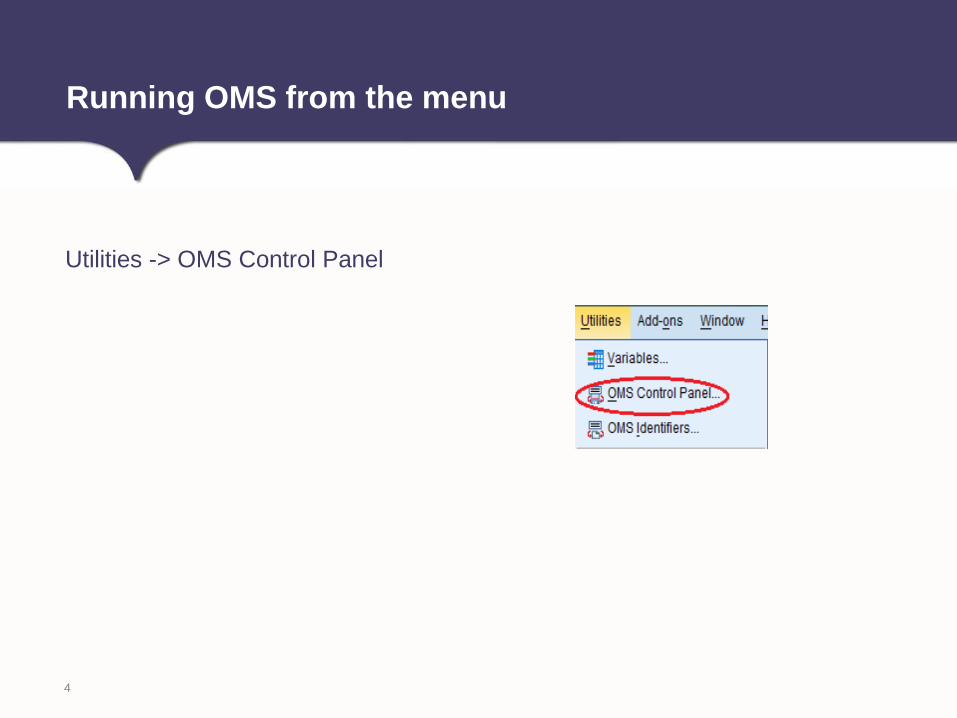
Utilities -> OMS Control Panel
Running OMS from the menu
4
The OMS control panel is used to both start and stop the
routing of output to various destinations or to exclude types
of output from the Viewer
Can create multiple independent OMS requests at the same
time
The same output can be routed to different locations in
different formats
OMS Control Panel
5
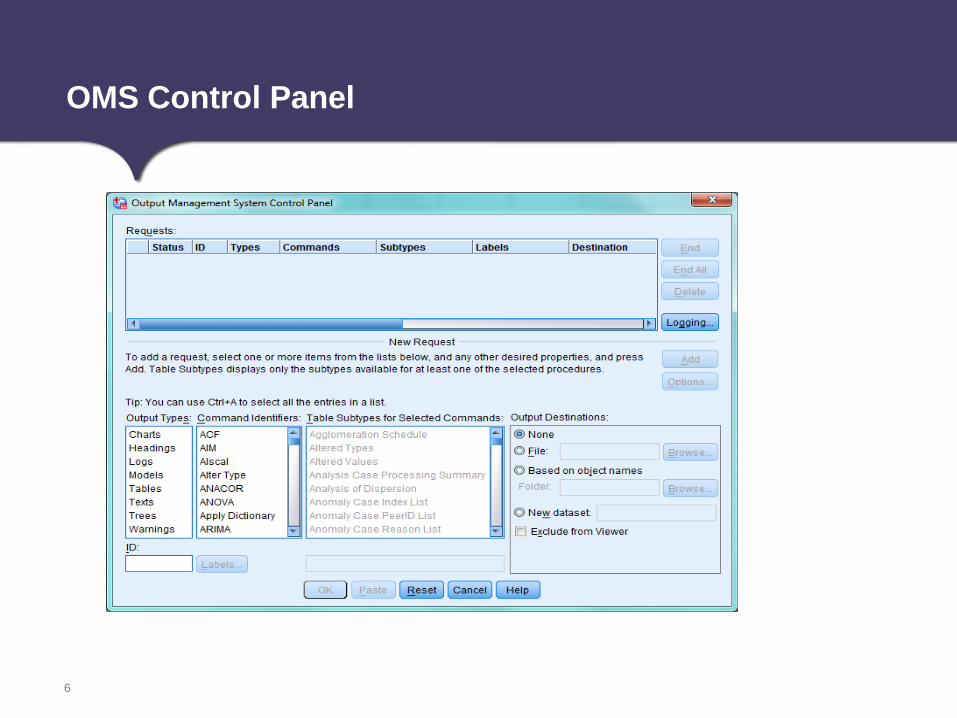
OMS Control Panel
6
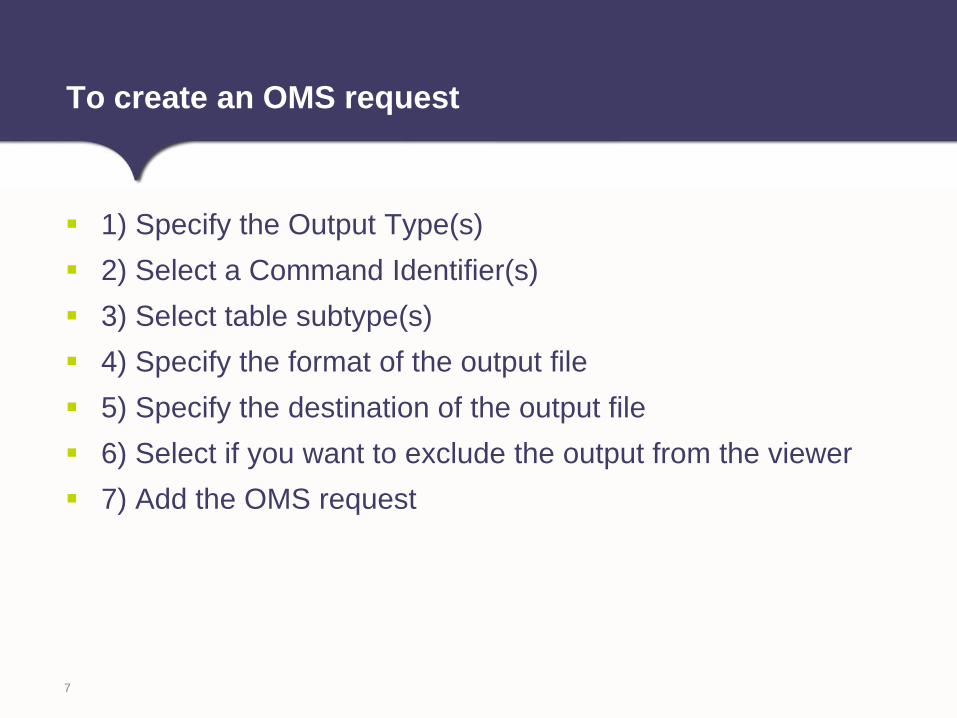
1) Specify the Output Type(s)
2) Select a Command Identifier(s)
3) Select table subtype(s)
4) Specify the format of the output file
5) Specify the destination of the output file
6) Select if you want to exclude the output from the viewer
7) Add the OMS request
To create an OMS request
7
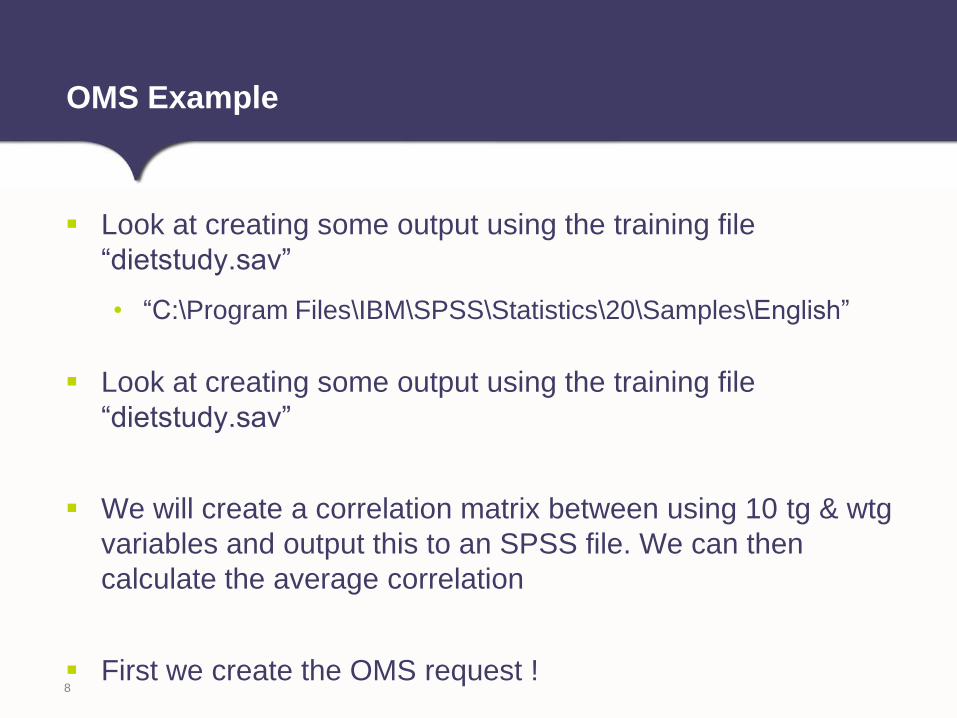
Look at creating some output using the training file
“dietstudy.sav”
• “C:\Program Files\IBM\SPSS\Statistics\20\Samples\English”
Look at creating some output using the training file
“dietstudy.sav”
We will create a correlation matrix between using 10 tg & wtg
variables and output this to an SPSS file. We can then
calculate the average correlation
First we create the OMS request !
OMS Example
8
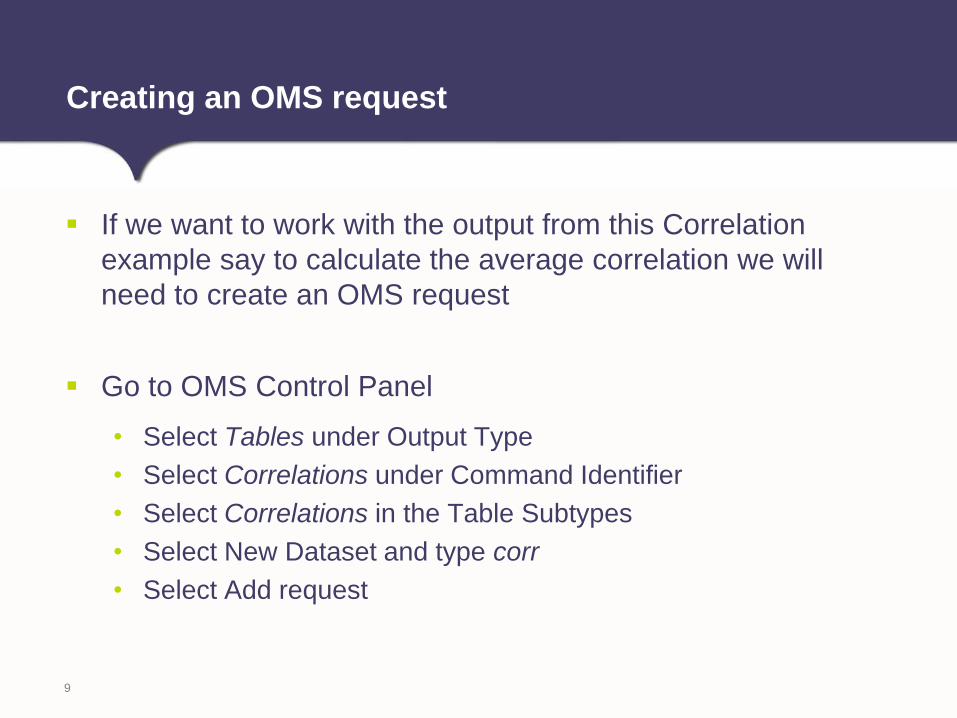
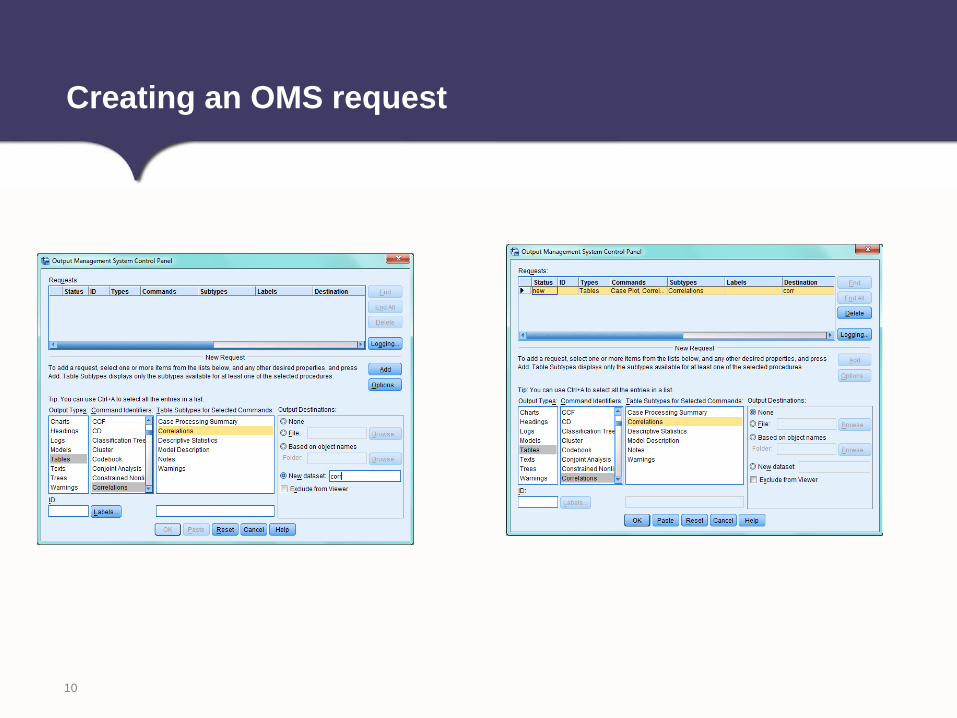
If we want to work with the output from this Correlation
example say to calculate the average correlation we will
need to create an OMS request
Go to OMS Control Panel
• Select Tables under Output Type
• Select Correlations under Command Identifier
• Select Correlations in the Table Subtypes
• Select New Dataset and type corr
• Select Add request
Creating an OMS request
9
Creating an OMS request
10
Creating an OMS request
11
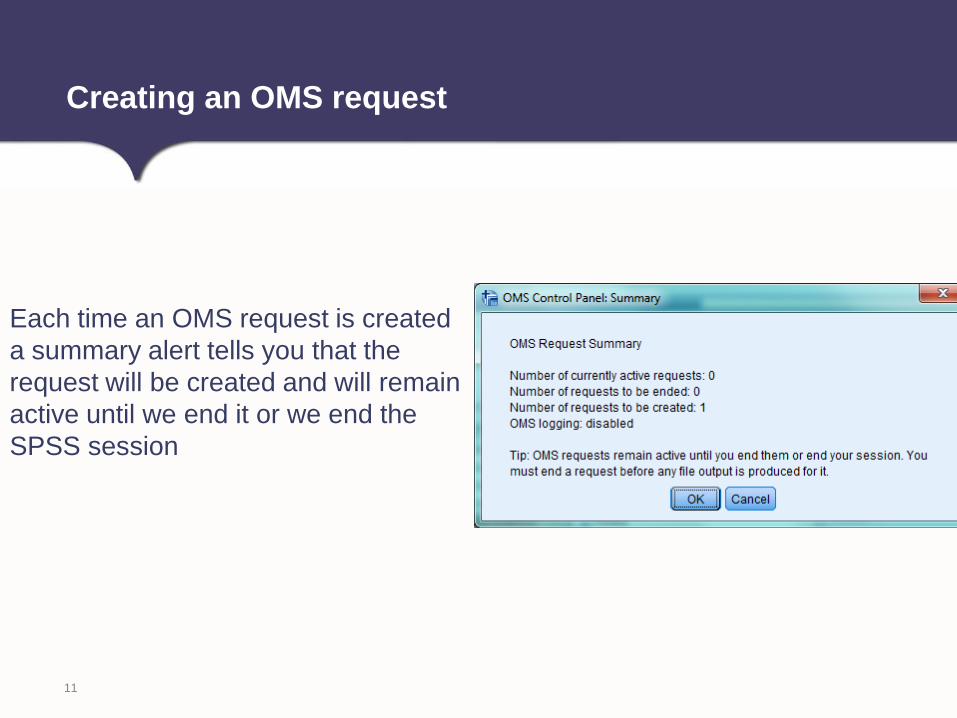
Each time an OMS request is created
a summary alert tells you that the
request will be created and will remain
active until we end it or we end the
SPSS session
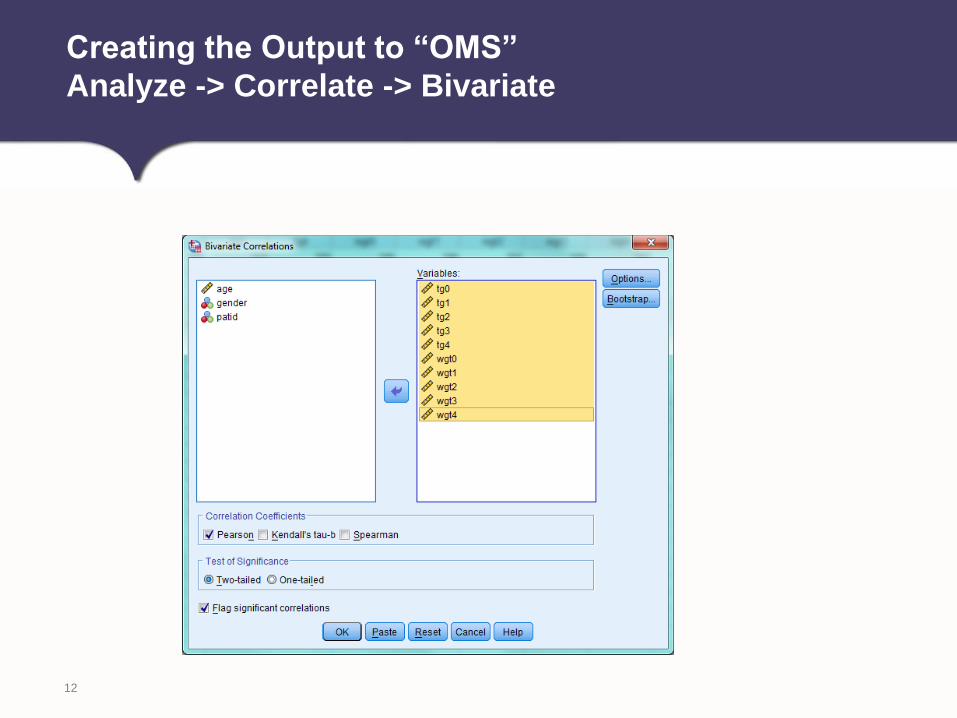
Creating the Output to “OMS”
Analyze -> Correlate -> Bivariate
12
In order to re-route our output to a new dataset we need to
End the OMS request
Utilities -> OMS Control Panel -> Select the request -> End-> Ok
Again you see the OMS summary but the number of requests to be
ended will be 1
A new dataset named “corr” will be opened
Routing your output to the new format
13
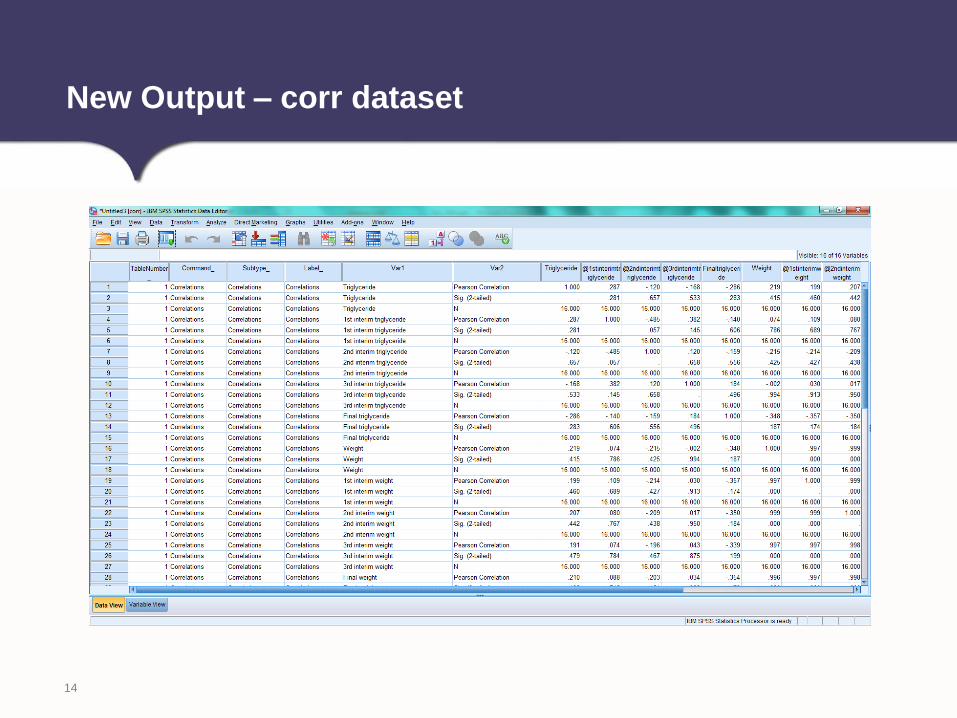
New Output – corr dataset
14
The new file “corr” has exactly the same structure as the
correlation matrix output
The Var1 column contains the variable labels from the rows
of the Correlation table
The variable label is repeated three times because there are
three statistics associated with each variable (Pearson
Correlation, Sig (2-tailed), and N)
We only want to look at the Pearson Correlation
We can use the Select Cases procedure to only select out
cases where Var2 = ‘Pearson Correlation’
Working with the new file
15
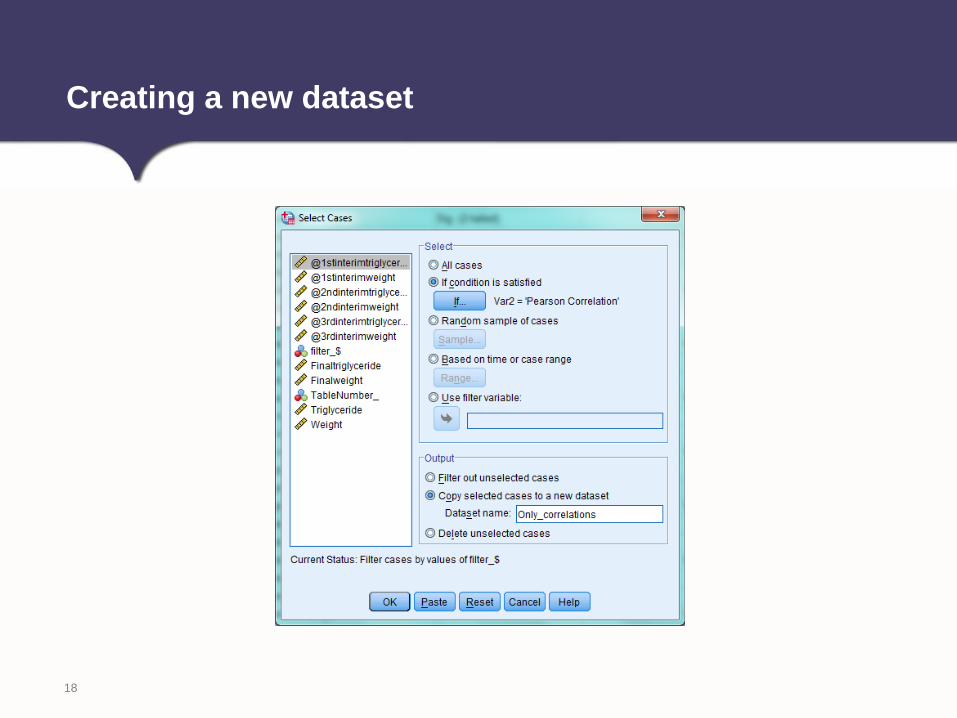
In order to only select out the correlation values we specify to
select cases where Var2 = ‘Pearson Correlation’
In order to work with only the correlation values we can
select “Copy selected cases to a new dataset” option
We could name this dataset “Only_correlations”
Select Cases dialog
16
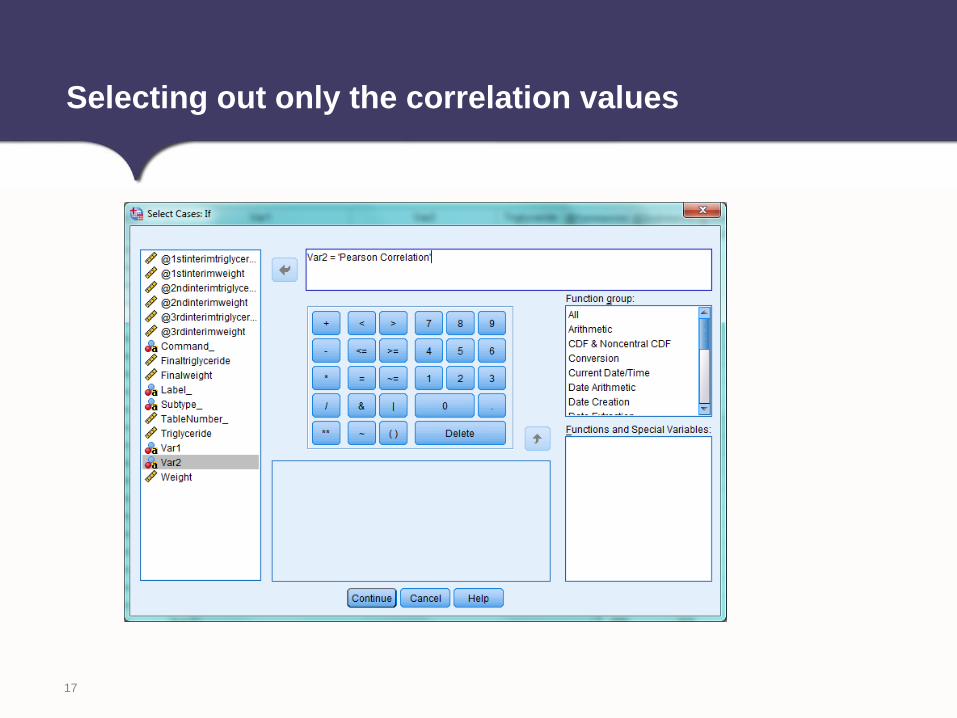
Selecting out only the correlation values
17
Creating a new dataset
18
The table includes the correlation between a variable and
itself (a value of 1)
We want to exclude these correlations so we can define 1 as
a missing value
We also need to calculate the absolute value of all
correlations to calculate a meaningful average
We can do this efficiently in syntax using a Do Repeat
Command
Extra Modifications
19
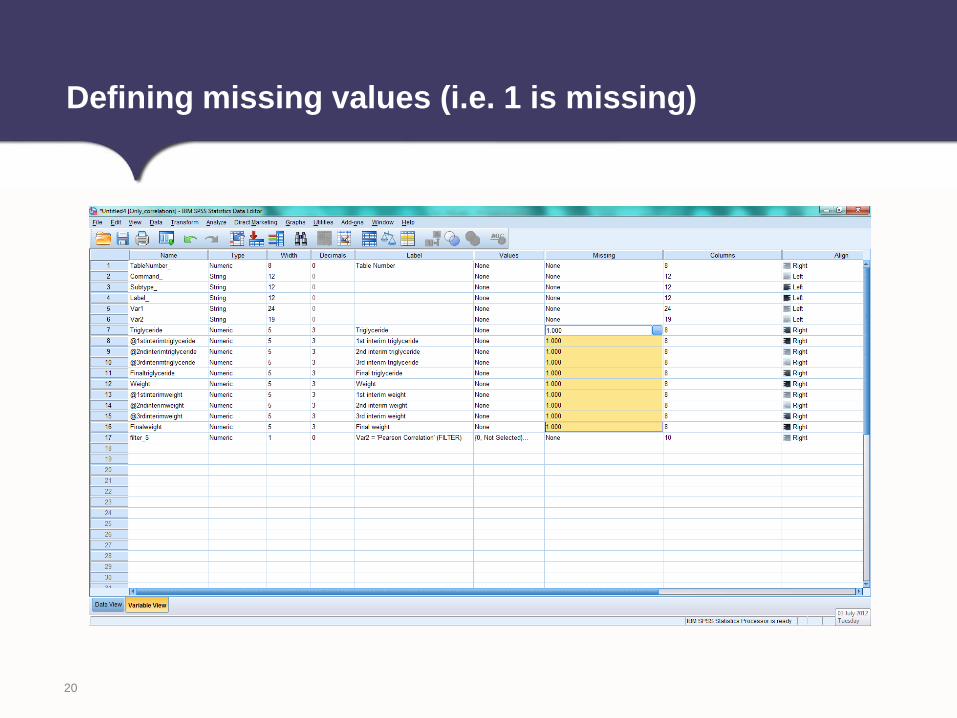
Defining missing values (i.e. 1 is missing)
20
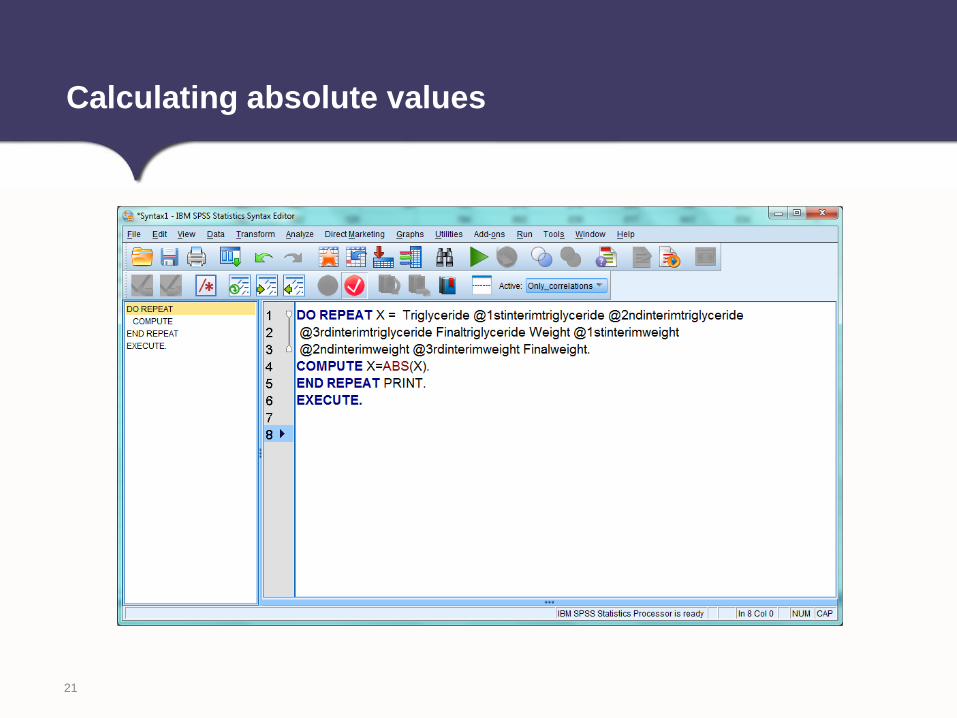
Calculating absolute values
21
Can use the Descriptives procedure to report on the average
for the correlation variables
Analyze -> Descriptive Statistics -> Descriptives
Select the Mean, Min, Max and Standard Deviation
Select only the correlation variables
Select Descending Means
Calculating the Mean Correlation
22
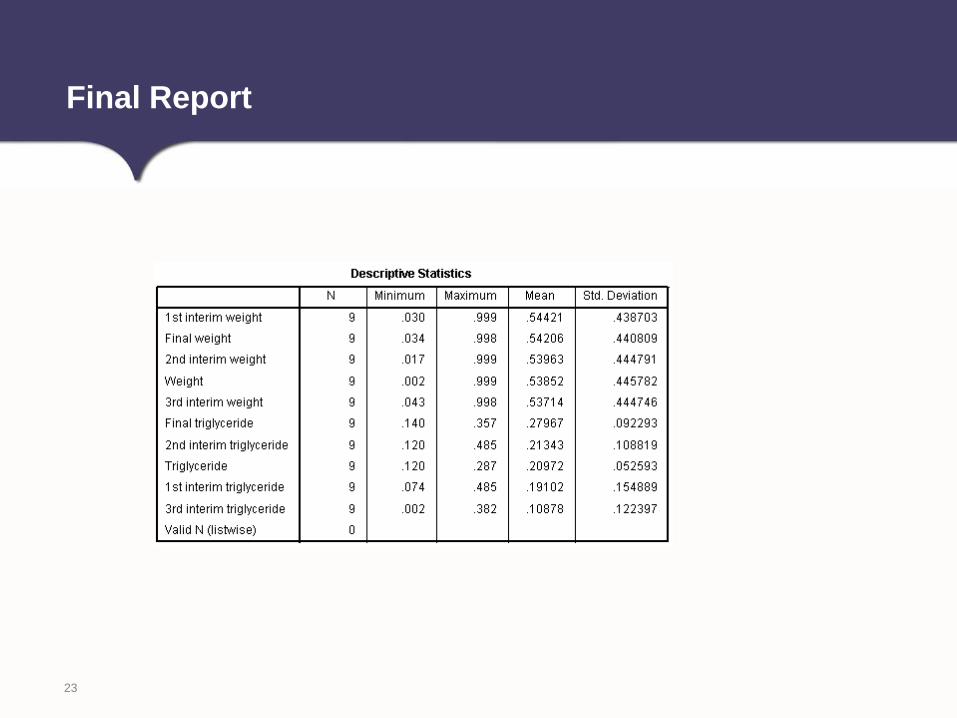
Final Report
23
If you want to automate the OMS facility it can be ran
through syntax
The OMS Identifier dialog can paste the command subtype
identifiers
Further OMS
24