Embed Size (px)
Citation preview

No 116
Output Commitment Through Product Bundling: Experimental Evidence Jeroen Hinloopen, Wieland Müller, Hans-Theo Normann
November 2013

IMPRINT DICE DISCUSSION PAPER Published by düsseldorf university press (dup) on behalf of Heinrich‐Heine‐Universität Düsseldorf, Faculty of Economics, Düsseldorf Institute for Competition Economics (DICE), Universitätsstraße 1, 40225 Düsseldorf, Germany www.dice.hhu.de
Editor: Prof. Dr. Hans‐Theo Normann Düsseldorf Institute for Competition Economics (DICE) Phone: +49(0) 211‐81‐15125, e‐mail: [email protected] DICE DISCUSSION PAPER All rights reserved. Düsseldorf, Germany, 2013 ISSN 2190‐9938 (online) – ISBN 978‐3‐86304‐115‐1 The working papers published in the Series constitute work in progress circulated to stimulate discussion and critical comments. Views expressed represent exclusively the authors’ own opinions and do not necessarily reflect those of the editor.

1
Output Commitment Through Product Bundling:
Experimental Evidence
Jeroen Hinloopen,a Wieland Müllerb,c and Hans-Theo Normannd
NOVEMBER 2013
ABSTRACT: We analyze the impact of product bundling in experimental markets. One firm has monopoly power in a first market but competes with another firm à la Cournot in a second market. We compare treatments where the multi-product firm (i) always bundles, (ii) never bundles, and (iii) chooses whether to bundle. We also contrast the simultaneous and the sequential order of moves in the duopoly market. Our data indicate support for the theory of product bundling: with bundling and simultaneous moves, the multi-product firm offers the predicted number of units. When the multi-product firm is the Stackelberg leader, the predicted equilibrium is better attained with bundling, especially when it chooses to bundle, even though in theory bundling should not make a difference here. In sum, bundling works as a commitment device that enables the transfer of market power from one market to another.
KEYWORDS: Product bundling, commitment, Cournot, experiments, Stackelberg,
JEL CODES: C92; D43; L11; L12; L41
We are grateful to an associate editor, two anonymous referees, Dirk Engelmann, Nadav Levy, Holger Rau, Yossi Spiegel, Fangfang Tan, David Ulph, and seminar participants at IIOC 2012 (Arlington), M-BEES 2012 (Maastricht), and CRESSE 2012 (Chania) for helpful comments. a Corresponding author. University of Amsterdam, FEB/ASE, Roetersstraat 11, 1018 WB Amsterdam, The Netherlands; [email protected]. b VCEE & Department of Economics, University of Vienna, 1210 Vienna, Brünnerstrasse 72, Austria,
[email protected]. c TILEC, CentER & Department of Economics, Tilburg University, P.O. Box 90153, 5000 LE Tilburg, The Netherlands. d Duesseldorf Institute for Competition Economics (DICE), Universitaetsstr. 1, 40225 Duesseldorf, Germany;

2
1. INTRODUCTION
In its 2004 landmark decision, the European Commission (EC) found Microsoft guilty of abusing
its dominant market position. Microsoft had bundled its operating system Microsoft Windows
with its Windows Media Player, thereby abusing its dominant position in the operating systems
market (European Commission, 2007). The EC fined the company €497 million, the largest fine
ever handed out by the EC at that time, and gave Microsoft 90 days to produce a version of
Microsoft Windows without Windows Media Player. In 2006, and again in 2008, the EC fined
Microsoft an additional €280.5 million and €899 million respectively for not complying with the
2004 ruling. In the meantime, Microsoft offered an operating system without Windows Media
Player and has paid all fines (reduced to €860 million) in full.1 To date, Microsoft has been fined
nearly €2.2 billion for its bundling practices, €561 million of which are currently being
challenged by Microsoft in the General Court.2
Product bundling is a business strategy that can be harmful to competitors and,
ultimately, to consumers. The leverage theory of product bundling states that a firm which enjoys
market power in one market can transfer this power to another possibly unrelated market by
selling the goods involved as a single bundle (Martin, 1999; and Nalebuff, 2004). The Microsoft
case illustrates that product bundling can qualify as an abuse of market dominance also in
practice. Moreover, the importance of bundling as a business strategy is reflected in the fact that
it is covered in virtually every textbook in industrial organization and business economics.
In this paper, we report on a series of experiments which test the leverage theory of
product bundling. In spite of its importance as a business practice, it is difficult to perform field
studies as to the effects of product bundling. Firms would not be willing to (randomly)
experiment with this business strategy as it might significantly affect sales (possibly for the
1 In January 2009, Microsoft was once again convicted for product bundling when the EC ordered the company to
unbundle its internet browser from Microsoft Windows, stating that “…Microsoft’s tying of Internet Explorer to the
Windows operating system harms competition between web browsers, undermines product innovation and
ultimately reduces consumer choice.” (European Commission, 2009). It was agreed that Microsoft would offer
customers of Microsoft Windows a choice of 12 internet browsers. Microsoft dropped this feature however in the
Windows 7 Service Pack 1 in February 2011 for 14 months onwards, inducing the EC to fine Microsoft €561
million in March 2013. 2 Other notable antitrust bundling cases include U.S. v. Microsoft (2001) and LePage’s Inc. v. 3M (2003) in the U.S.;
and Hilti (1987), and Tetra Pak II (1991) in the E.U.

3
worse), and because it could qualify as an abuse of a dominant position. Moreover, instances of
product bundling that significantly affect sales volumes are rare, making it difficult to draw
general conclusions from the various case studies as to the wider impact of product bundling on
market performance.
Van Damme et al. (2009, p. 107) review the experimental literature on abusive practices
and conclude that “little experimental work has been done in this area.” Indeed, our paper is part
of this small but growing experimental literature on abusive market practices. Isaac and Smith’s
(1985) experimental work on predatory pricing (see also Goeree et al., 2004) is a pioneer of
abuses of dominant positions. Recent work in this area includes experimental analyses of vertical
foreclosure (Martin et al., 2001), price discrimination (Normann et al., 2007), and exclusive
dealing (Landeo and Spier, 2009; Smith, 2011; Boone et al., in press). These papers have in
common that they provide experimental tests of business practices that may constitute abuses of
market power.
As is common in the literature, we analyze the scenario where one firm (the multi-
product firm) has monopoly power in one market but faces competition by a second firm (the
single-product firm) in another unrelated market.3 For this second market we employ a Cournot
quantity-setting framework. Our first treatment variable is “bundling” versus “no bundling.”
When bundling, the multi-product firm bundles its products for the two markets. We consider
both the situation where bundling/not bundling are exogenous to the multi-product firm and the
situation where it can choose whether to bundle. The treatments where bundling is a choice allow
us to examine whether the multi-product firm deliberately influences market performance by
adopting a bundling strategy.
Our second treatment variable is the order of moves in the duopoly market: simultaneous
versus sequential. We introduce this second treatment variable to examine the commitment effect
of product bundling (as highlighted by Whinston, 1990; Martin, 1999; Nalebuff, 2004). With
simultaneous-move Cournot competition, the bundling firm trades off reduced sales in its
monopoly market to increased output in the duopoly market, possibly at the expense of losing
some customers in the monopoly market (even if demand is independent across the two
3 If markets are related, the multi-product firm has an incentive to bundle in order to price discriminate (Adams and
Yellen, 1976; McAfee et al., 1989). To focus exclusively on the exclusionary effect of bundling, in our design the
two markets are not related.

4
markets). The bundling strategy works as a commitment to sell more in the competitive segment:
ex post, the multi-product firm would prefer to deviate from this outcome and would want to best
respond against the second firm (and at the same time, earn monopoly profits in the market
where it does not face a rival). In the Stackelberg setting, when both markets have identical
demand and cost structures, bundling does not imply additional commitment because the multi-
product firm is a first mover anyhow. That is, in theory, bundling does not affect optimal
quantities. This feature allows us to test whether bundling gives the Stackelberg leader additional
leverage because, as is known from previous experiments, Stackelberg leaders find it difficult to
gain from their first-mover advantage without bundling (Huck et al., 2001, 2002; Fonseca et al.,
2005; Müller, 2006).4
Our results are as follows. For the duopoly markets with and without exogenous
bundling, we find that firms roughly play the predicted Cournot-Nash outputs. These market
outcomes do not change significantly when the multi-product firm is allowed to bundle
endogenously. The data of our Stackelberg markets, where bundling is not an option for the
multi-product firm, reject the predictions; followers produce more and leaders produce less than
predicted—an observation which is in line with earlier experimental results. However, the
discrepancy between observations and prediction is greatly reduced in the Stackelberg markets
with exogenous product bundling. Finally, in the Stackelberg markets with endogenous bundling,
we note a surprising bifurcation of outcomes: while results resemble a symmetric Cournot
solution when the multi-product firm chooses not to bundle, they almost perfectly match the
Stackelberg prediction when the multi-product firm does decide to bundle.
In sum, we find that bundling successfully works as a commitment device to sustain
increased production (and therefore larger market shares), an observation that is robust with
respect to the order of moves (simultaneous or sequential) and to whether bundling is a choice.
Accordingly, we find that product bundling has an exclusionary effect: in both the Cournot and
Stackelberg treatments, and both with exogenous and endogenous bundling, the profits of the
4 In line with the theoretical literature to date (see Chung et al., 2013, for a recent overview), we do not consider the
situation where firms interact repeatedly. In that sense our paper is more an experimental test of conceived theories,
and less an experimental test of the workings of real markets.

5
single-product firm drop significantly if the multi-product firm bundles. At the same time,
bundling does not significantly affect the profits of the multi-product firm.5
Caliskan et al. (2007) is the only experimental paper on product bundling that we are
aware of.6 They run a series of experiments where one firm has the option to bundle. This firm
holds a monopoly in one market and is one of four competitors in another unrelated and much
smaller market. Moves are always simultaneous. Caliskan et al. (2007) focus on how a fringe
competitor in the monopoly market affects welfare. In a posted-offer-market setting, they find
that the fringe seller increases consumer surplus while decreasing seller surplus, and that the
fringe seller does not affect the consumer surplus extracted from the bundle, despite a decrease in
the bundle’s transaction price. As to the effect of bundling, Caliskan et al. (2007) find neither
any significant exclusionary effect nor any significant effect on consumer welfare and total
welfare. In our design, bundling affects a larger part of the market because the two markets we
employ are of equal size, and because the multi-product firm faces only one rival in the
oligopolistic market. This may well explain why we do observe that bundling significantly
affects markets.
From a behavioral perspective our results seem surprising. One of the key results in
experimental economics is that subjects dislike payoff asymmetries.7 Therefore, equilibrium
5 Our design, however, inherently undervalues the profitability of bundling for the multi-product firm as we do not
consider fixed costs. If these exceeded the profits of the single-product firm due to bundling, this firm would have to
leave the market altogether. 6 Muris and Smith (2008) report on the same experiment. 7 See, for example, the literature on ultimatum games (Roth, 1995; Güth, 1995). In industrial organization, structural
differences, including cost and capacity asymmetries, and a sequential order of moves yield asymmetric equilibria
with substantial payoff differences. Experimental data typically refute these theoretical predictions (see, e.g., Mason
et al. (1992) or, to a lesser extent, Keser (1993) in the context of Cournot competition with asymmetric costs; Huck
et al. (2001, 2002) in the context of Stackelberg markets; Fonseca and Normann (2008) in the context of a Bertrand-
Edgeworth setting with asymmetric capacities; or Henze and Schuett (2011) in the context of a game with
endogenous quality choices). While at odds with standard IO theory, the experimental results are often well
explained by models of other-regarding preferences (Fehr and Schmidt, 1999; Bolton and Ockenfels, 2000). The
behavior of Stackelberg followers, for example, can be rationalized when players have Fehr and Schmidt (1999)
preferences (see the theory papers by Santos-Pinto, 2008; and Lau and Leung, 2010), or when they are thought to act
reciprocally (Cox et al., 2007). And inequality aversion can explain why players often achieve equal profits in
asymmetric Cournot oligopoly (Iris and Santos-Pinto, 2010).

6
predictions for our product bundling experiments (with their substantial payoff differences in
Nash equilibrium because of the multi-product firm’s monopoly profit) were a priori unlikely to
be observed in lab experiments. However, we find that the implied payoff differences have little
impact on the observed outcomes in the duopoly market. Instead, our results suggest a large
congruence with the standard theory.
Nevertheless, we argue in Section 5 that our results are not inconsistent with inequality
aversion. Regarding the question of why our no-bundling treatments confirm previous standard
duopoly experiments despite amplified payoff differences, we point out that the multi-product
firm’s profit in the monopoly market does not affect the marginal costs and benefits of
“punishment” (that is, producing more than the standard best reply) by the single-product firm in
the duopoly market. A related question is why our results in the Stackelberg bundling treatment
are more in line with the prediction than the no-bundling treatment, even though bundling yields
greater payoff inequalities. The answer lies in the possibility to commit to an output level
through product bundling. A non-bundling multi-product firm can give in to the “punishing”
behavior of the smaller firm by producing less. But a bundling multi-product firm would lose the
additional payoff from such concessions and is thus less likely to reduce output. This is
anticipated by the single-product firms which therefore punish less. We also discuss this issue in
detail in Section 5.
In a legal context, exclusion is considered to be anticompetitive if the excluded firm is at
least as efficient as the excluding firm. As there are no cost differences in our experiment, the
observed drop in the single-product firm’s profits due to bundling is hence exclusionary. In this
sense, our findings support the recent interest of competition authorities in product bundling as a
potentially harmful practice. At the same time, using the markets in which bundling is impossible
as the point of departure, we find that allowing for the choice to bundle does not have a
significant effect on overall market performance because instances of voluntary bundling are
relatively rare. Taken together these results support the current policy practice whereby each
instance of bundling is considered individually, and is prohibited only when the (possible)
exclusion of rivals qualifies as an abuse of a dominant position.
The remainder of the paper is organized as follows. In Section 2 we derive several
theoretical predictions, followed by an outline of the experimental design and procedure in

7
Section 3. The experimental results are in Section 4. In Section 5 we briefly discuss our results
and Section 6 concludes.
2. MODEL AND PREDICTIONS
The Cournot model underlying our experiments has two firms, 1 and 2, and two markets, D and
M, where ‘D’ and ‘M’ stand for ‘duopoly’ and ‘monopoly’ respectively. In market D, firm 1 and
firm 2 are Cournot duopoly competitors; in market M, firm 1 is a monopolist. We assume that in
both markets inverse demand is linear, such that and , and
identical across markets, . Both firms produce at a constant marginal cost of c.
Firm 1 will sometimes be referred to as the multi-product firm whereas firm 2 will occasionally
be labeled the single-product firm.
Cournot – no bundling
Let us first suppose that there is no bundling, that is, output decisions in markets D and M are
independent. In this case, we obtain the following profit function for firm 1
(1) ,
while firm 2’s profit function is
(2) .
For market D, the unique Cournot-Nash equilibrium is /3, and the
equilibrium profits are /9. The equilibrium quantity on market M is
/2 and the monopoly profit is /4.
Cournot – bundling
Now consider the bundling case. Bundling implies that firm 1 can credibly commit to producing
its output for both markets as a fixed proportion. Without loss of generality, we assume that this
ratio is one-to-one (see also Martin, 1999): for each unit of , one unit of will be produced
such that we can simply state . Accordingly, in the bundling case, firm 1’s profit
function is
(3) ,
while firm 2’s profit function reads as
(4) .

8
In this case, the best-reply functions are /2 /2 and
/2. Nash equilibrium outputs (bundles) are 3 /7 and 2 /7, and Nash
equilibrium profits are 18 /49 and 4 /49.
Note that firm 1’s equilibrium output of 3 /7 satisfies /3
/2. That is, the optimal output with bundling is larger than the Cournot duopoly solution but
smaller than the monopoly output. For firm 2, we get 2 /7 /3. Hence,
bundling increases firm 1’s profits while it reduces the profits of firm 2.
Stackelberg – no bundling
If firm 1 does not bundle but is the first mover in market D, we obtain the Stackelberg duopoly
solution. Profit functions are as in the Cournot case, but firm 1 has a first-mover advantage such
that equilibrium outputs become /2 and /4. Profits are
/8 and /16. The monopoly solution for market M is as above in the
Cournot case.
Stackelberg – bundling
Suppose firm 1 bundles its products and is the first mover in market D. It is straightforward to
see that we then obtain the same equilibrium as in the Stackelberg case without bundling. The
reason is that with linear demand a Stackelberg leader produces the same output as an otherwise
identical monopolist. Accordingly, if firm 1 moves first in market D, it will choose the same
output as it supplies to market M.
Our design is thus suitable for exploring the commitment value of product bundling. We
can investigate this commitment value both in the case of simultaneous moves (where product
bundling should affect quantity choices) and in the case where moves are sequential (where
product bundling should not affect quantity choices).
3. EXPERIMENTAL DESIGN AND PROCEDURES
We employed a two-by-three treatment design. The two treatment variables are bundling/no
bundling/optional bundling, and Cournot/Stackelberg. Table 1 summarizes the treatment design
and treatment labels.

9
Table 1: Treatments and treatment labels
Exogenous Bundling Endogenous Bundling
No Bundling Bundling
Cournot COUR-EXO-NB COUR-EXO-B COUR-ENDO
Stackelberg STACK-EXO-NB STACK-EXO-B STACK-ENDO
We implemented the above model by giving subjects a payoff table (see Appendix B), which
was derived from the model using the parameter values d = 54 and c = 6. Subjects had to choose
integer quantities between 9 and 27.8 In each session, half the subjects played the role of firm 1
and the other half the role of firm 2. These roles remained fixed for the entire course of the
experiment. The experimental markets were repeated over 15 periods and subjects were
informed of the number of periods in the instructions. In each period, subjects were randomly
matched (“strangers” design).
Regarding bundling, subjects who played the role of firm 1 were put in a situation where
they could either not bundle at all (“NB”) or had to bundle in all periods (“B”). In the treatments
with endogenous bundling, they had the option to bundle: at the beginning of each period, the
firm-1 subjects had to decide whether they wanted to bundle.
In the instructions (see Appendix A), subjects were told that they would act as a firm
which, together with another firm serves a market, and that one of the firms would gain some
additional business in a second market. In all treatments, at the end of each round subjects
received feedback about what had happened in their market. The output decision of both
duopolists in market D and also firm 1’s output in market M was displayed on the computer
monitor. Feedback on profits was given about firm i’s own payoff. The information feedback
after each period, the instructions (which were also read aloud) and the payoff table, ensured
8 The payoff table gives all the necessary details of the model while avoiding formulas, parameters, and technical
terms. In the experiment and the instructions we relabeled the strategy space such that subjects had to choose a
number between 1 and 19. As subjects were unfamiliar with the model, the labels of the actions were meaningless to
them. In the results section, Section 4, we worked with the “original” quantities ranging from 9 and 27. Further, as is
well known (Holt, 1985), payoff tables with integer choices sometimes do not have unique best replies. Whenever
necessary, we manipulated the payoff table by increasing or decreasing a couple of payoffs to the next integer value
such that all best replies are unique.
10
common knowledge of the rules of the game. After reading the instructions, participants could
privately ask questions. Before the start of the experiment subjects were asked to answer several
control questions.
The experiments were computerized (Fischbacher, 2007) and conducted at the CentERlab
of Tilburg University (The Netherlands). For each treatment, a total of 32 subjects participated.
Subjects were randomly matched within groups of eight participants. Hence, we have four
independent observations for each treatment. Sessions usually had 16 participants but in two
cases we had to reduce the session size to eight because an insufficient number of subjects
showed up. Participants were students from various departments, many from fields other than
economics or business administration. The monetary payment was computed by using an
exchange rate of 500 “points” for €1 and adding a flat fee of €5 (this payment was made to help
subjects avoid making a loss in the experiment). Average earnings were €29.50 and €11.40 for
subjects in the role of firm 1 and 2, respectively, including the flat fee. The sessions lasted
between 60 and 75 minutes.
4. EXPERIMENTAL RESULTS
We present our experimental results in four subsections. In section 4.1, we report on the EXO-NB
treatments for both Cournot and Stackelberg competition and analyze the two EXO-B treatments
in section 4.2. Section 4.3 is devoted to the ENDO treatments. While we focus on output and
bundling decisions up to that point, we then discuss the issue of a possible abuse of dominance
by reporting on profits and surplus as measures of market performance in section 4.4.
Figure D1 in Appendix D shows the evolution of average quantities chosen by the multi-
product and the single-product firm in the various treatments. (Appendix C lists all per-period
quantities for each individual matching group.) It seems fair to say that by and large there are no
clear time trends in our data.9 Indeed, even if we ignore the possible dependence between
observations within sessions and treat each decision as an independent observation, we do not
9 An exception is firm 2’s quantity choice in treatment STACK-EXO-NB. One interpretation of the observed pattern is
that followers initially punish the Stackelberg leaders strategically despite the random matching scheme, but then
either give up on doing so or realize that it is “not needed” anymore because leaders stop choosing higher quantities
in the second half of the experiment.

11
observe a significant correlation between quantity choices and time in any of the treatments.10
Hence, for the presentation of the experimental results, we focus on treatment averages.
4.1 TREATMENTS WITHOUT BUNDLING (EXO)
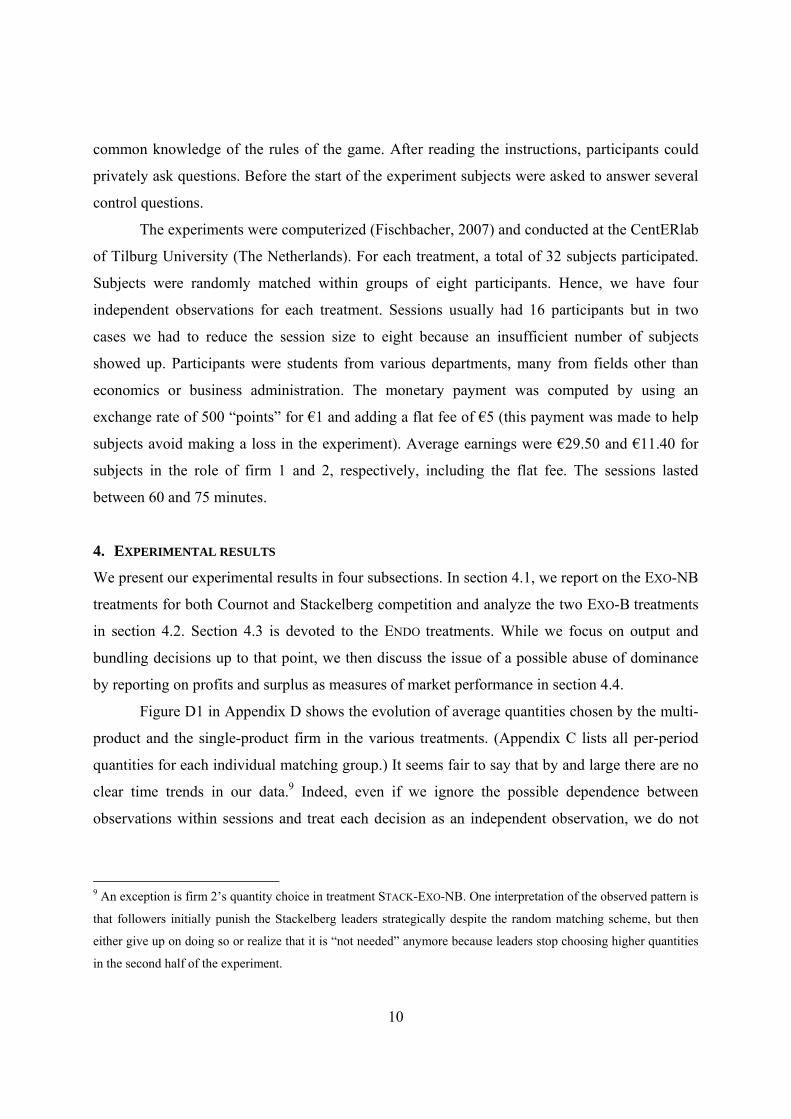
Table 2 summarizes the predictions and average quantities observed in the six treatments where
instances of bundling and no bundling in the two endogenous treatments (COUR-ENDO and
STACK-ENDO) are reported separately. The three average quantities are firm 1’s output in market
D ( ), firm 2’s output in market D ( ), and firm 1’s output in market M ( , which is equal to
in the case of bundling). The asterisks next to the inequality signs indicate whether the
observed differences are significant according to exact non-parametric rank-sum tests
(Wilcoxon), while a “≈” indicates statistical insignificance. We report two-sided p-values
throughout.11
First, in treatment COUR-EXO-NB, the average observed quantities correspond fairly
accurately to the predicted values, as has already been observed in earlier studies (Holt, 1985;
Huck et al., 2001). Here, both firms produce only slightly more than the predicted numbers of
units, but there are no economically or statistically significant differences between firms and the
predictions are contained in the 95% confidence intervals. Also, in the monopoly market, the
multi-product firm produces roughly the same as the monopoly output. Effectively, our data
confirm the theoretical predictions and the results from previous experiments.
Second, in the STACK-EXO-NB treatment, the theory fails: the Stackelberg leaders
produce less, while the Stackelberg followers produce more than predicted. This result is very
similar to Huck et al.’s (2001) finding. These authors also use linear demand and cost in their
experiments but have different parameter values. We can compare both their results and ours by
taking the ratio of observed output levels and predictions. In Huck et al. (2001), the ratio of
produced to predicted output is 8.32/6.00 = 1.39 for Stackelberg followers, and 10.19/12.00 =
0.85 for the Stackelberg leaders. For our data, the ratios are 15.58/12 = 1.30 and 19.00/24.00 =
0.79, respectively. While both Stackelberg leaders and followers produce relatively less in our 10 Spearman’s rho is always smaller than 0.1 and is not significant for all treatments and all three output decisions. 11 For each observation we also calculate the 95% confidence interval using the four independent observations that underlie each entry in Table 2. In particular, let ̅ be the average and the concomitant standard error. Assuming the averages follow a Normal distribution, the 95% confidence interval is then given by ̅ . , √⁄ , ̅
. , √⁄ , where n denotes the number of observations. In Table 2, the theoretical predictions are underlined when they fall outside this interval.
12
data, it is probably fair to say that these ratios are of a similar magnitude. At the same time, firm
1 produces roughly the monopoly output in market M.
Result 1. In the exogenous no-bundling treatments, the data confirm the predictions in the
Cournot markets, and reject the predictions in the Stackelberg markets. Both results confirm
previous experimental results.
Table 2: Average quantities and theoretical predictions
Market D, Firm 1 Market D, Firm 2 Market M, Firm 1
1Dq 2
Dq 1Mq
NB B NB B NB B
COUR-ENDO Theory
Observed
16.00
15.81
<*
20.00
19.62
16.00
16.34
>*
14.00
15.04
24.00
24.10
>*
20.00
19.62
≈ ≈ ≈ ≈ ≈ ≈
COUR-EXO Theory
Observed
16.00
16.32
<**
20.00
19.43
16.00
16.76
>*
14.00
15.42
24.00
24.41
>**
20.00
19.43
˄** ˄** ˅** ˅* ≈ ˄**
STACK-EXO Theory
Observed
24.00
19.00
<**
24.00
22.08
12.00
15.58
>**
12.00
13.59
24.00
23.92
>**
24.00
22.08
˅** ˄** ˄* ≈ ≈ ˄**
STACK-ENDO Theory
Observed
24.00
17.65
<**
24.00
23.36
12.00
16.57
≈
12.00
15.12
24.00
24.73
>**
24.00
23.36
Notes: NB = No bundling, B = Bundling. Observations (in bold) correspond to the average over the (four)
underlying independent observations. Theoretical predictions (in italics) are underlined in case they lie outside the
95% confidence interval of the respective observation. Significance levels are calculated with Wilcoxon rank-sum
tests, conservatively counting each matching group as one independent observation; ** and * indicate statistical
significance at the 5% and 10% level, respectively.

13
While the Cournot and Stackelberg no-bundling results are consistent with previous
experiments, this confirmation is, at least at first sight, surprising. Recall that in our experiments
the multi-product firm earned an extra monopoly profit, causing rather large payoff differences.
Given that subjects dislike payoff asymmetries, a priori it is not obvious that the single-market
settings as analyzed in Huck et al. (2001) are confirmed by our data. We will come back to this
point in Section 5.
4.2 TREATMENTS WITH BUNDLING (EXO)
We now turn to the exogenous bundling treatments. In the COUR-EXO-B markets, firm 1
produces on average slightly less than the predicted 20 units, but the average observed quantity
of 19.42 is within the 95% confidence interval. Firm 2 produces on average 15.42, which is more
than the Cournot-Nash equilibrium quantity of 14, but this value is also inside the 95%
confidence interval. By and large, the asymmetric equilibrium predicted for market D prevails.
In treatment STACK-EXO-B, outputs are now closer to the prediction than in STACK-EXO-
NB. Stackelberg leaders produce only two output units less than predicted (92% of the predicted
output), as compared to the five units under production absent bundling (79% of the theoretical
benchmark). Stackelberg followers produce roughly 1.6 units more than predicted (113% of the
prediction), as opposed to 3.6 units more than predicted (130% of the equilibrium value) without
bundling. Overall, product bundling brings average outputs closer to the prediction.
Result 2. In the exogenous bundling treatment, the predictions in the Cournot markets are
confirmed by the data. In the Stackelberg markets the deviation from the theoretical benchmark
is much smaller than in the exogenous no-bundling treatment.
4.3 TREATMENTS WITH ENDOGENOUS BUNDLING CHOICES
We first examine the extent to which the multi-product firms choose to bundle if given the
opportunity. Bundling choices are rather rare: in COUR-ENDO the multi-product firm bundles in
12.1% of all cases while in STACK-ENDO it bundles in 18.8% of all cases, and this difference is
not statistically significant (p = 0.561). Figure 1 illustrates that the bundling decisions are quite
stable over time.

14
In theory, the bundling option is predicted to be exercised in the Cournot market while it
is inconsequential for the Stackelberg market. Table 3 reports the average profits and shows that,
on average, endogenously bundling and non-bundling Stackelberg leaders do not earn
statistically different profits. For the endogenous Cournot markets, Table 3 indicates that a multi-
product firm earns only slightly and only weakly significantly more when it bundles both
products than when it does not. Given the relatively low and stable time pattern of bundling, it
seems that these small profit differences are insufficient to induce more bundling.
Result 3. Product bundling is not chosen very often; there are 12% and 19% bundling decisions
with simultaneous and sequential moves, respectively.
Figure 1: Fraction of multi-product firms bundling over time
What is the effect of introducing the option to bundle on quantities supplied? For Cournot
competition, the answer is clear-cut: introducing this option has (almost) no statistically
significant impact on quantities. In fact, focusing on the row labeled COUR-ENDO in Table 2, we
observe that—as in the COUR-EXO treatments—all quantity choices are within the 95%
confidence interval of the theoretical predictions, with the exception of the single-product firm
should the multi-product firm decide to bundle. Moreover, note that a vertical or column-wise
comparison of the two rows labeled COUR-ENDO and COUR-EXO in Table 2 shows that there are
0
0.05
0.1
0.15
0.2
0.25
0.3
0 2 4 6 8 10 12 14 16
Bundlin
g fraction
Period
Cour‐Endo Stack‐Endo
15
no statistically significant differences between quantities chosen in the exogenous Cournot
treatments and the endogenous Cournot treatment conditional on bundling/no bundling.
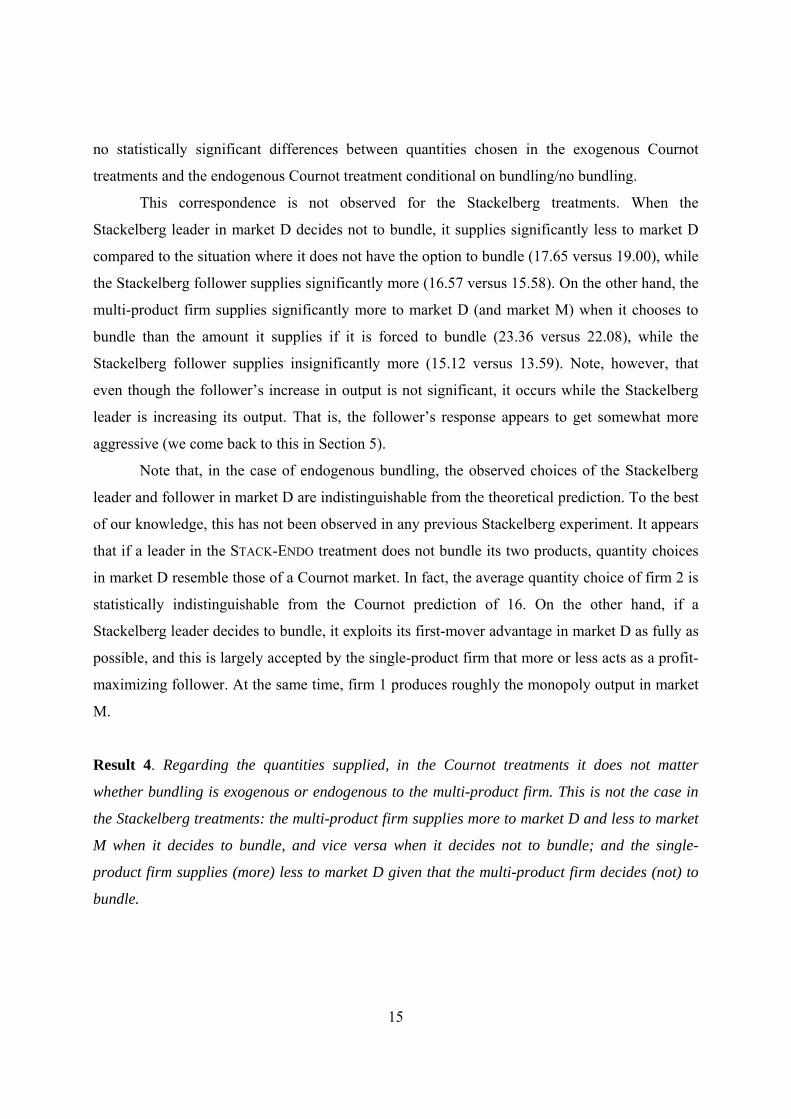
This correspondence is not observed for the Stackelberg treatments. When the
Stackelberg leader in market D decides not to bundle, it supplies significantly less to market D
compared to the situation where it does not have the option to bundle (17.65 versus 19.00), while
the Stackelberg follower supplies significantly more (16.57 versus 15.58). On the other hand, the
multi-product firm supplies significantly more to market D (and market M) when it chooses to
bundle than the amount it supplies if it is forced to bundle (23.36 versus 22.08), while the
Stackelberg follower supplies insignificantly more (15.12 versus 13.59). Note, however, that
even though the follower’s increase in output is not significant, it occurs while the Stackelberg
leader is increasing its output. That is, the follower’s response appears to get somewhat more
aggressive (we come back to this in Section 5).
Note that, in the case of endogenous bundling, the observed choices of the Stackelberg
leader and follower in market D are indistinguishable from the theoretical prediction. To the best
of our knowledge, this has not been observed in any previous Stackelberg experiment. It appears
that if a leader in the STACK-ENDO treatment does not bundle its two products, quantity choices
in market D resemble those of a Cournot market. In fact, the average quantity choice of firm 2 is
statistically indistinguishable from the Cournot prediction of 16. On the other hand, if a
Stackelberg leader decides to bundle, it exploits its first-mover advantage in market D as fully as
possible, and this is largely accepted by the single-product firm that more or less acts as a profit-
maximizing follower. At the same time, firm 1 produces roughly the monopoly output in market
M.
Result 4. Regarding the quantities supplied, in the Cournot treatments it does not matter
whether bundling is exogenous or endogenous to the multi-product firm. This is not the case in
the Stackelberg treatments: the multi-product firm supplies more to market D and less to market
M when it decides to bundle, and vice versa when it decides not to bundle; and the single-
product firm supplies (more) less to market D given that the multi-product firm decides (not) to
bundle.
16
Taken together, our data show that bundling has a similar effect in the Cournot and the
Stackelberg treatments regardless of whether the decision (not) to bundle is exogenous or
endogenous. The multi-product firm significantly increases its output in the duopolistic market at
the expense of losing some customers in the market where it holds a monopoly, and the single-
product firm adapts to this increased output by significantly reducing its supply. Put differently,
product bundling allows the multi-product firm to leverage market power in the market where it
does not have a dominant position. As a result, an asymmetric outcome emerges in the Cournot
treatments. However, in the Stackelberg treatments bundling should not have any effect because
the same asymmetric outcome is predicted absent bundling. If anything, our findings are in
contrast to the several experimental studies that fail to find support for asymmetric equilibria in
the lab.
Result 5. The effect of product bundling, whether exogenous or endogenous, is similar in the
Cournot and Stackelberg treatments. The multi-product firm supplies more to the duopolistic
market and less to the market where it holds a monopoly; the single-product firm produces less.
4.4 ABUSE OF DOMINANCE?
For an assessment of product bundling as an abuse of dominance, we look at market performance
indicators. In the following, we discuss profits and surplus measures observed in the various
treatments, concentrating on the most salient results.
Table 3 shows firm profits. It allows us to compare the entries column-wise from left to
right. While profits for firm 1 in market D are usually statistically the same with or without
(exogenous or endogenous) bundling, firm 1’s profits in market M are usually significantly
higher with (exogenous or endogenous) bundling. On balance, these opposing effects cancel out,
as firm 1’s total profits are unaffected by (exogenous or endogenous) bundling. However, and
more importantly, if firm 1 bundles, firm 2’s profits unambiguously decrease in a statistically
significant way, both when firm 1 is forced to bundle and if it does so voluntarily, a result that is
independent of the order of moves in market D. That is to say, product bundling has a clear
exclusionary effect.

17
Result 6. Bundling does not have a statistically significant effect on the profits of the multi-
product firm. Bundling does have an unambiguous exclusionary effect: in both the Cournot and
Stackelberg treatments, bundling reduces the profits of the single-product firm. This holds for
exogenously imposed bundling as well as for endogenously chosen bundling.
We note that if firm 2 were to incur a fixed cost, product bundling could be more
profitable to firm 1. In that case, the exclusionary effect could drive firm 2’s profits below its
fixed cost, which would force it to leave the market altogether. Presumably, our design yields a
conservative estimate of the profitability of product bundling for firm 1.
Table 3: Average firm profits and theoretical predictions
Firm 1
Market D
Firm 1
Market M
Firm 1
Total
Firm 2
Market D
NB B NB B NB B NB B
COUR-ENDO Theory
Observed
256
244
<*
280
259
576
575
>*
560
554
832
819
≈
840
813
256
254
>*
196
196
≈ ≈ ≈ ≈ ˅ * ≈ ≈ ≈
COUR-EXO Theory
Observed
256
236
≈
280
253
576
574
>**
560
553
832
810
≈
840
805
256
245
>**
196
196
≈ ≈ ≈ ˄** ≈ ≈ ˅** ˅**
STACK-EXO Theory
Observed
288
242
≈
288
269
576
574
>**
576
567
864
816
≈
864
836
144
199
>**
144
163
≈ ≈ ≈ ˄** ≈ ≈ ˄** ≈
STACK-ENDO Theory
Observed
288
235
≈
288
222
576
573
≈
576
574
864
808
≈
864
795
144
222
>**
144
129
Notes: NB = No bundling, B = Bundling. Observations (in bold) correspond to the average over the (four)
underlying independent observations. Theoretical predictions (in italics) are underlined in case they lie outside the
95% confidence interval of the respective observation. Significance levels are calculated with Wilcoxon rank-sum
tests, conservatively counting each matching group as one independent observation; ** and * indicate statistical
significance at the 5% and 10% level, respectively.

18
Moreover (and in line with the results for quantities), exogenous vs. endogenous bundling
is almost inconsequential for profits in our Cournot markets. In fact, only one of the statistical
tests comparing profits between cases in the COUR-ENDO treatment and the corresponding COUR-
EXO treatments returns a significant result.
Table 4: Average values of consumer surplus and total surplus
Consumer Surplus
Market D
Consumer Surplus
Market M
Consumer Surplus
Total
Total Surplus
NB B NB B NB B NB B
COUR-ENDO Theory
Observed
512
523
≈
578
604
288
291
>*
200
194
800
813
≈
778
798
1888
1886
>*
1814
1807
≈ ≈ ≈ ≈ ≈ ≈ ≈ ≈
COUR-EXO Theory
Observed
512
553
<*
578
612
288
299
>**
200
190
800
852
≈
778
802
1888
1907
>**
1814
1803
˄* ≈ ≈ ˄
**
≈ ˄* ≈ ˄ **
STACK-EXO Theory
Observed
648
609
≈
648
640
288
287
>**
288
247
936
896
≈
936
887
1944
1911
>*
1944
1886
≈ ˄* ≈ ˄** ≈ ˄* ≈ ˄**
STACK-ENDO Theory
Observed
648
593
<**
648
748
288
307
>**
288
274
936
900
<**
936
1021
1944
1930
≈
1944
1946
Notes: NB = No bundling, B = Bundling. Observations (in bold) correspond to the average over the (four)
underlying independent observations. Theoretical predictions (in italics) are underlined in case they lie outside the
95% confidence interval of the respective observation. Significance levels are calculated with Wilcoxon rank-sum
tests, conservatively counting each matching group as one independent observation; ** and * indicate statistical
significance at the 5% and 10% level, respectively.
Table 4 reports standard surplus measures. In line with the theory, both consumer surplus
and total surplus are higher in the Stackelberg treatments than in the Cournot treatments. The
effect of product bundling is also quite clear: it reduces consumer surplus in market M while it
increases consumer surplus in market D. The net effect is either an insignificant reduction in total
consumer surplus, or a significant increase in total consumer surplus (treatment STACK-ENDO

19
with bundling). If firms move simultaneously in market D, bundling significantly reduces total
surplus. This also occurs in the event of sequential moves in market D when (no) bundling is
exogenous.
Result 7. In the Cournot treatments, bundling does not significantly affect consumer surplus, but
it does significantly reduce total surplus. In the Stackelberg treatments, bundling significantly
reduces total surplus if bundling/no bundling is exogenous whereas it yields a significant
increase in total consumer surplus when the multi-product firm chooses to bundle.
Results 6 and 7 summarize the effects of product bundling on market performance. Note,
however, that they do not reveal the effect on market performance of prohibiting product
bundling per se. For that, the extent to which bundling occurs endogenously has to be taken into
account as well. That is, the exogenous no-bundling treatments have to be compared with the
endogenous bundling treatments without distinguishing instances of bundling/no bundling in the
endogenous treatments. This analysis12 shows that allowing the multi-product firm to bundle
hardly affects overall market performance in the Cournot or Stackelberg markets. The likely
reason for this finding is that endogenous product bundling is not frequently observed (recall
Result 3).
Result 8. Allowing for product bundling does not have a significant effect on overall market
performance.
Whereas Result 8 does not motivate a per se prohibition of product bundling on account of a
significant drop in total surplus, Result 6 shows that bundling, if it occurs, does have a clear
exclusionary effect. Taken together, these results support the current policy practice whereby
each instance of bundling is considered separately and prohibited only when the (possible)
exclusion of rivals qualifies as an abuse of a dominant position.
12 The analysis includes individual profits, producer, consumer, and total surplus, and is reported in Table C1 in
Appendix C.

20
5. DISCUSSION
One notable pattern in our experiments is that asymmetric equilibria with substantial payoff
differences are observed.13 From a behavioral economics perspective, this appears to be at odds
with theories of inequality aversion.14 Specifically, our results raise two questions. First, why do
our no-bundling results confirm those of previous duopoly experiments even though in previous
studies the extra monopoly payoff did not exist and, accordingly, the payoff inequality was much
smaller?15 Second, why are the results in the bundling treatments (more) in line with the
predictions, especially when the multi-product firm bundles voluntarily, even though product
bundling implies even greater payoff inequalities?
Regarding the first question, note that in models of inequality aversion (Bolton and
Ockenfels, 2000; Fehr and Schmidt, 1999), the additional profit of the multi-product firm
reduces players’ utilities compared to standard duopolies. However, the marginal change in
utility from the duopolist producing more than predicted is the same in both the regular
duopolies and in our multi-product setup. The reason is that the output chosen in the duopoly
market does not affect the payoff in the monopoly market. This explains why our no-bundling
results are in line with previous experiments: the amounts produced by firm 2 in STACK-EXO-NB
compared to the prediction are very similar to the figures observed in the Stackelberg duopolies
of Huck et al. (2001), as noted above. And this behavior is consistent with the Fehr and Schmidt
(1999) model because the utility-maximizing output choice of the Stackelberg follower
(balancing the marginal cost of producing more than the standard best reply and the marginal
gain of reducing the payoff inequality) is the same in regular duopolies and our multi-product
setup. A similar argument explains why the multi-product firms in STACK-EXO-NB and in
13 In COUR-EXO-NB the multi-product firm is predicted to earn 576 in the monopoly market, and both firms should
earn 256 in the duopoly market; thus, the multi-product firm is predicted to earn 3.3 times more than the duopolist.
In both Stackelberg treatments, the leader (follower) is predicted to earn 288 (144) in the duopoly market plus 576
for the multi-product firm; hence, the multi-product firm is predicted to earn six times as much. The observed
average profit ratio (multi-product firm profit over single-product firm profits) ranges from 3.2 (COUR-END-NB) to
6.2 (STACK-ENDO- B), see Table 3. These observed payoff differences are quite substantial. 14 Inequality aversion may be relevant for firms in the field if, for example, managers maximize relative, not
absolute, profits (Armstrong and Huck, 2010). 15 Indeed, inequality-aversion is considered to be the prime explanation for the Stackelberg data in Huck et al.
(2001) and similar experiments.

21
STACK-ENDO without bundling produce similar amounts as in the standard Stackelberg duopolies
of Huck et al. (2001). Finally, given that the prediction for the duopoly market in COUR-EXO-NB
is symmetric, observed play is expected to be in line with this prediction (as in Holt, 1995, or
Huck et al., 2011, and many others). To sum up, outcomes are not affected by the multi-product
firm earning additional profits in another unrelated market and this is consistent with models of
inequality aversion.16
Moving on to the second question, we note that bundling creates a connection between
the two markets because it makes the multi-product firm’s profit in the monopoly market, , a
function of its quantity in the duopoly market as well. Due to the bundling of products, it is
more costly for firm 1 to reduce output below the optimal amount. Any reduction of output in
market D will cause losses in the monopoly market. In both the exogenous and the endogenous
Cournot markets with bundling, we observe that firm 1 produces what the theory predicts, and
that in both the exogenous and the endogenous Stackelberg markets firm 1 produces significantly
more with bundling than without (22.08 versus 19.00 in STACK-EXO, and 23.36 versus 17.65 in
STACK-ENDO, respectively). Reflecting the multi-product firm’s cost of reducing the inequality,
these results are consistent with inequality aversion.
In line with the change in firm 1’s behavior is the observation that, in the bundling
treatments with sequential moves, firm 2’s behavior also changes.17 We illustrate this by looking
at the average observed response functions, estimates of which are shown in Table 6.18 These 16 Our setting is comparable to the ultimatum game implemented in Armantier (2006) where the proposer (or
receiver) earns an additional amount of money regardless of the responder’s actions. He finds that, over time,
“…rich (poor) proposers make smaller (larger) offers, while rich (poor) receivers are willing to reject (accept) larger
(smaller) offers. In other words, rich players become more greedy, and this behavior is tolerated by poor subjects.”
Inequality aversion (as in Bolton and Ockenfels, 2000, or Fehr and Schmidt, 1999) predicts that the additional
payoff would not affect responder rejection rates. 17 In both COUR-EXO-B and COUR-ENDO with bundling, the single-product firm tries to discipline the multi-product
firm to produce less, to no avail, however. This confirms the commitment power of product bundling that will be
discussed further below. The remainder of the discussion is restricted to the Stackelberg treatments because
empirical response functions can only be estimated properly for these treatments, and because our bundling results
stand out against the previously reported no-bundling results that deviate quite substantially from the theoretical
prediction.
18 We estimate the panel regression model , where is the individual
quantity set by follower firm i in period t, is a leader i’s quantity in period t, is the subject-specific

22
estimates are accompanied by Figure 3 which shows the average observed response function
graphically (top) and histograms of leader choices (bottom) in the Stackelberg markets;
exogenous markets on the left, endogenous market on the right. The histograms indicate, among
other things, which Stackelberg leader quantities were observed by most followers.
We first discuss the Stackelberg treatment with exogenous bundling/no bundling. Recall
that the standard best response function is given by 24 0.5 . Comparing the
estimated response functions in the two exogenous Stackelberg treatments, we observe that the
one in STACK-EXO-B is closer to the best response function than the one in STACK-EXO-NB. The
estimated intercept is larger and the slope smaller in the bundling treatment than the correspon-
ding estimates in the no-bundling treatment.19 Note that in the no-bundling case, the slope is
negative but is insignificantly different from zero.
The logic as to why single-product firms “accept” higher outputs whenever the
monopolist bundles could be as follows. In STACK-EXO-B it is more costly for the multi-product
firm to give concessions in the form of a lower output. Since the bundling firm has to take care
of its monopoly profit in its home market, the higher output with bundling (see the lower left
histogram in Figure 3) is apparently not interpreted as overly greedy toward the duopolist.
Indeed, a non-bundling Stackelberg leader can freely earn monopoly rents in its home market
and is not forced to produce the Stackelberg leader quantity in the duopoly market. Hence,
observed play is much closer to the Stackelberg equilibrium in STACK-EXO-B.20
random error component, and is the overall error component. We additionally control for possible non-
independence of choices at the matching group level. 19 We cannot reject the hypotheses that both intercept and slope parameters are the same in the two treatments. 20 At first sight, another explanation could be that our experiments remove the possibility of an equal split. As has
been observed (Andreoni and Bernheim, 2009; Güth et al., 2001), this causes behavior to be more in line with what
the theory predicts. However, an equal split is not possible in any of our treatments because one of the two players
will always earn the extra monopoly profits. It cannot, therefore, explain why the bundling results are more in line
with what the theory predicts.

23
Table 6: Estimates of the actual response function of Stackelberg followers
STACK-EXO-B STACK-EXO-NB STACK-ENDO-B STACK-ENDO-NB
0 21.92*** (2.85)
18.35*** (1.62)
24.16*** (2.36)
14.30*** (2.80)
1 -0.38*** (0.11)
-0.15 (0.10)
-0.38*** (0.08)
0.14 (0.17)
Notes: For the estimated equation, see footnote 16. *** and ** denotes statistical significance at the 1% and 5% level,
respectively. Standard errors in parentheses.
Figure 3: Observed response function (top) and histograms of leader choices (bottom) in the
Stackelberg markets [Exogenous markets on the left, endogenous market on the right]
91011121314151617181920
9 11 13 15 17 19 21 23 25 27
Average
Follo
wer Quan
tity
Leader quantity
Best Response Stack‐Exo‐B
Stack‐Exo‐NB
91011121314151617181920
9 11 13 15 17 19 21 23 25 27
Average
Follo
wer Quan
tity
Leader Quantity
Best Response Stack‐Endo‐B
Stack‐Endo‐NB
0510152025303540455055
9 11 13 15 17 19 21 23 25 27
Relative
Frequen
cy
Leader Quantity
Stack‐Exo‐B Stack‐Exo‐NB
05
10152025303540455055
9 11 13 15 17 19 21 23 25 27
Relative
Frequen
cy
Leader Quantity
Stack‐Endo‐B Stack‐Endo‐NB

24
Perhaps surprisingly, the treatments where bundling is endogenous support this
interpretation of the data. Looking at Table 6, the estimated response function in STACK-ENDO-B
again appears to be closer to the best response function than that in STACK-ENDO-NB. Once more,
the intercept is larger and the slope is smaller in the bundling case. In fact, when the multi-
product firm chooses not to bundle the response function is upward sloping, although the slope
parameter is not significantly different from zero.21
Indeed, when we compare the bundling and no bundling results, it again appears that
the larger output of the multi-product firm is tolerated to a larger extent by the single-product
firm. Punishment (whereby followers choose larger quantities than their best response) is less
harsh when the Stackelberg leader endogenously bundles than when it does not. As a result,
when the multi-product firm endogenously chooses to bundle, an outcome that is rather close to
the prediction emerges. Alternatively, when the multi-product firm endogenously chooses not to
bundle, the market outcome (almost) resembles the results of the Cournot treatment. (See Figure
3 and the bottom row of Table 2.) Both findings are in line with what we have observed in the
exogenous Stackelberg treatments.
In sum, the data in the Stackelberg treatments are consistent with the idea that
Stackelberg leaders are better able to exploit their first-mover advantage when they (exogenously
or endogenously) bundle their two products. The reason is that the followers are more likely to
“accept” the leader’s increased output, independent of whether the leader was exogenously
forced to bundle or endogenously chose to do so.
6. CONCLUSION
Product bundling is a strategy dominant firms may use to attempt to leverage market power from
one market to another. Even if demand is independent between markets, a multi-product firm can
21 A cautionary note is in place here. Inspecting the graphs of the average response functions in the upper right-hand
panel in Figure 3 suggests that a simple linear regression of the response functions is not appropriate, or is at least
problematic, in the case of endogenously (not) bundling. It may be inappropriate because there is a highly non-linear
pattern in the average observed response function in the case of no bundling. As the two response functions are not
observed for a similar range of Stackelberg leader quantities, it may be problematic. In fact, the histogram in the
lower right panel in Figure 3 shows that, in the case of endogenous bundling, firm 1 never chooses a quantity below
19.

25
credibly increase its market share in a competitive market at the expense of losing some
customers in its monopolistic market (Martin, 1999; Nalebuff, 2004).
In our experimental test of this leverage theory, one firm has monopoly power in one
market but competes with a second firm in another market. We implement the simultaneous
(Cournot) and the sequential (Stackelberg) order of moves in the duopoly market, and compare
instances where the multi-product firm (i) always bundles, (ii) never bundles, and (iii) chooses
whether or not to bundle.
To a large extent, our data indicate support for the theory of product bundling. In the case
of Cournot competition, firms produce the predicted numbers of units even if bundling is
exogenously implemented/excluded or if there is an endogenous choice of the multi-product
firm. In the Stackelberg markets, the theory finds more support when we move from markets
with exogenously excluded bundling to those where bundling is exogenously implemented. And
the theory is pretty much in line with observed outcomes when the multi-product firm
endogenously chooses to bundle its products. Interestingly, when the multi-product firm chooses
not to bundle, the market outcomes resemble those of Cournot.
The effect of exogenous or endogenous product bundling is similar in the Cournot and
Stackelberg treatments in that the multi-product firm supplies more to the duopolistic market and
less to the market where it holds a monopoly, while the single-product firm produces less.
Whereas bundling does not have a statistically significant effect on the profits of the multi-
product firm, in both the Cournot and Stackelberg treatments, exogenous or endogenous
bundling reduces the profits of the single-product firm. At the same time, we find that allowing
for endogenous product bundling does not have a significant effect on the overall market
performance because instances of product bundling are relatively rare. Insofar as our
experimental results have implications for competition policies, the message would be a
confirmation of current policy practice: there is no need for a per se prohibition of product
bundling for fear of a significant drop in total surplus if it is allowed, but instances of product
bundling should be considered in detail because bundling has a clear exclusionary effect which is
quite likely to reduce total surplus. This effect has then to be measured against the potential
benefits of product bundling.

26
REFERENCES
Adams, W. J. and Yellen, J. L. (1976), “Commodity bundling and the burden of monopoly”, Quarterly Journal of Economics, XC: 475–498.
Andreoni, J. and Bernheim D. (2009), “Social Image and the 50-50 Norm: A Theoretical and
Experimental Analysis of Audience Effects,” Econometrica, 77:5, 1607–1636. Armantier, O. (2006): “Do Wealth Differences Affect Fairness Consideration?,” International
Economic Review, 47, 391–429. Armstrong, M. and Huck, S (2010), “Behavioral economics as applied to firms: A
primer”, Competition Policy International, 6, 3–45. Bolton, G. E. and Ockenfels, A. (2000), “A theory of equity, reciprocity, and competition”,
American Economic Review, 90: 166–193. Boone, J., Müller, W., and Suetens, S. (in press), “Naked exclusion: towards a behavioral
approach to exclusive dealing”, Journal of Industrial Economics, forthcoming. Caliskan, A., Porter, D., Rassenti, S., Smith, V.L., and Wilson, B. (2007), “Exclusionary
Bundling and the Effects of a Competitive Fringe”, Journal of Institutional and Theoretical Economics, 163: 109–132.
Chung, H.-L., Lin, Y.-S. and Hu, J.-L (2013), “Bundling strategy and product differentiation”,
Journal of Economics, 108: 207–229. Cox. J., D. Friedman and S. Gjerstad (2007),“A tractable model of reciprocity and fairness”,
Games and Economic Behavior, 59: 17–45. Damme, E. van, Larouche, P. and Müller, W. (2009), “Abuse of a dominant position: cases and
experiments”, in Hinloopen, J. and Normann, H.-T. (eds.), Experiments and competition policy, Cambridge: Cambridge University Press, 107–160.
European Commision (2007), Case COMP/C-3/37.792 – Microsoft, Official Journal of the
European Union. European Commission (2009), “Antitrust: Commission confirms sending a Statement of
Objections to Microsoft on the tying of Internet Explorer to Windows”, MEMO / 09 / 15. Fehr, E. and Schmidt, K. (1999), “A theory of fairness, competition, and cooperation”,
Quarterly Journal of Economics, 114: 817–868. Fischbacher, (2007), “z-Tree: Zurich toolbox for ready-made economic experiments”,
Experimental Economics, 10: 171–178.

27
Fonseca, M. A., Huck, S. and Normann, H.-T. (2005), “Playing Cournot although they shouldn’t: endogenous timing in experimental duopolies with asymmetric costs”, Economic Theory, 25: 669–677.
Fonseca, M. A. and Normann, H.-T. (2008), “Mergers, capacity consolidations and collusion:
experimental evidence, Economic Journal, 118: 387–400. Goeree, J. K. and Gomez, R. and C. Holt (2004), “Predatory Pricing: Rare Like a Unicorn?”, in
C. Plott and V. L. Smith (eds.), Handbook of Experimental Economic Results, New York: Elsevier Press, 178–184.
Güth, W., (1995), “On Ultimatum Bargaining - A Personal Review”, Journal of Economic
Behavior and Organization, 27: 329–344. Güth, W., Huck, S. and Müller, W. (2001), “The relevance of equal splits in ultimatum games”,
Games and Econ. Behavior, 37, 161–169. Henze, B. and Schuett, F. (2011), “Transparency in markets for experience goods: experimental
evidence”, presented at the annual M-BEES conference, June 2011, Maastricht. Holt, C.A. (1985), “An Experimental Test of the Consistent-Conjectures Hypothesis,” American
Economic Review, 75, 314–325. Huck, S., Müller, W. and Normann, H.-T. (2001), “Stackelberg beats Cournot: on collusion and
efficiency in experimental markets”, Economic Journal, 111: 749–765. Huck, S., Müller, W. and Normann, H.-T., (2002), “To Commit or not to Commit: Endogenous
Timing in Experimental Duopoly”, Games and Economic Behavior, 38: 240–264. Isaac, M. R. and V. L. Smith (1985), “In Search of Predatory Pricing”, Journal of Political
Economy, 93: 320–345. Iris, D. and Santos-Pinto, L. (2010), “Experimental Cournot oligopoly and inequity aversion”,
available at: http://www.hec.unil.ch/lspinto/Papers%20&%20CV/ineaveoligop-competition26may2010.pdf
Keser, C. (1993), “Some results of experimental duopoly markets with demand inertia”, Journal
of Industrial Economics, 41: 133–151. Lau, S.-H. P. and Leung, F., (2010), “Estimating a parsimonious model of inequality aversion in
Stackelberg duopoly experiments”, Oxford Bulletin of Economics and Statistics, 72: 669–686.
Landeo, C.M., Spier, K.E. (2009), “Naked Exclusion: An Experimental Study of Contracts with
Externalities”, American Economic Review, 99: 1850–1877.

28
Martin, S., 1999, “Strategic and welfare implications of bundling”, Economics Letters, 62: 371–376.
Martin, S., Normann, H.T. and Snyder C. (2001) “Vertical Foreclosure in Experimental
Markets”, RAND Journal of Economics, 32: 466–496. Mason, C.F., Phillips, O.R. and Nowell, C. (1992), “Duopoly behavior in asymmetric markets:
an experimental investigation”, The Review of Economics and Statistics, 74: 662– 670. McAfee, R. P., McMillan, J. and Whinston, M. D. (1989), “Multiproduct monopoly, commodity
bundling, and correlation values”, Quarterly Journal of Economics, CIV: 371–384. Microsoft (2004), Case No. COMP/C-3/37.792. Müller. W. (2006), “Allowing for two production periods in the Cournot duopoly: Experimental
evidence”, Journal of Economic Behavior and Organization, 60: 100–111. Muris, Timothy J. and Vernon L. Smith (2008), “Antitrust and Bundled Discounts: An
Experimental Analysis”, Antitrust Law Journal, 75: 399–432. Nalebuff, B. (2004), “Bundling as an entry barrier”, Quarterly Journal of Economics, 119: 159–
187. Normann, H.T., Ruffle, B. and Snyder, C. (2007), “Do Buyer-Size Discounts Depend on the
Curvature of the Surplus Function? Experimental Tests of Bargaining Models”, RAND Journal of Economics, 38: 747–767.
Roth, A.E., (1995), “Bargaining Experiments”, in Kagel, J.H. and Roth, A.E. (eds.), The
Handbook of Experimental Economics (Princeton University Press, Princeton). Santos-Pinto, L. (2008), “Making sense of the experimental evidence on endogenous timing in
duopoly markets”, Journal of Economic Behavior and Organization, 68: 657–666. Smith, A.M. (2011), “An experimental study of exclusive contracts”, International Journal of
Industrial Organization, 29: 4–13. U.S. vs. Microsoft (2001), 253 F.3d 34. Whinston, M. (1990), “Tying, Foreclosure, and Exclusion”, American Economic Review, 80(4):
837–859.

29
APPENDIX A: INSTRUCTIONS
Cournot – bundling
Welcome!
This is an experiment on market decision-making. Take the time to read the instructions carefully. A good understanding of the instructions and well-thought-out decisions during the experiment can earn you a considerable amount of money. All earnings from the experiment will be paid to you in cash at the end of the experiment.
Your role and task in the experiment
In this experiment, you, just like everybody else in the room, will represent a firm. There are two types of firms, firm A and firm B. The computer randomly assigns half of the participants the role of firm A and the other half the role of firm B. Your role as firm A or firm B will remain fixed throughout the experiment, and you will learn whether you are firm A or firm B before we begin the experiment.
The experiment takes place over 15 rounds. In each round, one firm A and one firm B will meet in a market for a fictitious commodity, called Market 1. Firm A also operates in Market 2 but firm B does not.
The computer will randomly match two firms (one firm A, one firm B) for Market 1 in every round from a group of eight subjects. The matching is completely random, meaning that there is no relation between the participant you were matched with in the last round (or any other previous round) and the participant to whom you will be assigned to this round.
In every period, firm A and firm B have to choose a quantity. This quantity can be any whole number between 1 and 19. Firm B’s choice applies to Market 1. Firm A’s quantity choice is relevant both in Market 1 as well as in Market 2. That is, firm A only has one quantity choice so that the quantity in Market 1 will be the same as the one in Market 2.
Profit calculation
In the table we distributed, you can see how the profits for both firms are determined. Generally, the column on the left (“Market 2”) indicates the profit of firm A on Market 2 and the big payoff table (“Market 1”) indicates the profits for firm A and firm B in Market 1.
Market 1
In the payoff table for Market 1, the head of each row represents an A-firm quantity and the head of the column represents the quantity of the other firm (the B-firm). For each quantity combination (that is, for each of the firm A choices in the rows and the firm B choices in the columns), there is one relevant cell in the payoff table. In these cells, the lower left entry is firm A’s profit and the upper right profit is firm B’s profit in Market 1.
Market 2
As mentioned, firm A also operates in Market 2. Firm A’s profit in Market 2 is contained in the second column of your table, the one with the title “Market 2”. The profit firm A earns in Market 2 is in addition to the profit it earns in Market 1.
At the end of each period, Firm A will be informed of the quantity choice of Firm B and Firm B will be informed of the quantity choice of Firm A, and the computer also calculates your profits.

30
Each period
In each of the 15 rounds, you and the other participant with whom you are randomly matched have to simultaneously decide on your quantities. That is, you have to pick your quantity without knowing what the other participants will choose.
At the end of each period, you will be informed of the quantity the other participant chose, and the computer will also calculate your profits.
Payments
The profits in the table are denoted in a fictitious unit of money which we call Florin. For each 500 Florin, you (like all other participants) will be paid 1 in cash at the end.
At the beginning of the experiment, we will pay you and the other participants 2,500 Florin as an initial capital to start with (this is the €5 show-up fee you were promised). Also these 2,500 Florins will be paid in cash to you at the end.
Questions?
If you have a question, please indicate so by raising your hand and we will answer immediately and privately.
Stackelberg – bundling
Each period
In each of the 15 rounds, you and the other participant with whom you are randomly matched have to decide on your quantities. Firm A will choose its quantity first. The computer will then inform Firm B of Firm A’s choice in Market 1 and Market 2, and then Firm B has to pick the quantity, knowing Firm A’s choice.
In the endogenous bundling treatments (at the end of Section “Your role and task in the experiment”)
Before Firm A and Firm B make the quantity choices, Firm A has to decide between the following two options:
Option 1: One quantity choice for both Markets In this case, firm A makes only one quantity choice that is relevant in Market 1 as well as in Market 2. That is, in this case firm A makes only one quantity choice, so that the quantity supplied by firm A in Market 1 will be the same as what it supplies in Market 2.
Option 2: Two independent quantity choices for Market 1 and Market 2 In this case, firm A makes two quantity choices, one quantity choice for Market 1 and one quantity choice for Market 2. In this case Firm A’s quantity in Market 2 can be the same or it can be different to Firm A’s quantity in Market 1.
Firm A’s decision on Option 1 or Option 2 is binding and Firm B will be informed of this choice before firms A and B make their quantity choices.

31
APPENDIX B: PAYOFF TABLE
Firm A's Profit Quantities of the B-Firm in Market 1in Market 2
1 2 3 4 5 6 7 8 9 10 11 12 13 14 15 16 17 18 19270 290 308 324 338 350 360 368 374 378 380 379 378 374 368 360 350 338 324
270 261 252 243 234 225 216 207 198 189 180 171 162 153 144 135 126 117 108
261 280 297 312 325 336 345 352 357 360 361 360 357 352 345 336 325 312 297
290 280 270 260 250 240 230 220 210 200 190 180 170 160 150 140 130 120 109
252 270 286 300 312 322 330 336 340 342 341 340 336 330 322 312 300 286 270
308 297 286 275 264 253 242 231 220 209 198 187 176 165 154 143 131 121 110
243 260 275 288 299 308 315 320 323 324 323 320 315 308 299 288 275 260 243
324 312 300 288 276 264 252 240 228 216 204 192 180 168 155 144 132 120 108
234 250 264 276 286 294 300 304 306 305 304 300 294 286 276 264 250 234 216
338 325 312 299 286 273 260 247 234 221 208 195 181 169 156 143 130 117 104
225 240 253 264 273 280 285 288 289 288 285 280 272 264 253 240 225 208 189
350 336 322 308 294 280 266 252 238 224 210 196 182 168 154 140 126 112 98
216 230 242 252 260 266 270 272 271 270 266 260 252 242 230 216 200 182 162
360 345 330 315 300 285 270 255 240 225 209 195 180 165 150 135 120 105 90
207 220 231 240 247 252 255 256 255 252 247 240 231 220 207 192 175 156 135
368 352 336 320 304 288 272 256 239 224 208 192 176 160 144 128 112 96 80
198 210 220 228 234 238 240 239 238 234 228 220 210 198 184 168 150 130 108
374 357 340 323 306 289 271 255 238 221 204 187 170 153 136 119 102 85 68
189 200 209 216 221 224 225 224 221 216 209 200 189 176 161 144 125 104 81
378 360 342 324 305 288 270 252 234 216 198 180 162 144 126 108 90 72 54
180 190 198 204 208 210 209 208 204 198 190 180 168 154 138 120 100 78 54
380 361 341 323 304 285 266 247 228 209 190 171 152 133 114 95 76 57 38
171 180 187 192 195 196 195 192 187 180 171 160 147 132 115 96 75 52 27
379 360 340 320 300 280 260 240 220 200 180 160 140 120 100 80 60 40 20
162 170 176 180 181 182 180 176 170 162 152 140 126 110 92 72 50 26 0
378 357 336 315 294 272 252 231 210 189 168 147 126 105 84 63 42 21 0
153 160 165 168 169 168 165 160 153 144 133 120 105 88 69 48 25 0 -27
374 352 330 308 286 264 242 220 198 176 154 132 110 88 66 44 22 0 -22
144 150 154 155 156 154 150 144 136 126 114 100 84 66 46 24 0 -26 -54
368 345 322 299 276 253 230 207 184 161 138 115 92 69 46 23 0 -23 -46
135 140 143 144 143 140 135 128 119 108 95 80 63 44 23 0 -25 -52 -81
360 336 312 288 264 240 216 192 168 144 120 96 72 48 24 0 -24 -48 -72
126 130 131 132 130 126 120 112 102 90 76 60 42 22 0 -24 -50 -78 -108
350 325 300 275 250 225 200 175 150 125 100 75 50 25 0 -25 -50 -75 -100
117 120 121 120 117 112 105 96 85 72 57 40 21 0 -23 -48 -75 -104 -135
338 312 286 260 234 208 182 156 130 104 78 52 26 0 -26 -52 -78 -104 -130
108 109 110 108 104 98 90 80 68 54 38 20 0 -22 -46 -72 -100 -130 -162
324 297 270 243 216 189 162 135 108 81 54 27 0 -27 -54 -81 -108 -135 -16219
Qu
an
titi
es
of
the
A-F
irm
in
Ma
rke
t 1
13
14
15
16
9
10
1
2
3
4
11
12
5
6
7
8
Qu
an
titi
es
of
the
A-F
irm
in
Ma
rke
t 2
17
18
351
380
407
432
567
567
572
575
576
527
540
551
560
1
2
3
4
575
572
455
476
495
512
9
10
11
12
5
6
7
8
17
18
19
13
14
15
16

32
APPENDIX C: RESULTS OF ADDITIONAL TESTS
Table C1: Effect of prohibiting product bundling on market performance
COUR-EXO-NB COUR-ENDO STACK-EXO-NB STACK-ENDO
236 ≈ 246 242 ≈ 233
245 ≈ 249 199 ≈ 207
553 ≈ 528 609 ≈ 619
1034 ≈ 1023 1050 ≈ 1058
299 ≈ 280 287 ≈ 294
873 ≈ 852 861 ≈ 868
810 <* 819 816 ≈ 806
852 ≈ 807 896 ≈ 913
1907 ≈ 1874 1911 <* 1925
Notes: Significance levels are calculated with Wilcoxon rank-sum tests, conservatively counting each matching group as one independent observation; ** and * indicate statistical significance at the 5% and 10% level, respectively.

33
APPENDIX D: DATA
Table D1:
COUR-EXO-B COUR-EXO-NB COUR-ENDO matching
group period
1 2 3 4 1 2 3 4 1 2 3 4
1 20.25 17.00 21.50 19.00 17.00 16.75 13.75 14.00 14.00 18.50 17.00 15.75 2 20.25 18.00 20.50 17.75 17.00 16.50 16.00 13.75 14.00 18.00 16.75 16.75 3 19.75 17.75 19.50 17.75 16.25 16.00 18.00 14.00 13.25 15.75 16.50 15.25 4 20.25 18.00 20.00 19.75 17.00 19.50 16.75 12.75 14.25 17.25 16.50 15.75 5 20.25 17.75 20.00 20.00 16.25 17.75 17.50 13.75 14.25 18.00 17.25 16.00 6 21.00 18.25 20.00 20.50 17.75 18.50 17.25 13.50 14.25 19.00 17.00 16.257 19.75 18.00 19.75 18.50 15.00 17.75 17.00 14.25 14.25 18.00 16.75 15.75 8 20.25 19.25 19.50 19.25 16.75 18.50 17.75 14.75 14.25 20.00 16.75 15.75 9 20.25 19.25 19.50 19.75 17.75 18.50 16.75 15.00 14.25 18.25 14.75 15.25 10 19.00 18.75 20.00 18.75 16.75 16.50 15.50 14.50 14.25 18.00 15.75 15.00 11 20.25 19.25 19.50 19.75 17.50 16.50 16.00 14.75 13.75 18.75 15.75 14.7512 20.25 19.25 19.25 19.00 17.25 18.50 16.75 14.75 13.75 19.25 16.75 15.75 13 20.25 19.25 19.75 19.00 17.75 18.25 15.75 14.50 13.50 18.00 16.00 15.75 14 20.25 19.25 19.75 19.00 17.00 15.75 15.75 15.25 15.00 18.50 18.25 15.50 15 20.25 19.25 19.75 19.00 16.75 18.25 15.75 16.25 14.25 19.25 17.25 15.25
STACK-EXO-B STACK-EXO-NB STACK-ENDO matching
group period
1 2 3 4 1 2 3 4 1 2 3 4
1 20.75 22.25 23.50 20.25 14.75 19.25 21.75 15.75 17.50 19.75 21.50 19.25 2 20.50 21.75 22.75 21.25 17.50 19.25 19.50 16.25 17.75 21.50 20.50 18.25 3 22.75 22.25 21.50 21.00 19.25 17.75 19.50 19.00 19.00 21.00 20.75 19.75 4 22.25 22.50 23.00 21.75 21.50 18.75 20.25 22.00 19.00 20.00 19.00 19.25 5 22.25 20.25 22.75 23.25 19.25 18.00 21.00 21.25 17.25 16.25 17.50 20.50 6 21.50 21.50 22.50 22.00 18.50 19.25 20.25 20.00 20.00 16.25 17.75 20.75 7 21.00 22.50 24.00 22.00 16.75 19.00 19.50 18.25 18.25 16.50 17.75 20.50 8 23.25 22.25 22.75 21.50 17.00 18.5 19.50 19.25 20.00 16.00 16.50 21.50 9 23.00 21.75 23.00 22.25 17.75 19.25 20.25 19.00 20.00 16.75 16.50 21.50 10 23.00 22.75 22.00 22.00 17.00 20.00 19.50 21.25 18.00 17.50 18.25 19.75 11 22.75 22.00 22.50 21.50 17.75 21.25 17.00 19.75 17.00 16.25 16.00 22.50 12 22.25 21.25 22.00 21.00 17.75 19.75 19.50 19.00 18.25 16.25 15.75 21.50 13 22.25 20.75 22.50 21.75 16.75 17.50 19.50 19.75 18.50 16.25 16.00 21.50 14 22.50 21.75 22.50 22.25 17.75 20.25 19.50 19.00 17.25 16.00 16.25 21.50 15 22.50 22.25 22.50 21.25 19.50 20.25 17.00 20.25 19.00 16.00 17.50 21.25

34
Table D2:
COUR-EXO-B COUR-EXO-NB COUR-ENDO matching
group period
1 2 3 4 1 2 3 4 1 2 3 4
1 16.00 15.50 17.25 15.00 17.00 15.75 17.25 17.25 11.50 17.00 18.75 17.00 2 14.50 15.50 15.25 13.00 19.00 16.75 16.50 19.25 14.75 17.25 17.50 19.50 3 14.25 16.00 17.25 12.50 17.50 18.00 17.00 17.00 16.00 16.50 14.75 17.00 4 16.25 15.75 15.50 15.00 18.75 14.50 15.75 18.00 15.50 18.50 15.25 14.50 5 16.75 15.50 14.75 13.25 17.25 16.25 16.25 16.25 15.50 15.75 16.50 14.50 6 16.50 15.50 15.25 13.75 16.00 15.75 16.25 17.75 15.00 15.25 15.25 15.25 7 16.25 15.50 15.25 14.25 15.75 16.00 16.25 17.25 15.75 14.50 15.25 14.50 8 15.75 15.50 14.75 14.75 15.50 15.25 16.50 17.50 17.25 16.00 16.00 15.75 9 16.75 15.25 16.00 13.00 16.25 16.50 16.25 17.50 16.75 14.75 16.00 16.25 10 16.25 15.50 15.75 13.50 16.00 16.75 16.50 17.25 17.00 16.75 16.00 16.00 11 17.75 16.25 15.75 14.75 17.50 16.50 16.50 16.75 17.75 17.50 16.50 16.25 12 18.00 16.25 16.00 14.25 17.25 16.25 16.50 17.25 17.75 15.75 16.50 16.50 13 16.25 15.50 15.25 15.50 17.50 15.75 15.50 17.50 17.75 17.50 16.00 15.50 14 18.25 15.50 15.25 14.25 17.75 16.00 16.00 17.25 17.50 15.50 15.75 15.75 15 16.00 16.25 14.25 14.25 17.50 17.50 15.75 17.25 17.25 14.75 17.00 15.25
STACK-EXO-B STACK-EXO-NB STACK-ENDO matching
group period
1 2 3 4 1 2 3 4 1 2 3 4
1 13.50 12.00 11.50 15.25 15.25 12.75 14.50 14.50 15.75 19.25 16.75 15.00 2 14.00 15.00 12.50 13.50 16.50 12.25 14.75 16.75 18.75 18.00 17.00 17.00 3 12.75 16.25 13.25 12.25 14.50 14.25 14.25 15.75 14.75 20.75 14.75 15.50 4 13.00 14.75 12.50 12.50 13.75 16.00 14.75 16.75 16.50 20.00 16.25 15.75 5 13.00 15.50 15.25 11.75 19.00 14.25 16.00 13.25 15.50 15.50 17.50 15.00 6 13.25 16.75 12.75 12.25 18.00 14.75 17.75 13.25 16.25 16.75 16.50 14.25 7 13.50 14.00 12.00 15.50 15.25 17.25 18.50 16.00 18.25 16.50 17.00 14.75 8 12.50 15.25 12.50 12.25 18.00 14.50 18.50 18.00 14.25 16.25 16.50 14.75 9 12.50 16.25 12.75 12.25 15.25 14.00 17.75 18.25 15.25 17.00 16.75 15.00 10 12.50 16.25 13.00 12.50 18.00 14.00 17.25 15.75 17.25 17.75 17.00 15.00 11 12.75 16.00 13.00 12.25 15.50 13.50 18.50 14.00 15.75 16.25 16.75 14.50 12 12.75 16.50 13.50 12.75 14.75 14.75 14.25 15.50 15.25 16.50 17.25 14.50 13 12.75 15.50 13.25 12.75 13.75 15.75 16.50 14.25 17.50 16.75 15.75 14.75 14 12.75 17.25 13.25 12.25 17.75 14.50 16.50 15.75 17.25 16.50 17.25 14.50 15 12.75 16.75 13.25 13.00 14.75 13.75 13.25 17.50 15.00 17.00 19.50 13.75

35
Table D3:
COUR-EXO-B COUR-EXO-NB COUR-ENDO matching
group period
1 2 3 4 1 2 3 4 1 2 3 4
1 20.25 17.00 21.50 19.00 24.00 25.25 26.00 21.00 24.00 22.25 22.75 25.50 2 20.25 18.00 20.50 17.75 24.00 24.25 25.75 24.25 24.00 24.25 22.75 24.75 3 19.75 17.75 19.50 17.75 24.00 24.50 25.50 24.00 24.00 22.50 22.75 24.75 4 20.25 18.00 20.00 19.75 24.00 24.50 25.50 24.00 24.00 22.00 22.75 24.75 5 20.25 17.75 20.00 20.00 24.00 24.50 25.50 24.00 24.00 22.50 22.75 24.75 6 21.00 18.25 20.00 20.50 24.00 24.50 25.50 24.00 24.00 24.00 22.75 24.00 7 19.75 18.00 19.75 18.50 24.00 24.50 25.50 24.00 24.00 24.00 22.75 24.00 8 20.25 19.25 19.50 19.25 24.00 24.50 25.50 24.00 24.00 22.75 22.75 24.00 9 20.25 19.25 19.50 19.75 24.00 24.50 25.50 24.00 24.00 22.75 24.75 24.00 10 19.00 18.75 20.00 18.75 24.00 24.50 25.50 24.00 24.00 22.50 22.75 24.00 11 20.25 19.25 19.50 19.75 24.00 24.50 24.75 24.00 24.00 22.00 24.75 24.00 12 20.25 19.25 19.25 19.00 24.00 24.50 24.75 24.00 24.00 22.25 22.75 24.00 13 20.25 19.25 19.75 19.00 24.00 24.50 24.75 24.00 24.00 23.75 24.75 24.00 14 20.25 19.25 19.75 19.00 24.00 24.50 24.75 24.00 24.00 22.75 22.75 24.00 15 20.25 19.25 19.75 19.00 24.00 24.50 24.75 24.00 24.00 22.75 22.75 24.00
STACK-EXO-B STACK-EXO-NB STACK-ENDO matching
group period
1 2 3 4 1 2 3 4 1 2 3 4
1 20.75 22.25 23.50 20.25 22.75 21.75 22.25 25.00 24.00 22.75 24.50 25.50 2 20.50 21.75 22.75 21.25 24.00 22.75 23.75 24.75 25.25 23.25 24.75 25.50 3 22.75 22.25 21.50 21.00 24.00 24.00 24.00 23.75 25.25 23.25 23.75 24.50 4 22.25 22.50 23.00 21.75 24.00 24.25 24.00 25.50 24.25 24.00 24.50 24.25 5 22.25 20.25 22.75 23.25 24.00 24.75 24.00 24.00 24.75 24.00 24.75 22.50 6 21.50 21.50 22.50 22.00 24.00 23.50 24.00 24.75 24.00 24.00 25.00 24.25 7 21.00 22.50 24.00 22.00 24.00 24.25 24.00 23.75 24.25 24.00 24.75 24.25 8 23.25 22.25 22.75 21.50 24.00 24.25 24.00 23.25 24.00 24.00 24.50 23.50 9 23.00 21.75 23.00 22.25 24.00 24.00 24.00 24.25 24.00 24.00 24.75 23.75 10 23.00 22.75 22.00 22.00 24.00 24.00 24.00 24.75 24.00 24.00 24.75 23.75 11 22.75 22.00 22.50 21.50 24.00 23.50 24.00 24.75 24.00 24.00 24.75 24.50 12 22.25 21.25 22.00 21.00 24.00 22.75 24.00 25.25 24.00 24.00 24.75 23.50 13 22.25 20.75 22.50 21.75 24.00 22.50 24.00 23.50 24.00 24.00 24.75 23.50 14 22.50 21.75 22.50 22.25 24.00 24.00 24.00 23.50 24.00 24.00 24.75 23.50 15 22.50 22.25 22.50 21.25 24.00 23.50 24.00 24.00 24.00 24.00 24.75 25.50

36
Figure D1: Average quantities over time
14
16
18
20
22
24
0 2 4 6 8 10 12 14 16
Output firm
1, m
arket D
Period
Cour‐Exo‐NB Cour‐Exo‐B Cour‐Endo
Stack‐Exo‐NB Stack‐Exo‐B Stack‐Endo
12
13
14
15
16
17
18
19
0 2 4 6 8 10 12 14 16
Output firm
2, m
arket D
Period
Cour‐Exo‐NB Cour‐Exo‐B Cour‐Endo
Stack‐Exo‐NB Stack‐Exo‐B Stack‐Endo

37
Figure D1 (continued): Average quantities over time
18
19
20
21
22
23
24
25
0 2 4 6 8 10 12 14 16
Output firm
1, m
arket M
Period
Cour‐Exo‐NB Cour‐Exo‐B Cour‐Endo
Stack‐Exo‐NB Stack‐Exo‐B Stack‐Endo

PREVIOUS DISCUSSION PAPERS
116 Hinloopen, Jeroen, Müller, Wieland and Normann, Hans-Theo, Output Commitment Through Product Bundling: Experimental Evidence, November 2013. Forthcoming in: European Economic Review.
115 Baumann, Florian, Denter, Philipp and Friehe Tim, Hide or Show? Endogenous Observability of Private Precautions Against Crime When Property Value is Private Information, November 2013.
114 Fan, Ying, Kühn, Kai-Uwe and Lafontaine, Francine, Financial Constraints and Moral Hazard: The Case of Franchising, November 2013.
113 Aguzzoni, Luca, Argentesi, Elena, Buccirossi, Paolo, Ciari, Lorenzo, Duso, Tomaso, Tognoni, Massimo and Vitale, Cristiana, They Played the Merger Game: A Retrospective Analysis in the UK Videogames Market, October 2013.
112 Myrseth, Kristian Ove R., Riener, Gerhard and Wollbrant, Conny, Tangible Temptation in the Social Dilemma: Cash, Cooperation, and Self-Control, October 2013.
111 Hasnas, Irina, Lambertini, Luca and Palestini, Arsen, Open Innovation in a Dynamic Cournot Duopoly, October 2013.
110 Baumann, Florian and Friehe, Tim, Competitive Pressure and Corporate Crime, September 2013.
109 Böckers, Veit, Haucap, Justus and Heimeshoff, Ulrich, Benefits of an Integrated European Electricity Market, September 2013.
108 Normann, Hans-Theo and Tan, Elaine S., Effects of Different Cartel Policies: Evidence from the German Power-Cable Industry, September 2013. Forthcoming in: Industrial and Corporate Change.
107 Haucap, Justus, Heimeshoff, Ulrich, Klein, Gordon J., Rickert, Dennis and Wey, Christian, Bargaining Power in Manufacturer-Retailer Relationships, September 2013.
106 Baumann, Florian and Friehe, Tim, Design Standards and Technology Adoption: Welfare Effects of Increasing Environmental Fines when the Number of Firms is Endogenous, September 2013.
105 Jeitschko, Thomas D., NYSE Changing Hands: Antitrust and Attempted Acquisitions of an Erstwhile Monopoly, August 2013.
104 Böckers, Veit, Giessing, Leonie and Rösch, Jürgen, The Green Game Changer: An Empirical Assessment of the Effects of Wind and Solar Power on the Merit Order, August 2013.
103 Haucap, Justus and Muck, Johannes, What Drives the Relevance and Reputation of Economics Journals? An Update from a Survey among Economists, August 2013.
102 Jovanovic, Dragan and Wey, Christian, Passive Partial Ownership, Sneaky Takeovers, and Merger Control, August 2013.
101 Haucap, Justus, Heimeshoff, Ulrich, Klein, Gordon J., Rickert, Dennis and Wey, Christian, Inter-Format Competition Among Retailers – The Role of Private Label Products in Market Delineation, August 2013.

100 Normann, Hans-Theo, Requate, Till and Waichman, Israel, Do Short-Term Laboratory Experiments Provide Valid Descriptions of Long-Term Economic Interactions? A Study of Cournot Markets, July 2013. Forthcoming in: Experimental Economics.
99 Dertwinkel-Kalt, Markus, Haucap, Justus and Wey, Christian, Input Price Discrimination (Bans), Entry and Welfare, June 2013.
98 Aguzzoni, Luca, Argentesi, Elena, Ciari, Lorenzo, Duso, Tomaso and Tognoni, Massimo, Ex-post Merger Evaluation in the UK Retail Market for Books, June 2013.
97 Caprice, Stéphane and von Schlippenbach, Vanessa, One-Stop Shopping as a Cause of Slotting Fees: A Rent-Shifting Mechanism, May 2012. Published in: Journal of Economics and Management Strategy, 22 (2013), pp. 468-487.
96 Wenzel, Tobias, Independent Service Operators in ATM Markets, June 2013. Forthcoming in: Scottish Journal of Political Economy.
95 Coublucq, Daniel, Econometric Analysis of Productivity with Measurement Error: Empirical Application to the US Railroad Industry, June 2013.
94 Coublucq, Daniel, Demand Estimation with Selection Bias: A Dynamic Game Approach with an Application to the US Railroad Industry, June 2013.
93 Baumann, Florian and Friehe, Tim, Status Concerns as a Motive for Crime?, April 2013.
92 Jeitschko, Thomas D. and Zhang, Nanyun, Adverse Effects of Patent Pooling on Product Development and Commercialization, April 2013.
91 Baumann, Florian and Friehe, Tim, Private Protection Against Crime when Property Value is Private Information, April 2013. Published in: International Review of Law and Economics, 35 (2013), pp. 73-79.
90 Baumann, Florian and Friehe, Tim, Cheap Talk About the Detection Probability, April 2013. Forthcoming in: International Game Theory Review.
89 Pagel, Beatrice and Wey, Christian, How to Counter Union Power? Equilibrium Mergers in International Oligopoly, April 2013.
88 Jovanovic, Dragan, Mergers, Managerial Incentives, and Efficiencies, April 2013.
87 Heimeshoff, Ulrich and Klein Gordon J., Bargaining Power and Local Heroes, March 2013.
86 Bertschek, Irene, Cerquera, Daniel and Klein, Gordon J., More Bits – More Bucks? Measuring the Impact of Broadband Internet on Firm Performance, February 2013. Forthcoming in: Information Economics and Policy.
85 Rasch, Alexander and Wenzel, Tobias, Piracy in a Two-Sided Software Market, February 2013. Published in: Journal of Economic Behavior & Organization, 88 (2013), pp. 78-89.
84 Bataille, Marc and Steinmetz, Alexander, Intermodal Competition on Some Routes in Transportation Networks: The Case of Inter Urban Buses and Railways, January 2013.

83 Haucap, Justus and Heimeshoff, Ulrich, Google, Facebook, Amazon, eBay: Is the Internet Driving Competition or Market Monopolization?, January 2013. Forthcoming in: International Economics and Economic Policy.
82 Regner, Tobias and Riener, Gerhard, Voluntary Payments, Privacy and Social Pressure on the Internet: A Natural Field Experiment, December 2012.
81 Dertwinkel-Kalt, Markus and Wey, Christian, The Effects of Remedies on Merger Activity in Oligopoly, December 2012.
80 Baumann, Florian and Friehe, Tim, Optimal Damages Multipliers in Oligopolistic Markets, December 2012.
79 Duso, Tomaso, Röller, Lars-Hendrik and Seldeslachts, Jo, Collusion through Joint R&D: An Empirical Assessment, December 2012. Forthcoming in: The Review of Economics and Statistics.
78 Baumann, Florian and Heine, Klaus, Innovation, Tort Law, and Competition, December 2012. Forthcoming in: Journal of Institutional and Theoretical Economics.
77 Coenen, Michael and Jovanovic, Dragan, Investment Behavior in a Constrained Dictator Game, November 2012.
76 Gu, Yiquan and Wenzel, Tobias, Strategic Obfuscation and Consumer Protection Policy in Financial Markets: Theory and Experimental Evidence, November 2012. Forthcoming in: Journal of Industrial Economics under the title “Strategic Obfuscation and Consumer Protection Policy”.
75 Haucap, Justus, Heimeshoff, Ulrich and Jovanovic, Dragan, Competition in Germany’s Minute Reserve Power Market: An Econometric Analysis, November 2012. Forthcoming in: The Energy Journal.
74 Normann, Hans-Theo, Rösch, Jürgen and Schultz, Luis Manuel, Do Buyer Groups Facilitate Collusion?, November 2012.
73 Riener, Gerhard and Wiederhold, Simon, Heterogeneous Treatment Effects in Groups, November 2012.
72 Berlemann, Michael and Haucap, Justus, Which Factors Drive the Decision to Boycott and Opt Out of Research Rankings? A Note, November 2012.
71 Muck, Johannes and Heimeshoff, Ulrich, First Mover Advantages in Mobile Telecommunications: Evidence from OECD Countries, October 2012.
70 Karaçuka, Mehmet, Çatik, A. Nazif and Haucap, Justus, Consumer Choice and Local Network Effects in Mobile Telecommunications in Turkey, October 2012. Published in: Telecommunications Policy, 37 (2013), pp. 334-344.
69 Clemens, Georg and Rau, Holger A., Rebels without a Clue? Experimental Evidence on Partial Cartels, April 2013 (First Version October 2012).
68 Regner, Tobias and Riener, Gerhard, Motivational Cherry Picking, September 2012.
67 Fonseca, Miguel A. and Normann, Hans-Theo, Excess Capacity and Pricing in Bertrand-Edgeworth Markets: Experimental Evidence, September 2012. Published in: Journal of Institutional and Theoretical Economics, 169 (2013), pp. 199-228.

66 Riener, Gerhard and Wiederhold, Simon, Team Building and Hidden Costs of Control, September 2012.
65 Fonseca, Miguel A. and Normann, Hans-Theo, Explicit vs. Tacit Collusion – The Impact of Communication in Oligopoly Experiments, August 2012. Published in: European Economic Review, 56 (2012), pp. 1759-1772.
64 Jovanovic, Dragan and Wey, Christian, An Equilibrium Analysis of Efficiency Gains from Mergers, July 2012.
63 Dewenter, Ralf, Jaschinski, Thomas and Kuchinke, Björn A., Hospital Market Concentration and Discrimination of Patients, July 2012.
62 Von Schlippenbach, Vanessa and Teichmann, Isabel, The Strategic Use of Private Quality Standards in Food Supply Chains, May 2012. Published in: American Journal of Agricultural Economics, 94 (2012), pp. 1189-1201.
61 Sapi, Geza, Bargaining, Vertical Mergers and Entry, July 2012.
60 Jentzsch, Nicola, Sapi, Geza and Suleymanova, Irina, Targeted Pricing and Customer Data Sharing Among Rivals, July 2012. Published in: International Journal of Industrial Organization, 31 (2013), pp. 131-144.
59 Lambarraa, Fatima and Riener, Gerhard, On the Norms of Charitable Giving in Islam: A Field Experiment, June 2012.
58 Duso, Tomaso, Gugler, Klaus and Szücs, Florian, An Empirical Assessment of the 2004 EU Merger Policy Reform, June 2012. Forthcoming in: Economic Journal.
57 Dewenter, Ralf and Heimeshoff, Ulrich, More Ads, More Revs? Is there a Media Bias in the Likelihood to be Reviewed?, June 2012.
56 Böckers, Veit, Heimeshoff, Ulrich and Müller Andrea, Pull-Forward Effects in the German Car Scrappage Scheme: A Time Series Approach, June 2012.
55 Kellner, Christian and Riener, Gerhard, The Effect of Ambiguity Aversion on Reward Scheme Choice, June 2012.
54 De Silva, Dakshina G., Kosmopoulou, Georgia, Pagel, Beatrice and Peeters, Ronald, The Impact of Timing on Bidding Behavior in Procurement Auctions of Contracts with Private Costs, June 2012. Published in: Review of Industrial Organization, 41 (2013), pp.321-343.
53 Benndorf, Volker and Rau, Holger A., Competition in the Workplace: An Experimental Investigation, May 2012.
52 Haucap, Justus and Klein, Gordon J., How Regulation Affects Network and Service Quality in Related Markets, May 2012. Published in: Economics Letters, 117 (2012), pp. 521-524.
51 Dewenter, Ralf and Heimeshoff, Ulrich, Less Pain at the Pump? The Effects of Regulatory Interventions in Retail Gasoline Markets, May 2012.
50 Böckers, Veit and Heimeshoff, Ulrich, The Extent of European Power Markets, April 2012.
49 Barth, Anne-Kathrin and Heimeshoff, Ulrich, How Large is the Magnitude of Fixed-Mobile Call Substitution? - Empirical Evidence from 16 European Countries, April 2012.

48 Herr, Annika and Suppliet, Moritz, Pharmaceutical Prices under Regulation: Tiered Co-payments and Reference Pricing in Germany, April 2012.
47 Haucap, Justus and Müller, Hans Christian, The Effects of Gasoline Price Regulations: Experimental Evidence, April 2012.
46 Stühmeier, Torben, Roaming and Investments in the Mobile Internet Market, March 2012. Published in: Telecommunications Policy, 36 (2012), pp. 595-607.
45 Graf, Julia, The Effects of Rebate Contracts on the Health Care System, March 2012, Forthcoming in: The European Journal of Health Economics.
44 Pagel, Beatrice and Wey, Christian, Unionization Structures in International Oligopoly, February 2012. Published in: Labour: Review of Labour Economics and Industrial Relations, 27 (2013), pp. 1-17.
43 Gu, Yiquan and Wenzel, Tobias, Price-Dependent Demand in Spatial Models, January 2012. Published in: B. E. Journal of Economic Analysis & Policy, 12 (2012), Article 6.
42 Barth, Anne-Kathrin and Heimeshoff, Ulrich, Does the Growth of Mobile Markets Cause the Demise of Fixed Networks? – Evidence from the European Union, January 2012.
41 Stühmeier, Torben and Wenzel, Tobias, Regulating Advertising in the Presence of Public Service Broadcasting, January 2012. Published in: Review of Network Economics, 11/2 (2012), Article 1.
40 Müller, Hans Christian, Forecast Errors in Undisclosed Management Sales Forecasts: The Disappearance of the Overoptimism Bias, December 2011.
39 Gu, Yiquan and Wenzel, Tobias, Transparency, Entry, and Productivity, November 2011. Published in: Economics Letters, 115 (2012), pp. 7-10.
38 Christin, Clémence, Entry Deterrence Through Cooperative R&D Over-Investment, November 2011. Forthcoming in: Louvain Economic Review.
37 Haucap, Justus, Herr, Annika and Frank, Björn, In Vino Veritas: Theory and Evidence on Social Drinking, November 2011. In a modified version forthcoming in: European Journal of Law and Economics.
36 Barth, Anne-Kathrin and Graf, Julia, Irrationality Rings! – Experimental Evidence on Mobile Tariff Choices, November 2011.
35 Jeitschko, Thomas D. and Normann, Hans-Theo, Signaling in Deterministic and Stochastic Settings, November 2011. Published in: Journal of Economic Behavior and Organization, 82 (2012), pp.39-55.
34 Christin, Cémence, Nicolai, Jean-Philippe and Pouyet, Jerome, The Role of Abatement Technologies for Allocating Free Allowances, October 2011.
33 Keser, Claudia, Suleymanova, Irina and Wey, Christian, Technology Adoption in Markets with Network Effects: Theory and Experimental Evidence, October 2011. Published in: Information Economics and Policy, 24 (2012), pp. 262-276.

32 Çatik, A. Nazif and Karaçuka, Mehmet, The Bank Lending Channel in Turkey: Has it Changed after the Low Inflation Regime?, September 2011. Published in: Applied Economics Letters, 19 (2012), pp. 1237-1242.
31 Hauck, Achim, Neyer, Ulrike and Vieten, Thomas, Reestablishing Stability and Avoiding a Credit Crunch: Comparing Different Bad Bank Schemes, August 2011.
30 Suleymanova, Irina and Wey, Christian, Bertrand Competition in Markets with Network Effects and Switching Costs, August 2011. Published in: B. E. Journal of Economic Analysis & Policy, 11 (2011), Article 56.
29 Stühmeier, Torben, Access Regulation with Asymmetric Termination Costs, July 2011. Published in: Journal of Regulatory Economics, 43 (2013), pp. 60-89.
28 Dewenter, Ralf, Haucap, Justus and Wenzel, Tobias, On File Sharing with Indirect Network Effects Between Concert Ticket Sales and Music Recordings, July 2011. Published in: Journal of Media Economics, 25 (2012), pp. 168-178.
27 Von Schlippenbach, Vanessa and Wey, Christian, One-Stop Shopping Behavior, Buyer Power, and Upstream Merger Incentives, June 2011.
26 Balsmeier, Benjamin, Buchwald, Achim and Peters, Heiko, Outside Board Memberships of CEOs: Expertise or Entrenchment?, June 2011.
25 Clougherty, Joseph A. and Duso, Tomaso, Using Rival Effects to Identify Synergies and Improve Merger Typologies, June 2011. Published in: Strategic Organization, 9 (2011), pp. 310-335.
24 Heinz, Matthias, Juranek, Steffen and Rau, Holger A., Do Women Behave More Reciprocally than Men? Gender Differences in Real Effort Dictator Games, June 2011. Published in: Journal of Economic Behavior and Organization, 83 (2012), pp. 105-110.
23 Sapi, Geza and Suleymanova, Irina, Technology Licensing by Advertising Supported Media Platforms: An Application to Internet Search Engines, June 2011. Published in: B. E. Journal of Economic Analysis & Policy, 11 (2011), Article 37.
22 Buccirossi, Paolo, Ciari, Lorenzo, Duso, Tomaso, Spagnolo Giancarlo and Vitale, Cristiana, Competition Policy and Productivity Growth: An Empirical Assessment, May 2011. Published in: The Review of Economics and Statistics, 95 (2013), pp. 1324-1336.
21 Karaçuka, Mehmet and Çatik, A. Nazif, A Spatial Approach to Measure Productivity Spillovers of Foreign Affiliated Firms in Turkish Manufacturing Industries, May 2011. Published in: The Journal of Developing Areas, 46 (2012), pp. 65-83.
20 Çatik, A. Nazif and Karaçuka, Mehmet, A Comparative Analysis of Alternative Univariate Time Series Models in Forecasting Turkish Inflation, May 2011. Published in: Journal of Business Economics and Management, 13 (2012), pp. 275-293.
19 Normann, Hans-Theo and Wallace, Brian, The Impact of the Termination Rule on Cooperation in a Prisoner’s Dilemma Experiment, May 2011. Published in: International Journal of Game Theory, 41 (2012), pp. 707-718.
18 Baake, Pio and von Schlippenbach, Vanessa, Distortions in Vertical Relations, April 2011. Published in: Journal of Economics, 103 (2011), pp. 149-169.

17 Haucap, Justus and Schwalbe, Ulrich, Economic Principles of State Aid Control, April 2011. Forthcoming in: F. Montag & F. J. Säcker (eds.), European State Aid Law: Article by Article Commentary, Beck: München 2012.
16 Haucap, Justus and Heimeshoff, Ulrich, Consumer Behavior towards On-net/Off-net Price Differentiation, January 2011. Published in: Telecommunication Policy, 35 (2011), pp. 325-332.
15 Duso, Tomaso, Gugler, Klaus and Yurtoglu, Burcin B., How Effective is European Merger Control? January 2011. Published in: European Economic Review, 55 (2011), pp. 980-1006.
14 Haigner, Stefan D., Jenewein, Stefan, Müller, Hans Christian and Wakolbinger, Florian, The First shall be Last: Serial Position Effects in the Case Contestants evaluate Each Other, December 2010. Published in: Economics Bulletin, 30 (2010), pp. 3170-3176.
13 Suleymanova, Irina and Wey, Christian, On the Role of Consumer Expectations in Markets with Network Effects, November 2010. Published in: Journal of Economics, 105 (2012), pp. 101-127.
12 Haucap, Justus, Heimeshoff, Ulrich and Karaçuka, Mehmet, Competition in the Turkish Mobile Telecommunications Market: Price Elasticities and Network Substitution, November 2010. Published in: Telecommunications Policy, 35 (2011), pp. 202-210.
11 Dewenter, Ralf, Haucap, Justus and Wenzel, Tobias, Semi-Collusion in Media Markets, November 2010. Published in: International Review of Law and Economics, 31 (2011), pp. 92-98.
10 Dewenter, Ralf and Kruse, Jörn, Calling Party Pays or Receiving Party Pays? The Diffusion of Mobile Telephony with Endogenous Regulation, October 2010. Published in: Information Economics and Policy, 23 (2011), pp. 107-117.
09 Hauck, Achim and Neyer, Ulrike, The Euro Area Interbank Market and the Liquidity Management of the Eurosystem in the Financial Crisis, September 2010.
08 Haucap, Justus, Heimeshoff, Ulrich and Schultz, Luis Manuel, Legal and Illegal Cartels in Germany between 1958 and 2004, September 2010. Published in: H. J. Ramser & M. Stadler (eds.), Marktmacht. Wirtschaftswissenschaftliches Seminar Ottobeuren, Volume 39, Mohr Siebeck: Tübingen 2010, pp. 71-94.
07 Herr, Annika, Quality and Welfare in a Mixed Duopoly with Regulated Prices: The Case of a Public and a Private Hospital, September 2010. Published in: German Economic Review, 12 (2011), pp. 422-437.
06 Blanco, Mariana, Engelmann, Dirk and Normann, Hans-Theo, A Within-Subject Analysis of Other-Regarding Preferences, September 2010. Published in: Games and Economic Behavior, 72 (2011), pp. 321-338.
05 Normann, Hans-Theo, Vertical Mergers, Foreclosure and Raising Rivals’ Costs – Experimental Evidence, September 2010. Published in: The Journal of Industrial Economics, 59 (2011), pp. 506-527.
04 Gu, Yiquan and Wenzel, Tobias, Transparency, Price-Dependent Demand and Product Variety, September 2010. Published in: Economics Letters, 110 (2011), pp. 216-219.

03 Wenzel, Tobias, Deregulation of Shopping Hours: The Impact on Independent Retailers and Chain Stores, September 2010. Published in: Scandinavian Journal of Economics, 113 (2011), pp. 145-166.
02 Stühmeier, Torben and Wenzel, Tobias, Getting Beer During Commercials: Adverse Effects of Ad-Avoidance, September 2010. Published in: Information Economics and Policy, 23 (2011), pp. 98-106.
01 Inderst, Roman and Wey, Christian, Countervailing Power and Dynamic Efficiency, September 2010. Published in: Journal of the European Economic Association, 9 (2011), pp. 702-720.

ISSN 2190-9938 (online) ISBN 978-3-86304-115-1