Embed Size (px)
Citation preview
Mumbai/Pune/New Delhi/Chennai, January 2015
Outlook on Road Logistics for Finished Vehicles

2 Road_Logistics_for _Finished_Vehicles_India.pptx
This document shall be treated as confidential. RBSC does not assume any responsibility for the completeness and accuracy of the statements made in this document.
© Roland Berger Strategy Consultants
Contents Page
A. Global trends in Automotive Road Logistics Market 3
B. Europe: A Benchmark in Logistics Competitiveness 9
C. India Landscape for Automotive Logistics 26
D. Models for Indian OEMs to Improve Outbound Logistics 38
E. Key Trends and Recommendations for India 43
F. Roland Berger Strategy Consultants India 50

3 Road_Logistics_for _Finished_Vehicles_India.pptx
A. Global trends in Automotive Road Logistics Market

4 Road_Logistics_for _Finished_Vehicles_India.pptx
Logistics is a dynamic market impacted by a number of key trends
Source: Roland Berger
Megatrends and impact on logistics
Trend Relevance Impact on Logistics
4 Demographic Change/ Urbanization
> New logistical requirements in inner-city transportation and long-distance transportation (e.g. innovative approaches to first and last mile transportation)
> Need for better utilization of both infrastructures and fleets (e.g. pooling, use of non-logistics infrastructure)
3 E-Commerce & Digitalization
> New structures in the supply chain (e.g. bypassing of hubs, direct ordering, transparency) > Demand for value added services on B2B and B2C level (e.g. packaging, return deliveries) > Refinement of service levels (e.g. same day delivery, utmost flexibility)
7 Sustainability > Establishment of green standards across the entire supply chain (mainly driven by industry players)
> Use of more efficient vehicles, hybrids and alternative fuels
1 New Technologies
> Growth in new technology investments (e.g. RFID, inventory, automation) > Integrated logistics networks and real-time tracking of transportation value chains > New business models based on data mining/analytics
5 Globalization of Operations
> Increasing logistics process complexity of global supply chains > New approaches of supply chain risk management > Greater exposure to unusual interruptions and disruptions of business processes
2 Outsourcing/ Cost Pressure
> Continued cost pressure on supply chain operations > Forward/backward integration of players in the supply chain > Reshaping of logistics hubs, less complex than of manufacturing footprint
6 Regulatory developments
> Traffic gridlocks result in stricter regulations for urban transportation (e.g. tolls, bans) > Understanding and management of tariff and tax regulations becomes increasingly
decisive, particularly in Russia, India, Argentina (e.g. local content)
Low relevance High relevance
Example/cases
A Global trends in Automotive Road Logistics Market
5 Road_Logistics_for _Finished_Vehicles_India.pptx
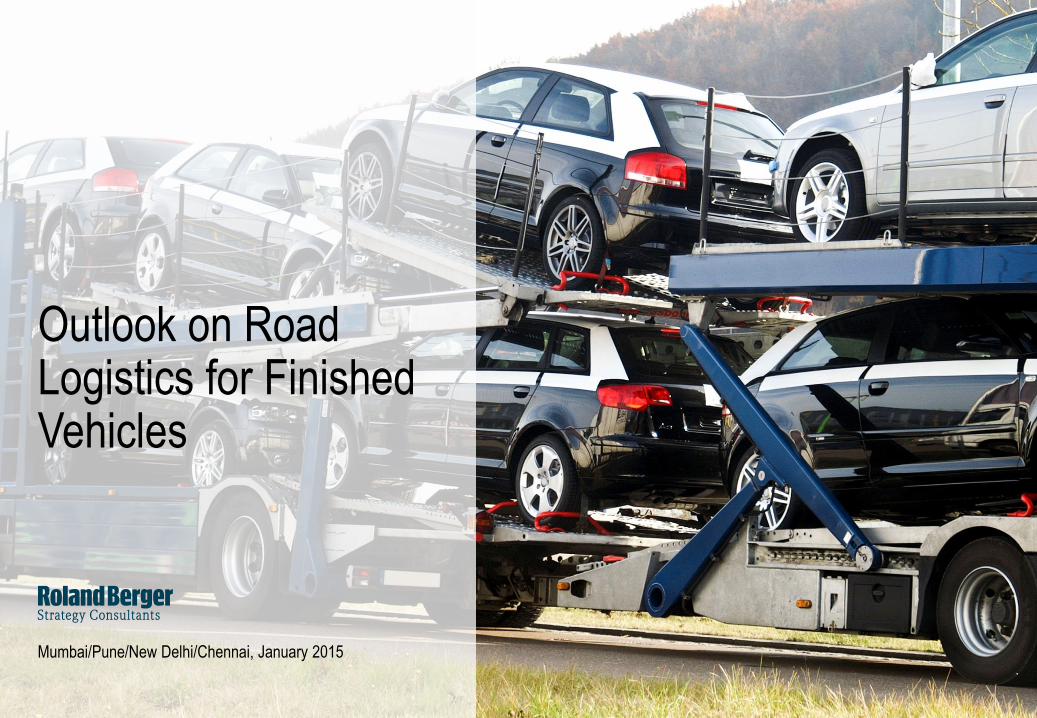
Customer requirements across industry sectors show that current pain points are driven by cost aspects or operational performance
"Pain-points"
1
2
3
4
5
12
14
15
13
Impact on logistics
Very important Not relevant Key sectors
Impact assessment across industry sectors
Source: Roland Berger; Interviews; Analysis
Complexity management
SC network optimization
SC standardization/modularization
Service level management
Supply chain risk management
LEAN organization
Process automation
Data-enabled processes
Return delivery management
10 Integrated planning/scheduling
7 Insourcing/Outsourcing
8 Supplier relationship management
9 3PL/4PL management
11 Route planning
6 Inventory management
Automotive Mechanical Chemical/Pharma Food & Beverage Electronics Metal processing Transportation/LSPs
A Global trends in Automotive Road Logistics Market
6 Road_Logistics_for _Finished_Vehicles_India.pptx
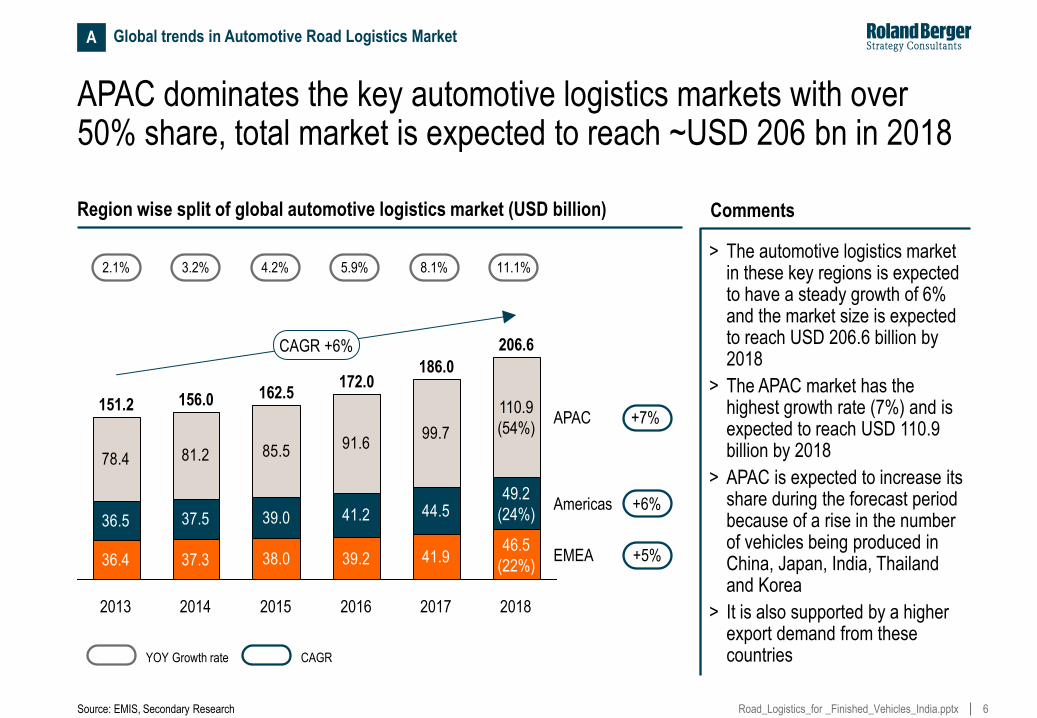
APAC dominates the key automotive logistics markets with over 50% share, total market is expected to reach ~USD 206 bn in 2018
Region wise split of global automotive logistics market (USD billion) Comments
11.1%
36.4 37.3 38.0 39.2 41.9
36.5 37.5 39.0 41.2 44.5
81.2 85.591.6
99.7
78.4
CAGR +6%
EMEA +5%
Americas +6%
APAC +7%
2018
206.6
46.5
(22%)
49.2
(24%)
110.9
(54%)
2017
186.0
2016
172.0
2015
162.5
2014
156.0
2013
151.2
Source: EMIS, Secondary Research
> The automotive logistics market in these key regions is expected to have a steady growth of 6% and the market size is expected to reach USD 206.6 billion by 2018
> The APAC market has the highest growth rate (7%) and is expected to reach USD 110.9 billion by 2018
> APAC is expected to increase its share during the forecast period because of a rise in the number of vehicles being produced in China, Japan, India, Thailand and Korea
> It is also supported by a higher export demand from these countries
2.1% 3.2% 4.2% 5.9% 8.1%
YOY Growth rate
A Global trends in Automotive Road Logistics Market
CAGR
7 Road_Logistics_for _Finished_Vehicles_India.pptx
90.5 94.7 101.5 110.5
65.5 67.870.9
75.5
Finished Vehicles +5%
Auto components +7%
2018
82.7
(40%)
123.9
(60%)
2017 2016 2015 2014 2013
63.7
(42%)
87.5
(58%)
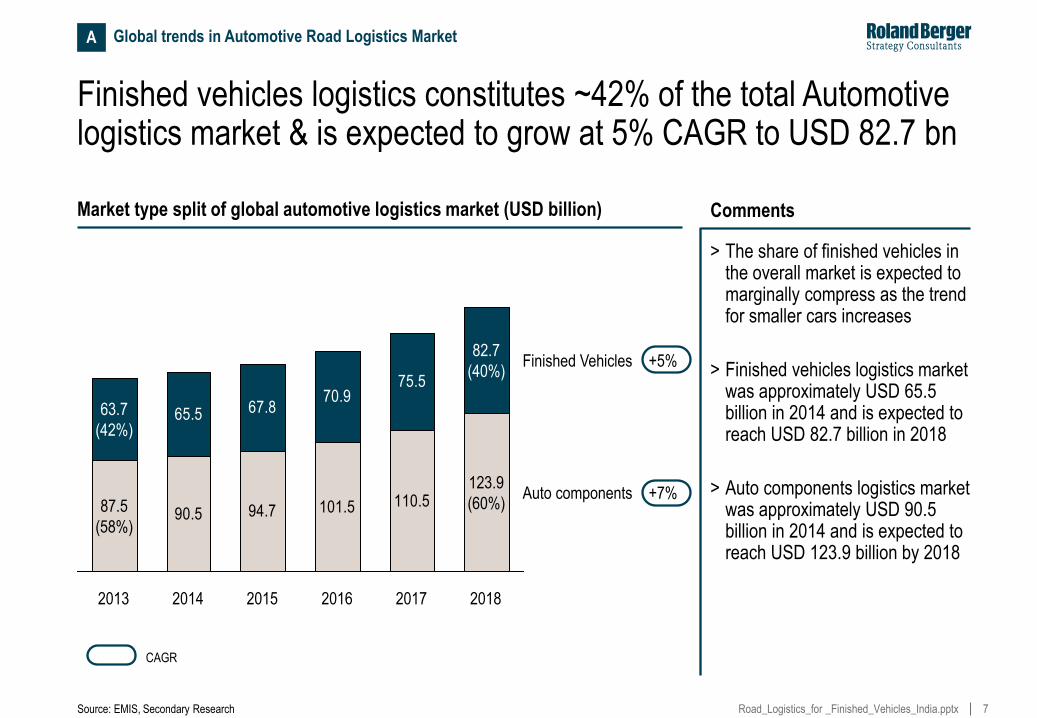
Finished vehicles logistics constitutes ~42% of the total Automotive logistics market & is expected to grow at 5% CAGR to USD 82.7 bn
Market type split of global automotive logistics market (USD billion) Comments
> The share of finished vehicles in the overall market is expected to marginally compress as the trend for smaller cars increases
> Finished vehicles logistics market was approximately USD 65.5 billion in 2014 and is expected to reach USD 82.7 billion in 2018
> Auto components logistics market was approximately USD 90.5 billion in 2014 and is expected to reach USD 123.9 billion by 2018
Source: EMIS, Secondary Research
A Global trends in Automotive Road Logistics Market
CAGR
9 Road_Logistics_for _Finished_Vehicles_India.pptx
B. Europe: A Benchmark in Logistics Competitiveness
10 Road_Logistics_for _Finished_Vehicles_India.pptx
10
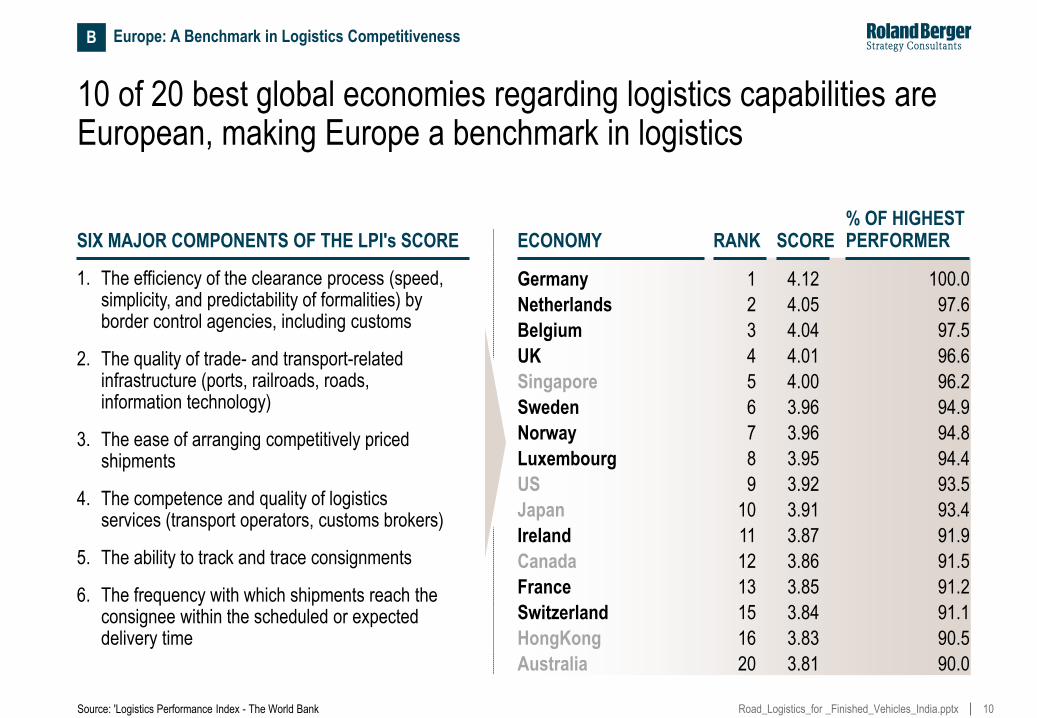
10 of 20 best global economies regarding logistics capabilities are European, making Europe a benchmark in logistics
Source: 'Logistics Performance Index - The World Bank
SIX MAJOR COMPONENTS OF THE LPI's SCORE
1. The efficiency of the clearance process (speed, simplicity, and predictability of formalities) by border control agencies, including customs
2. The quality of trade- and transport-related infrastructure (ports, railroads, roads, information technology)
3. The ease of arranging competitively priced shipments
4. The competence and quality of logistics services (transport operators, customs brokers)
5. The ability to track and trace consignments
6. The frequency with which shipments reach the consignee within the scheduled or expected delivery time
ECONOMY RANK SCORE % OF HIGHEST PERFORMER
Germany 1 4.12 100.0
Netherlands 2 4.05 97.6
Belgium 3 4.04 97.5
UK 4 4.01 96.6
Singapore 5 4.00 96.2
Sweden 6 3.96 94.9
Norway 7 3.96 94.8
Luxembourg 8 3.95 94.4
US 9 3.92 93.5
Japan 10 3.91 93.4
Ireland 11 3.87 91.9
Canada 12 3.86 91.5
France 13 3.85 91.2
Switzerland 15 3.84 91.1
HongKong 16 3.83 90.5
Australia 20 3.81 90.0
B Europe: A Benchmark in Logistics Competitiveness
11 Road_Logistics_for _Finished_Vehicles_India.pptx
11
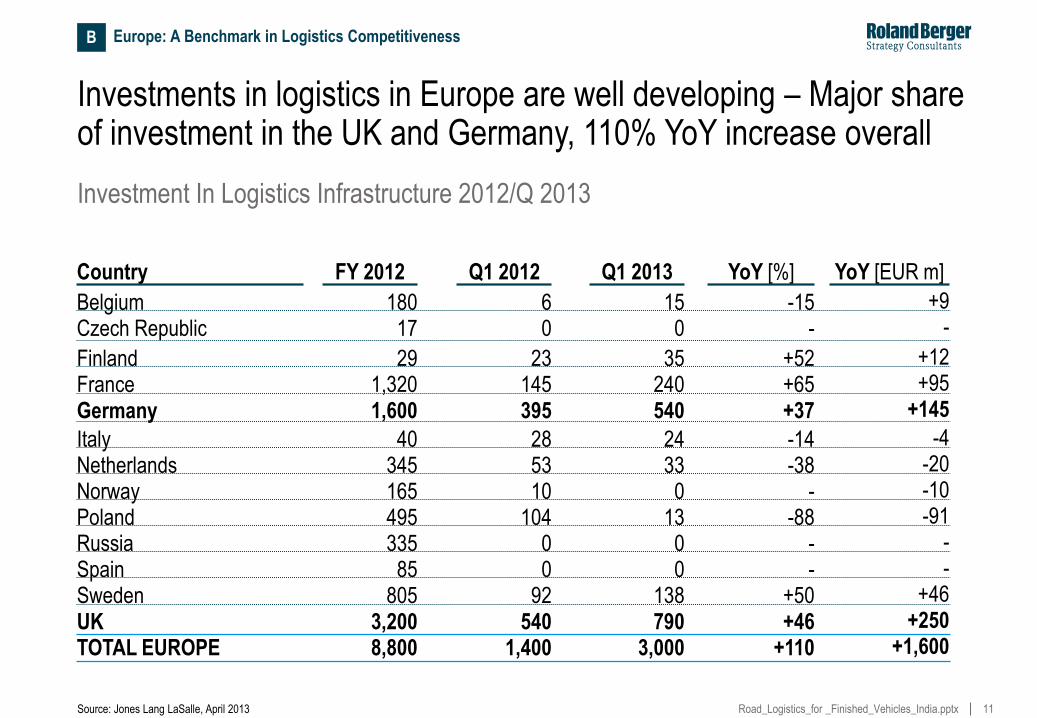
Investments in logistics in Europe are well developing – Major share of investment in the UK and Germany, 110% YoY increase overall
Source: Jones Lang LaSalle, April 2013
FY 2012 Q1 2012 Q1 2013 YoY [%] YoY [EUR m] Country
180 6 15 -15 +9 Belgium 17 0 0 - - Czech Republic
29 23 35 +52 +12 Finland 1,320 145 240 +65 +95 France 1,600 395 540 +37 +145 Germany
40 28 24 -14 -4 Italy 345 53 33 -38 -20 Netherlands 165 10 0 - -10 Norway 495 104 13 -88 -91 Poland 335 0 0 - - Russia
85 0 0 - - Spain 805 92 138 +50 +46 Sweden
3,200 540 790 +46 +250 UK 8,800 1,400 3,000 +110 +1,600 TOTAL EUROPE
Investment In Logistics Infrastructure 2012/Q 2013
B Europe: A Benchmark in Logistics Competitiveness
12 Road_Logistics_for _Finished_Vehicles_India.pptx
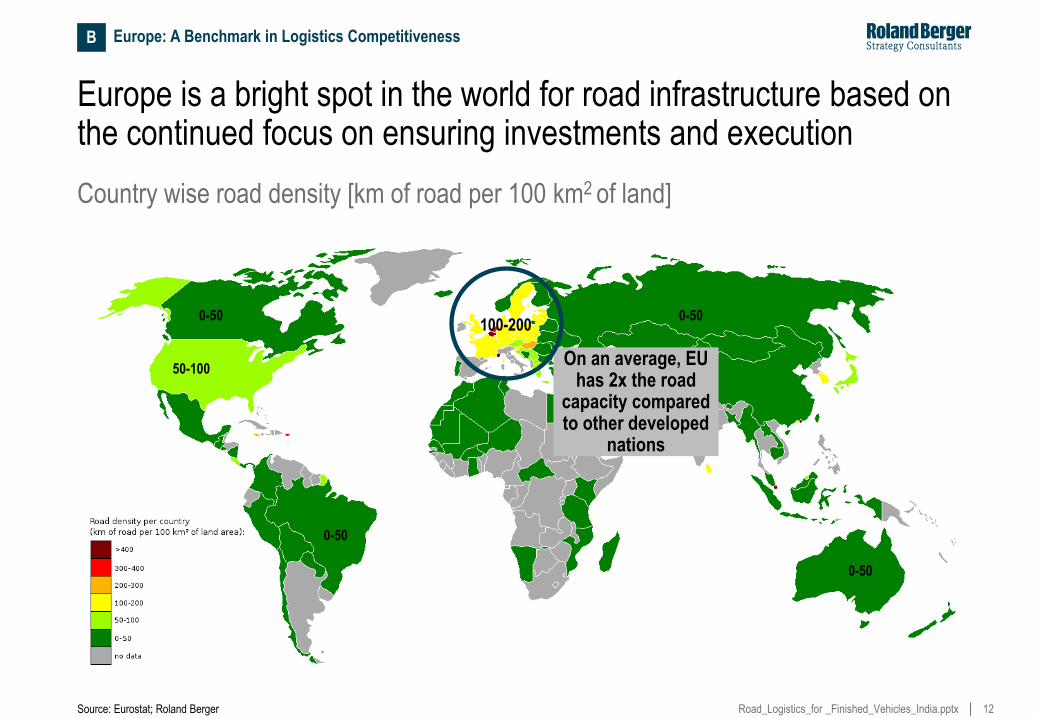
Europe is a bright spot in the world for road infrastructure based on the continued focus on ensuring investments and execution
On an average, EU has 2x the road
capacity compared to other developed
nations
Country wise road density [km of road per 100 km2 of land]
50-100
0-50 0-50
0-50
0-50
100-200
Source: Eurostat; Roland Berger
B Europe: A Benchmark in Logistics Competitiveness
13 Road_Logistics_for _Finished_Vehicles_India.pptx
13
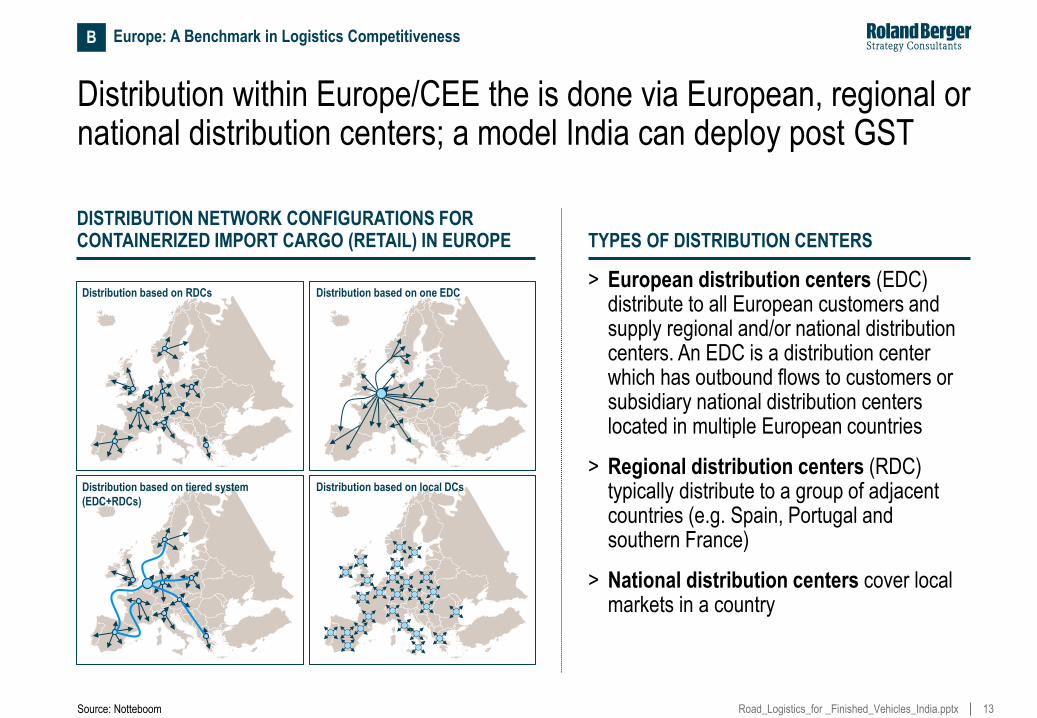
Distribution within Europe/CEE the is done via European, regional or national distribution centers; a model India can deploy post GST
Source: Notteboom
TYPES OF DISTRIBUTION CENTERS
> European distribution centers (EDC) distribute to all European customers and supply regional and/or national distribution centers. An EDC is a distribution center which has outbound flows to customers or subsidiary national distribution centers located in multiple European countries
> Regional distribution centers (RDC) typically distribute to a group of adjacent countries (e.g. Spain, Portugal and southern France)
> National distribution centers cover local markets in a country
DISTRIBUTION NETWORK CONFIGURATIONS FOR CONTAINERIZED IMPORT CARGO (RETAIL) IN EUROPE
Distribution based on RDCs
Distribution based on tiered system
(EDC+RDCs)
Distribution based on one EDC
Distribution based on local DCs
B Europe: A Benchmark in Logistics Competitiveness
14 Road_Logistics_for _Finished_Vehicles_India.pptx
14
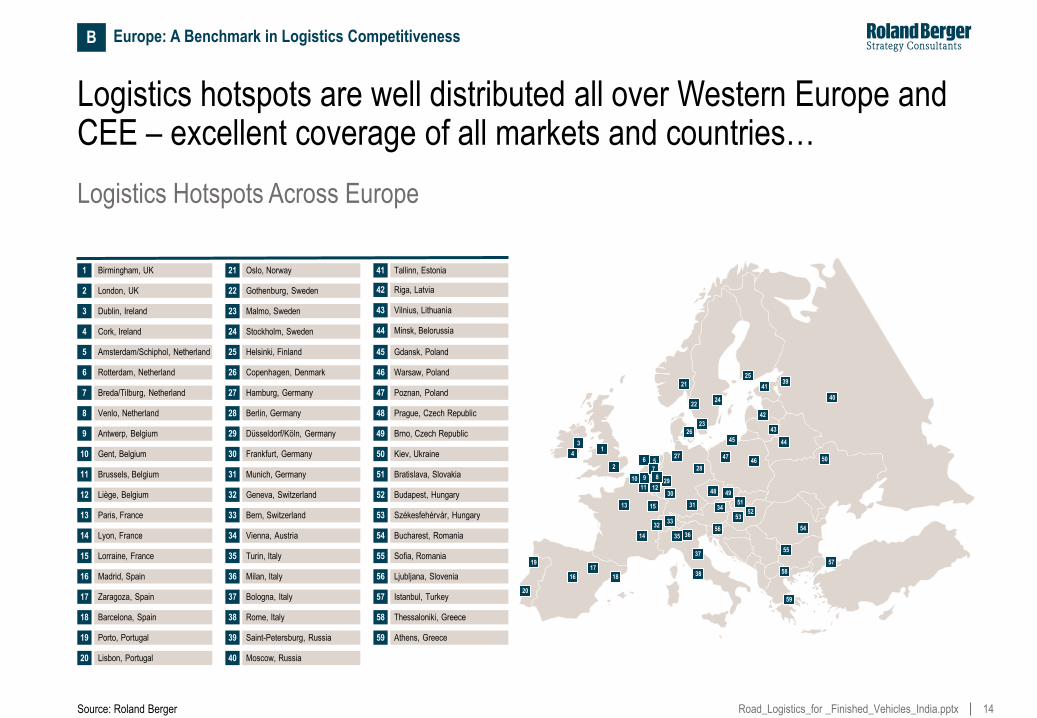
Logistics hotspots are well distributed all over Western Europe and CEE – excellent coverage of all markets and countries…
Source: Roland Berger
1 Birmingham, UK
2 London, UK
3 Dublin, Ireland
4 Cork, Ireland
5 Amsterdam/Schiphol, Netherland
6 Rotterdam, Netherland
7 Breda/Tilburg, Netherland
8 Venlo, Netherland
9 Antwerp, Belgium
11 Brussels, Belgium
12 Liège, Belgium
13 Paris, France
14 Lyon, France
15 Lorraine, France
16 Madrid, Spain
10 Gent, Belgium
17 Zaragoza, Spain
18 Barcelona, Spain
19 Porto, Portugal
20 Lisbon, Portugal
21 Oslo, Norway
22 Gothenburg, Sweden
23 Malmo, Sweden
24 Stockholm, Sweden
25 Helsinki, Finland
26 Copenhagen, Denmark
27 Hamburg, Germany
28 Berlin, Germany
29 Düsseldorf/Köln, Germany
31 Munich, Germany
32 Geneva, Switzerland
33 Bern, Switzerland
34 Vienna, Austria
35 Turin, Italy
36 Milan, Italy
30 Frankfurt, Germany
37 Bologna, Italy
38 Rome, Italy
39 Saint-Petersburg, Russia
40 Moscow, Russia
42 Riga, Latvia
43 Vilnius, Lithuania
44 Minsk, Belorussia
45 Gdansk, Poland
46 Warsaw, Poland
47 Poznan, Poland
48 Prague, Czech Republic
49 Brno, Czech Republic
51 Bratislava, Slovakia
52 Budapest, Hungary
53 Székesfehérvár, Hungary
54 Bucharest, Romania
55 Sofia, Romania
56 Ljubljana, Slovenia
50 Kiev, Ukraine
57 Istanbul, Turkey
58 Thessaloniki, Greece
59 Athens, Greece
41 Tallinn, Estonia
20
19
16
17
18
4
3 1
2
27
28
38
37
36 35
32 33
56 14
13 15
30
29 12 11
10 9
6 5
7
8
26
23
22
21
31
25
41
42
45
47 46
48 49
34
53 52
51
43
44
50
39
40
54
58
59
57
55
24
Logistics Hotspots Across Europe
B Europe: A Benchmark in Logistics Competitiveness
15 Road_Logistics_for _Finished_Vehicles_India.pptx
20
19
16
17
18
4
3 1
2
27
28
38
37
36 35
32 33
56 14
13 15
30
29 12 11
10 9
6 5
7
8
26
23
22
21
31
25
41
42
45
47 46
48 49
34
53 52
51
43
44
50
39
40
54
58
59
57
55
24
15
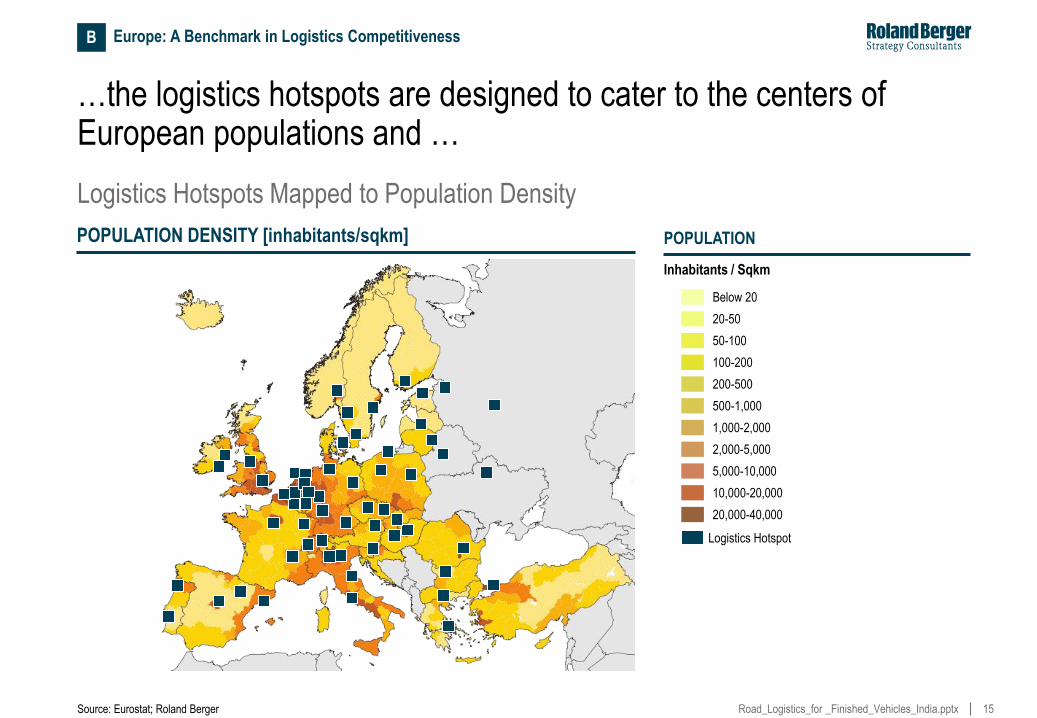
…the logistics hotspots are designed to cater to the centers of European populations and …
Source: Eurostat; Roland Berger
POPULATION
Inhabitants / Sqkm
Below 20
20-50
50-100
100-200
200-500
500-1,000
1,000-2,000
2,000-5,000
5,000-10,000
10,000-20,000
20,000-40,000
POPULATION DENSITY [inhabitants/sqkm]
Logistics Hotspots Mapped to Population Density
40 Logistics Hotspot
B Europe: A Benchmark in Logistics Competitiveness
16 Road_Logistics_for _Finished_Vehicles_India.pptx
16
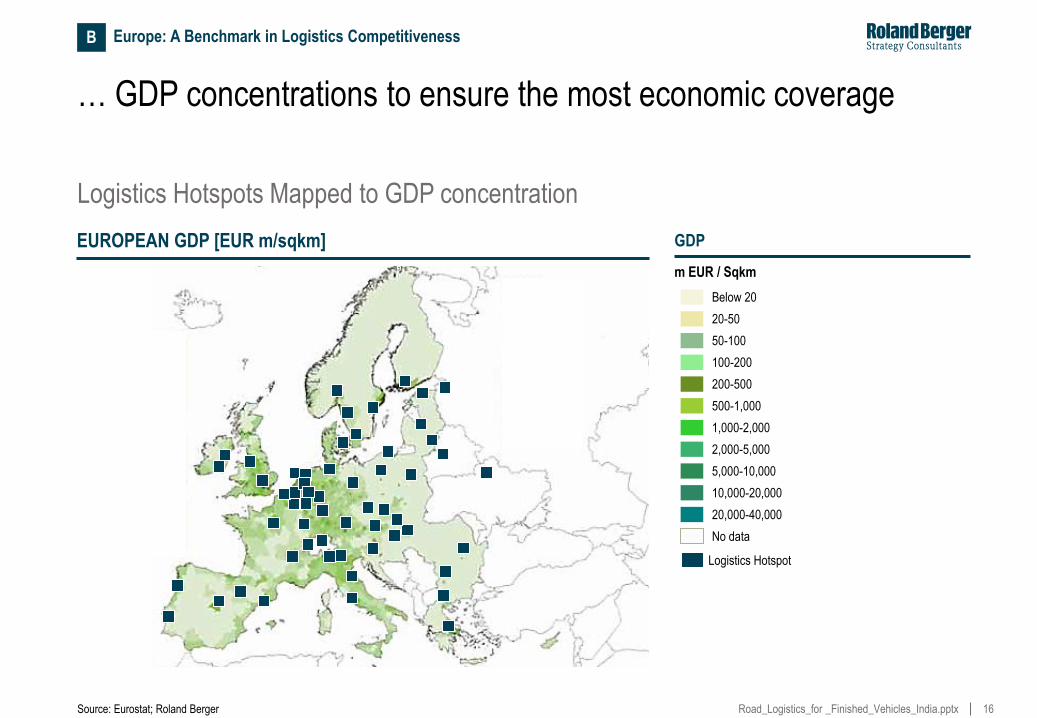
… GDP concentrations to ensure the most economic coverage
Source: Eurostat; Roland Berger
GDP
m EUR / Sqkm
Below 20
20-50
50-100
100-200
200-500
500-1,000
1,000-2,000
2,000-5,000
5,000-10,000
10,000-20,000
20,000-40,000
No data
EUROPEAN GDP [EUR m/sqkm]
20
19
16
17
18
4
3 1
2
27
28
38
37
36 35
32 33
56 14
13 15
30
29 12 11
10 9
6 5
7
8
26
23
22
21
31
25
41
42
45
47 46
48 49
34
53 52
51
43
44
50
39
54
58
59
55
24
Logistics Hotspots Mapped to GDP concentration
40 Logistics Hotspot
B Europe: A Benchmark in Logistics Competitiveness

17 Road_Logistics_for _Finished_Vehicles_India.pptx
17
Looking at the latest GDP and retail sales forecasts per capita, the current set-up already fits to future developments
Source: DTZ Research; Roland Berger
GDP GROWTH [%] RETAIL SALES PER CAPITA ANNUAL FORECAST GROWTH 2013-2018 [%]
Albania
Belgium
Bosnia and Herzegovina Bulgaria
Denmark
Germany
Estonia
Finland
France
Greece
United Kingdom
Ireland
Italy
Serbia Croatia
Latvia
Lithuania
Luxembourg
Macedonia
Moldova
Netherlands
Norway
Austria
Poland
Portugal
Romania
Russia
Sweden
Switzerland
Slovakia
Slovenia
Spain
Czech Republik
Turkey
Ukraine
Hungary
Belarus
Montenegro
Malta
Cyprus
-6.1%-0.0% 0.0%-1.0% 1.0%-2.0% 2.0%-3.7% No data
Albania
Belgium
Bosnia and Herzegovina Bulgaria
Denmark
Germany
Estonia
Finland
France
Greece
United Kingdom
Ireland
Italy
Serbia Croatia
Latvia
Lithuania
Luxembourg
Macedonia
Moldova
Netherlands
Norway
Austria
Poland
Portugal
Romania
Russia
Sweden
Switzerland
Slovakia
Slovenia
Spain
Czech Republik
Turkey
Ukraine
Hungary
Belarus
Montenegro
Malta
Cyprus
Retail sales per capita in 2013 (kEUR) 1
5
10
20
19
16
17
18
4
3 1
2
27
28
38
37
36 35
32 33
56 14
13 15
30
29 12 11
10 9
6 5 7
8
26 23
22
21
31
25
41
42
45
47 46
48 49
34
53 52
51
43
44
50
39
40
54
58
59
57
55
24
40 Logistics Hotspot
B Europe: A Benchmark in Logistics Competitiveness
18 Road_Logistics_for _Finished_Vehicles_India.pptx
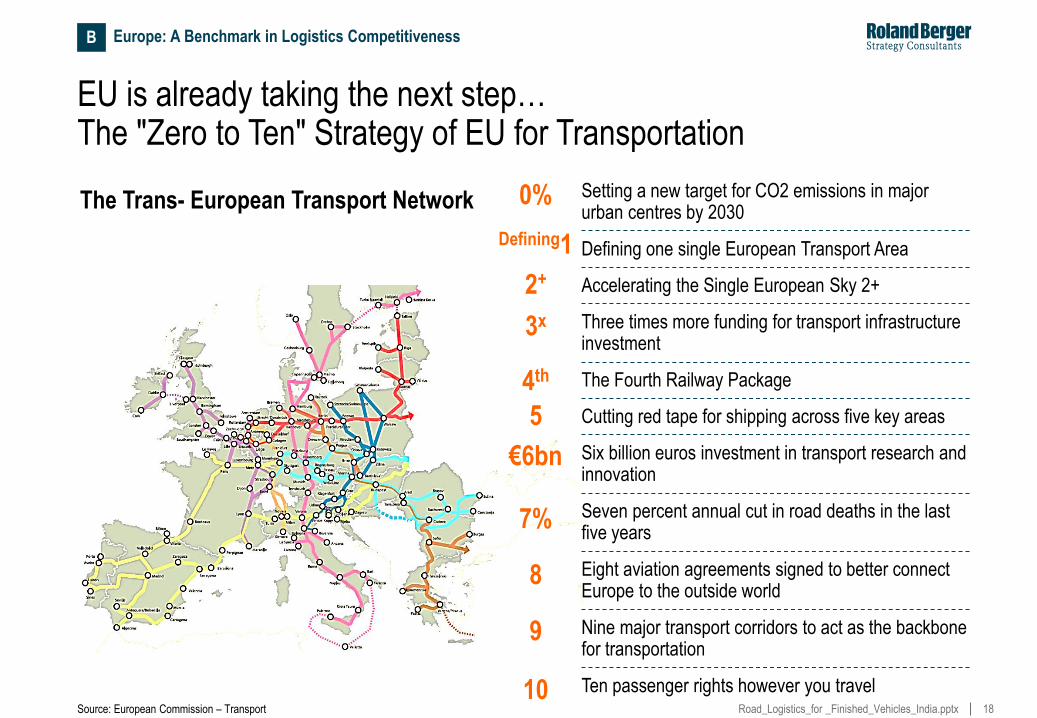
EU is already taking the next step… The "Zero to Ten" Strategy of EU for Transportation
0% Setting a new target for CO2 emissions in major urban centres by 2030
Defining1 Defining one single European Transport Area
2+ Accelerating the Single European Sky 2+
3x Three times more funding for transport infrastructure investment
4th The Fourth Railway Package
5 Cutting red tape for shipping across five key areas
€6bn Six billion euros investment in transport research and innovation
7% Seven percent annual cut in road deaths in the last five years
8 Eight aviation agreements signed to better connect Europe to the outside world
9 Nine major transport corridors to act as the backbone for transportation
10 Ten passenger rights however you travel
The Trans- European Transport Network
Source: European Commission – Transport
B Europe: A Benchmark in Logistics Competitiveness

19 Road_Logistics_for _Finished_Vehicles_India.pptx
Let's take a deeper look at 3 key strategies, relevant for this forum…
Defining1
0% Setting a new target for CO2 emissions in major urban centres by 2030
Defining one single European Transport Area
2+ Accelerating the Single European Sky 2+
3x Three times more funding for transport infrastructure investment
4th The Fourth Railway Package
5 Cutting red tape for shipping across 5 key areas
€6bn Six billion euros investment in transport research and innovation
7% Seven percent annual cut in road deaths in the last five years
8 Eight aviation agreements signed to better connect Europe to the outside world
9 Nine major transport corridors to act as the backbone for transportation
10 Ten passenger rights however you travel
The Trans- European Transport Network
Source: European Commission – Transport
B Europe: A Benchmark in Logistics Competitiveness

20 Road_Logistics_for _Finished_Vehicles_India.pptx
Strategy "x3" focusses on three times the funding for transport infrastructure in EU between 2014 and 2020
Strategy "x3"
> The Connecting Europe Facility, agreed by the EU in 2013, is a dedicated infrastructure fund for transport, energy and telecommunications in the EU’s seven-year budget programme up to 2020
> EU is increasing its financing for transport infrastructure by 3x to to €26 billion as a complement to the national investments for developing the TEN-T
> This funding will focus on building the network’s nine major transport corridors, filling in missing cross-border links and removing barriers
> The national investments of EUR ~250 bn are committed by member states toward the intra country completion of the TEN-T network
EU Infrastructure Funds
Euro billion (2007-2013)
Euro billion (2014-2020)
National investments committed to Infrastructure by member states till 2020
Source: European Commission – Transport
26 8
Euro
250 billion
B Europe: A Benchmark in Logistics Competitiveness
21 Road_Logistics_for _Finished_Vehicles_India.pptx
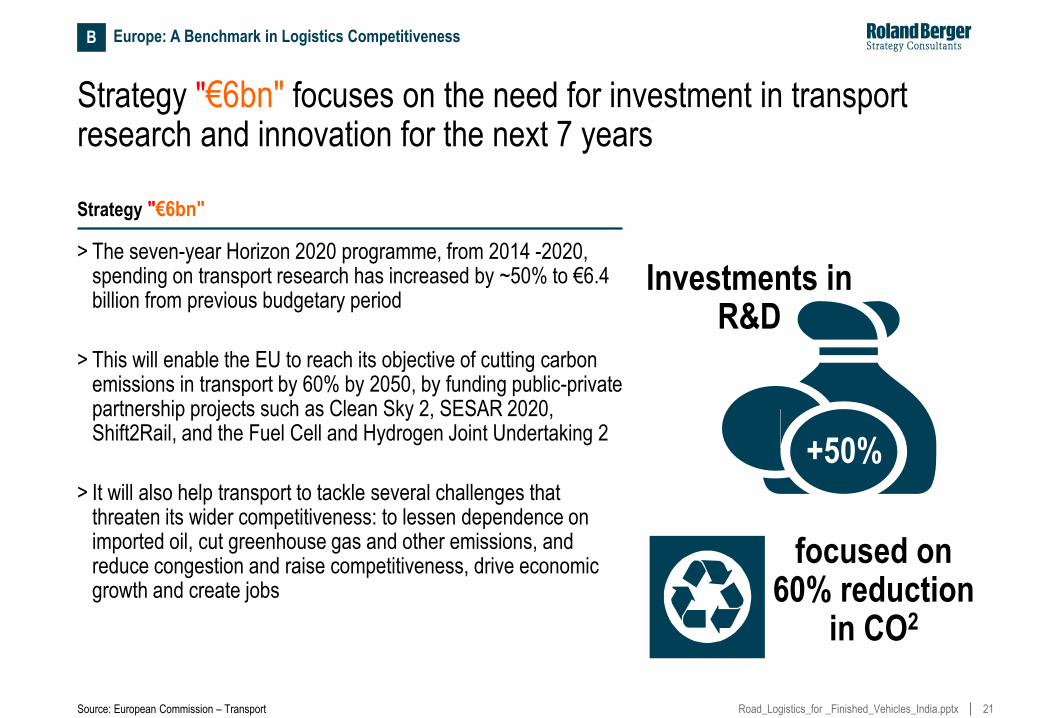
Strategy "€6bn" focuses on the need for investment in transport research and innovation for the next 7 years
Strategy "€6bn"
> The seven-year Horizon 2020 programme, from 2014 -2020, spending on transport research has increased by ~50% to €6.4 billion from previous budgetary period
> This will enable the EU to reach its objective of cutting carbon emissions in transport by 60% by 2050, by funding public-private partnership projects such as Clean Sky 2, SESAR 2020, Shift2Rail, and the Fuel Cell and Hydrogen Joint Undertaking 2
> It will also help transport to tackle several challenges that threaten its wider competitiveness: to lessen dependence on imported oil, cut greenhouse gas and other emissions, and reduce congestion and raise competitiveness, drive economic growth and create jobs
Source: European Commission – Transport
+50%
Investments in R&D
focused on 60% reduction
in CO2
B Europe: A Benchmark in Logistics Competitiveness
22 Road_Logistics_for _Finished_Vehicles_India.pptx
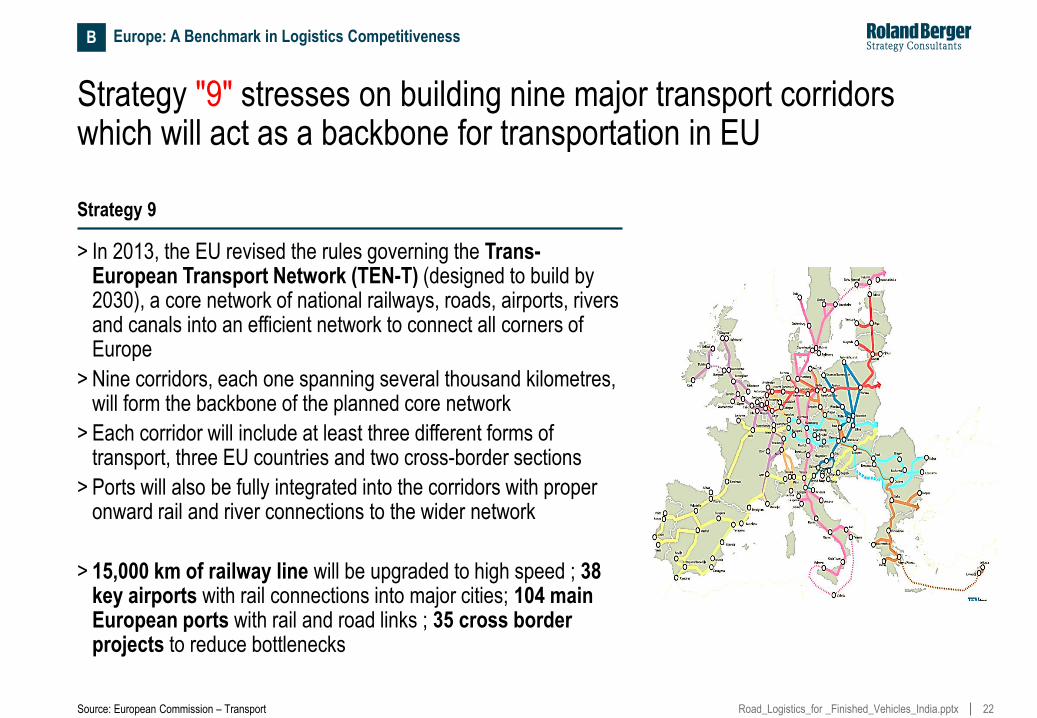
Strategy "9" stresses on building nine major transport corridors which will act as a backbone for transportation in EU
Strategy 9
> In 2013, the EU revised the rules governing the Trans-European Transport Network (TEN-T) (designed to build by 2030), a core network of national railways, roads, airports, rivers and canals into an efficient network to connect all corners of Europe
> Nine corridors, each one spanning several thousand kilometres, will form the backbone of the planned core network
> Each corridor will include at least three different forms of transport, three EU countries and two cross-border sections
> Ports will also be fully integrated into the corridors with proper onward rail and river connections to the wider network
> 15,000 km of railway line will be upgraded to high speed ; 38 key airports with rail connections into major cities; 104 main European ports with rail and road links ; 35 cross border projects to reduce bottlenecks
Source: European Commission – Transport
B Europe: A Benchmark in Logistics Competitiveness
23 Road_Logistics_for _Finished_Vehicles_India.pptx
C. India Landscape for Automotive Logistics
24 Road_Logistics_for _Finished_Vehicles_India.pptx
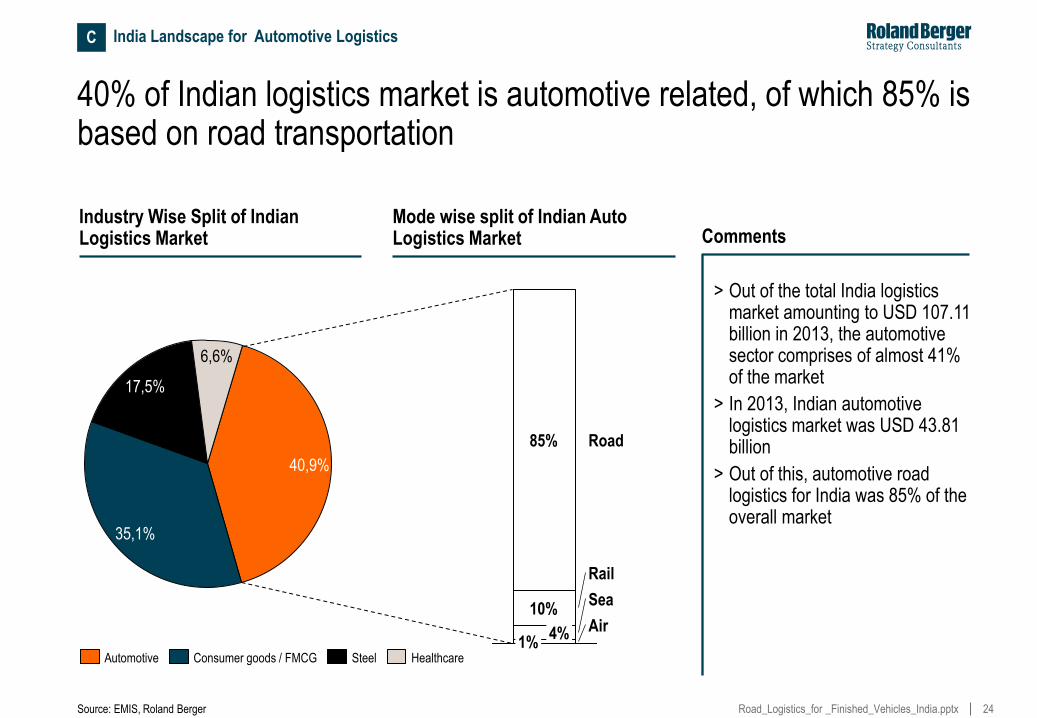
40% of Indian logistics market is automotive related, of which 85% is based on road transportation
6,6%
17,5%
35,1%
40,9%
Healthcare Steel Consumer goods / FMCG Automotive
Rail
Air
Sea
Road
1% 4%
10%
85%
Comments
> Out of the total India logistics market amounting to USD 107.11 billion in 2013, the automotive sector comprises of almost 41% of the market
> In 2013, Indian automotive logistics market was USD 43.81 billion
> Out of this, automotive road logistics for India was 85% of the overall market
Industry Wise Split of Indian Logistics Market
Mode wise split of Indian Auto Logistics Market
Source: EMIS, Roland Berger
C India Landscape for Automotive Logistics
25 Road_Logistics_for _Finished_Vehicles_India.pptx
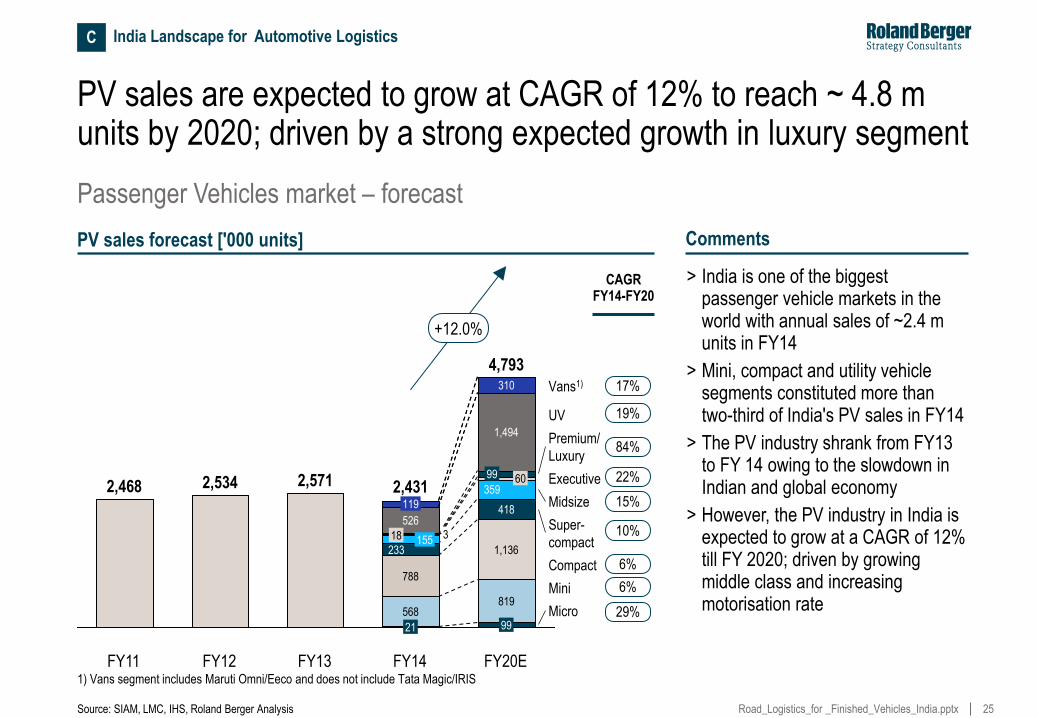
PV sales are expected to grow at CAGR of 12% to reach ~ 4.8 m units by 2020; driven by a strong expected growth in luxury segment
FY12
2,534
FY11
2,468
FY20E
4,793
99
819
1,136
418
359 60 99
1,494
310
FY14
2,431
21
568
788
233 155 18 3
2,571
119
FY13
+12.0%
Micro
Mini
Compact
526
Midsize
Executive
Premium/
Luxury
UV
Vans1)
Super-
compact
PV sales forecast ['000 units]
Source: SIAM, LMC, IHS, Roland Berger Analysis
29%
6%
6%
10%
15%
84%
19%
17%
22%
CAGR FY14-FY20
Passenger Vehicles market – forecast
1) Vans segment includes Maruti Omni/Eeco and does not include Tata Magic/IRIS
Comments
> India is one of the biggest passenger vehicle markets in the world with annual sales of ~2.4 m units in FY14
> Mini, compact and utility vehicle segments constituted more than two-third of India's PV sales in FY14
> The PV industry shrank from FY13 to FY 14 owing to the slowdown in Indian and global economy
> However, the PV industry in India is expected to grow at a CAGR of 12% till FY 2020; driven by growing middle class and increasing motorisation rate
C India Landscape for Automotive Logistics
26 Road_Logistics_for _Finished_Vehicles_India.pptx
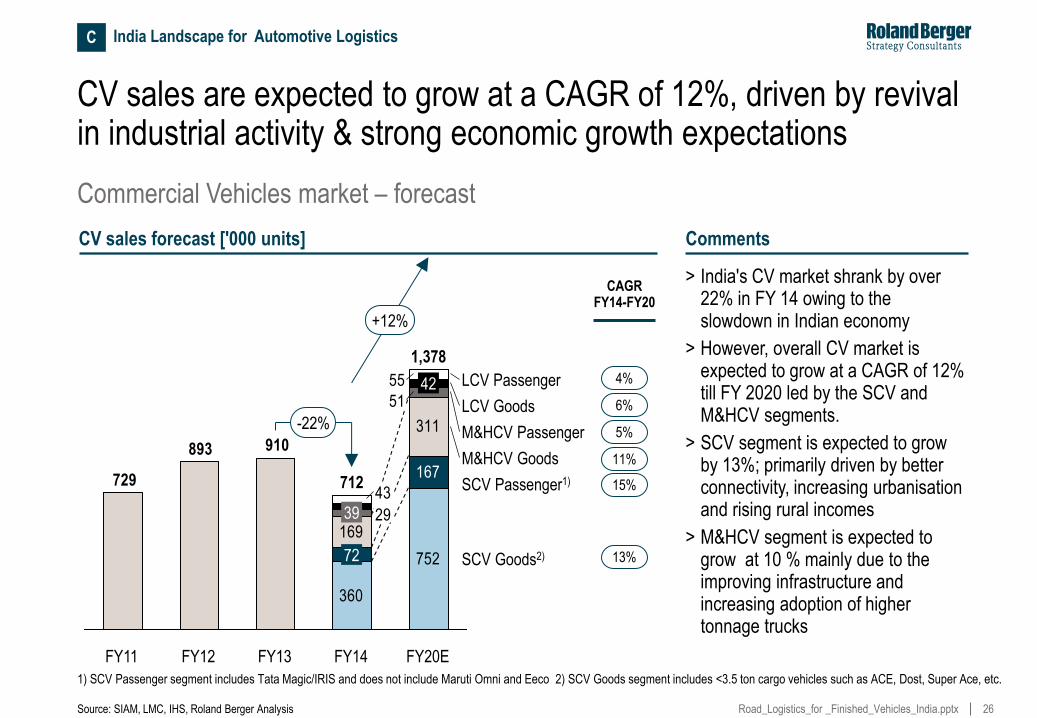
CV sales are expected to grow at a CAGR of 12%, driven by revival in industrial activity & strong economic growth expectations
CV sales forecast ['000 units]
910893
729
752
360
167
311
169
51
29
55
43
39
FY13 FY12 FY11
-22%
+12%
SCV Goods2)
SCV Passenger1)
M&HCV Goods
M&HCV Passenger
LCV Goods
LCV Passenger
FY20E
1,378
42
FY14
712
72
Comments
> India's CV market shrank by over 22% in FY 14 owing to the slowdown in Indian economy
> However, overall CV market is expected to grow at a CAGR of 12% till FY 2020 led by the SCV and M&HCV segments.
> SCV segment is expected to grow by 13%; primarily driven by better connectivity, increasing urbanisation and rising rural incomes
> M&HCV segment is expected to grow at 10 % mainly due to the improving infrastructure and increasing adoption of higher tonnage trucks
Source: SIAM, LMC, IHS, Roland Berger Analysis
Commercial Vehicles market – forecast
13%
6%
4%
CAGR FY14-FY20
11%
1) SCV Passenger segment includes Tata Magic/IRIS and does not include Maruti Omni and Eeco 2) SCV Goods segment includes <3.5 ton cargo vehicles such as ACE, Dost, Super Ace, etc.
5%
15%
C India Landscape for Automotive Logistics
27 Road_Logistics_for _Finished_Vehicles_India.pptx
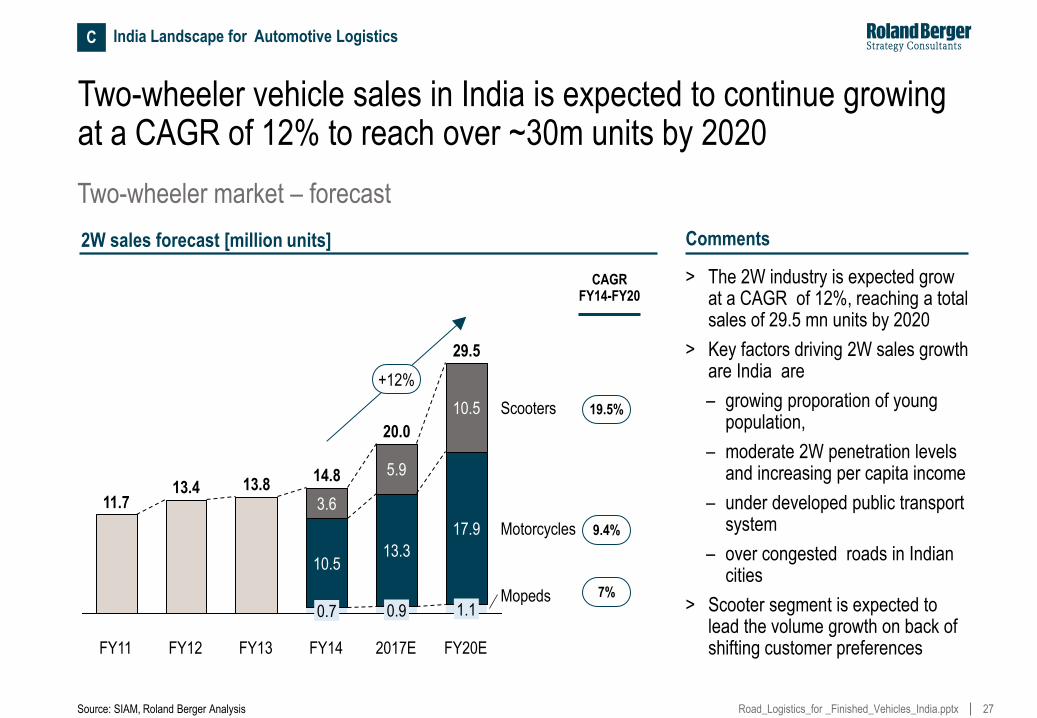
Two-wheeler vehicle sales in India is expected to continue growing at a CAGR of 12% to reach over ~30m units by 2020
Source: SIAM, Roland Berger Analysis
+12%
Mopeds
Motorcycles
Scooters
FY20E
29.5
1.1
17.9
10.5
2017E
0.9
13.3
5.9
FY14
14.8
0.7
10.5
3.6
FY13
13.8
FY12
13.4
FY11
11.7
20.0
> The 2W industry is expected grow at a CAGR of 12%, reaching a total sales of 29.5 mn units by 2020
> Key factors driving 2W sales growth are India are
– growing proporation of young population,
– moderate 2W penetration levels and increasing per capita income
– under developed public transport system
– over congested roads in Indian cities
> Scooter segment is expected to lead the volume growth on back of shifting customer preferences
2W sales forecast [million units]
Two-wheeler market – forecast
19.5%
9.4%
7%
CAGR FY14-FY20
Comments
C India Landscape for Automotive Logistics
28 Road_Logistics_for _Finished_Vehicles_India.pptx
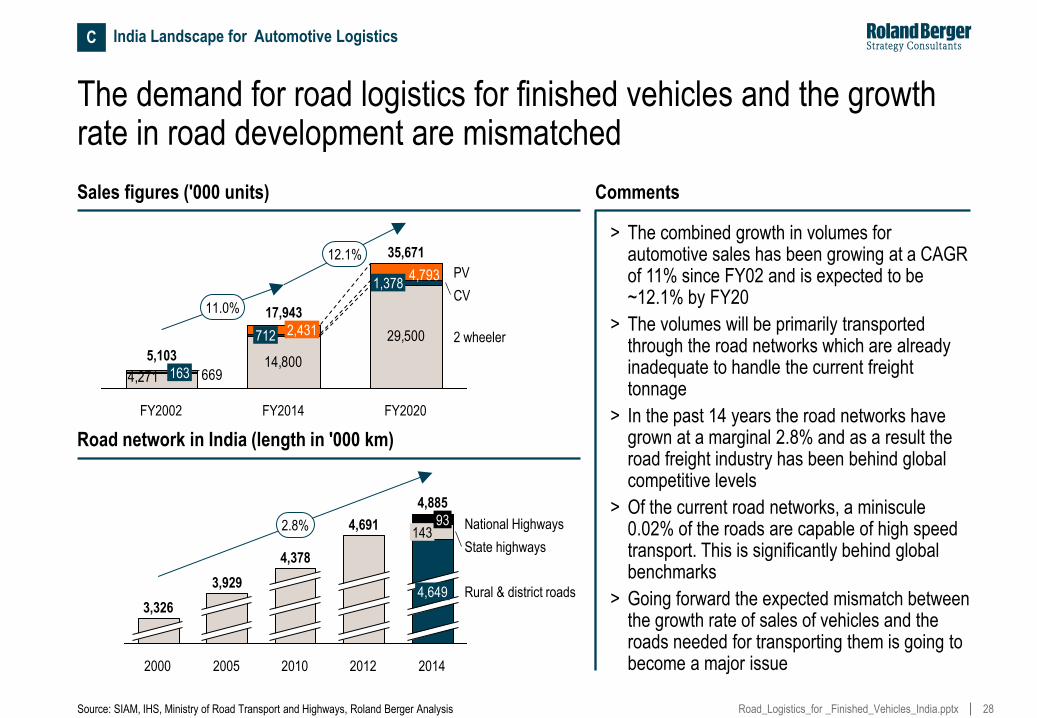
The demand for road logistics for finished vehicles and the growth rate in road development are mismatched
4,27114,800
29,500
4,793
669
11.0%
2 wheeler
CV
PV
FY2020
35,671
1,378
FY2014
17,943
712 2,431
FY2002
5,103
163
12.1%
Sales figures ('000 units) Comments
> The combined growth in volumes for automotive sales has been growing at a CAGR of 11% since FY02 and is expected to be ~12.1% by FY20
> The volumes will be primarily transported through the road networks which are already inadequate to handle the current freight tonnage
> In the past 14 years the road networks have grown at a marginal 2.8% and as a result the road freight industry has been behind global competitive levels
> Of the current road networks, a miniscule 0.02% of the roads are capable of high speed transport. This is significantly behind global benchmarks
> Going forward the expected mismatch between the growth rate of sales of vehicles and the roads needed for transporting them is going to become a major issue
Source: SIAM, IHS, Ministry of Road Transport and Highways, Roland Berger Analysis
Road network in India (length in '000 km)
2.8%
Rural & district roads
State highways
National Highways
2014
4,885
4,649
143 93
2012
4,691
2010
4,378
2005
3,929
2000
3,326
C India Landscape for Automotive Logistics
29 Road_Logistics_for _Finished_Vehicles_India.pptx
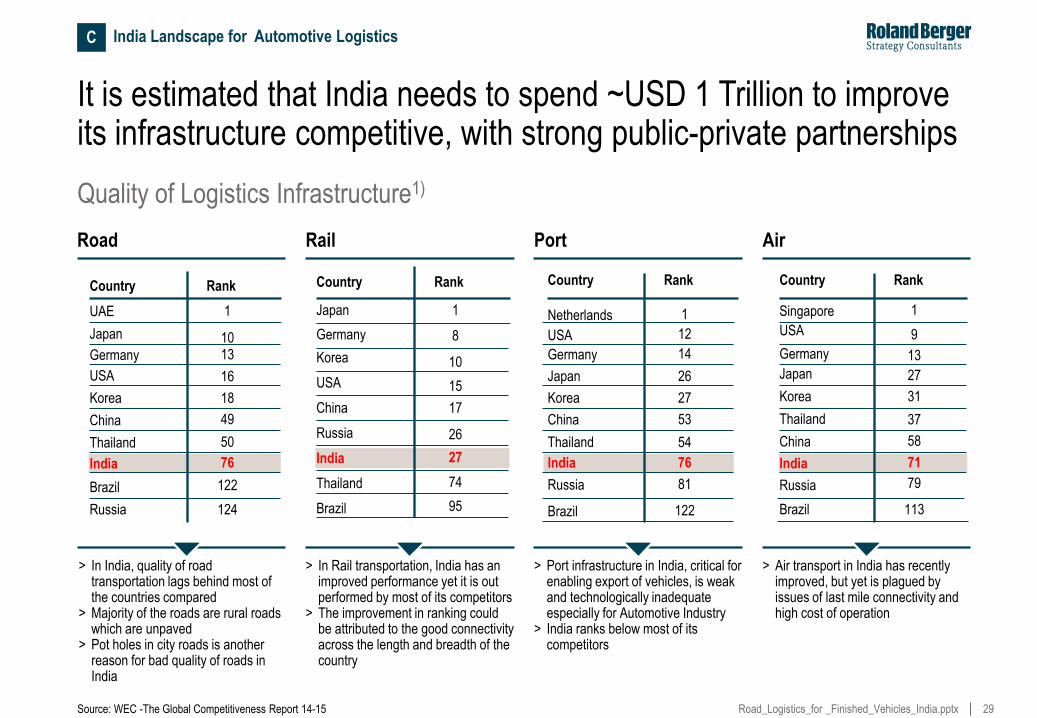
It is estimated that India needs to spend ~USD 1 Trillion to improve its infrastructure competitive, with strong public-private partnerships
Source: WEC -The Global Competitiveness Report 14-15
Quality of Logistics Infrastructure1)
> In India, quality of road transportation lags behind most of the countries compared
> Majority of the roads are rural roads which are unpaved
> Pot holes in city roads is another reason for bad quality of roads in India
> In Rail transportation, India has an improved performance yet it is out performed by most of its competitors
> The improvement in ranking could be attributed to the good connectivity across the length and breadth of the country
> Port infrastructure in India, critical for enabling export of vehicles, is weak and technologically inadequate especially for Automotive Industry
> India ranks below most of its competitors
> Air transport in India has recently improved, but yet is plagued by issues of last mile connectivity and high cost of operation
C India Landscape for Automotive Logistics
Japan 1
Korea
USA
China
Russia
India
Thailand
Brazil
10
15
17
26
27
74
95
Country Rank
Netherlands 1
USA
Japan
Korea
China
Thailand
India
Russia
Brazil
12
26
27
53
54
76
81
122
Country Rank
Road Rail Port Air
UAE 1
Japan
USA
Korea
China
Thailand
India
Brazil
Russia
10
16
18
49
50
76
122
124
Country Rank
Germany 13
Germany 8
Germany 14
Singapore 1
USA
Japan
Korea
Thailand
China
India
Russia
Brazil
9
27
31
37
58
71
79
113
Country Rank
Germany 13
30 Road_Logistics_for _Finished_Vehicles_India.pptx
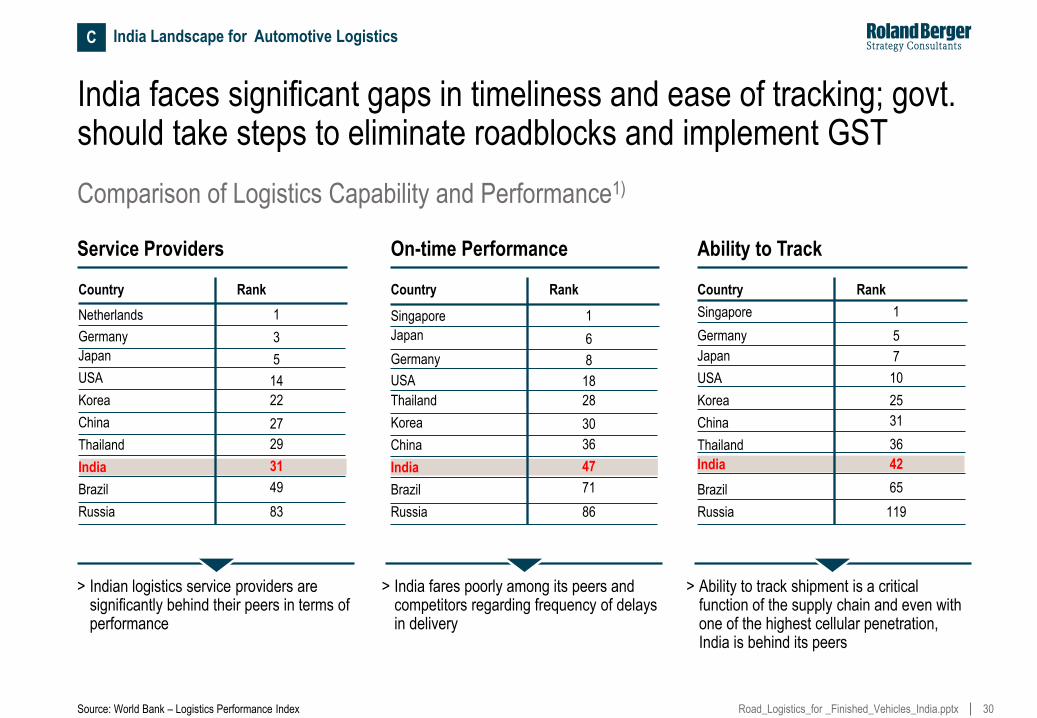
India faces significant gaps in timeliness and ease of tracking; govt. should take steps to eliminate roadblocks and implement GST
Source: World Bank – Logistics Performance Index
Comparison of Logistics Capability and Performance1)
> Indian logistics service providers are significantly behind their peers in terms of performance
> India fares poorly among its peers and competitors regarding frequency of delays in delivery
> Ability to track shipment is a critical function of the supply chain and even with one of the highest cellular penetration, India is behind its peers
C India Landscape for Automotive Logistics
Service Providers On-time Performance Ability to Track
Netherlands 1
Japan
USA
Korea
China
Thailand
India
Brazil
Russia
5
14
22
27
29
31
49
83
Country Rank
Singapore 1
Japan
USA
Thailand
Korea
China
India
Brazil
Russia
6
18
28
30
36
47
71
86
Country Rank
Singapore 1
Japan
USA
Korea
China
Thailand
India
Brazil
Russia
7
10
25
31
36
42
65
119
Country Rank
Germany 3
Germany 8
Germany 5
31 Road_Logistics_for _Finished_Vehicles_India.pptx
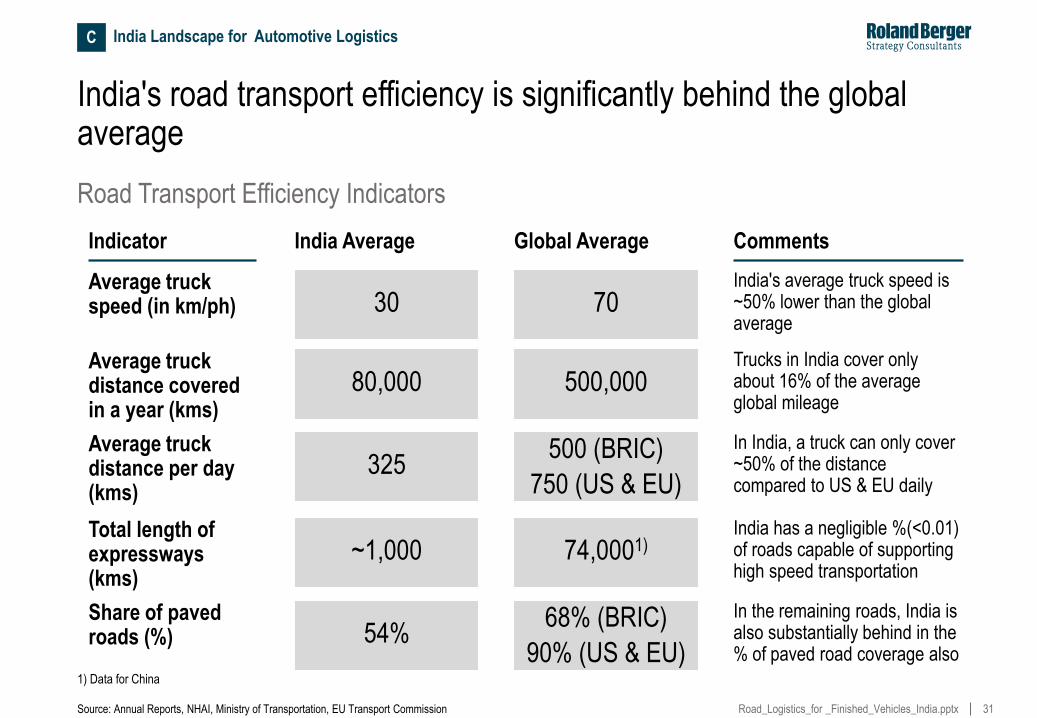
India's road transport efficiency is significantly behind the global average
Road Transport Efficiency Indicators
Indicator
Average truck speed (in km/ph)
India Average Global Average Comments
India's average truck speed is ~50% lower than the global average
30 70
Source: Annual Reports, NHAI, Ministry of Transportation, EU Transport Commission
Average truck distance covered in a year (kms)
Trucks in India cover only about 16% of the average global mileage
80,000 500,000
Total length of expressways (kms)
India has a negligible %(<0.01) of roads capable of supporting high speed transportation
~1,000 74,0001)
Average truck distance per day (kms)
In India, a truck can only cover ~50% of the distance compared to US & EU daily
325 500 (BRIC)
750 (US & EU)
Share of paved roads (%)
In the remaining roads, India is also substantially behind in the % of paved road coverage also
54% 68% (BRIC)
90% (US & EU)
C India Landscape for Automotive Logistics
1) Data for China
32 Road_Logistics_for _Finished_Vehicles_India.pptx
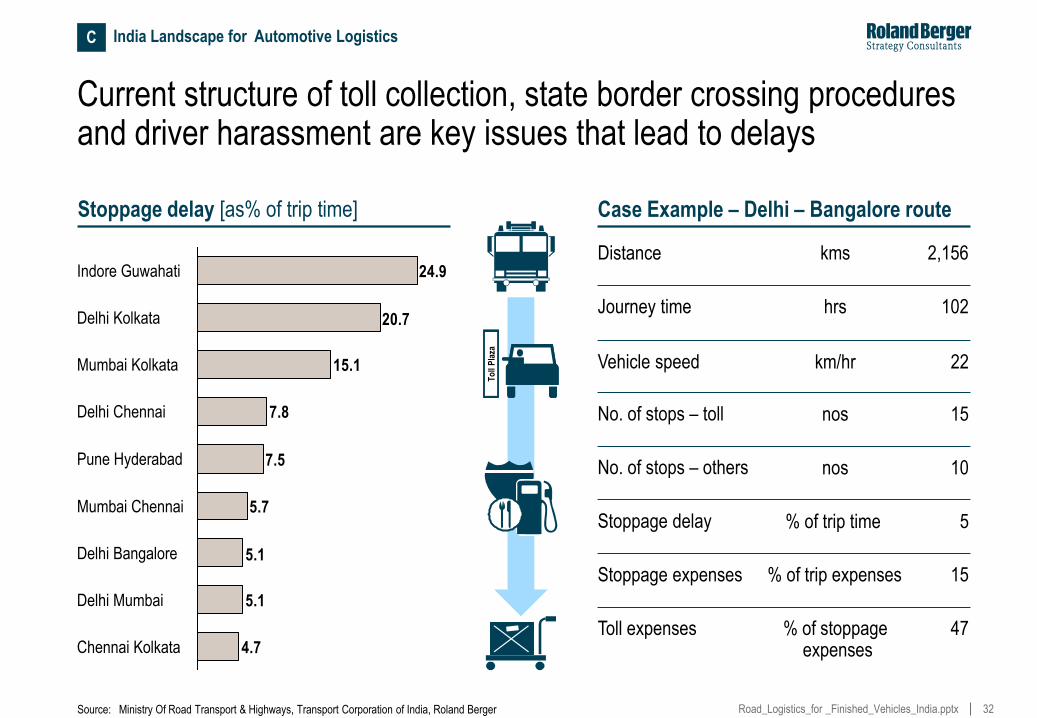
Current structure of toll collection, state border crossing procedures and driver harassment are key issues that lead to delays
To
ll P
laza
Case Example – Delhi – Bangalore route
4.7
5.1
5.1
5.7
7.5
7.8
15.1
20.7
24.9
Chennai Kolkata
Delhi Mumbai
Delhi Bangalore
Mumbai Chennai
Pune Hyderabad
Delhi Chennai
Mumbai Kolkata
Delhi Kolkata
Indore Guwahati
Stoppage delay [as% of trip time]
Distance
Journey time
Vehicle speed
No. of stops – toll
No. of stops – others
Stoppage delay
Stoppage expenses
kms
hrs
km/hr
nos
nos
% of trip time
% of trip expenses
2,156
102
22
15
10
5
15
Toll expenses % of stoppage expenses
47
Source: Ministry Of Road Transport & Highways, Transport Corporation of India, Roland Berger
C India Landscape for Automotive Logistics
33 Road_Logistics_for _Finished_Vehicles_India.pptx
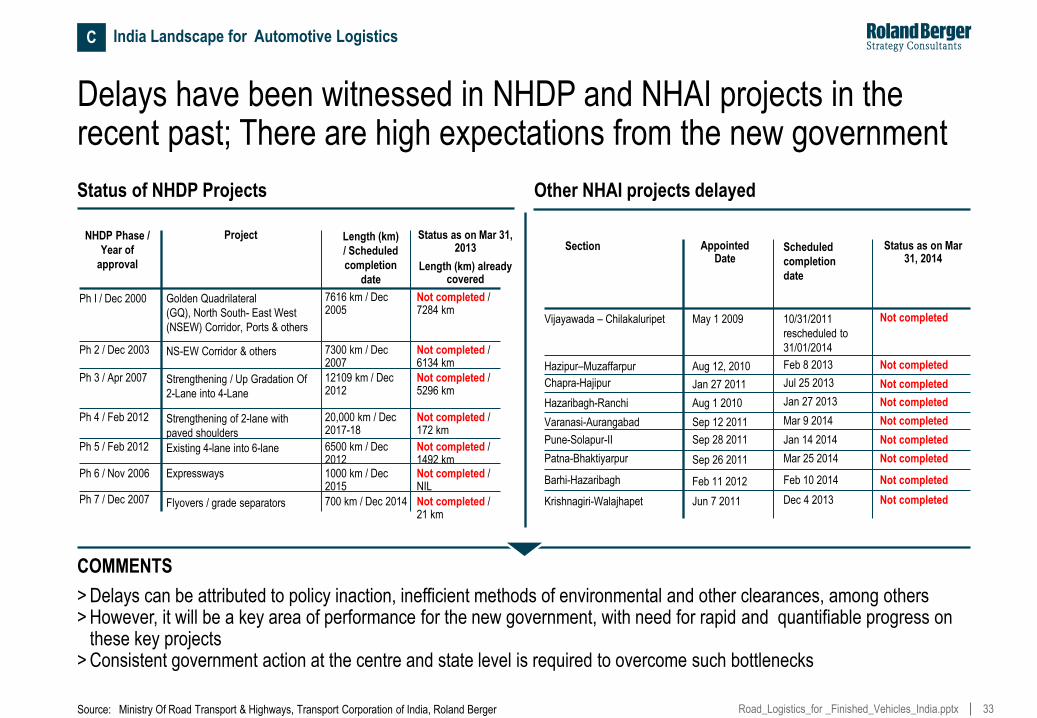
Delays have been witnessed in NHDP and NHAI projects in the recent past; There are high expectations from the new government
Status of NHDP Projects Other NHAI projects delayed
Ph I / Dec 2000 Golden Quadrilateral
(GQ), North South- East West
(NSEW) Corridor, Ports & others
7616 km / Dec 2005
Not completed / 7284 km
Ph 2 / Dec 2003 NS-EW Corridor & others 7300 km / Dec 2007
Not completed / 6134 km
Ph 3 / Apr 2007 Strengthening / Up Gradation Of
2-Lane into 4-Lane
12109 km / Dec 2012
Not completed / 5296 km
Ph 4 / Feb 2012 Strengthening of 2-lane with
paved shoulders
20,000 km / Dec 2017-18
Not completed / 172 km
Ph 5 / Feb 2012 Existing 4-lane into 6-lane 6500 km / Dec 2012
Not completed / 1492 km
Ph 6 / Nov 2006 Expressways 1000 km / Dec 2015
Not completed / NIL
Ph 7 / Dec 2007 Flyovers / grade separators 700 km / Dec 2014 Not completed / 21 km
Project Length (km)
/ Scheduled
completion
date
Status as on Mar 31, 2013
Length (km) already covered
NHDP Phase /
Year of
approval
Vijayawada – Chilakaluripet May 1 2009 10/31/2011
rescheduled to
31/01/2014
Not completed
Hazipur–Muzaffarpur Aug 12, 2010 Feb 8 2013
Chapra-Hajipur Jan 27 2011 Jul 25 2013
Hazaribagh-Ranchi Aug 1 2010 Jan 27 2013
Varanasi-Aurangabad Sep 12 2011 Mar 9 2014
Pune-Solapur-II Sep 28 2011 Jan 14 2014
Patna-Bhaktiyarpur Sep 26 2011 Mar 25 2014
Appointed Date
Scheduled
completion
date
Status as on Mar 31, 2014
Section
Not completed
Not completed
Not completed
Not completed
Not completed
Not completed
Barhi-Hazaribagh Feb 11 2012 Feb 10 2014 Not completed
Krishnagiri-Walajhapet Jun 7 2011 Dec 4 2013 Not completed
C India Landscape for Automotive Logistics
COMMENTS
> Delays can be attributed to policy inaction, inefficient methods of environmental and other clearances, among others > However, it will be a key area of performance for the new government, with need for rapid and quantifiable progress on
these key projects > Consistent government action at the centre and state level is required to overcome such bottlenecks
Source: Ministry Of Road Transport & Highways, Transport Corporation of India, Roland Berger

34 Road_Logistics_for _Finished_Vehicles_India.pptx
Procedural bottlenecks, land acquisition and funding issues are also attributable to the delays in the Dedicated Freight Corridor Network
34
Western Corridor – 1,490 km
Phase I
Phase II
Phase III
Eastern Corridor – 1,805 km
Phase I
Phase II
Phase III
Phase IV
Phase V
920 kms
430 kms
140 kms
343 kms
390 kms
397 kms
550 kms
125 kms
2011-2017
2012-2018
2013-2018
2011-2017
2013-2018
2014-2019
2014-2019
2010-2016
Ahmadabad
Bangalore
Calcutta
Chennai
Delhi
Mumbai
Nagpur
Vijayawada
Ludhiana
Goa
Kharagpur
Dadri – JNPT (Western)
DFCs planned
Kharagpur - Vijayawada (East coast)
Kolkata - Mumbai (East - West)
Delhi - Chennai (North - South)
Chennai – Goa (South - West)
DFCs under execution
Ludhiana – Dankuni (Eastern)
Route map for the proposed DFCs are approximate
Project timelines
Source: DFCCI, DFC concept plan, Secondary sources, Roland Berger
Dedicated Freight Corridor Network
Kanpur
Phases Length Last year status
Expected completion
2009-2016
2010-2017
2010-2017
2010- 2016
2010-2016
2011-2016
2011-2016
2010-2016
Phases Length Last year status
DELAYS
Expected completion
C India Landscape for Automotive Logistics
35 Road_Logistics_for _Finished_Vehicles_India.pptx
D. Models for Indian OEMs to Improve Outbound Logistics
36 Road_Logistics_for _Finished_Vehicles_India.pptx
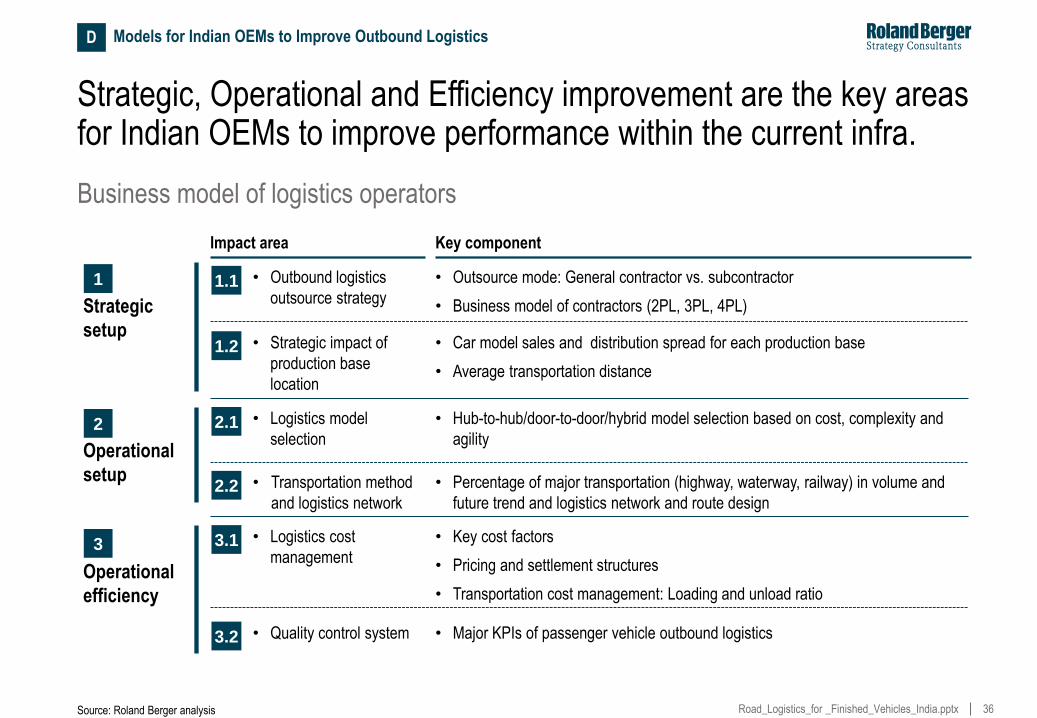
Strategic, Operational and Efficiency improvement are the key areas for Indian OEMs to improve performance within the current infra.
• Outbound logistics
outsource strategy
• Logistics model
selection
Impact area
Strategic
setup
1
Operational
setup
2
Key component
• Car model sales and distribution spread for each production base
• Average transportation distance
1.1
2.1
2.2
• Hub-to-hub/door-to-door/hybrid model selection based on cost, complexity and
agility
1.2
Source: Roland Berger analysis
• Strategic impact of
production base
location
• Outsource mode: General contractor vs. subcontractor
• Business model of contractors (2PL, 3PL, 4PL)
• Transportation method
and logistics network
• Percentage of major transportation (highway, waterway, railway) in volume and
future trend and logistics network and route design
• Logistics cost
management Operational
efficiency
3 3.1
3.2 • Quality control system
• Key cost factors
• Pricing and settlement structures
• Transportation cost management: Loading and unload ratio
• Major KPIs of passenger vehicle outbound logistics
D Models for Indian OEMs to Improve Outbound Logistics
Business model of logistics operators
37 Road_Logistics_for _Finished_Vehicles_India.pptx
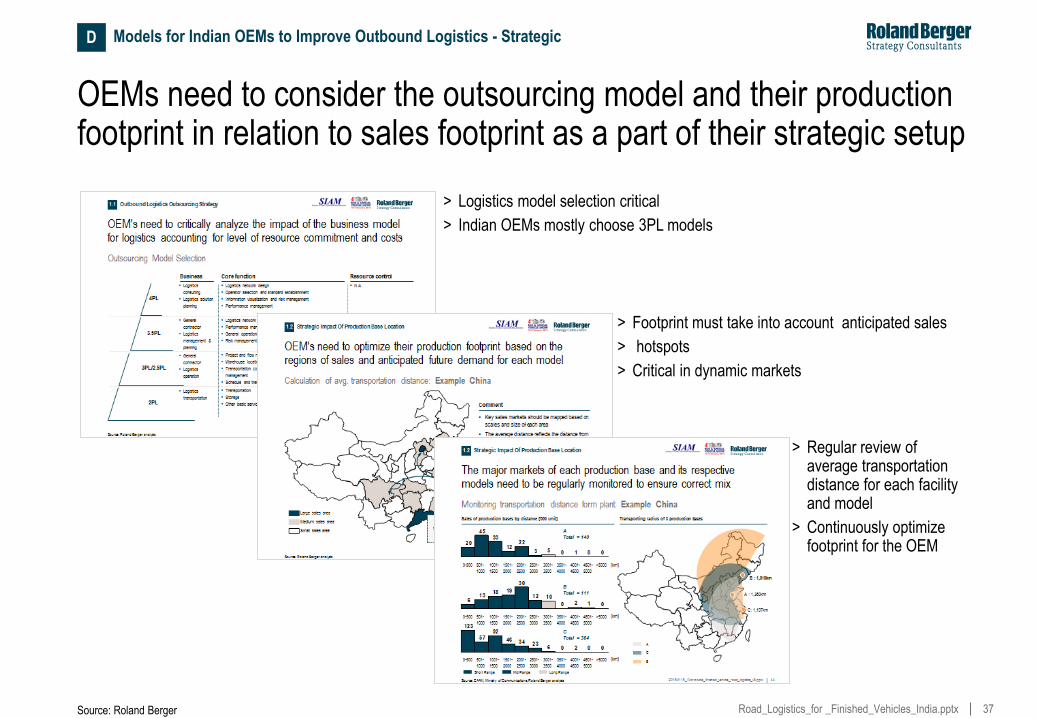
OEMs need to consider the outsourcing model and their production footprint in relation to sales footprint as a part of their strategic setup
> Logistics model selection critical
> Indian OEMs mostly choose 3PL models
> Footprint must take into account anticipated sales
> hotspots
> Critical in dynamic markets
Source: Roland Berger
> Regular review of average transportation distance for each facility and model
> Continuously optimize footprint for the OEM
Models for Indian OEMs to Improve Outbound Logistics - Strategic D
38 Road_Logistics_for _Finished_Vehicles_India.pptx
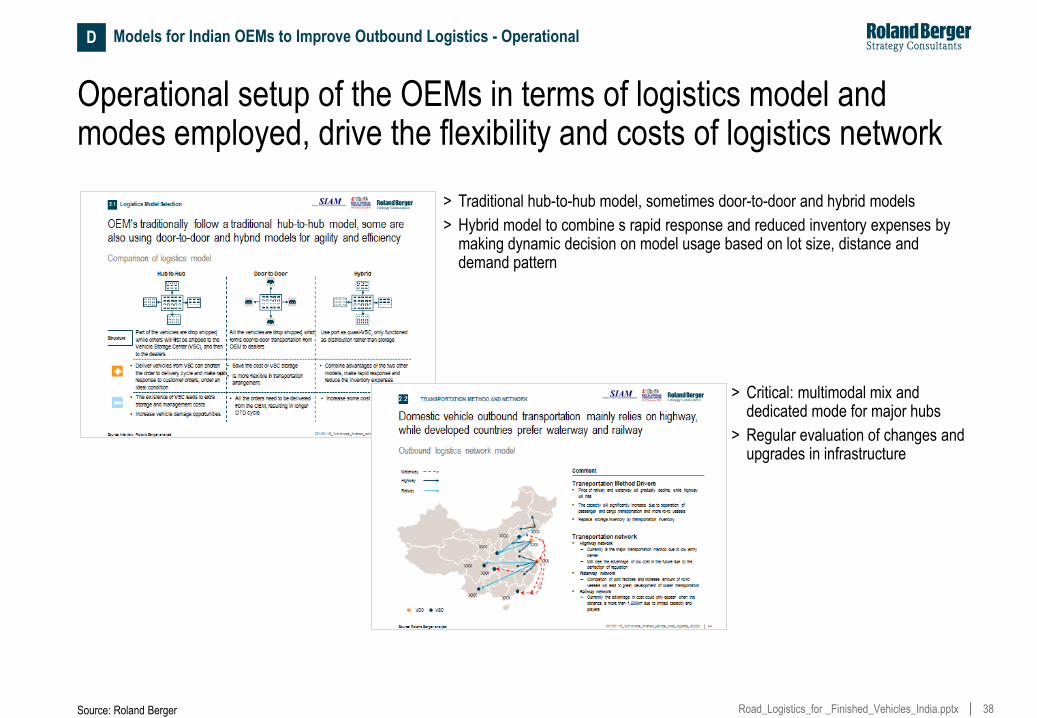
Operational setup of the OEMs in terms of logistics model and modes employed, drive the flexibility and costs of logistics network
> Traditional hub-to-hub model, sometimes door-to-door and hybrid models
> Hybrid model to combine s rapid response and reduced inventory expenses by making dynamic decision on model usage based on lot size, distance and demand pattern
> Critical: multimodal mix and dedicated mode for major hubs
> Regular evaluation of changes and upgrades in infrastructure
Source: Roland Berger
Models for Indian OEMs to Improve Outbound Logistics - Operational D
39 Road_Logistics_for _Finished_Vehicles_India.pptx
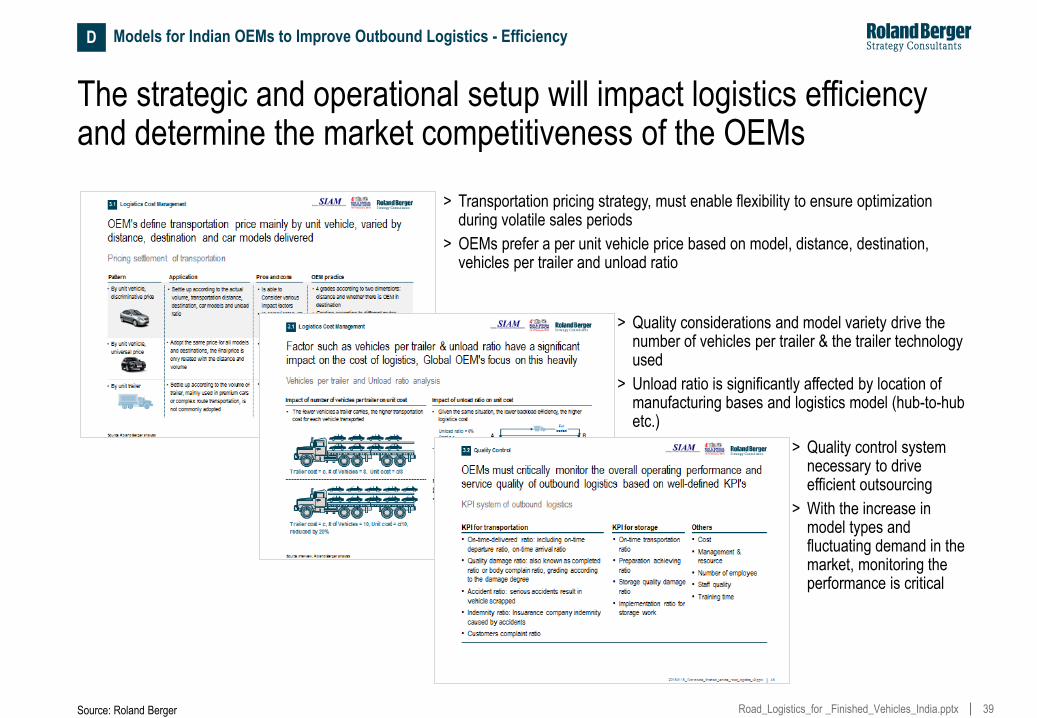
The strategic and operational setup will impact logistics efficiency and determine the market competitiveness of the OEMs
> Transportation pricing strategy, must enable flexibility to ensure optimization during volatile sales periods
> OEMs prefer a per unit vehicle price based on model, distance, destination, vehicles per trailer and unload ratio
> Quality considerations and model variety drive the number of vehicles per trailer & the trailer technology used
> Unload ratio is significantly affected by location of manufacturing bases and logistics model (hub-to-hub etc.)
Source: Roland Berger
> Quality control system necessary to drive efficient outsourcing
> With the increase in model types and fluctuating demand in the market, monitoring the performance is critical
Models for Indian OEMs to Improve Outbound Logistics - Efficiency D

40 Road_Logistics_for _Finished_Vehicles_India.pptx
E. Key Trends and Recommendations for India

41 Road_Logistics_for _Finished_Vehicles_India.pptx
Trend 1 : Robust growth expected in the Indian automotive sector will increase demand for and complexity in the logistics market
E Key Trends for India
Rising automotive demand
4,792
2,431712
FY14
CV +11.6%
29,500
14,800
1,378
FY20
+12.1% PV +12.0%
2 Wheeler +12.2%
Sales figures ('000 units)
CAGR FY14-FY20
– Improve access to key logistics suppliers and enhance cooperation
– Cooperatively plan capacities for effective utilization of capacities
– Lobby with the Government to implement GST
– Optimize own logistics and production footprints
– Invest in driver capability building and make the profession more lucrative
– Focus on Multimodal transportation to increase efficiency and reduce dependence on Road
Source: SIAM, LMC, IHS, Roland Berger Analysis
Impact
42 Road_Logistics_for _Finished_Vehicles_India.pptx
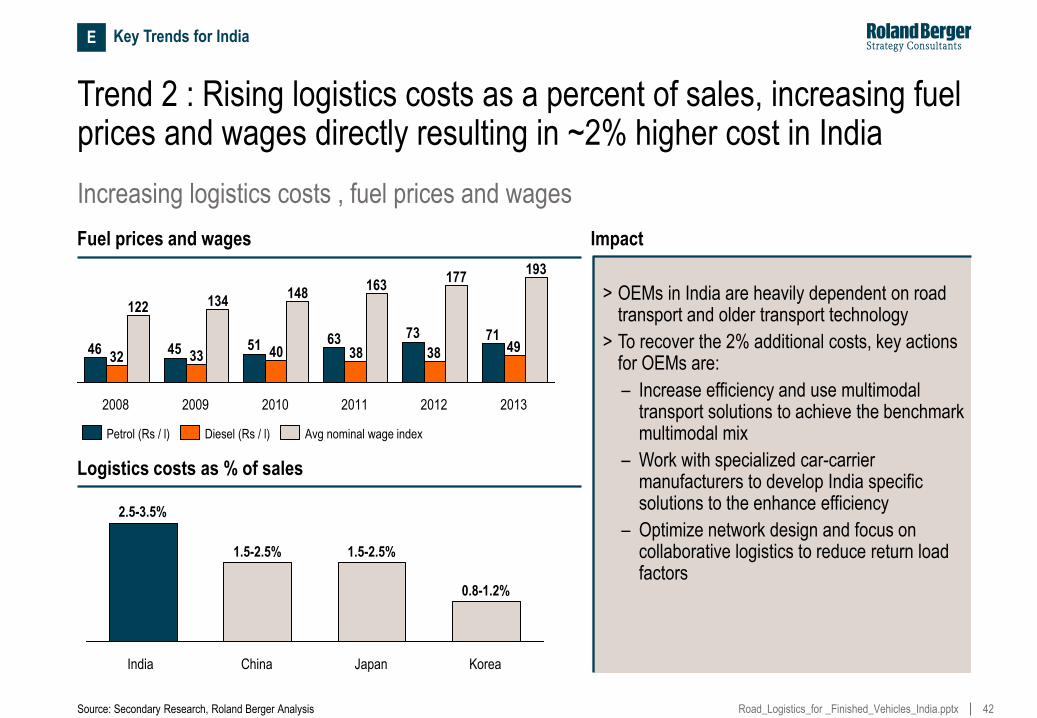
Trend 2 : Rising logistics costs as a percent of sales, increasing fuel prices and wages directly resulting in ~2% higher cost in India
Logistics costs as % of sales
Impact
> OEMs in India are heavily dependent on road transport and older transport technology
> To recover the 2% additional costs, key actions for OEMs are:
– Increase efficiency and use multimodal transport solutions to achieve the benchmark multimodal mix
– Work with specialized car-carrier manufacturers to develop India specific solutions to the enhance efficiency
– Optimize network design and focus on collaborative logistics to reduce return load factors
Korea
0.8-1.2%
Japan
1.5-2.5%
China
1.5-2.5%
India
2.5-3.5%
Fuel prices and wages
717363514546 493838403332
193177
163148
134122
2013 2012 2011 2010 2009 2008
Petrol (Rs / l) Avg nominal wage index Diesel (Rs / l)
Source: Secondary Research, Roland Berger Analysis
Increasing logistics costs , fuel prices and wages
E Key Trends for India
43 Road_Logistics_for _Finished_Vehicles_India.pptx
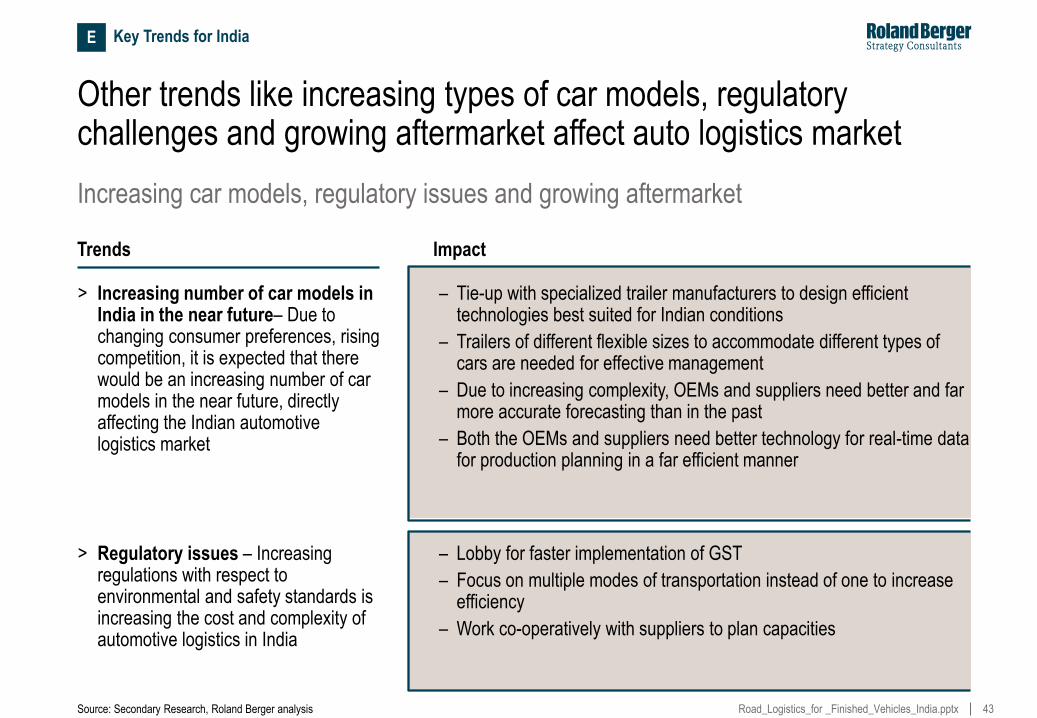
Other trends like increasing types of car models, regulatory challenges and growing aftermarket affect auto logistics market
Increasing car models, regulatory issues and growing aftermarket
Source: Secondary Research, Roland Berger analysis
E Key Trends for India
Trends Impact
– Tie-up with specialized trailer manufacturers to design efficient technologies best suited for Indian conditions
– Trailers of different flexible sizes to accommodate different types of cars are needed for effective management
– Due to increasing complexity, OEMs and suppliers need better and far more accurate forecasting than in the past
– Both the OEMs and suppliers need better technology for real-time data for production planning in a far efficient manner
> Increasing number of car models in India in the near future– Due to changing consumer preferences, rising competition, it is expected that there would be an increasing number of car models in the near future, directly affecting the Indian automotive logistics market
> Regulatory issues – Increasing regulations with respect to environmental and safety standards is increasing the cost and complexity of automotive logistics in India
– Lobby for faster implementation of GST
– Focus on multiple modes of transportation instead of one to increase efficiency
– Work co-operatively with suppliers to plan capacities
44 Road_Logistics_for _Finished_Vehicles_India.pptx
To build a competitive auto road logistics capability, India should follow the European example
1 Improving infrastructure –With rising demand for vehicles and bulk of the road network being poorly paved, there is
a pressing demand to improve infrastructure to support intermodal services
2 Continuous investment – Continuous investments to improve the infrastructure is the need of the hour to increase
capacity and service speeds significantly
3 Removing Red tape– Increasing regulations, high interest rates, complexities with respect to environmental and
safety standards, complications in obtaining permits, use of inter-state permits, complex and opaque tax regime need
to be done away with
4 Faster implementation of GST – Implementation of Goods and Services Tax (GST), which is meant to centralise
certain taxes and help make India a common market across its state borders, will go a long way in building a
competitive automotive road logistics capability
5 Completing pending projects – With sales of passenger and commercial vehicles expected to increase by over
11% in the coming years, pending projects such as the Eastern and Western corridors, NHDP and other NHAI
projects in the southern part of the country need to be completed
E Key Recommendations for India
Source: Roland Berger Analysis

45 Road_Logistics_for _Finished_Vehicles_India.pptx
Additional focus on increasing investment in research and innovation and improving safety on roads is required
8 Newer targets for CO2 norms in Urban cities – Following the Europe example, India should aim for an ambitious
plan of CO2 free urban cities for cleaner cities and for reducing dependence on scarce fossil fuels
9 More investment in research and innovation required – Investment in research and innovation for the next
generation of cutting edge cleaner, cost effective technologies leading to lesser dependence on natural resources
10 Improving safety on roads – Better road safety policies need to be implemented through the use of safety devices
and modern technology, tougher rules on vehicle testing and enforcing stricter penalties
E Key Recommendations for India
7 Improving rail connectivity to reduce burden on roads – While only 2-3% of automotive freight currently moves by
rail, initiatives should be taken to increase this level to reduce burden on the road network. Initiatives such as rail
network through the AFTO and the dedicated rail freight corridor need to be expedited
6 Integrated Logistics Plan for India – Implementation of an integrated logistics plan for India is key for building a
competitive automotive road logistics capability for India. Long term plan for 2030 instead of a shorter term plan for
2020 is required incorporating future projections of population growth, migration patterns, GDP and industrial
production
Source: Roland Berger Analysis