Embed Size (px)
Citation preview

Outlook on Natural Gas and LNGOutlook on Natural Gas and LNG

Fuel Diversity in New EnglandFuel Diversity in New England
• Recent build-out ~10,700 MW• Gas-fired generation (% Total NE GWh)
– 1999: 16%
– 2003: 41%
– 2010: 49%
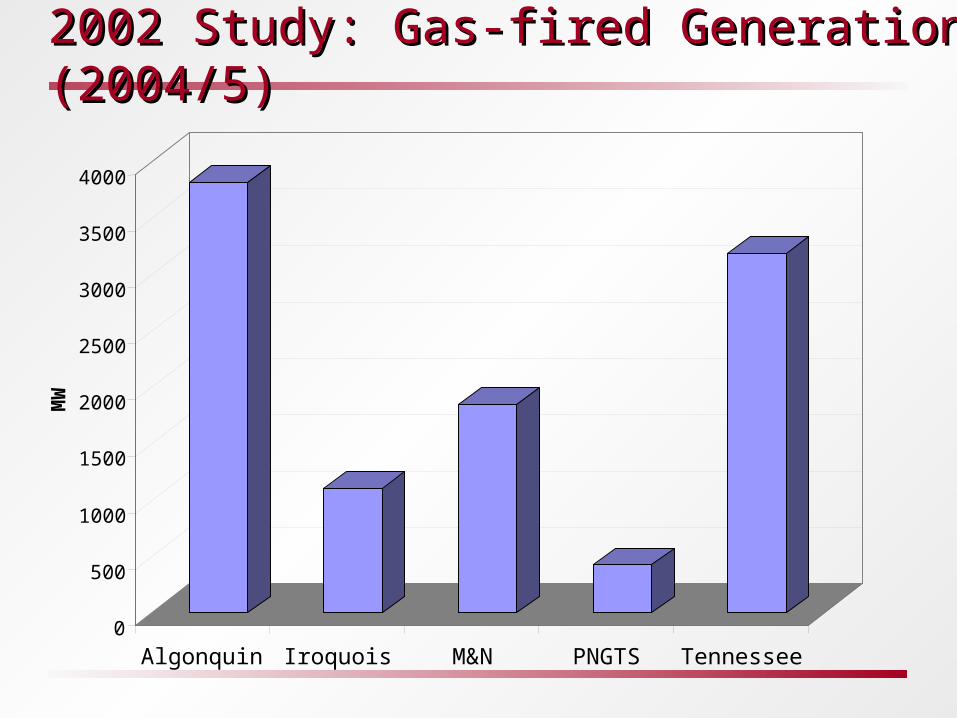
2002 Study: Gas-fired Generation (2004/5)2002 Study: Gas-fired Generation (2004/5)
0
500
1000
1500
2000
2500
3000
3500
4000
MW
Algonquin Iroquois M&N PNGTS Tennessee
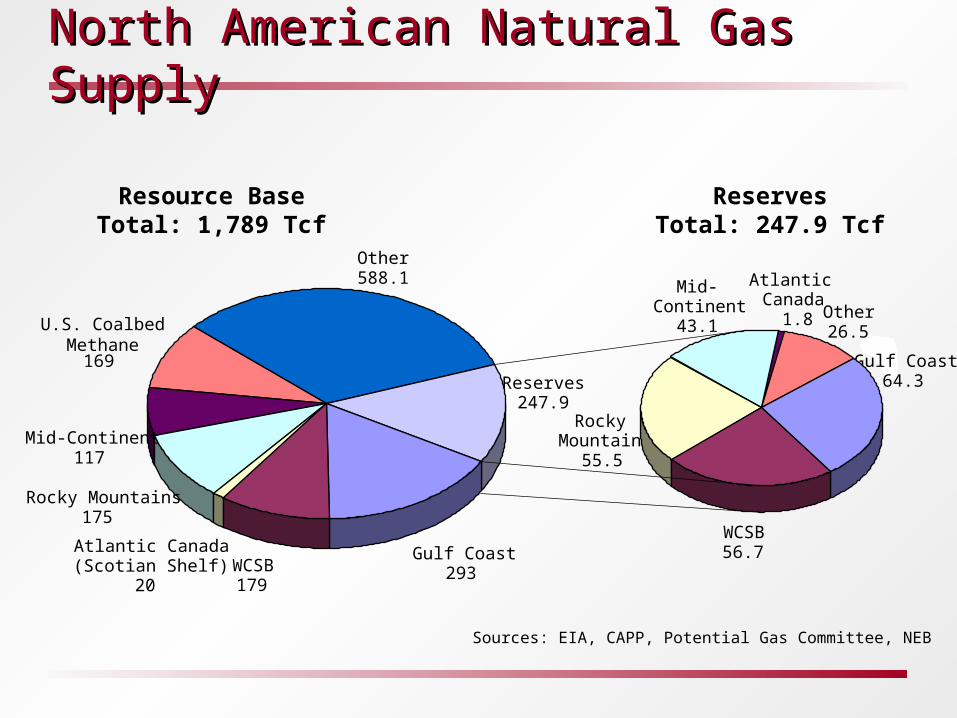
North American Natural Gas SupplyNorth American Natural Gas Supply
ReservesTotal: 247.9 Tcf
Sources: EIA, CAPP, Potential Gas Committee, NEB
Resource BaseTotal: 1,789 Tcf
Gulf Coast293WCSB
179
Rocky Mountains175
Mid-Continent117
Other588.1
U.S. CoalbedMethane
169Reserves
247.9
Atlantic Canada(Scotian Shelf)
20
1.8
WCSB56.7
Rocky Mountains
55.5
Other26.5
Atlantic Canada
Mid-Continent
43.1
Gulf Coast64.3
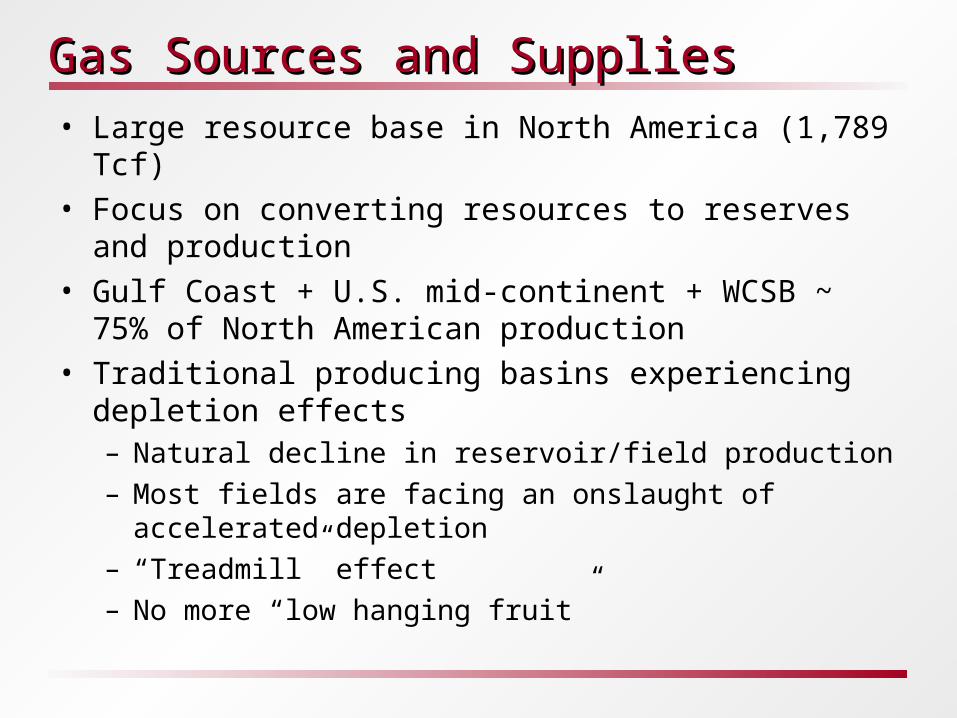
Gas Sources and SuppliesGas Sources and Supplies• Large resource base in North America (1,789 Tcf)• Focus on converting resources to reserves and
production• Gulf Coast + U.S. mid-continent + WCSB ~ 75% of North
American production• Traditional producing basins experiencing depletion
effects– Natural decline in reservoir/field production
– Most fields are facing an onslaught of accelerated depletion
– “Treadmill” effect
– No more “low hanging fruit”
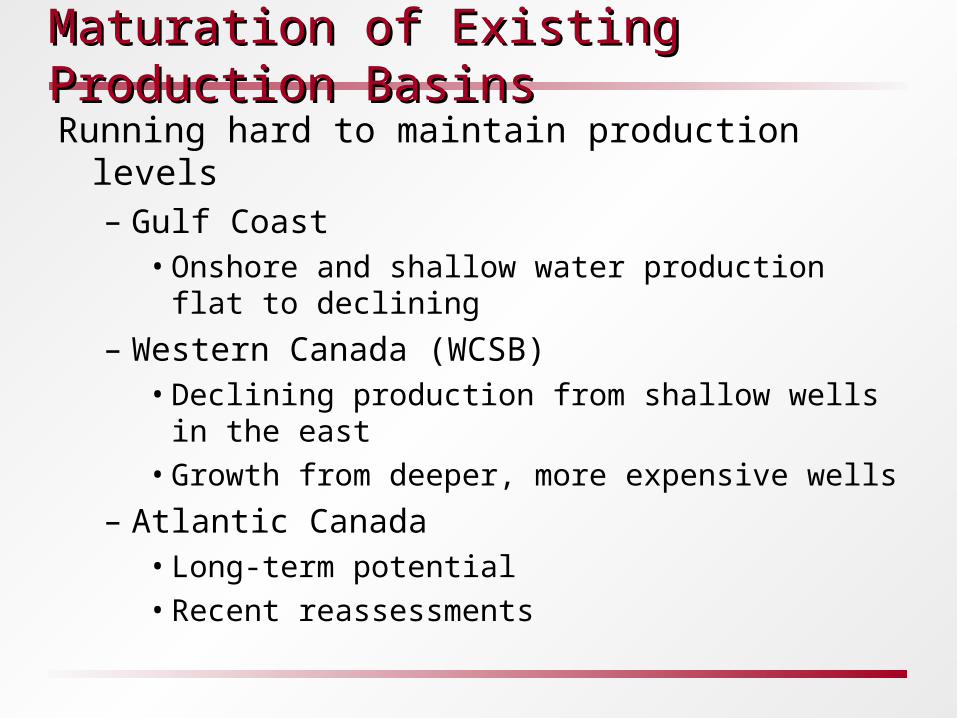
Maturation of Existing Production BasinsMaturation of Existing Production Basins
Running hard to maintain production levels– Gulf Coast
• Onshore and shallow water production flat to declining
– Western Canada (WCSB)• Declining production from shallow wells in the east• Growth from deeper, more expensive wells
– Atlantic Canada• Long-term potential• Recent reassessments
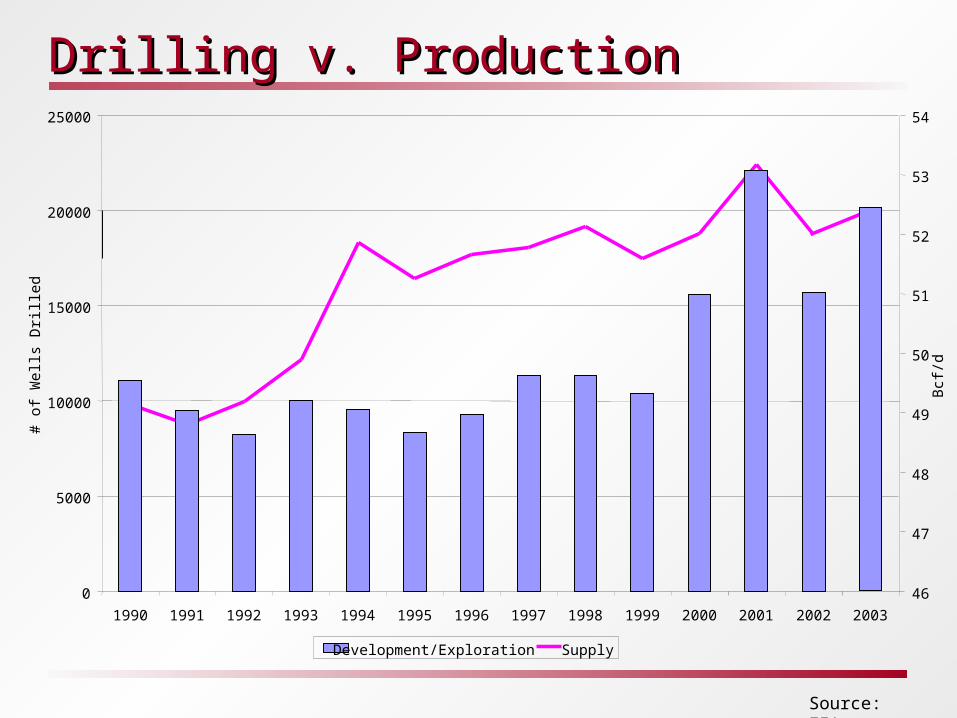
Drilling v. ProductionDrilling v. Production
0
5000
10000
15000
20000
25000
1990 1991 1992 1993 1994 1995 1996 1997 1998 1999 2000 2001
# of
Wel
ls D
rille
d
46
47
48
49
50
51
52
53
54
Bcf
/d
Development/Exploration Supply
2002 2003
Source: EIA
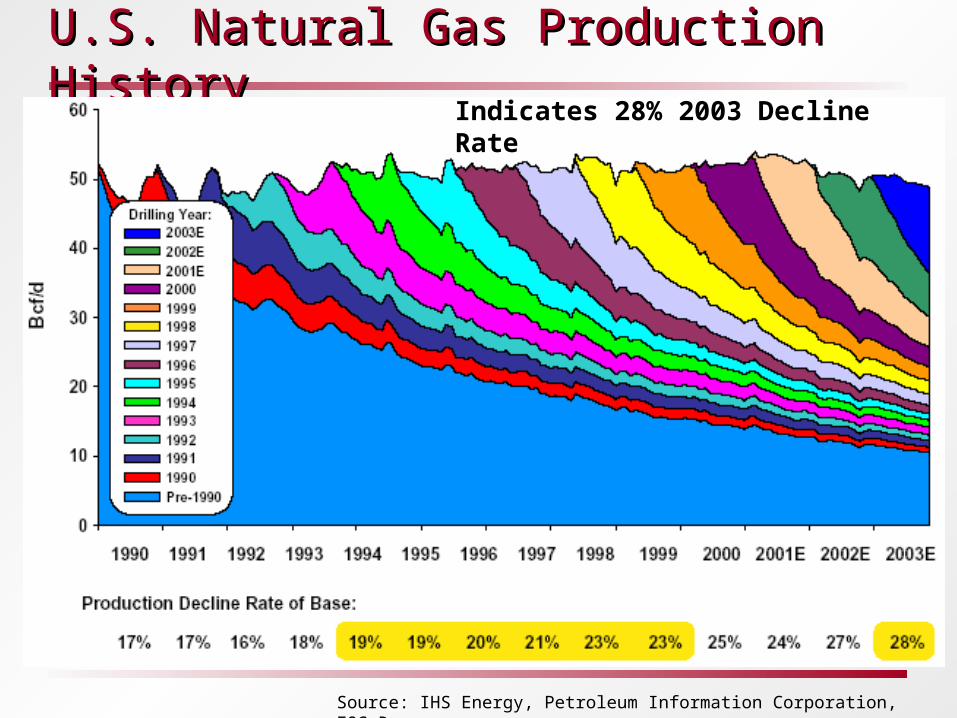
U.S. Natural Gas Production HistoryU.S. Natural Gas Production HistoryIndicates 28% 2003 Decline Rate
Source: IHS Energy, Petroleum Information Corporation, EOG Resources

E&P in Atlantic CanadaE&P in Atlantic Canada
• Current Scotian Shelf production relatively small– Sable Island: 0.4-0.5 Bcf/d
– Gulf Coast: 26.3 Bcf/d
– Western Canada: 16.5 Bcf/d
• High costs, difficult reservoir conditions• Recent setbacks:
– Postponement of Deep Panuke
– Downward revisions of proven reserves
– Lack of new exploration success
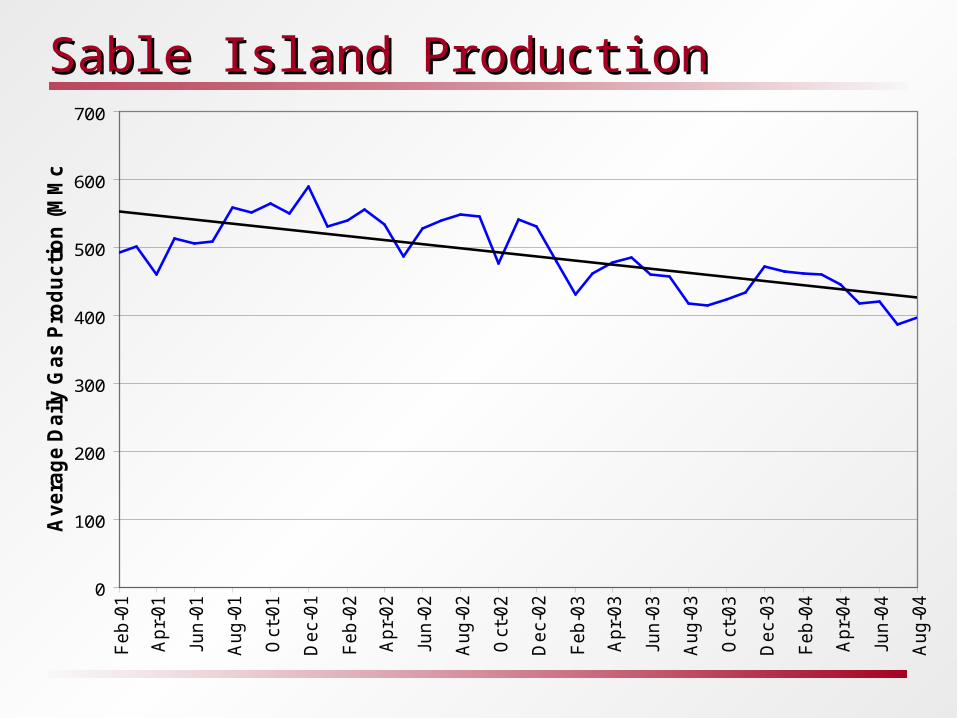
Sable Island ProductionSable Island Production
0
100
200
300
400
500
600
700F
eb-0
1
Apr-
01
Jun-0
1
Aug
-01
Oct
-01
Dec-
01
Feb-0
2
Apr-
02
Jun-0
2
Aug
-02
Oct
-02
Dec-
02
Feb-0
3
Apr-
03
Jun-0
3
Aug
-03
Oct
-03
Dec-
03
Feb-0
4
Apr-
04
Jun-0
4
Aug
-04
Av
era
ge
Da
ily
Ga
s P
rod
uc
tio
n (
MM
cf/
d)
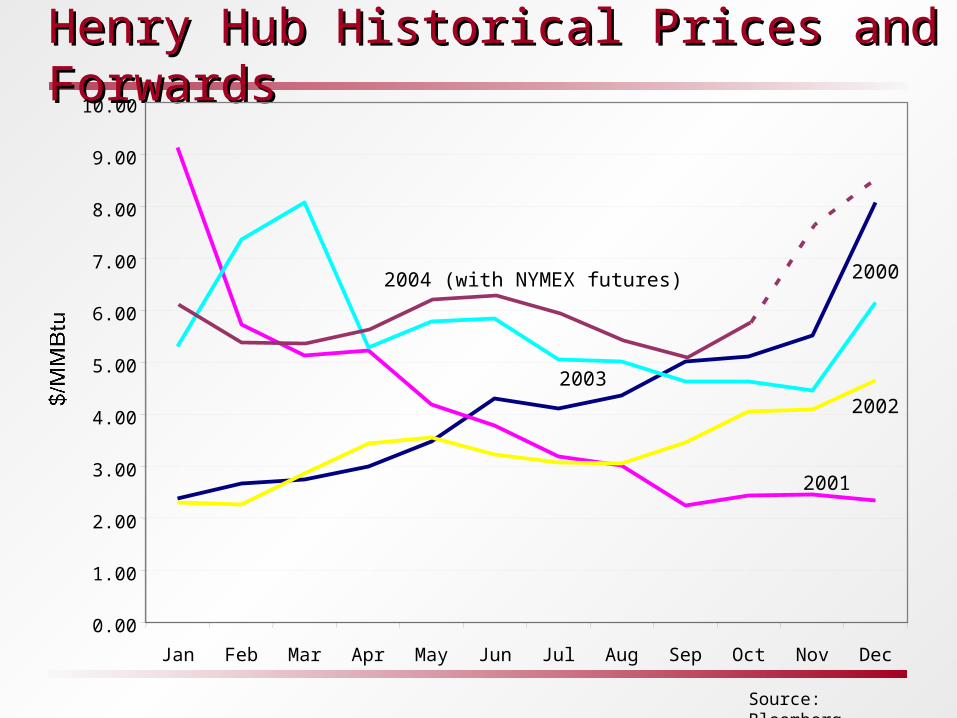
Henry Hub Historical Prices and ForwardsHenry Hub Historical Prices and Forwards
0.00
1.00
2.00
3.00
4.00
5.00
6.00
7.00
8.00
9.00
10.00
Jan Feb Mar Apr May Jun Jul Aug Sep Oct Nov Dec
2001
2000
2002
2004 (with NYMEX futures)
2003
Source: Bloomberg
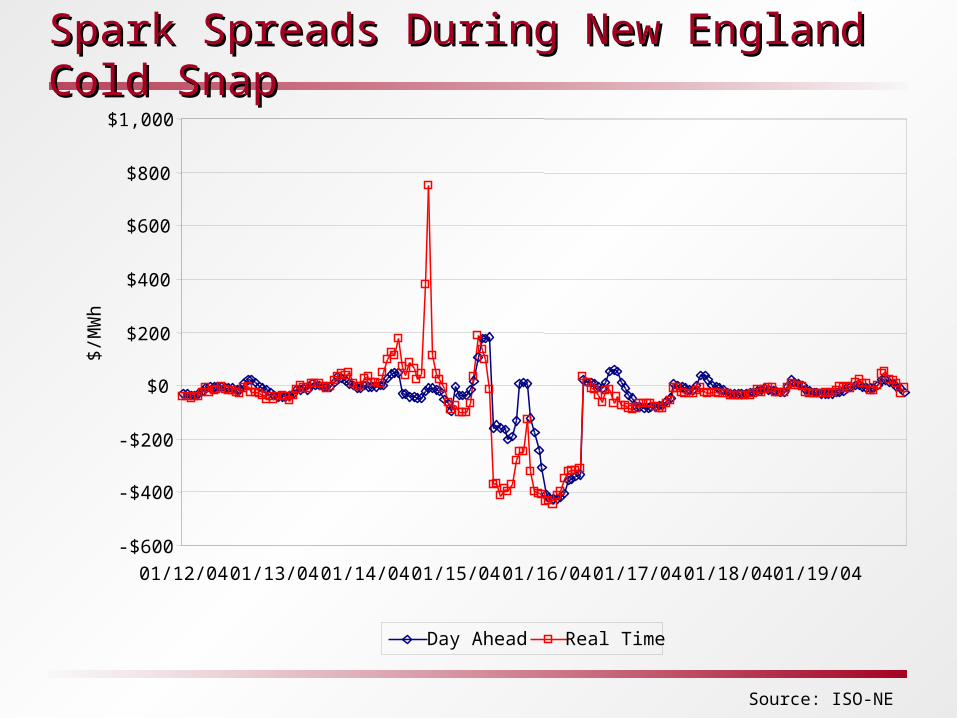
Spark Spreads During New England Cold SnapSpark Spreads During New England Cold Snap
-$600
-$400
-$200
$0
$200
$400
$600
$800
$1,000
01/12/04 01/13/04 01/14/04 01/15/04 01/16/04 01/17/04 01/18/04 01/19/04
$/M
Wh
Day Ahead Real Time
Source: ISO-NE
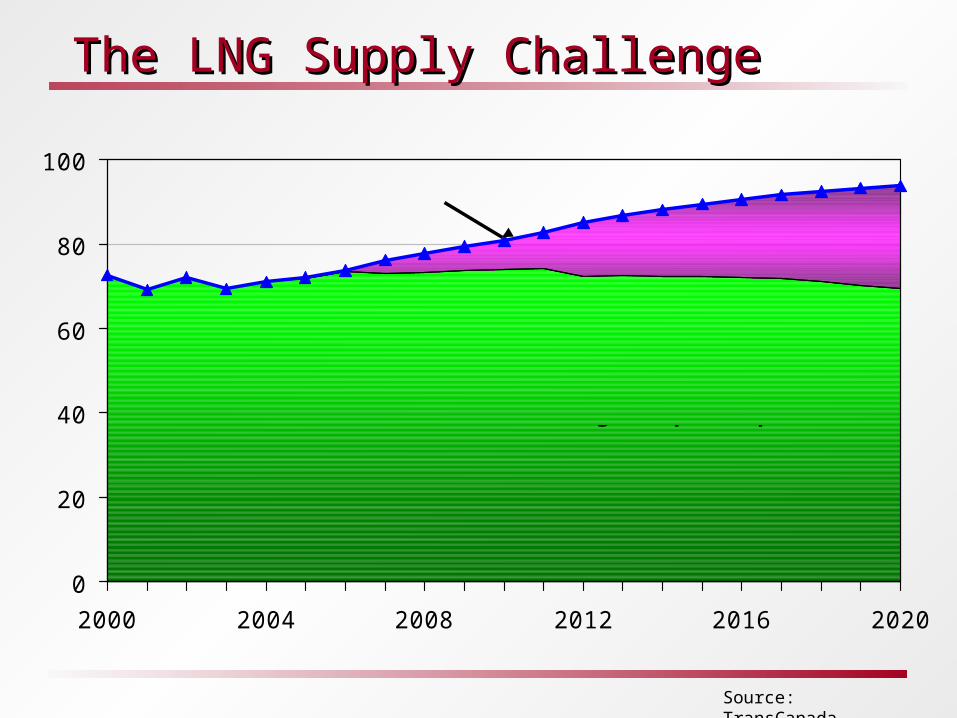
The LNG Supply ChallengeThe LNG Supply Challenge
0
20
40
60
80
100
2000 2004 2008 2012 2016 2020
Bcf/d
WCSB, L-48,East Coast,Existing LNG plus expansions
New LNG, & Northern Gas
North American Demand
Source: TransCanada
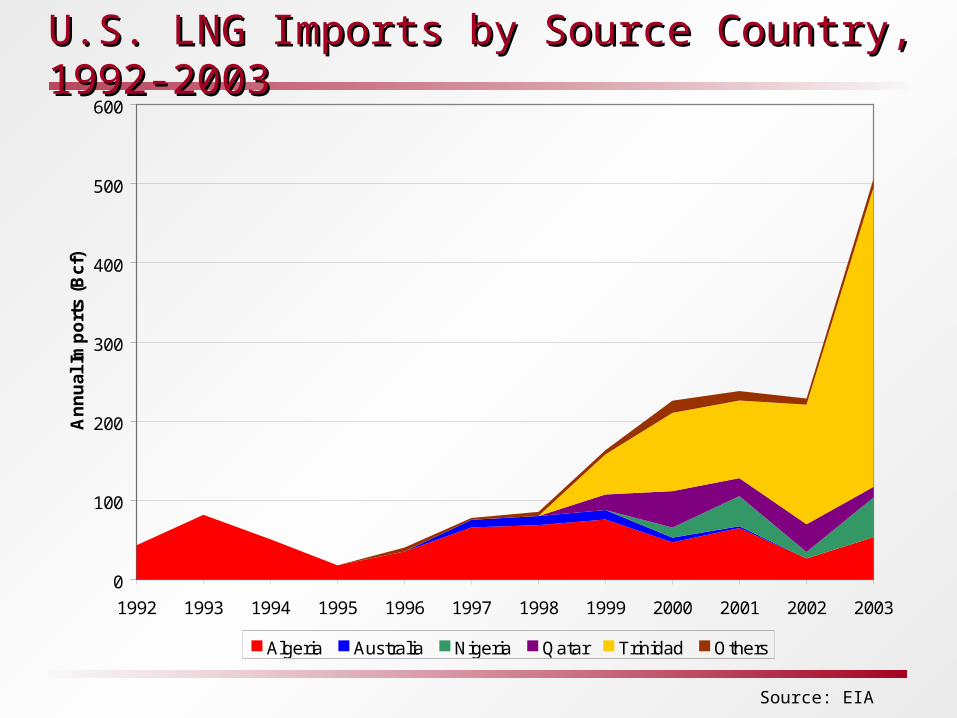
U.S. LNG Imports by Source Country, 1992-2003U.S. LNG Imports by Source Country, 1992-2003
Source: EIA
0
100
200
300
400
500
600
1992 1993 1994 1995 1996 1997 1998 1999 2000 2001 2002 2003
An
nu
al I
mp
ort
s (B
cf)
Algeria Australia Nigeria Qatar Trinidad Others
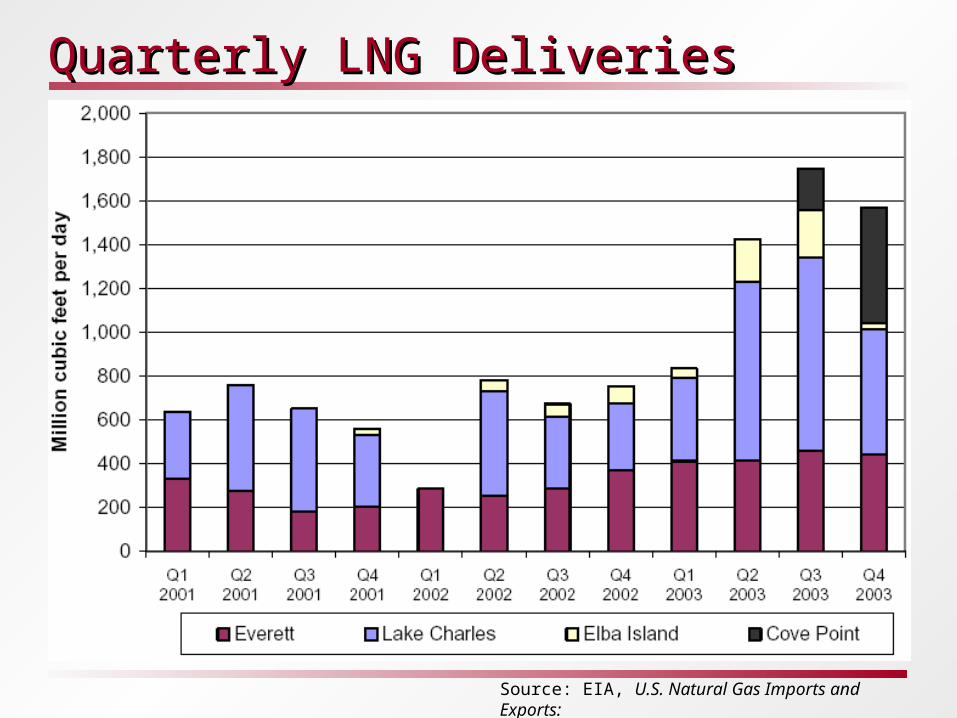
Quarterly LNG DeliveriesQuarterly LNG Deliveries
Source: EIA, U.S. Natural Gas Imports and Exports:Issues and Trends 2003

Major LNG Trade Movements, 2002 (Bcf)Major LNG Trade Movements, 2002 (Bcf)
Source: EIA, The Global Liquefied Natural Gas Market: Status and Outlook

Atlantic Basin Liquefaction Capacity, October 2003Atlantic Basin Liquefaction Capacity, October 2003
Source: EIA, The Global Liquefied Natural Gas Market: Status and Outlook
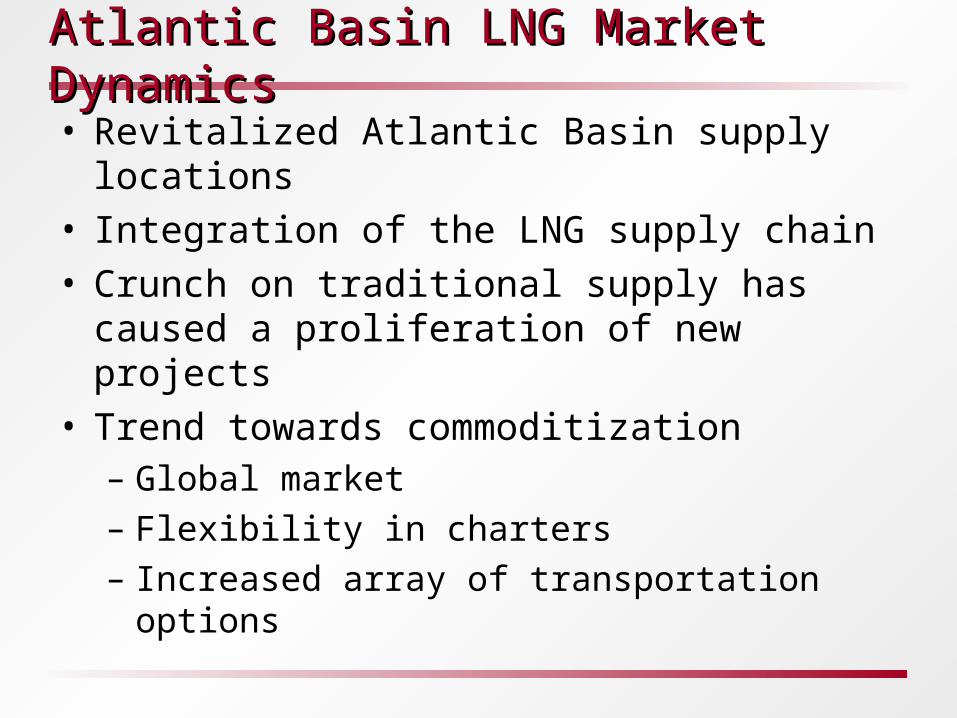
Atlantic Basin LNG Market DynamicsAtlantic Basin LNG Market Dynamics
• Revitalized Atlantic Basin supply locations• Integration of the LNG supply chain• Crunch on traditional supply has caused a
proliferation of new projects• Trend towards commoditization
– Global market
– Flexibility in charters
– Increased array of transportation options
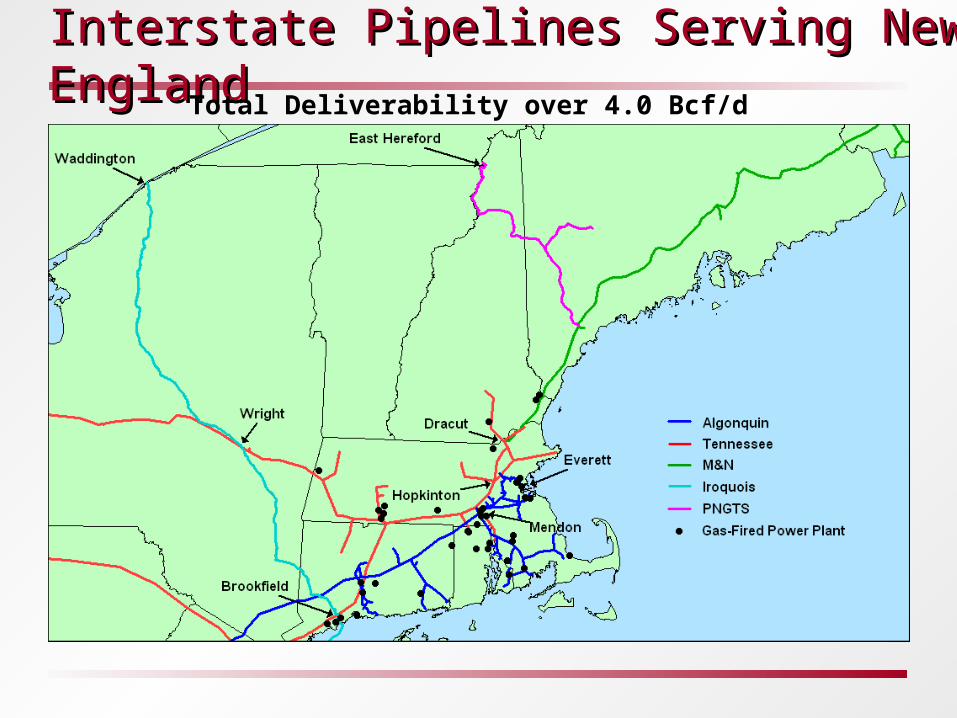
Interstate Pipelines Serving New EnglandInterstate Pipelines Serving New EnglandTotal Deliverability over 4.0 Bcf/d

Distrigas LNGDistrigas LNG
New Mystic(272 MMcf/d)
Backup for New Mystic
LDCLNG
Terminals
KeySpan,AlgonquinTennessee
Distrigas EverettLNG Terminal
Storage Capacity: 3.5 BcfDaily Vaporization: 1 Bcf
LNG Imports(158.3 Bcf in 2003)
(150 MMcf/d)
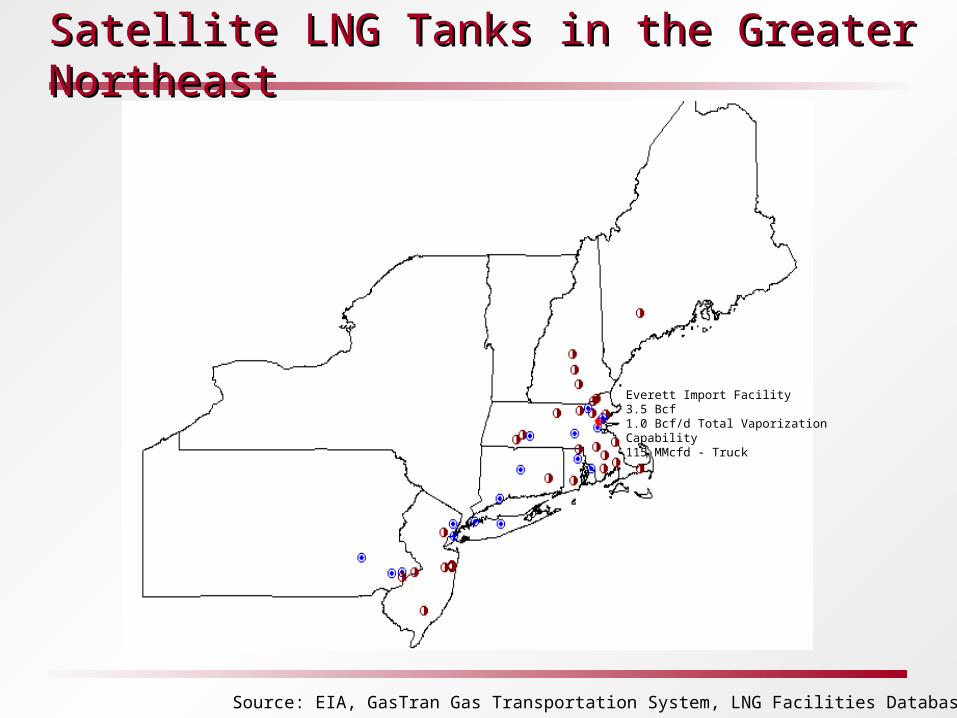
Satellite LNG Tanks in the Greater NortheastSatellite LNG Tanks in the Greater Northeast
Source: EIA, GasTran Gas Transportation System, LNG Facilities Database
Everett Import Facility3.5 Bcf1.0 Bcf/d Total Vaporization Capability 115 MMcfd - Truck
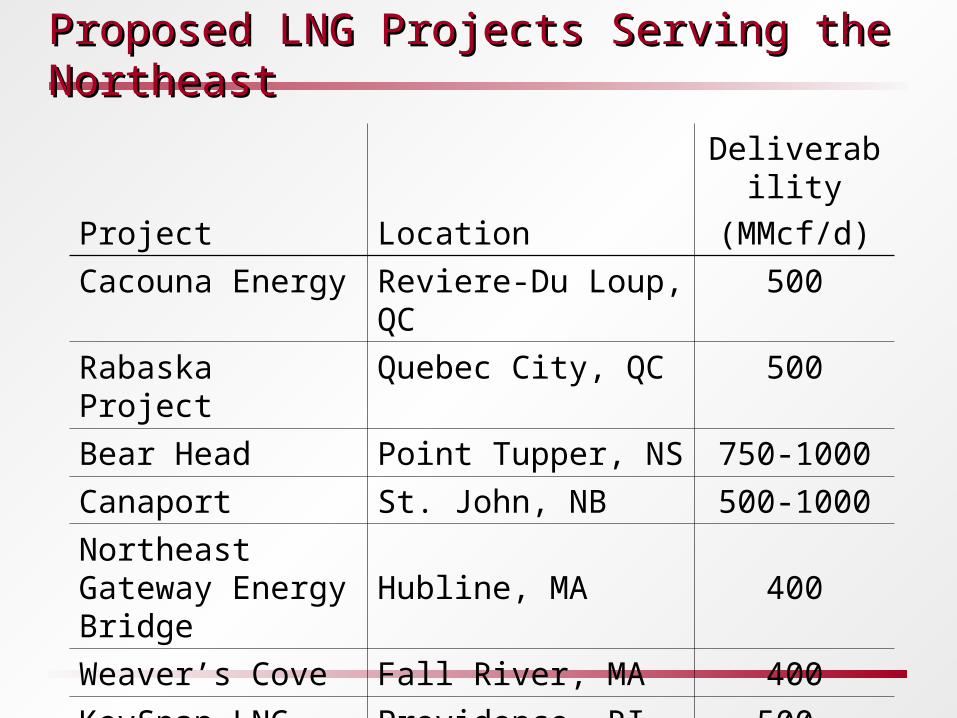
Proposed LNG Projects Serving the NortheastProposed LNG Projects Serving the Northeast
Project Location
Deliverability
(MMcf/d)
Cacouna Energy Reviere-Du Loup, QC 500
Rabaska Project Quebec City, QC 500
Bear Head Point Tupper, NS 750-1000
Canaport St. John, NB 500-1000
Northeast Gateway Energy Bridge
Hubline, MA 400
Weaver’s Cove Fall River, MA 400
KeySpan LNG Providence, RI 500
Broadwater Energy Long Island, NY 1000