Embed Size (px)
Citation preview

Outlook For Data Driven Marketing:First Look 2019
Bruce BiegelSenior Managing Director
January 17, 2019New York, NY

Trends to Watch for 2019
Outlook 2019
The 2018 Recap
The First Half of 2018 Went Well; The End of Year Less So—With Trade Wars, Geopolitical Agita, Shutdowns and Stock Market Declines
The economy was strong, unemployment is at historic lows, corporate profits were at record levels and the stock market had a great 10 months…….
Cambridge Analytica and FB shook up the privacy landscape at the end of Q1, while GDPR went into effect at the end of May and California passed a flawed privacy directive in June leading to calls for national regulation by 4Q18
Traditional media spend continued its slow decline
…And then the government shut down
…but concerns over trade wars, tariffs and a looming hard Brexit became reality
[ 3 ][ 3 ]
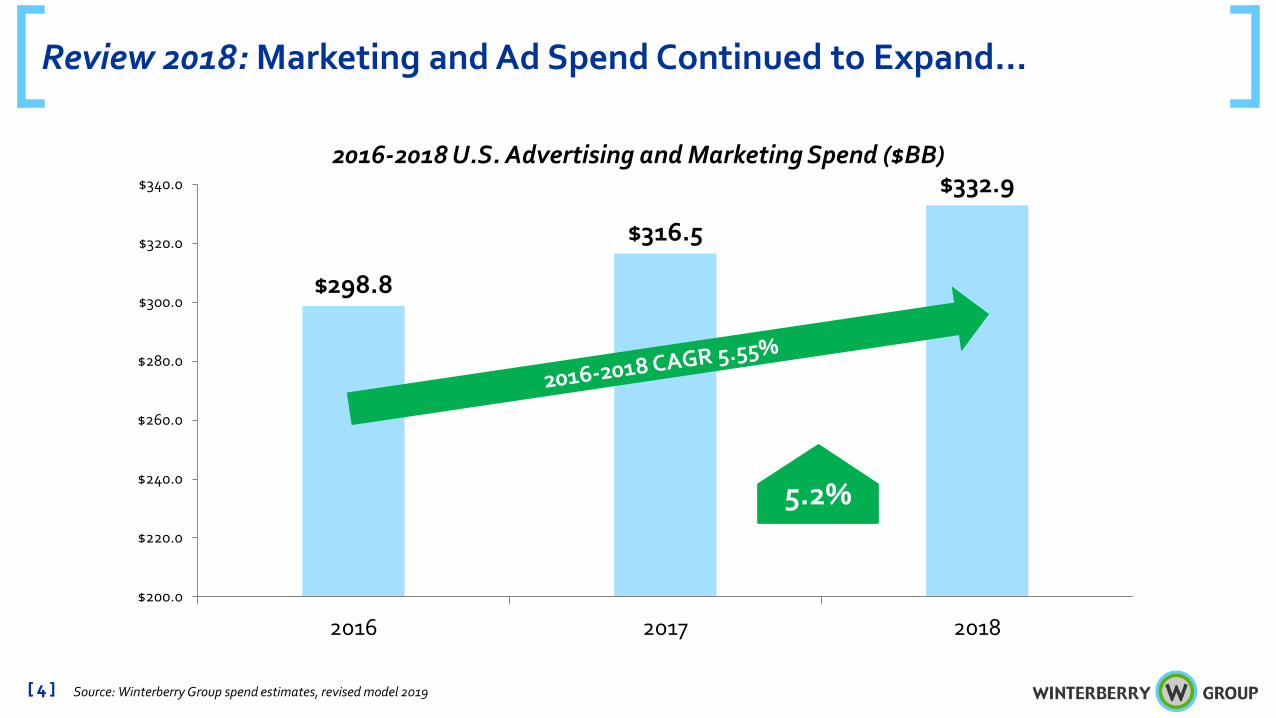
Review 2018: Marketing and Ad Spend Continued to Expand…
Source: Winterberry Group spend estimates, revised model 2019 [ 4 ]
$298.8
$316.5
$332.9
$200.0
$220.0
$240.0
$260.0
$280.0
$300.0
$320.0
$340.0
2016 2017 2018
2016-2018 U.S. Advertising and Marketing Spend ($BB)
5.2%
[ 4 ]
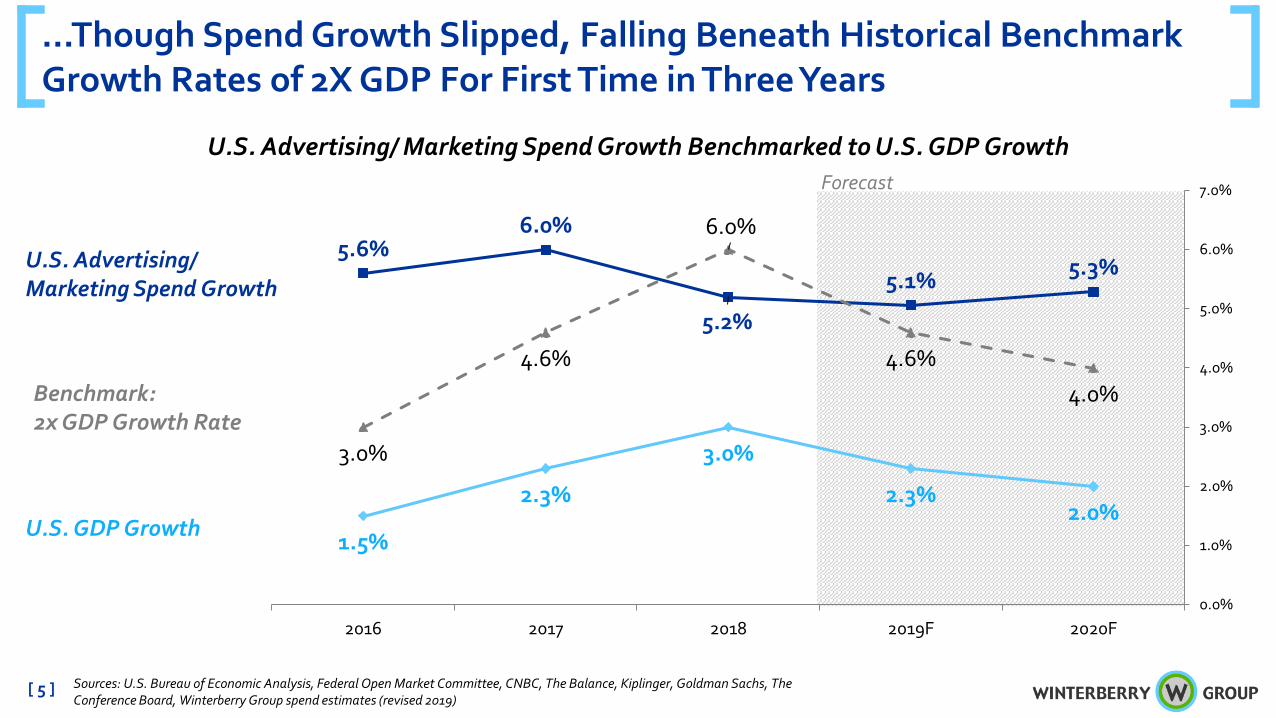
…Though Spend Growth Slipped, Falling Beneath Historical Benchmark Growth Rates of 2X GDP For First Time in Three Years
Sources: U.S. Bureau of Economic Analysis, Federal Open Market Committee, CNBC, The Balance, Kiplinger, Goldman Sachs, The Conference Board, Winterberry Group spend estimates (revised 2019)
U.S. Advertising/ Marketing Spend Growth
U.S. GDP Growth
Benchmark:2x GDP Growth Rate
Forecast
[ 5 ]
1.5%
2.3%
3.0%
2.3%2.0%
5.6%6.0%
5.2%
5.1% 5.3%
3.0%
4.6%
6.0%
4.6%4.0%
0.0%
1.0%
2.0%
3.0%
4.0%
5.0%
6.0%
7.0%
2016 2017 2018 2019F 2020F
U.S. Advertising/ Marketing Spend Growth Benchmarked to U.S. GDP Growth
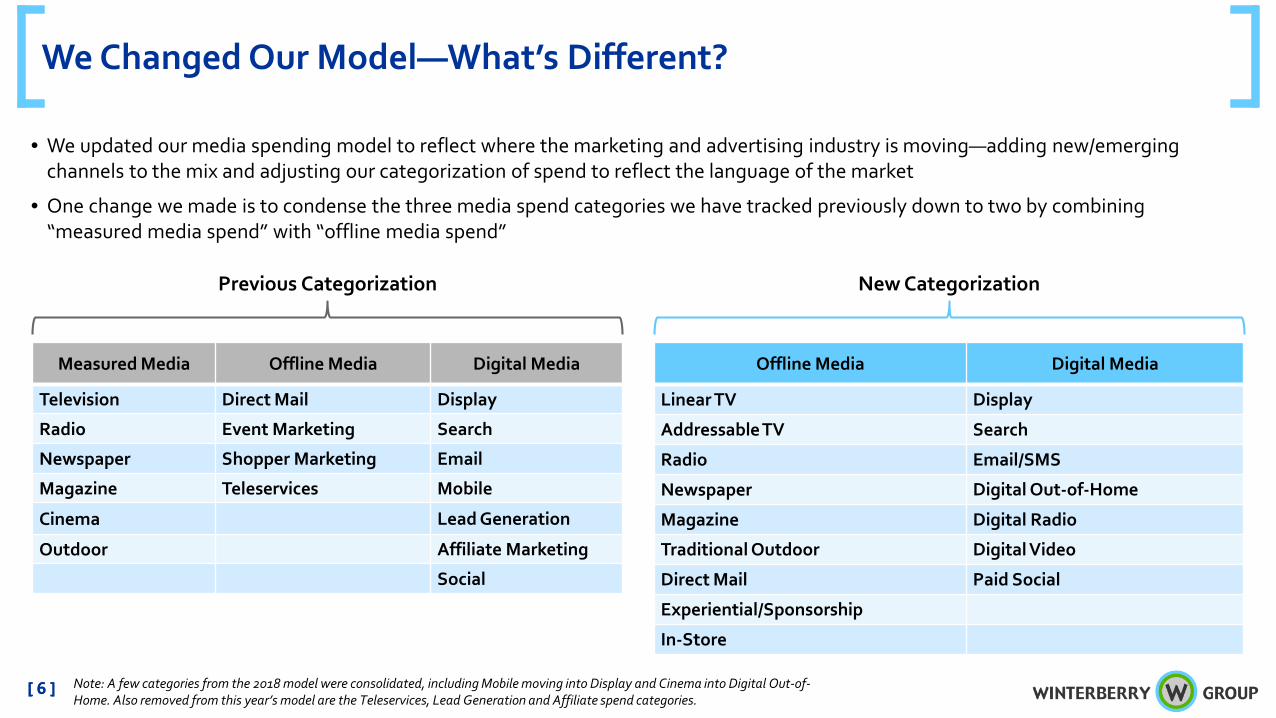
We Changed Our Model—What’s Different?
[ 6 ]
• We updated our media spending model to reflect where the marketing and advertising industry is moving—adding new/emerging channels to the mix and adjusting our categorization of spend to reflect the language of the market
• One change we made is to condense the three media spend categories we have tracked previously down to two by combining “measured media spend” with “offline media spend”
Previous Categorization
Measured Media Offline Media Digital Media
Television Direct Mail Display
Radio Event Marketing Search
Newspaper Shopper Marketing Email
Magazine Teleservices Mobile
Cinema Lead Generation
Outdoor Affiliate Marketing
Social
New Categorization
Offline Media Digital Media
Linear TV Display
Addressable TV Search
Radio Email/SMS
Newspaper Digital Out-of-Home
Magazine Digital Radio
Traditional Outdoor Digital Video
Direct Mail Paid Social
Experiential/Sponsorship
In-Store
Note: A few categories from the 2018 model were consolidated, including Mobile moving into Display and Cinema into Digital Out-of-Home. Also removed from this year’s model are the Teleservices, Lead Generation and Affiliate spend categories.
[ 6 ]
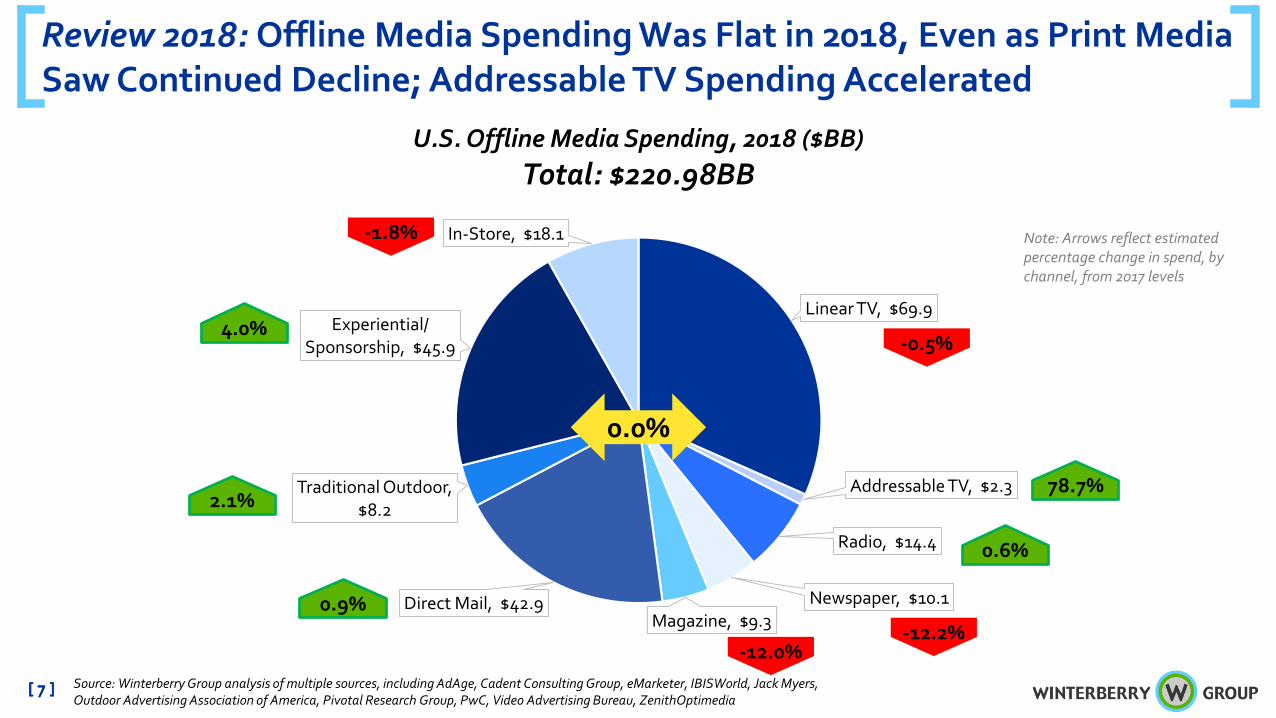
Review 2018: Offline Media Spending Was Flat in 2018, Even as Print Media Saw Continued Decline; Addressable TV Spending Accelerated
Linear TV, $69.9
Addressable TV, $2.3
Radio, $14.4
Newspaper, $10.1 Magazine, $9.3
Direct Mail, $42.9
Traditional Outdoor, $8.2
Experiential/ Sponsorship, $45.9
In-Store, $18.1
U.S. Offline Media Spending, 2018 ($BB)Total: $220.98BB
2.1%
Note: Arrows reflect estimated percentage change in spend, by channel, from 2017 levels
-0.5%
Source: Winterberry Group analysis of multiple sources, including AdAge, Cadent Consulting Group, eMarketer, IBISWorld, Jack Myers, Outdoor Advertising Association of America, Pivotal Research Group, PwC, Video Advertising Bureau, ZenithOptimedia
-12.2%
78.7%
0.9%
-12.0%
0.0%
0.6%
-1.8%
4.0%
[ 7 ][ 7 ]
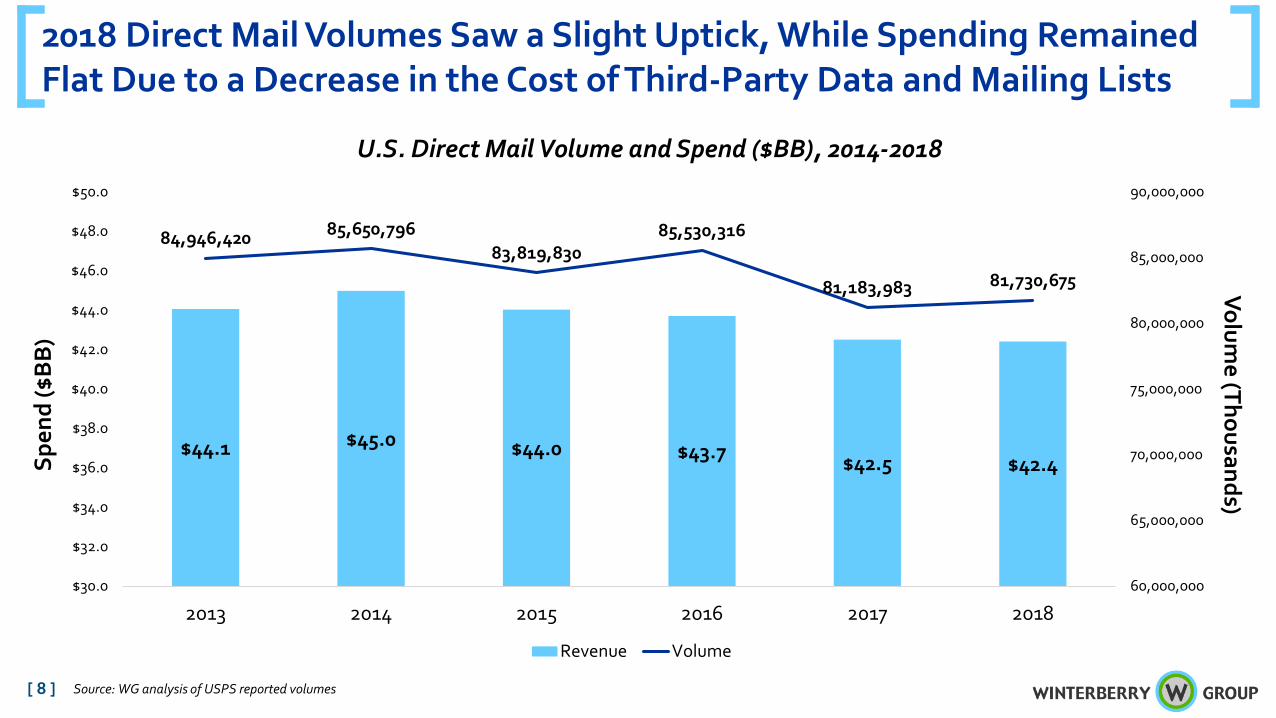
2018 Direct Mail Volumes Saw a Slight Uptick, While Spending Remained Flat Due to a Decrease in the Cost of Third-Party Data and Mailing Lists
Source: WG analysis of USPS reported volumes
$44.1 $45.0 $44.0 $43.7 $42.5 $42.4
84,946,420 85,650,79683,819,830
85,530,316
81,183,983 81,730,675
60,000,000
65,000,000
70,000,000
75,000,000
80,000,000
85,000,000
90,000,000
$30.0
$32.0
$34.0
$36.0
$38.0
$40.0
$42.0
$44.0
$46.0
$48.0
$50.0
2013 2014 2015 2016 2017 2018
Revenue Volume
Spen
d ($
BB
)Volum
e (Thousands)
U.S. Direct Mail Volume and Spend ($BB), 2014-2018
[ 8 ]
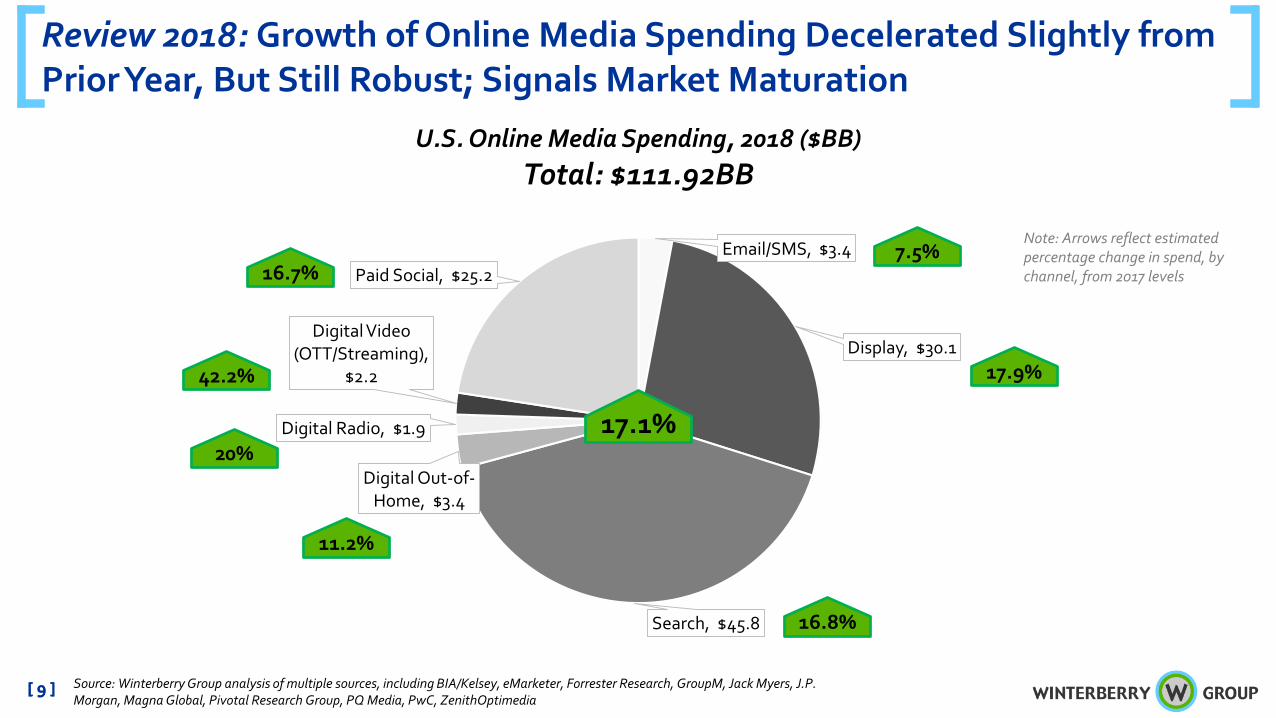
Email/SMS, $3.4
Display, $30.1
Search, $45.8
Digital Out-of-Home, $3.4
Digital Radio, $1.9
Digital Video (OTT/Streaming),
$2.2
Paid Social, $25.2
U.S. Online Media Spending, 2018 ($BB)Total: $111.92BB
17.1%
Review 2018: Growth of Online Media Spending Decelerated Slightly from Prior Year, But Still Robust; Signals Market Maturation
Note: Arrows reflect estimated percentage change in spend, by channel, from 2017 levels
Source: Winterberry Group analysis of multiple sources, including BIA/Kelsey, eMarketer, Forrester Research, GroupM, Jack Myers, J.P. Morgan, Magna Global, Pivotal Research Group, PQ Media, PwC, ZenithOptimedia
17.9%
16.8%
16.7%
[ 9 ]
7.5%
42.2%
20%
11.2%
[ 9 ]
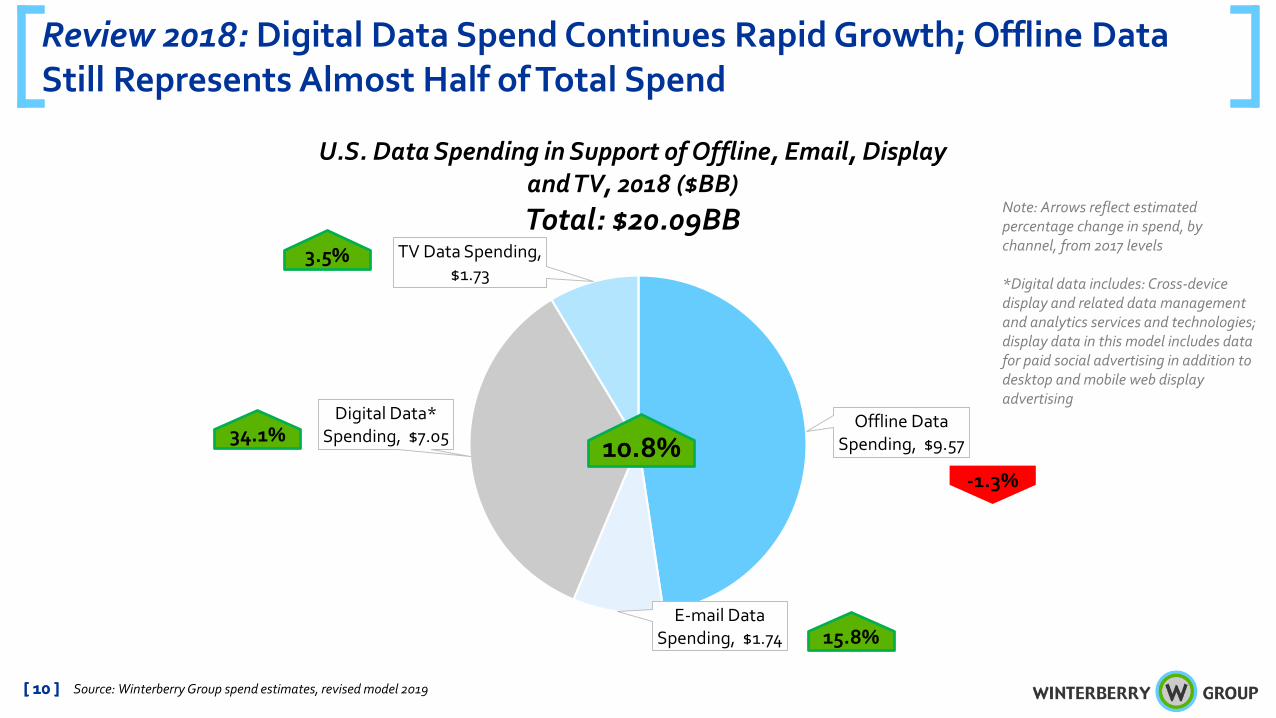
Review 2018: Digital Data Spend Continues Rapid Growth; Offline Data Still Represents Almost Half of Total Spend
Source: Winterberry Group spend estimates, revised model 2019
Note: Arrows reflect estimated percentage change in spend, by channel, from 2017 levels
*Digital data includes: Cross-device display and related data management and analytics services and technologies; display data in this model includes data for paid social advertising in addition to desktop and mobile web display advertising
[ 10 ]
Offline Data Spending, $9.57
E-mail Data Spending, $1.74
Digital Data* Spending, $7.05
TV Data Spending, $1.73
U.S. Data Spending in Support of Offline, Email, Display and TV, 2018 ($BB)Total: $20.09BB
15.8%
3.5%
34.1%
-1.3%10.8%
[ 10 ]
• Linear TV held on to the top channel spend, though it’s under attack from OTT—where ad views were up 25%+ last year; furthermore, cord-cutting and “un-bundling” of media services accelerated with OTT growth
• Addressable TV ad spend reached its forecasted $2.3BB in 2018, and growth is expected to continue as data-driven approaches and programmatic capabilities expand
• Digital video ad spending* up 30% to nearly $28BB—nearly 25% of digital ad spending
• Nielsen’s contract negotiations with CBS were just resolved, but the real question remains: what is the future of measurement?
Offline Channel Highlights: Direct Mail Rebounds; Linear TV Slips to Alternative Video Channels
[ 11 ]
• 2018 direct mail volumes decreased, then increased over the last 6 months of the year—a complete flip from the prior year
• Paper and postage costs are going to be up in 2019, and logistics costs may also rise due to increases in labor and fuel expenses; these changes likely to drive spending—though not necessarily volume—up. Of course, this is macro-economically sensitive
• More consolidation is expected as new and existing producers add scale, capability and geographic footprint
*Digital video here refers to all digital video spend, including paid video within social networks, social network games and social network apps (per eMarketer, 2018)Sources: Winterberry Group spend estimates (revised model 2019), USPS, eMarketer, FreeWheel
Online Channel Highlights: With FB Pain, Amazon Steals Spend from Duopoly; Elsewhere, Programmatic Maintains Share Growth, More Fraud
[ 12 ] Sources: Facebook, eMarketer, Adweek, Linqia, Adweek Pixelate, Digiday, Activate
• Programmatic continued to gain share of digital display buying and reached 82.5% of ad spend in 2018; shift toward in-house teams accelerates
• While ad spend grew across segments of display, growth is slowing and technology/data costs are consuming 25% of each media dollar spent
• While brand safety improved, fraud remains a significant issue, especially as fraud in OTT video is estimated at 19%; overall, $20BB is still lost to ad fraud each year
• Despite more than 2.6BB global accounts, Facebook had a tough year, from Cambridge Analytica to Russian trolls, fake news, troubling data deals with device manufacturers and the 30MM member hack
• Meanwhile, the Duopoly saw a reduction in digital ad spend share from 61% to 57.7%, with Amazon picking up 4.1% (leaving only 38% for the rest); Amazon is expected to grab 7% of share over the next 24 months
• It is estimated that influencer marketing will grow from a $2BB industry in 2017 to a $10BB industry by 2020; marketers cite engagement (90%), clicks (59%), impressions (55%), conversions (54%), and reach (50%) as the most popular measures of influencer success
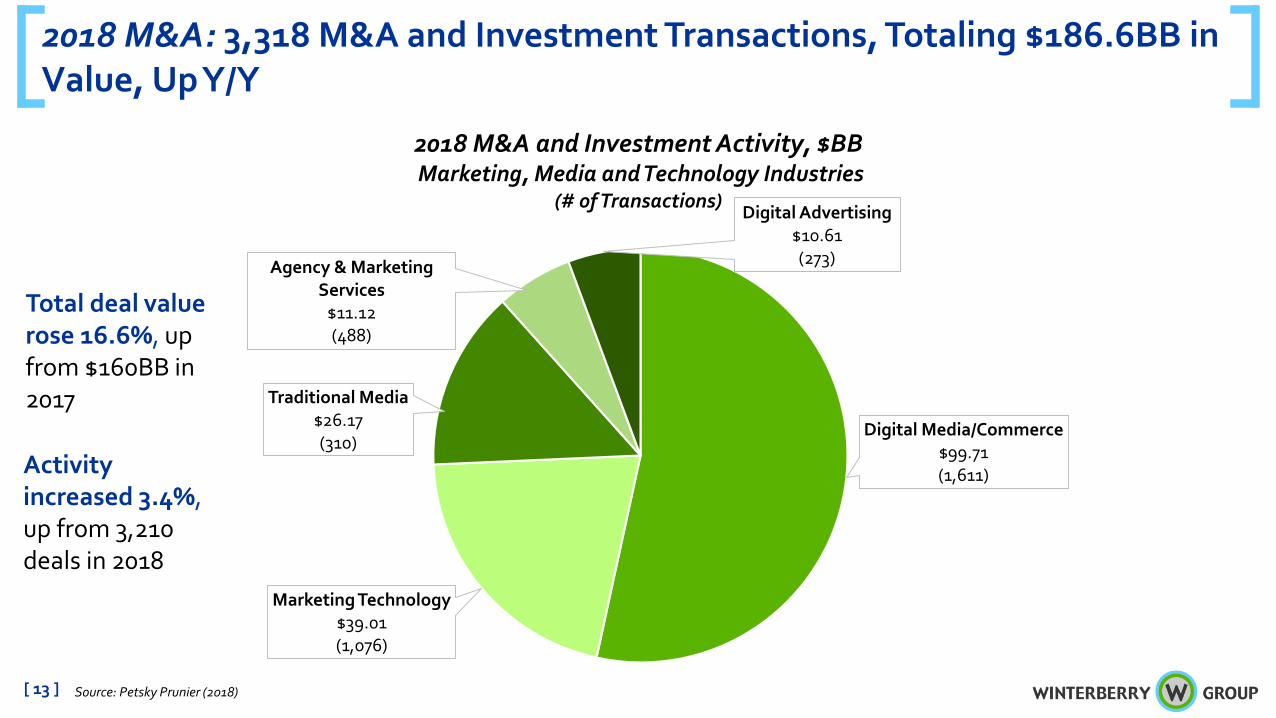
2018 M&A: 3,318 M&A and Investment Transactions, Totaling $186.6BB in Value, Up Y/Y
[ 13 ]
Digital Media/Commerce$99.71 (1,611)
Marketing Technology$39.01 (1,076)
Traditional Media$26.17 (310)
Agency & Marketing Services
$11.12 (488)
Digital Advertising$10.61 (273)
2018 M&A and Investment Activity, $BBMarketing, Media and Technology Industries
(# of Transactions)
Source: Petsky Prunier (2018)
Total deal value rose 16.6%, up from $160BB in 2017
Activity increased 3.4%, up from 3,210 deals in 2018
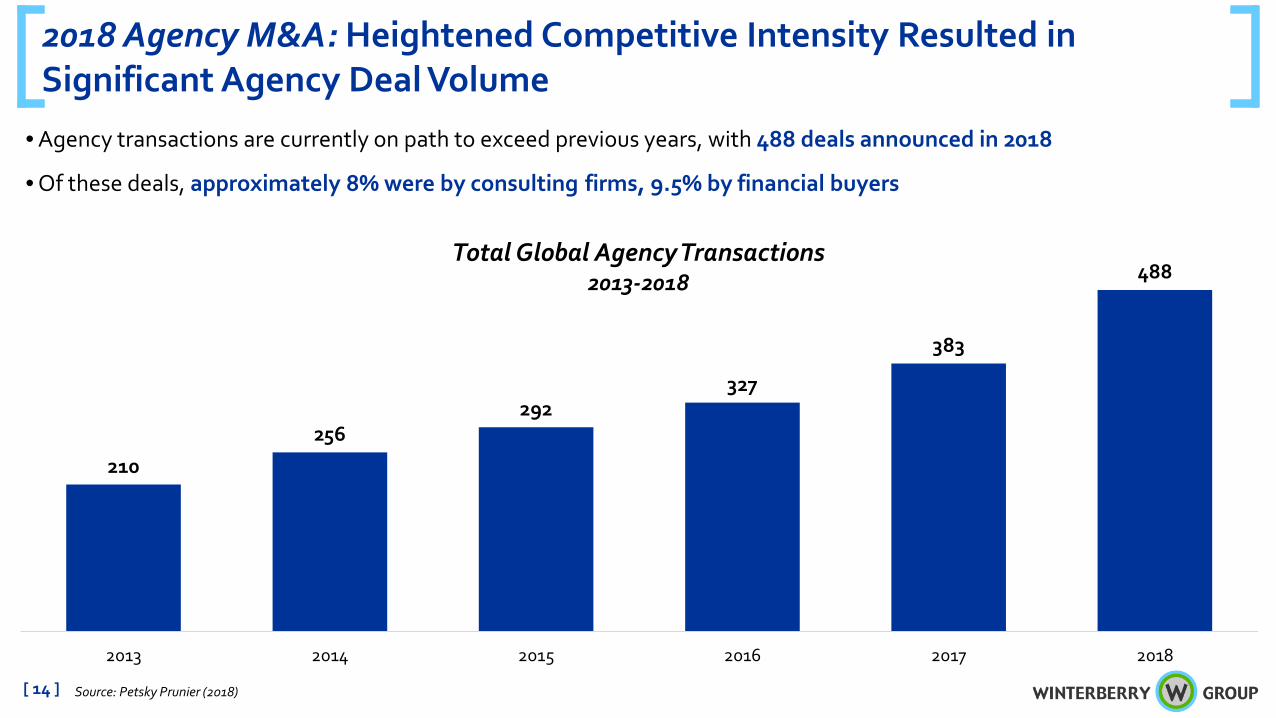
• Agency transactions are currently on path to exceed previous years, with 488 deals announced in 2018
• Of these deals, approximately 8% were by consulting firms, 9.5% by financial buyers
2018 Agency M&A: Heightened Competitive Intensity Resulted in Significant Agency Deal Volume
[ 14 ]
210
256292
327
383
488
2013 2014 2015 2016 2017 2018
Total Global Agency Transactions2013-2018
Source: Petsky Prunier (2018)
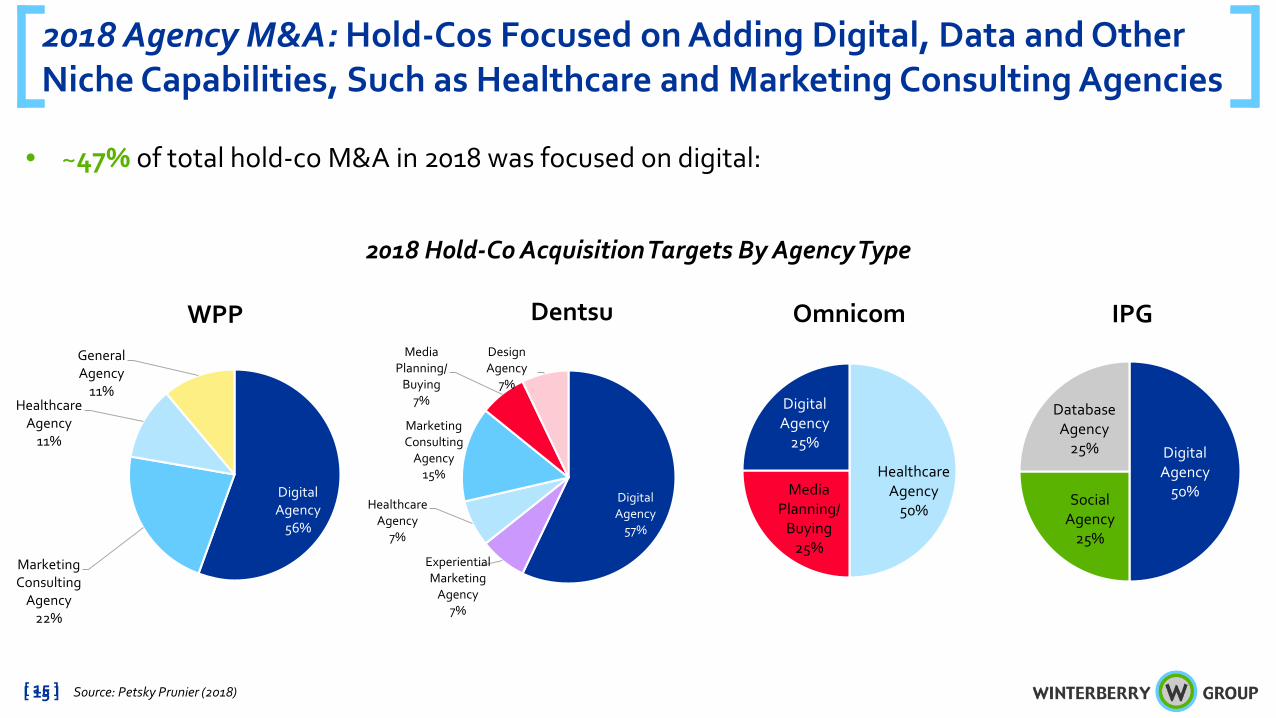
Digital Agency
50%Social Agency
25%
Database Agency
25%
Digital Agency
56%
Marketing Consulting
Agency22%
Healthcare Agency
11%
General Agency
11%
2018 Agency M&A: Hold-Cos Focused on Adding Digital, Data and Other Niche Capabilities, Such as Healthcare and Marketing Consulting Agencies
Source: Petsky Prunier (2018)
Digital Agency
57%
Experiential Marketing
Agency7%
Healthcare Agency
7%
Marketing Consulting
Agency15%
Media Planning/
Buying7%
Design Agency
7%
• ~47% of total hold-co M&A in 2018 was focused on digital:
Healthcare Agency
50%Media
Planning/ Buying
25%
Digital Agency
25%
WPP IPGOmnicomDentsu
2018 Hold-Co Acquisition Targets By Agency Type
[ 15 ][ 15 ]
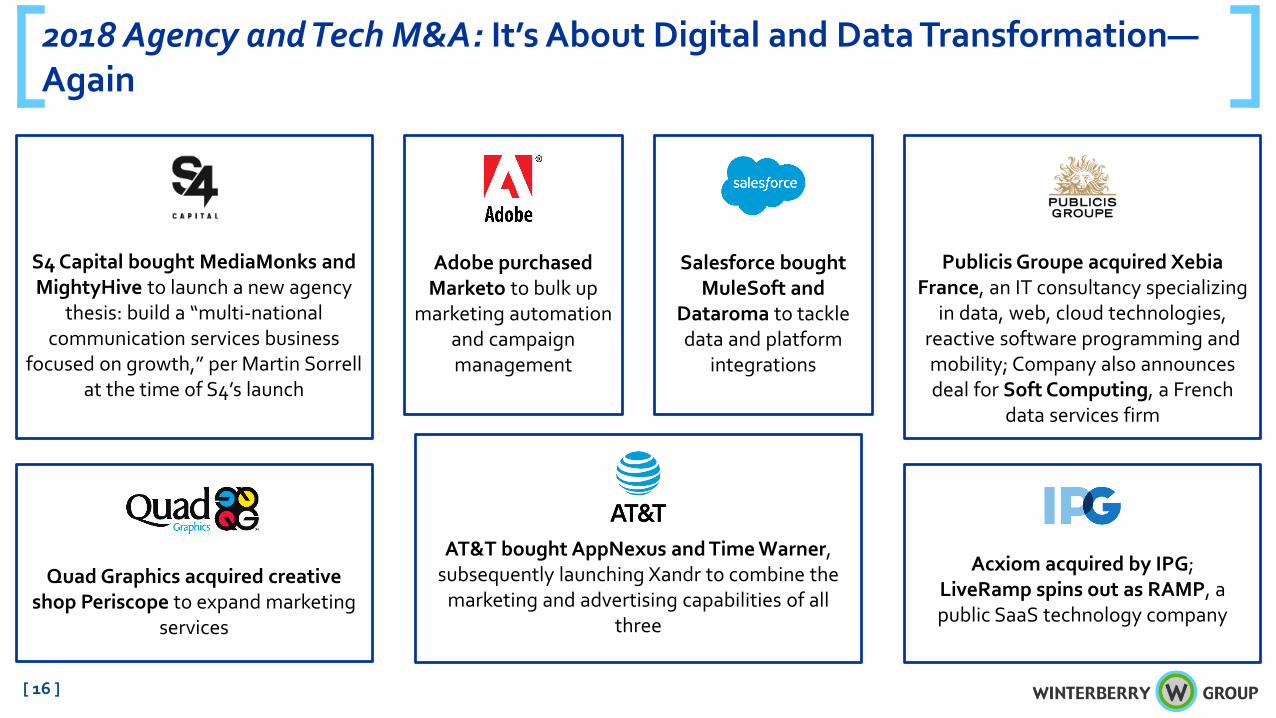
2018 Agency and Tech M&A: It’s About Digital and Data Transformation—Again
[ 16 ]
Acxiom acquired by IPG; LiveRamp spins out as RAMP, a public SaaS technology company
AT&T bought AppNexus and Time Warner, subsequently launching Xandr to combine the
marketing and advertising capabilities of all three
Quad Graphics acquired creative shop Periscope to expand marketing
services
S4 Capital bought MediaMonks and MightyHive to launch a new agency
thesis: build a “multi-national communication services business
focused on growth,” per Martin Sorrell at the time of S4’s launch
Adobe purchased Marketo to bulk up
marketing automation and campaign management
Salesforce bought MuleSoft and
Dataroma to tackle data and platform
integrations
Publicis Groupe acquired XebiaFrance, an IT consultancy specializing
in data, web, cloud technologies, reactive software programming and mobility; Company also announces deal for Soft Computing, a French
data services firm

Trends to Watch for 2019
Outlook 2019
The 2018 Recap
Emerging Maturing
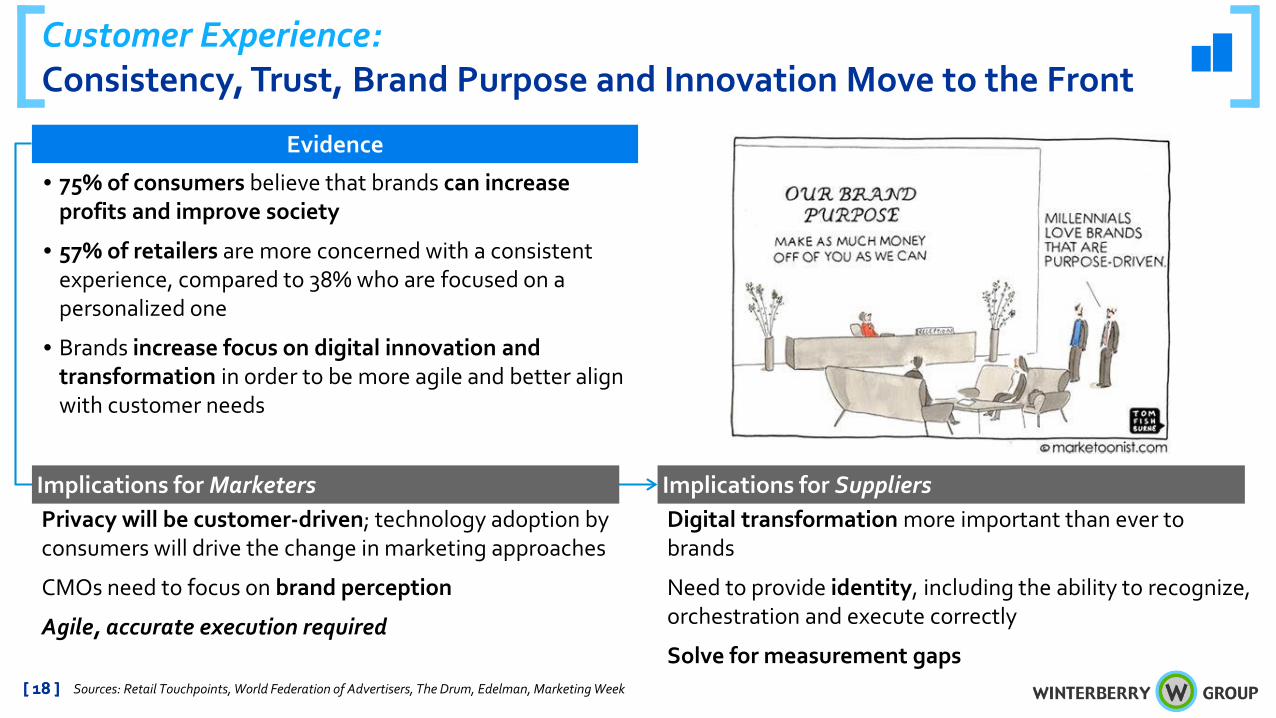
Customer Experience:Consistency, Trust, Brand Purpose and Innovation Move to the Front
Sources: Retail Touchpoints, World Federation of Advertisers, The Drum, Edelman, Marketing Week
Evidence
• 75% of consumers believe that brands can increase profits and improve society
• 57% of retailers are more concerned with a consistent experience, compared to 38% who are focused on a personalized one
• Brands increase focus on digital innovation and transformation in order to be more agile and better align with customer needs
Implications for MarketersPrivacy will be customer-driven; technology adoption by consumers will drive the change in marketing approaches
CMOs need to focus on brand perception
Agile, accurate execution required
Digital transformation more important than ever to brands
Need to provide identity, including the ability to recognize, orchestration and execute correctly
Solve for measurement gaps
Implications for Suppliers
[ 18 ][ 18 ]
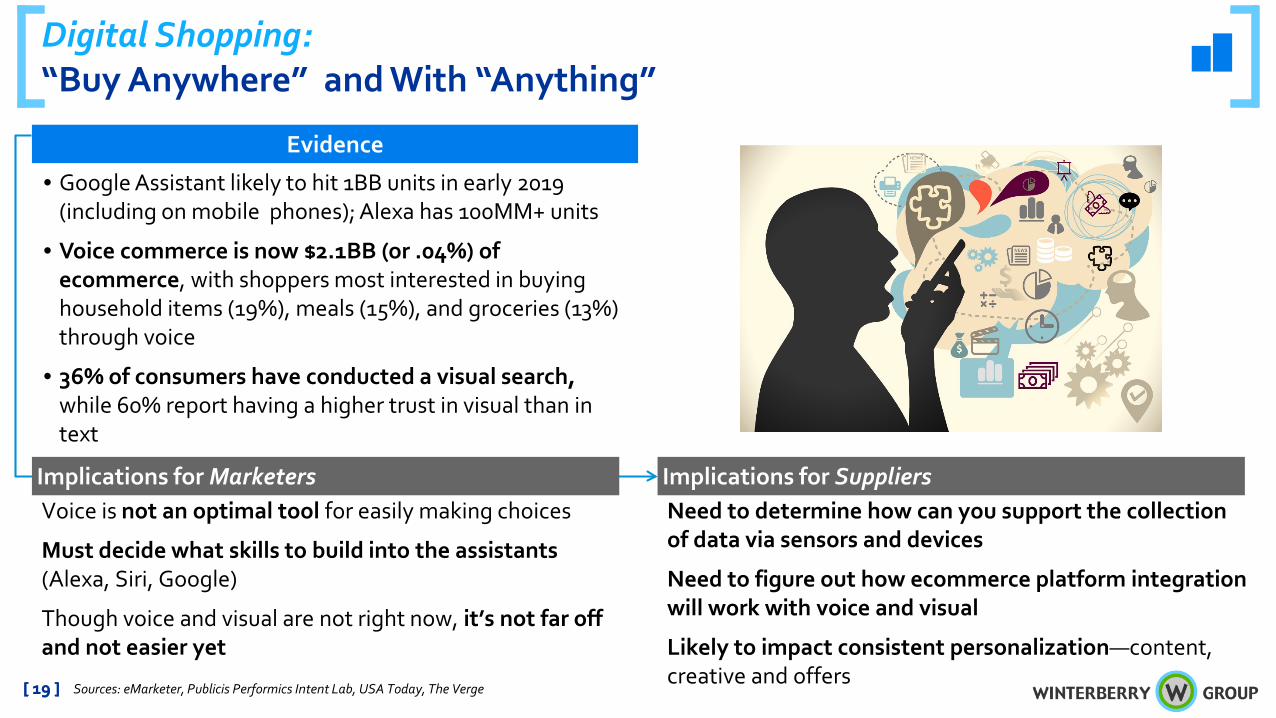
Digital Shopping:“Buy Anywhere” and With “Anything”
Sources: eMarketer, Publicis Performics Intent Lab, USA Today, The Verge
Evidence
• Google Assistant likely to hit 1BB units in early 2019 (including on mobile phones); Alexa has 100MM+ units
• Voice commerce is now $2.1BB (or .04%) of ecommerce, with shoppers most interested in buying household items (19%), meals (15%), and groceries (13%) through voice
• 36% of consumers have conducted a visual search, while 60% report having a higher trust in visual than in text
Implications for MarketersVoice is not an optimal tool for easily making choices
Must decide what skills to build into the assistants (Alexa, Siri, Google)
Though voice and visual are not right now, it’s not far off and not easier yet
Need to determine how can you support the collection of data via sensors and devices
Need to figure out how ecommerce platform integration will work with voice and visual
Likely to impact consistent personalization—content, creative and offers
Implications for Suppliers
[ 19 ][ 19 ]
Connectivity and IoT:To Complement Voice…We Need More Connected Devices
Sources: Gartner, eMarketer, CCS Insight, Everyday Hearing Blog, VerywellHealth.com
Evidence
• Worldwide shipments of ear-worn devices are projected to pass those of smartwatches by 2022 (158.43MM ear-worn units vs. 115.20MM million watches); hearables (which exclude devices that only play music), went from 2MM units in 2017 to 6MM in 2018
• Sleepables (including sleeping sensors, headbands and facemasks) are likely the next wearables
• At CES 2019, P&G released six new AI-based beauty products, including connected/heated razors
Implications for MarketersVoice is key, but being able to hear and better leverage voice is also critical; it will not be an “either/or”
The connected home is not just about thermostats—other smart home tech is developing
Think about skills the way you think about apps
More data, more AI, more complex customer journeys to map—even if the touchpoint is not for buying
Need to watch for how eCommerce/connected commerce will change
Suppliers must have a point of view on connected devices
Implications for Suppliers
[ 20 ]
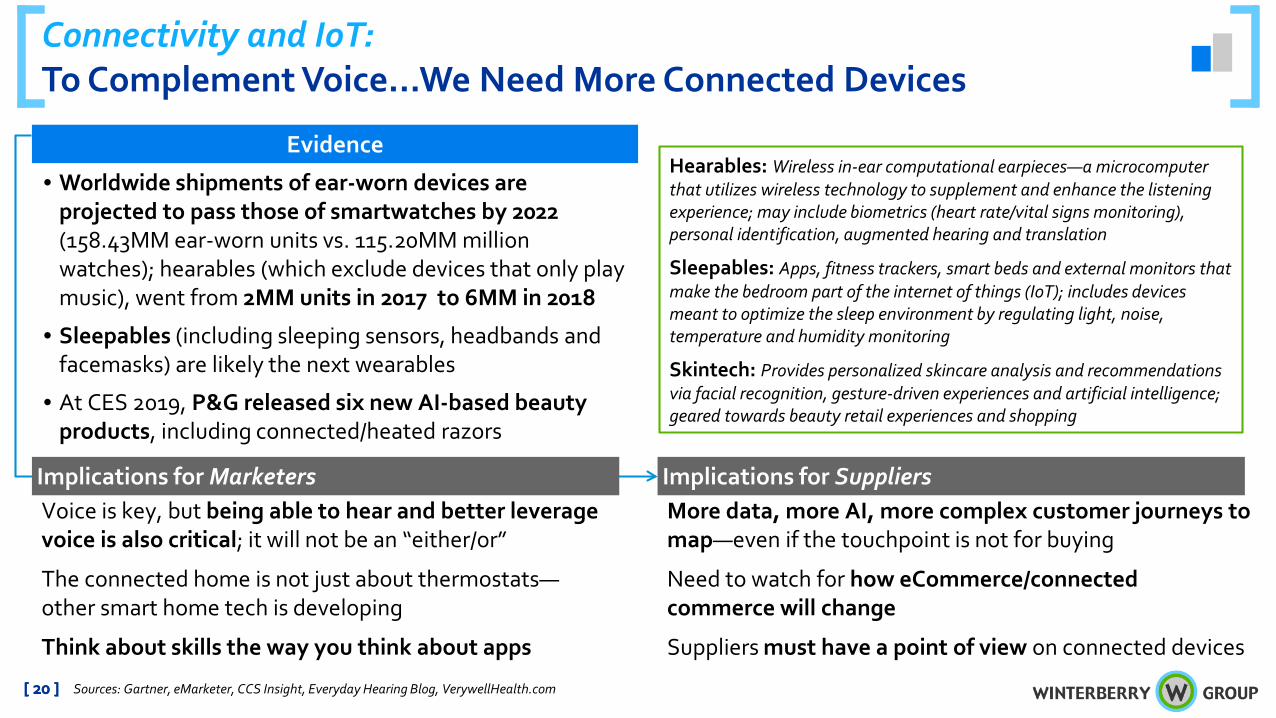
Hearables: Wireless in-ear computational earpieces—a microcomputer that utilizes wireless technology to supplement and enhance the listening experience; may include biometrics (heart rate/vital signs monitoring), personal identification, augmented hearing and translation
Sleepables: Apps, fitness trackers, smart beds and external monitors that make the bedroom part of the internet of things (IoT); includes devices meant to optimize the sleep environment by regulating light, noise, temperature and humidity monitoring
Skintech: Provides personalized skincare analysis and recommendations via facial recognition, gesture-driven experiences and artificial intelligence; geared towards beauty retail experiences and shopping
[ 20 ]
AI and decisioning require more data; need for real-time, new architecture and deeper AdTech/MarTech integration
Deeper, faster insights are available—but will they be trackable and auditable?
Voice, natural language processing and visual will require new skills
Personalization and Decisioning:AI Rising To Meet Real Time and Right Time Engagement
Sources: IDC, IBM
Evidence• From 2017 to 2018, worldwide spending on AI and cognitive
computing increased by more than 50%—to an estimated $19.1BB worldwide; expected to rise to $52.1BB by 2021
• The rise of AI could lead to the emergence of 'consulgencies,’ (consultancy/agency hybrids) that hold expertise in both customer experience and technical integration, development and strategy
• Retail and banking expected to lead AI spending in 2019, focusing on automated CSRs, expert shopping advisors, automated threat intelligence and fraud analysis use cases
Implications for MarketersRise of CDPs, which can process in real-time
Need to master data integration, personalization and orchestration applications
Increase in headless applications directed by AI
Need to deliver omnichannel personalization (eventually)
Implications for Suppliers
[ 21 ][ 21 ]
Rise of the headless applications!
Programmatic Media:From In-Housing to Transparency
Sources: eMarketer, Centro, Infectious Media
Evidence• Programmatic approaches dominate display; programmatic
for video (both digital and linear) is growing, though the latter is nascent (only 2.5% of all linear is programmatic today)
• Brands are going direct to DSPs, diluting the role of media agencies but not eliminating it; there’s also consolidation of the number of DSPs used (avg of 3.5)
• Rise of in-house support specialists likely dominated by consultancies moving forward (MightyHive, Accenture)
Implications for MarketersFocus remains on improving brand safety, views are secondary
Insourcing evaluation continues—while 62% of marketers report they’ll move some or all in house in the next five years, only 1.4% have fully done so
Partner accountability (media agencies, publishers) and transparency are top of mind
Held to higher and higher standards; demand for transparency will lead to margin compression
Will continue to develop improved (and more) uses for data
Onus to solve accountability/fraud issues and provide enhanced marketing attribution stays with suppliers
Implications for Suppliers
[ 22 ]
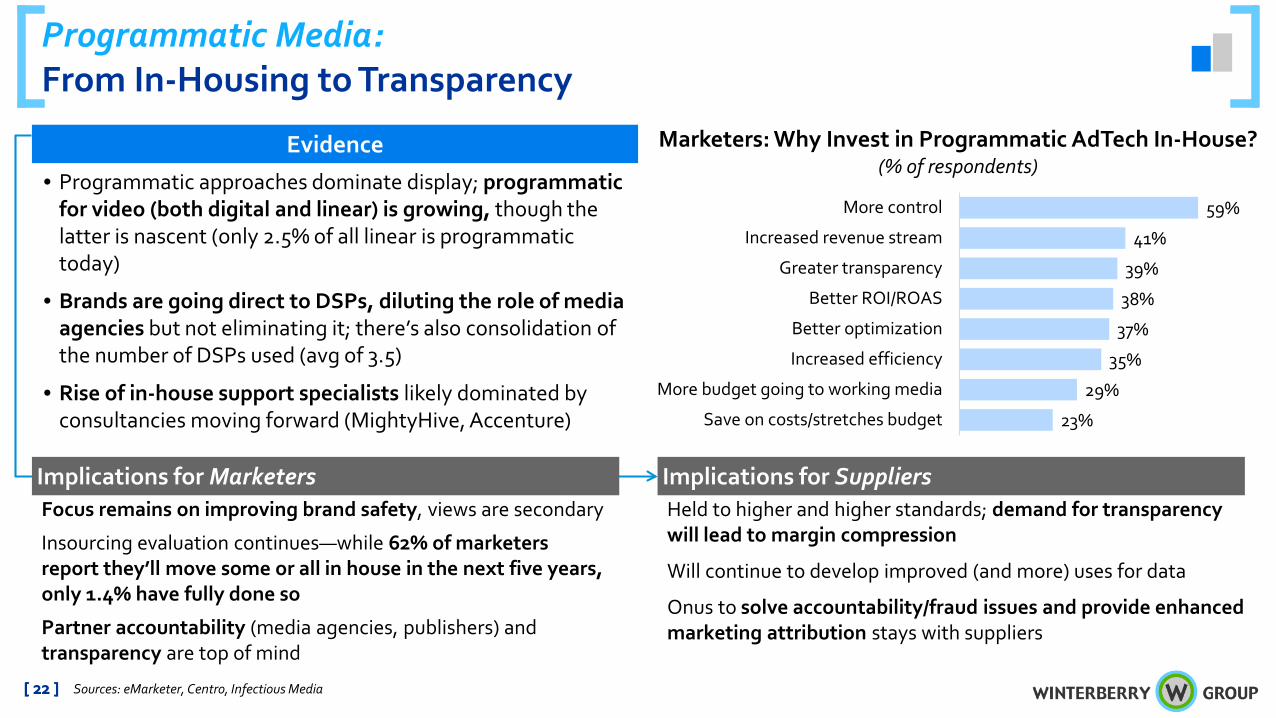
Marketers: Why Invest in Programmatic AdTech In-House? (% of respondents)
23%
29%
35%
37%
38%
39%
41%
59%
Save on costs/stretches budget
More budget going to working media
Increased efficiency
Better optimization
Better ROI/ROAS
Greater transparency
Increased revenue stream
More control
[ 22 ]
Loyalty:It’s About Subscription and Experience
Sources: Gartner, Accenture, eMarketer, Bond Brand Loyalty, Excentus, Mordor Intelligence
Evidence• The global loyalty management market was valued
at $2.1BB in 2017; it’s estimated to grow to $6.8BB by 2023
• 36% of loyalty members shop based on program, while 21% scheduled shopping based on enhanced rewards
• Momentum grows for paid tier/subscription offerings for additional benefits; marketers fund added benefits to enhance brand experience (Ex: Restoration Hardware, Wayfair)
• Recent resurgence of interest in “gamifying” rewards programs to support fun/engagement (Ex: Starbucks)
Implications for MarketersLoyalty via experiences rising
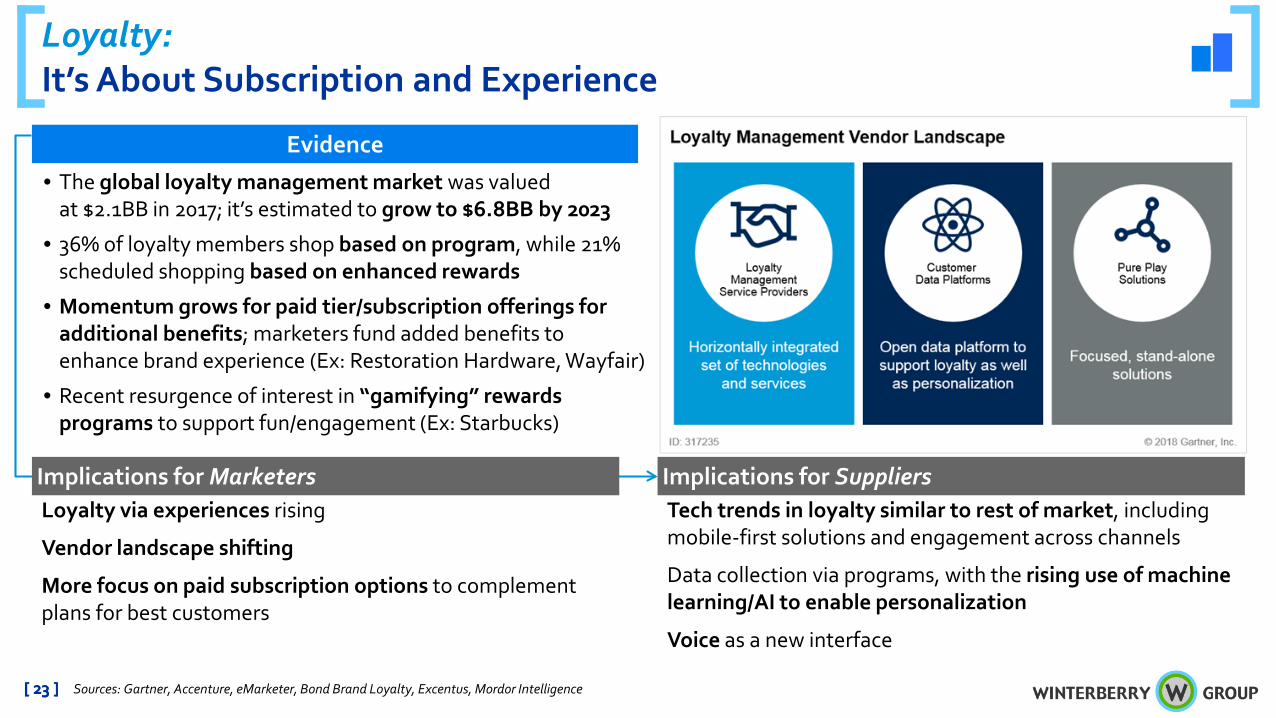
Vendor landscape shifting
More focus on paid subscription options to complement plans for best customers
Tech trends in loyalty similar to rest of market, including mobile-first solutions and engagement across channels
Data collection via programs, with the rising use of machine learning/AI to enable personalization
Voice as a new interface
Implications for Suppliers
[ 23 ][ 23 ]
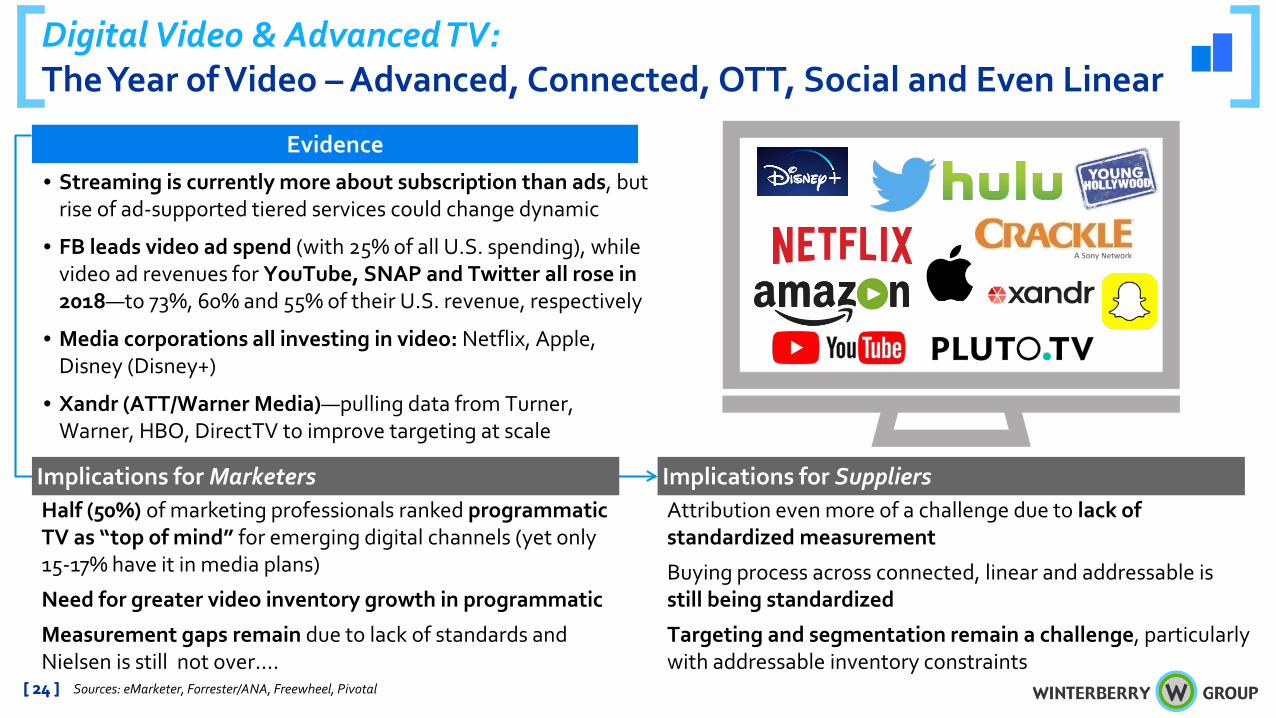
Digital Video & Advanced TV:The Year of Video – Advanced, Connected, OTT, Social and Even Linear
Sources: eMarketer, Forrester/ANA, Freewheel, Pivotal
Evidence• Streaming is currently more about subscription than ads, but
rise of ad-supported tiered services could change dynamic
• FB leads video ad spend (with 25% of all U.S. spending), while video ad revenues for YouTube, SNAP and Twitter all rose in 2018—to 73%, 60% and 55% of their U.S. revenue, respectively
• Media corporations all investing in video: Netflix, Apple, Disney (Disney+)
• Xandr (ATT/Warner Media)—pulling data from Turner, Warner, HBO, DirectTV to improve targeting at scale
Implications for MarketersHalf (50%) of marketing professionals ranked programmatic TV as “top of mind” for emerging digital channels (yet only 15-17% have it in media plans)
Need for greater video inventory growth in programmatic
Measurement gaps remain due to lack of standards and Nielsen is still not over….
Attribution even more of a challenge due to lack of standardized measurement
Buying process across connected, linear and addressable is still being standardized
Targeting and segmentation remain a challenge, particularly with addressable inventory constraints
Implications for Suppliers
[ 24 ][ 24 ]
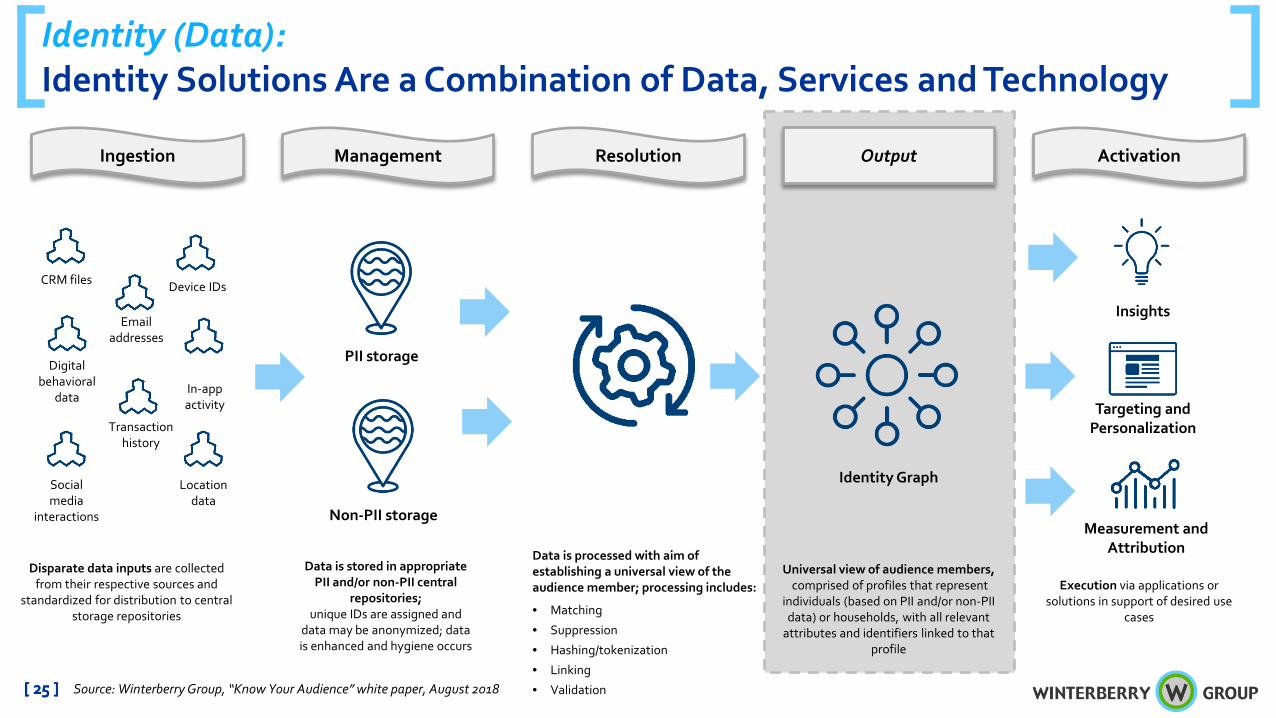
Identity (Data):Identity Solutions Are a Combination of Data, Services and Technology
Ingestion Management Resolution Output Activation
CRM files
Email addresses
Digital behavioral
dataIn-app activity
Device IDs
Location data
Transaction history
Social media
interactions
Disparate data inputs are collected from their respective sources and
standardized for distribution to central storage repositories
PII storage
Non-PII storage
Data is stored in appropriate PII and/or non-PII central
repositories; unique IDs are assigned and
data may be anonymized; data is enhanced and hygiene occurs
Data is processed with aim of establishing a universal view of the audience member; processing includes:
• Matching
• Suppression
• Hashing/tokenization
• Linking
• Validation
Identity Graph
Universal view of audience members, comprised of profiles that represent
individuals (based on PII and/or non-PII data) or households, with all relevant
attributes and identifiers linked to that profile
Insights
Targeting and Personalization
Measurement and Attribution
Execution via applications or solutions in support of desired use
cases
[ 25 ] Source: Winterberry Group, “Know Your Audience” white paper, August 2018[ 25 ]
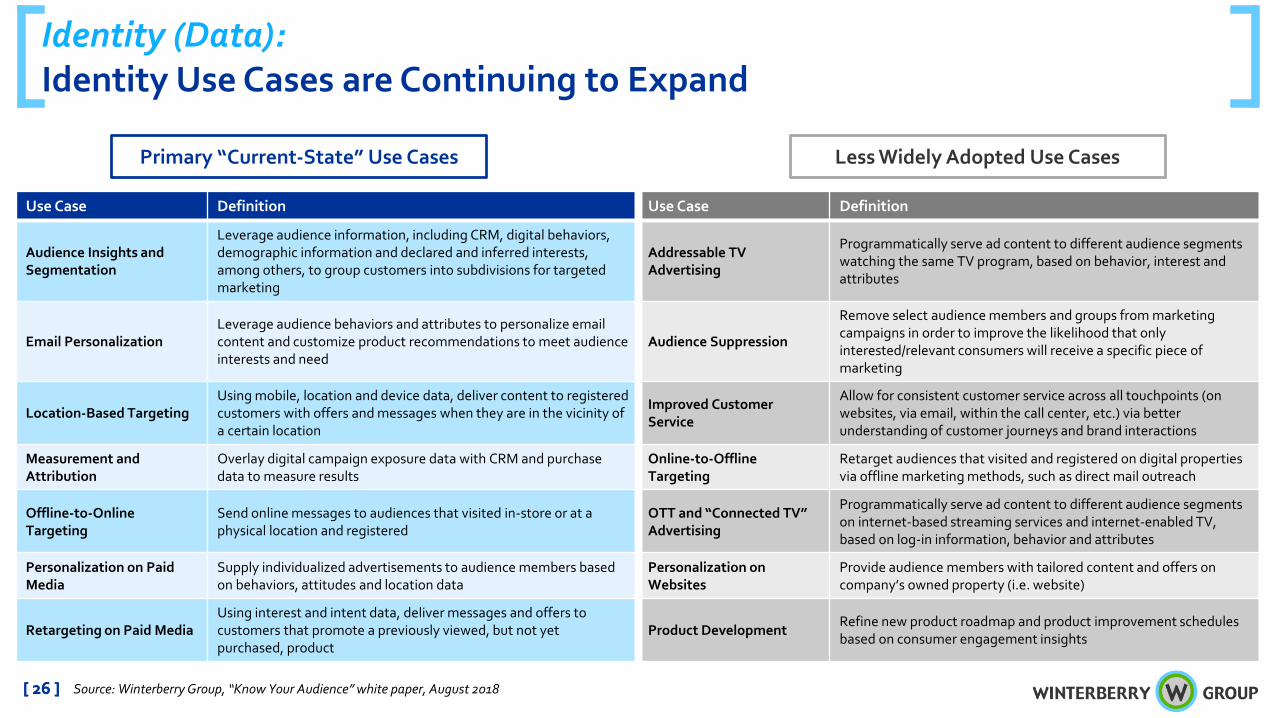
Identity (Data):Identity Use Cases are Continuing to Expand
Use Case Definition Use Case Definition
Audience Insights and Segmentation
Leverage audience information, including CRM, digital behaviors, demographic information and declared and inferred interests, among others, to group customers into subdivisions for targeted marketing
Addressable TV Advertising
Programmatically serve ad content to different audience segments watching the same TV program, based on behavior, interest and attributes
Email PersonalizationLeverage audience behaviors and attributes to personalize email content and customize product recommendations to meet audience interests and need
Audience Suppression
Remove select audience members and groups from marketing campaigns in order to improve the likelihood that only interested/relevant consumers will receive a specific piece of marketing
Location-Based TargetingUsing mobile, location and device data, deliver content to registered customers with offers and messages when they are in the vicinity of a certain location
Improved Customer Service
Allow for consistent customer service across all touchpoints (on websites, via email, within the call center, etc.) via better understanding of customer journeys and brand interactions
Measurement and Attribution
Overlay digital campaign exposure data with CRM and purchase data to measure results
Online-to-Offline Targeting
Retarget audiences that visited and registered on digital properties via offline marketing methods, such as direct mail outreach
Offline-to-Online Targeting
Send online messages to audiences that visited in-store or at a physical location and registered
OTT and “Connected TV” Advertising
Programmatically serve ad content to different audience segments on internet-based streaming services and internet-enabled TV, based on log-in information, behavior and attributes
Personalization on Paid Media
Supply individualized advertisements to audience members based on behaviors, attitudes and location data
Personalization on Websites
Provide audience members with tailored content and offers on company’s owned property (i.e. website)
Retargeting on Paid MediaUsing interest and intent data, deliver messages and offers to customers that promote a previously viewed, but not yet purchased, product
Product DevelopmentRefine new product roadmap and product improvement schedules based on consumer engagement insights
Primary “Current-State” Use Cases Less Widely Adopted Use Cases
[ 26 ] Source: Winterberry Group, “Know Your Audience” white paper, August 2018[ 26 ]
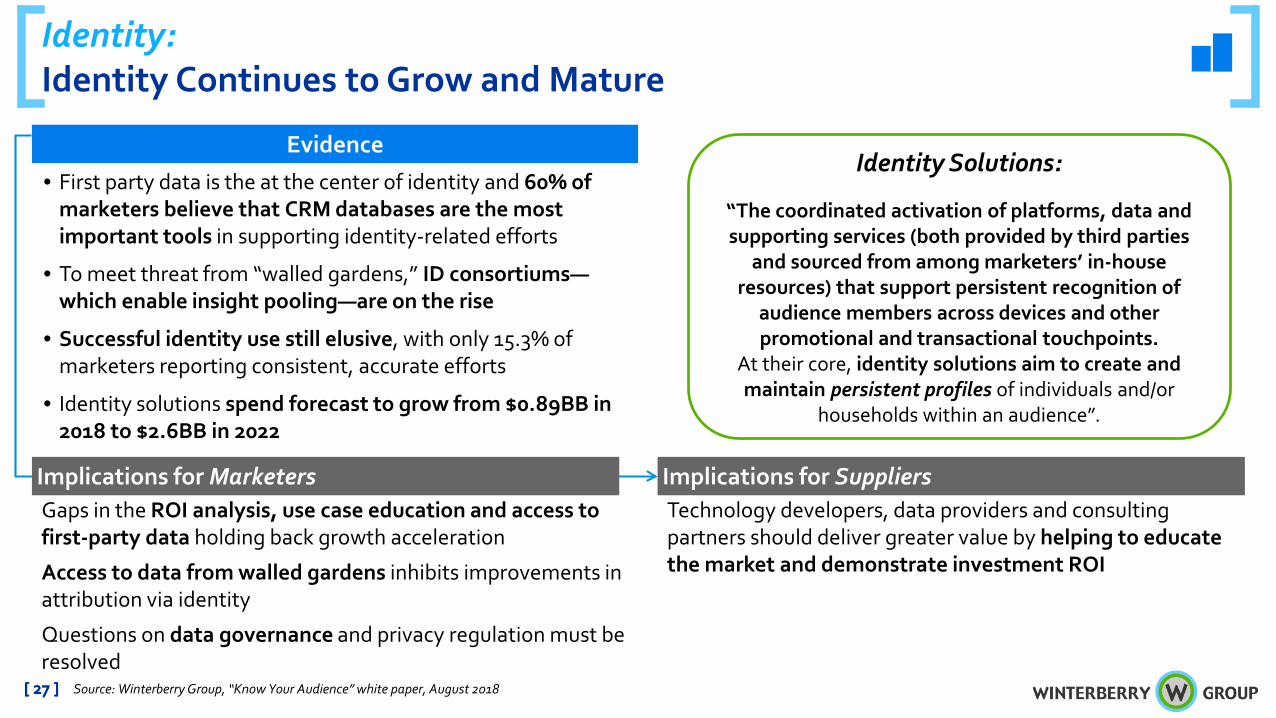
Identity:Identity Continues to Grow and Mature
Evidence• First party data is the at the center of identity and 60% of
marketers believe that CRM databases are the most important tools in supporting identity-related efforts
• To meet threat from “walled gardens,” ID consortiums—which enable insight pooling—are on the rise
• Successful identity use still elusive, with only 15.3% of marketers reporting consistent, accurate efforts
• Identity solutions spend forecast to grow from $0.89BB in 2018 to $2.6BB in 2022
Implications for MarketersGaps in the ROI analysis, use case education and access to first-party data holding back growth acceleration
Access to data from walled gardens inhibits improvements in attribution via identity
Questions on data governance and privacy regulation must be resolved
Technology developers, data providers and consulting partners should deliver greater value by helping to educate the market and demonstrate investment ROI
Implications for Suppliers
[ 27 ]
Identity Solutions:
“The coordinated activation of platforms, data and supporting services (both provided by third parties
and sourced from among marketers’ in-house resources) that support persistent recognition of
audience members across devices and other promotional and transactional touchpoints.
At their core, identity solutions aim to create and maintain persistent profiles of individuals and/or
households within an audience”.
Source: Winterberry Group, “Know Your Audience” white paper, August 2018[ 27 ]
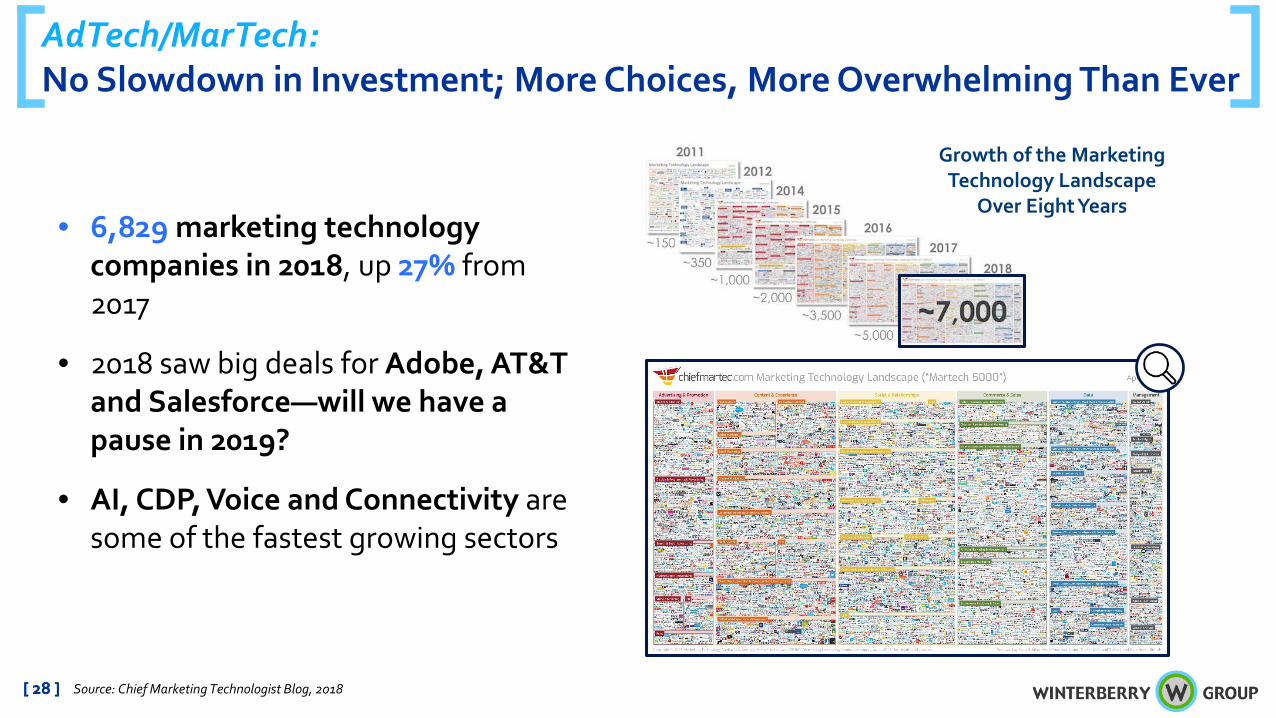
AdTech/MarTech: No Slowdown in Investment; More Choices, More Overwhelming Than Ever
• 6,829 marketing technology companies in 2018, up 27% from 2017
• 2018 saw big deals for Adobe, AT&T and Salesforce—will we have a pause in 2019?
• AI, CDP, Voice and Connectivity aresome of the fastest growing sectors
Growth of the Marketing Technology Landscape
Over Eight Years
[ 28 ] Source: Chief Marketing Technologist Blog, 2018[ 28 ]
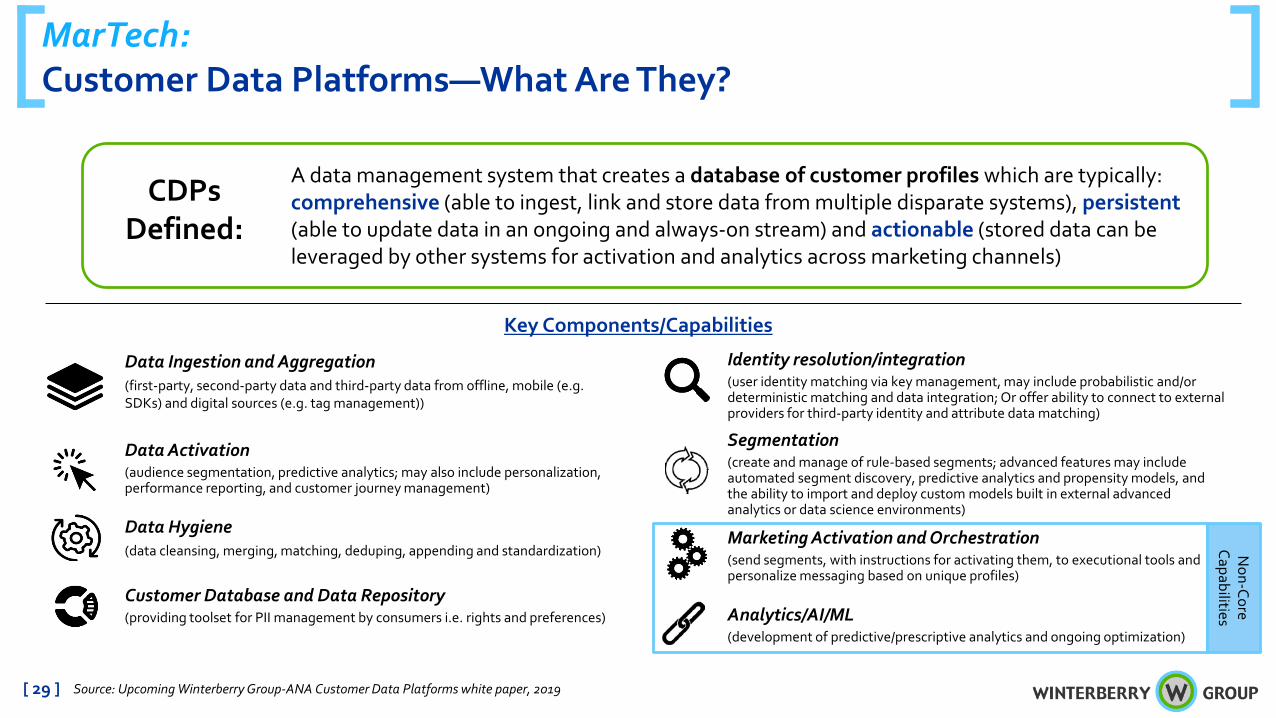
MarTech:Customer Data Platforms—What Are They?
[ 29 ] Source: Upcoming Winterberry Group-ANA Customer Data Platforms white paper, 2019
Key Components/Capabilities
Analytics/AI/ML(development of predictive/prescriptive analytics and ongoing optimization)
Data Hygiene(data cleansing, merging, matching, deduping, appending and standardization)
Data Activation(audience segmentation, predictive analytics; may also include personalization, performance reporting, and customer journey management)
Data Ingestion and Aggregation (first-party, second-party data and third-party data from offline, mobile (e.g. SDKs) and digital sources (e.g. tag management))
Identity resolution/integration(user identity matching via key management, may include probabilistic and/or deterministic matching and data integration; Or offer ability to connect to external providers for third-party identity and attribute data matching)
Segmentation(create and manage of rule-based segments; advanced features may include automated segment discovery, predictive analytics and propensity models, and the ability to import and deploy custom models built in external advanced analytics or data science environments)
Customer Database and Data Repository(providing toolset for PII management by consumers i.e. rights and preferences)
Marketing Activation and Orchestration(send segments, with instructions for activating them, to executional tools and personalize messaging based on unique profiles)
Non-Core
Capabilities
A data management system that creates a database of customer profiles which are typically: comprehensive (able to ingest, link and store data from multiple disparate systems), persistent (able to update data in an ongoing and always-on stream) and actionable (stored data can be leveraged by other systems for activation and analytics across marketing channels)
CDPs Defined:
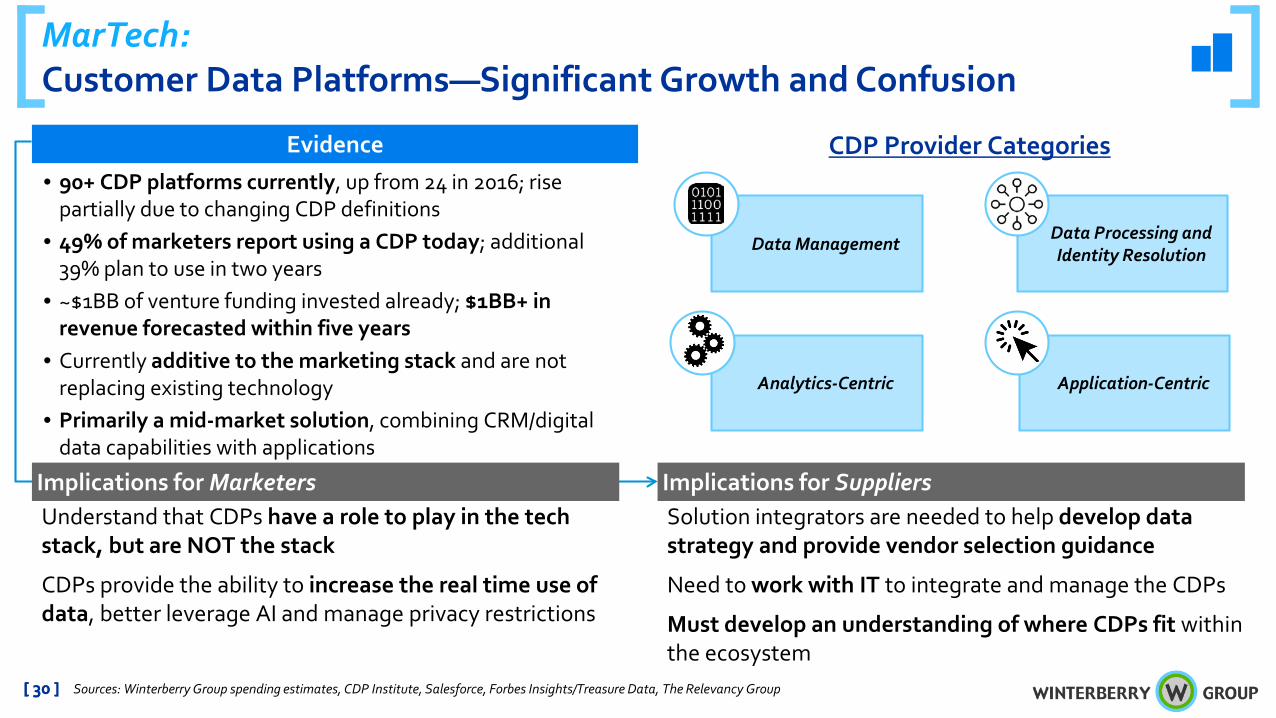
MarTech:Customer Data Platforms—Significant Growth and Confusion
Sources: Winterberry Group spending estimates, CDP Institute, Salesforce, Forbes Insights/Treasure Data, The Relevancy Group
Evidence• 90+ CDP platforms currently, up from 24 in 2016; rise
partially due to changing CDP definitions• 49% of marketers report using a CDP today; additional
39% plan to use in two years• ~$1BB of venture funding invested already; $1BB+ in
revenue forecasted within five years• Currently additive to the marketing stack and are not
replacing existing technology• Primarily a mid-market solution, combining CRM/digital
data capabilities with applications
Implications for MarketersUnderstand that CDPs have a role to play in the tech stack, but are NOT the stack
CDPs provide the ability to increase the real time use of data, better leverage AI and manage privacy restrictions
Solution integrators are needed to help develop data strategy and provide vendor selection guidance
Need to work with IT to integrate and manage the CDPs
Must develop an understanding of where CDPs fit within the ecosystem
Implications for Suppliers
[ 30 ][ 30 ]
CDP Provider Categories
Analytics-Centric
Data Processing and Identity Resolution
Data Management
Application-Centric
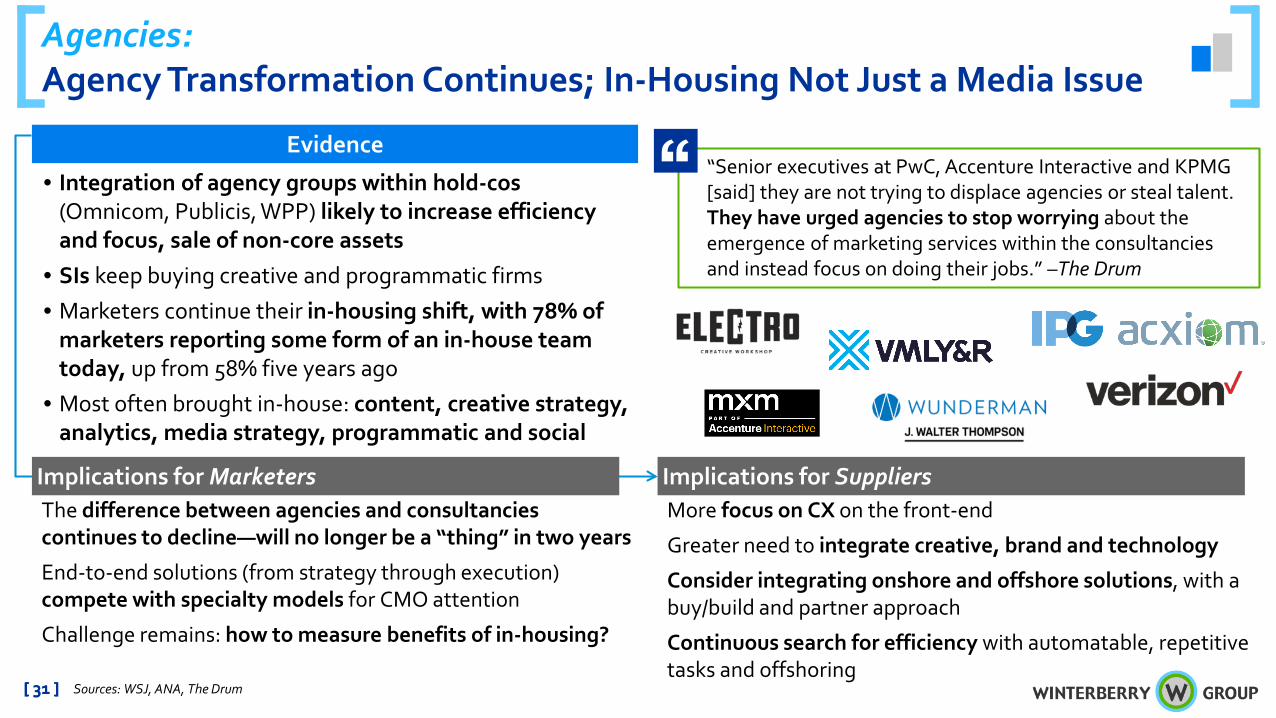
The difference between agencies and consultancies continues to decline—will no longer be a “thing” in two years
End-to-end solutions (from strategy through execution) compete with specialty models for CMO attention
Challenge remains: how to measure benefits of in-housing?
Agencies:Agency Transformation Continues; In-Housing Not Just a Media Issue
Sources: WSJ, ANA, The Drum
Evidence
• Integration of agency groups within hold-cos (Omnicom, Publicis, WPP) likely to increase efficiency and focus, sale of non-core assets
• SIs keep buying creative and programmatic firms• Marketers continue their in-housing shift, with 78% of
marketers reporting some form of an in-house team today, up from 58% five years ago
• Most often brought in-house: content, creative strategy, analytics, media strategy, programmatic and social
Implications for MarketersMore focus on CX on the front-end
Greater need to integrate creative, brand and technology
Consider integrating onshore and offshore solutions, with a buy/build and partner approach
Continuous search for efficiency with automatable, repetitive tasks and offshoring
Implications for Suppliers
[ 31 ][ 31 ]
“Senior executives at PwC, Accenture Interactive and KPMG [said] they are not trying to displace agencies or steal talent. They have urged agencies to stop worrying about the emergence of marketing services within the consultancies and instead focus on doing their jobs.” –The Drum
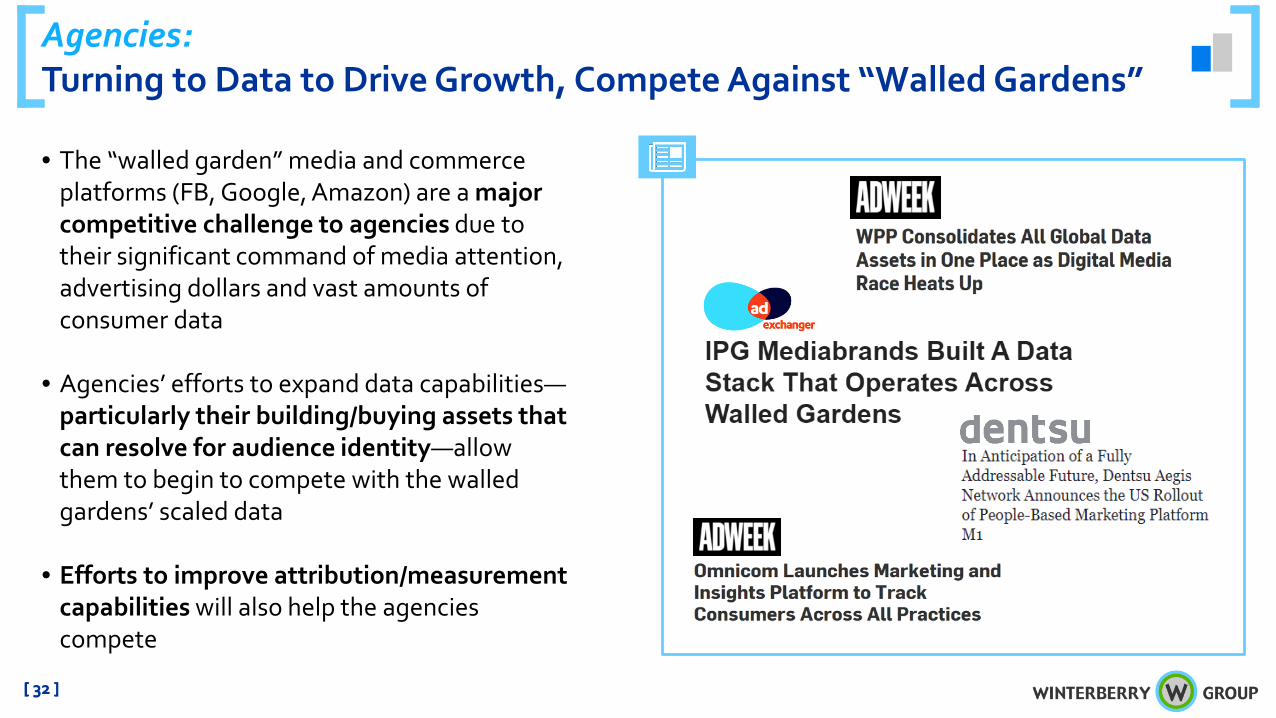
Agencies: Turning to Data to Drive Growth, Compete Against “Walled Gardens”
• The “walled garden” media and commerce platforms (FB, Google, Amazon) are a major competitive challenge to agencies due to their significant command of media attention, advertising dollars and vast amounts of consumer data
• Agencies’ efforts to expand data capabilities—particularly their building/buying assets that can resolve for audience identity—allow them to begin to compete with the walled gardens’ scaled data
• Efforts to improve attribution/measurement capabilities will also help the agencies compete
[ 32 ][ 32 ]

Significant risk to reputation and revenue; lawsuits have startedWith multiple state regulations in process (in addition to CCPA), marketers will be faced with grim choices: abandon relevant marketing or try to comply state-by-stateAlign and work—don’t pray for national regulation
GDPR and California Consumer Privacy Act:Adoption Challenges Remain as Privacy Became a Critical U.S. Issue
Sources: Second annual review of the U.S.-European Privacy Shield, GDPR Implementation Review- IT Governance
Evidence
•Effective May 25, 2018 (GDPR) and January 1, 2020 (CCPA)•47% of marketers say their policies, procedures and documentation are now in line with GDPR; 45% report they are only partially complete and 5% haven’t started•Only 33% of companies are confident that they can identify all of the data they have on each person•European Commission urges national U.S. privacy legislation in order to “strengthen the protection of our citizens when their data is transferred abroad”
Implications for MarketersSuppliers—including storage providers—are liable for violations
While technology platforms (CDPs) and authentication providers release tools to solve for better management, the service and governance architectures need focus
Like marketers—don’t hope for national regulation
Implications for Suppliers
[ 33 ][ 33 ]CC
PA
• Provides consumers control over data compiled by commercial “brokers,” and imposes new management protocols on these businesses
• Personal information is defined as anything that could be associated or linked with an individual or household
• Applies to businesses that have revenue >$25MM or derive 50% of revenues from audience data
• Provides rights to consumers to opt out of having their personal information used commercially
• Will serve as a model and precedent for other states’ data privacy regulations
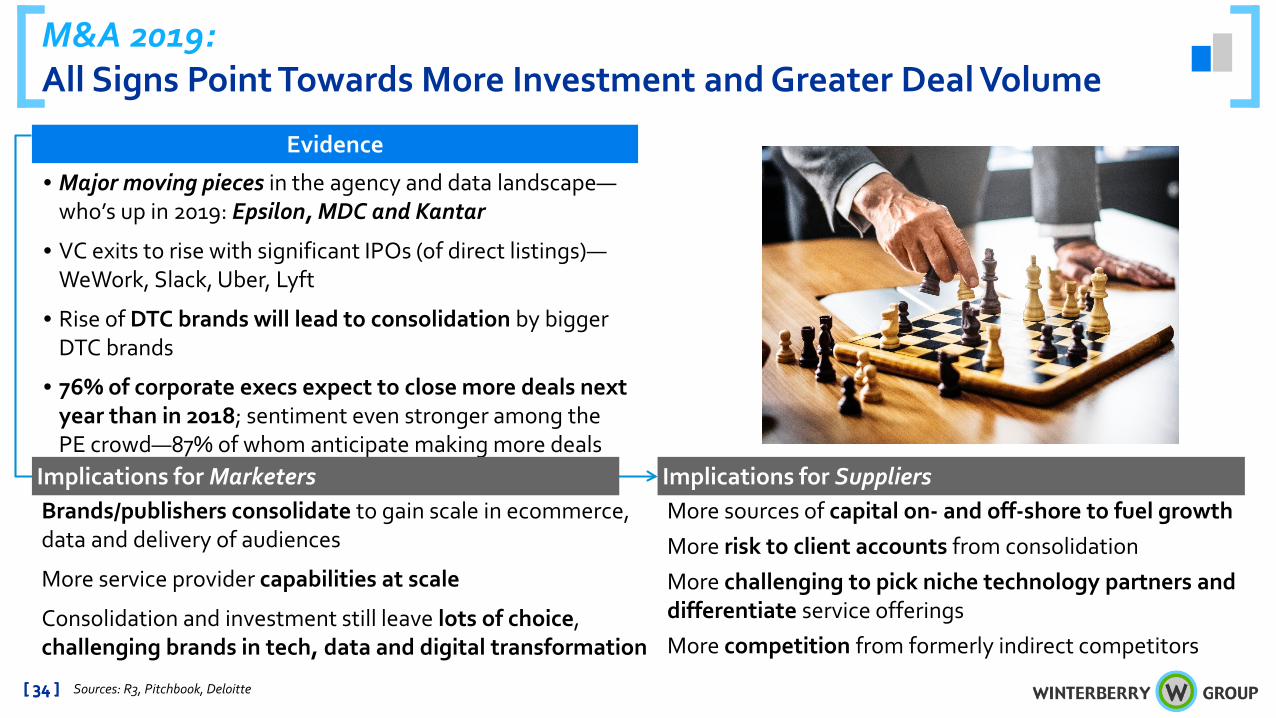
M&A 2019:All Signs Point Towards More Investment and Greater Deal Volume
Sources: R3, Pitchbook, Deloitte
Evidence
• Major moving pieces in the agency and data landscape—who’s up in 2019: Epsilon, MDC and Kantar
• VC exits to rise with significant IPOs (of direct listings)—WeWork, Slack, Uber, Lyft
• Rise of DTC brands will lead to consolidation by bigger DTC brands
• 76% of corporate execs expect to close more deals next year than in 2018; sentiment even stronger among the PE crowd—87% of whom anticipate making more deals
Implications for MarketersBrands/publishers consolidate to gain scale in ecommerce, data and delivery of audiences
More service provider capabilities at scale
Consolidation and investment still leave lots of choice, challenging brands in tech, data and digital transformation
More sources of capital on- and off-shore to fuel growthMore risk to client accounts from consolidationMore challenging to pick niche technology partners and differentiate service offeringsMore competition from formerly indirect competitors
Implications for Suppliers
[ 34 ][ 34 ]

Trends to Watch for 2019
Outlook 2019
The 2018 Recap
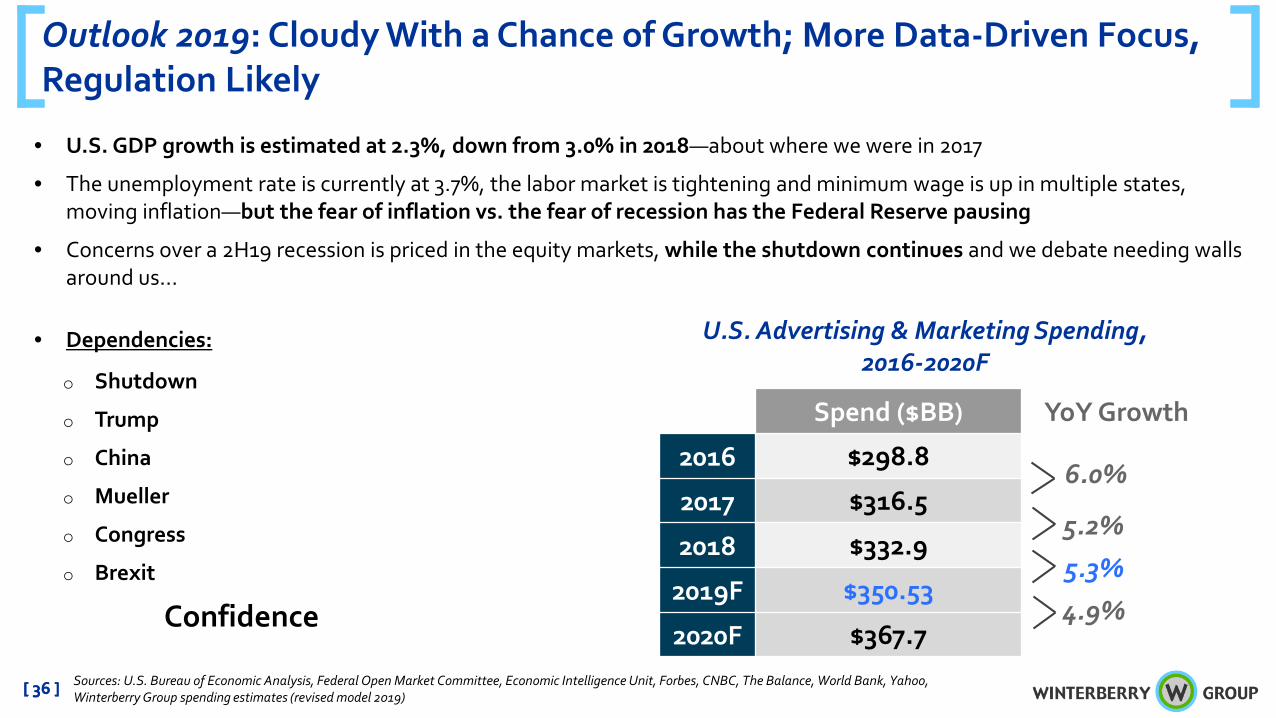
Outlook 2019: Cloudy With a Chance of Growth; More Data-Driven Focus, Regulation Likely
Sources: U.S. Bureau of Economic Analysis, Federal Open Market Committee, Economic Intelligence Unit, Forbes, CNBC, The Balance, World Bank, Yahoo, Winterberry Group spending estimates (revised model 2019)
• U.S. GDP growth is estimated at 2.3%, down from 3.0% in 2018—about where we were in 2017
• The unemployment rate is currently at 3.7%, the labor market is tightening and minimum wage is up in multiple states, moving inflation—but the fear of inflation vs. the fear of recession has the Federal Reserve pausing
• Concerns over a 2H19 recession is priced in the equity markets, while the shutdown continues and we debate needing walls around us…
• Dependencies:
o Shutdown
o Trump
o China
o Mueller
o Congress
o Brexit
Confidence
Spend ($BB) YoY Growth
2016 $298.8
2017 $316.5
2018 $332.9
2019F $350.53
2020F $367.7
U.S. Advertising & Marketing Spending, 2016-2020F
6.0%
5.2%
5.3%
4.9%
[ 36 ][ 36 ]
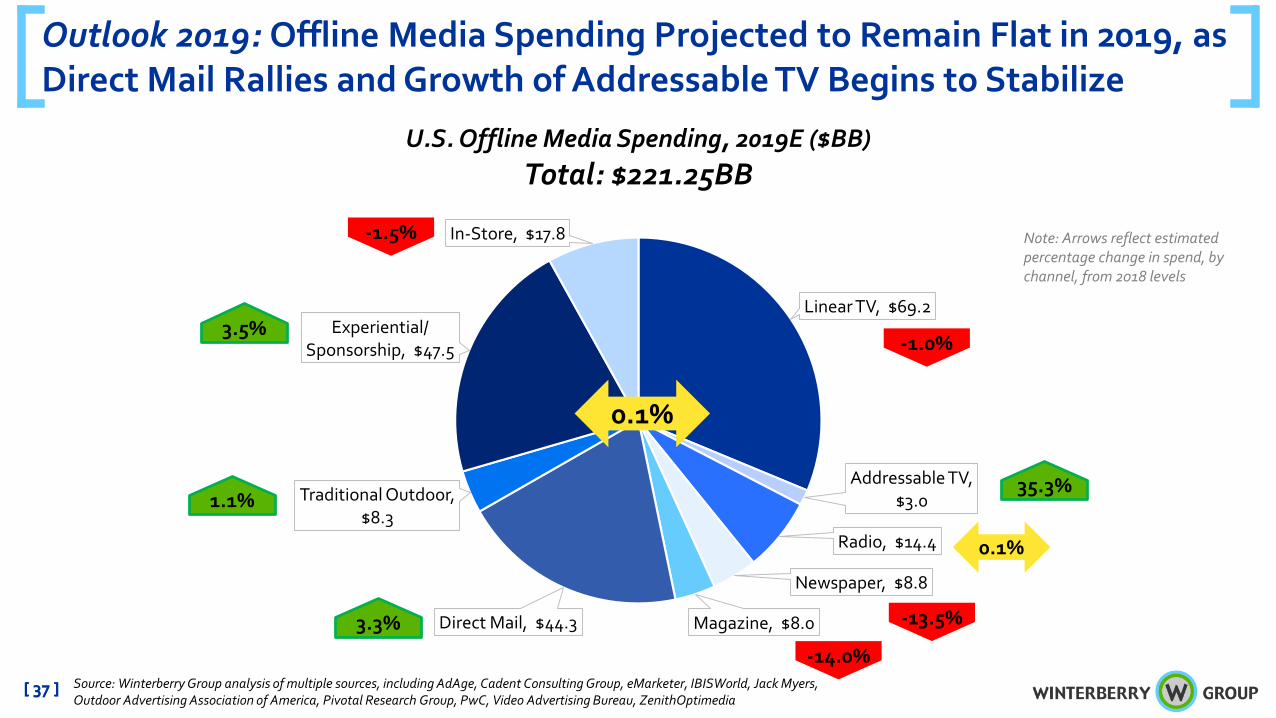
Outlook 2019: Offline Media Spending Projected to Remain Flat in 2019, as Direct Mail Rallies and Growth of Addressable TV Begins to Stabilize
Linear TV, $69.2
Addressable TV, $3.0
Radio, $14.4
Newspaper, $8.8
Magazine, $8.0 Direct Mail, $44.3
Traditional Outdoor, $8.3
Experiential/ Sponsorship, $47.5
In-Store, $17.8
U.S. Offline Media Spending, 2019E ($BB)Total: $221.25BB
1.1%
Note: Arrows reflect estimated percentage change in spend, by channel, from 2018 levels
-1.0%
Source: Winterberry Group analysis of multiple sources, including AdAge, Cadent Consulting Group, eMarketer, IBISWorld, Jack Myers, Outdoor Advertising Association of America, Pivotal Research Group, PwC, Video Advertising Bureau, ZenithOptimedia
-13.5%
35.3%
3.3%
-14.0%
-1.5%
3.5%
[ 37 ]
0.1%
0.1%
[ 37 ]
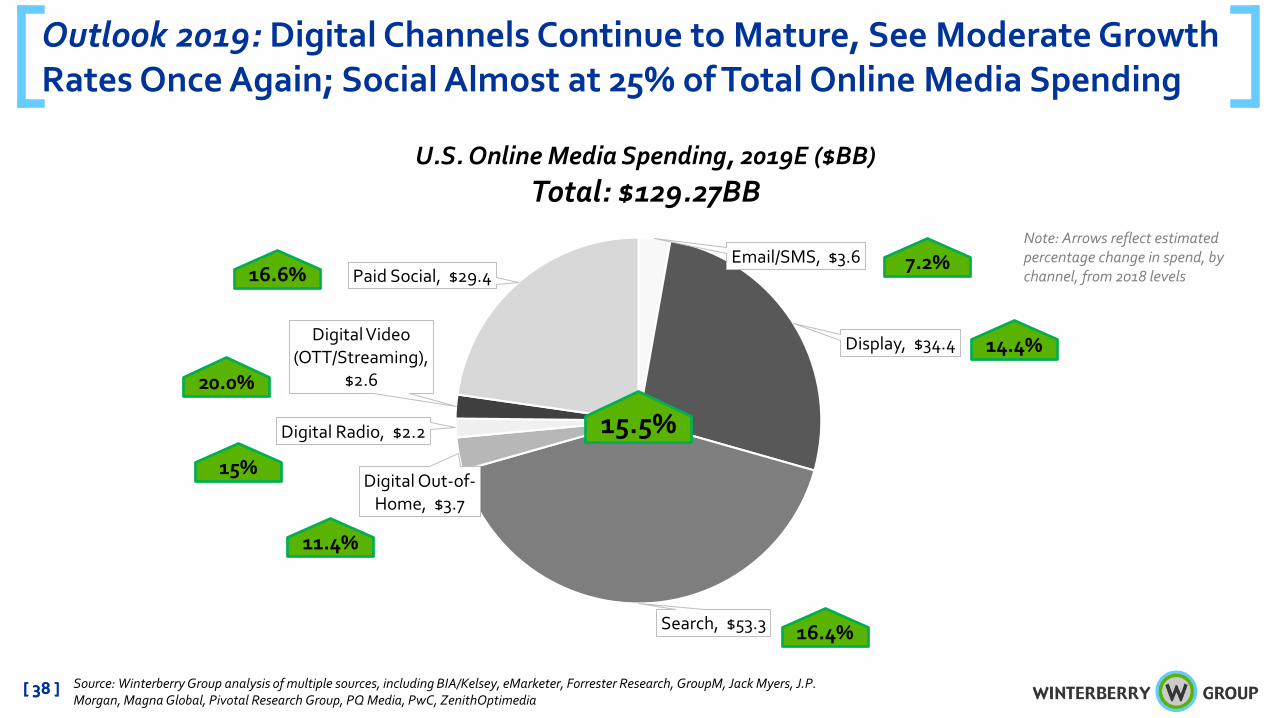
Email/SMS, $3.6
Display, $34.4
Search, $53.3
Digital Out-of-Home, $3.7
Digital Radio, $2.2
Digital Video (OTT/Streaming),
$2.6
Paid Social, $29.4
U.S. Online Media Spending, 2019E ($BB)Total: $129.27BB
15.5%
Outlook 2019: Digital Channels Continue to Mature, See Moderate Growth Rates Once Again; Social Almost at 25% of Total Online Media Spending
Note: Arrows reflect estimated percentage change in spend, by channel, from 2018 levels
Source: Winterberry Group analysis of multiple sources, including BIA/Kelsey, eMarketer, Forrester Research, GroupM, Jack Myers, J.P. Morgan, Magna Global, Pivotal Research Group, PQ Media, PwC, ZenithOptimedia
14.4%
16.4%
16.6%
[ 38 ]
7.2%
20.0%
15%
11.4%
[ 38 ]
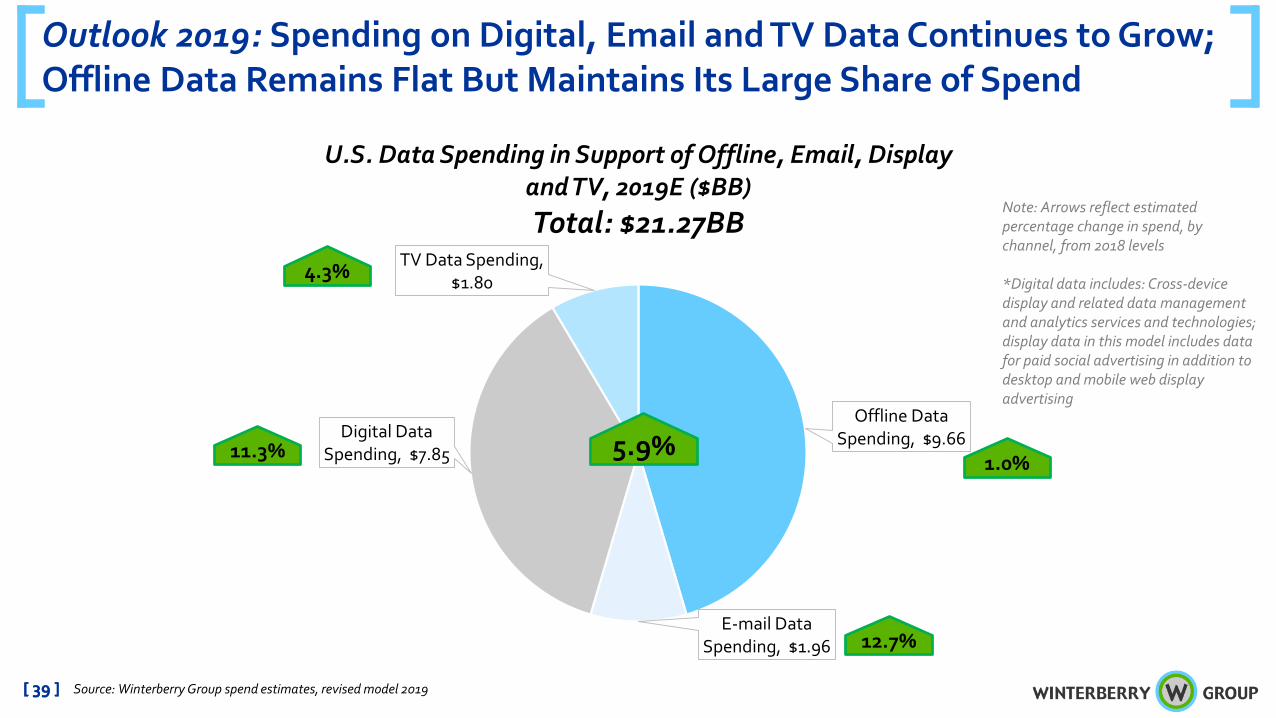
Outlook 2019: Spending on Digital, Email and TV Data Continues to Grow; Offline Data Remains Flat But Maintains Its Large Share of Spend
[ 39 ]
Offline Data Spending, $9.66
E-mail Data Spending, $1.96
Digital Data Spending, $7.85
TV Data Spending, $1.80
U.S. Data Spending in Support of Offline, Email, Display and TV, 2019E ($BB)Total: $21.27BB
12.7%
4.3%
11.3% 5.9%1.0%
Note: Arrows reflect estimated percentage change in spend, by channel, from 2018 levels
*Digital data includes: Cross-device display and related data management and analytics services and technologies; display data in this model includes data for paid social advertising in addition to desktop and mobile web display advertising
Source: Winterberry Group spend estimates, revised model 2019 [ 39 ]
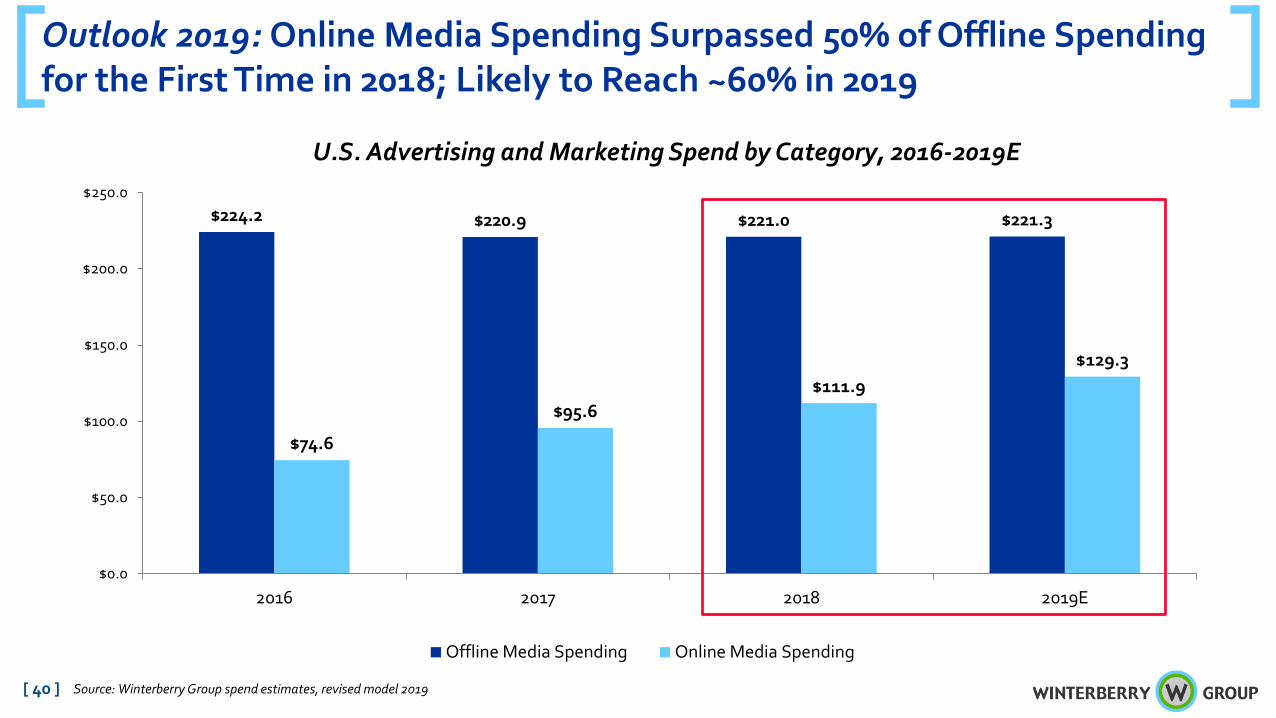
$224.2 $220.9 $221.0 $221.3
$74.6
$95.6$111.9
$129.3
$0.0
$50.0
$100.0
$150.0
$200.0
$250.0
2016 2017 2018 2019E
U.S. Advertising and Marketing Spend by Category, 2016-2019E
Offline Media Spending Online Media Spending
Outlook 2019: Online Media Spending Surpassed 50% of Offline Spending for the First Time in 2018; Likely to Reach ~60% in 2019
[ 40 ] Source: Winterberry Group spend estimates, revised model 2019