Embed Size (px)
Citation preview

Outlook for 2014
January 2014 Henry H. McVey

2
Important InformationThe views expressed in this presentation are the personal views of Henry McVey of Kohlberg Kravis Roberts & Co. L.P. (together with its affiliates, "KKR") and do not necessarily reflect the views of KKR itself. This presentation is not research and should not be treated as research. This presentation does not represent valuation judgments with respect to any financial instrument, issuer, security or sector that may be described or referenced herein and does not represent a formal or official view of KKR. This presentation is not intended to, and does not, relate specifically to any investment strategy or product that KKR offers. It is being provided merely to provide a framework to assist in the implementation of an investor’s own analysis and an investor’s own views on the topic discussed herein.
The views expressed reflect the current views of Mr. McVey as of the date hereof and neither Mr. McVey nor KKR undertakes to advise you of any changes in the views expressed herein. In addition, the views expressed do not necessarily reflect the opinions of any investment professional at KKR, and may not be reflected in the strategies and products that KKR offers, including strategies and products to which Mr. McVey provides investment advice on behalf of KKR. It should not be assumed that Mr. McVey will make investment recommendations in the future that are consistent with the views expressed herein, or use any or all of the techniques or methods of analysis described herein in managing client accounts. KKR and its affiliates may have positions (long or short) or engage in securities transactions that are not consistent with the information and views expressed in this presentation.
This presentation has been prepared solely for informational purposes. The information contained herein is only as current as of the date indicated, and may be superseded by subsequent market events or for other reasons. Charts and graphs provided herein are for illustrative purposes only. The information in this presentation has been developed internally and/or obtained from sources believed to be reliable; however, neither KKR nor Mr. McVey guarantees the accuracy, adequacy or completeness of such information. Nothing contained herein constitutes investment, legal, tax or other advice nor is it to be relied on in making an investment or other decision.
There can be no assurance that an investment strategy will be successful. Historic market trends are not reliable indicators of actual future market behavior or future performance of any particular investment which may differ materially, and should not be relied upon as such. Target allocations contained herein are subject to change. There is no assurance that the target allocations will be achieved, and actual allocations may be significantly different than that shown here. This presentation should not be viewed as a current or past recommendation or a solicitation of an offer to buy or sell any securities or to adopt any investment strategy.
The information in this presentation may contain projections or other forward looking statements regarding future events, targets, forecasts or expectations regarding the strategies ‐described herein, and is only current as of the date indicated. There is no assurance that such events or targets will be achieved, and may be significantly different from that shown here. The information in this presentation, including statements concerning financial market trends, is based on current market conditions, which will fluctuate and may be superseded by subsequent market events or for other reasons. Performance of all cited indices is calculated on a total return basis with dividends reinvested. The indices do not include any expenses, fees or charges and are unmanaged and should not be considered investments.
The investment strategy and themes discussed herein may be unsuitable for investors depending on their specific investment objectives and financial situation. Please note that changes in the rate of exchange of a currency may affect the value, price or income of an investment adversely.
Neither KKR nor Mr. McVey assumes any duty to, nor undertakes to update forward looking statements. No representation or warranty, express or implied, is made or given by or on behalf of KKR, Mr. McVey or any other person as to the accuracy and completeness or fairness of the information contained in this presentation, and no responsibility or liability is accepted for any such information. By accepting this presentation in its entirety, the recipient acknowledges its understanding and acceptance of the foregoing statement.
The MSCI sourced information in this presentation is the exclusive property of MSCI Inc. (MSCI). MSCI makes no express or implied warranties or representations and shall have no liability whatsoever with respect to any MSCI data contained herein. The MSCI data may not be further redistributed or used as a basis for other indices or any securities or financial products. This report is not approved, reviewed or produced by MSCI.
I. Key Macro Conclusions & Economic Outlook

4
Outlook 2014: “Stay the Course” As a Global Recovery Unfolds
What Does “Stay the Course” Mean?
1. Retain key overweight positions in global equities and alternatives, including private credit, special situations and real assets.
2. To fund these risk buckets, we continue to target a massive underweight to government bonds and investment grade debt.
3. However, 2014 will not be a repeat of 2013. In particular, we believe 1) the “drag” from government austerity should decline in 2014; 2) equity trading multiples for stocks are now ahead of schedule.
5
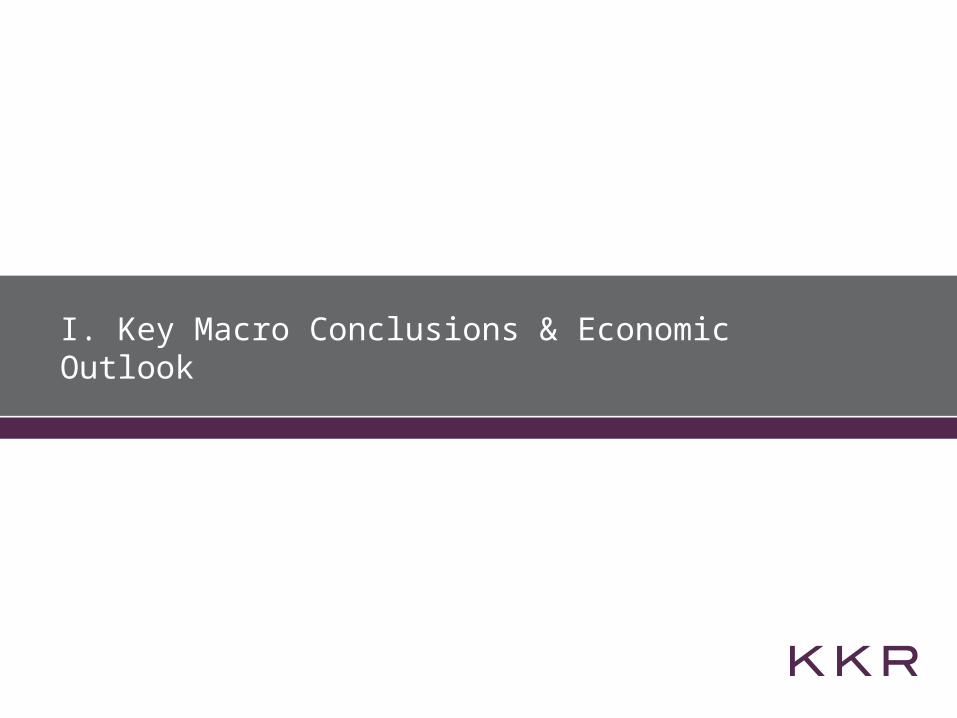
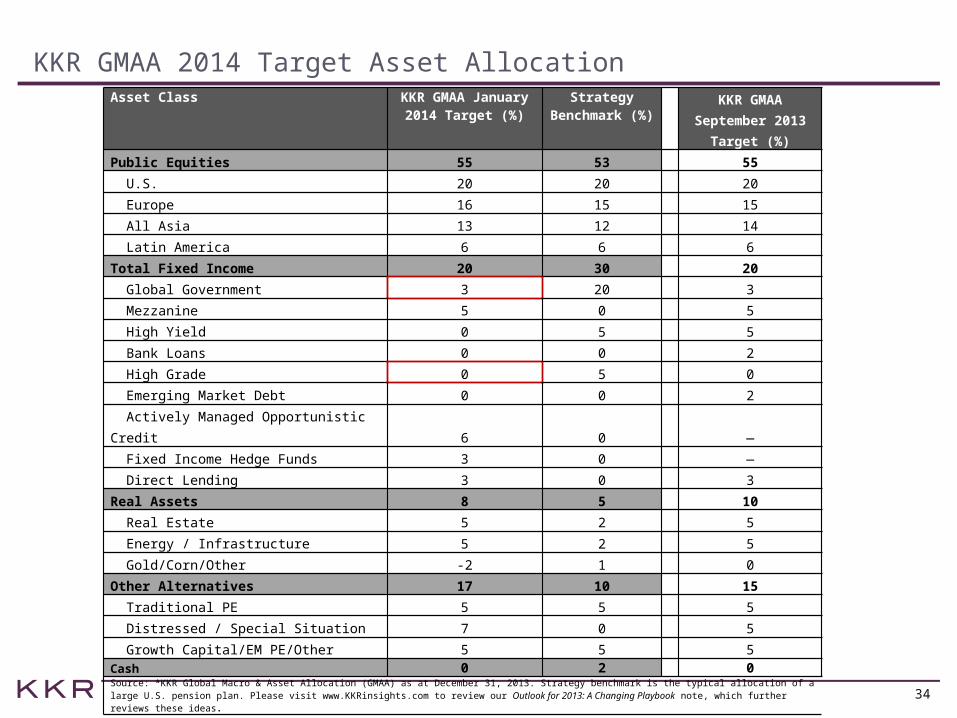
KKR GMAA 2014 Target Asset AllocationAsset Class KKR GMAA January
2014 Target (%)Strategy
Benchmark (%)
KKR GMAA September 2013
Target (%)
Public Equities 55 53 55
U.S. 20 20 20
Europe 16 15 15
All Asia 13 12 14
Latin America 6 6 6
Total Fixed Income 20 30 20
Global Government 3 20 3
Mezzanine 5 0 5
High Yield 0 5 5
Bank Loans 0 0 2
High Grade 0 5 0
Emerging Market Debt 0 0 2
Actively Managed Opportunistic Credit 6 0 ―
Fixed Income Hedge Funds 3 0 ―
Direct Lending 3 0 3
Real Assets 8 5 10
Real Estate 5 2 5
Energy / Infrastructure 5 2 5
Gold/Corn/Other -2 1 0
Other Alternatives 17 10 15
Traditional PE 5 5 5
Distressed / Special Situation 7 0 5
Growth Capital/EM PE/Other 5 5 5
Cash 0 2 0Source: *KKR Global Macro & Asset Allocation (GMAA) as at December 31, 2013. Strategy benchmark is the typical allocation of a large U.S. pension plan. Please visit www.KKRinsights.com to review our Outlook for 2013: A Changing Playbook note, which further reviews these ideas.
6
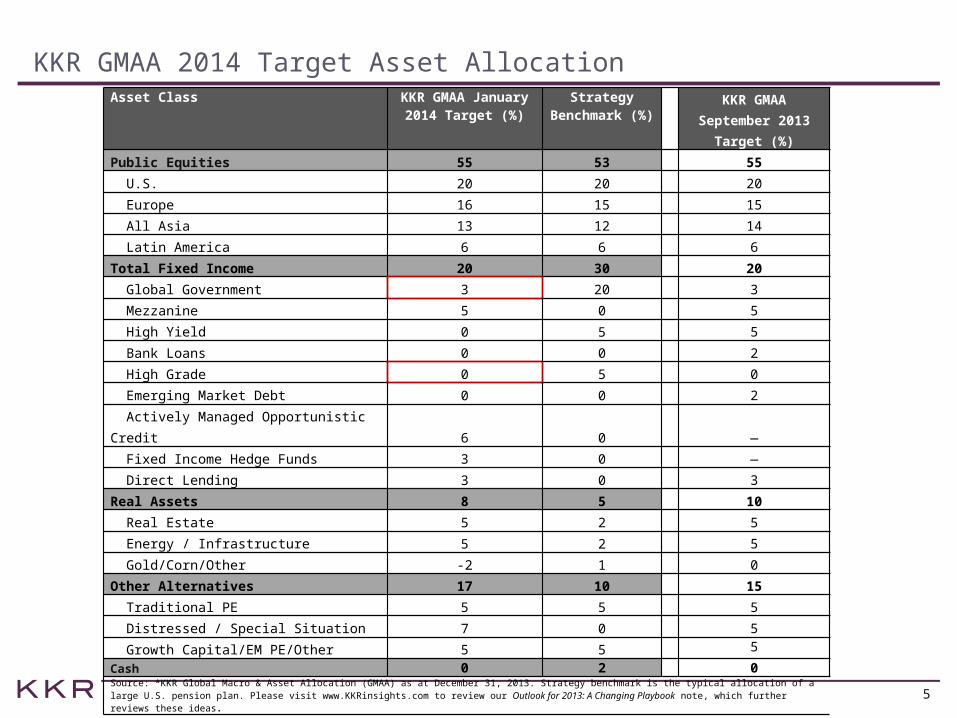
Overall, We Believe the Backdrop For the Global Economy Is Favorable in 2014
2014 Growth & Inflation Base Case Estimates
KKR GMAA Target Real GDP Growth
Bloomberg Consensus Real
GDP Growth
KKR GMAA Target
Inflation
Bloomberg Consensus
Inflation
U.S. 2.8% 2.6% 1.7% 1.7%
Euro Area 1.1% 1.0% 1.0% 1.2%
China 7.4% to 7.6% 7.5% 3.0 to 3.5% 3.1%
Brazil 2.1% 2.3% 6.0% 5.8%
Our GDP and Inflation Outlook by Region Seems to Suggest Stronger Growth in 2014,
Aided by Less Fiscal Drag
Even a Decelerating China Still Makes Up Almost a Third of Global Growth in 2014
China Other Asia
Other Emerging Markets
US Euro Area Other Ad-
vanced Economie
s
World0.0
0.5
1.0
1.5
2.0
2.5
3.0
3.5
4.0
+1.2
+0.8
+0.9
+0.5
+0.1
+0.2+3.6
2014 Real Global GDP Growth (%)
China alone makes up 32% of growth in 2014
Other Asia makes up another 22% of growth in 2014
Other Emerging Markets makes up another 24%
GDP = Gross Domestic Product. Bloomberg consensus estimates as at December 31, 2013. Source: Bloomberg, FOMC, ECB, Haver Analytics, KKR Global Macro & Asset Allocation analysis.
Data as at October 8, 2013. Source: IMF, Haver Analytics.
2013 (bps)
2014 (bps)
U.S. Government Drag on Growth -125 -30
Europe Government Drag on Growth -100 to -150
-50 to -75
7
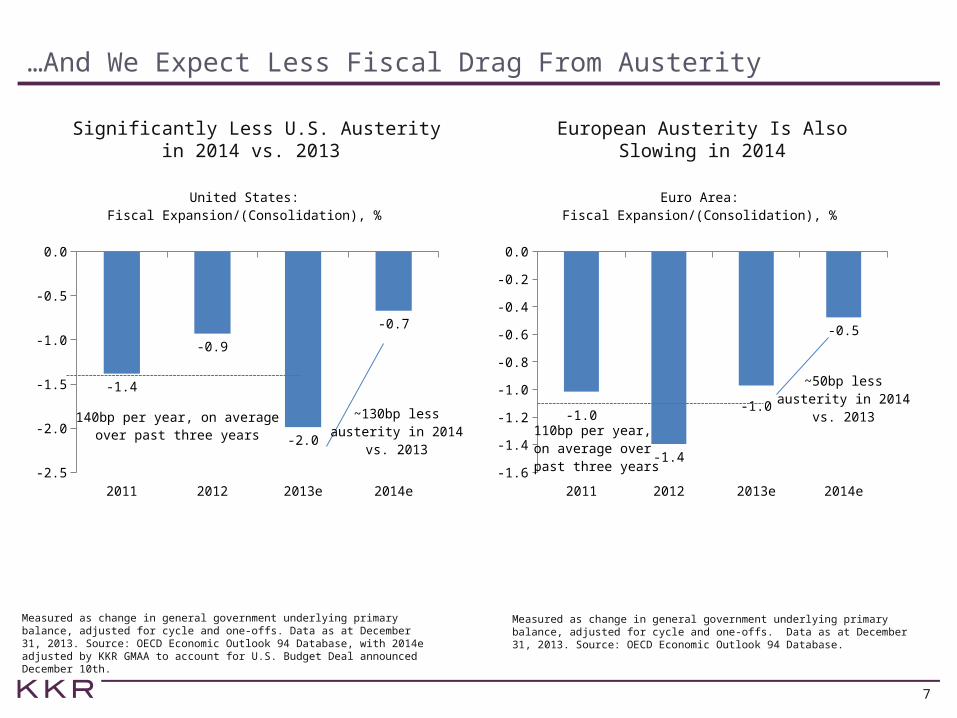
…And We Expect Less Fiscal Drag From Austerity
Significantly Less U.S. Austerity in 2014 vs. 2013
European Austerity Is Also Slowing in 2014
Measured as change in general government underlying primary balance, adjusted for cycle and one-offs. Data as at December 31, 2013. Source: OECD Economic Outlook 94 Database, with 2014e adjusted by KKR GMAA to account for U.S. Budget Deal announced December 10th.
Measured as change in general government underlying primary balance, adjusted for cycle and one-offs. Data as at December 31, 2013. Source: OECD Economic Outlook 94 Database.
2011 2012 2013e 2014e-2.5
-2.0
-1.5
-1.0
-0.5
0.0
-1.4
-0.9
-2.0
-0.7
United States:Fiscal Expansion/(Consolidation), %
~130bp lessausterity in 2014
vs. 2013
140bp per year, on averageover past three years
2011 2012 2013e 2014e-1.6
-1.4
-1.2
-1.0
-0.8
-0.6
-0.4
-0.2
0.0
-1.0
-1.4
-1.0
-0.5
Euro Area:Fiscal Expansion/(Consolidation), %
~50bp lessausterity in 2014
vs. 2013
110bp per year, on average over past three years
8
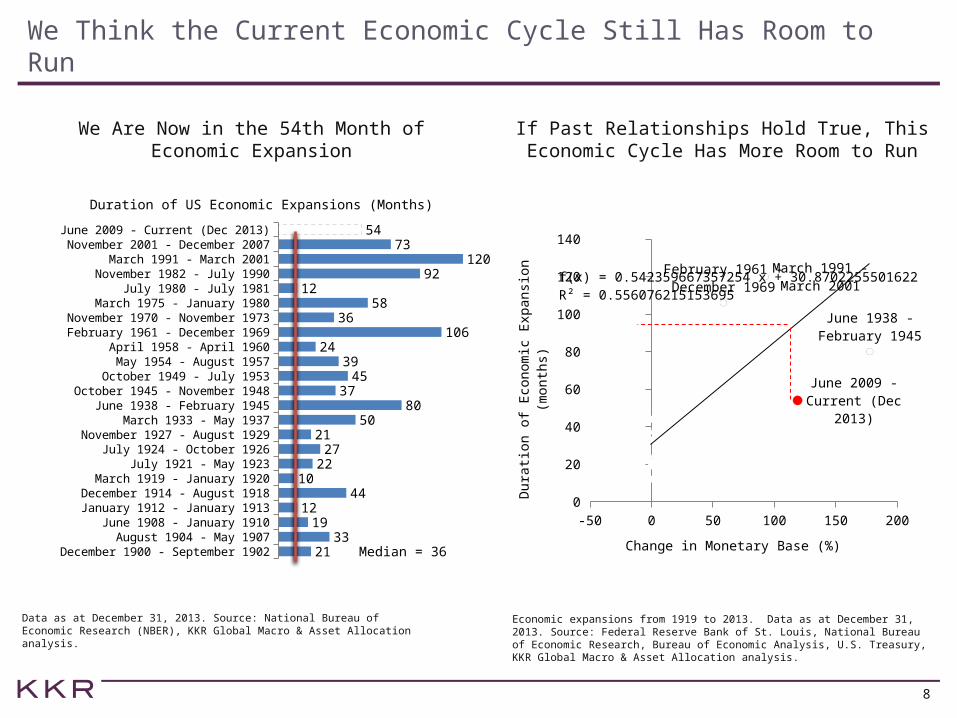
We Think the Current Economic Cycle Still Has Room to Run
We Are Now in the 54th Month of Economic Expansion
If Past Relationships Hold True, This Economic Cycle Has More Room to Run
Data as at December 31, 2013. Source: National Bureau of Economic Research (NBER), KKR Global Macro & Asset Allocation analysis.
Economic expansions from 1919 to 2013. Data as at December 31, 2013. Source: Federal Reserve Bank of St. Louis, National Bureau of Economic Research, Bureau of Economic Analysis, U.S. Treasury, KKR Global Macro & Asset Allocation analysis.
December 1900 - September 1902August 1904 - May 1907
June 1908 - January 1910January 1912 - January 1913
December 1914 - August 1918March 1919 - January 1920
July 1921 - May 1923July 1924 - October 1926
November 1927 - August 1929March 1933 - May 1937
June 1938 - February 1945October 1945 - November 1948
October 1949 - July 1953May 1954 - August 1957
April 1958 - April 1960February 1961 - December 1969
November 1970 - November 1973March 1975 - January 1980
July 1980 - July 1981November 1982 - July 1990
March 1991 - March 2001November 2001 - December 2007
June 2009 - Current (Dec 2013)
2133
1912
4410
2227
2150
8037
4539
24106
3658
1292
12073
54
Duration of US Economic Expansions (Months)
Median = 36
-50 0 50 100 150 2000
20
40
60
80
100
120
140
February 1961 - December 1969
March 1991 - March 2001
June 1938 - Feb-ruary 1945
June 2009 - Cur-rent (Dec 2013)
f(x) = 0.542359667357254 x + 30.8702255501622R² = 0.556076215153695
Change in Monetary Base (%)D
ura
tion o
f Eco
nom
ic E
xpansi
on (
month
s)

II. Macro Themes
10
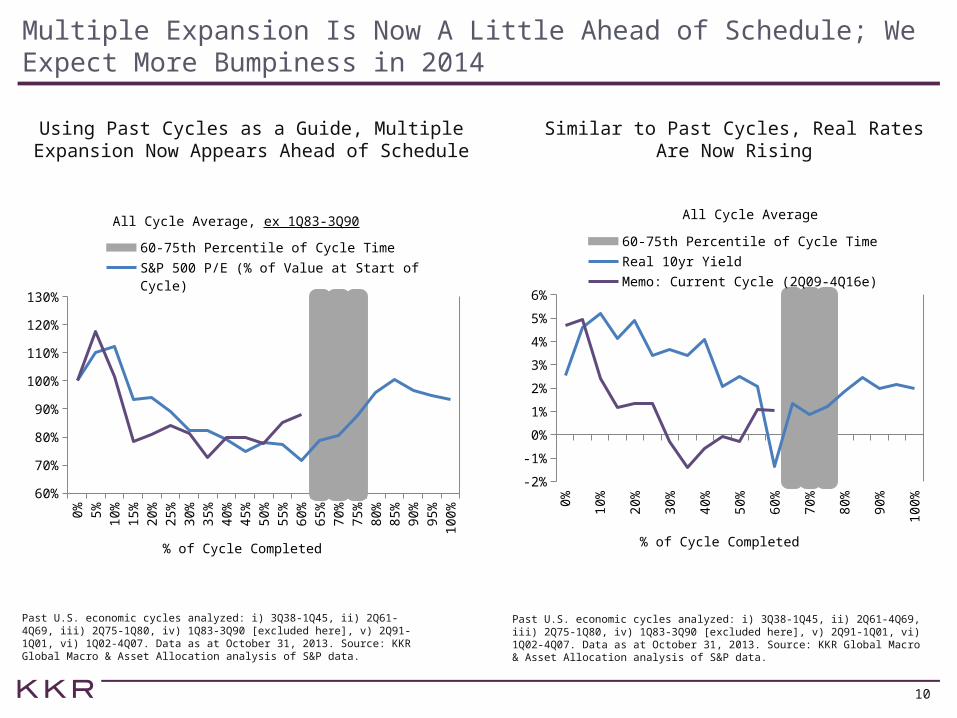
Multiple Expansion Is Now A Little Ahead of Schedule; We Expect More Bumpiness in 2014
Using Past Cycles as a Guide, Multiple Expansion Now Appears Ahead of Schedule
Similar to Past Cycles, Real Rates Are Now Rising
Past U.S. economic cycles analyzed: i) 3Q38-1Q45, ii) 2Q61-4Q69, iii) 2Q75-1Q80, iv) 1Q83-3Q90 [excluded here], v) 2Q91-1Q01, vi) 1Q02-4Q07. Data as at October 31, 2013. Source: KKR Global Macro & Asset Allocation analysis of S&P data.
Past U.S. economic cycles analyzed: i) 3Q38-1Q45, ii) 2Q61-4Q69, iii) 2Q75-1Q80, iv) 1Q83-3Q90 [excluded here], v) 2Q91-1Q01, vi) 1Q02-4Q07. Data as at October 31, 2013. Source: KKR Global Macro & Asset Allocation analysis of S&P data.
0%
5%
10%
15%
20%
25%
30%
35%
40%
45%
50%
55%
60%
65%
70%
75%
80%
85%
90%
95%
100%
60%
70%
80%
90%
100%
110%
120%
130%
60-75th Percentile of Cycle TimeS&P 500 P/E (% of Value at Start of Cycle)Memo: Current Cycle (2Q09-4Q16e)
% of Cycle Completed
All Cycle Average, ex 1Q83-3Q90
0%
5%
10%
15%
20%
25%
30%
35%
40%
45%
50%
55%
60%
65%
70%
75%
80%
85%
90%
95%
100%
-2%
-1%
0%
1%
2%
3%
4%
5%
6%
60-75th Percentile of Cycle Time
Real 10yr Yield
Memo: Current Cycle (2Q09-4Q16e)
% of Cycle Completed
All Cycle Average
11
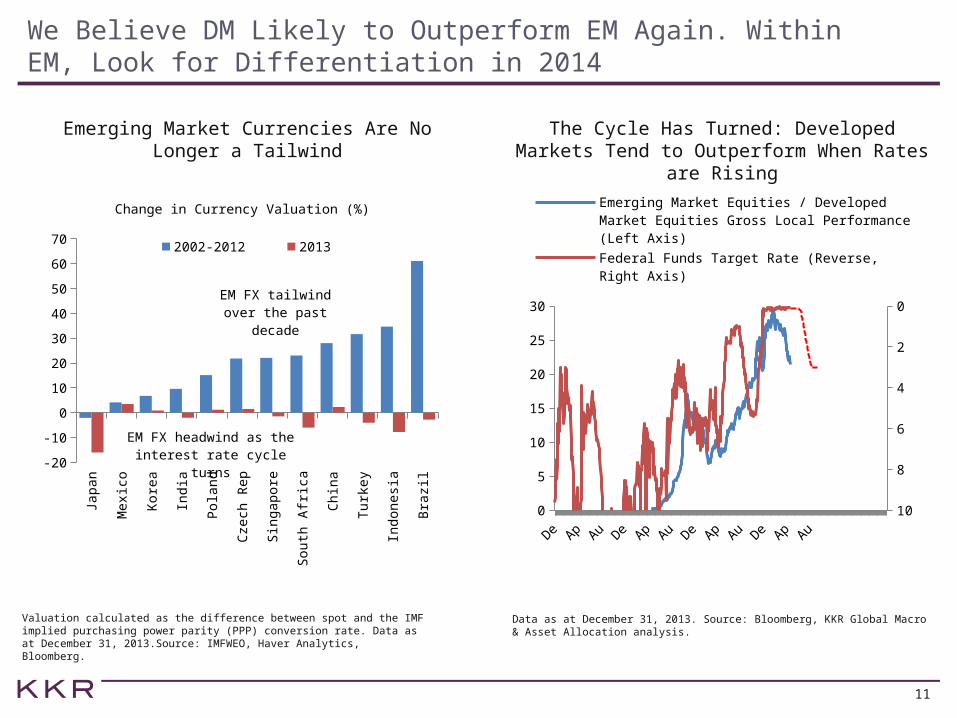
We Believe DM Likely to Outperform EM Again. Within EM, Look for Differentiation in 2014
Emerging Market Currencies Are No Longer a Tailwind
The Cycle Has Turned: Developed Markets Tend to Outperform When Rates are Rising
Valuation calculated as the difference between spot and the IMF implied purchasing power parity (PPP) conversion rate. Data as at December 31, 2013.Source: IMFWEO, Haver Analytics, Bloomberg.
Data as at December 31, 2013. Source: Bloomberg, KKR Global Macro & Asset Allocation analysis.
Japan
Mexic
o
Kore
a
India
Pola
nd
Cze
ch R
ep
Sin
gapore
South
Afr
ica
Chin
a
Turk
ey
Indonesi
a
Bra
zil
-20
-10
0
10
20
30
40
50
60
70
Change in Currency Valuation (%)
2002-2012 2013
EM FX tailwind over the past decade
EM FX headwind as the interest rate cycle turns
88 91 94 97 00 03 06 09 12 15 180
5
10
15
20
25
30 0
2
4
6
8
10
Emerging Market Equities / Developed Market Equities Gross Local Performance (Left Axis)
Federal Funds Target Rate (Reverse, Right Axis)
KKR Estimate (Reverse, Right Axis)
12
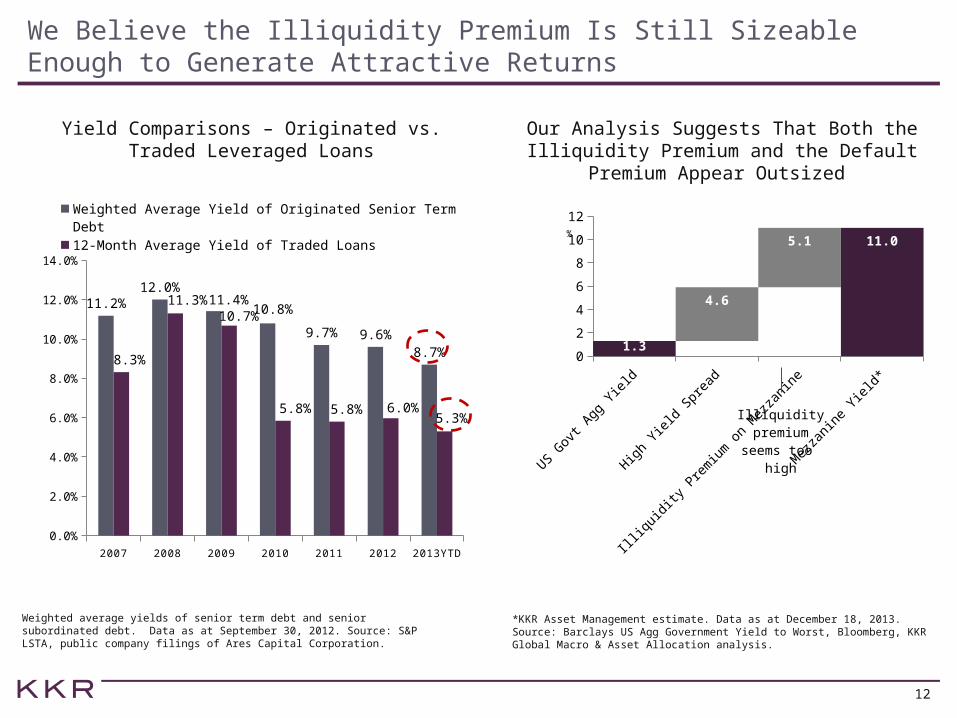
We Believe the Illiquidity Premium Is Still Sizeable Enough to Generate Attractive Returns
Yield Comparisons – Originated vs. Traded Leveraged Loans
Our Analysis Suggests That Both the Illiquidity Premium and the Default Premium
Appear Outsized
Weighted average yields of senior term debt and senior subordinated debt. Data as at September 30, 2012. Source: S&P LSTA, public company filings of Ares Capital Corporation.
*KKR Asset Management estimate. Data as at December 18, 2013. Source: Barclays US Agg Government Yield to Worst, Bloomberg, KKR Global Macro & Asset Allocation analysis.
2007 2008 2009 2010 2011 2012 2013YTD0.0%
2.0%
4.0%
6.0%
8.0%
10.0%
12.0%
14.0%
11.2%12.0%
11.4%10.8%
9.7% 9.6%8.7%8.3%
11.3%10.7%
5.8% 5.8% 6.0%5.3%
Weighted Average Yield of Originated Senior Term Debt
12-Month Average Yield of Traded Loans
US Gov
t Agg
Yie
ld
High
Yiel
d Sp
read
Illiq
uidi
ty P
rem
ium
on
Mez
zani
ne
Mezza
nine
Yie
ld*
0
2
4
6
8
10
12
1.3
4.6
5.1 11.0%
Illiquidity premium
seems too high
13
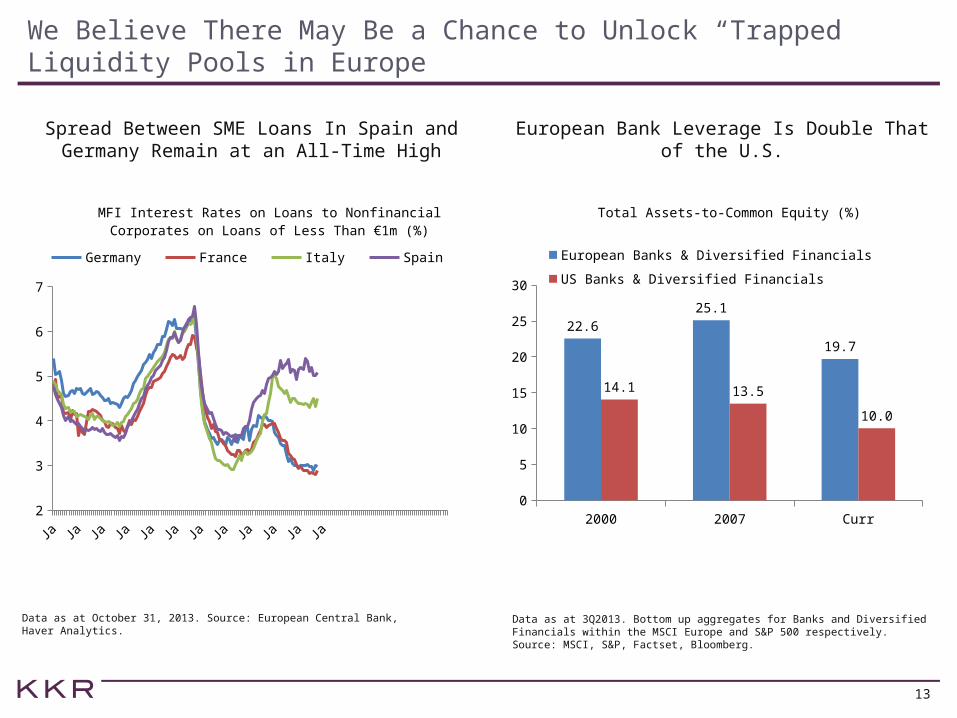
We Believe There May Be a Chance to Unlock “Trapped” Liquidity Pools in Europe
Spread Between SME Loans In Spain and Germany Remain at an All-Time High
European Bank Leverage Is Double That of the U.S.
Data as at October 31, 2013. Source: European Central Bank, Haver Analytics.
Data as at 3Q2013. Bottom up aggregates for Banks and Diversified Financials within the MSCI Europe and S&P 500 respectively. Source: MSCI, S&P, Factset, Bloomberg.
03 04 05 06 07 08 09 10 11 12 13 142
3
4
5
6
7
MFI Interest Rates on Loans to Nonfinancial Corpo-rates on Loans of Less Than €1m (%)
Germany France Italy Spain
2000 2007 Curr0
5
10
15
20
25
30
22.625.1
19.7
14.1 13.5
10.0
Total Assets-to-Common Equity (%)
European Banks & Diversified Financials
US Banks & Diversified Financials

III. Equities
15
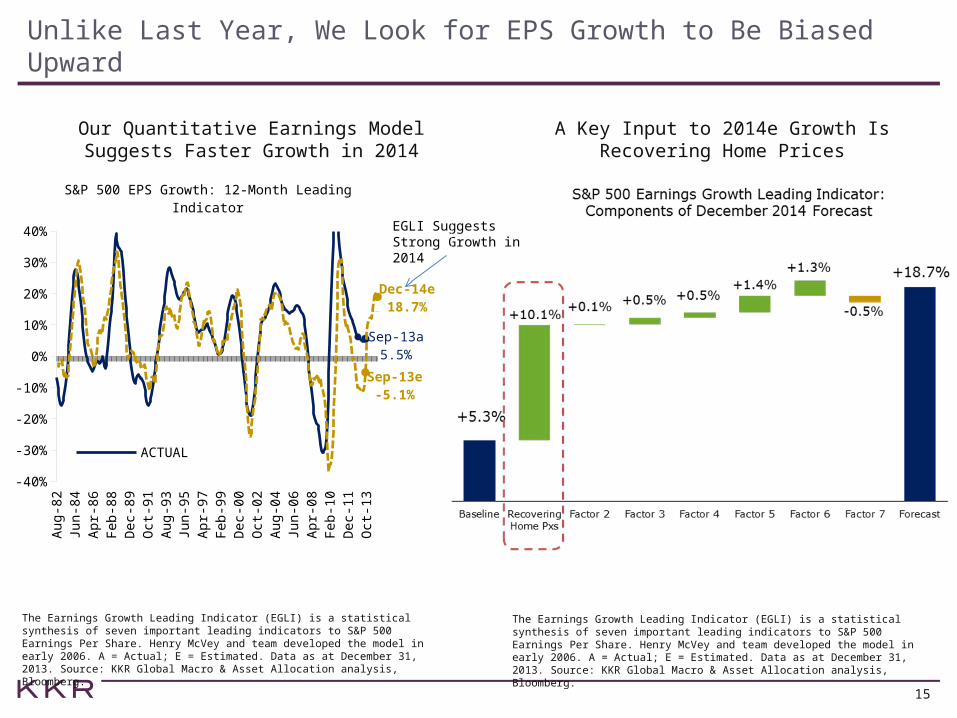
Unlike Last Year, We Look for EPS Growth to Be Biased Upward
Our Quantitative Earnings Model Suggests Faster Growth in 2014
A Key Input to 2014e Growth Is Recovering Home Prices
The Earnings Growth Leading Indicator (EGLI) is a statistical synthesis of seven important leading indicators to S&P 500 Earnings Per Share. Henry McVey and team developed the model in early 2006. A = Actual; E = Estimated. Data as at December 31, 2013. Source: KKR Global Macro & Asset Allocation analysis, Bloomberg.
The Earnings Growth Leading Indicator (EGLI) is a statistical synthesis of seven important leading indicators to S&P 500 Earnings Per Share. Henry McVey and team developed the model in early 2006. A = Actual; E = Estimated. Data as at December 31, 2013. Source: KKR Global Macro & Asset Allocation analysis, Bloomberg.
EGLI Suggests Strong Growth in 2014
1982
1985
1988
1991
1994
1997
2000
2003
2006
2009
2012
-40%
-30%
-20%
-10%
0%
10%
20%
30%
40%
Sep-13a5.5%
Sep-13e-5.1%
Dec-14e18.7%
S&P 500 EPS Growth: 12-Month Leading Indicator
ACTUALPREDICTED (3mo MA)
16
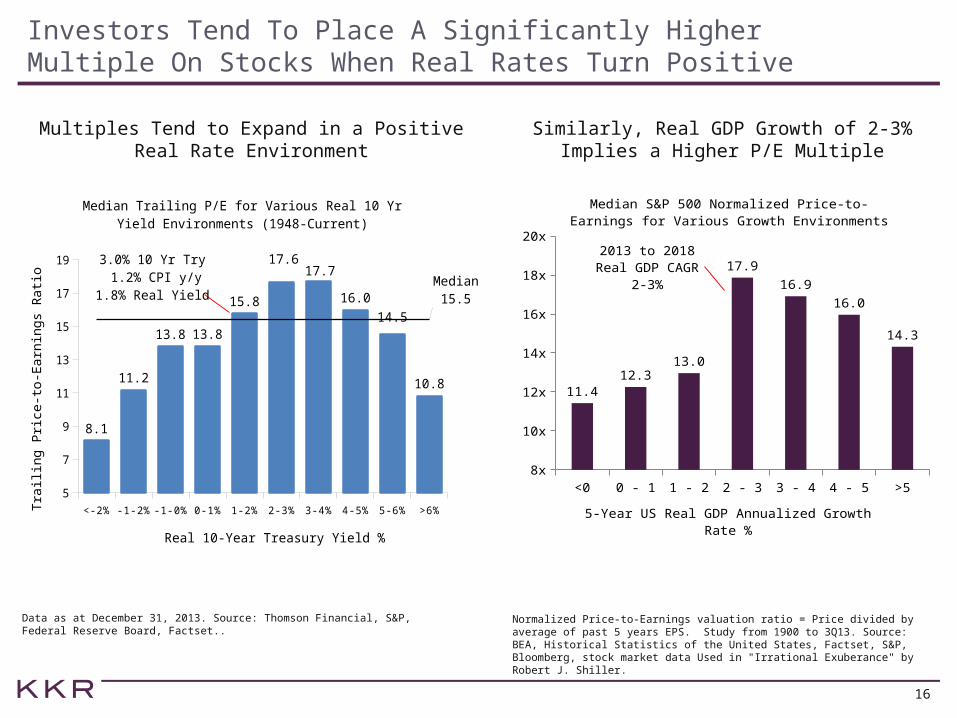
Investors Tend To Place A Significantly Higher Multiple On Stocks When Real Rates Turn Positive
Multiples Tend to Expand in a Positive Real Rate Environment
Similarly, Real GDP Growth of 2-3% Implies a Higher P/E Multiple
Data as at December 31, 2013. Source: Thomson Financial, S&P, Federal Reserve Board, Factset..
Normalized Price-to-Earnings valuation ratio = Price divided by average of past 5 years EPS. Study from 1900 to 3Q13. Source: BEA, Historical Statistics of the United States, Factset, S&P, Bloomberg, stock market data Used in "Irrational Exuberance" by Robert J. Shiller.
<-2% -1-2% -1-0% 0-1% 1-2% 2-3% 3-4% 4-5% 5-6% >6%5
7
9
11
13
15
17
19
8.1
11.2
13.8 13.8
15.8
17.617.7
16.0
14.5
10.8
Median15.5
Median Trailing P/E for Various Real 10 Yr Yield Envi-ronments (1948-Current)
Real 10-Year Treasury Yield %
Trai
ling
Pric
e-to
-Ear
ning
s R
atio
3.0% 10 Yr Try 1.2% CPI y/y
1.8% Real Yield
<0 0 - 1 1 - 2 2 - 3 3 - 4 4 - 5 >58x
10x
12x
14x
16x
18x
20x
11.412.3
13.0
17.9
16.9
16.0
14.3
Median S&P 500 Normalized Price-to-Earnings for Various Growth Environments
5-Year US Real GDP Annualized Growth Rate %
2013 to 2018 Real GDP CAGR 2-3%
17
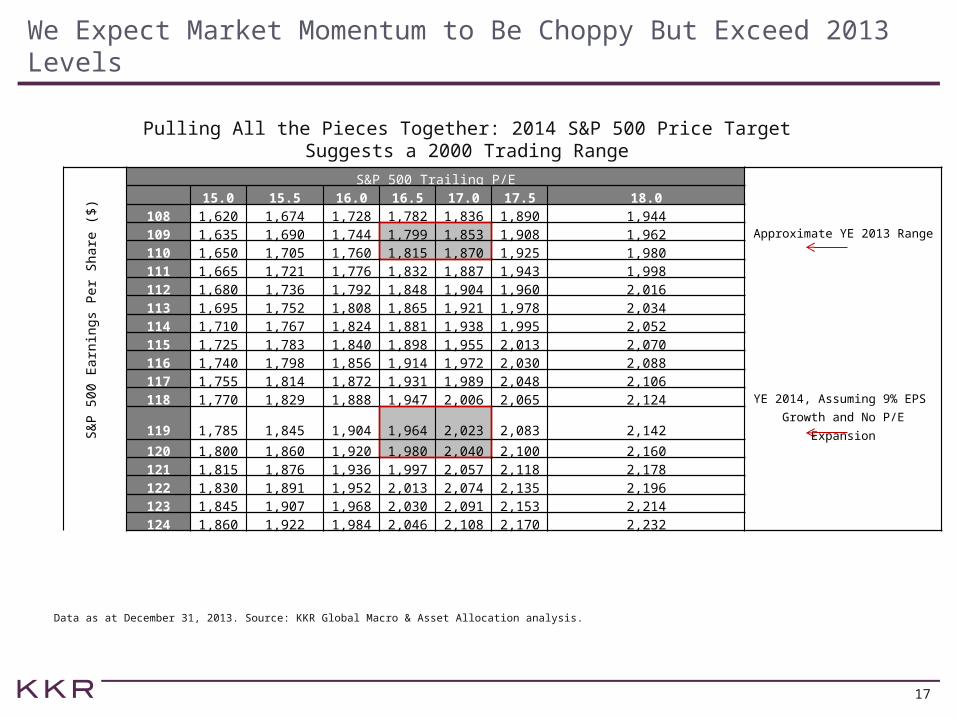
We Expect Market Momentum to Be Choppy But Exceed 2013 Levels
Pulling All the Pieces Together: 2014 S&P 500 Price Target Suggests a 2000 Trading Range
Data as at December 31, 2013. Source: KKR Global Macro & Asset Allocation analysis.
&P S&P 500 Trailing P/E 15.0 15.5 16.0 16.5 17.0 17.5 18.0
108 1,620 1,674 1,728 1,782 1,836 1,890 1,944 109 1,635 1,690 1,744 1,799 1,853 1,908 1,962 Approximate YE 2013 Range
110 1,650 1,705 1,760 1,815 1,870 1,925 1,980111 1,665 1,721 1,776 1,832 1,887 1,943 1,998 112 1,680 1,736 1,792 1,848 1,904 1,960 2,016 113 1,695 1,752 1,808 1,865 1,921 1,978 2,034 114 1,710 1,767 1,824 1,881 1,938 1,995 2,052 115 1,725 1,783 1,840 1,898 1,955 2,013 2,070 116 1,740 1,798 1,856 1,914 1,972 2,030 2,088 117 1,755 1,814 1,872 1,931 1,989 2,048 2,106 118 1,770 1,829 1,888 1,947 2,006 2,065 2,124 YE 2014, Assuming 9% EPS
119 1,785 1,845 1,904 1,964 2,023 2,083 2,142 Growth and No P/E Expansion
120 1,800 1,860 1,920 1,980 2,040 2,100 2,160121 1,815 1,876 1,936 1,997 2,057 2,118 2,178 122 1,830 1,891 1,952 2,013 2,074 2,135 2,196 123 1,845 1,907 1,968 2,030 2,091 2,153 2,214 124 1,860 1,922 1,984 2,046 2,108 2,170 2,232
S&
P 5
00
Earn
ing
s Pe
r S
hare
($
)
18
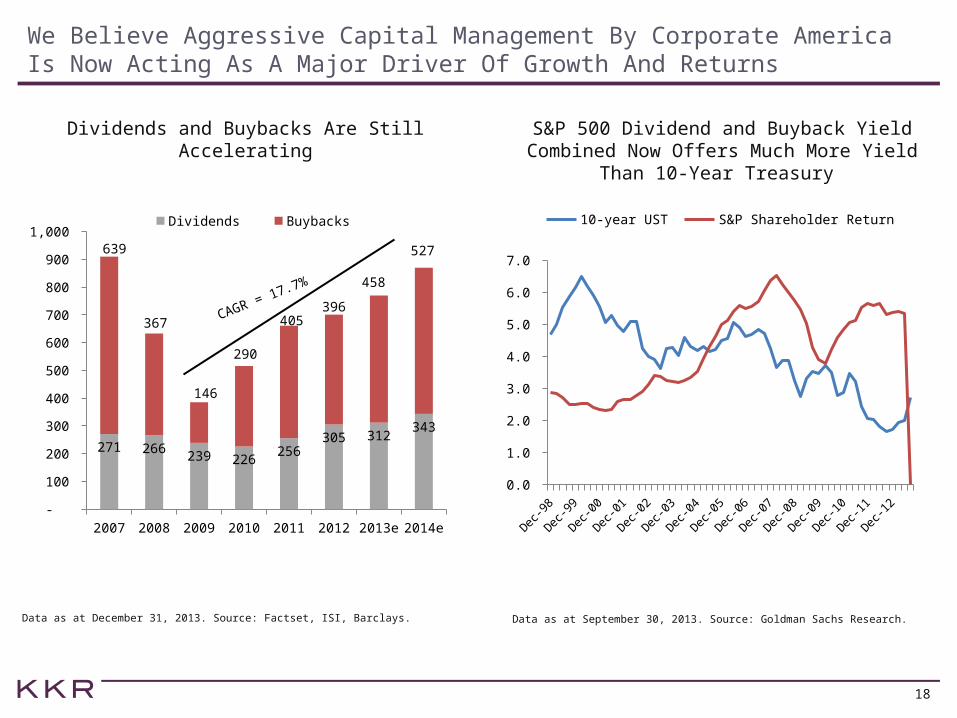
We Believe Aggressive Capital Management By Corporate America Is Now Acting As A Major Driver Of Growth And Returns
Dividends and Buybacks Are Still Accelerating S&P 500 Dividend and Buyback Yield Combined Now Offers Much More Yield Than
10-Year Treasury
Data as at December 31, 2013. Source: Factset, ISI, Barclays. Data as at September 30, 2013. Source: Goldman Sachs Research.
Dec-9
8
Dec-9
9
Dec-0
0
Dec-0
1
Dec-0
2
Dec-0
3
Dec-0
4
Dec-0
5
Dec-0
6
Dec-0
7
Dec-0
8
Dec-0
9
Dec-1
0
Dec-1
1
Dec-1
2
Dec-1
3
0.0
1.0
2.0
3.0
4.0
5.0
6.0
7.0
10-year UST S&P Shareholder Return
2007 2008 2009 2010 2011 2012 2013e 2014e -
100
200
300
400
500
600
700
800
900
1,000
271 266 239 226 256
305 312 343
639
367
146
290
405 396
458
527
Dividends Buybacks
CAGR = 17.7%

IV. Fixed Income
20
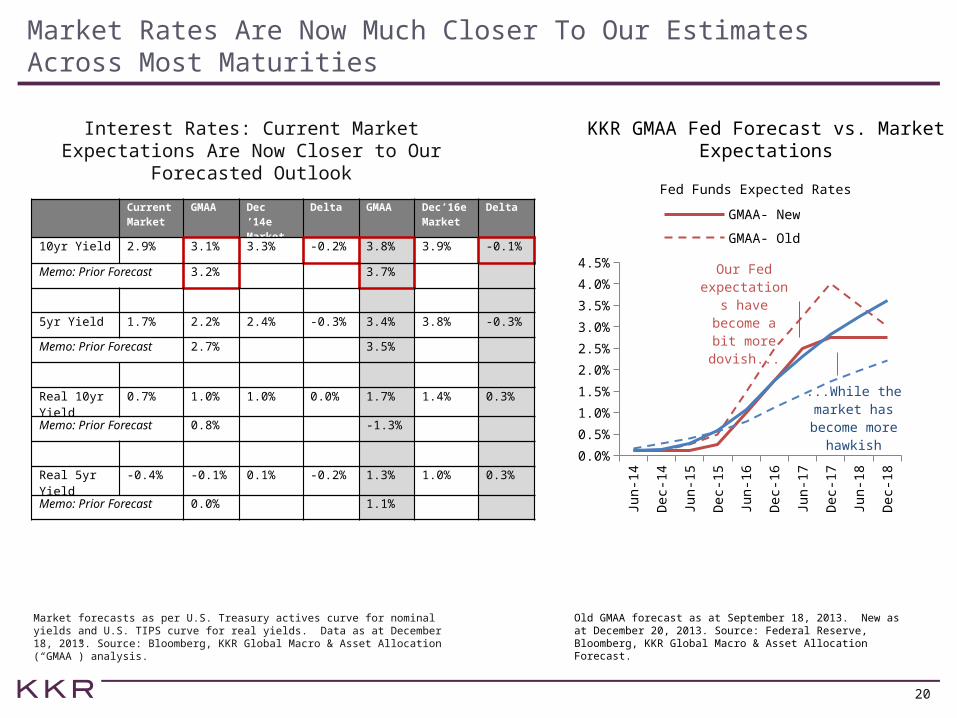
Market Rates Are Now Much Closer To Our Estimates Across Most Maturities
Interest Rates: Current Market Expectations Are Now Closer to Our Forecasted Outlook
Market forecasts as per U.S. Treasury actives curve for nominal yields and U.S. TIPS curve for real yields. Data as at December 18, 2013. Source: Bloomberg, KKR Global Macro & Asset Allocation (“GMAA”) analysis.
Current Market
GMAA Dec’14eMarket
Delta GMAA Dec’16eMarket
Delta
10yr Yield 2.9% 3.1% 3.3% -0.2% 3.8% 3.9% -0.1%
Memo: Prior Forecast 3.2% 3.7%
5yr Yield 1.7% 2.2% 2.4% -0.3% 3.4% 3.8% -0.3%
Memo: Prior Forecast 2.7% 3.5%
Real 10yr Yield
0.7% 1.0% 1.0% 0.0% 1.7% 1.4% 0.3%
Memo: Prior Forecast 0.8% -1.3%
Real 5yr Yield
-0.4% -0.1% 0.1% -0.2% 1.3% 1.0% 0.3%
Memo: Prior Forecast 0.0% 1.1%
KKR GMAA Fed Forecast vs. Market Expectations
Jun-1
4
Dec-
14
Jun-1
5
Dec-
15
Jun-1
6
Dec-
16
Jun-1
7
Dec-
17
Jun-1
8
Dec-
18
0.0%
0.5%
1.0%
1.5%
2.0%
2.5%
3.0%
3.5%
4.0%
4.5%
GMAA- New GMAA- Old
Market-Current Market - 12/31/12
Fed Funds Expected Rates
...While the market has be-
come more hawkish
Our Fed ex-pectations
have become a bit more dovish...
Old GMAA forecast as at September 18, 2013. New as at December 20, 2013. Source: Federal Reserve, Bloomberg, KKR Global Macro & Asset Allocation Forecast.
21
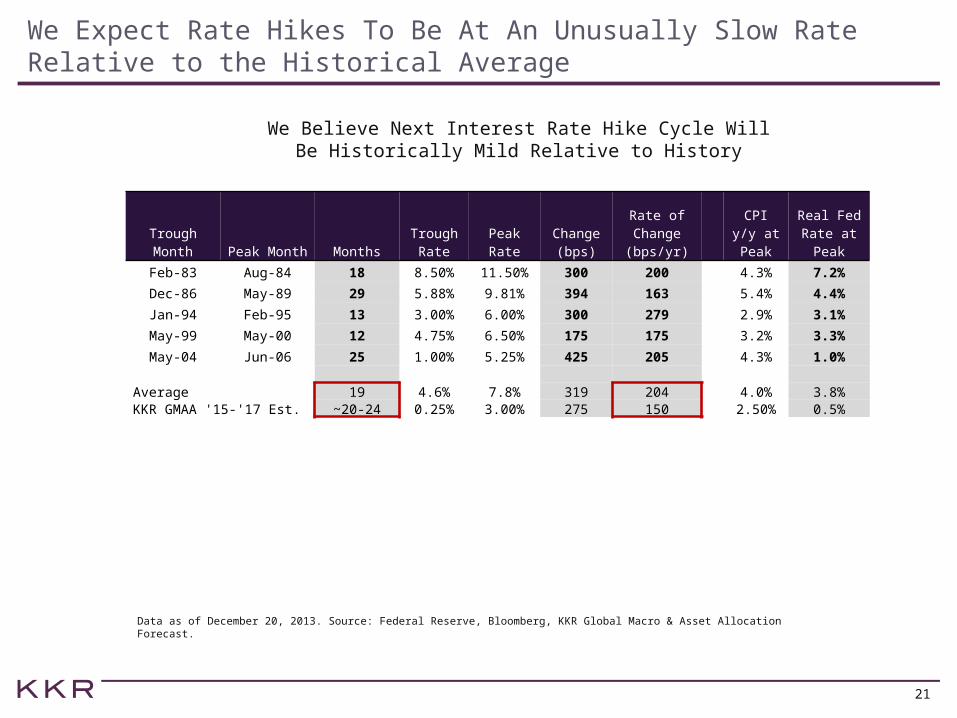
We Expect Rate Hikes To Be At An Unusually Slow Rate Relative to the Historical Average
We Believe Next Interest Rate Hike Cycle Will Be Historically Mild Relative to History
Data as of December 20, 2013. Source: Federal Reserve, Bloomberg, KKR Global Macro & Asset Allocation Forecast.
Trough Month Peak Month Months
Trough Rate
Peak Rate
Change (bps)
Rate of Change (bps/yr)
CPI y/y at Peak
Real Fed Rate at Peak
Feb-83 Aug-84 18 8.50% 11.50% 300 200 4.3% 7.2%
Dec-86 May-89 29 5.88% 9.81% 394 163 5.4% 4.4%
Jan-94 Feb-95 13 3.00% 6.00% 300 279 2.9% 3.1%
May-99 May-00 12 4.75% 6.50% 175 175 3.2% 3.3%
May-04 Jun-06 25 1.00% 5.25% 425 205 4.3% 1.0%
Average 19 4.6% 7.8% 319 204 4.0% 3.8%KKR GMAA '15-'17 Est. ~20-24 0.25% 3.00% 275 150 2.50% 0.5%
22
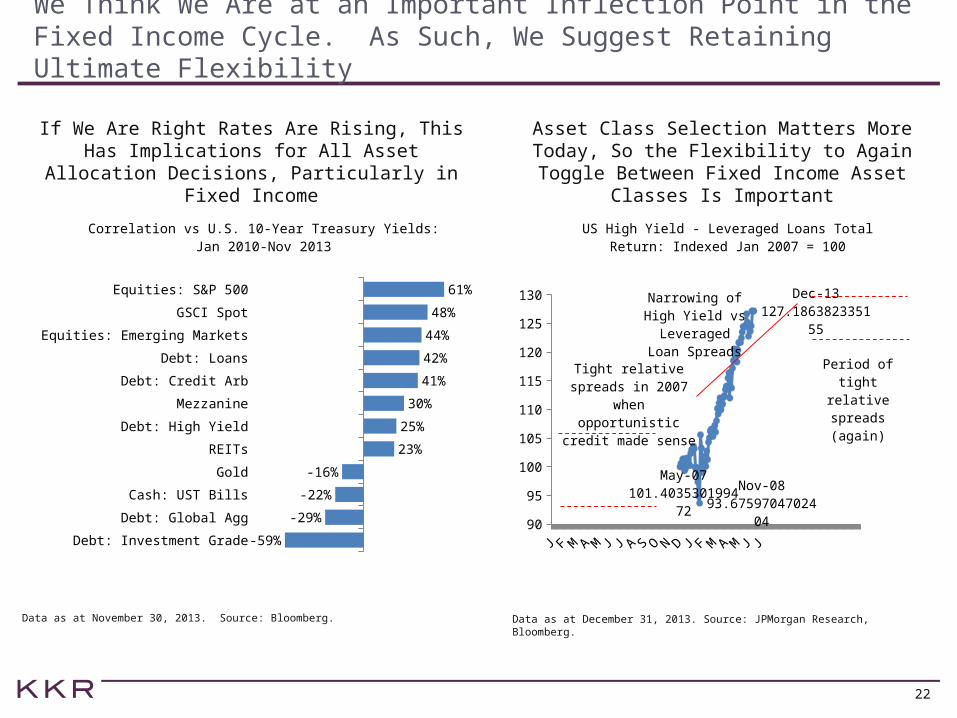
We Think We Are at an Important Inflection Point in the Fixed Income Cycle. As Such, We Suggest Retaining Ultimate Flexibility
If We Are Right Rates Are Rising, This Has Implications for All Asset Allocation Decisions,
Particularly in Fixed Income
Asset Class Selection Matters More Today, So the Flexibility to Again Toggle Between Fixed Income Asset Classes Is Important
Data as at November 30, 2013. Source: Bloomberg. Data as at December 31, 2013. Source: JPMorgan Research, Bloomberg.
Debt: Investment Grade
Debt: Global Agg
Cash: UST Bills
Gold
REITs
Debt: High Yield
Mezzanine
Debt: Credit Arb
Debt: Loans
Equities: Emerging Markets
GSCI Spot
Equities: S&P 500
-59%
-29%
-22%
-16%
23%
25%
30%
41%
42%
44%
48%
61%
Correlation vs U.S. 10-Year Treasury Yields: Jan 2010-Nov 2013
07 08 09 10 11 12 13 1490
95
100
105
110
115
120
125
130
07101.4035301994
7208
93.6759704702404
13127.1863823351
55
US High Yield - Leveraged Loans Total Return: Indexed Jan 2007 = 100
Tight relative spreads in 2007
when opportunistic credit made sense
Narrowing of High Yield vs
Leveraged Loan Spreads
Period of tight relative
spreads (again)
23
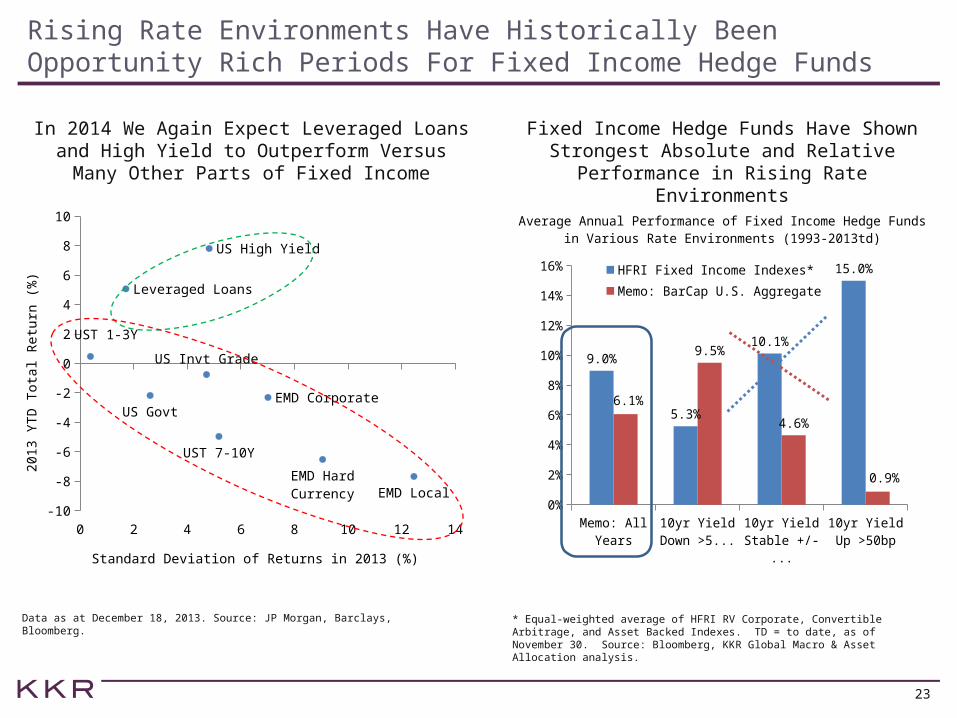
Rising Rate Environments Have Historically Been Opportunity Rich Periods For Fixed Income Hedge Funds
In 2014 We Again Expect Leveraged Loans and High Yield to Outperform Versus Many
Other Parts of Fixed Income
Fixed Income Hedge Funds Have Shown Strongest Absolute and Relative
Performance in Rising Rate Environments
Data as at December 18, 2013. Source: JP Morgan, Barclays, Bloomberg. * Equal-weighted average of HFRI RV Corporate, Convertible Arbitrage, and Asset Backed Indexes. TD = to date, as of November 30. Source: Bloomberg, KKR Global Macro & Asset Allocation analysis.
0 2 4 6 8 10 12 14-10
-8
-6
-4
-2
0
2
4
6
8
10
US High Yield
Leveraged Loans
UST 1-3Y
US Invt Grade
US GovtEMD Corporate
UST 7-10Y
EMD Hard Cur-rency EMD Local
Standard Deviation of Returns in 2013 (%)
2013 Y
TD
Tota
l R
etu
rn (
%)
Memo: All Years
10yr Yield Down >50
bp
10yr Yield Stable +/-
50bp
10yr Yield Up >50bp
0%
2%
4%
6%
8%
10%
12%
14%
16%
9.0%
5.3%
10.1%
15.0%
6.1%
9.5%
4.6%
0.9%
HFRI Fixed Income Indexes*
Memo: BarCap U.S. Aggregate
Average Annual Performance of Fixed Income Hedge Fundsin Various Rate Environments (1993-2013td)

V. Real Assets
25
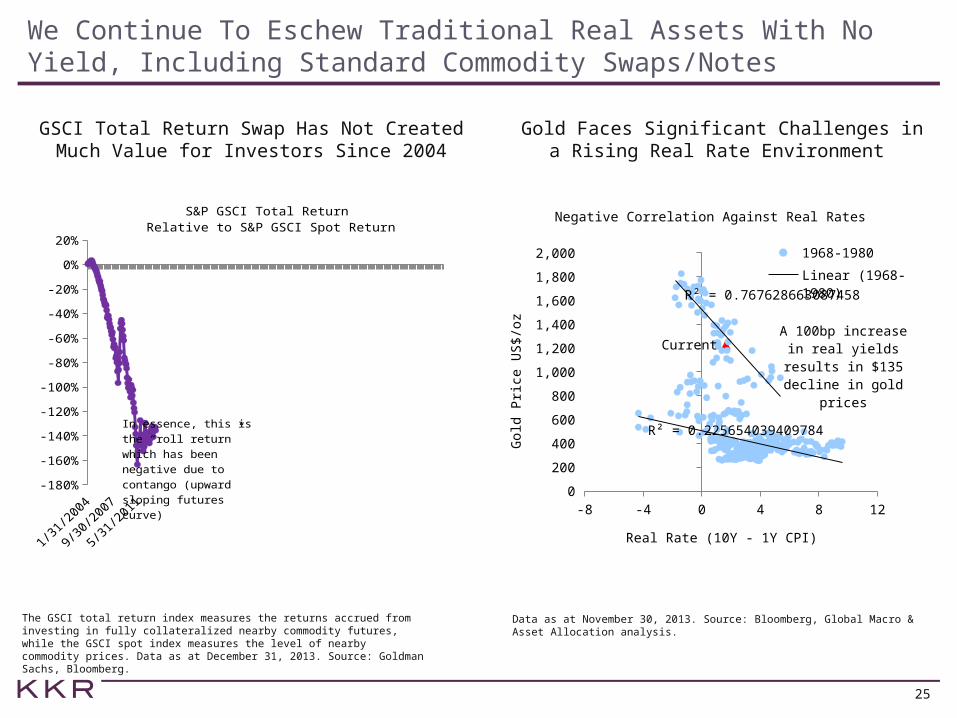
We Continue To Eschew Traditional Real Assets With No Yield, Including Standard Commodity Swaps/Notes
GSCI Total Return Swap Has Not Created Much Value for Investors Since 2004
Gold Faces Significant Challenges in a Rising Real Rate Environment
The GSCI total return index measures the returns accrued from investing in fully collateralized nearby commodity futures, while the GSCI spot index measures the level of nearby commodity prices. Data as at December 31, 2013. Source: Goldman Sachs, Bloomberg.
Data as at November 30, 2013. Source: Bloomberg, Global Macro & Asset Allocation analysis.
-8 -4 0 4 8 120
200
400
600
800
1,000
1,200
1,400
1,600
1,800
2,000
Current
R² = 0.767628663087458
R² = 0.225654039409785
Negative Correlation Against Real Rates
1968-1980Linear (1968-1980)1980-2009
Real Rate (10Y - 1Y CPI)G
old
Pri
ce U
S$/o
z A 100bp increase in real yields results in $135 decline in
gold prices
2004 2005 2006 2007 2008 2009 2010 2011 2012 2013-180%
-160%
-140%
-120%
-100%
-80%
-60%
-40%
-20%
0%
20%
S&P GSCI Total Return Relative to S&P GSCI Spot Return
In essence, this is the “roll return” which has been negative due to contango (upward slop-ing futures curve)
26
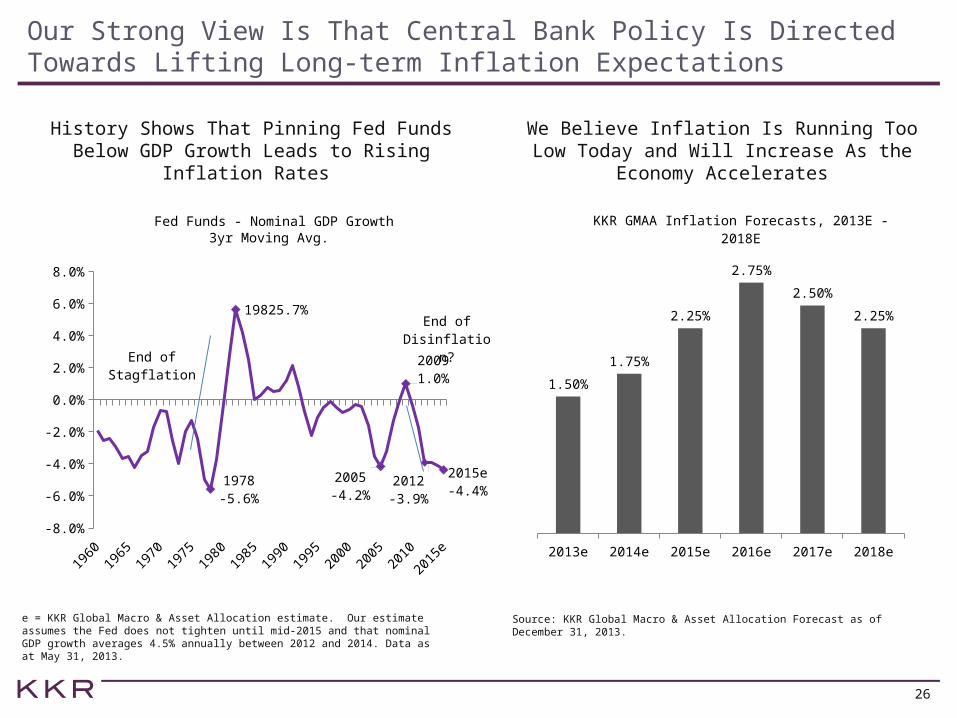
Our Strong View Is That Central Bank Policy Is Directed Towards Lifting Long-term Inflation Expectations
History Shows That Pinning Fed Funds Below GDP Growth Leads to Rising Inflation Rates
We Believe Inflation Is Running Too Low Today and Will Increase As the Economy
Accelerates
e = KKR Global Macro & Asset Allocation estimate. Our estimate assumes the Fed does not tighten until mid-2015 and that nominal GDP growth averages 4.5% annually between 2012 and 2014. Data as at May 31, 2013.
Source: KKR Global Macro & Asset Allocation Forecast as of December 31, 2013.
1960
1964
1968
1972
1976
1980
1984
1988
1992
1996
2000
2004
2008
2012
-8.0%
-6.0%
-4.0%
-2.0%
0.0%
2.0%
4.0%
6.0%
8.0%
1978-5.6%
19825.7%
2005-4.2%
20091.0%
2012-3.9%
2015e-4.4%
3yr Moving Avg.Fed Funds - Nominal GDP Growth
End of Stagflation
End ofDisinflation?
2013e 2014e 2015e 2016e 2017e 2018e
1.50%
1.75%
2.25%
2.75%
2.50%
2.25%
KKR GMAA Inflation Forecasts, 2013E - 2018E

VI. Alternatives
28
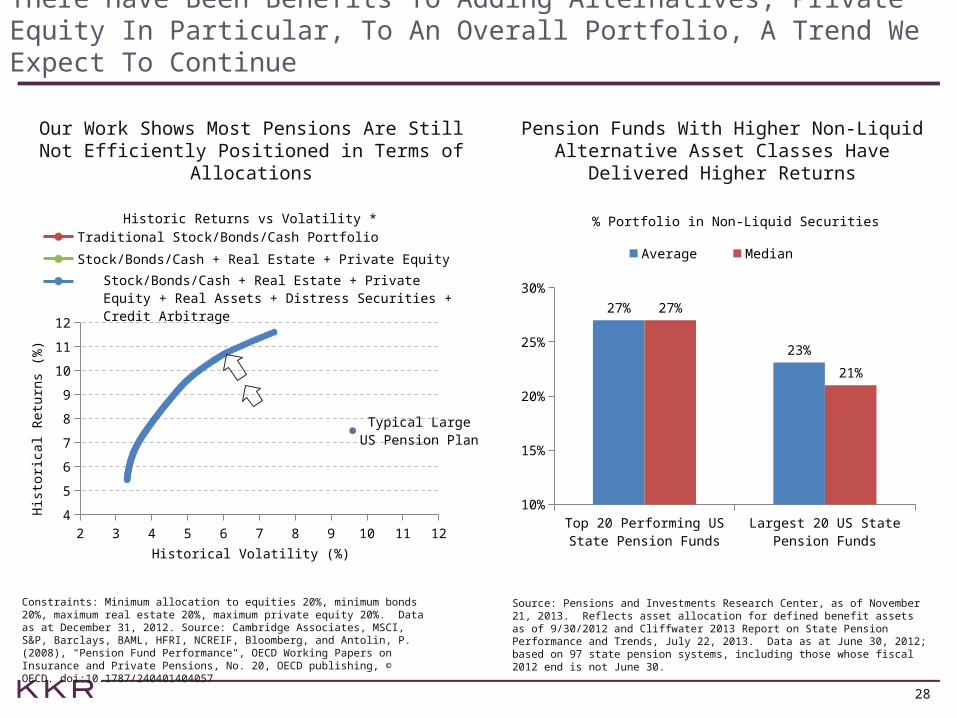
There Have Been Benefits To Adding Alternatives, Private Equity In Particular, To An Overall Portfolio, A Trend We Expect To Continue
Our Work Shows Most Pensions Are Still Not Efficiently Positioned in Terms of Allocations
Pension Funds With Higher Non-Liquid Alternative Asset Classes Have Delivered
Higher Returns
Constraints: Minimum allocation to equities 20%, minimum bonds 20%, maximum real estate 20%, maximum private equity 20%. Data as at December 31, 2012. Source: Cambridge Associates, MSCI, S&P, Barclays, BAML, HFRI, NCREIF, Bloomberg, and Antolin, P. (2008), "Pension Fund Performance", OECD Working Papers on Insurance and Private Pensions, No. 20, OECD publishing, © OECD. doi:10.1787/240401404057
Source: Pensions and Investments Research Center, as of November 21, 2013. Reflects asset allocation for defined benefit assets as of 9/30/2012 and Cliffwater 2013 Report on State Pension Performance and Trends, July 22, 2013. Data as at June 30, 2012; based on 97 state pension systems, including those whose fiscal 2012 end is not June 30.
2 3 4 5 6 7 8 9 10 11 124
5
6
7
8
9
10
11
12
Typical Large US Pension Plan
Historic Returns vs Volatility *
Traditional Stock/Bonds/Cash Portfolio
Stock/Bonds/Cash + Real Estate + Private Equity
Historical Volatility (%)
His
tori
cal R
etu
rns
(%)
Stock/Bonds/Cash + Real Estate + Private Equity + Real Assets + Distress Securities + Credit Arbitrage
Top 20 Performing US State Pension Funds
Largest 20 US State Pension Funds
10%
15%
20%
25%
30%
27%
23%
27%
21%
% Portfolio in Non-Liquid Securities
Average Median
29
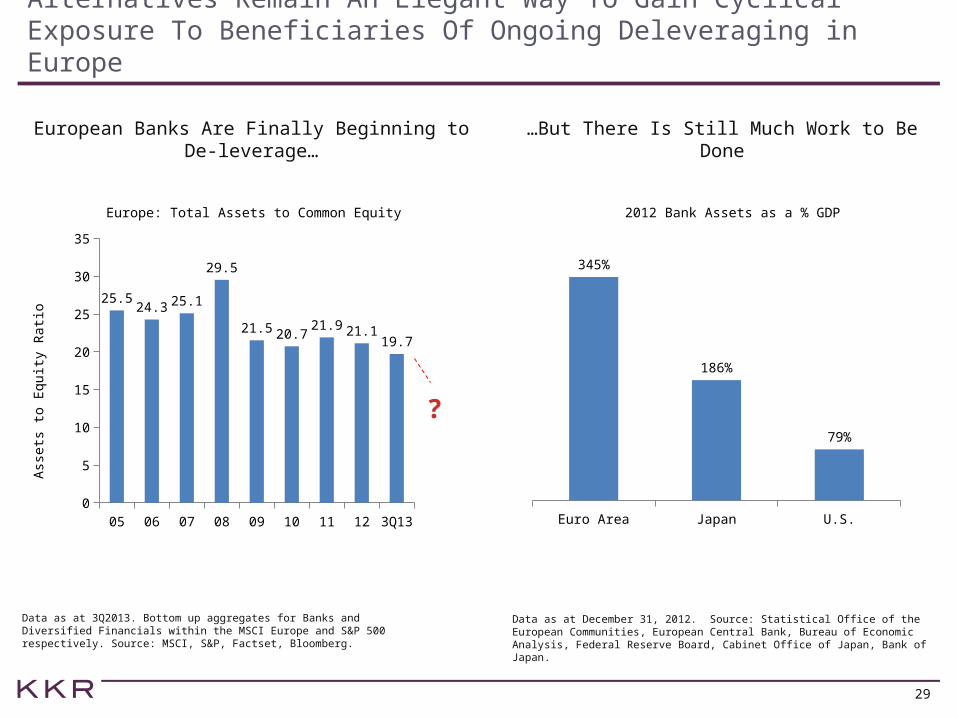
Alternatives Remain An Elegant Way To Gain Cyclical Exposure To Beneficiaries Of Ongoing Deleveraging in Europe
European Banks Are Finally Beginning to De-leverage…
…But There Is Still Much Work to Be Done
Data as at 3Q2013. Bottom up aggregates for Banks and Diversified Financials within the MSCI Europe and S&P 500 respectively. Source: MSCI, S&P, Factset, Bloomberg.
Data as at December 31, 2012. Source: Statistical Office of the European Communities, European Central Bank, Bureau of Economic Analysis, Federal Reserve Board, Cabinet Office of Japan, Bank of Japan.
05 06 07 08 09 10 11 12 3Q13
0
5
10
15
20
25
30
35
25.524.3 25.1
29.5
21.5 20.721.9 21.1
19.7
Europe: Total Assets to Common Equity
Ass
ets
to E
quit
y R
ati
o
?
Euro Area Japan U.S.
345%
186%
79%
2012 Bank Assets as a % GDP

VI. Currencies
31
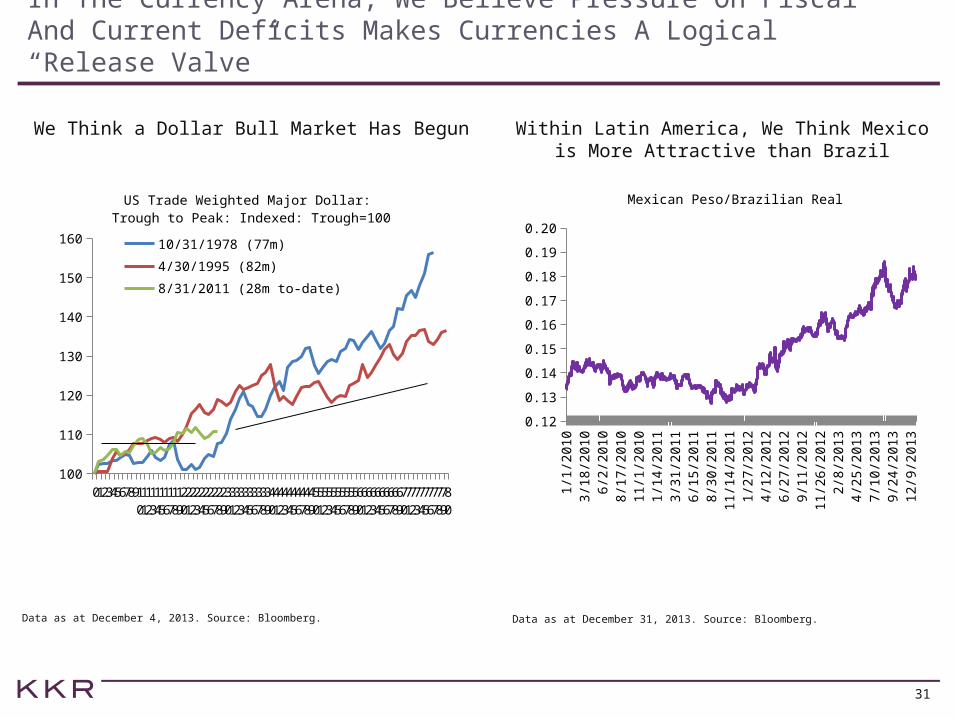
In The Currency Arena, We Believe Pressure On Fiscal And Current Deficits Makes Currencies A Logical “Release Valve”
We Think a Dollar Bull Market Has Begun Within Latin America, We Think Mexico is More Attractive than Brazil
Data as at December 4, 2013. Source: Bloomberg. Data as at December 31, 2013. Source: Bloomberg.
01234567891011121314151617181920212223242526272829303132333435363738394041424344454647484950515253545556575859606162636465666768697071727374757677787980
100
110
120
130
140
150
160
US Trade Weighted Major Dollar: Trough to Peak: Indexed: Trough=100
10/31/1978 (77m)
4/30/1995 (82m)
8/31/2011 (28m to-date)
Jan-1
0
May-1
0
Sep-1
0
Jan-1
1
May-1
1
Sep-1
1
Jan-1
2
May-1
2
Sep-1
2
Jan-1
3
May-1
3
Sep-1
3
0.12
0.13
0.14
0.15
0.16
0.17
0.18
0.19
0.20
Mexican Peso/Brazilian Real

VII. Asset Allocation Summary/Q&A
33
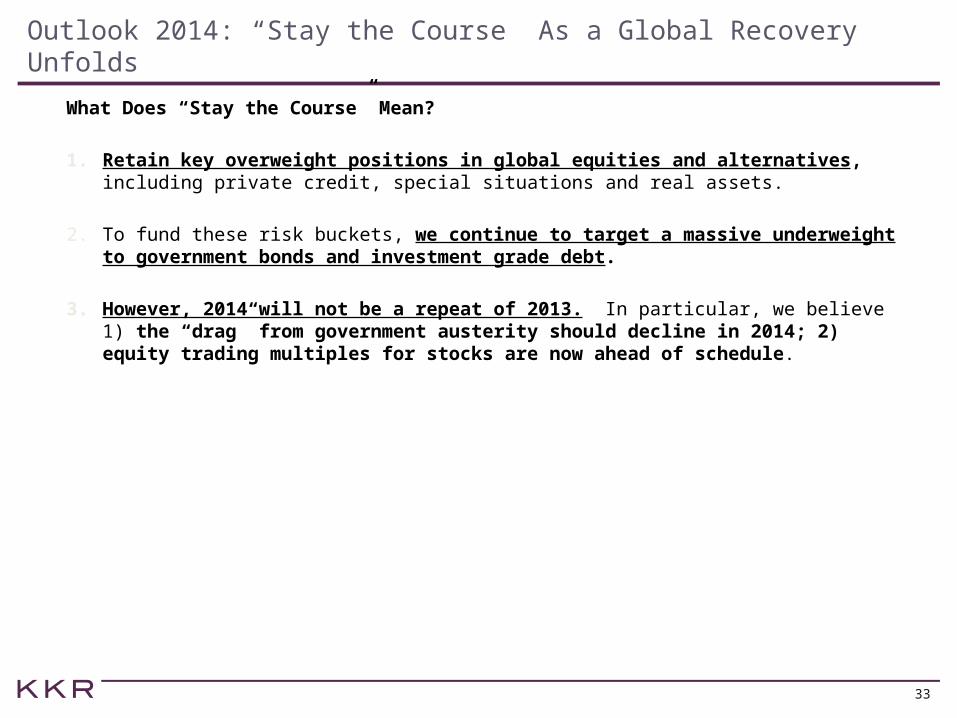
Outlook 2014: “Stay the Course” As a Global Recovery Unfolds
What Does “Stay the Course” Mean?
1. Retain key overweight positions in global equities and alternatives, including private credit, special situations and real assets.
2. To fund these risk buckets, we continue to target a massive underweight to government bonds and investment grade debt.
3. However, 2014 will not be a repeat of 2013. In particular, we believe 1) the “drag” from government austerity should decline in 2014; 2) equity trading multiples for stocks are now ahead of schedule.
34
KKR GMAA 2014 Target Asset AllocationAsset Class KKR GMAA January
2014 Target (%)Strategy
Benchmark (%)
KKR GMAA September 2013
Target (%)
Public Equities 55 53 55
U.S. 20 20 20
Europe 16 15 15
All Asia 13 12 14
Latin America 6 6 6
Total Fixed Income 20 30 20
Global Government 3 20 3
Mezzanine 5 0 5
High Yield 0 5 5
Bank Loans 0 0 2
High Grade 0 5 0
Emerging Market Debt 0 0 2
Actively Managed Opportunistic Credit 6 0 ―
Fixed Income Hedge Funds 3 0 ―
Direct Lending 3 0 3
Real Assets 8 5 10
Real Estate 5 2 5
Energy / Infrastructure 5 2 5
Gold/Corn/Other -2 1 0
Other Alternatives 17 10 15
Traditional PE 5 5 5
Distressed / Special Situation 7 0 5
Growth Capital/EM PE/Other 5 5 5Cash 0 2 0Source: *KKR Global Macro & Asset Allocation (GMAA) as at December 31, 2013. Strategy benchmark is the typical allocation of a large U.S. pension plan. Please visit www.KKRinsights.com to review our Outlook for 2013: A Changing Playbook note, which further reviews these ideas.