Embed Size (px)
Citation preview
Outline of Consolidated Results for the Fiscal Year Ended March 2013
May 8, 2013
© 2013 1
Contents
1. Outline of Consolidated Results for the Fiscal Year Ended March 2013 2
2. Progress of Investment Plan 12
3. Consolidated Earnings Forecast for the Fiscal Year Ending March 2014 14
4. Supplementary Materials 19
1. Outline of Consolidated Results for the Fiscal Year Ended March 2013
© 2013 3
+8%+9.7
+7%+387.6
+2%+1.2
+25%+23.4
Net sales Operating income
Ordinary income
Net income
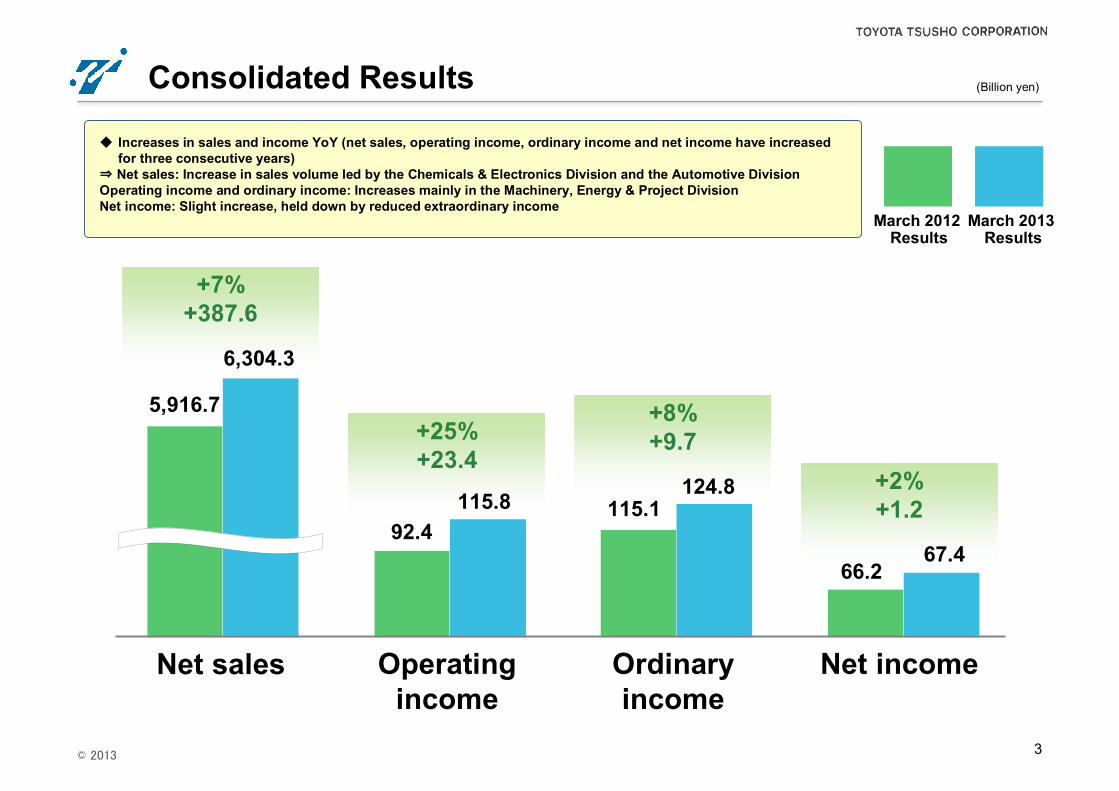
Consolidated Results
5,916.7
March 2012 Results
March 2013 Results
6,304.3
92.4115.8 115.1
124.8
66.267.4
(Billion yen)
◆ Increases in sales and income YoY (net sales, operating income, ordinary income and net income have increased for three consecutive years)
⇒ Net sales: Increase in sales volume led by the Chemicals & Electronics Division and the Automotive DivisionOperating income and ordinary income: Increases mainly in the Machinery, Energy & Project DivisionNet income: Slight increase, held down by reduced extraordinary income
© 2013 4
March 2012Results
March 2013Results
+5.8
+14.6
+1.9
-10.8
+1.4+13.9
+9.6
-3.0
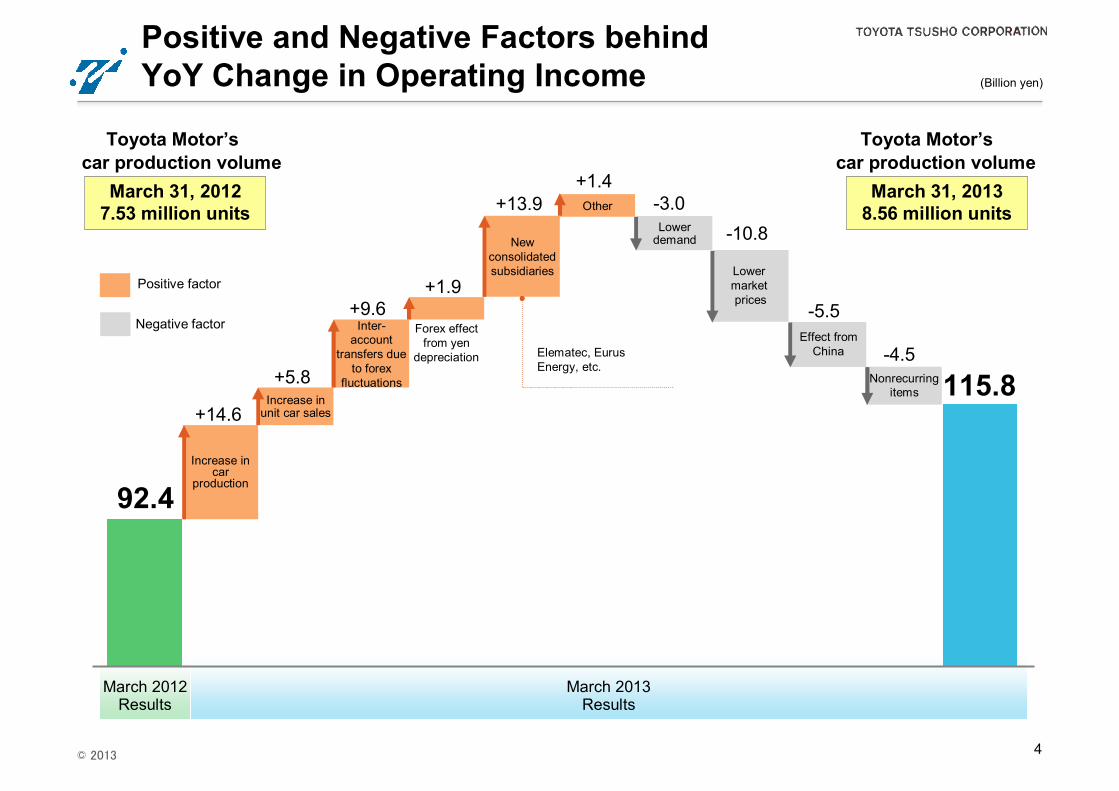
Positive and Negative Factors behind YoY Change in Operating Income (Billion yen)
Increase in unit car sales
Lower demand
Increase incar
production
Inter-account
transfers due to forex
fluctuations
Lower market prices
92.4
115.8
March 31, 20127.53 million units
March 31, 20138.56 million units
Positive factor
Negative factor
New consolidated subsidiaries
Other
-5.5
Nonrecurring items
Elematec, Eurus Energy, etc.
Forex effect from yen
depreciation
Effect from China -4.5
Toyota Motor’s car production volume
Toyota Motor’s car production volume
© 2013
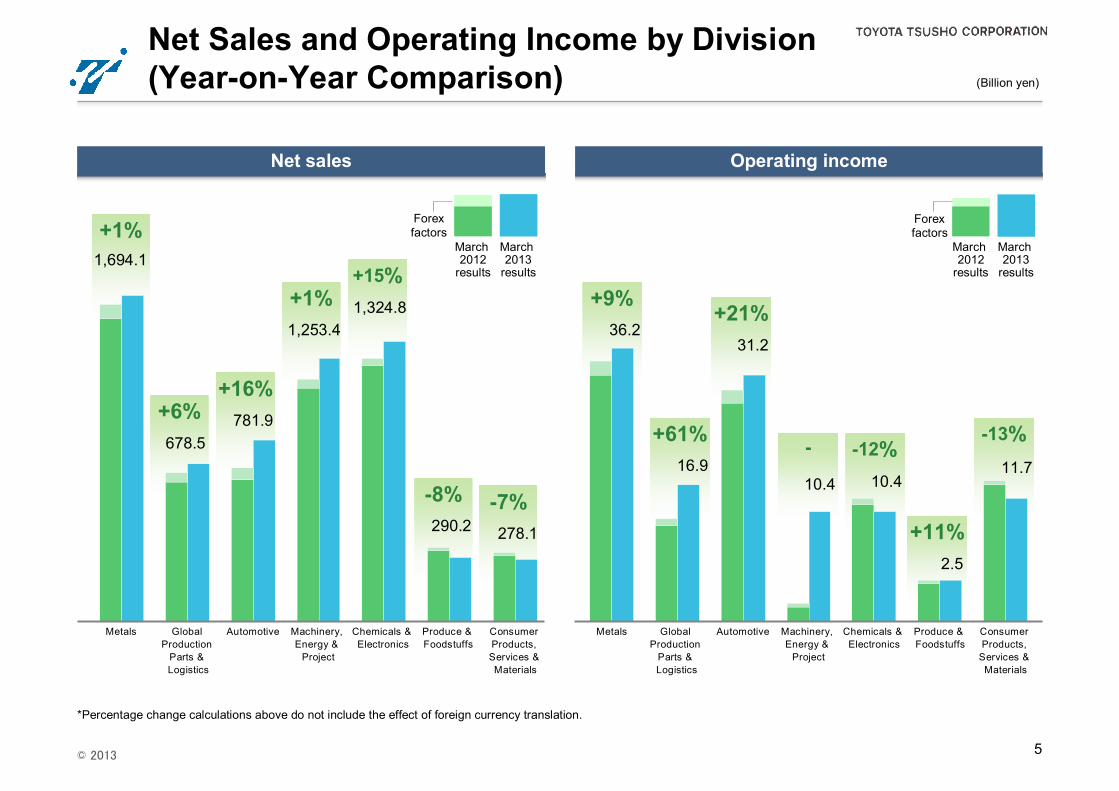
+6%+16%
+1%+15%
-8% -7%
+1%1,694.1
678.5781.9
1,253.41,324.8
290.2 278.1
5
-13%+61%
+21%
- -12%
+11%
+9%
Net Sales and Operating Income by Division(Year-on-Year Comparison)
*Percentage change calculations above do not include the effect of foreign currency translation.
Net sales Operating income
(Billion yen)
March 2012
results
March 2013
results
March 2012
results
March 2013
results
36.2
16.9
31.2
10.4 10.4
2.5
11.7
Forexfactors
Forexfactors
Metals Global Production
Parts & Logistics
Automotive Machinery, Energy &
Project
Consumer Products, Services & Materials
Chemicals & Electronics
Produce & Foodstuffs
Metals Global Production
Parts & Logistics
Automotive Machinery, Energy &
Project
Consumer Products,
Services & Materials
Chemicals & Electronics
Produce & Foodstuffs
© 2013 6
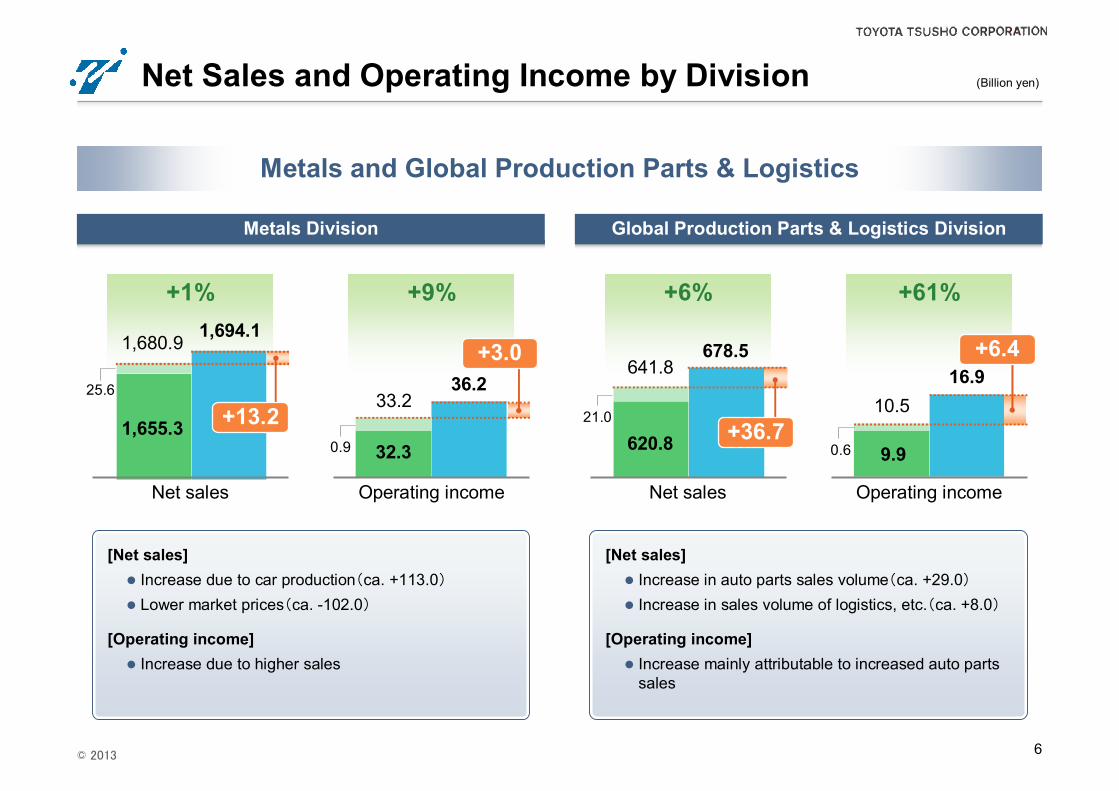
+6%
Net Sales and Operating Income by Division
+1% +9%
Metals Division Global Production Parts & Logistics Division
(Billion yen)
33.2
[Net sales] Increase due to car production(ca. +113.0) Lower market prices(ca. -102.0)
[Operating income] Increase due to higher sales
+61%
641.8678.5
620.8 +36.721.0
10.516.9
9.90.6
+6.4
[Net sales] Increase in auto parts sales volume(ca. +29.0) Increase in sales volume of logistics, etc.(ca. +8.0)
[Operating income] Increase mainly attributable to increased auto parts
sales
1,694.1
1,655.3 +13.225.6
1,680.9
36.2
32.30.9
Metals and Global Production Parts & Logistics
+3.0
Net sales Operating income Net sales Operating income

© 2013 7
+1%+16% +21% -
Net Sales and Operating Income by Division
Automotive Division Machinery, Energy & Project Division
Net sales Operating income
(Billion yen)
25.7
[Net sales] Increase in automobile export volume at parent
company (ca. +48.0) Growth in overseas auto sales (ca. +62.0)
Central & Western Asia +20.0, Russia +10.0, Australia & Asia +18.0, Africa +8.0
[Operating income] Increase due to higher overseas unit auto sales
Net sales Operating income
1,240.51,253.4
1,224.5+12.916.0
0.6
10.4
0.50.1
+9.8
[Net sales] Increase in machinery-related (ca. +22.0)
Of which automotive-related equipment (ca. +30.0) Lower energy- and plant-related sales volume (ca. -9.0)
Of which petroleum products, etc. (ca. -34.0), effect of new consolidated subsidiaries, etc. (ca. +25.0)
[Operating income] Higher income from automotive-related equipment Increase due to effect of new consolidated subsidiaries
781.9
668.8+110.6
2.5
671.3
31.2
25.40.3
+5.5
Automotive and Machinery, Energy & Project
© 2013 8
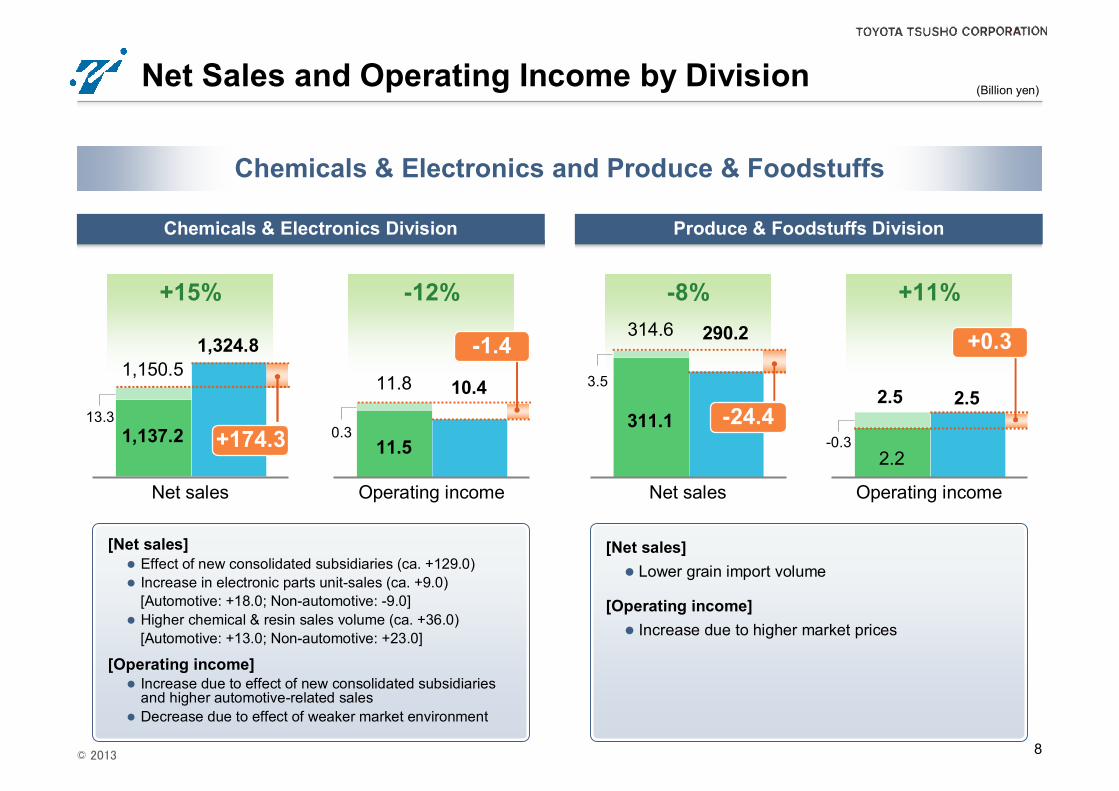
+15% +11%-8%-12%
Net Sales and Operating Income by Division
Chemicals & Electronics Division
Net sales Operating income
[Net sales] Effect of new consolidated subsidiaries (ca. +129.0) Increase in electronic parts unit-sales (ca. +9.0)
[Automotive: +18.0; Non-automotive: -9.0] Higher chemical & resin sales volume (ca. +36.0)
[Automotive: +13.0; Non-automotive: +23.0]
[Operating income] Increase due to effect of new consolidated subsidiaries
and higher automotive-related sales Decrease due to effect of weaker market environment
1,324.8
1,137.2 +174.313.3
1,150.510.4
0.3
-1.4
Chemicals & Electronics and Produce & Foodstuffs
Produce & Foodstuffs Division
(Billion yen)
[Net sales] Lower grain import volume
[Operating income] Increase due to higher market prices
Net sales Operating income
314.6 290.2
311.1 -24.43.5
2.2
2.52.5
-0.3
+0.3
11.5
11.8
© 2013 9
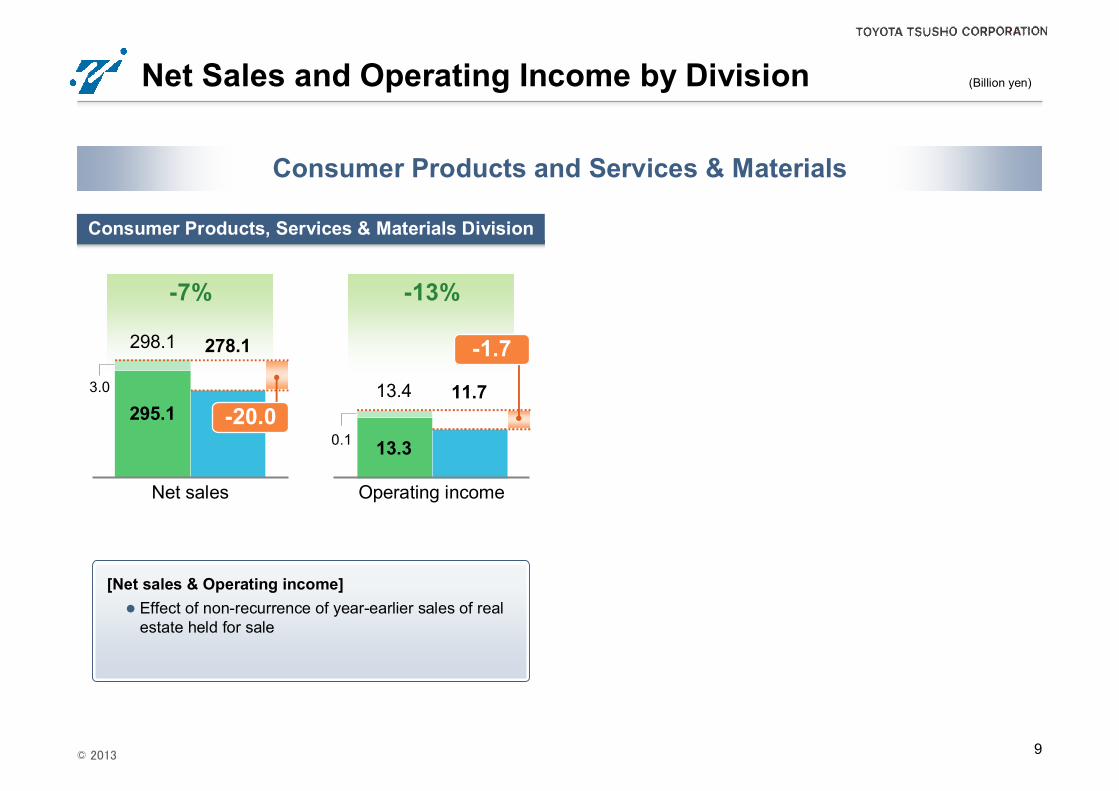
-7% -13%
Net Sales and Operating Income by Division
Consumer Products, Services & Materials Division
(Billion yen)
Net sales Operating income
[Net sales & Operating income] Effect of non-recurrence of year-earlier sales of real
estate held for sale
278.1
295.1 -20.03.0
298.1
11.7
0.1
-1.7
Consumer Products and Services & Materials
13.3
13.4
© 2013 10
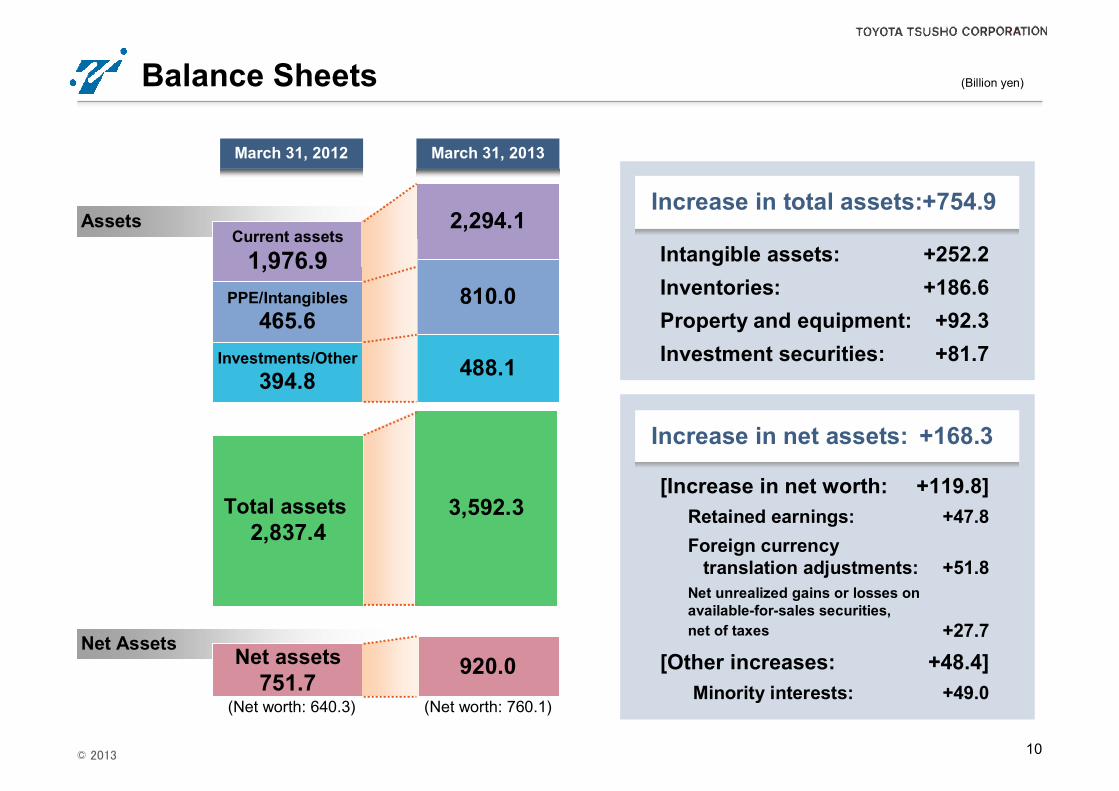
Assets
Net Assets
Balance Sheets
March 31, 2012 March 31, 2013
(Billion yen)
Net assets751.7
920.0
Total assets 2,837.4
Current assets1,976.9
Investments/Other394.8
PPE/Intangibles465.6
2,294.1
810.0
488.1
3,592.3
(Net worth: 640.3) (Net worth: 760.1)
Intangible assets: +252.2Inventories: +186.6Property and equipment: +92.3Investment securities: +81.7
[Increase in net worth: +119.8]Retained earnings: +47.8Foreign currency
translation adjustments: +51.8Net unrealized gains or losses on available-for-sales securities, net of taxes +27.7
[Other increases: +48.4]Minority interests: +49.0
Increase in total assets:+754.9
Increase in net assets: +168.3
© 2013 11
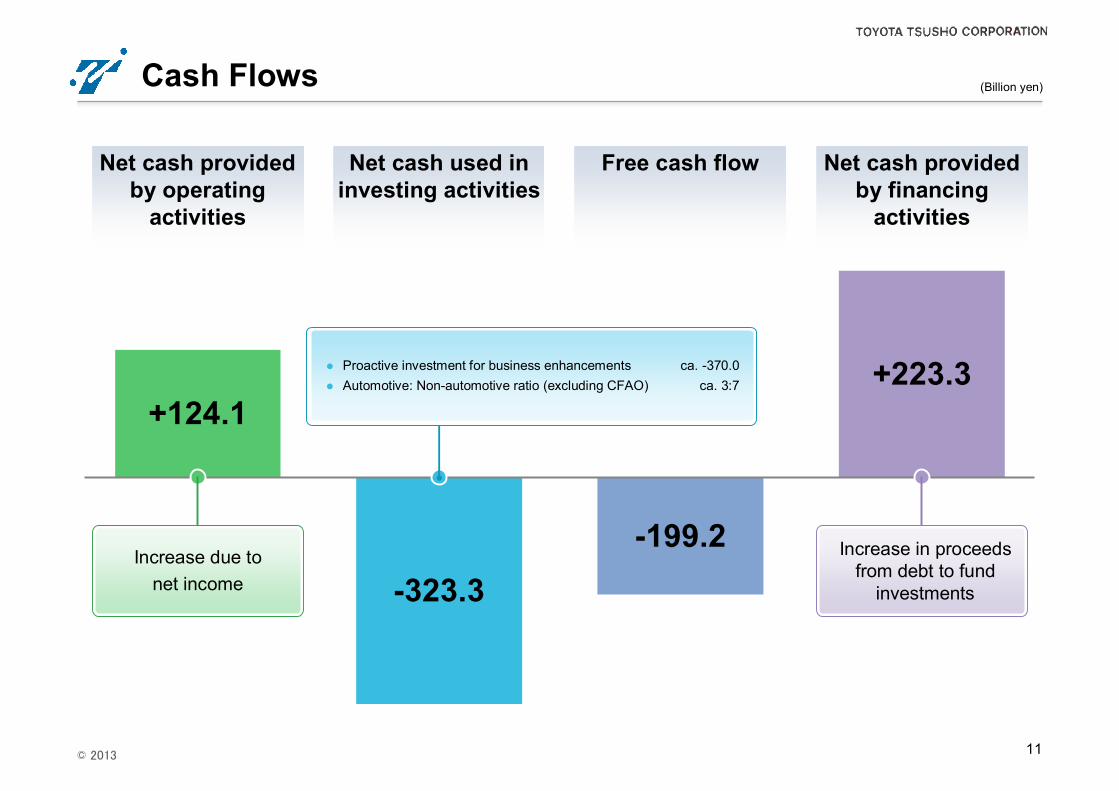
Net cash provided by operating
activities
Net cash used in investing activities
Free cash flow Net cash provided by financing
activities
Cash Flows (Billion yen)
-199.2-323.3
+124.1+223.3
Increase due tonet income
Proactive investment for business enhancements ca. -370.0 Automotive: Non-automotive ratio (excluding CFAO) ca. 3:7
Increase in proceeds from debt to fund
investments

2.Progress of Investment Plan

© 2013
Total
13
Gas development project (Australia/Canada) Participation in power generation business
(Asia & North America)
Gas development project (Australia/Canada) Lithium development project (Argentina)
Expansion of the overseas assembly business
Automotive investment
Non-automotive investment
Establishment of new overseas dealers in emerging countries
Reinforcement of the logistics business (overseas)
Approved but not yet
funded
Approved but not yet
funded
Progress of Investment Plan
1Q – 3Q 29.5
4Q 7.9
AutomotiveAutomotiveFunded
Funded
NonNon--automotiveautomotive
FY ended March 2013
Total 12.7
1Q – 3Q 55.9
4Q 40.5
Unfunded 76.0Total 209.8
Funded 133.8
Total 96.4
Total 37.4
Total 63.3
Separate Separate budgetbudget Acquisition of a 97.81% stake in CFAO Funded 234.5
(Billion yen)
Investment as of 4Q of FY ended March 2013

3. Consolidated Earnings Forecast for the Fiscal Year Ending March 2014
© 2013 15
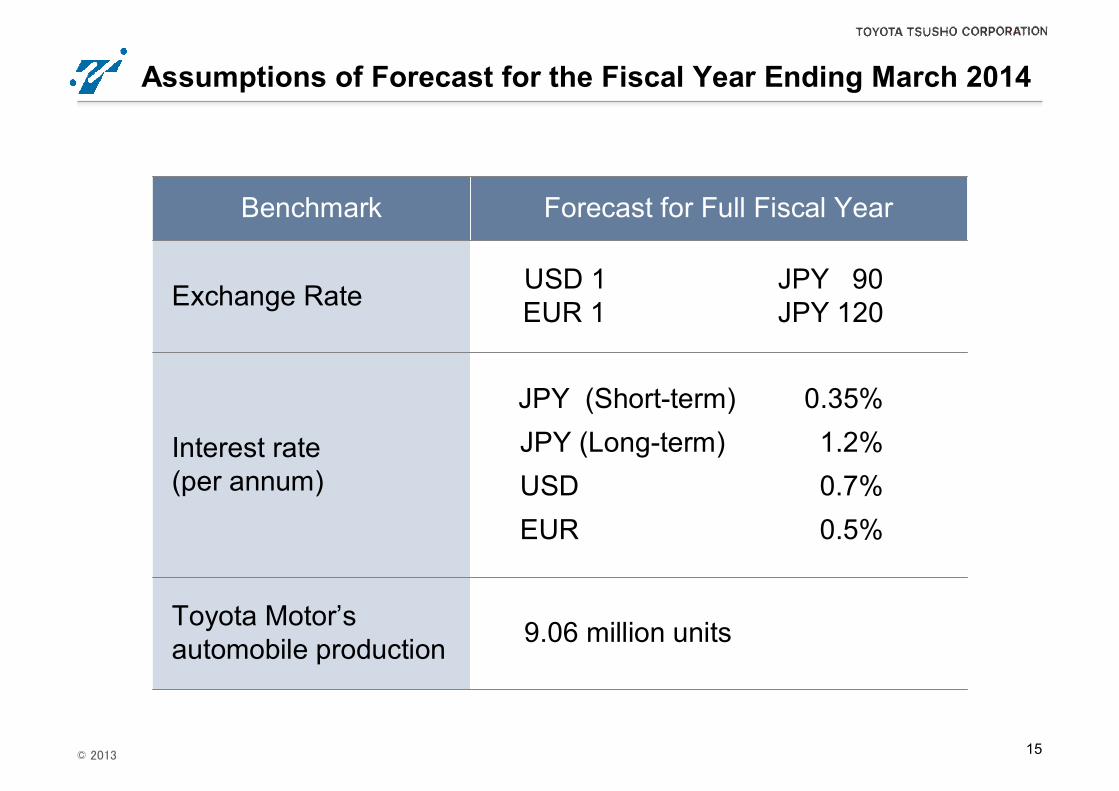
Assumptions of Forecast for the Fiscal Year Ending March 2014
Benchmark Forecast for Full Fiscal Year
Exchange Rate USD 1 JPY 90EUR 1 JPY 120
Interest rate (per annum)
JPY (Short-term) 0.35%JPY (Long-term) 1.2%USD 0.7%EUR 0.5%
Toyota Motor’s automobile production 9.06 million units
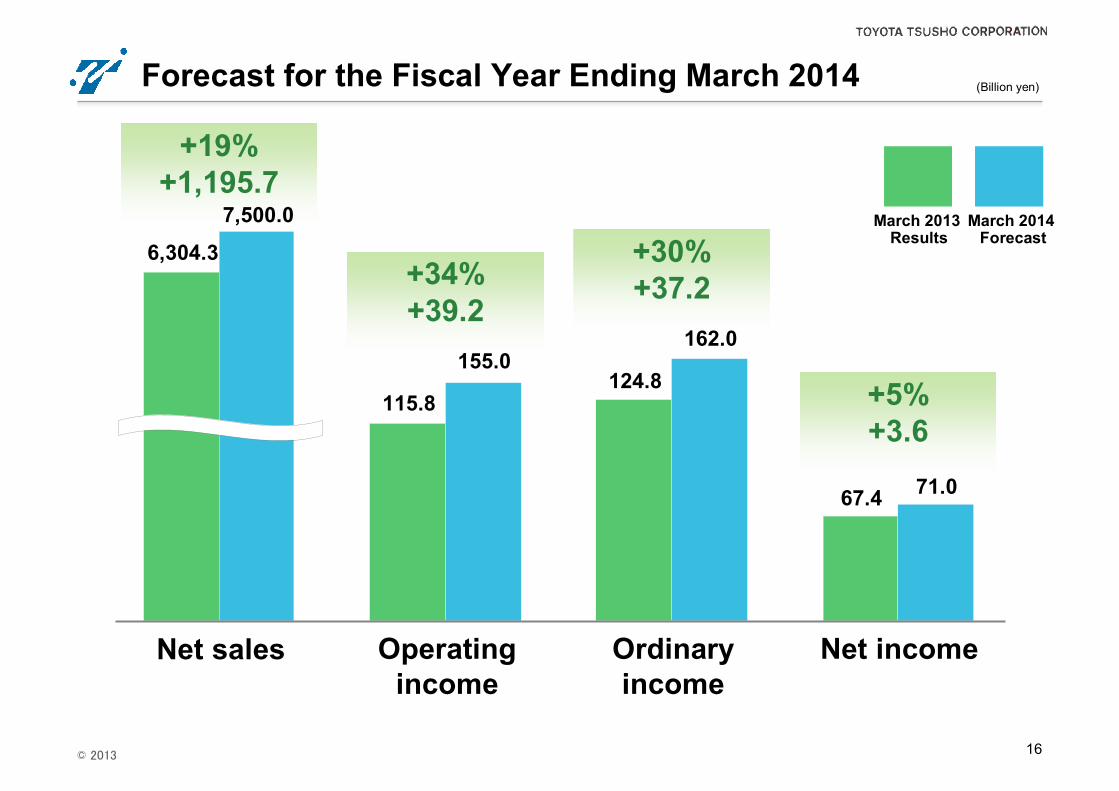
© 2013 16
+19%+1,195.7
+34%+39.2
+30%+37.2
+5%+3.6
Forecast for the Fiscal Year Ending March 2014
Net sales Operating income
Ordinary income
Net income
6,304.3
(Billion yen)
March 2013 Results
March 2014 Forecast
7,500.0
115.8
155.0124.8
162.0
67.4 71.0
© 2013 17
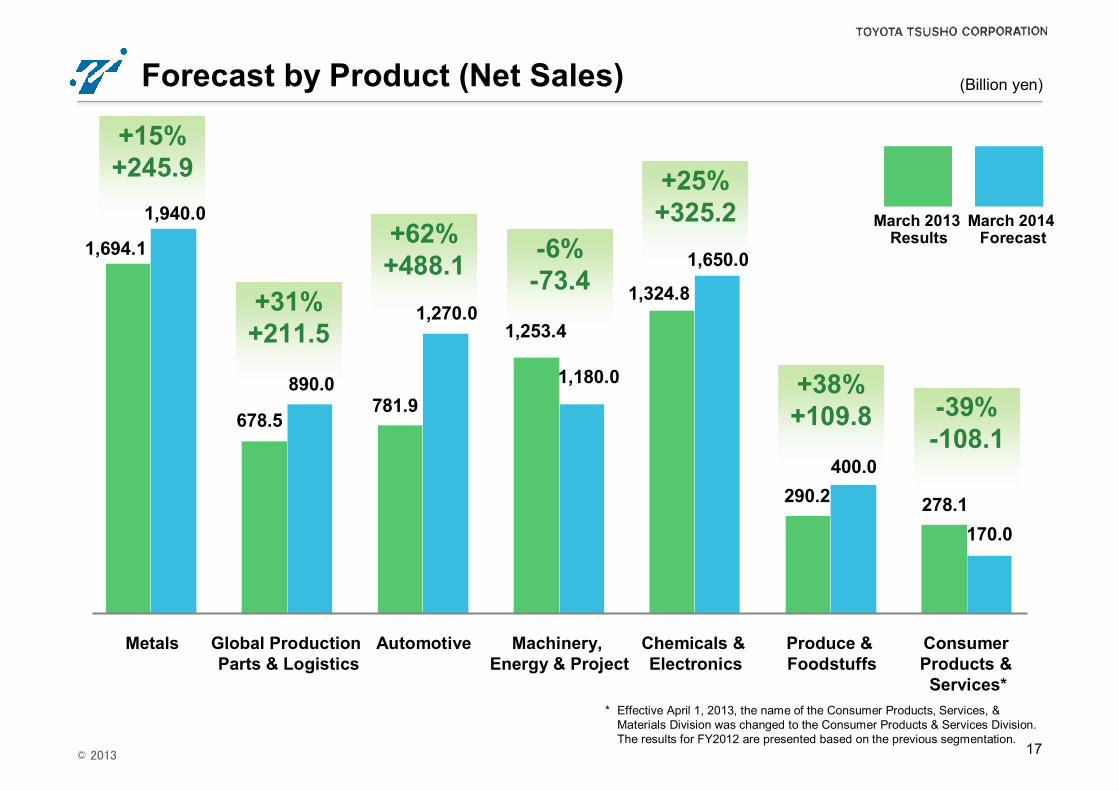
+15%+245.9
+31%+211.5
+62%+488.1 -6%
-73.4
+25%+325.2
+38%+109.8 -39%
-108.1
Metals
1,694.1
1,940.0
(Billion yen)
Global Production Parts & Logistics
Automotive Machinery, Energy & Project
Chemicals & Electronics
Produce & Foodstuffs
Consumer Products & Services*
678.5
890.0781.9
1,270.01,253.4
1,180.0
1,324.8
1,650.0
290.2400.0
278.1170.0
March 2013 Results
March 2014 Forecast
Forecast by Product (Net Sales)
* Effective April 1, 2013, the name of the Consumer Products, Services, & Materials Division was changed to the Consumer Products & Services Division. The results for FY2012 are presented based on the previous segmentation.

© 2013 18
+14%+5.3
+18%+3.1
+51%+15.8
+63%+6.6
+120%+12.6
+214%+5.5
-27%-3.2
36.2
41.5
16.9
20.0
31.2
47.0
10.4
17.0
10.4
23.0
2.58.0
11.78.5
(Billion yen)
March 2013 Results
March 2014 Forecast
Forecast by Product (Operating income)
Metals Global Production Parts & Logistics
Automotive Machinery, Energy & Project
Chemicals & Electronics
Produce & Foodstuffs
Consumer Products &Services*
* Effective April 1, 2013, the name of the Consumer Products, Services, & Materials Division was changed to the Consumer Products & Services Division. The results for FY2012 are presented based on the previous segmentation.

4. Supplementary Materials

© 2013 20
Supplementary Materials (Contents)
Supplementary Materials 1: Selling, General and Administrative Expenses 21
Supplementary Materials 2: Non-operating Income and Expenses 22
Supplementary Materials 3: Number of Consolidated Subsidiaries 23
Supplementary Materials 4: Companies with Losses and with Negative Net Worth 24
Supplementary Materials 5: Net Sales and Operating Income by Geographical Area 25
© 2013 21
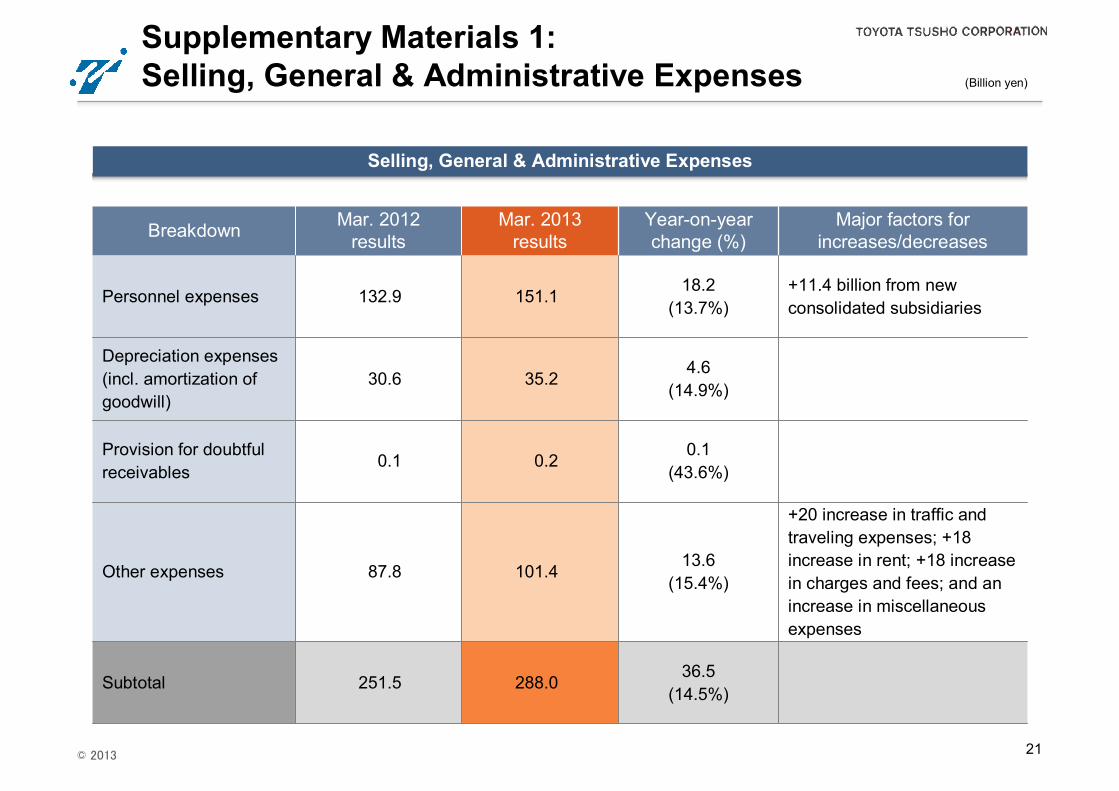
Supplementary Materials 1:Selling, General & Administrative Expenses
Selling, General & Administrative Expenses
(Billion yen)
Breakdown Mar. 2012results
Mar. 2013results
Year-on-year change (%)
Major factors for increases/decreases
Personnel expenses 132.9 151.1 18.2(13.7%)
+11.4 billion from new consolidated subsidiaries
Depreciation expenses (incl. amortization of goodwill)
30.6 35.24.6
(14.9%)
Provision for doubtful receivables
0.1 0.2 0.1(43.6%)
Other expenses 87.8 101.4 13.6(15.4%)
+20 increase in traffic and traveling expenses; +18 increase in rent; +18 increase in charges and fees; and an increase in miscellaneous expenses
Subtotal 251.5 288.0 36.5(14.5%)
© 2013
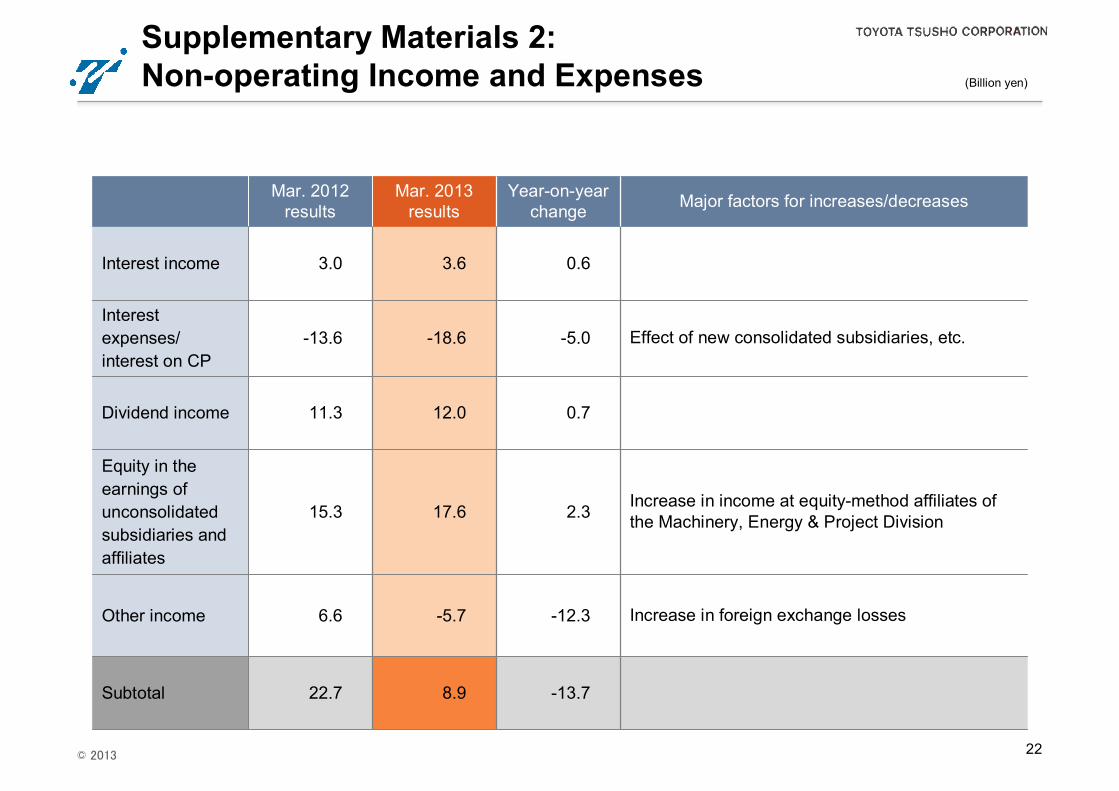
Supplementary Materials 2: Non-operating Income and Expenses
22
(Billion yen)
Mar. 2012results
Mar. 2013results
Year-on-year change Major factors for increases/decreases
Interest income 3.0 3.6 0.6
Interest expenses/ interest on CP
-13.6 -18.6 -5.0 Effect of new consolidated subsidiaries, etc.
Dividend income 11.3 12.0 0.7
Equity in the earnings of unconsolidated subsidiaries and affiliates
15.3 17.6 2.3 Increase in income at equity-method affiliates of the Machinery, Energy & Project Division
Other income 6.6 -5.7 -12.3 Increase in foreign exchange losses
Subtotal 22.7 8.9 -13.7
© 2013
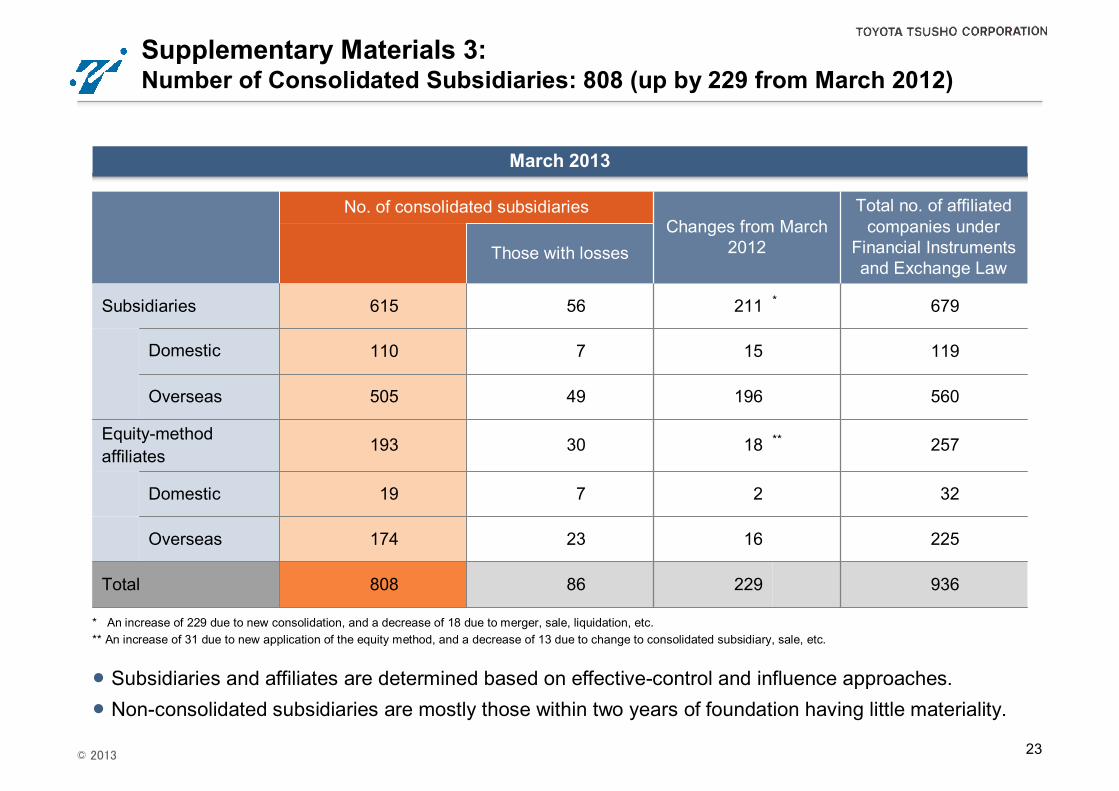
No. of consolidated subsidiariesChanges from March
2012
Total no. of affiliated companies under
Financial Instruments and Exchange Law
Those with losses
Subsidiaries 615 56 211 * 679
Domestic 110 7 15 119
Overseas 505 49 196 560
Equity-method affiliates
193 30 18 ** 257
Domestic 19 7 2 32
Overseas 174 23 16 225
Total 808 86 229 936
23
Supplementary Materials 3: Number of Consolidated Subsidiaries: 808 (up by 229 from March 2012)
Subsidiaries and affiliates are determined based on effective-control and influence approaches. Non-consolidated subsidiaries are mostly those within two years of foundation having little materiality.
* An increase of 229 due to new consolidation, and a decrease of 18 due to merger, sale, liquidation, etc. ** An increase of 31 due to new application of the equity method, and a decrease of 13 due to change to consolidated subsidiary, sale, etc.
March 2013
© 2013 24
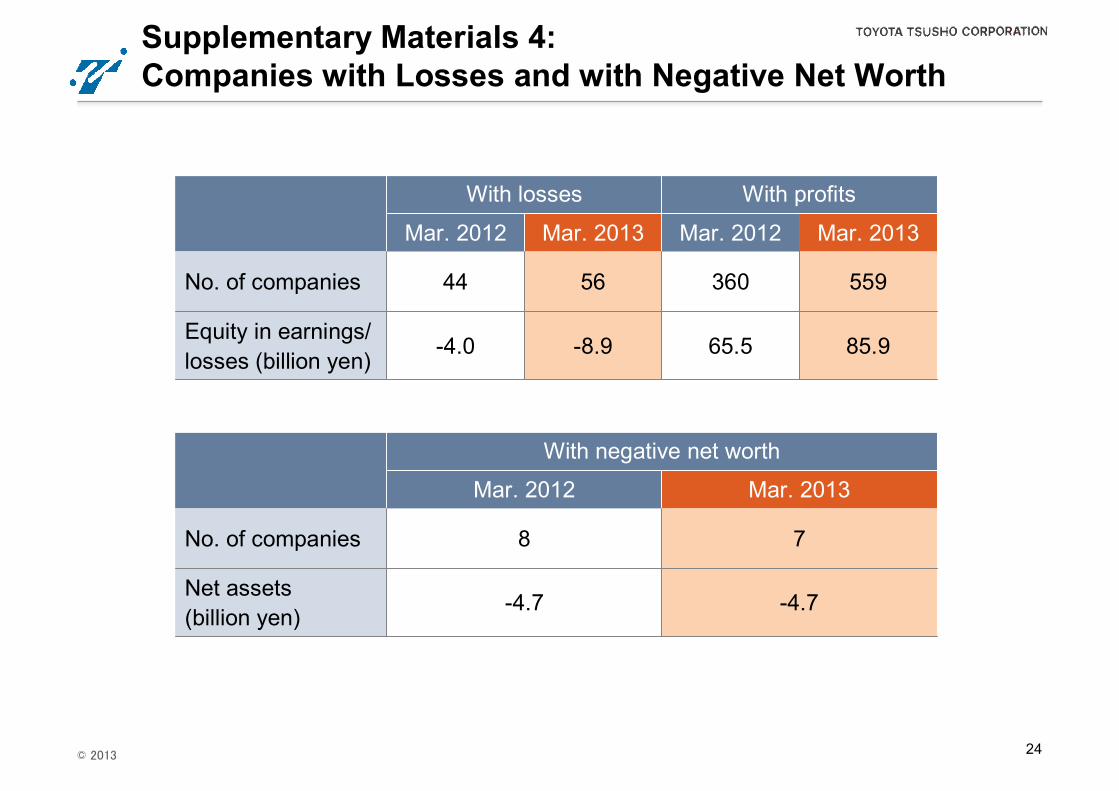
Supplementary Materials 4: Companies with Losses and with Negative Net Worth
With losses With profits
Mar. 2012 Mar. 2013 Mar. 2012 Mar. 2013
No. of companies 44 56 360 559
Equity in earnings/losses (billion yen)
-4.0 -8.9 65.5 85.9
With negative net worth
Mar. 2012 Mar. 2013
No. of companies 8 7
Net assets(billion yen)
-4.7 -4.7
© 2013 25
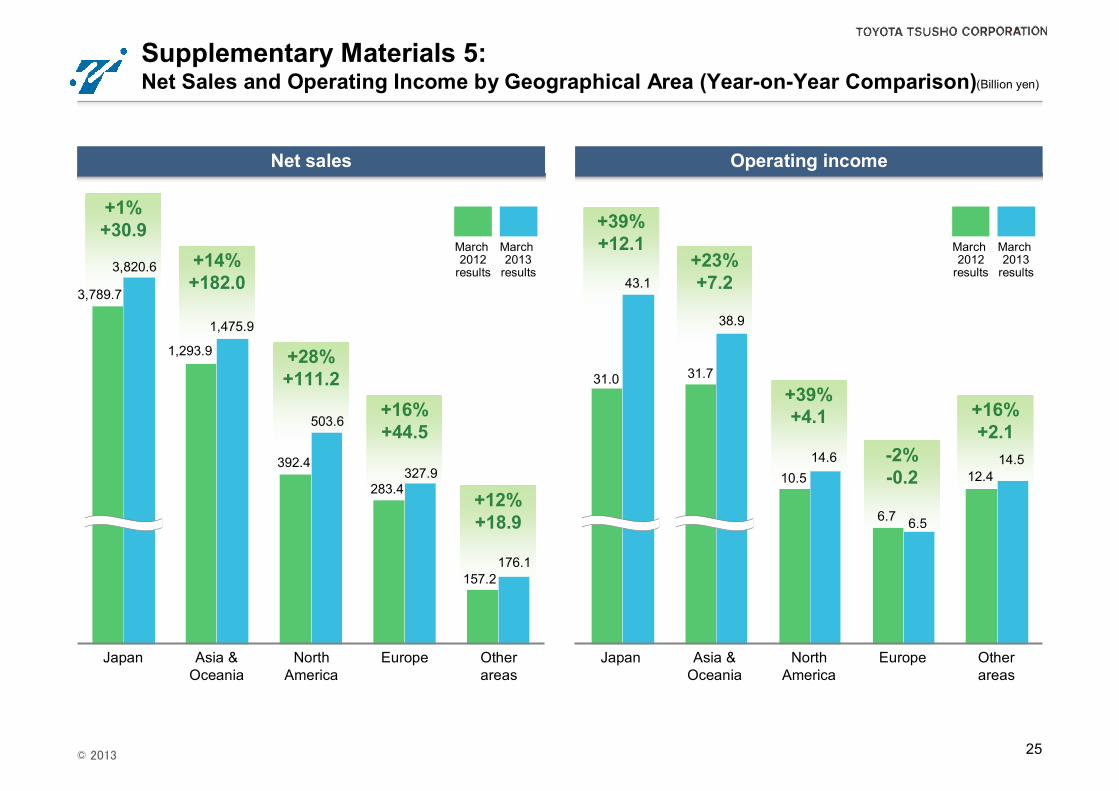
+39%+12.1
+23%+7.2
+39%+4.1
-2%-0.2
+16%+2.1
+1%+30.9
+14%+182.0
+28%+111.2
+16%+44.5
+12%+18.9
Supplementary Materials 5:Net Sales and Operating Income by Geographical Area (Year-on-Year Comparison)
Net sales Operating income
Japan Asia & Oceania
North America
Europe Other areas
(Billion yen)
3,820.6
3,789.7
1,475.9
1,293.9
503.6
392.4327.9
283.4
176.1157.2
43.1
31.0
38.9
31.7
14.610.5
6.56.7
14.512.4
March 2012
results
March 2013
results
March 2012
results
March 2013
results
Japan North America
Europe Other areas
Asia & Oceania
© 2013 26
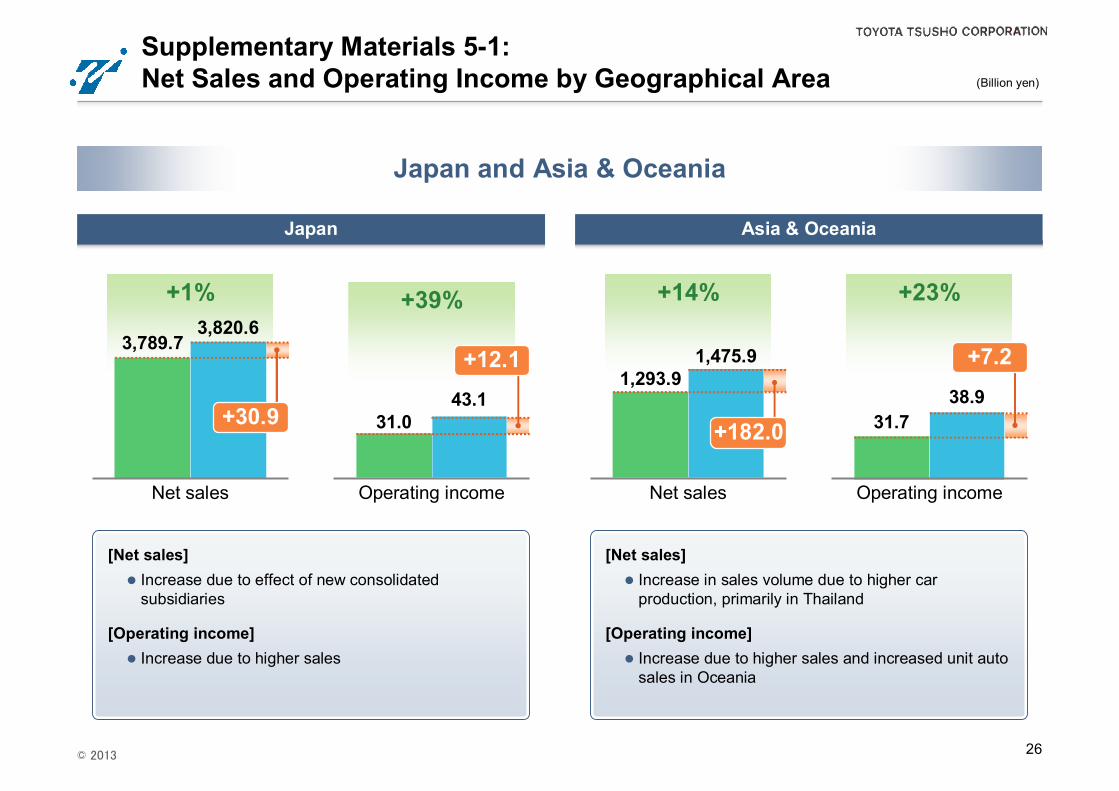
+1% +14% +23%+39%
Japan Asia & Oceania
Net sales Operating income
(Billion yen)
[Net sales] Increase due to effect of new consolidated
subsidiaries
[Operating income] Increase due to higher sales
Net sales Operating income
1,475.91,293.9
+182.038.9
31.7
+7.2
[Net sales] Increase in sales volume due to higher car
production, primarily in Thailand
[Operating income] Increase due to higher sales and increased unit auto
sales in Oceania
3,820.63,789.7
+30.943.1
31.0
+12.1
Japan and Asia & Oceania
Supplementary Materials 5-1:Net Sales and Operating Income by Geographical Area

© 2013 27
+28% +16% -2%+39%
North America Europe
Net sales Operating income
(Billion yen)
[Net sales] Increase in sales volume of U.S. subsidiaries in the
Metals Division and the Global Production Parts & Logistics Division because of higher car production in North America
[Operating income] Increase due to higher sales
Net sales Operating income
327.9283.4
+44.56.56.7
-0.2
[Net sales] Increase in unit auto sales
[Operating income] Despite higher sales, operating income decreased
due to lower income at automotive sales companies in Russia
503.6392.4
+111.2
14.610.5
+4.1
North America and Europe
Supplementary Materials 5-2:Net Sales and Operating Income by Geographical Area
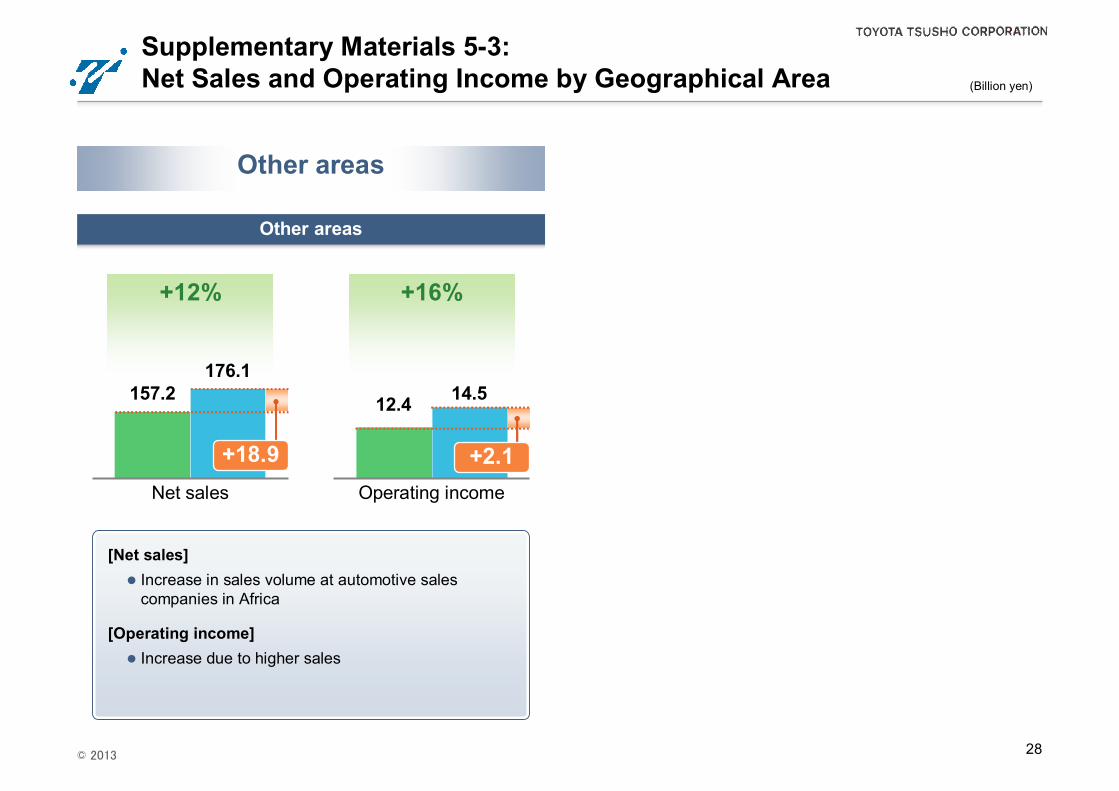
© 2013 28
+12% +16%
Other areas
(Billion yen)
Net sales Operating income
[Net sales] Increase in sales volume at automotive sales
companies in Africa
[Operating income] Increase due to higher sales
176.1157.2
+18.9
14.512.4
+2.1
Other areas
Supplementary Materials 5-3:Net Sales and Operating Income by Geographical Area
© 2013 29
Inquiries:
Investor Relation Group
E-mail [email protected]
TEL +81-3-4306-8201
FAX +81-3-4306-8818