Embed Size (px)
Citation preview
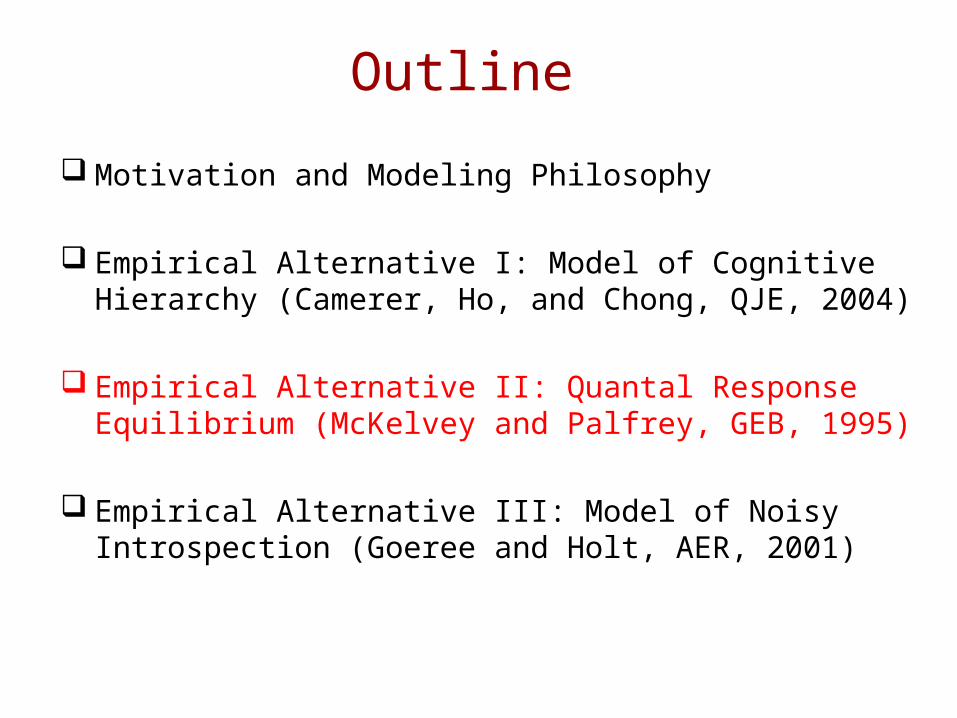
Outline
Motivation and Modeling Philosophy
Empirical Alternative I: Model of Cognitive Hierarchy (Camerer, Ho, and Chong, QJE, 2004)
Empirical Alternative II: Quantal Response Equilibrium (McKelvey and Palfrey, GEB, 1995)
Empirical Alternative III: Model of Noisy Introspection (Goeree and Holt, AER, 2001)
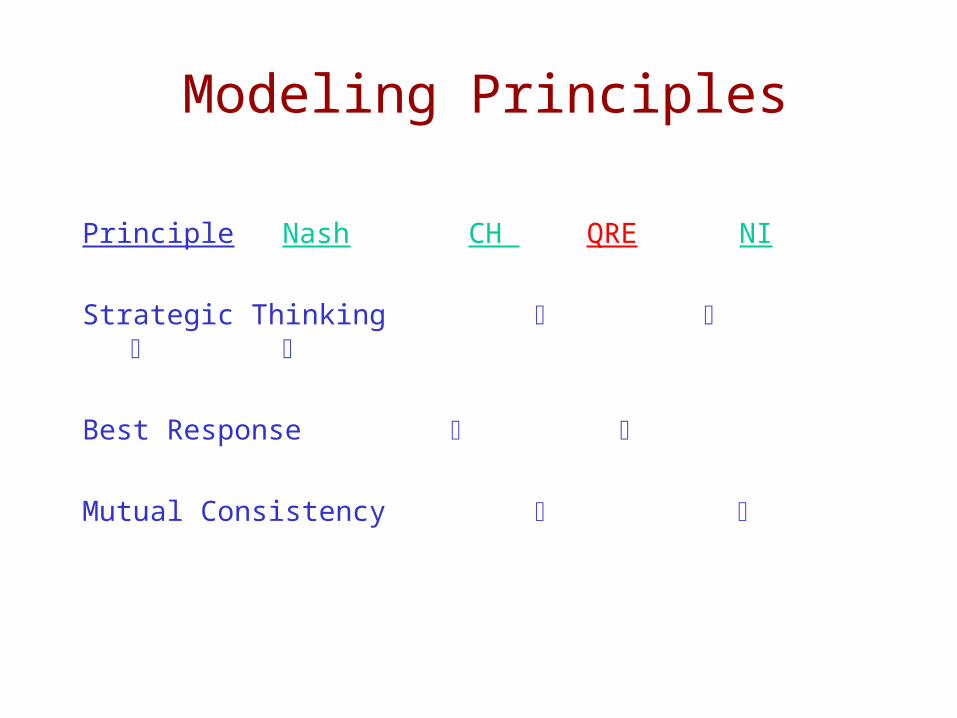
Modeling Principles
Principle Nash CH QRE NI
Strategic Thinking
Best Response
Mutual Consistency
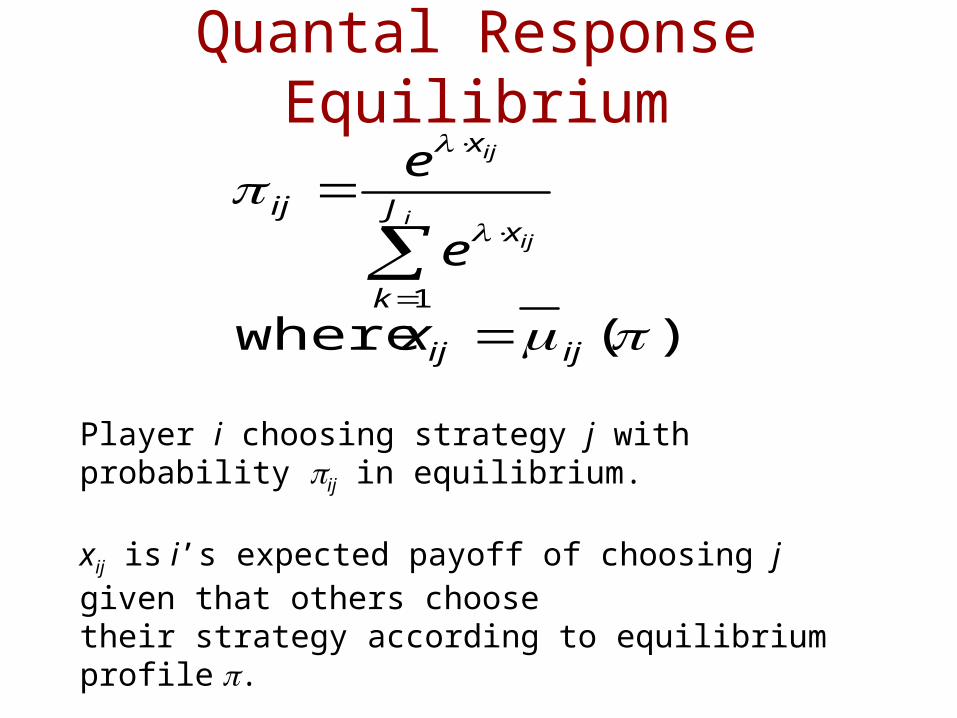
Quantal Response Equilibrium
)( where1
ijij
J
k
x
x
ij
x
e
ei
ij
ij
Player i choosing strategy j with probability ij in equilibrium.
xij is i’s expected payoff of choosing j given that others choosetheir strategy according to equilibrium profile .
The values of depends on .
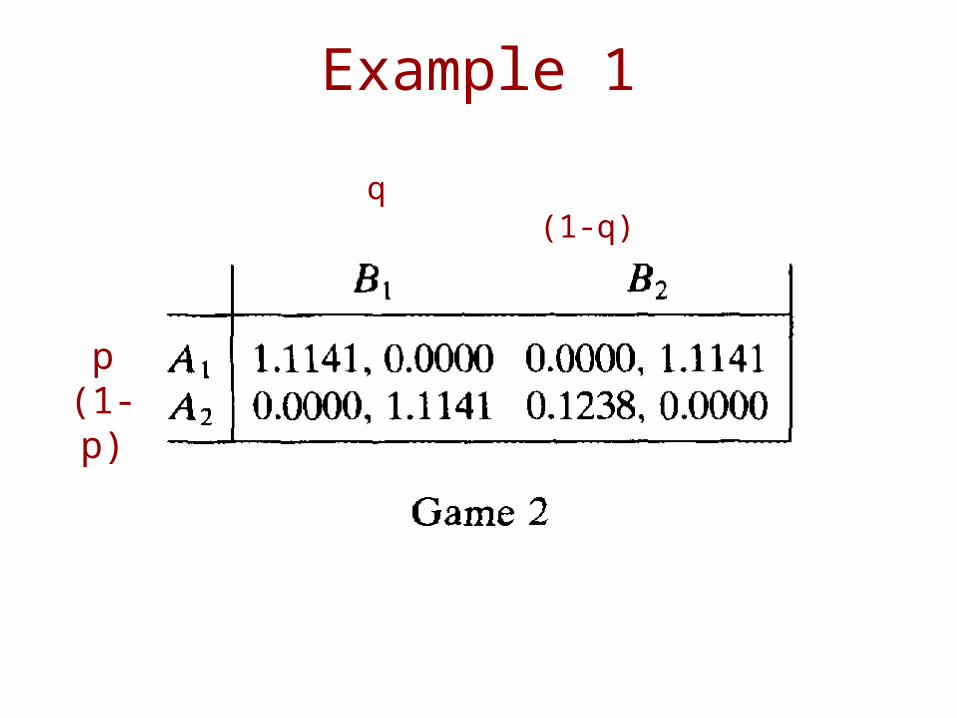
Example 1
q (1-q)
p(1-p)
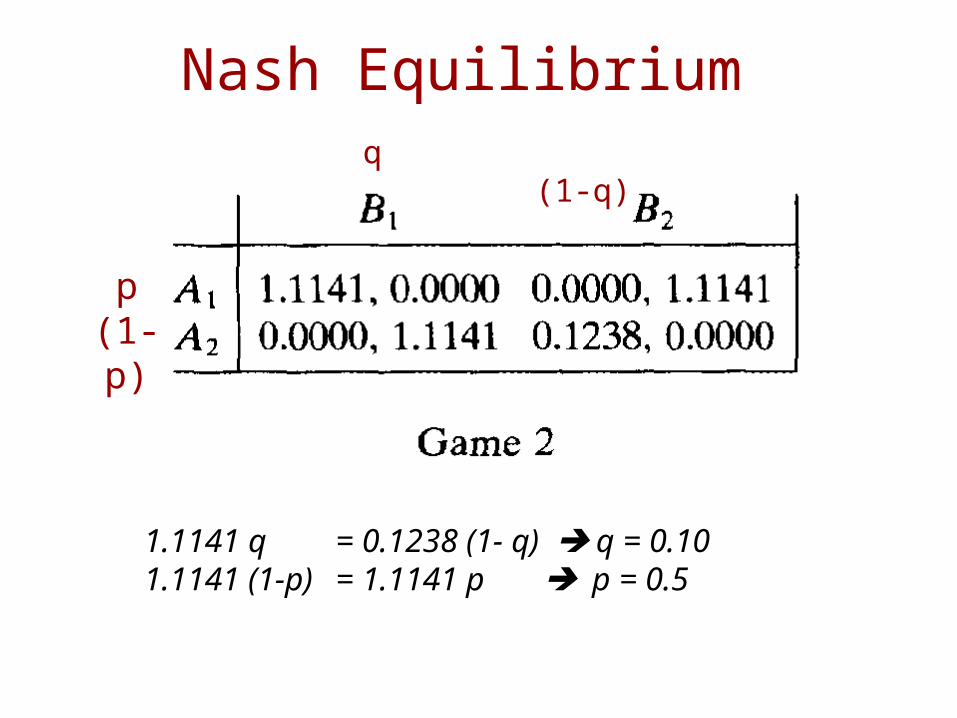
Nash Equilibrium q (1-q)
p(1-p)
1.1141 q = 0.1238 (1- q) q = 0.101.1141 (1-p) = 1.1141 p p = 0.5
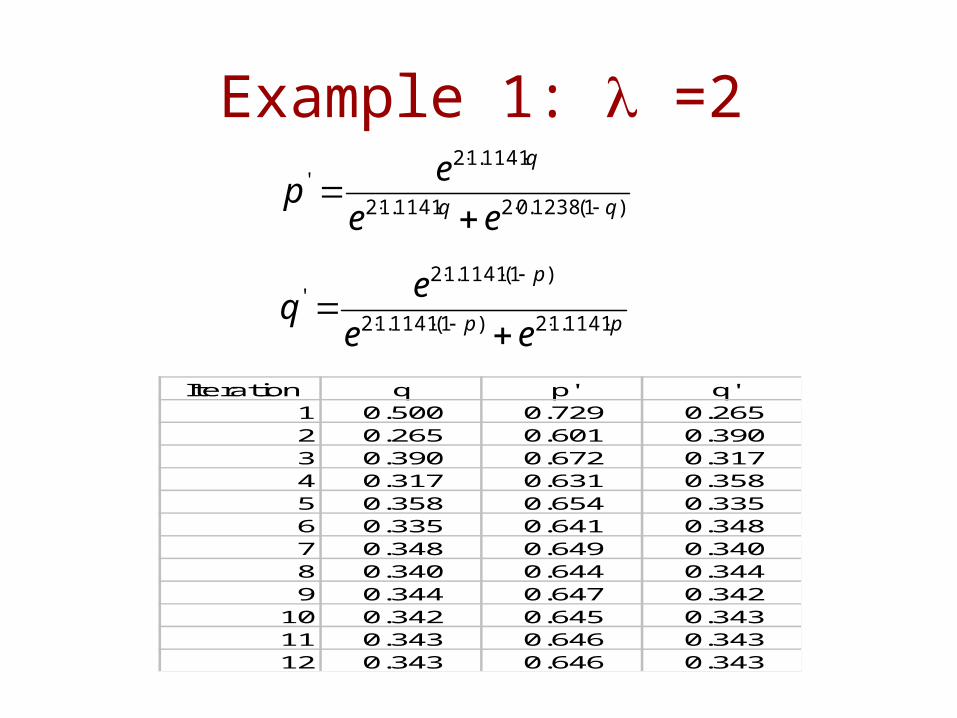
Example 1: =2
pp
p
q
ee
eq
ee
ep
1141.12)1(1141.12
)1(1141.12'
)1(1238.021141.12
1141.12'
Iteration q p' q'1 0.500 0.729 0.2652 0.265 0.601 0.3903 0.390 0.672 0.3174 0.317 0.631 0.3585 0.358 0.654 0.3356 0.335 0.641 0.3487 0.348 0.649 0.3408 0.340 0.644 0.3449 0.344 0.647 0.342
10 0.342 0.645 0.34311 0.343 0.646 0.34312 0.343 0.646 0.343
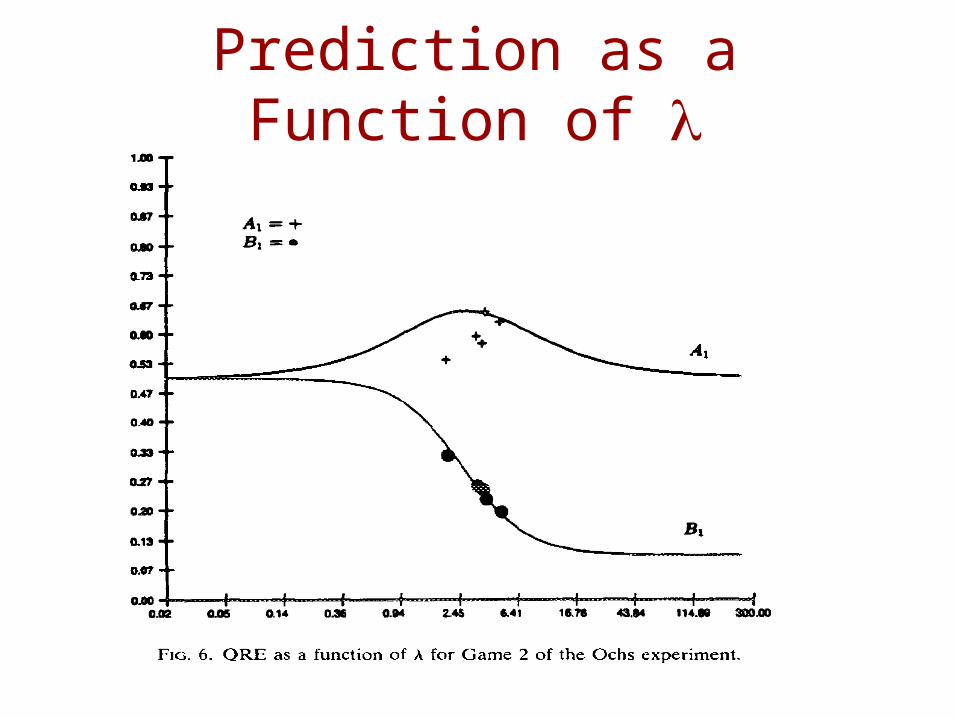
Prediction as a Function of
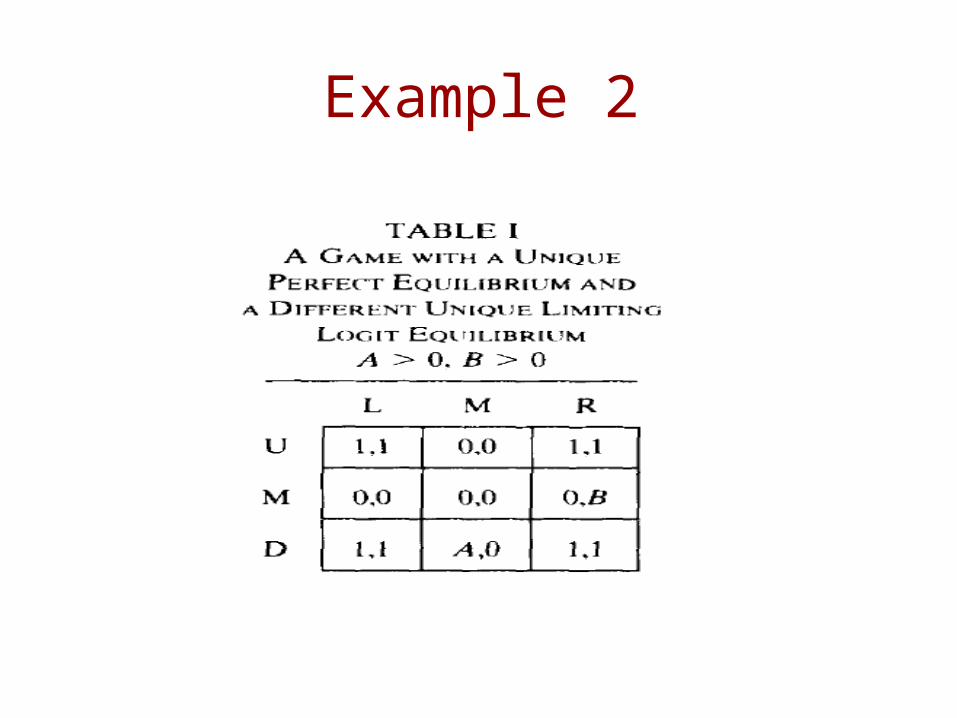
Example 2
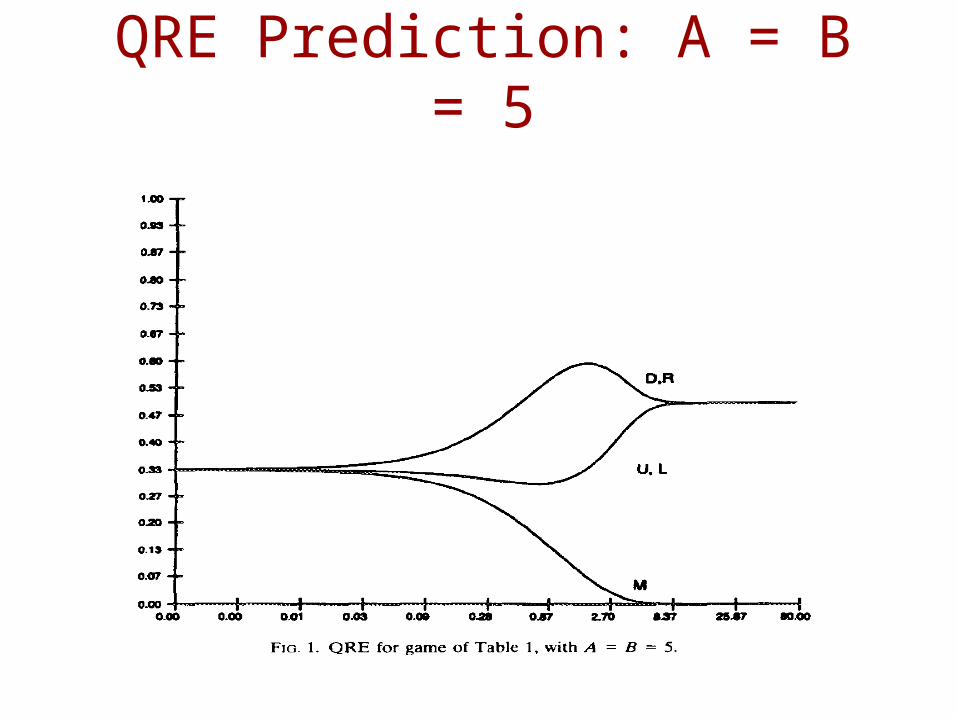
QRE Prediction: A = B = 5
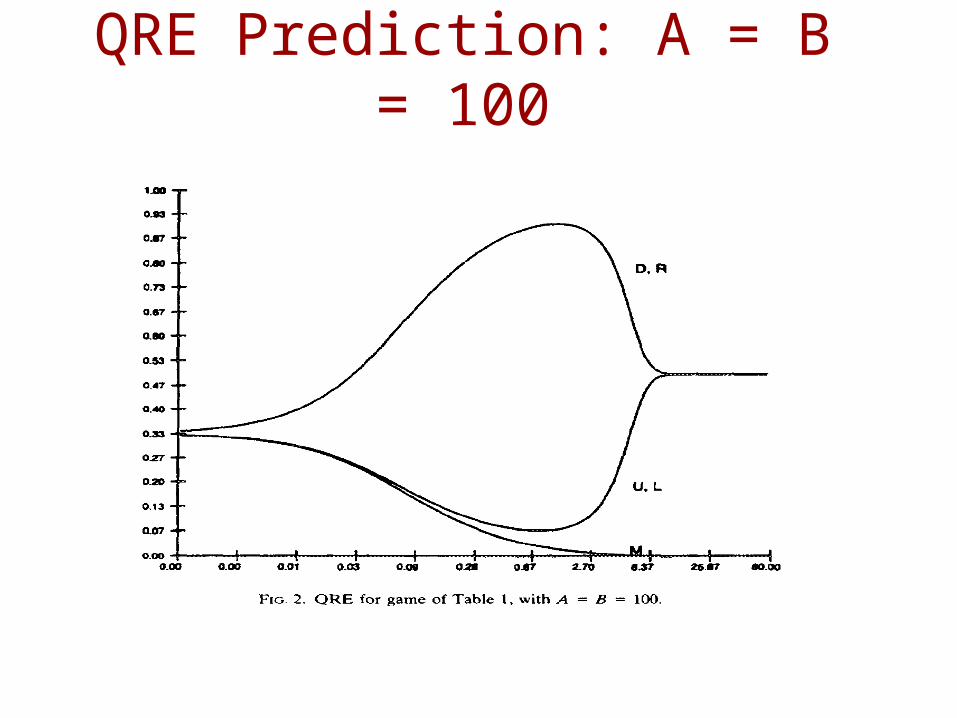
QRE Prediction: A = B = 100
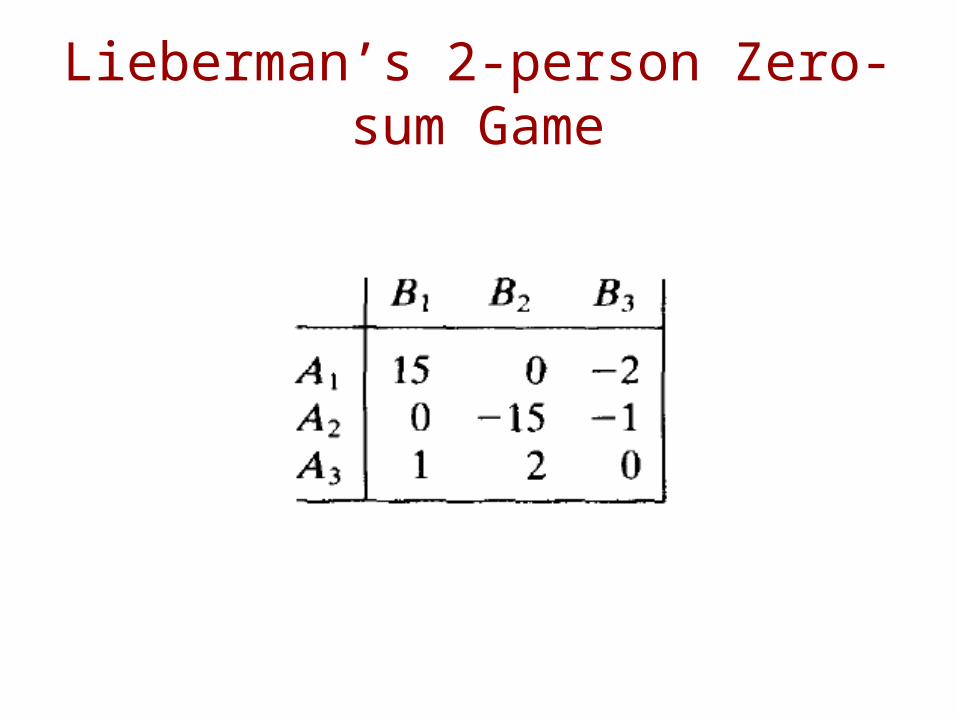
Lieberman’s 2-person Zero-sum Game
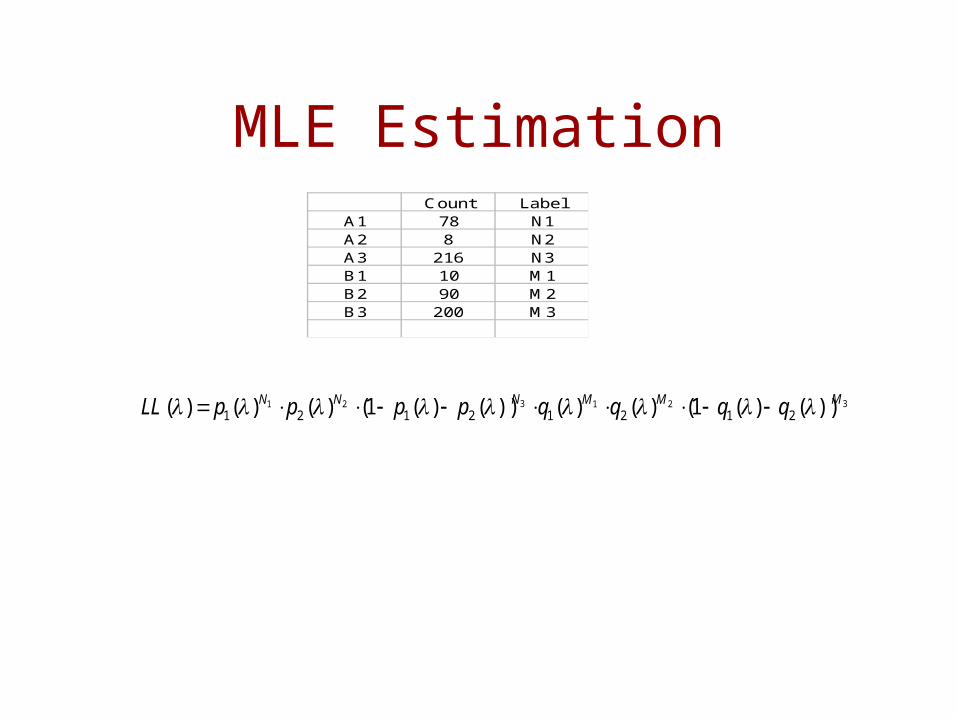
MLE Estimation Count Label
A1 78 N1A2 8 N2A3 216 N3B1 10 M1B2 90 M2B3 200 M3
321321 ))()(1()()())()(1()()()( 21212121MMMNNN qqqqppppLL
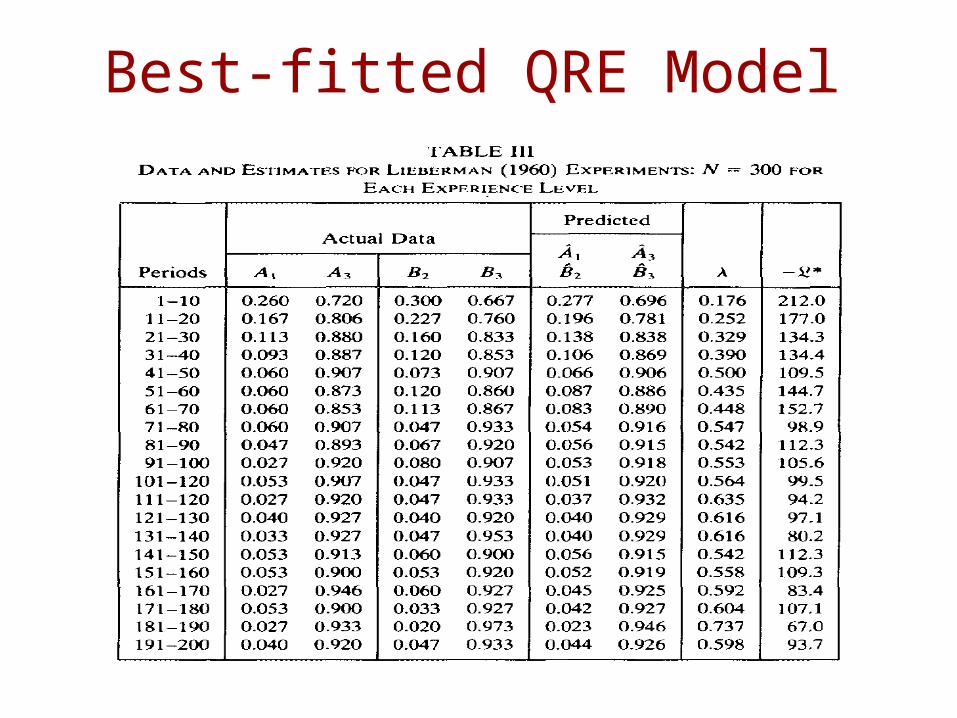
Best-fitted QRE Model
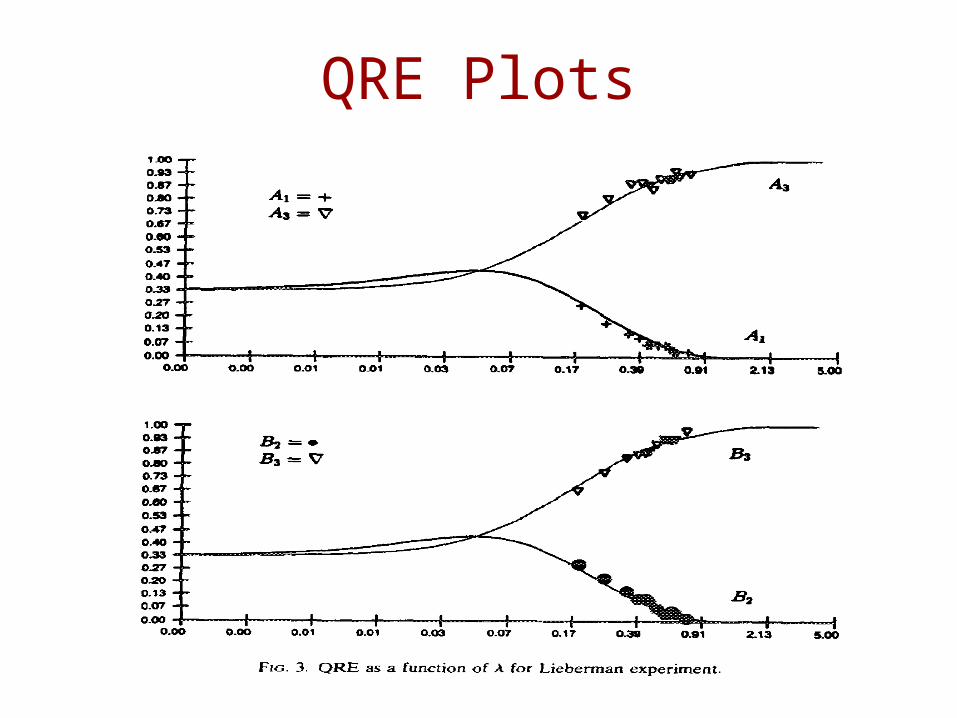
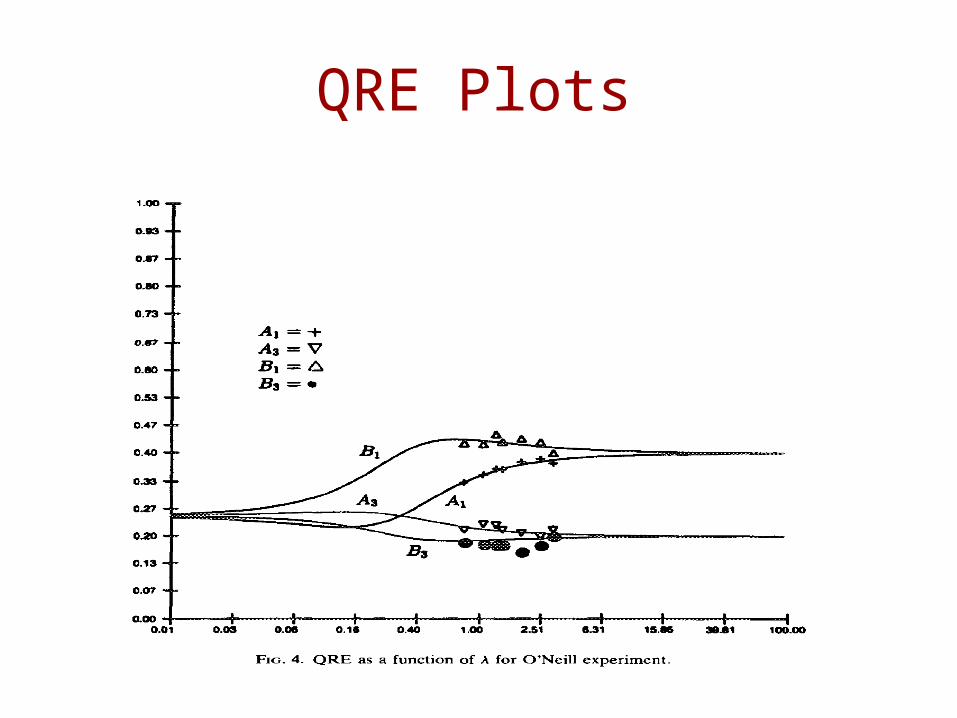
QRE Plots
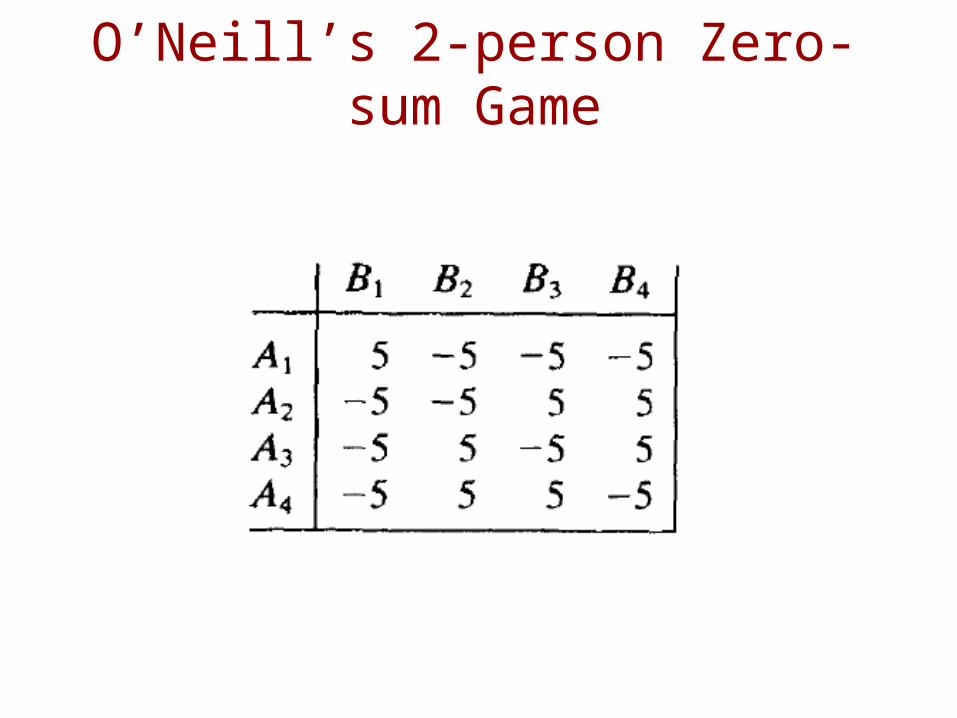
O’Neill’s 2-person Zero-sum Game
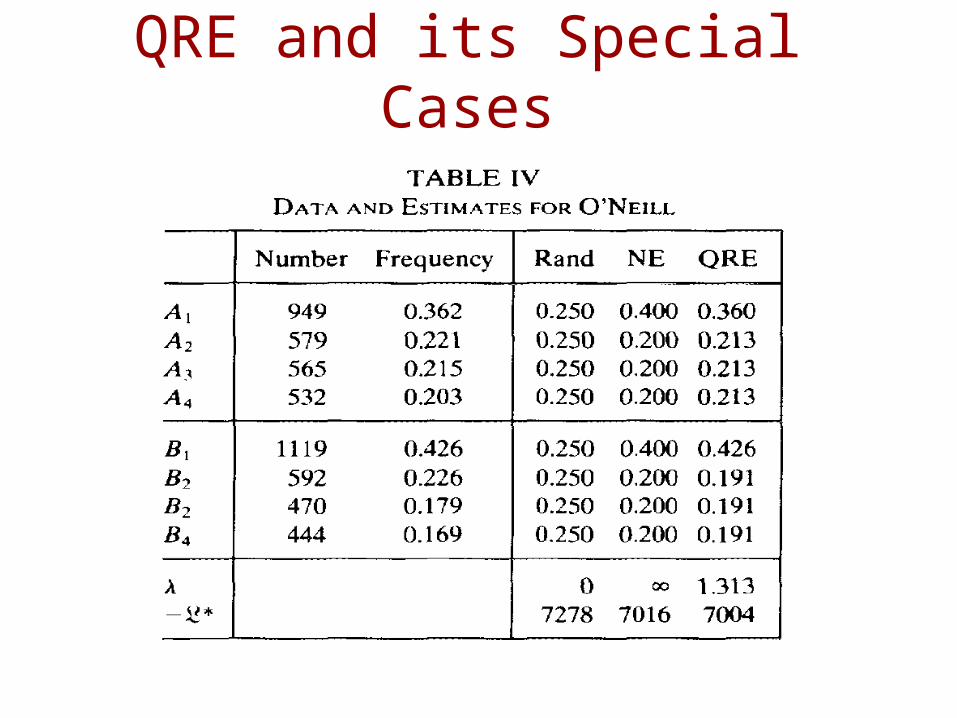
QRE and its Special Cases
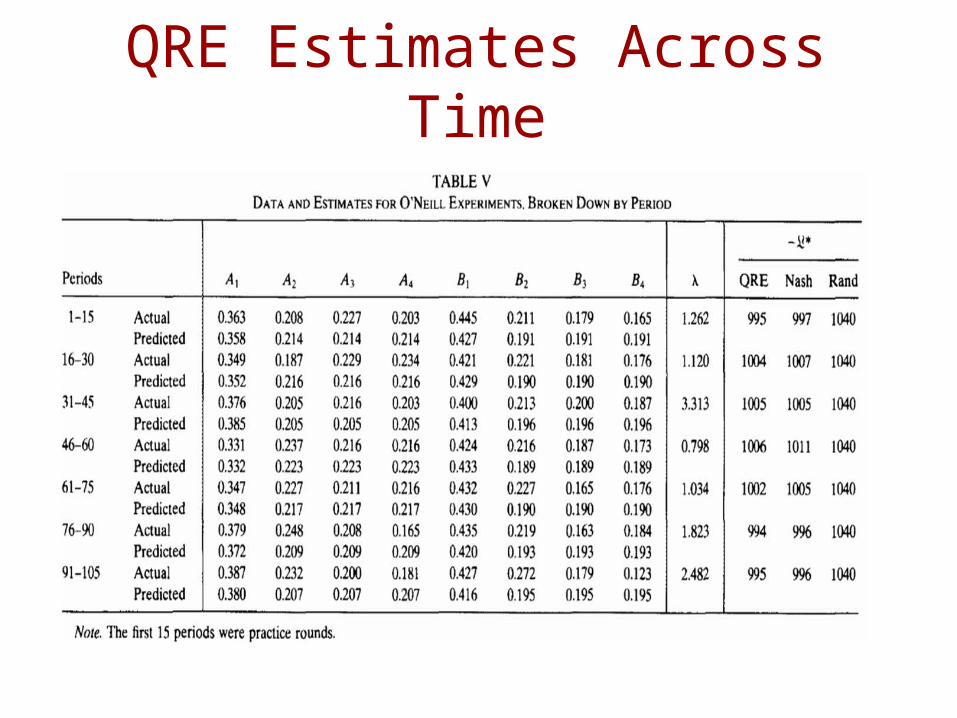
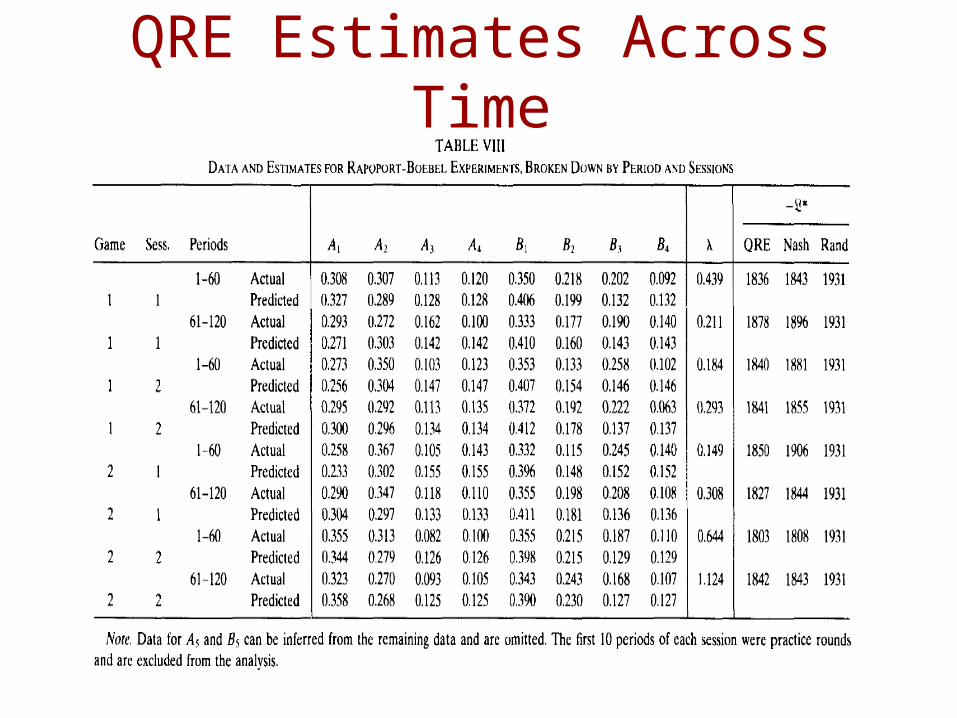
QRE Estimates Across Time
QRE Plots
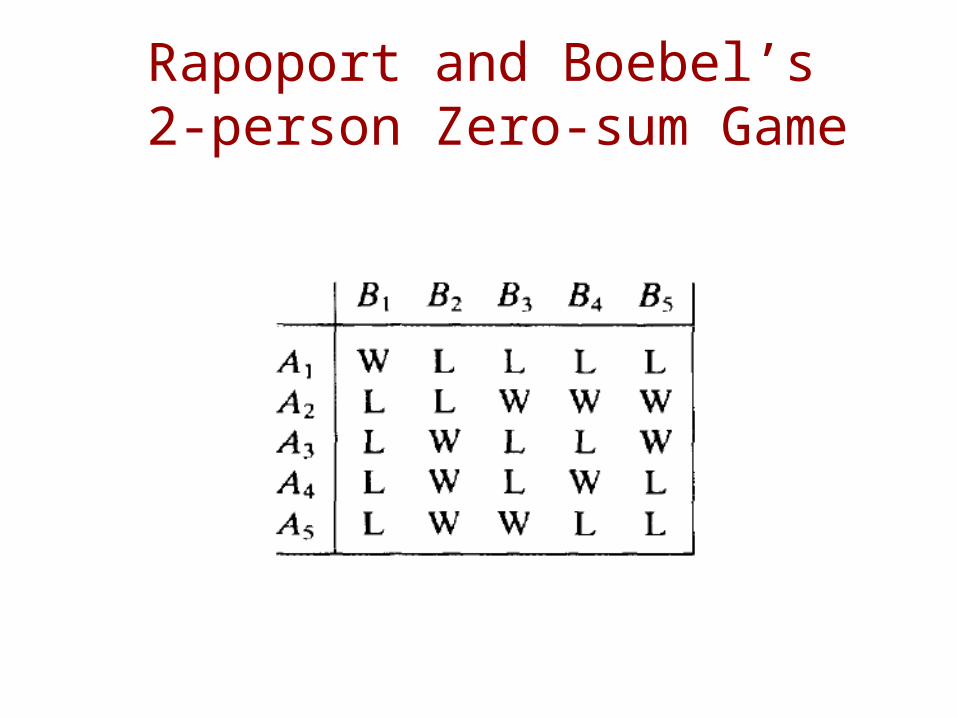
Rapoport and Boebel’s 2-person Zero-sum Game
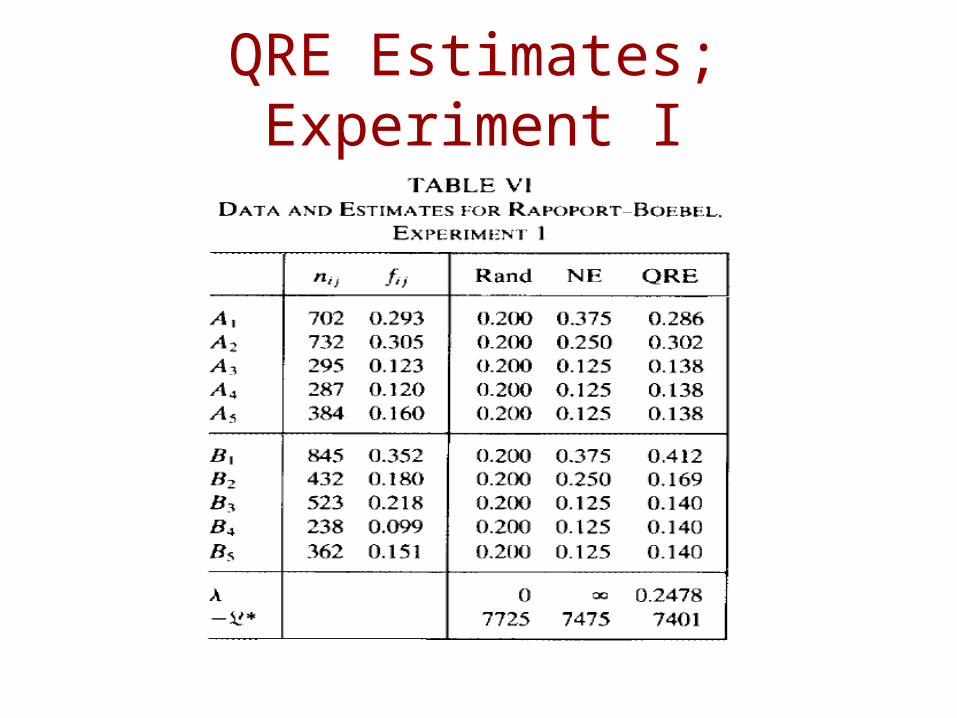
QRE Estimates; Experiment I
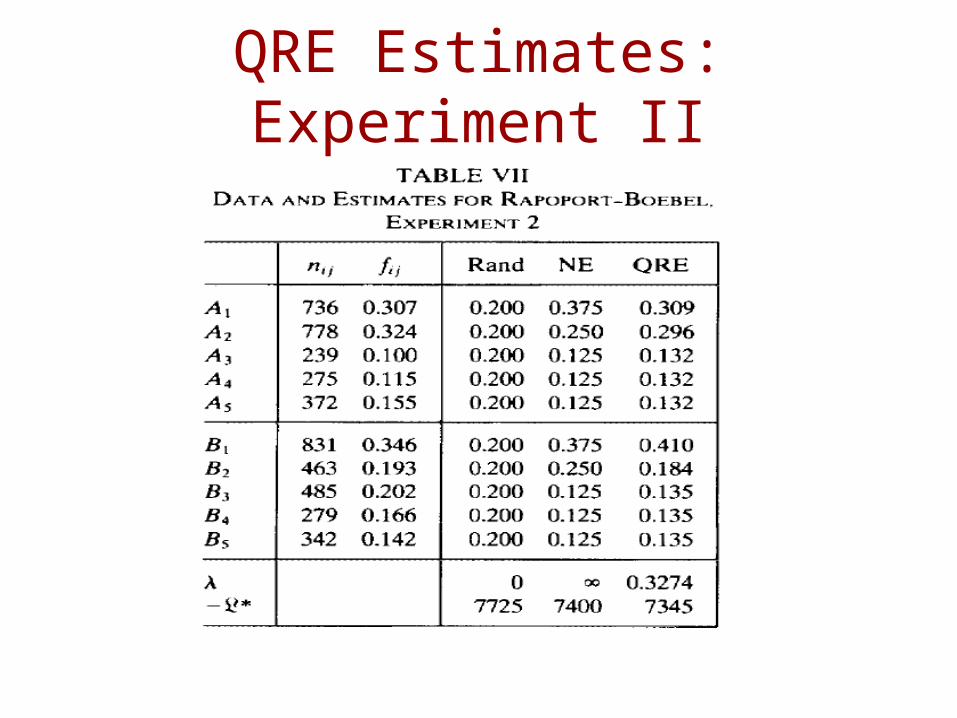
QRE Estimates: Experiment II
QRE Estimates Across Time
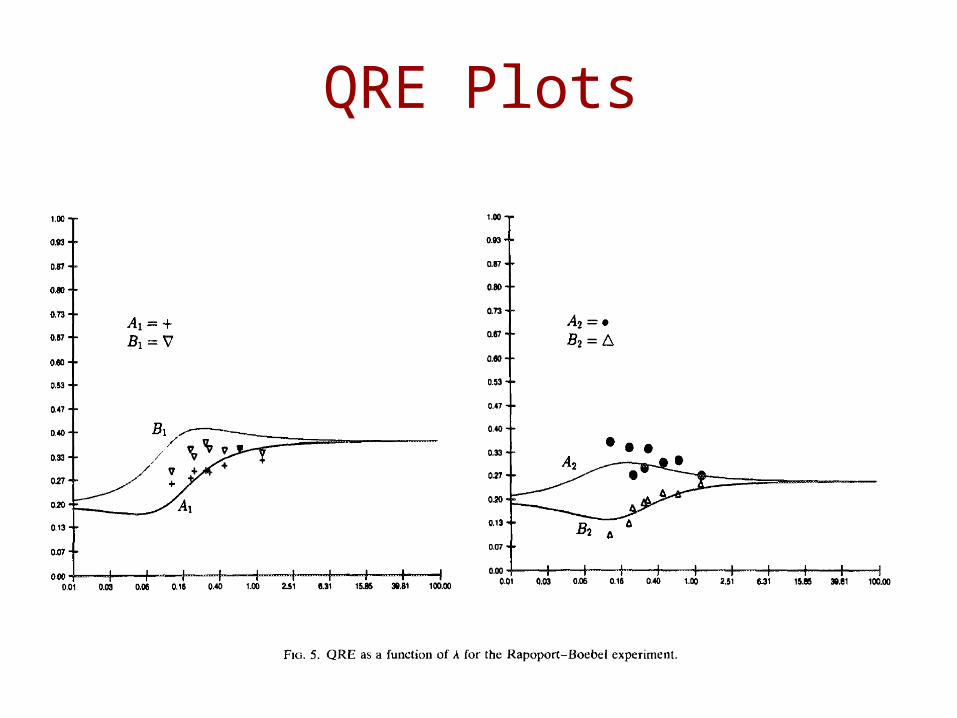
QRE Plots
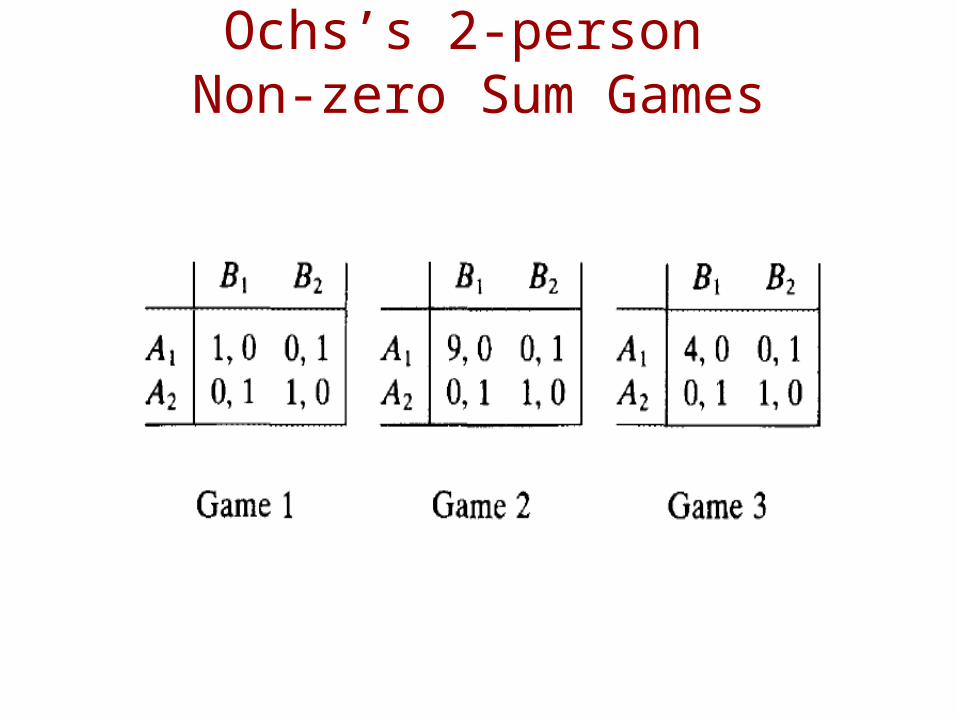
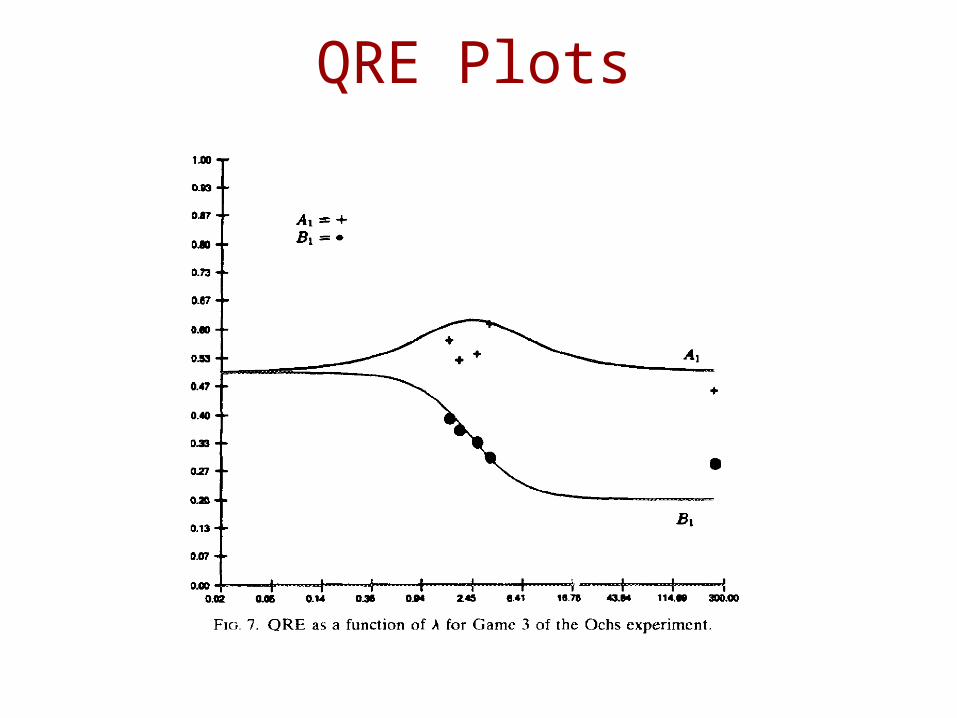
Ochs’s 2-person Non-zero Sum Games
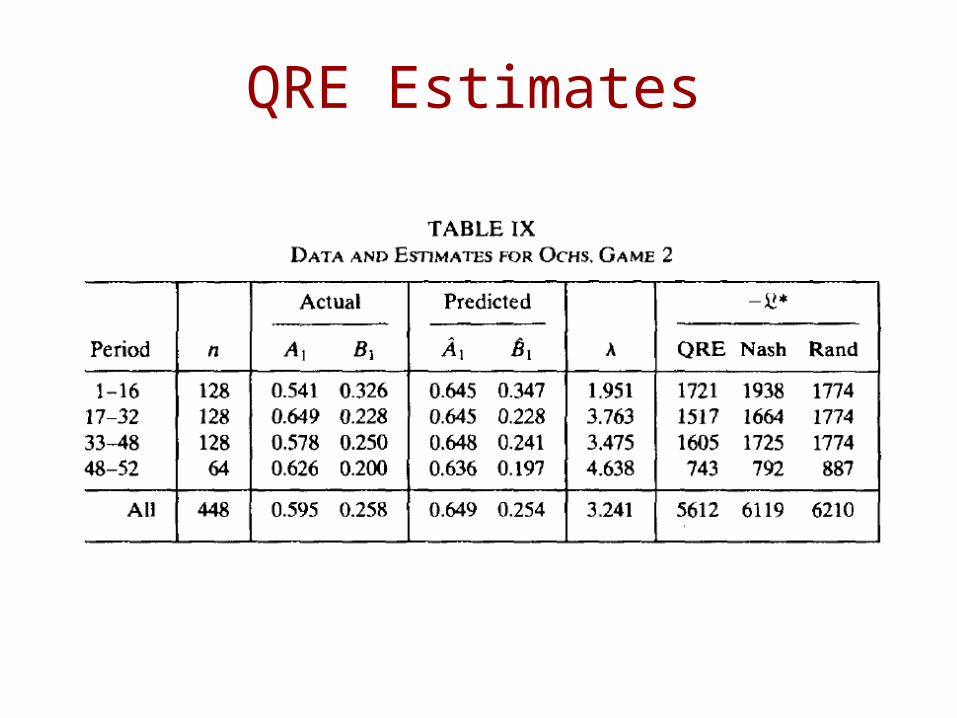
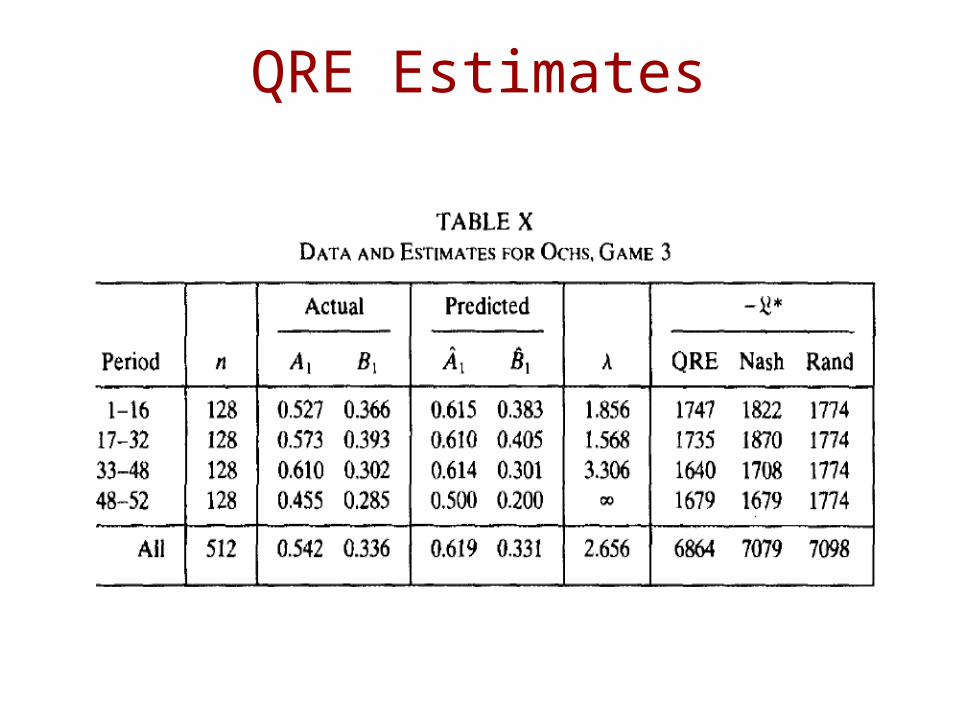
QRE Estimates
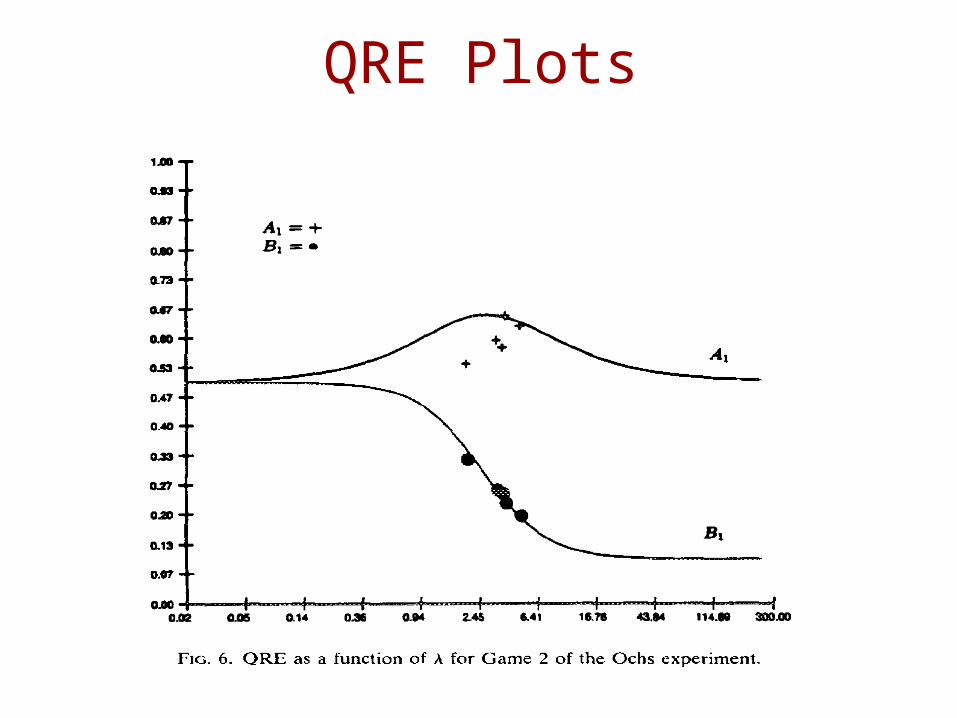
QRE Plots
QRE Estimates

Prediction
QRE Plots
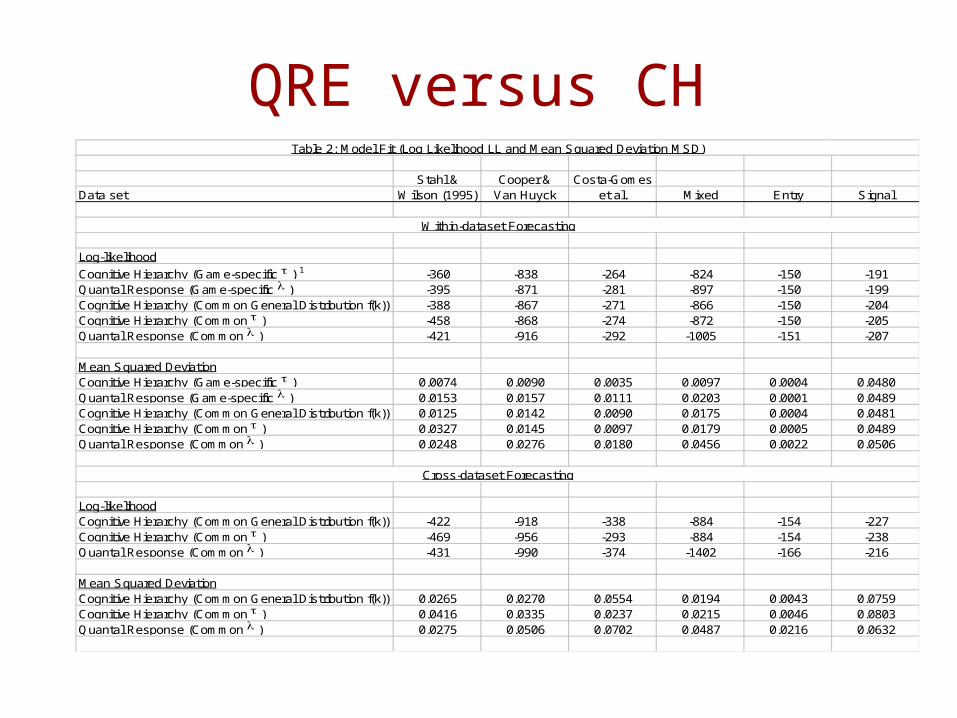
QRE versus CHStahl & Cooper & Costa-Gomes
Data set Wilson (1995) Van Huyck et al. Mixed Entry Signal
Log-likelihood
Cognitive Hierarchy (Game-specific t ) 1 -360 -838 -264 -824 -150 -191Quantal Response (Game-specific ) -395 -871 -281 -897 -150 -199Cognitive Hierarchy (Common General Distribution f(k)) -388 -867 -271 -866 -150 -204Cognitive Hierarchy (Common t ) -458 -868 -274 -872 -150 -205Quantal Response (Common ) -421 -916 -292 -1005 -151 -207
Mean Squared DeviationCognitive Hierarchy (Game-specific t ) 0.0074 0.0090 0.0035 0.0097 0.0004 0.0480Quantal Response (Game-specific ) 0.0153 0.0157 0.0111 0.0203 0.0001 0.0489Cognitive Hierarchy (Common General Distribution f(k)) 0.0125 0.0142 0.0090 0.0175 0.0004 0.0481Cognitive Hierarchy (Common t ) 0.0327 0.0145 0.0097 0.0179 0.0005 0.0489Quantal Response (Common ) 0.0248 0.0276 0.0180 0.0456 0.0022 0.0506
Log-likelihoodCognitive Hierarchy (Common General Distribution f(k)) -422 -918 -338 -884 -154 -227Cognitive Hierarchy (Common t ) -469 -956 -293 -884 -154 -238Quantal Response (Common ) -431 -990 -374 -1402 -166 -216
Mean Squared DeviationCognitive Hierarchy (Common General Distribution f(k)) 0.0265 0.0270 0.0554 0.0194 0.0043 0.0759Cognitive Hierarchy (Common t ) 0.0416 0.0335 0.0237 0.0215 0.0046 0.0803Quantal Response (Common ) 0.0275 0.0506 0.0702 0.0487 0.0216 0.0632
Within-dataset Forecasting
Cross-dataset Forecasting
Table 2: Model Fit (Log Likelihood LL and Mean Squared Deviation MSD)
Summary