Embed Size (px)
Citation preview
Outline Business Case
Lake Lothing Third Crossing, Lowestoft
24 December 2015
Mouchel Ltd
Export House
Cawsey Way
Woking
Suffolk
GU21 6QX
UK
T +44 (0)1483 731000
F +44 (0)1483 731003

Outline Business Case
Lake Lothing Third Crossing, Lowestoft
© Mouchel 2016 i
Document Control Sheet
Project Title Lake Lothing Third Crossing Outline Business Case
Report Title Outline Business Case
Report ref no.
Version 7.0
Status Final
Report Date 24 December 2015
Record of Issue
Version Status Author Date Checked by Date Approved by Date
7.0 Final Rob Surl
Ian Baker
Thomas Diver
R. Santhakumar
15/12/2015 Joanna Lyon
Rob Surl
Ian Baker
Thomas Diver
24/12/2015 Joanna Lyon
24/12/2015
Distribution
Date Organisation Contact Format Copies
24.12.2015 Suffolk County Council Dave Watson
Graeme Mateer
Mike Dowdall
E
29.12.2015 Department for Transport John Collins
Karl Murphy
Jago Atkinson
E

Outline Business Case
Lake Lothing Third Crossing, Lowestoft
© Mouchel 2016 i
Limitations
This report is presented to Suffolk County Council in respect of Lake Lothing Third Crossing Project and may not be used or relied on by any other person.
Notwithstanding anything to the contrary contained in the report, Mouchel Consulting is obliged to exercise reasonable skill, care and diligence in the performance of the services required by Suffolk County Council and Mouchel Consulting shall not be liable except to the extent that it has failed to exercise reasonable skill, care and diligence, and this report shall be read and construed accordingly.
This report has been prepared by Mouchel Consulting. No individual is personally liable in connection with the preparation of this report. By receiving this report and acting on it, the client or any other person accepts that no individual is personally liable whether in contract, tort, for breach of statutory duty or otherwise.

Outline Business Case
Lake Lothing Third Crossing, Lowestoft
© Mouchel 2016 ii
Contents
Document Control Sheet ............................................................................................. i
Limitations ................................................................................................................... i
Contents ...................................................................................................................... ii
Table of figures ......................................................................................................... xii
Tables ....................................................................................................................... xiv
1 Introduction........................................................................................................ 1
1.1 Overview ............................................................................................................. 1
1.2 Location of the scheme ........................................................................................ 1
1.3 The need for a third crossing ............................................................................... 3
1.4 Description of the scheme ................................................................................... 3
1.5 The Five Cases ................................................................................................... 6
1.6 Summary of the Strategic Case ........................................................................... 6
1.6.1 Strategic fit 6
1.6.2 Development plans 6
1.6.3 Problems 6
1.6.4 Aims and objectives 7
1.6.5 Constraints 7
1.6.6 Support for the scheme 7
1.6.7 Option assessment and selection of preferred scheme 7
1.7 Summary of the Economic Case.......................................................................... 8
1.8 Summary of the Financial Case ........................................................................... 8
Outline Business Case
Lake Lothing Third Crossing, Lowestoft
© Mouchel 2016 iii
1.8.1 Costs 8
1.8.2 Risk 8
1.8.3 Funding 9
1.8.4 Whole life costs 9
1.9 Summary of the Commercial Case ...................................................................... 9
1.9.1 Procurement 9
1.9.2 Form of contract and sourcing. 9
1.9.3 Risk allocation and transfer 10
1.10 Summary of the Management Case .................................................................. 10
1.10.1 Evidence of similar projects; 10
1.10.2 Programme and project dependencies 10
1.10.3 Governance 10
1.10.4 Programme 10
1.10.5 Stakeholder management 11
1.10.6 Risk management 11
1.10.7 Benefits realisation 11
2 The Strategic Case .......................................................................................... 12
2.1 Introduction ........................................................................................................ 12
2.2 Overview ........................................................................................................... 13
2.3 Policy Background – The Business Strategy...................................................... 14
2.3.1 National plans and policies 14
2.3.2 Regional plans and policies 14
2.3.3 New Anglia Strategic Economic Plan (2014) 15
2.3.4 Assisted Area Designation 17

Outline Business Case
Lake Lothing Third Crossing, Lowestoft
© Mouchel 2016 iv
2.3.5 Lowestoft-Great Yarmouth Enterprise Zone 18
2.3.6 Simplified Planning Zone 19
2.3.7 Suffolk Local Transport Plan 2011-2031 19
2.3.8 Local plans and policies 22
2.3.9 The Waveney Local Development Framework Core Strategy (2009) 23
2.3.10 Lake Lothing and Outer Harbour Area Action Plan, Lowestoft (2012) 23
2.3.11 Lowestoft Transport Strategy (2011) 25
2.3.12 Lowestoft Transport and Infrastructure Prospectus (2013 – 2025) 25
2.3.13 Summary of the Business Strategy and Policy Background 27
2.4 Opportunities for growth, regeneration and inward investment .......................... 28
2.4.1 PowerPark (SSP1) 30
2.4.2 Peto Square and South Quay 31
2.4.3 Kirkley Waterfront and Sustainable Urban Neighbourhood (SSP3) 32
2.4.4 East of England Park (SSP4) 33
2.4.5 Kirkley Rise (SSP5) 33
2.4.6 Western end of Lake Lothing (SSP6) 34
2.4.7 Oswald’s Boatyard (SSP7) 34
2.4.8 The Scores (east of historic High Street) (SSP8) 34
2.4.9 Peto Way / Denmark Road Corridor (SSP9) 34
2.5 Problems ........................................................................................................... 35
2.5.1 Problem: loss of traditional industries and employment 35
2.5.2 Problem: difficulty accessing potential regeneration sites 37
2.5.3 Problem: community severance 39
2.5.4 Problem: congestion 42
Outline Business Case
Lake Lothing Third Crossing, Lowestoft
© Mouchel 2016 v
2.5.5 Problem: barriers to walking and cycling 46
2.5.6 Problem: difficulties for local bus services 46
2.5.7 Problem: accidents 48
2.5.8 Summary of problems identified: 50
2.6 The impacts of not changing .............................................................................. 50
2.7 Objectives .......................................................................................................... 53
2.8 Measures for success ........................................................................................ 53
2.8.1 Causality 53
2.8.2 Monitoring and Evaluation 53
2.9 Scope of the scheme ......................................................................................... 55
2.10 Constraints ........................................................................................................ 55
2.10.1 Physical constraints 55
2.10.2 Environmental constraints 56
2.10.3 Financial constraints 58
2.10.4 Contractual constraints 58
2.10.5 Public acceptability constraints 58
2.10.6 Summary of constraints 59
2.11 Interdependencies ............................................................................................. 60
2.11.1 Other transport proposals 60
2.11.2 Major developments 60
2.11.3 Statutory processes 60
2.11.4 Summary of interdependencies 61
2.12 Stakeholders...................................................................................................... 62
2.12.1 Stakeholders 62
Outline Business Case
Lake Lothing Third Crossing, Lowestoft
© Mouchel 2016 vi
2.12.2 Engagement to date with local businesses 63
2.12.3 Stakeholder engagement 63
2.13 Options .............................................................................................................. 63
2.13.1 Option generation (long list) 64
2.13.2 Options considered, but not included in the long list. 64
2.13.3 Initial sifting 65
2.13.4 Short-listed options 65
2.13.5 Preferred scheme 67
2.14 Summary of the Strategic Case ......................................................................... 68
2.14.1 Strategic fit 68
2.14.2 Development plans 69
2.14.3 Problems 69
2.14.4 Aims and objectives 69
2.14.5 Constraints 70
2.14.6 Support for the scheme 70
2.14.7 Option selection and preferred scheme 70
3 The Economic Case ......................................................................................... 71
3.1 Introduction ........................................................................................................ 71
3.2 Options appraised ............................................................................................. 71
3.3 Overview of methodology and assumptions ....................................................... 72
3.3.1 Methodology 72
3.3.2 Assumptions 73
3.4 Costs ................................................................................................................. 75
3.4.1 Scheme preparation and construction 75

Outline Business Case
Lake Lothing Third Crossing, Lowestoft
© Mouchel 2016 vii
3.4.2 Maintenance and renewal 75
3.4.3 Optimism bias (OB) 76
3.4.4 Present Value of Costs (PVC) 76
3.5 Transport Economic Efficiency .......................................................................... 76
3.6 Safety Benefits .................................................................................................. 78
3.7 Active Modes Benefits ....................................................................................... 79
3.8 Reliability benefits .............................................................................................. 80
3.9 Wider Impacts (WITA) ....................................................................................... 81
3.10 Social and Distributional Impacts ....................................................................... 81
3.10.1 Distributional analysis of user benefits 81
3.10.2 Distributional analysis of accident benefits 84
3.11 Environmental Impacts ...................................................................................... 85
3.11.1 Noise 86
3.11.2 Air quality 86
3.11.3 Greenhouse gases 87
3.11.4 Townscape 88
3.11.5 Biodiversity 88
3.11.6 Historic environment 89
3.11.7 Water Environment 89
3.12 Regeneration impacts ........................................................................................ 89
3.12.1.1 Current and Upcoming Investments in Lowestoft 90
3.12.2 Lowestoft Town Centre and Employment Space 91
3.12.3 The Demand for Labour 92

Outline Business Case
Lake Lothing Third Crossing, Lowestoft
© Mouchel 2016 viii
3.13 Value for Money Statement ............................................................................... 93
3.13.1 Benefit-Cost Ratio (BCR) 93
3.14 Sensitivity Testing .............................................................................................. 95
3.14.1.1 Alternative growth scenarios sensitivity test 95
3.14.1.2 National Trip End Model Constraint (sensitivity test) 95
3.14.1.3 Non-modelled time periods 98
3.15 Appraisal Summary Table (AST) ....................................................................... 99
3.16 Summary and conclusion................................................................................... 99
4 The Financial Case ........................................................................................ 100
4.1 Introduction ...................................................................................................... 100
4.2 Costs ............................................................................................................... 100
4.2.1 Scheme preparation and construction 102
4.2.2 Risk budget 102
4.2.3 Spend Profile 102
4.2.4 Out-turn price adjustment 102
4.3 Budgets / Funding Cover ................................................................................. 103
4.3.1 Funding 103
4.3.2 Budgetary Impact 104
4.4 Whole Life Costs ............................................................................................. 104
4.4.1 Capital Renewal Costs 104
4.4.2 Annual Maintenance and Operating Costs 104
5 The Commercial Case ................................................................................... 106
5.1 Introduction ...................................................................................................... 106

Outline Business Case
Lake Lothing Third Crossing, Lowestoft
© Mouchel 2016 ix
5.2 Procurement Strategy ...................................................................................... 107
5.2.1 Available procurement procedures 107
5.2.1.1 Open Procedure 107
5.2.1.2 Restricted Procedure 107
5.2.1.3 Accelerated Restricted Procedure 107
5.2.1.4 Competitive Dialogue Procedure 108
5.2.1.5 Competitive Procedure with Negotiation 108
5.2.2 Preferred procurement procedure 108
5.2.3 Details of preferred procurement procedure 110
5.2.3.1 Quality Statement 111
5.2.3.2 Financial Statement 112
5.2.4 Procurement method 112
5.2.5 Form of contract 113
5.3 Sourcing Options ............................................................................................. 113
5.4 Payment mechanisms ..................................................................................... 113
5.5 Pricing Framework and Charging Mechanisms ................................................ 114
5.6 Risk Allocation and Transfer ............................................................................ 114
5.7 Contract Length ............................................................................................... 114
5.8 Human Resource Issues ................................................................................. 115
5.9 Contract Management ..................................................................................... 115
6 The Management Case .................................................................................. 116
6.1 Introduction ...................................................................................................... 116
6.2 Evidence of Similar Projects ............................................................................ 116

Outline Business Case
Lake Lothing Third Crossing, Lowestoft
© Mouchel 2016 x
6.2.1 Contractor experience 121
6.3 Programme / Project Dependencies ................................................................ 121
6.4 Project Governance, Organisation Structure and Roles ................................... 121
6.4.1 Project Board 121
6.4.2 Project Delivery Team 123
6.4.3 Stakeholder Group 124
6.5 Programme / Project Plan ................................................................................ 124
6.6 Assurance and Approvals Plan ........................................................................ 127
6.6.1 Local Contribution Funding Approval 127
6.7 Communications and Stakeholder Management Plan ...................................... 127
6.7.1 Stakeholder Identification 128
6.7.2 Stakeholder Engagement – Public Consultation 129
6.7.3 Stakeholder Engagement – Business Engagement 131
6.7.4 Steering Group 135
6.7.5 Association of British Ports (ABP) 135
6.7.6 Lake Lothing Third Crossing website 135
6.7.7 Resources 136
6.7.8 Communication Protocols 136
6.7.9 Notice of works 136
6.8 Risk Management Strategy .............................................................................. 136
6.8.1 Risk management process 137
6.8.2 Risk identification 137
6.8.3 Quantification of risks 138
6.8.3.1 Assessing the impact of risk (costs) 138

Outline Business Case
Lake Lothing Third Crossing, Lowestoft
© Mouchel 2016 xi
6.8.3.2 Estimating the likelihood of the outcomes occurring 138
6.8.3.3 Deriving the probability distribution for the costs of the scheme 139
6.8.4 Managing risks (response plans and mitigation) 140
6.8.5 Implementation and review 141
6.9 Benefits Realisation Plan ................................................................................. 141
6.10 Monitoring and Evaluation Plan ....................................................................... 143
6.10.1 Description 145
6.10.2 Logic Model 145
6.10.3 Type of Evaluation 145
6.10.4 Data requirements 145
6.10.5 Sources of Data 146
6.10.6 Implementation 147
6.10.7 Responsibility 147
6.10.8 Summary of analysis 148
6.10.9 Linking indicators to outcomes 149
6.10.10 Uses of evaluation 149
7 Appendices .................................................................................................... 150

Outline Business Case
Lake Lothing Third Crossing, Lowestoft
© Mouchel 2016 xii
Table of figures
Figure 1-1: Lake Lothing, viewed from the east .............................................................. 1
Figure 1-2: Location of the scheme in the context of the Lowestoft town centre .............. 2
Figure 1-3: Proposed scheme ......................................................................................... 4
Figure 1-4: Conceptual 3D image of the scheme ............................................................ 5
Figure 2-1: The Norfolk and Suffolk region covered by New Anglia LEP (Source: New
Anglia SEP) ........................................................................................................... 16
Figure 2-2: Region classed as ‘Assisted Area’ (Source: UK Assisted Areas Map ......... 18
Figure 2-3: Riverside Road, and Outer Harbour and PowerPark sites .......................... 19
Figure 2-4: LTP3 Strategic Transport Improvements (Lowestoft) .................................. 21
Figure 2-5: Lake Lothing and Outer Harbour AAP boundary ......................................... 24
Figure 2-6: Area Action Plan Site Allocations ................................................................ 29
Figure 2-7: Kirkley Waterfront and Sustainable Urban Neighbourhood ......................... 32
Figure 2-8: Kirkley Waterfront and Sustainable Urban Neighbourhood – aerial view ..... 33
Figure 2-9: Most deprived areas of Lowestoft based on employment............................ 36
Figure 2-10: Potential regeneration sites (AAP allocations) – bottlenecks and barrier to
movement .............................................................................................................. 38
Figure 2-11: Shopping centre, north Lowestoft ............................................................. 39
Figure 2-12: Sea front, south Lowestoft ........................................................................ 40
Figure 2-13: Bascule Bridge at the eastern end of Lake Lothing ................................... 41
Figure 2-14: Lifting bridge and railway swing bridge at Mutford Lock, at the western end
of Lake Lothing ...................................................................................................... 41
Figure 2-15: Lake Lothing severs the town and increases journey length for local trips 42
Figure 2-16: Typical Tuesday morning (8:30 a.m.) floating vehicle data on the
approaches to the existing lake crossings (Source: Google Maps) ........................ 43
Figure 2-17: Typical Wednesday evening (5:15 p.m.) floating vehicle data on the
approaches to the existing lake crossings (Source: Google Maps) ........................ 44
Figure 2-18: Local cycle network, Lowestoft ................................................................. 45
Figure 2-19: Bus services in Lowestoft (from: www.suffolkonboard.com) ...................... 47
Figure 2-20: Accidents by severity in the Lake Lothing area, between 2010 and 2014 . 48
Figure 2-21: Accidents in area of existing Bascule Bridge between 2010 and 2014 ...... 49
Figure 2-22: Causal chain diagram (logic map) ............................................................. 54

Outline Business Case
Lake Lothing Third Crossing, Lowestoft
© Mouchel 2016 xiii
Figure 2-23: Leathes Ham Local Nature Reserve ......................................................... 56
Figure 2-24: Flood risk map .......................................................................................... 57
Figure 2-25: Historic environment ................................................................................. 58
Figure 2-26: Preferred scheme: Central bridge option .................................................. 68
Figure 3-1: Summary of calculation of BCR and VfM score .......................................... 73
Figure 3-2: Model zones categorised by income quintiles ............................................. 82
Figure 5-1: Restricted Procedure Flowchart .............................................................. 110
Figure 6-1: High-level governance structure for the Third Crossing project ................. 122
Figure 6-2: Project Programme ................................................................................... 126
Figure 6-3: Degree to which traffic causes a problem to businesses ........................... 133
Figure 6-4: Business consultation (2015): the location of a new crossing ................... 134
Figure 6-5: Risk Management Strategy ....................................................................... 137
Figure 6-6: Distribution of total risk cost – 1 ................................................................ 140
Figure 6-7: Distribution of total risk cost – 2 ................................................................ 140
Figure 6-8: The Benefits Management Cycle (Source: DfT Programme and Project
Management Portal) ............................................................................................ 143
Figure 6-9: Logic Model .............................................................................................. 145

Outline Business Case
Lake Lothing Third Crossing, Lowestoft
© Mouchel 2016 xiv
Tables
Table 2-1: Employment scores and ranks of the three most deprived wards in Lowestoft
.............................................................................................................................. 37
Table 2-2: Long-listed options ....................................................................................... 64
Table 2-3: Assessment of short-listed options ............................................................... 67
Table 3-1: Scheme preparation and construction costs (Q4 2015 prices) ..................... 75
Table 3-2: Adjustment to 2010 prices ............................................................................ 75
Table 3-3: Maintenance, renewal and operating costs .................................................. 76
Table 3-4: Present Value of Costs ................................................................................ 76
Table 3-5: Transport User Benefits ............................................................................... 77
Table 3-6: TUBA benefits by time period ...................................................................... 78
Table 3-7: Accident Savings over 60 years ................................................................... 78
Table 3-8: Casualty savings over 60 years ................................................................... 79
Table 3-9: Present value of accident savings over 60 years (2010 prices, discounted to
2010) ..................................................................................................................... 79
Table 3-10: Summary of Opening Year Active Mode Impacts Core Scenario (2010
prices).................................................................................................................... 79
Table 3-11: Summary of Active Mode Impacts over 30Yr Appraisal Period (2010 prices
and value) .............................................................................................................. 80
Table 3-12: Distributional Analysis for Users Benefits -AM period ................................. 83
Table 3-13: Distributional Analysis for Users Benefits -IP period ................................... 83
Table 3-14: Distributional Analysis for Users Benefits -PM period ................................. 83
Table 3-15: Description of Screened Lowestoft links and number of casualties ............ 84
Table 3-16: Casualties by age group ............................................................................ 84
Table 3-17: Casualties by mode ................................................................................... 85
Table 3-18: Noise sensitive receptors. ......................................................................... 86
Table 3-19: Air quality impacts ...................................................................................... 87
Table 3-20: Change in greenhouse gas emissions (TUBA outputs) .............................. 87
Table 3-21: Expected effects of a third crossing and timescales over which these are
expected to be delivered ........................................................................................ 93
Table 3-22: Initial BCR calculation ................................................................................ 94
Table 3-23: Adjusted BCR calculation ........................................................................... 94

Outline Business Case
Lake Lothing Third Crossing, Lowestoft
© Mouchel 2016 xv
Table 3-24: High, Core and Low Growth scenario TUBA benefits sensitivity tests ........ 95
Table 3-25: Local change in planning data from Waveney District ................................ 96
Table 3-26: Core Scenario Reference Case matrix totals and NTEM targets ................ 97
Table 3-27: User benefits from NTEM-constrained forecasts (£, 2010 prices, discounted
to 2010) ................................................................................................................. 97
Table 3-28: TEE benefits excluding off peak and weekends (£, 2010 prices, discounted
to 2010) ................................................................................................................. 98
Table 3-29: Low and High Uplift Sensitivity Test Results (rounded to nearest £1)......... 99
Table 4-1: Estimated capital costs of the proposed scheme ....................................... 100
Table 4-2: Breakdown of scheme costs for the Third Crossing scheme ...................... 101
Table 4-3: Annual spend profile .................................................................................. 102
Table 4-4: Inflation allowance for the scheme option .................................................. 103
Table 4-5: Budgetary Impact Summary ....................................................................... 104
Table 4-6: Breakdown of annual maintenance and capital renewal costs, by highways
and bridge costs .................................................................................................. 105
Table 5-1: Indicative Risk Allocation Table.................................................................. 114
Table 5-2: Key Contract Dates .................................................................................... 115
Table 6-1: Evidence of similar projects ....................................................................... 120
Table 6-2: The Project Board ...................................................................................... 123
Table 6-3: Project Delivery Team ................................................................................ 124
Table 6-4: Results of questionnaire regarding preferred location ................................ 130
Table 6-5: Business consultation (2015): the location of a new crossing ..................... 134
Table 6-6: Impact / Probability Matrix .......................................................................... 139
Table 6-7: scheme objectives, desired outputs and desired outcomes ........................ 142
Table 6-8: Enhanced monitoring measures................................................................. 144
Table 6-9: Data requirements and frequency of data collection ................................... 146
Table 6-10: Details of the individual responsible for the monitoring and evaluation plan
............................................................................................................................ 148

© Mouchel 2016 xvi
Executive Summary
This document is the Outline Business Case for the Lake Lothing Third Crossing. It
has been prepared on behalf of Suffolk County Council (SCC) and New Anglia Local
Enterprise Partnership (NALEP), the scheme promoters, for consideration by the
Department for Transport (DfT).
The crossing will follow a north / south alignment from a new roundabout on
Denmark Road, east of the existing Peto Way / Denmark Road roundabout, and
span both the railway line and Lake Lothing, connecting to Riverside Road to the
south of the Lake. The new infrastructure will support traffic movements between the
Northern Spine Road (Peto Way) and the Southern Link Road (Tom Crisp Way).
The crossing will consist of a bascule (lifting) bridge to allow the passage of boats
within the inner harbour of Lake Lothing, and will have a clearance of 12m to allow
smaller boats to pass underneath to minimise lifting. The crossing will be a single
carriageway, with segregated footways and cycle paths, linked to existing networks
on the northern and southern borders of Lake Lothing.
The cost of the scheme preparation and construction, excluding inflation, client costs
and non-recoverable VAT is £80,347,000 at 2015 prices. The scheme expected
outturn cost will be £91,733,000 (which includes inflation). Subject to funding
approvals and consents, construction of the third crossing will begin in February
2018 and be delivered in November 2020.
The scheme offers a very high value for money, with a Benefit-Cost Ratio (BCR) of
8.08. The monetary benefits are predominantly derived from journey time savings to
commuters and business, as well as savings to vehicle operating costs. Lowestoft
will benefit from reduced congestion, faster journeys and improved journey time
reliability. This will support local development and regeneration and Lowestoft’s
economy. Furthermore, there will be accident and casualty savings, and savings
associated with the increased use of active modes (walking and cycling) as a result
of the scheme.
The scheme will be funded through a combination of Government funding and a
Local Contribution in an 80/20 split.
The scheme is commercially viable with a robust contracting and procurement
strategy. This includes the use of the OJEU ‘restricted procedure’ procurement
tendering process, using a ‘traditional’ approach, with the NEC3 Engineering and
Construction (ECC) form of contract.
In summary the scheme is financially affordable, commercially viable achievable and
offers high value for money.

© Mouchel 2016 1
1 Introduction
1.1 Overview
This document is the Outline Business Case (OBC) for the Lake Lothing Third
Crossing. It has been prepared on behalf of Suffolk County Council (SCC) and New
Anglia Local Enterprise Partnership (LEP) for consideration by the Department for
Transport (DfT). The form of and content of the business case follows guidance from
the government1 and the LEP.
The OBC explains why the proposed scheme should receive support, and provides a
clear audit trail for the purposes of public accountability.
The OBC is not just a bid for financial support, although this is of course important.
Rather, it explains how and why the decision has been made to put the proposal
forward in its current form, and at the present time. It shows that the decision is
based on a realistic analysis of the current situation, a clear vision of how things
should be in the future, and a robust assessment of the potential options for the
scheme and for the way it is delivered.
1.2 Location of the scheme
The proposed scheme is a new road crossing over Lake Lothing, a large saltwater
lake which flows into the North Sea. The lake is approximately 180m across at its
widest point, and forms the inner harbour of the Port of Lowestoft. This area has
suffered greatly from the decline of shipbuilding and traditional industries, and is a
key area for regeneration. The scheme will support regeneration by improving
access to the lake area and by relieving congestion in, and around, the town centre.
Figure 1-1: Lake Lothing, viewed from the east
1 The Transport Business Cases, Department for Transport (January 2011)

© Mouchel 2016 2
Figure 1-2: Location of the scheme in the context of the Lowestoft town centre
Figure 1-2 shows the area of the scheme in relation to the town and the local road
network. Lake Lothing separates the north and south parts of the town. The A12
forms a north-south route on the eastern (seaward) side of Lowestoft, providing
access to the town centre (on the north side) and crossing Lake Lothing by means of
a bascule bridge at the entrance to the inner harbour. The southern section of the
A12 (the Southern Access Road) is a trunk road. To the west, another north-south
route is provided by the A1177 (the Northern Spine Road) which crosses Lake
Lothing by means of another lifting bridge at Mutford Lock, and the A146. There are
no other road crossings. The two north-south routes are linked by the A1144 and
Key
A12
A146
A1144
A1145
A1177
Lake Lothing

© Mouchel 2016 3
Denmark Road (north of Lake Lothing) and a section of the A146 (south of Lake
Lothing).
The A146 links Lowestoft to Norwich with its international airport. The A12 runs
northwards to Great Yarmouth, and southwards towards the A14 for Ipswich and
Felixstowe, and to London.
1.3 The need for a third crossing
Over the past 35 years, much of Lowestoft’s rich and proud industrial heritage has
gone. The fishing industry has declined dramatically, industries have closed, and
there has been a move away from home-based tourism. There is an urgent need for
inward investment and regeneration, but poor infrastructure hampers attempts to
attract new businesses to the area.
Lake Lothing divides Lowestoft between north and south. The road crossings in the
east and west are inadequate for existing traffic demand. The problem of congestion
has blighted the town for years, and Lowestoft’s inadequate road network is a
serious disincentive to people coming to the town. Congestion causes real problems
for business; it discourages existing firms from expanding and discourages new
businesses from moving into the area. There have been improvements to local roads
in recent years, but the third crossing remains a missing link. Provision of an extra
crossing will reduce severance, and allow the road network to operate efficiently,
providing vital extra capacity. It will reduce congestion, helping Lowestoft to attract
investment and achieve its full potential as a place in which to live and work.
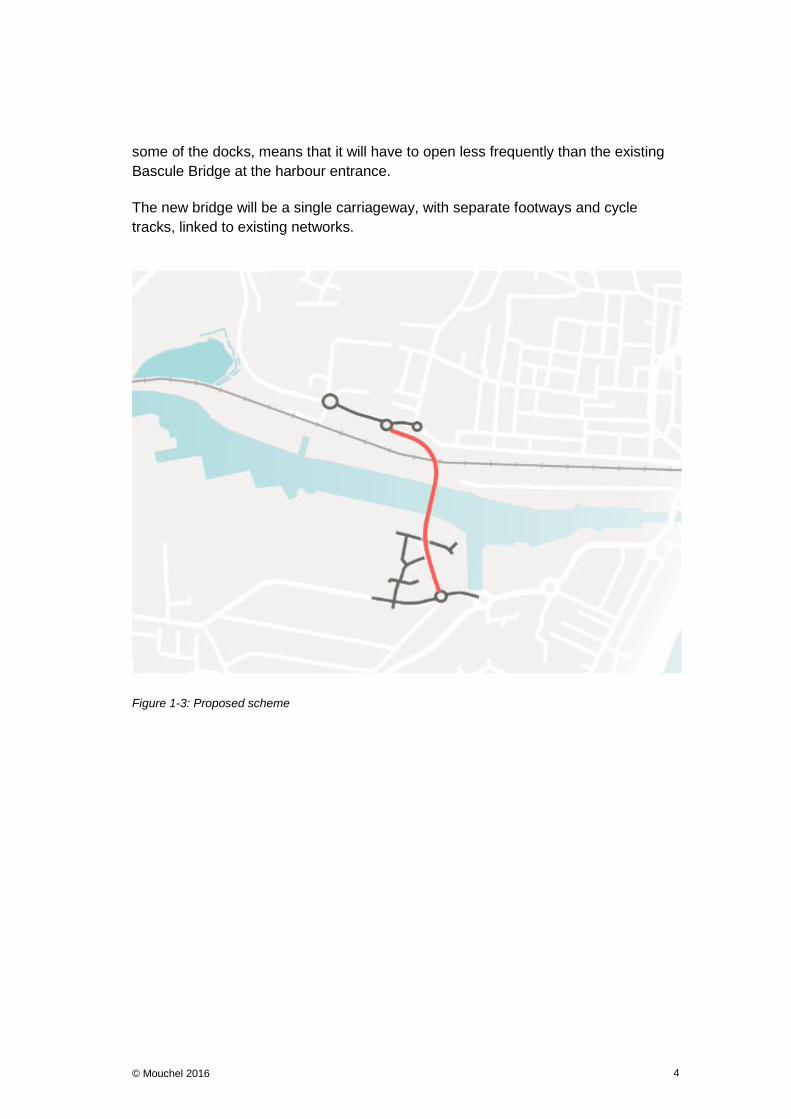
1.4 Description of the scheme
The proposed scheme is illustrated in Figure 1-3. It starts at a new roundabout on
Denmark Road, east of the existing Peto Way / Denmark Road roundabout, and
spans both the railway line and Lake Lothing on a north – south alignment.
On the southern shore, the new crossing follows the line of Riverside Road, initially
at a high level, descending to a new roundabout at the junction of Riverside Road
and Waveney Drive, west of the Lings Motor showroom.
Improvements between this roundabout and the existing Waveney Road / Tom Crisp
Way roundabout will provide access to the A12. Local roads which presently connect
directly to Riverside Road will be served in the main from a new connection to
Waveney Drive.
The choice of a “central” corridor for the third crossing means that traffic can travel
easily between the Northern Spine Road (Peto Way) and the Southern Link Road
(Tom Crisp Way) without using either of the existing bridges, helping to reduce
congestion and reduce community severance.
A bascule (lifting) bridge will be constructed to allow the passage of shipping within
the inner harbour. When closed, the bridge will have a clearance of at least 12m.
This will enable smaller boats to pass under the bridge. This, and its location west of
© Mouchel 2016 4
some of the docks, means that it will have to open less frequently than the existing
Bascule Bridge at the harbour entrance.
The new bridge will be a single carriageway, with separate footways and cycle
tracks, linked to existing networks.
Figure 1-3: Proposed scheme

© Mouchel 2016 5
Figure 1-4: Conceptual 3D image of the scheme

© Mouchel 2016 6
1.5 The Five Cases
The OBC is made up of five separate cases. Together these show that the scheme
is:
Closely aligned to wider strategies and objectives – the strategic case.
Best value for money – the economic case.
Achievable in commercial terms – the commercial case.
Affordable – the financial case.
Achievable in practical terms – the management case.
1.6 Summary of the Strategic Case
1.6.1 Strategic fit
The proposed Lake Lothing Third Crossing scheme is closely aligned with national,
regional and local transport plans and policies. Together these set out a bold vision
for economic growth and regeneration in Lowestoft, with a specific focus on the area
around Lake Lothing. The proposed third crossing is part of that vision. By
addressing Lowestoft’s reputation for chronic congestion, it will help to attract more
inward investment, and support and stimulate growth.
1.6.2 Development plans
The Area Action Plan identifies the specific site allocations within the area which
need to be developed to realise the regeneration and revitalisation of the Lake
Lothing and Outer Harbour area. The third crossing will improve access to key areas,
including Kirkley Waterfront and the proposed Sustainable Urban Neighbourhood.
1.6.3 Problems
The main problems which have led to the proposed scheme being developed are:
The loss of traditional industries and employment;
Difficulty accessing potential regeneration sites;
Community severance;
Congestion;
Barriers to walking and cycling;
Difficulties for local bus services; and
Accidents.
If a third crossing is not provided, these problems are expected worsen.
Regeneration and growth in Lowestoft will come at the price of increased congestion

© Mouchel 2016 7
and community severance. It will be hard for the town to shake off its image as a
place characterised by congestion and poor accessibility, and there is a real risk that
these perceptions will prevent the town from achieving its true potential for growth.
In contrast to this, tackling the problems of congestion and severance with a bold
new scheme will send a clear message that Lowestoft is embracing the challenges
of regeneration and growth.
1.6.4 Aims and objectives
The overall aim of the proposed scheme is therefore:
To stimulate regeneration, sustain economic growth, and enhance Lowestoft
as a place to live and work in, and to visit.
The specific objectives of the scheme are:
To open up opportunities for regeneration and development in Lowestoft.
To provide the capacity needed to accommodate planned growth.
To reduce community severance between north and south Lowestoft.
To reduce congestion and delay on the existing bridges over Lake Lothing.
To reduce congestion in the town centre and improve accessibility.
To encourage more people to walk and cycle, and reduce conflict between
cycles, pedestrians and other traffic.
To improve bus journey times and reliability.
To reduce accidents.
1.6.5 Constraints
In developing the scheme, account has been taken of physical, environmental,
financial, contractual and public acceptability constraints, especially the need to fit in
with the operation of the port.
1.6.6 Support for the scheme
There is very strong public support for a scheme, with over 93% of people believing
that a new crossing is needed. Local businesses consider that the scheme will
stimulate increased turnover and higher levels of employment.
1.6.7 Option assessment and selection of preferred scheme
A comprehensive and robust option selection process was adopted to generate and
assess options for the scheme. An initial long-list of 15 options, including non-road
options, was assessed and reduced to a short list of three.
© Mouchel 2016 8
The preferred scheme is the Central Bridge option. It is the least expensive of the
short-listed options, it produces the highest benefits, is most likely to deliver the
objectives, and has a high level of public and business support.
1.7 Summary of the Economic Case
An analysis of the monetised benefits of the proposed scheme demonstrates that it
offers very high value for money with a BCR of 6.85. Most of the benefits result from
savings in journey time and vehicle operating costs. Accident savings and savings
associated with increased use of active modes also contribute to the benefits.
Inclusion of reliability benefits increases the BCR further to 8.08. Sensitivity testing
with a range of growth scenarios shows that the scheme would still offer very good
value for money in a low growth scenario. Analysis of social and distributional
impacts shows that areas of Lowestoft with lower average incomes will benefit most.
About half of the forecast time and vehicle operating cost savings are identified as
benefits to business. Business will benefit from reduced congestion, faster journeys
and improved journey time reliability, with reduced costs and better access to
markets, whilst commuters will similarly benefit from shorter, more reliable, journeys
to work. These benefits, which are included in the BCR calculations, will support
local development and the regeneration of Lowestoft’s economy.
Impacts on the environment have been assessed and range from neutral to
moderate adverse. These will be reviewed for the Full Business Case in the light of
more detailed assessment and consideration of measures to mitigate, manage or
compensate for the impacts. The scheme is expected to lead to a reduction in
greenhouse gas emissions; these have been monetised and included in the BCR.
The results of the appraisal are summarised in an Appraisal Summary Table.
1.8 Summary of the Financial Case
1.8.1 Costs
The cost of the scheme preparation and construction has been estimated by Suffolk
County Council’s consultant, Mouchel Consulting. The estimated capital cost of the
scheme is £80,347,000 at current (2015) prices, excluding inflation, client costs and
non-recoverable VAT. Subject to funding and consents, the scheme will be delivered
by financial year 2020-2021. Including inflation, the expected capital costs will be
£91,733,000.
1.8.2 Risk
Risk allowance is a factor applied to project costs to act as a contingency for
unforeseen circumstances. The cost of delivering the scheme will not be fully known
until the detailed design has been completed, land purchased, and tender prices
have been received. To reflect the uncertainty associated with known risks, a
quantified risk assessment (QRA) has been undertaken. The allowance for risk is
£25,546,000 at 2015 prices, and is included in the scheme costs above.

© Mouchel 2016 9
1.8.3 Funding
It is likely that the scheme will be funded entirely from public finances.
The largest contribution to the scheme costs would be provided by the Government’s
Department for Transport.
20% of the costs will be covered by a local contribution. Potential sources for this are
identified in the Financial Case. The exact composition cannot be finalised at this
stage – details of the local funding mechanism will be clarified as the scheme is
developed. Suffolk County Council will underwrite this cost, and this is confirmed in a
letter of intent, written by the Council’s Section 151 officer. The Council is also
prepared to enter into credit arrangements under the prudential borrowing powers
from the Local Government Act 2003.
In addition to underwriting the 20% contribution, the letter also confirms that the
Council will underwrite any potential increase in scheme costs.
1.8.4 Whole life costs
The scheme will give rise to additional revenue liabilities for capital renewals and
maintenance and for the cost of day to day operation of the bridge. All maintenance
obligations will be met as part of the maintenance regime operated by Suffolk County
Council.
The following whole life costs (given at 2015 prices) have been factored into the
economic appraisal
£1.5 million (over a 60 year period) for resurfacing / renewing the new
highway infrastructure (including the bridge approaches and bridge surface);
£1.5 million (over a 60 year period) for bridge repair and rehabilitation;
£10,000 (per year) for annual highways maintenance liabilities; and
£132,000 (per year) for bridge maintenance (including operation and
maintenance of the bascule bridge.
1.9 Summary of the Commercial Case
1.9.1 Procurement
The scheme is commercially viable with a robust contracting and procurement
strategy. It will use an OJEU ‘restricted procedure’ procurement tendering process,
which has been utilised by the Council on a number of previous large-scale transport
infrastructure schemes. Details are given in the Commercial Case. The scheme will
be procured using a ‘traditional’ approach as opposed to ‘design and build’.
1.9.2 Form of contract and sourcing.
The Council will use the NEC3 Engineering and Construction (ECC) form of contract
which is the standard form of contract used for construction works in the UK. The

© Mouchel 2016 10
“priced with activity schedule” option will be selected in order to provide increased
levels of cost certainty. The scheme will be sourced through advertisement in the
Official Journal of the European Union (OJEU) due to its value. This will allow
companies from across the EU to bid for the work.
1.9.3 Risk allocation and transfer
The construction contract will include clauses to facilitate the transfer of appropriate
risks from the Council to the contractor, such as risks associated with construction
costs increasing above those predicted in the financial case.
1.10 Summary of the Management Case
The Management Case describes how the scheme will be delivered through project
management best practice, confirming that the timescales are realistic, and
demonstrating that an appropriate governance structure is in place to oversee the
project.
1.10.1 Evidence of similar projects;
The delivery of the scheme will build upon experience gained with a number of major
highway and transport schemes delivered by Suffolk County Council in recent times.
1.10.2 Programme and project dependencies
The Third Crossing scheme is a ‘stand-alone’ scheme, which can be delivered as
designed and costed independently. It is not dependent upon any other scheme or
project. Similarly, no other future projects or schemes are dependent upon it. It is,
however, dependent upon a number of other activities which are outlined within the
Project Programme, and is subject to risks, which are set out in the Risk Register.
1.10.3 Governance
A well-functioning governance structure will be crucial to the successful delivery of
the scheme. Suffolk County Council (SCC) will therefore establish a Project Board, a
Project Delivery Team and a Stakeholder Group to work together to deliver the
scheme. Details are given in the Management Case.
1.10.4 Programme
Construction is programmed to commence in February 2018 and will be completed
in November 2020, subject to approvals and funding.
A project programme has been developed setting out all the key project tasks and
their duration, the interdependencies between each of the tasks, and key milestones
and gateways.
The programme will be a live document, with progress on planned task completion
being monitored against actual progress on a weekly basis by the project manager.
A greater level of detail will be introduced into the programme during the Full
Business Case production, as detailed design of the scheme progresses and as risk
quantification and impacts change.

© Mouchel 2016 11
1.10.5 Stakeholder management
Stakeholders have been consulted on the project to highlight issues and constraints
which led into the development of the preferred option. A project steering group was
formed to facilitate this process, and two key engagement events have been held, as
well as public and business consultations. A website has been developed for the
scheme. Details are given in the Management Case.
Stakeholders will continue to have an important role as the scheme is developed.
Representatives from the key statutory stakeholders (the DfT, Network Rail,
Highways England and Association of British Ports (ABP)) and project partners (i.e.
Waveney District Council, Suffolk and Waveney Chamber of Commerce and the
New Anglia LEP), and Peter Aldous, the Member of Parliament for Waveney will be
invited by the promoter (Suffolk County Council) to form a stakeholder group for the
scheme, based on the existing Steering Group. This group will identify key
constraints to scheme delivery, capture wider stakeholder opinion and disseminate
information to other stakeholders and the wider public.
1.10.6 Risk management
The Management Case details the approach to Risk Management, including the
development of response plans. Reviews of the status of scheme risk assessments
and their related response plans (as part of project reporting) will be an integral part
progress meetings (and at the Project Board) during progression of detailed design
and the construction period. All key risks will be formally reviewed at key decision
points in the scheme lifecycle.
1.10.7 Benefits realisation
It is important to demonstrate that the scheme is successful in delivering its
objectives. A Benefits Realisation Plan will be developed, closely linked to the
Monitoring and Evaluation Plan.

© Mouchel 2016 12
2 The Strategic Case
2.1 Introduction
The Strategic Case is the foundation of the Business Case. It demonstrates that the
proposed scheme has not been developed in isolation, but as part of a broader
strategy for Lowestoft and the local area, in response to real problems and with clear
aims and objectives.
The overarching theme is the need for Lowestoft to attract more inward investment
and take advantage of the opportunities for economic growth, reversing the tide of
industrial decline. Traffic congestion and the inadequacy of the town’s local road
network are seen by local people and businesses as the main obstacles to growth.
The inner harbour, Lake Lothing, divides the town in two, making local travel difficult
and journey times unpredictable.
Specific problems addressed in the Strategic Case are:
The loss of traditional industries and employment;
Difficulty accessing potential regeneration sites;
Community severance;
Congestion;
Barriers to walking and cycling and gaps in local cycling and pedestrian
networks;
Difficulties for local bus services due to lack of routes across Lake Lothing
and congestion at the existing bascule bridge; and
Accidents.
The provision of a third crossing of Lake Lothing is a key element of the strategy to
provide Lowestoft with the infrastructure it needs to support growth. It will enable the
local road network to operate efficiently by reducing congestion, improving
predictability of journey times, and providing capacity for growth. For these reasons,
there is a long held local aspiration to provide a third crossing which will make
Lowestoft more attractive to inward investment and a better place in which to live
and work.

© Mouchel 2016 13
The Strategic Case shows how these aspirations are in line with strategic aims and
objectives. It then demonstrates how a scheme has been identified which is best
able to deliver these objectives.
2.2 Overview
The Strategic Case is structured in line with government guidance2. It describes:
The policy background against which the scheme has been developed – the
business strategy.
The specific problems which the scheme is designed to solve.
What will happen if the scheme is not delivered – the impact of not
changing.
The objectives of the scheme.
How success will be measured.
The Strategic Case also considers strategic issues affecting the practical delivery of
the scheme:
The scope of the scheme – what it will, and will not, include.
Any constraints (physical, financial, political etc.) which could have an
impact on the delivery of the scheme.
Key interdependencies – other factors that could affect the timely delivery of
the scheme.
The role of stakeholders – what they require from the scheme, how they
have been involved so far, and how they can support the delivery of the
scheme.
Finally, the strategic case describes the range of strategic options that were
considered for the scheme. It identifies the key assumptions that underpin the
assessment of the options, and explains why the proposed scheme is recommended
as the most appropriate solution.
A summary of the strategic case is given in Section 2.14.
2 The Transport Business Cases, Department of Transport (January 2011)

© Mouchel 2016 14
2.3 Policy Background – The Business Strategy
The proposed Lake Lothing Third Crossing is closely aligned with national, regional
and local transport plans and policies.
2.3.1 National plans and policies
The National Infrastructure Plan (December 2014) is based on the principle that
“high-quality infrastructure boosts productivity and competitiveness, allowing
businesses to grow and enabling them to reach suppliers, deepen labour and
product markets, collaborate and innovate, and attract inward investment”3.
The government’s aim is “to create a national road network fit for the 21st century,
which improves economic productivity and supports jobs and growth across the
country. It seeks to increase capacity, tackle congestion, support development,
strengthen connectivity, improve reliability and resilience, and ensure a road network
of the best possible quality”.
The National Infrastructure Plan recognises the role of government in funding
improvements to the Strategic Road Network (SRN), and aims for “a transformation
of the nation’s road network over the next quarter of a century, with the aim of putting
the nation’s SRN back in the top ten globally”.
Local roads, which are not part of the SRN, are also a crucial part of the overall
transport system. Local authorities are responsible for managing, maintaining and
improving the local road network. The Government provides financial support for
road maintenance and renewal schemes, and supports investment in new local
transport schemes through Growth Deals, allocating Local Growth Fund through
Local Enterprise Partnerships.
The A12 and the existing eastern crossing of Lake Lothing are part of the SRN.
Other roads around the inner harbour are part of the local road network.
The proposed Lake Lothing Third Crossing will help deliver the government’s aim of
increasing capacity, tackling congestion, supporting development, strengthening
connectivity, improving reliability and resilience, and ensuring that the road network
(strategic and local) is of the best possible quality. This business case describes how
it will achieve this, and sets out the case for the scheme to receive financial support.
2.3.2 Regional plans and policies
The strategic case for the scheme is underpinned by key regional economic and
spatial policies, including:
New Anglia Strategic Economic Plan;
3 National Infrastructure Plan, H. M. Treasury (December 2014)

© Mouchel 2016 15
Assisted Area Designation;
Lowestoft-Great Yarmouth Enterprise Zone and Simplified Planning Zone;
and
Suffolk Local Transport Plan 2011-2031.
2.3.3 New Anglia Strategic Economic Plan (2014)
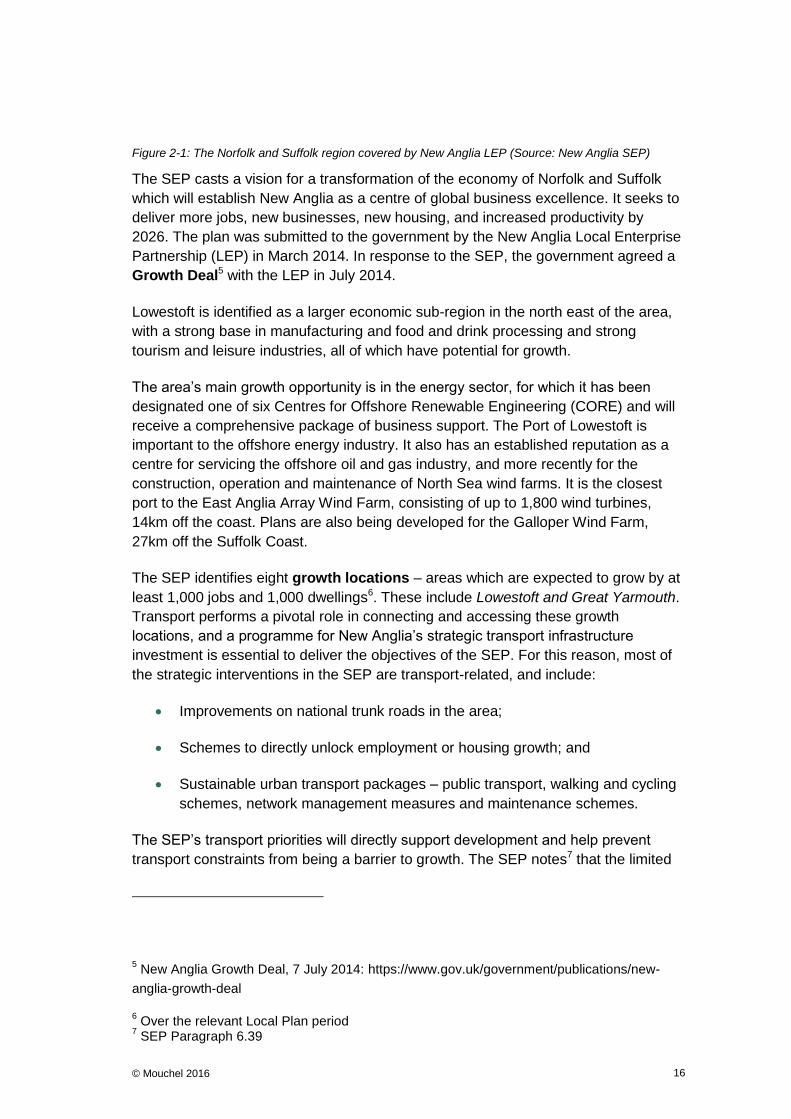
The New Anglia Strategic Economic Plan (SEP)4 covers the area illustrated in
Figure 2-1 below:
4 New Anglia Strategic Economic Plan, New Anglia LEP (March 2014)
© Mouchel 2016 16
Figure 2-1: The Norfolk and Suffolk region covered by New Anglia LEP (Source: New Anglia SEP)
The SEP casts a vision for a transformation of the economy of Norfolk and Suffolk
which will establish New Anglia as a centre of global business excellence. It seeks to
deliver more jobs, new businesses, new housing, and increased productivity by
2026. The plan was submitted to the government by the New Anglia Local Enterprise
Partnership (LEP) in March 2014. In response to the SEP, the government agreed a
Growth Deal5 with the LEP in July 2014.
Lowestoft is identified as a larger economic sub-region in the north east of the area,
with a strong base in manufacturing and food and drink processing and strong
tourism and leisure industries, all of which have potential for growth.
The area’s main growth opportunity is in the energy sector, for which it has been
designated one of six Centres for Offshore Renewable Engineering (CORE) and will
receive a comprehensive package of business support. The Port of Lowestoft is
important to the offshore energy industry. It also has an established reputation as a
centre for servicing the offshore oil and gas industry, and more recently for the
construction, operation and maintenance of North Sea wind farms. It is the closest
port to the East Anglia Array Wind Farm, consisting of up to 1,800 wind turbines,
14km off the coast. Plans are also being developed for the Galloper Wind Farm,
27km off the Suffolk Coast.
The SEP identifies eight growth locations – areas which are expected to grow by at
least 1,000 jobs and 1,000 dwellings6. These include Lowestoft and Great Yarmouth.
Transport performs a pivotal role in connecting and accessing these growth
locations, and a programme for New Anglia’s strategic transport infrastructure
investment is essential to deliver the objectives of the SEP. For this reason, most of
the strategic interventions in the SEP are transport-related, and include:
Improvements on national trunk roads in the area;
Schemes to directly unlock employment or housing growth; and
Sustainable urban transport packages – public transport, walking and cycling
schemes, network management measures and maintenance schemes.
The SEP’s transport priorities will directly support development and help prevent
transport constraints from being a barrier to growth. The SEP notes7 that the limited
5 New Anglia Growth Deal, 7 July 2014: https://www.gov.uk/government/publications/new-
anglia-growth-deal
6 Over the relevant Local Plan period
7 SEP Paragraph 6.39

© Mouchel 2016 17
opportunities for traffic to cross Lake Lothing force traffic onto a few congested
routes, and specifically identifies the existing Bascule Bridge as a bottleneck causing
traffic congestion.
This lack of connectivity between the northern and southern parts of Lowestoft
makes it more difficult to access potential employment sites and is one of the
barriers to growth that needs to be tackled in the SEP infrastructure programme.
The SEP has therefore made the design of the Lake Lothing Third Crossing a priority
for 2015, with a view to it being included in the national roads programme as soon as
possible8.
The case for providing a third crossing in Lowestoft does not rest solely on its ability
to solve problems in the immediate area of Lake Lothing, or even in Lowestoft as a
whole. Great Yarmouth and Lowestoft are a natural sub-region with strongly
interconnected travel to work areas. Unlocking congestion in Lowestoft will therefore
help support economic growth in the wider area too.
2.3.4 Assisted Area Designation
Since July 2014, parts of Lowestoft and Great Yarmouth have been designated as
Assisted Areas, eligible to receive regional aid from the European Union between
2014 and 20209. This builds on the existing incentives of the Enterprise Zone and the
Centre for Offshore Renewable Engineering (CORE). The designation is for less
advantaged local economies where there is the opportunity to increase growth.
8 SEP Paragraph 6.42, Transport Priorities
9 https://www.gov.uk/government/uploads/system/uploads/attachment_data/file/310089/2014-
2020_UK_Map_A4.jpg
© Mouchel 2016 18
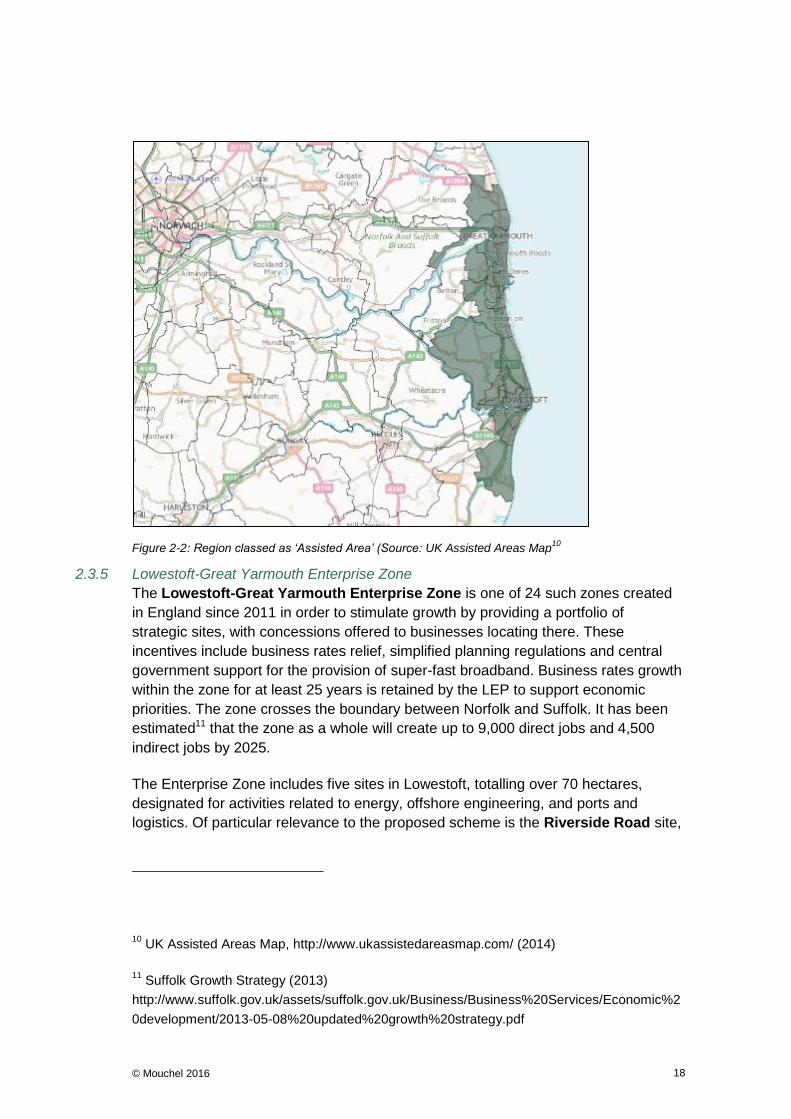
Figure 2-2: Region classed as ‘Assisted Area’ (Source: UK Assisted Areas Map10
2.3.5 Lowestoft-Great Yarmouth Enterprise Zone
The Lowestoft-Great Yarmouth Enterprise Zone is one of 24 such zones created
in England since 2011 in order to stimulate growth by providing a portfolio of
strategic sites, with concessions offered to businesses locating there. These
incentives include business rates relief, simplified planning regulations and central
government support for the provision of super-fast broadband. Business rates growth
within the zone for at least 25 years is retained by the LEP to support economic
priorities. The zone crosses the boundary between Norfolk and Suffolk. It has been
estimated11 that the zone as a whole will create up to 9,000 direct jobs and 4,500
indirect jobs by 2025.
The Enterprise Zone includes five sites in Lowestoft, totalling over 70 hectares,
designated for activities related to energy, offshore engineering, and ports and
logistics. Of particular relevance to the proposed scheme is the Riverside Road site,
10 UK Assisted Areas Map, http://www.ukassistedareasmap.com/ (2014)
11 Suffolk Growth Strategy (2013)
http://www.suffolk.gov.uk/assets/suffolk.gov.uk/Business/Business%20Services/Economic%2
0development/2013-05-08%20updated%20growth%20strategy.pdf

© Mouchel 2016 19
a 4.5 hectare brownfield site beside Lowestoft Inner Harbour (Lake Lothing), shown
in Figure 2-3.
Figure 2-3: Riverside Road, and Outer Harbour and PowerPark sites
The Riverside Road land has been allocated for B1 (light industrial / business), B2
(general industrial), or B8 (storage and distribution uses). A Local Development
Order is in place which permits these uses without the need for planning permission,
subject to certain constraints on the land. The land forms part of the wider mixed-use
allocation known as Kirkley Waterfront.
2.3.6 Simplified Planning Zone
The Outer Harbour and PowerPark, a 24.5 hectare brownfield site beside
Lowestoft Outer Harbour adjacent to Lowestoft railway station, is also part of an
indicative Simplified Planning zone (SPZ). It surrounds the OrbisEnergy Centre and
is envisioned as a centre for the renewable technology cluster. The SPZ sites are
also illustrated in Figure 2-3.
2.3.7 Suffolk Local Transport Plan 2011-2031
DfT guidance on Local Transport Plans (LTPs) required local authorities to develop
strategies and implement programmes to achieve five goals originally developed in
the DfT’s discussion document, ‘Towards a Sustainable Transport System’:
Maximising economic growth through competitiveness and productivity;
Tackling climate change;

© Mouchel 2016 20
Protecting people’s safety, security and health;
Improving quality of life; and
Promoting greater equality of opportunity.
In response, Suffolk County Council adopted a strategy intended to deliver first class
transport infrastructure in the county. LTP312 sets out the authority’s transport
objectives, strategies and policies for the period 2011-2031. It shows how transport
will play its part in supporting and facilitating future sustainable economic growth by:
Maintaining (and in future, improving) transport networks;
Tackling congestion;
Improving access to jobs and markets; and
Encouraging a shift towards more sustainable travel patterns.
12 Suffolk Local Transport Plan 2011-2031 (Part 1 – Transport Strategy and Part 2 –
Implementation Plan), Suffolk County Council
© Mouchel 2016 21
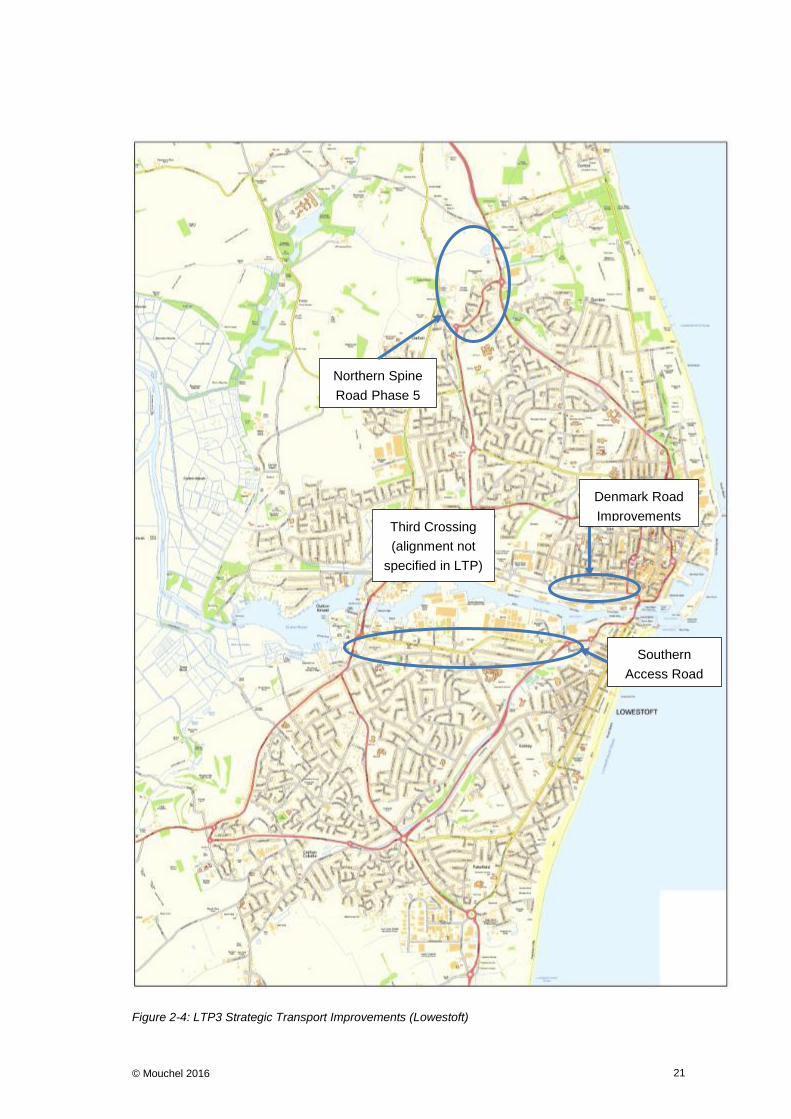
Figure 2-4: LTP3 Strategic Transport Improvements (Lowestoft)
Northern Spine
Road Phase 5
Denmark Road
Improvements Third Crossing
(alignment not
specified in LTP)
Southern
Access Road

© Mouchel 2016 22
The LTP identifies 11 key transport issues for Waveney District. These include:
Access to development sites south of Lake Lothing in Lowestoft;
Impact of traffic in north Lowestoft;
Lack of pedestrian / cycle bridges over Lake Lothing; and
Pinch points for northbound / southbound traffic in Lowestoft.
The LTP describes a number of long-standing aspirations for highway improvements
in Lowestoft. These include: completion of the northern spine road that will allow the
re-routing of the A12 in North Lowestoft, the improvement of Denmark Road; a new
access road south of Lake Lothing to unlock development sites in this regeneration
area; additional pedestrian / cycle bridges across Lake Lothing; and, in the longer
term a third vehicular bridge across Lake Lothing.
Of these planned improvements, shown in Figure 2-4, the A1177 Lowestoft Northern
Spine Road (Phase V) was opened in March 2015. The Denmark Road
improvements and the proposed pedestrian, cycle and vehicular crossings of Lake
Lothing have not yet been delivered. The Southern Access Road is not being taken
forward.
The proposed scheme for a third crossing would contribute to the LTP3 goals and
would address the specific transport issues identified in the plan by reducing
congestion and improving connectivity, access to jobs, and journey time reliability for
customers, commuters and freight. It would provide an improved crossing for cycles
and pedestrians as well as for cars and freight vehicles.
The LTP – which pre-dates the Growth Deal – identified the proposed third crossing
of Lake Lothing in Lowestoft as a “much needed improvement for which there is a
very strong desire in the local community but with, at present, no clear delivery
mechanism”.
2.3.8 Local plans and policies
The Strategic Case is also closely aligned with key local economic and spatial
strategies, including
Waveney Local Development Framework Core Strategy;
Lake Lothing and Outer Harbour Area Action Plan;
Lowestoft Transport Strategy (2011); and
Lowestoft Transport and Infrastructure Prospectus (2013-2025).

© Mouchel 2016 23
2.3.9 The Waveney Local Development Framework Core Strategy (2009)
The Local Development Framework (LDF) covers Lowestoft and the whole of the
administrative area of Waveney District, except that part lying within the Broads
Executive Area. The LDF includes a Core Strategy and proposals map, site-specific
allocations and policies, as well as generic development control policies.
The Core Strategy sets out a long-term spatial vision for the District, including
Lowestoft, indicating where development should take place and the factors that will
be taken into account when considering proposals. Consultation was undertaken on
the vision, objectives and options for the Core Strategy in mid-2006, before the
Strategy was submitted to Government in 2008 and adopted in 2009.
The Core Strategy envisages that Lowestoft will accommodate 70 – 80% of the
housing growth planned for Waveney (CS01 and CS11), and 70 – 80% of the
additional jobs in the district (5,000 jobs), providing an alignment between
employment and housing growth. Most of this employment growth will take place in
the Lake Lothing and Outer Harbour area of Lowestoft (Policy CS07), supporting port
expansion, regeneration and economic diversification. An Area Action Plan has
been prepared to help achieve this (Policy CS05). More information is given below.
Lowestoft will also be the focus for most of the retail and leisure growth in the District
(Policy CS10). Retail development as part of mixed-use schemes will be important to
the regeneration, including cultural and tourism, prospects for the town. The primary
focus for delivery will be the town centre and to the south and east towards the water
frontage of Lake Lothing and the outer harbour.
The Core Strategy identifies a range of transport measures (Policy CS15) which are
integral to the regeneration of Lowestoft and the wider sub-region with Great
Yarmouth. These include measures to reduce congestion, improve safety and
enhance connectivity between north and south Lowestoft and with Great Yarmouth.
The Core Strategy states that “the District Council will continue to promote the
creation of a third road crossing of Lake Lothing, as an integral part of dealing with
transport problems and issues in Lowestoft and the sub-region”. It identifies the need
for “new cycle / pedestrian crossings of Lake Lothing to increase accessibility
between development sites in Lowestoft and employment sites, services and
facilities”.
2.3.10 Lake Lothing and Outer Harbour Area Action Plan, Lowestoft (2012)
The Area Action Plan (AAP)13 provides a detailed spatial policy framework for the
regeneration of Lake Lothing and the Outer Harbour by identifying opportunities for a
range of employment, residential, recreational, community, transport and
13 Lake Lothing and Outer Harbour Area Action Plan, Lowestoft (adopted January 2012)

© Mouchel 2016 24
environmental improvements. The area covered by the AAP is also identified as a
Strategic Employment Location, in support of port development, employment-led
regeneration and economic diversification.
The AAP is the result of detailed master planning, option assessment and
consultation between 2006 and 2012. Transport and its associated infrastructure will
perform a key role in the delivery of a revitalised area. The extent of the AAP is
illustrated in Figure 2-5 below.
Figure 2-5: Lake Lothing and Outer Harbour AAP boundary
Lake Lothing creates a significant barrier to movement within the AAP area and
across the wider town. This splits the town in two, with the main employment area
located to the northern side and a sizeable residential population to the south.
Crossing Lake Lothing constrains the transport options within the town, with two
lifting bridges crossing at the eastern and western ends of the town, forming
bottlenecks where several roads merge into one.
The AAP states that “in order to facilitate development a series of road
improvements will be required, dependent on securing appropriate levels of funding
from central government and developments within the town. These improvements
are set out within the Lowestoft Transport Strategy. As a long term ambition for the
town a third crossing has been identified to provide a further vehicular connection
across Lake Lothing”. The AAP assumes that developers will work with the Council
to ensure that development proposals do not restrict the potential for a third crossing.
Inner Harbour
Outer Harbour

© Mouchel 2016 25
2.3.11 Lowestoft Transport Strategy (2011)
The Lowestoft Transport Strategy, produced by Suffolk County Council in 2011,
complements the LTP and the Area Action Plan. It notes that plans for further
regeneration of Lowestoft could lead to significant growth in housing and
employment over the next 20 years, with a likely growth of 2,200 homes and up to
5,000 jobs. This will add to congestion if current travel trends continue. The focus for
growth is around Lake Lothing, and could lead to long-term changes in the area and
its land uses. However, there are only roads crossing Lake Lothing: the A12 via the
Bascule Bridge (the point at which it becomes a trunk road) and the A1117 over
Mutford Lock. The constricted nature of these two opening bridges can create
congestion, especially when the Bascule Bridge is opened to allow access to the
quayside. The congestion is exacerbated when the level crossing near Oulton Broad
North railway station is closed to traffic.
The strategy seeks to address problems by encouraging more sustainable modes of
travel in the area. It also identifies a number of infrastructure improvements.
The Lowestoft Transport Strategy confirmed the County Council’s support for the
then Highways Agency “in developing and securing funding in the longer term for a
third river crossing of Lake Lothing for motorised traffic”.
2.3.12 Lowestoft Transport and Infrastructure Prospectus (2013 – 2025)
In 2013, a partnership of key public and private sector bodies14 published Moving
Lowestoft Forward, a comprehensive prospectus for transport and infrastructure in
Lowestoft. Its vision is simply “that the transport and infrastructure provisions within
and serving the town of Lowestoft will be appropriate for the present and future
needs of businesses, residents and visitors to the town”.
The prospectus sets objectives for road infrastructure as well as for sustainable
transport, rail infrastructure, port infrastructure, and flood protection. Objectives for
road infrastructure include:
14 A steering group led by Peter Aldous MP together with representatives from the New
Anglia Local Enterprise Partnership (NALEP), Suffolk County Council (SCC), Waveney
District Council (WDC), Environment Agency (EA), the Suffolk Chamber and the Lowestoft
and Waveney Chamber (“The Partners”) was formed to produce a prospectus supporting the
planned development and delivery of comprehensive proposals to improve the transport and
infrastructure both within and serving Lowestoft. Development of the proposals contained
within the prospectus has been assigned to a Lowestoft Transport & Infrastructure Major
Projects Team formed from representatives of The Partner organisations with support from
key stakeholders including Associated British Ports (ABP), Highways Agency (HA), Network
Rail (NR), Marine Management Organisation (MMO) and Anglian Water (AW).

© Mouchel 2016 26
Improving the movement of traffic through and within the town centre,
particularly around the bascule bridge area;
Improving the junction between Commercial Road and the A12;
Facilitating re-routing of through traffic to the west of Lowestoft’s town centre
and remove the pinch point at Bentley Drive;
Improving connectivity to Lowestoft via Great Yarmouth and the A11 to the
north and Ipswich and the A14 to the south;
Reducing journey times, improve reliability and protect and enhance the
environment along key routes serving Lowestoft;
Improving safety for those travelling on and those residing beside key routes
serving Lowestoft;
Improving the connectivity between the town centre, Belvedere Road and the
seafront;
Reducing the cost and time taken when transporting goods to and from
Lowestoft; and
Providing improved access to major housing development sites.
The transport and infrastructure prospectus crystallises a view of the proposed third
crossing scheme which is very characteristic of the other policies reviewed in this
business case. It states that:
“Significant work has been done in recent years to understand the feasibility and
costs of a new north – south road, which would have to cross Lake Lothing and the
railway. It is clear that the scale of such a project, which would cost around £100
million, means that delivery has to be seen as a long term proposal for which the
majority of funding would have to come from central Government. Therefore the
partners have taken the approach that whilst a third crossing remains a high priority,
and any opportunities that may arise to advance its delivery should be taken, there
are a number of other interventions that could be made in the short to medium term
to improve and increase travel opportunities in Lowestoft in order to support the
town’s growth and ensure its prosperity.”
The prospectus includes a range of short, medium and longer term infrastructure
proposals, including road improvements. These include, as a longer term proposal:
“Subject to option appraisals and development of proposals carried out in the short /
medium term, deliver the preferred option for the replacement / relocation of the
Bascule Bridge and / or the provision of a third crossing.”

© Mouchel 2016 27
The prospectus also illustrates a number of options for a new crossing. Further
option appraisal has since been undertaken, as described in Appendix A.
The prospectus considers the likely potential sources of funding for each of its
proposals and concludes that, to deliver the Lake Lothing Third Crossing scheme,
funding would be required from the New Anglia LEP and from central government.
This OBC explains, in line with government guidance, why the proposed scheme
should now receive support, and provides a clear audit trail for the purposes of public
accountability.
2.3.13 Summary of the Business Strategy and Policy Background
The proposed Lake Lothing Third Crossing is closely aligned with national, regional
and local transport plans and policies.
It reflects the government’s view, in the National Infrastructure Plan, that high
quality infrastructure is needed to improve productivity and support jobs and growth.
The scheme will increase capacity, tackle congestion, support development,
strengthen connectivity, improve reliability and resilience and improve the quality of
the local road network.
The Strategic Economic Plan identifies opportunities for growth in Lowestoft. The
limited opportunities to cross Lake Lothing are seen as a barrier to growth, and the
plan therefore supports the development of the scheme. The area around Lake
Lothing is part of the Lowestoft-Great Yarmouth Enterprise Zone and has Assisted
Area status from the EU, in recognition of the urgent need for regeneration and
growth. The proposed scheme will improve access and connectivity, supporting
regeneration. The Local Transport Plan identifies the third crossing as a “much
needed improvement for which there is a very strong desire in the local community
but with, at present, no clear delivery mechanism”.
The LDF Core Strategy sets out spatial policies for regeneration growth and states
that “the District Council will continue to promote the creation of a third road crossing
of Lake Lothing, as an integral part of dealing with transport problems and issues in
Lowestoft and the sub-region”. The Area Action Plan notes that Lake Lothing
creates a significant barrier to movement within the AAP area and across the wider
town and identifies a third crossing as a longer term ambition. Suffolk County
Council’s Lowestoft Transport Strategy notes that whilst the focus for growth will
be around Lake Lothing, congestion is problem. It gives support to developing and
securing funding in the longer term for a third river crossing of Lake Lothing for
motorised traffic. The Lowestoft Transport and Infrastructure Prospectus
consolidates the views of key public and private sector bodies by clearly identifying
the transport infrastructure needed to support growth and regeneration. It considers
options for a third crossing of Lake Lothing and confirms this as a high priority for
which central government support will be needed.
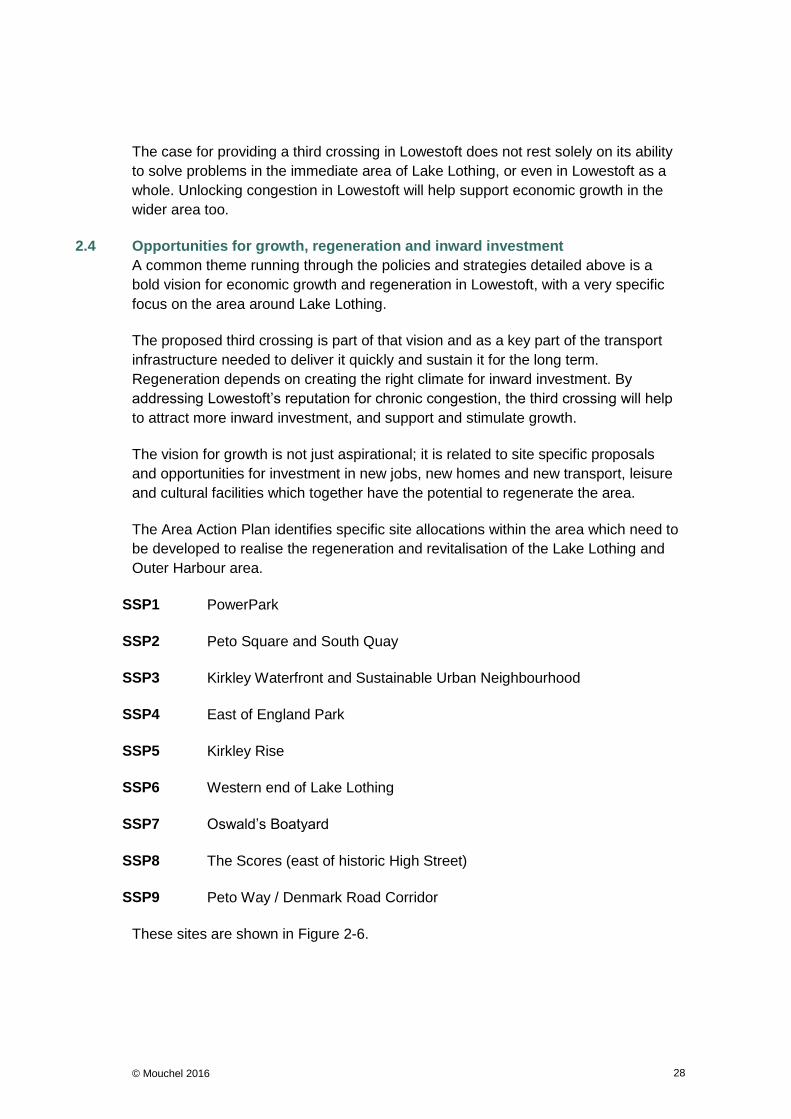
© Mouchel 2016 28
The case for providing a third crossing in Lowestoft does not rest solely on its ability
to solve problems in the immediate area of Lake Lothing, or even in Lowestoft as a
whole. Unlocking congestion in Lowestoft will help support economic growth in the
wider area too.
2.4 Opportunities for growth, regeneration and inward investment
A common theme running through the policies and strategies detailed above is a
bold vision for economic growth and regeneration in Lowestoft, with a very specific
focus on the area around Lake Lothing.
The proposed third crossing is part of that vision and as a key part of the transport
infrastructure needed to deliver it quickly and sustain it for the long term.
Regeneration depends on creating the right climate for inward investment. By
addressing Lowestoft’s reputation for chronic congestion, the third crossing will help
to attract more inward investment, and support and stimulate growth.
The vision for growth is not just aspirational; it is related to site specific proposals
and opportunities for investment in new jobs, new homes and new transport, leisure
and cultural facilities which together have the potential to regenerate the area.
The Area Action Plan identifies specific site allocations within the area which need to
be developed to realise the regeneration and revitalisation of the Lake Lothing and
Outer Harbour area.
SSP1 PowerPark
SSP2 Peto Square and South Quay
SSP3 Kirkley Waterfront and Sustainable Urban Neighbourhood
SSP4 East of England Park
SSP5 Kirkley Rise
SSP6 Western end of Lake Lothing
SSP7 Oswald’s Boatyard
SSP8 The Scores (east of historic High Street)
SSP9 Peto Way / Denmark Road Corridor
These sites are shown in Figure 2-6.
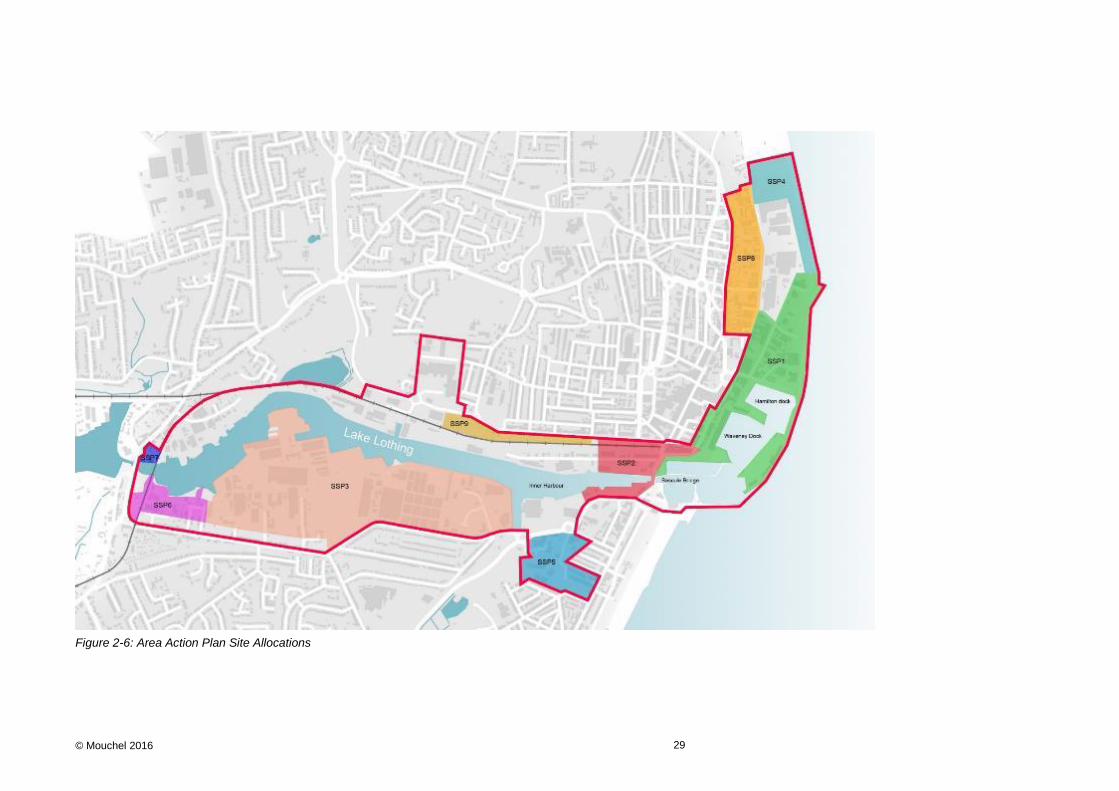
© Mouchel 2016 29
Figure 2-6: Area Action Plan Site Allocations
© Mouchel 2016 30
The creation of an additional crossing of Lake Lothing will help to stimulate the
regeneration of these sites, by providing the high quality transport infrastructure
needed to access new developments and by reducing congestion on the existing
bridges and local road network.
Equally, as the sites are developed, they will generate additional demand for travel
by car, cycle, and bus, and on foot. The third crossing will help to meet this demand
without putting additional pressure on the existing transport networks. However,
because regeneration is the main driver for the scheme, these developments are
treated in this OBC as opportunities, not problems.
Full details and plans of all the AAP site allocations shown in Figure 2-6 are given in
Appendix B. A summary description of each site, and its potential relationship to the
proposed third crossing scheme, is set out below.
2.4.1 PowerPark (SSP1)
The PowerPark is the area around the Outer Harbour, including Hamilton Dock,
Waveney Dock, and parts of the Trawl Dock. It is adjacent to, but does not include,
the 10 ha site of Birds Eye – a major local employer. Much of the site is occupied by
the Beach Industrial Estate, which comprises a mixture of industrial, office and retail
wholesale premises. Much of the estate is poorly maintained with an ageing building
stock. However, it is also home to the recently opened OrbisEnergy Centre which
provides a start-up space for businesses focused on the energy sector, and to the
2.75 mw Gulliver demonstrator wind turbine.
The PowerPark will provide some 24.7 ha of reconfigured employment land (B1, B2
and B8). A Relocation Strategy (2010) has been developed to ensure that existing
businesses are not adversely affected. The strategic aim is to continue developing
the PowerPark as a centre of excellence in the marine engineering and energy
sectors, focusing on15:
Offshore wind operations and maintenance;
Offshore marine research and development;
Existing traditional marine and underwater engineering;
Other energy-related activities, including:
o Carbon Capture Storage;
o Support to the nuclear industry;
15 PowerPark Demand and Need Report (Phase 2, 2009 & Phase 2, 2020) quoted in the Area
Action Plan

© Mouchel 2016 31
o Gas storage;
Training for the energy sectors; and
Offshore assembly and component development.
It is estimated that an additional 950 direct and almost 4,000 indirect jobs could be
created by 2020. The economic benefit from offshore wind operations and
maintenance is tentatively estimated to be worth £3 million to the sub-regional
economy by 2020.
The proposed Lake Lothing Third Crossing scheme will support the development of
the PowerPark by reducing congestion in the road network around the existing
Bascule Bridge, thereby improving accessibility by car, cycle, bus and on foot, and
for freight.
2.4.2 Peto Square and South Quay
Peto Square and South Quay are immediately north and south of the existing
Bascule Bridge.
On the north side, the 6.6 ha strategic Peto Square site, which includes the Railway
Station, Station Square and Commercial Road, will be the main focus for
development. The area includes a range of secondary town centre related services,
retail and catering businesses within an important, though badly degraded, historic
townscape. It suffers from the effects of through-traffic on the A12, and most
buildings are in a poor condition and underutilised. The improvements include:
Improving the station and surrounding area;
Refurbishment of key buildings;
Retail and leisure developments;
Improvements for pedestrians and cyclists;
Junction improvements; and
Environmental enhancements.
To the south, 2.4 ha of land between Belvedere Road and South Quay will be
developed and enhanced for commercial and port related activities with improved
public realm.
The proposed Lake Lothing Third Crossing scheme will support the development of
Peto Square and South Quay by reducing congestion in the road network around the
existing Bascule Bridge, reducing the impacts of traffic on the townscape and
improving accessibility by car, cycle, bus and on foot, and for freight.

© Mouchel 2016 32
2.4.3 Kirkley Waterfront and Sustainable Urban Neighbourhood (SSP3)
Kirkley Waterfront and the proposed Sustainable Urban Neighbourhood comprise
59.8 ha of largely under-utilised or unoccupied brownfield land on the south side of
Lake Lothing, between the waterfront and Victoria Road and Waveney Drive. The
area is shown in Figure 2-7 and Figure 2-8.
Figure 2-7: Kirkley Waterfront and Sustainable Urban Neighbourhood
The area includes the premises of the former Jeld Wen timber company, which has
extensive waterfront with scope for future port activities. The Riverside Road
employment area is a mix of active businesses and vacant land. Brooke Peninsula
(12.1 ha) is the site of a former boat yard which is now under-utilised, having a range
of small and medium sized businesses with low employment density. The former
Sanyo sites (8 ha) are currently vacant. To the north-west is the Haven Marina and a
range of newer businesses, which would be retained. To the west are the SCA
Recycling and Witham Paints which may provide scope for redevelopment. The area
also includes areas of open space, including a County Wildlife Site.

© Mouchel 2016 33
Figure 2-8: Kirkley Waterfront and Sustainable Urban Neighbourhood – aerial view
The strategic aim is to regenerate the area as a new residential community,
comprising around 1,380 homes at densities of 50 – 90 per hectare, together with
about 12 ha of reconfigured employment land, at least 3 ha of new open space, a
primary school and other community facilities, together with waterfront and marina
facilities. Significant new transport infrastructure will be needed to facilitate these
developments.
The proposed Lake Lothing Third Crossing will help to encourage inward investment
and support the regeneration of this important area by greatly improving accessibility
by car, cycle, bus and on foot, and for freight. It will link this site to strategic routes
and provide improved access between this site, the town centre and residential
areas to the north and south of Lowestoft.
2.4.4 East of England Park (SSP4)
Located to the north of the PowerPark, on the seafront, the East of England Park
presents the opportunity to reinvent a neglected and under-utilised open space to the
north of the Birds Eye factory as a major new contemporary park including the most
easterly point of England (Ness Point). The improvements will include better
pedestrian and cycle links to the town centre.
2.4.5 Kirkley Rise (SSP5)
The Kirkley Rise area lies between the southern shore of Lake Lothing and the
Kirkley waterfront, and has a mix of employment, car parking and residential uses.
There are a number of vacant sites with development opportunities.
The strategic vision for this 8.3 ha area is to link Lothing waterfront with the Kirkley
District shopping centre. There are opportunities to expand the shopping centre and
© Mouchel 2016 34
provide a new health centre, market, housing and employment floor space, retaining
existing employment sites and, possibly, providing more public car parking.
The proposed Lake Lothing Third Crossing will support the regeneration of this area
by reducing congestion in the road network south of the existing Bascule Bridge,
reducing the impacts of traffic on the townscape and improving accessibility by car,
cycle, bus and on foot, and for freight. It will improve connectivity between Kirkley
Rise and strategic routes, and residential and employment areas on the north side of
Lowestoft.
2.4.6 Western end of Lake Lothing (SSP6)
This 4.9 ha area is characterised by small scale industrial uses, under-utilised
employment land and residential development.
There are opportunities in this area to provide about 57 new homes, additional
employment focused on marine-based activities and waterfront tourism.
The proposed Lake Lothing Third Crossing scheme will support the development of
the PowerPark by reducing congestion in the road network around the existing lifting
bridge, thereby improving accessibility by car, cycle, bus and on foot, and for freight.
2.4.7 Oswald’s Boatyard (SSP7)
Located on the north shore of Lake Lothing, at its western end, this site comprises a
disused boat yard, cottages and a library. It will be developed for about 50 high
density residential units, a replacement library and community facilities.
The proposed Lake Lothing Third Crossing scheme will support the development of
the PowerPark by reducing congestion in the road network around the existing lifting
bridge, thereby improving accessibility by car, cycle, bus and on foot, and for freight.
2.4.8 The Scores (east of historic High Street) (SSP8)
The area east of the historic High Street is characterised by a network of alleyways
which are important historic features that linked the town with the original fishing
port. The AAP seeks to improve linkages within this area between the High Street
and key intervention areas including the East of England Park, PowerPark and Peto
Square. Residential development will be favoured in this location to assist in the
wider regeneration of this highly attractive location.
The proposed Lake Lothing Third Crossing scheme will support the development of
The Scores by reducing congestion road network in and around the town centre.
2.4.9 Peto Way / Denmark Road Corridor (SSP9)
This area has seen considerable investment in recent years facilitated by the
construction of Peto Way which provides a primary route into the AAP area from the
North. This has included the development of the North Quay retail park and the Quay
View Business Park.

© Mouchel 2016 35
Approximately 3.1 ha of space within the vicinity of Peto Way / Denmark Road
corridor is allocated for employment development. This location will be used as
priority relocation space for appropriate businesses that will be displaced by other
strategic site proposals in the AAP.
The proposed Lake Lothing Third Crossing will support the regeneration of this area
by greatly improving accessibility by car, cycle, bus and on foot, and for freight.
Full details and plans of all the AAP site allocations described above are given in
Appendix B.
2.5 Problems
There are a number of specific problems in Lowestoft, especially in the area around
Lake Lothing, which are key drivers for the proposed scheme.
Loss of traditional industries and employment;
Difficulty accessing potential regeneration sites;
Community severance;
Congestion;
Barriers to walking and cycling, and gaps in pedestrian and cycling networks;
Difficulties for local bus services; and
Accidents
2.5.1 Problem: loss of traditional industries and employment
Lowestoft is an area of significant deprivation and has been since the demise of the
fishing industry. Lake Lothing used to be the industrial heart of the town, an
important centre for shipbuilding and other traditional industries, but these have
declined sharply, leaving the area in urgent need of regeneration and growth.
The decline in employment in key industries has been a problem for over 20 years.
The last shipyard closed in the mid-1990s and from a peak in the 1950s and 1960s,
Lowestoft’s offshore fishing fleet is now reduced to only a small number of inshore
vessels. The manufacturing sector has continued to fall and employment has
depended increasingly upon a small number of larger employers, particularly in
engineering and food processing such as Birds Eye. The decline in oil and gas
exploration in UK waters had impacted on economic and employment levels but the
growth of offshore renewable energy generation provides significant potential.

© Mouchel 2016 36
Compensatory growth employment is also occurring in retail, tourism, service,
construction and public service sectors16.
The proportion of people claiming Job Seeker’s Allowance is 4.6%, compared to
2.3% in Suffolk and 3.1% in England17. The Waveney Core Strategy highlights the
problem of long-term unemployment and the high proportion of low skilled jobs.
According to the Index of Multiple Deprivation (2010), the level of employment
deprivation in Lowestoft is relatively high. Parts18 of the Kirkley, Harbour and
Normanston wards are among the 5% most deprived in England. All parts of these
wards are amongst the 35% most deprived in England. Figure 2-9 shows the
locations of the most deprived parts of Lowestoft, based on employment19. Table 2-1
below gives national rankings of all parts of these wards.
Figure 2-9: Most deprived areas of Lowestoft based on employment
16 Waveney District Council Economic Regeneration Strategy, pages 104-122
17
JSA claimants data for 2013 18
Parts = Super Output Areas (SOAs) ranked according to the Employment domain 19
Data from OpenDataCommunities © Mapbox © OpenStreetMap

© Mouchel 2016 37
Table 2-1: Employment scores and ranks of the three most deprived wards in Lowestoft
2.5.2 Problem: difficulty accessing potential regeneration sites
For Lowestoft to experience more inward investment, regeneration and growth, it is
essential that brownfield sites – especially those vacated by declining industries in
the area around Lake Lothing – are redeveloped to attract new investment, create
new jobs and enhance the built environment. For these developments to be
successful and sustainable in the long term, they need high quality infrastructure,
including excellent transport facilities – roads, public transport, and provision for
people walking and cycling – within an attractive and inspiring environment.
The main potential regeneration sites have been described in detail in in Section 2.4
above and Appendix B.
Ward LSOA Code
Employment Score
National Rank (out of 32482)
Percentile Average
percentile
Harbour
E01030247 0.28 592 1.8%
14.3%
E01030250 0.22 2030 6.2%
E01030249 0.19 3410 10.4%
E01030246 0.14 7636 23.3%
E01030248 0.12 9834 29.9%
Kirkley
E01030258 0.39 57 0.2%
16.8%
E01030256 0.21 2265 6.9%
E01030254 0.14 7471 22.7%
E01030257 0.13 8817 26.8%
E01030255 0.13 8949 27.2%
Normanston
E01030261 0.26 915 2.8%
18.7%
E01030263 0.17 4827 14.7%
E01030265 0.16 5757 17.5%
E01030262 0.13 8405 25.6%
E01030264 0.11 10784 32.8%

© Mouchel 2016 38
Figure 2-10: Potential regeneration sites (AAP allocations) – bottlenecks and barrier to movement
The great challenge for Lowestoft is that the area in most need of regeneration and
inward investment – the area around Lake Lothing – is also an area where the
transport networks have significant problems, due to the limited crossing
opportunities and congestion at the existing bridges, as illustrated in Figure 2-10.
Lowestoft cannot afford to miss out on these opportunities for regeneration. The
need for new jobs and inward investment is very urgent. For this reason, the various
policies and strategies detailed in Section 2.3 have, without exception, been
pragmatic about the prospects for the provision of a third crossing; they all present it
as a highly desirable, longer term project, part of a complete vision for a prosperous
and growing town with a transport network that is fit for purpose in the 21st century.
New development will lead to an increase in overall travel and trip making. More
people will need to travel to work, the regenerated sites will need to be serviced and
goods will have to be transported in and out. To minimise the traffic impacts of new
development, the Lowestoft Transport Strategy emphasises the need to reduce the
need to travel. Developers will be expected to actively promote walking, cycling and
bus use. Travel plans, with robust targets for parking and car use, enforced through
the planning process, will form the basis of this approach, and sustainable transport
infrastructure will be improved, where possible, through development and the Local
Transport Plan. Nevertheless, new development on this scale will inevitably also
produce a net increase in vehicular traffic, with more car and commercial vehicle
trips using local roads. As this happens, the problems identified above will tend to
worsen over time.

© Mouchel 2016 39
A third crossing of Lake Lothing would address this issue, and greatly improve
access to the proposed development. The traffic modelling which underpins the
Economic Case (Section 3) takes account of the trip generation from the proposed
developments. The improved accessibility to regeneration sites resulting from the
new crossing (and the problems that may occur without it) are therefore taken into
account in the calculation of the transport economic efficiency (TEE) and benefit cost
ratio (BCR) calculations.
2.5.3 Problem: community severance
Community severance can generally be described as the separation of residents
from the places they visit within their community caused by a busy road or other
transport link such as a railway20. In Lowestoft, severance is caused by Lake Lothing
itself, the railway line, and congestion at the two existing crossings.
Despite being at the heart of the town, Lake Lothing divides Lowestoft into two
halves, similar in size but different in character. The area to the north of the lake is
home to about 36,180 people21, and includes the main shopping centre and marina.
The area to the south is home to about 26,041 people14 and includes the main
seafront, pier and beach.
Figure 2-11: Shopping centre, north Lowestoft
20 Dyett, L. (2010) Community severance on the A4 Great West Road. Unpublished MSc.
thesis, University of Westminster. 21
Office for National Statistics (ONS) Mid-2013 Population Estimates

© Mouchel 2016 40
Figure 2-12: Sea front, south Lowestoft
There are only two road bridges over Lake Lothing, separated by a distance of
nearly 3km, as well as a railway bridge. These provide the only connections between
the north and south of the town. All the bridges have to close periodically to allow the
passage of shipping, which further increases journey times between the north and
south of the town.

© Mouchel 2016 41
Figure 2-13: Bascule Bridge at the eastern end of Lake Lothing
Figure 2-14: Lifting bridge and railway swing bridge at Mutford Lock, at the western end of Lake Lothing
The geography of the town, and the lack of any other road crossings of Lake Lothing
creates a significant severance problem for people in Lowestoft. For example, a

© Mouchel 2016 42
resident of Beechwood Gardens, in the southern part of the town, wanting to travel to
the North Quay Retail Park – a distance of less than a mile “as the crow flies” –
would have to drive for 2.8 miles to get there by the quickest route (via the bridge at
Mutford Lock). For a pedestrian, the trip would take about 28 minutes.
Figure 2-15: Lake Lothing severs the town and increases journey length for local trips
Community severance on this scale has several undesirable impacts:
It increases the length of journeys to work, increasing fuel consumption and
emissions for car trips;
It makes non-car modes of travel, such as walking and cycling, les s
attractive for work and other trips;
It reduces people’s access to local services, as in the example above;
It creates a physical separation between the businesses within the AAP area,
despite their apparent proximity, making it harder for the area to function as a
coherent whole.
2.5.4 Problem: congestion
Because of the limited number of crossings, there is significant congestion at the
existing road bridges, especially at peak times, and this increases traffic delays and
worsens the severance impacts described above.
A very simple overview of the congestion problem can be obtained by examining the
peak hour traffic speeds shown in Google Maps. These use floating vehicle data to
estimate traffic speeds on the road network using anonymous real-time data from
mobile phone networks and other GPS-enabled devices.

© Mouchel 2016 43
Typical traffic speeds (rated as slow, average or fast) on a Tuesday morning peak
and a Wednesday evening peak are illustrated in Figure 2-16 and Figure 2-17 below.
Figure 2-16: Typical Tuesday morning (8:30 a.m.) floating vehicle data on the approaches to the
existing lake crossings (Source: Google Maps)

© Mouchel 2016 44
Figure 2-17: Typical Wednesday evening (5:15 p.m.) floating vehicle data on the approaches to the
existing lake crossings (Source: Google Maps)
In the morning peak, there is slow-moving traffic on the northbound approaches to
both the lifting bridge at Mutford Lock and the bascule bridge. In the evening peak,
traffic moves slowly on both the northbound and southbound approaches to each
bridge.
The problem of congestion at the bridges is, of course, much worse when they have
to be periodically raised to allow shipping to pass through Lake Lothing. The majority
of bridge openings are planned to occur outside of peak periods of demand, but
many openings are unplanned and unscheduled and can occur at any time (for
larger vessels that can request opening upon arrival at the Port). This has an
additional negative effect on journey time reliability. Another factor affecting
congestion and delay is the level crossing just north of the lifting bridge at Mutford
Lock.

© Mouchel 2016 45
Figure 2-18: Local cycle network, Lowestoft
Traffic-free route on National
Cycle Network
Traffic-free route not on National
Cycle Network
On-road route on National Cycle
Network
On-road route not on National
Cycle Network
© Mouchel 2016 46
2.5.5 Problem: barriers to walking and cycling
As discussed above, the limited number of road crossings of Lake Lothing, and the
distance between them, increases the length of some cycling and walking journeys,
making these sustainable modes of travel less attractive. This is a potential problem
for people in future wanting to cycle or walk between Kirkley Waterfront – the
proposed sustainable urban neighbourhood – and the town centre, or residential
areas in north Lowestoft.
For a pedestrian or cycle route to be attractive, it needs to be direct (between key
origins and destinations), safe, secure and pleasant to use. The limited opportunities
to cross Lake Lothing by cycle or on foot is a serious weakness in the town’s cycle
network which means it is unlikely to fulfil its potential to carry a greater proportion of
work, leisure and other trips. The existing bridges do not have adequate facilities for
cyclists. At Mutford Lock there is a shared pedestrian / cycle path on the southbound
side only, whilst the Bascule Bridge to the east has footpaths on both sides but no
cycle facilities.
Lowestoft’s wider cycle network (Figure 2-18) comprises sections of National Cycle
Network Route 517, and the Regional Cycle Network, as well as other signposted
on-road cycle routes, advisory cycling routes and some traffic free cycle routes.
The lack of opportunities to cross Lake Lothing by cycle or on foot means there are
significant gaps in this network, and in the accessibility of the potential regeneration
sites around the Lake. For this reason, there has been a long standing aspiration to
provide an additional pedestrian and cycle crossing of Lake Lothing, either as part of
a new road crossing or as a stand-alone scheme.
The proposed third crossing would include segregated cycle facilities and links to
existing cycle routes, and would create attractive opportunities for new north-south
cycle trips.
2.5.6 Problem: difficulties for local bus services
Due to its size and prominence as a key service centre Lowestoft has a mostly
commercially operated bus network. The bus services cover key corridors through
the town, with all serving the town centre from outer lying areas. Key service
provision is between 0700 hours and 1900 hours with fewer services operating
outside of these periods. Services between the north and south of the town, or from
the south to the town centre, can suffer from severe delay to their journey when
traffic is disrupted by congestion around the Bascule Bridge.
The public transport network has evolved around the two existing bridges, which
means that north-south services tend to be peripheral to the built-up area (and
especially to the area around Lake Lothing). A third crossing could open up
opportunities for services that serve this area more efficiently as it grows.

© Mouchel 2016 47
Figure 2-19: Bus services in Lowestoft (from: www.suffolkonboard.com)
101
101 101
60
60
60
X2

© Mouchel 2016 48
2.5.7 Problem: accidents
Figure 2-20 shows the locations of all injury accidents in the area surrounding Lake
Lothing in the five year period 2010 to 201422. There are noticeable clusters of
accidents focused on:
the Bascule Bridge and its approaches;
the A12 at Horn Hill; and
the northern approach to the lifting bridge at Mutford Lock.
Figure 2-20: Accidents by severity in the Lake Lothing area, between 2010 and 2014
There are also significant numbers of accidents on the busy routes leading to and
from the existing crossings, especially on the A12 via the Bascule Bridge, which is
part of the Strategic Road Network and a major through route within Lowestoft.
An analysis has been undertaken of the 1.6km section between the A146 / Tom
Crisp Way Roundabout and Battery Green Road / Old Nelson Street Roundabout via
the Bascule Bridge. Most strategic traffic uses this route to cross Lake Lothing.
22 STATS 19 data, January 2010 – December 2014
Key
Fatal
Serious
Slight
N
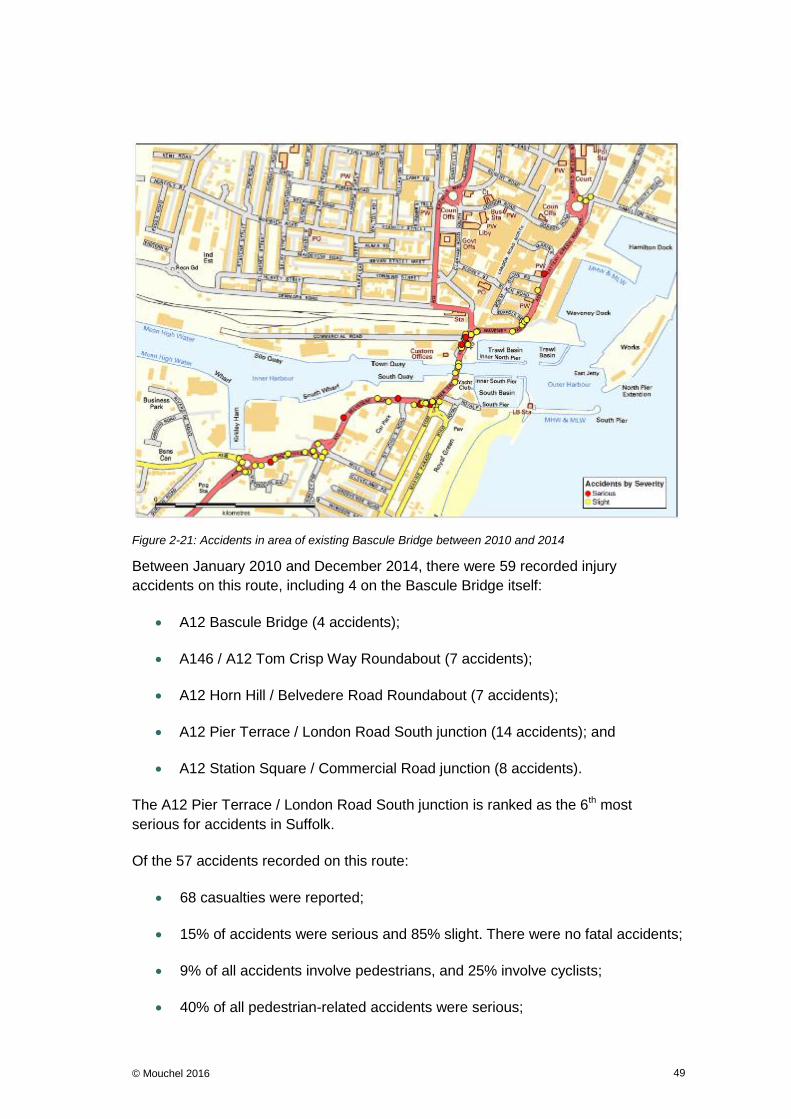
© Mouchel 2016 49
Figure 2-21: Accidents in area of existing Bascule Bridge between 2010 and 2014
Between January 2010 and December 2014, there were 59 recorded injury
accidents on this route, including 4 on the Bascule Bridge itself:
A12 Bascule Bridge (4 accidents);
A146 / A12 Tom Crisp Way Roundabout (7 accidents);
A12 Horn Hill / Belvedere Road Roundabout (7 accidents);
A12 Pier Terrace / London Road South junction (14 accidents); and
A12 Station Square / Commercial Road junction (8 accidents).
The A12 Pier Terrace / London Road South junction is ranked as the 6th most
serious for accidents in Suffolk.
Of the 57 accidents recorded on this route:
68 casualties were reported;
15% of accidents were serious and 85% slight. There were no fatal accidents;
9% of all accidents involve pedestrians, and 25% involve cyclists;
40% of all pedestrian-related accidents were serious;
© Mouchel 2016 50
20% of all cyclist-related accidents were serious;
7% of all accidents occur during the extended morning peak (07:00-10:00);
and
27% of all accidents occur during the extended evening peak (16:00-19:00)
Within the same period there were 18 recorded injury accidents on the 1km section
of the A1117 between Saltwater Way / Victoria Road Roundabout and Normanston
Drive / Gorleston Road Roundabout, via Mutford Lock and the lifting bridge.
The traffic modelling which underpins the Economic Case (Section 3) takes account
of these accidents, as well as those in larger area of the highway network in
Lowestoft. Accident reductions resulting from the new crossing are therefore taken
into account in the calculation of the transport economic efficiency (TEE) and benefit
cost ratio (BCR) calculations.
2.5.8 Summary of problems identified:
The main problems which have led to the proposed scheme being developed are:
The loss of traditional industries and employment. This gives rise to an
urgent need for regeneration of the area around Lake Lothing.
Difficulty accessing potential regeneration sites. It is essential that sites
are brought forward for redevelopment to attract inward investment and
create jobs. Sustainable travel will be encouraged. However, the scale of
growth planned also requires provision of excellent highways infrastructure as
the potential for growth is fully realised.
Community severance. Lake Lothing divides the town in half and makes
many journeys difficult for local people.
Congestion. The limited number of crossing points causes traffic congestion
at the existing bridges, and on roads in the town centre.
Barriers to walking and cycling and gaps in local cycling and pedestrian
networks, due to the lack of opportunities to cross Lake Lothing.
Difficulties for local bus services due to lack of routes across Lake Lothing
and congestion in the town centre and at the existing bascule bridge.
Accidents. There are significant concentrations of injury accidents on the
existing crossing points. The A12 route via the Bascule Bridge has high
numbers of accidents.
2.6 The impacts of not changing
If a third crossing is not provided, the problems described in Section 2.5 above are
expected to get worse. Specifically:
© Mouchel 2016 51
Congestion will increase
Lowestoft already suffers significant congestion and delay. This is a
consequence of the lack of opportunities to cross Lake Lothing, forcing traffic
onto a limited number of routes. Without a third crossing, any further traffic
growth will make the problem worse. The congestion impacts of traffic growth
with and without the proposed scheme are taken into account in the
calculation of the transport economic efficiency (TEE) and benefit cost ratio
(BCR) calculations. Congestion will affect journeys by public transport and
commercial vehicles, as well as those by car, adding to travel costs and
making journey times less reliable.
There is a risk that existing businesses will continue to decline, and
some may re-locate away from Lowestoft.
In a survey of 151 local businesses, 83% rated traffic problems as a
“significant or very significant” problem to their business. One correspondent
stated that failure to build a new crossing would threaten the existence of
their firm, and a majority (99) predicted that the number of people they would
employ would either decrease or at best remain static. Only 27 firms
predicted a growth in employment without a new crossing. By contrast, firms
forecast an average increase of 8 full time equivalent employees if a new
crossing was provided.
Statements made in response to the survey include the following:
“We have lost 3 clients from energy industry who have re-located out of area,
reducing our annual revenue by a further £4,000. … If [large company] join
the migration we will lose approximately £5,000 more per annum.”
“I have made the decision to move my business mainly down to London since
September 2012. This decision was partly due to the infrastructure problems
in Lowestoft making travel to Great Yarmouth difficult and therefore
increasing the costs of providing services to the Oil and Gas sector in Great
Yarmouth. It is easier not to travel north of the river. I know many individuals
who are doing the same… money and businesses are moving out of the area
and infrastructure issues are a contributory factor behind this.
“Our customers simply do not want to face the traffic problems, and time
wasting issues that are involved with attempting to get from south Lowestoft
to north Lowestoft. I have spoken to many customers over the years who
consider shopping in Lowestoft as a last option behind Norwich and even
Beccles. Therefore, however much we spend on advertising and new
products and services, there is a huge percentage of potential customers who
will not want to travel, visit and shop with us, simply because of the traffic.

© Mouchel 2016 52
Traffic growth associated with regeneration and new development will
add to existing congestion problems, and may inhibit further economic
growth.
As previously noted, the need for regeneration in Lowestoft is so urgent that it
cannot be put off until a third crossing has been provided. Massive efforts are
being made to promote new development. Potential sites have been
identified in the Area Action Plan, whilst the inclusion of key sites in the
Enterprise Zone and the Simplified Planning Zone will be a further incentive
for these to be developed. Growth in the offshore energy sector will also lead
to development and increased use of the port. As this growth, welcome
though it is, occurs it will inevitably lead to additional traffic demand, including
journeys to and from work, business travel, deliveries and servicing traffic.
If a third crossing is not provided, this additional demand will result in
increased congestion at the two existing bridges and the routes leading to
them. Given the perceptions already existing that Lowestoft’s traffic
congestion is a hindrance to business and enterprise, there is a risk that
increased congestion will eventually inhibit growth and regeneration.
It will become more difficult to encourage sustainable travel to work.
The lack of a third crossing is even more of a problem for people walking and
cycling to work than it is for drivers, since these active modes depend on the
availability of short, safe convenient routes. As has been demonstrated, some
journeys between residential and commercial areas north and south of Lake
Lothing could be up to three times longer in distance without a new bridge. In
these circumstances it may be difficult to encourage more people to walk or
cycle to new or existing employment areas.
Severance between north and south Lowestoft will increase.
Travel between the north and south of Lowestoft is already not easy, but as
traffic and congestion increase it will become even more difficult without a
new crossing. Many people will, effectively, become less connected to places
of work and community facilities on the “other” side of the Lake. The sense of
separation between the town centre and the seafront will become more
apparent, with adverse implications for tourism and community coherence.
To summarise, if a third crossing is not provided, regeneration and growth in
Lowestoft will come at the price of increased congestion and community severance.
It will be hard for the town to shake off its image as a place characterised by
congestion and poor accessibility, and there is a real risk that these perceptions will
prevent the town from achieving its true potential for growth. In contrast to this,
providing first class infrastructure and tacking the problems of congestion and
severance with a bold new scheme will send a clear message that Lowestoft is

© Mouchel 2016 53
embracing the challenges of growth and development and ready to take full
advantages of the opportunities for regeneration.
2.7 Objectives
The overall aim of the proposed scheme is therefore:
To stimulate regeneration, sustain economic growth, and enhance
Lowestoft as a place to live and work in, and to visit.
The specific objectives of the scheme are:
To open up opportunities for regeneration and development in Lowestoft.
To provide the capacity needed to accommodate planned growth.
To reduce community severance between north and south Lowestoft.
To reduce congestion and delay on the existing bridges over Lake Lothing.
To reduce congestion in the town centre and improve accessibility.
To encourage more people to walk and cycle, and reduce conflict between
cycles, pedestrians and other traffic.
To improve bus journey times and reliability.
To reduce accidents.
The objectives relate closely to the policies, opportunities and problems described in
Sections 2.3, 2.4 and 2.5 above.
2.8 Measures for success
2.8.1 Causality
It is important to be able to demonstrate that the scheme, when complete, is
performing as expected and that it is delivering the strategic aims and objectives set
out in Section 2.7. In a complex world, it is often difficult to demonstrate ‘cause and
effect’, as there are many other factors (such as the state of the national economy)
which may affect the achievement of the objectives. The causal chain (logic) diagram
in Figure 2-22 shows how the proposed scheme is expected to deliver the
objectives, and also indicates how success can be measured, either directly or
indirectly.
2.8.2 Monitoring and Evaluation
A Monitoring and Evaluation Plan (described in Section 6.10) sets out in detail the
data which the Council will collect and analyse to determine whether the scheme is
achieving its objectives.

© Mouchel 2016 54
Figure 2-22: Causal chain diagram (logic map)
Lake Lothing Third Crossing, Lowestoft – Causal chain diagram and monitoring of key impacts and outcomes
Scheme Impacts Delivery of objectives Achievement of aims Monitoring
O U T C O M E S
BETTER ACCESS TO
JOBS
IMPROVED PERCEPTIONS
OF TOWN

© Mouchel 2016 55
2.9 Scope of the scheme
The scope of the scheme is the construction of a new bridge over Lake Lothing,
Lowestoft, linking the northern and southern halves of the town. The bridge will be a
7.3m wide single carriageway, with footways and an off-carriageway cycle lane. The
scheme includes alterations to existing junctions to form new at-grade roundabouts
at each end of the bridge. Accesses will be maintained to existing and planned
development north of Waveney road. The bridge will include a central lifting section
(Bascule Bridge) together with the necessary operating and control systems and
infrastructure. When lowered, the bridge will have a vertical clearance of 13.5m
above mean sea level.
The scheme is described in more detail in 1, Paragraph 1.4.
2.10 Constraints
This section considers the factors which could constrain the ability to deliver the
scheme, or which could affect the choice of options or the timescale. The following
types of ‘high level’ constraint are considered:
Physical constraints;
Environmental constraints;
Financial constraints;
Contractual constraints; and
Public acceptability constraints.
2.10.1 Physical constraints
The key physical constraints are:
Operation of the port. Lake Lothing is part of an operating port, and the new
crossing will be designed to accommodate this. The scheme needs to allow
continued access to existing docks by ships and vehicles. In particular, any
structure needs to be clear of the designated turning circle for large ships.
Bridge height and width of channel. A lifting bridge is proposed, so it will
not impose a constraint on the air draught of ships passing through it.
However, a potential advantage of a new bridge over the existing bridges is
that it could be high enough to allow smaller vessels to pass through it
without opening. A clearance in the centre of the channel of 12m above high
actual tide level has been adopted as a design objective. The channel width
under the existing Bascule Bridge is approximately 23.4m. A channel width of
25m has been adopted as a design objective, to future-proof the scheme.
Railway bridge. Any new bridge will require a clearance of 6m over the
railway tracks on the north side of Lake Lothing.
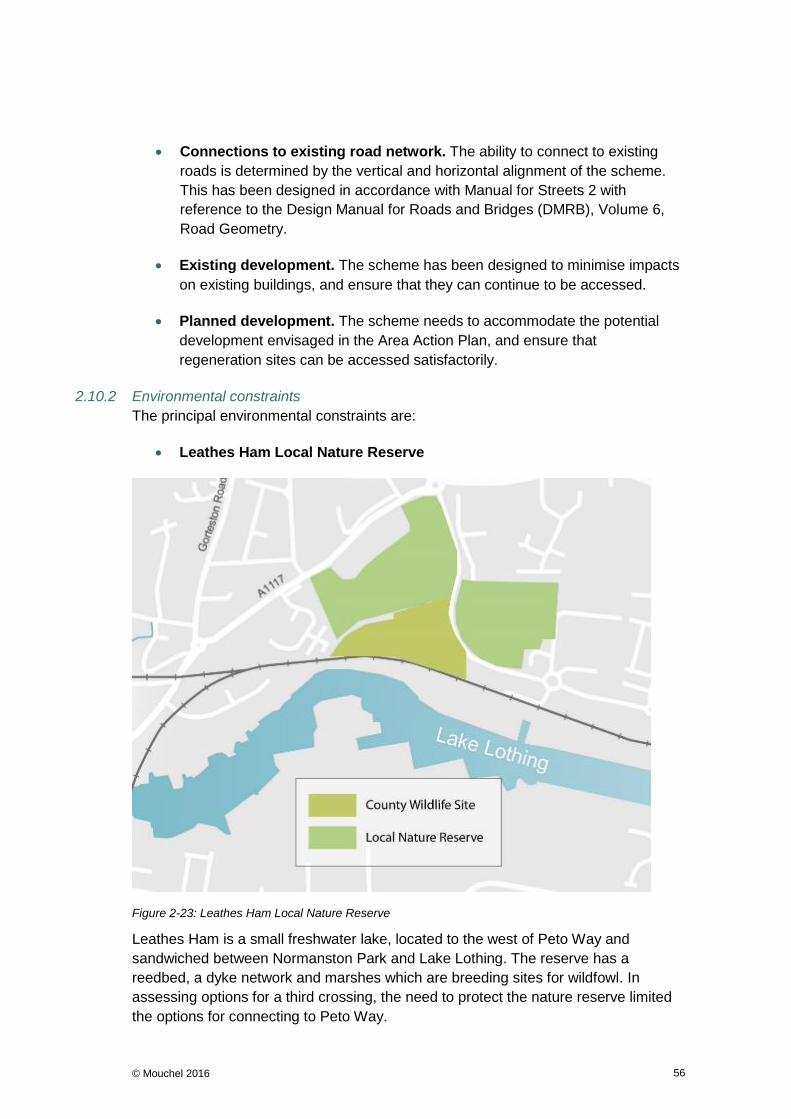
© Mouchel 2016 56
Connections to existing road network. The ability to connect to existing
roads is determined by the vertical and horizontal alignment of the scheme.
This has been designed in accordance with Manual for Streets 2 with
reference to the Design Manual for Roads and Bridges (DMRB), Volume 6,
Road Geometry.
Existing development. The scheme has been designed to minimise impacts
on existing buildings, and ensure that they can continue to be accessed.
Planned development. The scheme needs to accommodate the potential
development envisaged in the Area Action Plan, and ensure that
regeneration sites can be accessed satisfactorily.
2.10.2 Environmental constraints
The principal environmental constraints are:
Leathes Ham Local Nature Reserve
Figure 2-23: Leathes Ham Local Nature Reserve
Leathes Ham is a small freshwater lake, located to the west of Peto Way and
sandwiched between Normanston Park and Lake Lothing. The reserve has a
reedbed, a dyke network and marshes which are breeding sites for wildfowl. In
assessing options for a third crossing, the need to protect the nature reserve limited
the options for connecting to Peto Way.

© Mouchel 2016 57
Visual impact of a new bridge. A new bridge across Lake Lothing will be a
significant feature in its own right. In appraising options, and in developing the
preferred scheme, the potential visual impact on the townscape has been an
important consideration.
Flood risk. Lowestoft is subject to periodic flooding, both from the sea and
from the river. This needs to be taken account of in the design of the scheme,
and was a particular constraint on the tunnel alignments considered at the
Option Development stage.
Figure 2-24: Flood risk map
Historic environment. The proposed scheme does not affect the
conservation area or any listed buildings. The existing Bascule Bridge is
within the conservation area, whilst to the north, the main A12 route also
passes through the conservation area and close to a large number of listed
buildings. The proposed scheme is expected to reduce traffic in this part of
the conservation area.

© Mouchel 2016 58
Figure 2-25: Historic environment
2.10.3 Financial constraints
Details of the way the scheme is to be financed are given in the Financial and
Commercial Cases (Sections 4 and 5). Apart from the fact that the scheme requires
government funding, there are no financial constraints on its delivery. The scheme is
expected to be eligible for the new ‘Local Majors Fund’ and was referred to in the
Chancellor’s announcement of this new funding stream. More information on the
funding profile, including confirmation of the local contributions, is given in Section 4,
the Financial Case.
2.10.4 Contractual constraints
Details of the arrangements for delivery of the scheme are given in the Management
Case (Section 6). There are no particular constraints on its delivery.
2.10.5 Public acceptability constraints
There is strong public support for the provision of a third crossing of Lake Lothing.
However, a public consultation exercise in 2014 demonstrated that support was very
dependent on the location of a proposed third crossing.
In response to the question: “Do you think a new road crossing of Lake Lothing is
needed for Lowestoft, over 93% of people answered “yes”:

© Mouchel 2016 59
Response Percentage
Yes 93.71%
No 2.86%
No response 3.43%
Total 100.00%
But in response to a question about the location of a potential crossing, a clear
preference was stated for a “central” option:
Preferred location Percentage
West 23.9%
Central 60.6%
East (3 options) 8.3%
Other 4.4%
No response 2.8%
Total 100.00%
These results suggest that public acceptability is unlikely to be a constraint on the
scheme in principle, but that it would be difficult to gain public support for an
“eastern” option, especially if other options were available.
2.10.6 Summary of constraints
Physical constraints on the delivery of the scheme relate mainly to the need to
maintain port operations and provide for the save passage of shipping. The need to
provide clearance to the Lake and the adjacent railway line, whilst meeting standards
for vertical and horizontal alignment, constrain the ways in which a new crossing can
connect to the existing road network. Similarly, the alignment needs to minimise the
impact on existing and planned development. There are few major environmental
constraints, except for the Leathes Ham Local Nature Reserve, but care needs to be
taken to manage the visual impact of a large new structure within the town. There
are no significant contractual or financial constraints, apart from the need for
government financial support. There is strong public and stakeholder opinion support
for the scheme in principle, though this does not extend to all possible options.

© Mouchel 2016 60
2.11 Interdependencies
This section identifies factors on which the delivery of the scheme is dependent, or
which could affect (or be affected by) its delivery. These include:
Other transport proposals;
Major developments; and
Statutory processes.
2.11.1 Other transport proposals
There are no other transport proposals on which the scheme is considered to be
dependent, or which depend upon it. However the following scheme should be
noted:
Denmark Road improvement scheme
The Local Transport Plan includes a scheme to improve Denmark Road
between Rotterdam Road and Katwijk Way. Without a third crossing,
Denmark Road, a residential street, is the only direct route between the
Northern Spine Road (Peto Way) and the existing Bascule Bridge. The
scheme is not currently programmed and the need for this improvement will
be reviewed in the light of the proposal for a third crossing.
2.11.2 Major developments
There are no major developments on which the scheme is considered to be
dependent, or which depend completely upon it. However, congestion and the lack
of a third crossing are considered to be a constraint on development. The proposed
scheme will provide improved access to development sites around Lake Lothing
identified in the Area Action Plan and supports the ambitious plans for regeneration
in Lowestoft.
2.11.3 Statutory processes
Delivery of the scheme depends on the successful completion of statutory
processes. As the scheme needs to be delivered by 2020 (the timeframe set by the
government) the time limited aspects of the Development Consent Order (DCO)
process are the preferred means of delivering these.
A DCO is the means of obtaining permission for Nationally Significant Infrastructure
Projects (NSIPs), in of place of individual consents such as planning permission,
listed building consent and compulsory purchase orders. The process is set out in
more detail below:
1. Pre-application: The applicant has full responsibility for developing the
project. The development consent regime is a front-loaded process – the
proposal has to be fully scoped and refined before being submitted to the
Planning Inspectorate. It is at this stage that the applicant must formally
consult with all statutory bodies, community, local authority or affected

© Mouchel 2016 61
persons. There is very little scope for change once the application has been
submitted. The applicant will take into account all relevant responses
received during formal consultation. This stage is driven by the applicant.
2. Acceptance: At this stage, the application is fully submitted to the Planning
Inspectorate, who must decide within 28 days whether all relevant documents
have been submitted to enable the application to proceed. There is a 6-week
window for the applicant to challenge if acceptance is refused.
3. Pre-examination: The applicant must publicise that the Planning
Inspectorate has accepted the application and include when and how parties
can register to become involved as interested parties. A single Inspector or a
Panel of Inspectors will be appointed to examine the application. A
preliminary meeting will then be held to discuss procedural issues and the
timetable for examination. All interested parties will be notified of the date of
the preliminary meeting. The close of the meeting marks the close of the pre-
examination stage.
4. Examination: The examination begins the day after the preliminary meeting,
at which point the examining authority has 6 months to examine the
application. The examination is primarily conducted through written
representations, however, hearings can also be held.
5. Recommendation and Decision: During this time, the examining authority
has 3 months to write its recommendation and submit it to the relevant
Secretary of State, who has 3 months to make a decision about whether to
grant consent or not.
6. Post decision: This is a 6-week window in which the Secretary of State’s
decision may be challenged in the High Court.
This assumes that the Secretary of State will formerly designate the scheme as a
NSIP. This request for NSIP designation would be issued following confirmation that
the scheme should proceed to Full Business Case stage, this decision being likely
taken by the Government in the Summer Budget (April 2016). Should NSIP
designation not be forthcoming, a traditional approach to planning and obtaining
consent would be adopted.
In addition, Traffic Regulation Orders (TROs) will be required. TROs will be
processed in parallel with the DCO, as indicated in the project programme (see
Section 6, the Management Case). A Harbour Revision Order (HRO) may also be
required.
2.11.4 Summary of interdependencies
The scheme can be delivered independently of any other transport or major
development proposals. Statutory orders will be delivered by means of the DCO
process. The project programme allows for this, and the processing of TROs.

© Mouchel 2016 62
2.12 Stakeholders
This section identifies the main stakeholders who are affected by the proposed
scheme, or who are involved in some way with its delivery and the decision making
processes.
2.12.1 Stakeholders
The main stakeholders include:
Local authorities
Suffolk County Council (scheme promoter)
Waveney District Council
Adjacent Councils
Statutory bodies
The Environment Agency
Highways England
Transport operators
Associated British Ports (ABP)
Network Rail
Local Bus operators
Business organisations
Suffolk Chamber of Commerce
Lowestoft and Waveney Chamber of Commerce
Kirkley Business Association
Lowestoft Harbour Maritime Business Group
Lowestoft Vision
Other stakeholders
Centre for Environment, Aquaculture and Fisheries Science (CEFAS)
Other environmental groups
Individual local businesses, including maritime businesses
© Mouchel 2016 63
2.12.2 Engagement to date with local businesses
An extensive engagement exercise was undertaken with local businesses in
September 2015, involving an online survey and a business consultation event in
Lowestoft. 151 businesses responded to the online survey and 77 business people
attended the consultation events, representing a broad range of local businesses of
all sizes and from a variety of sectors.
A large majority of respondents reported that traffic causes “very significant
problems” to their business.
Businesses expected to see, on average, 23% growth in turnover in the next five
years if the scheme is provided, but only 5% if it is not provided. Businesses also
forecast average growth in employment of 8.1 full time equivalent posts if the
scheme is provided, but only 0.02% if it is not provided.
Even allowing for the subjectivity of this approach, it is clear from these results that
businesses believe a new crossing would bring very great economic benefits to their
organisations. The full results of the engagement, including individual comments
from respondents, are given in Appendix C.
Amongst the businesses surveyed, support for the provision of a third crossing was
nearly universal. The proposed scheme was the most popular of the various options
discussed, and was the first or second preference of over 90% of those responding.
2.12.3 Stakeholder engagement
A stakeholder management plan will be developed, as described in Section 6, the
Management Case.
Engagement with ABP will be critical to the successful delivery of the project.
Discussions have taken place during the option assessment phase, and regular
liaison will be scheduled throughout the design and implementation phases. This will
cover:
Access to docks during and after construction;
Impact on shipping during construction;
Future plans for the port; and
Operation of the bascule bridge.
2.13 Options
A comprehensive and robust process was adopted for generating and shortlisting
options for the scheme, leading to the selection of the preferred option. This is
described in detail in the Options Assessment (Appendix A) and summarised briefly
below.

© Mouchel 2016 64
2.13.1 Option generation (long list)
An initial long list of 15 options for a third crossing was compiled. This included a
number of options described in historic studies, together with additional options
generated by means of desktop studies, site observations and an options workshop.
The long list included bridge, tunnel, non-road and low-cost options, as summarised
below:
Type From (N) To (S) Notes
W1 Bascule bridge Peto Way Waveney Drive
W2 Bascule bridge Peto Way/Denmark Rd
Waveney Drive
W3 Bascule bridge Peto Way/Denmark Rd
Waveney Drive / Riverside Rd
C1 Bascule bridge Peto Way/Denmark Rd
Waveney Drive / A12 Horn Hill
Affects Kirkley Ham basin
C3 Bascule bridge Denmark Road Waveney Drive / A12 Horn Hill
Via Riverside Avenue
C4 Bascule bridge Denmark Road Waveney Drive / A12 Horn Hill
Via Riverside Avenue
E1 Bascule bridge Commercial Road Belvedere Road No railway bridge
E2 Bascule bridge Katwijk Way/Denmark Rd
Belvedere Road Relocate station
E3 Bascule bridge Katwijk Way Belvedere Road Bridge over station
E4 Bascule bridge Commercial Road Belvedere Road With railway bridge to Denmark Rd
L1 Lock / flood barrier with lifting bridges
Denmark Road Waveney Drive / A12 Horn Hill
Two bridges and lock
T1 Road tunnel Peto Way / Denmark Rd
Waveney Drive / A12 Horn Hill
Alternatives to be considered
J1 Junction improvements
A package of measures to increase capacity and improve traffic flow at problem junctions throughout Lowestoft without a third crossing.
As alternative to a third crossing.
S1 Smarter Choices A package of “Smarter Choices” measures, to encourage people to make fewer journeys by private car.
As alternative to a third crossing.
P1 Road pricing
Introduction of road pricing to discourage traffic from congested routes and encourage people to make fewer journeys by private car.
As an alternative to a third crossing.
Table 2-2: Long-listed options
Each long-listed option is illustrated and described in more detail in the Options
Assessment, Appendix A.
2.13.2 Options considered, but not included in the long list.
The following were excluded from the long list:
Fixed bridge options. A bridge high enough to remain open to both traffic
and shipping at all times would need 35m clearance. It would be visually

© Mouchel 2016 65
intrusive, expensive and very difficult to tie back into the existing roads due to
the levels involved.
Floating bridge options. A floating bridge would not be feasible for this
scheme because of the railway line on the north shore. It would not be
possible to achieve sufficient clearance over, or under, the tracks from a
bridge just above water level, and a level crossing would not be acceptable to
Network Rail.
Dual carriageway options. Lowestoft’s major road network has been
developed exclusively with new single carriageway roads (e.g. Northern
Spine Road, Southern Relief Road). A dual carriageway crossing was
excluded from the long list on the grounds of route consistency and cost.
2.13.3 Initial sifting
Having identified a long list of fifteen options, the next stage was to identify any
which do not represent realistic solutions. An initial sift was therefore undertaken to
identify any “showstoppers” which are sufficiently serious to rule an option out.
The initial sifting was undertaken in two stages. Firstly a subjective assessment was
made of each option against the scheme objectives set out in Section 2.7 above.
Each option is allocated to one of the following categories:
Significant contribution to achievement of objective Some contribution to achievement of objective
Minimal or no contribution to achievement of objective
The second stage of the initial sift then involved discarding any options which:
Did not achieve five or more scheme objectives (from first stage);
Did not fit with existing local or national strategies and priorities;
Would have significant adverse impacts (economic, environmental,
geographical or social);
Were considered not to be technically sound;
Were unlikely to be affordable; and
Were unlikely to be acceptable to stakeholders and the public.
This was undertaken as a desktop exercise, informed by site inspections, a technical
workshop and the findings of earlier studies. Full details of the initial sift are given in
the Options Assessment, Appendix A.
2.13.4 Short-listed options
Following the initial sift, a short list of three options was identified comprising:

© Mouchel 2016 66
A bascule bridge in the western corridor;
A bascule bridge in the central corridor; and
An immersed tube tunnel in the western corridor.
Full details of the three short-listed options are given in the Options Assessment,
Appendix A. Further investigation and design work was undertaken for each of the
short-listed options with the aim that each should represent the best available
scheme of its type in each corridor. This helps to ensure that the subsequent
assessment is as fair as possible.
In order to compare the three short-listed options and determine a preferred scheme,
a further appraisal was undertaken, based on assessment of the following issues:
Delivery of scheme objectives – updated from the initial assessment;
User benefits, calculated using the traffic model and TUBA;
Cost of construction, estimates based on advance design work ;
Benefit - cost ratio (BCR);
Traffic impacts – the effectiveness of each option in reducing traffic at the
two existing bridges, using the traffic model;
Environmental impacts;
Public support – based on earlier studies; and
Stakeholder support – based on the 2015 stakeholder consultation.
This was considered a proportionate approach in view of the information available at
this stage and will enable a clear distinction to be made between the three options.
Full details of the appraisal are set out in the Options Assessment, Appendix A. The
results are summarised below. An overall score is given for each assessment area,
based on a colour coded 5 point scale:
-2 -1 0 (neutral) +1 +2
This very simplified approach allows the differences between the three options to be
seen very clearly.

© Mouchel 2016 67
Assessment areas
Western bridge option
Central Bridge option
Tunnel option
Delivery of
scheme
objectives
Less relief to
existing
bridges
Significant
contribution
Less relief to
bridges, No
cycle /ped
provision
User benefits
(PVB) £338 .7 million £453.3 million £338.3 million
Cost (£ million) £85 million £79 million £118 million
Benefit-cost
ratio (BCR) 5.90 8.50 4.27
Traffic impacts
Bascule Bridge
Mutford Bridge
a.m. / p.m.
-15% / -13%
-30% / -22%
a.m./p.m.
-34% / -33%
-34% / -22%
a.m./p.m.
-15% / -15%
-31%/-26%
Environmental
impacts
Moderate/severe
adverse Slight/moderate
adverse Moderate/severe
adverse
Public support 23.9% 60.6% Unknown ?
Stakeholder
support 40% 48% Unknown ?
Table 2-3: Assessment of short-listed options
The estimated economic costs and benefits of each option shown above are based
on the interim traffic model and data available at the option assessment stage. They
exclude accident benefits and benefits arising from active mode appraisal, but these
are included in the assessment of the preferred option in the economic case.
Similarly, the design of the preferred option has been refined, and cost estimates
improved, as set out in Section 4, the Financial Case. For these reasons the
economic costs and benefits for the preferred scheme in the economic case are
different from the figures above which are based on similar levels of detail for each
option, as appropriate for comparing the different options.
2.13.5 Preferred scheme
On the basis of the above assessment, it was concluded that the Central Bridge
option should be the preferred scheme. It is the least expensive, it produces the
highest benefits, is most likely to deliver the objectives, and has a high level of public
and business support.
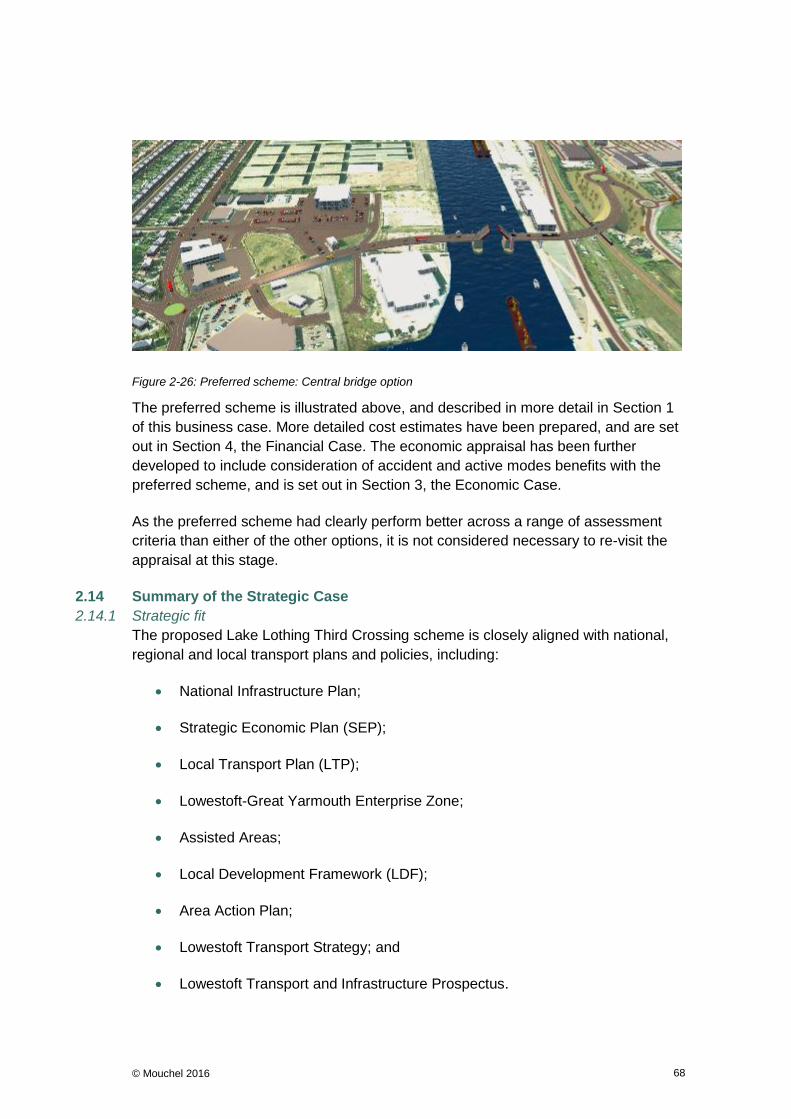
© Mouchel 2016 68
Figure 2-26: Preferred scheme: Central bridge option
The preferred scheme is illustrated above, and described in more detail in Section 1
of this business case. More detailed cost estimates have been prepared, and are set
out in Section 4, the Financial Case. The economic appraisal has been further
developed to include consideration of accident and active modes benefits with the
preferred scheme, and is set out in Section 3, the Economic Case.
As the preferred scheme had clearly perform better across a range of assessment
criteria than either of the other options, it is not considered necessary to re-visit the
appraisal at this stage.
2.14 Summary of the Strategic Case
2.14.1 Strategic fit
The proposed Lake Lothing Third Crossing scheme is closely aligned with national,
regional and local transport plans and policies, including:
National Infrastructure Plan;
Strategic Economic Plan (SEP);
Local Transport Plan (LTP);
Lowestoft-Great Yarmouth Enterprise Zone;
Assisted Areas;
Local Development Framework (LDF);
Area Action Plan;
Lowestoft Transport Strategy; and
Lowestoft Transport and Infrastructure Prospectus.

© Mouchel 2016 69
Together, these set out a bold vision for economic growth and regeneration in
Lowestoft, with a specific focus on the area around Lake Lothing. The proposed third
crossing is part of that vision. By addressing Lowestoft’s reputation for chronic
congestion, it will help to attract more inward investment, and support and stimulate
growth.
2.14.2 Development plans
The Area Action Plan identifies the specific site allocations within the area which
need to be developed to realise the regeneration and revitalisation of the Lake
Lothing and Outer Harbour area. The third crossing will improve access to key areas,
including Kirkley Waterfront and the proposed Sustainable Urban Neighbourhood.
2.14.3 Problems
The main problems which have led to the proposed scheme being developed are:
The loss of traditional industries and employment.
Difficulty accessing potential regeneration sites.
Community severance.
Congestion.
Barriers to walking and cycling and gaps in local cycling and pedestrian
networks
Difficulties for local bus services
Accidents.
If a third crossing is not provided, these problems are expected to get worse.
Regeneration and growth in Lowestoft will come at the price of increased congestion
and community severance. It will be hard for the town to shake off its image as a
place characterised by congestion and poor accessibility, and there is a real risk that
these perceptions will prevent the town from achieving its true potential for growth.
In contrast to this, tacking the problems of congestion and severance with a bold
new scheme will send a clear message that Lowestoft is embracing the challenges
of regeneration and growth.
2.14.4 Aims and objectives
The overall aim of the proposed scheme is therefore:
To stimulate regeneration, sustain economic growth, and enhance Lowestoft
as a place to live and work in, and to visit.
The specific objectives of the scheme are:

© Mouchel 2016 70
To open up opportunities for regeneration and development in Lowestoft.
To provide the capacity needed to accommodate planned growth.
To reduce community severance between north and south Lowestoft.
To reduce congestion and delay on the existing bridges over Lake Lothing.
To reduce congestion in the town centre and improve accessibility.
To encourage more people to walk and cycle, and reduce conflict between
cycles, pedestrians and other traffic.
To improve bus journey times and reliability.
To reduce accidents.
2.14.5 Constraints
In developing the scheme, account has been taken of physical, environmental,
financial, contractual and public acceptability constraints, especially the need to fit in
with the operation of the port.
2.14.6 Support for the scheme
There is very strong public support for a scheme, with over 93% of people believing
that a new crossing is needed. Local businesses consider that the scheme will
stimulate increased turnover and higher levels of employment.
2.14.7 Option selection and preferred scheme
A comprehensive and robust option selection process was adopted to generate and
assess options for the scheme, leading to the clear identification of a preferred
option. The preferred scheme was the Central Bridge option. It is the least expensive
of the short-listed options, it produces the highest benefits, it is most likely to deliver
the objectives, and it has a high level of public and business support.

© Mouchel 2016 71
3 The Economic Case
3.1 Introduction
The Economic Case identifies and assesses all the impacts of the scheme to
determine its overall value for money. It takes account of the costs of developing,
building, operating and maintaining the scheme, and a full range of its impacts.
These include those impacts which can be monetised, as well as quantitative and
qualitative impacts that cannot be monetised. The economic case considers the
extent to which the scheme’s benefits will outweigh its costs.
This section covers:
Options appraised;
Overview of methodology and assumptions;
Scheme costs;
Transport economic efficiency (TEE);
Safety impacts;
Active modes impacts;
Reliability benefits;
Wider impacts;
Social and distributional impacts;
Environmental impacts;
Value for money statement;
Sensitivity testing;
Appraisal Summary Table (AST); and
Summary and conclusion.
3.2 Options appraised
A comprehensive and robust process was adopted for the generation and short-
listing of options for the scheme. This is described in Appendix A (Options
Assessment) and summarised in the Strategic Case.

© Mouchel 2016 72
An initial long list of 15 options was compiled. These were assessed against the
scheme objectives, to give a short-list of three options, which were subsequently
refined and assessed in more detail. The short-listed options were:
Western Bridge option;
Central Bridge option; and
Tunnel option.
The appraisal of the short-listed options is described in Appendix A (Options
Assessment) and summarised in the Strategic Case. A simplified cost-benefit
analysis was undertaken. Based on this, and other criteria, the Central Bridge option
clearly emerged as the preferred option.
The more detailed appraisal described in this section therefore concerns the
preferred route only, as described in Section 0. This comprises a new road linking
Denmark Road (west of Katwijk Way) to Riverside Road and Waveney Drive. It
includes a new bridge over the railway, a bascule bridge over the main channel of
Lake Lothing and connections to local roads, cycle ways and footways.
3.3 Overview of methodology and assumptions
3.3.1 Methodology
The economic assessment of the scheme has been undertaken in accordance with
current WebTAG guidance, including:
TAG Unit A1 cost-benefit analysis;
TAG Unit A2 economic impacts;
TAG Unit A4 social and distributional impacts; and
TAG Unit A5-1 Active Mode Appraisal.
The methodology is based on the DfT Value for Money Note (December, 2013) and
follows the process described in the Appraisal Specification Report (ASR). The basic
steps are described below and illustrated in Figure 3-1.
The present value of cost (PVC) is calculated using the discounted whole life costs
of the scheme.
TUBA (Transport User Benefit Analysis) is used to calculate the user benefits due to
time and vehicle operating cost savings resulting from the scheme. COBALT (Cost
and Benefit to Accidents – Light Touch) is used to assess benefits arising from
changes in accidents with the scheme. An active mode appraisal is undertaken to
determine the economic benefits of increases in active travel resulting from the
scheme.

© Mouchel 2016 73
An initial benefit-cost ratio (BCR) is calculated. Other monetarised benefits –
reliability and wider impacts – are then taken into consideration, producing an
adjusted present value of benefit (PVB), which is used to calculate a final adjusted
BCR and value for money category.
Other impacts which are not capable of being fully monetarised – social and
distributional impacts and environmental impacts – are then assessed using the
qualitative assessment techniques referred to in the DfT Value for Money note
(December, 2013). These are not included in the BCR, but are used, together with
the final BCR, to determine a final value for money category for the scheme.
Many of the impacts assessed are based on outputs from the Lowestoft Highway
Assignment Model. The SATURN model has been developed and used as outlined
in the Appraisal Specification Report. The development of the model is described in
the Data Collection Report (Appendix D), Local Model Validation Report (Appendix
E) and the Forecasting Report (Appendix F).
Figure 3-1: Summary of calculation of BCR and VfM score
3.3.2 Assumptions
The full list of assumptions related to model development and forecasting are set out
in the LMVR and Forecasting Report. Key assumptions are summarised below:
The modelled assessment years are:
Calculate Present Value of Costs
(PVC)
Calculate initial Present Value of Benefits (PVBi)
Calculate Present Value of Costs
(PVC)
Calculate adjusted Present Value of Benefits (PVBa)
Calculate initial Benefit Cost Ratio
(BCRi)
Conventional benefits: user, accident
Active Mode benefits
Reliability benefits; Wider Impacts (WITA)
Calculate adjusted Benefit Cost Ratio
(BCRa)
Qualitative / non-monetised Impacts
Social and Distributional ImpactsEnvironmental impacts
Final Value for Money category

© Mouchel 2016 74
Base year (2015); and
Opening year (2020).
The modelled time periods are:
AM peak (08:00 – 09:00);
Average interpeak (10:00 – 16:00); and
PM peak (17:00 – 18:00).
This is consistent with advice presented in Section 2.5 of TAG Unit M3.1 (January
2014).
The following user classes are modelled:
UC1: Car – Commuting;
UC2: Car – Employer’s Business;
UC3: Car – Other;
UC4: LGV; and
UC5: HGV.
The following assumptions were made in relation to the modelling of the bridges
within the SATURN highway assignment model:
The proposed new bridge will open at the same frequency as the existing
bascule bridge23; and
The frequency of bridge openings will not increase in the future24.
23 This is a ‘worst case’ assumption. As the new bridge will be higher than the existing
bascule bridge, enabling smaller vessels to pass under it, the frequency of opening will be significantly less. Furthermore, the position of the new bridge is to the west of the ship turning circle in Lake Lothing. This would result in the new bridge opening less often than the existing Bascule Bridge which is at the mouth of the inner harbour. 24
This also offers a conservative estimate / assumption in terms of the benefits of an additional bridge. The recently announced Galloper and East Anglia ONE investment and proposed re-occupation of port buildings, along with other potential investment, will increase the number of bridge openings required. Port traffic is expected to treble in the Inner Harbour over the medium to long term.

© Mouchel 2016 75
Additional ship monitoring and analysis of opening times, together with a boat
simulation, will be undertaken as part of the Full Business Case, and bridge opening
times will be adjusted accordingly in the model, which is expected to enhance the
scheme benefits.
3.4 Costs
3.4.1 Scheme preparation and construction
The cost of the proposed scheme has been estimated at 2015 (Q4) prices, as set out
in detail in Section 4, the Financial Case. It includes all costs associated with
scheme preparation and construction.
Q4 2015 prices,
including QRA
Costs (£M)
15/16 16/17 17/18 18/19 19/20 20/21 TOTAL
Scheme preparation 1.495 3.184 0.974 0.325 0.325 0.195 4.061
Cost of construction 0 0 2.031 14.214 16.245 8.122 40.612
TOTAL excluding QRA 1.495 5.202 5.023 16.976 16.976 9.129 54.801
Quantified risk (QRA) 0.697 2.425 2.342 7.913 7.913 4.256 25.546
Risk adjusted TOTAL 2.191 7.627 7.365 24.889 24.889 13.385 80.347
Table 3-1: Scheme preparation and construction costs (Q4 2015 prices)
The above costs include an allowance for risk, in the form of a quantified risk
assessment (QRA). This is presented in Section 6, the Management Case. For the
purposes of the Economic Assessment, these costs have been adjusted to 2010
prices using WebTAG data book values as set out below:
2010 2011 2012 2013 2014 2015 2016
Increase on 2010 100.00 102.31 103.45 105.23 107.65 109.37 111.34
Table 3-2: Adjustment to 2010 prices
3.4.2 Maintenance and renewal
The estimated cost of maintenance, renewals and bridge operation have been
estimated, as set out below. For the purposes of the economic assessment, these
cost estimates have been adjusted to 2010 prices.
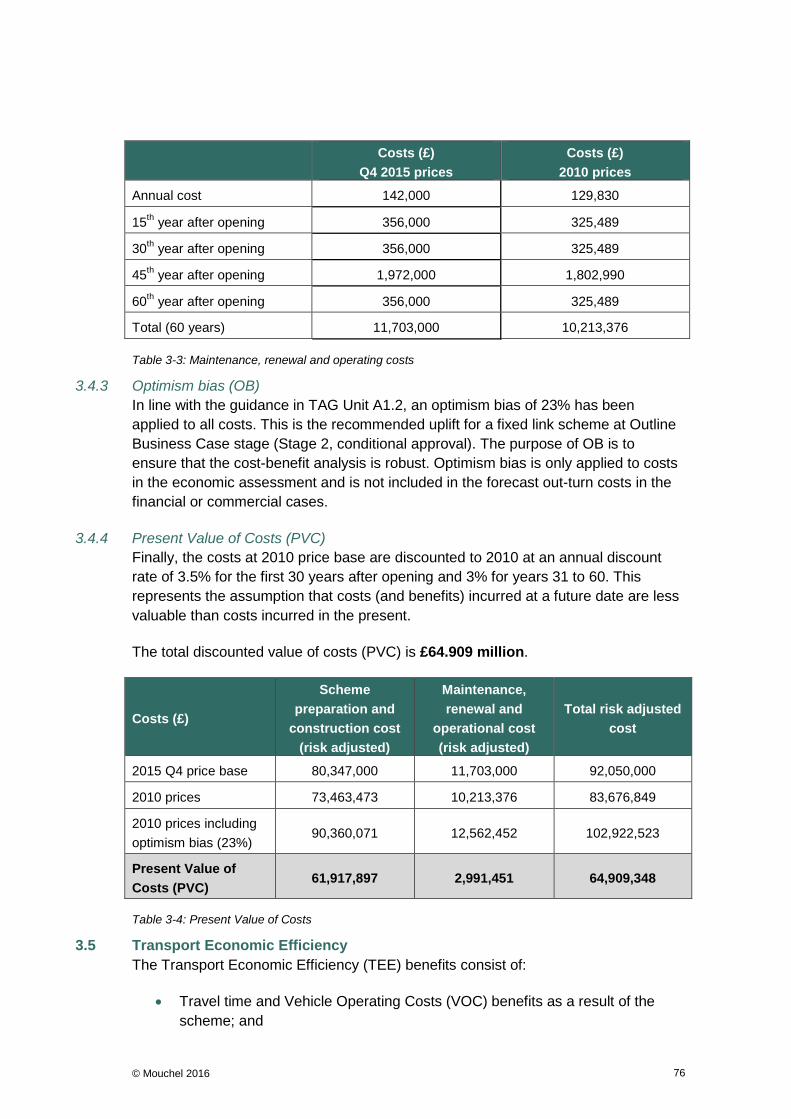
© Mouchel 2016 76
Costs (£)
Q4 2015 prices
Costs (£)
2010 prices
Annual cost 142,000 129,830
15th year after opening 356,000 325,489
30th year after opening 356,000 325,489
45th year after opening 1,972,000 1,802,990
60th year after opening 356,000 325,489
Total (60 years) 11,703,000 10,213,376
Table 3-3: Maintenance, renewal and operating costs
3.4.3 Optimism bias (OB)
In line with the guidance in TAG Unit A1.2, an optimism bias of 23% has been
applied to all costs. This is the recommended uplift for a fixed link scheme at Outline
Business Case stage (Stage 2, conditional approval). The purpose of OB is to
ensure that the cost-benefit analysis is robust. Optimism bias is only applied to costs
in the economic assessment and is not included in the forecast out-turn costs in the
financial or commercial cases.
3.4.4 Present Value of Costs (PVC)
Finally, the costs at 2010 price base are discounted to 2010 at an annual discount
rate of 3.5% for the first 30 years after opening and 3% for years 31 to 60. This
represents the assumption that costs (and benefits) incurred at a future date are less
valuable than costs incurred in the present.
The total discounted value of costs (PVC) is £64.909 million.
Costs (£)
Scheme
preparation and
construction cost
(risk adjusted)
Maintenance,
renewal and
operational cost
(risk adjusted)
Total risk adjusted
cost
2015 Q4 price base 80,347,000 11,703,000 92,050,000
2010 prices 73,463,473 10,213,376 83,676,849
2010 prices including
optimism bias (23%) 90,360,071 12,562,452 102,922,523
Present Value of
Costs (PVC) 61,917,897 2,991,451 64,909,348
Table 3-4: Present Value of Costs
3.5 Transport Economic Efficiency
The Transport Economic Efficiency (TEE) benefits consist of:
Travel time and Vehicle Operating Costs (VOC) benefits as a result of the
scheme; and

© Mouchel 2016 77
Travel time and Vehicle Operating Costs (VOC) benefits as a result of
maintenance activities.
Travel time and Vehicle Operating Costs (VOC) disbenefits as a result of
construction activities will be assessed and included in the Full Business Case.
User benefits have been assessed using the DfT’s Transport Users Benefit Appraisal
(TUBA) software, an industry-standard method of assessing economic benefits from
transport schemes, in accordance with guidelines set out in WebTAG Unit A1. TUBA
calculates the benefits related to journey time savings, vehicle operating cost
savings, carbon emissions and fuel tax revenue. The current version of TUBA is
1.9.5, which includes the latest parameter values as published in the WebTAG
databook (November 2014).
Annualisation factors for the three modelled time periods were based on values
obtained from local traffic survey data. Scheme appraisal was undertaken for a 60-
year period from opening, in accordance with HM Treasury’s Green Book.
The results of the TUBA assessments, used to create the Transport Economic
Efficiency Table (TEE) are presented below. The total transport economic efficiency
benefit is £427.915 million. The TEE, PA and AMCB tables are included within
Appendix G.
Benefits
Consumer – commuting user
benefits
Travel time £48,158,000
Vehicle operating costs £2,925,000
Subtotal £51,082,000
Consumer – other user benefits
Travel time £143,324,000
Vehicle operating costs £11,298,000
Subtotal £154,622,000
Business benefits
Travel time £207,343,000
Vehicle operating costs £14,868,000
Subtotal £222,211,000
Total TEE benefit £427,915,000
Table 3-5: Transport User Benefits
An appraisal of Transport User Benefits are described in more detail in Transport
User Benefits report (Appendix H).
This report sets out the appraisal of user benefits undertaken using the DfT’s TUBA
software.
The benefits by time period are also summarised in Table 3-6 below:

© Mouchel 2016 78
Time Period Benefits
AM peak £65,257,000
PM peak £87,969,000
Inter peak £212,539,000
Off peak £17,530,000
Weekend £34,072,000
Table 3-6: TUBA benefits by time period
A number of sensitivity tests were performed on the TUBA results. These are
described in Section 3.14 below.
3.6 Safety Benefits
The assessment of scheme safety benefits was undertaken using COBALT (Cost
Benefit Analysis Light Touch), the DfT’s cost-benefit analysis software for accident
savings. The appraisal used the latest COBALT parameter file 2014.3 (released 10th
November 2014).
COBALT assesses the safety aspects of road schemes using detailed inputs of
either (a) separate road links and road junctions that would be impacted by the
scheme; or (b) combined links and junctions. For the Lake Lothing Third Crossing
scheme combined links and junctions were assessed. As COBALT does not accept
links with a 20mph speed limit, a speed of 30mph was assigned to links in both the
Do Minimum and Do Something networks which were below this threshold.
Five year accident data was obtained for Lowestoft between 1st January 2010 and
30th December 2014. COBALT default accident rates were used across the COBALT
network except for links within Lowestoft for which the actual observed accidents
were applied.
The assessment was based on a comparison of accidents by severity using Without-
Scheme’ and ‘With-Scheme’ forecasts from the SATURN model using details of link
characteristics, relevant accident rates and costs and forecast traffic volumes by link.
The COBALT assessment was undertaken to assess the scheme over a 60 year
period (2020 to 2080) with an opening year of 2020 and design year of 2035.
The COBALT analysis estimates that 289 accidents will be saved by 2080 as a result
of the scheme, as shown in the following table:
‘Without’ Scheme
Accidents
‘With’ Scheme
Accidents
Reduction in
accidents
Accidents in 60 years 29,177 28,888 289
Table 3-7: Accident Savings over 60 years
COBALT also provides a summary of the number of casualties saved as a result of
the scheme, as shown in the following table.
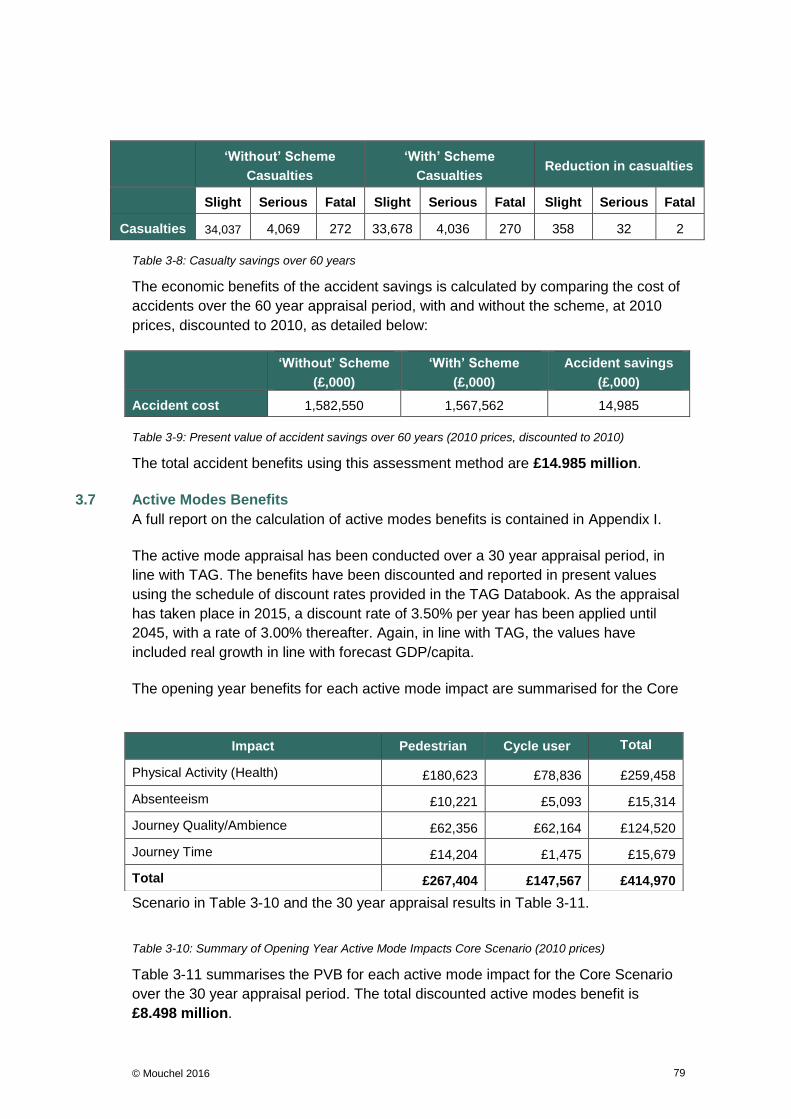
© Mouchel 2016 79
‘Without’ Scheme
Casualties
‘With’ Scheme
Casualties Reduction in casualties
Slight Serious Fatal Slight Serious Fatal Slight Serious Fatal
Casualties 34,037 4,069 272 33,678 4,036 270 358 32 2
Table 3-8: Casualty savings over 60 years
The economic benefits of the accident savings is calculated by comparing the cost of
accidents over the 60 year appraisal period, with and without the scheme, at 2010
prices, discounted to 2010, as detailed below:
‘Without’ Scheme
(£,000)
‘With’ Scheme
(£,000)
Accident savings
(£,000)
Accident cost 1,582,550 1,567,562 14,985
Table 3-9: Present value of accident savings over 60 years (2010 prices, discounted to 2010)
The total accident benefits using this assessment method are £14.985 million.
3.7 Active Modes Benefits
A full report on the calculation of active modes benefits is contained in Appendix I.
The active mode appraisal has been conducted over a 30 year appraisal period, in
line with TAG. The benefits have been discounted and reported in present values
using the schedule of discount rates provided in the TAG Databook. As the appraisal
has taken place in 2015, a discount rate of 3.50% per year has been applied until
2045, with a rate of 3.00% thereafter. Again, in line with TAG, the values have
included real growth in line with forecast GDP/capita.
The opening year benefits for each active mode impact are summarised for the Core
Scenario in Table 3-10 and the 30 year appraisal results in Table 3-11.
Table 3-10: Summary of Opening Year Active Mode Impacts Core Scenario (2010 prices)
Table 3-11 summarises the PVB for each active mode impact for the Core Scenario
over the 30 year appraisal period. The total discounted active modes benefit is
£8.498 million.
Impact Pedestrian Cycle user Total
Physical Activity (Health) £180,623 £78,836 £259,458
Absenteeism £10,221 £5,093 £15,314
Journey Quality/Ambience £62,356 £62,164 £124,520
Journey Time £14,204 £1,475 £15,679
Total £267,404 £147,567 £414,970

© Mouchel 2016 80
Impact Pedestrian Cycle user Total
Physical Activity (Health) £3,699,115 £1,614,533 £5,313,648
Absenteeism £209,319 £104,300 £313,620
Journey Quality / Ambience £1,277,032 £1,273,103 £2,550,135
Journey Time £290,894 £30,199 £321,093
Total £5,476,361 £3,022,135 £8,498,496
Table 3-11: Summary of Active Mode Impacts over 30Yr Appraisal Period (2010 prices and value)
3.8 Reliability benefits
A full report on the calculation of reliability benefits is contained in Appendix J.
Reliability has been assessed in line with WebTAG Unit A1.3, Section 6.3 (Reliability
– urban roads) using the following relationships, based on calculation of the standard
deviation of journey times from journey time and distance for each O-D (origin-
destination) pair:
Reliability benefit = −∑∆𝜎𝑖𝑗 (𝑇𝑖𝑗2+𝑇𝑖𝑗
1
2) × 0.8 × 𝑉𝑂𝑇
Where: ∆𝜎𝑖𝑗 = 0.0018((𝑡𝑖𝑗2 )
2.02− (𝑡𝑖𝑗
1 )2.02
)𝑑𝑖𝑗−1.41
VOT = value of time (£/sec)
T = number of trips (1 = before improvement, 2 = after improvement)
t = journey time (s) (1 = before improvement, 2 = after improvement)
d = distance (km)
i,j = subscript denoting quantity from zone I to zone j
The results from the reliability assessment are summarised below:
The benefit calculated for the year 2020 is £1.46 million. Applying a discount
rate of 3.5% this value is equivalent to £1.03 million in 2010 prices;
The benefit calculated for the year 2035 is £4.9 million. With a discount rate
of 3.5% this value is equivalent to £2.07 million in 2010. For the calculation of
benefits, a linear trend between 2020 and 2035 is assumed, which is then flat
thereafter; and
The total benefit calculated for the 60 years (2020-2079) is equal to £79.75
million (2010 prices), using a discount rate of 3.5% from 2010 to 2049 and
3.0% from 2050 onwards.
© Mouchel 2016 81
3.9 Wider Impacts (WITA)
An assessment had been made of wider transport impacts, using the WITA software
referred to in the Wider Impacts section of the DfT Value for Money Note (December,
2013). The WITA assessment indicated very high transport benefits of £421 million.
However, this value is not considered plausible, with WITA benefits typically
accounting for up to 10-20% of the Transport User Benefits. Additionally, the WITA
software is not currently supported by the provider, restricting the ability for more
detailed investigation and testing, but the software will be supported in the New Year
(2016). These benefits have therefore not been included within adjusted BCR
calculation (as they are not required to demonstrate high value for money). They will
however be further interrogated and assessed within the Full Business Case, should
the scheme proceed through the Conditional Approval gateway.
3.10 Social and Distributional Impacts
Of the Social and Distributional Impact analysis that can be undertaken, as set out in
TAG Unit A4-1 and A4-2, only User Benefits and Accident analysis has been
undertaken at this Outline Business Case stage. This is partly because the
quantitative environmental analysis required for noise and air quality has not yet
been undertaken (and will be undertake during the production of the Full Business
Case). In addition a number of the impacts which can be assessed, such as
severance, physical activity, accessibility, have already been accounted for (and
benefits taken) in the active mode analysis. As such they have not been included
here so as not to “double count” these benefits.
3.10.1 Distributional analysis of user benefits
Income is unevenly distributed in Lowestoft, with the most deprived areas being in
the east of the town, around Lake Lothing and the outer harbour, with higher
incomes in other areas. This means that different income groups may experience the
benefits of the scheme differently.
The distribution of income between the modelled zones, using data from the Index of
Multiple Deprivation25 is illustrated below:
25 https://www.gov.uk/government/statistics/english-indices-of-deprivation-2015

© Mouchel 2016 82
Figure 3-2: Model zones categorised by income quintiles
The distribution of user benefits between different income groups is analysed in the
tables below.

© Mouchel 2016 83
User Benefits (£M) - Distributional Analysis - AM
IMD Income Domains - Quintiles (£M)
Q1 Q2 Q3 Q4 Q5
Benefits/ Disbenefits (0% < 20%)
(20% < 40%)
(40% < 60%)
(60% < 80%)
(80% < 100%)
Total
Total User Benefits 6.25 11.43 2.94 2.63 1.62 24.86
Total User Disbenefits 0.00 -0.12 0.00 0.00 -0.01 -0.13
Net User Benefit 6.25 11.31 2.94 2.63 1.61 24.73
Net User Disbenefit 0.00 0.00 0.00 0.00 0.00 0.00
Share of Net User Benefits 25% 46% 12% 11% 6% 100%
Share of Net User Disbenefits 0% 0% 0% 0% 0% 0%
Share of Population 22.0% 35.1% 16.2% 17.1% 9.6% 100.0%
Assessment
Table 3-12: Distributional Analysis for Users Benefits -AM period
User Benefits (£M) - Distributional Analysis - IP
IMD Income Domains - Quintiles (£M)
Q1 Q2 Q3 Q4 Q5
Benefits/ Disbenefits (0% < 20%)
(20% < 40%)
(40% < 60%)
(60% < 80%)
(80% < 100%)
Total
Total User Benefits 12.36 14.39 4.56 3.21 1.65 36.17
Total User Disbenefits 0.00 0.00 0.00 0.00 0.00 0.00
Net User Benefit 12.36 14.39 4.56 3.21 1.65 36.17
Net User Disbenefit 0.00 0.00 0.00 0.00 0.00 0.00
Share of Net User Benefits 34% 40% 13% 9% 5% 100%
Share of Net User Disbenefits 0% 0% 0% 0% 0% 0%
Share of Population 22.0% 35.1% 16.2% 17.1% 9.6% 100.0%
Assessment
Table 3-13: Distributional Analysis for Users Benefits -IP period
User Benefits (£M) - Distributional Analysis - PM
IMD Income Domains - Quintiles
Q1 Q2 Q3 Q4 Q5
(0% < 20%)
(20% < 40%)
(40% < 60%)
(60% < 80%)
(80% < 100%)
Total
Total User Benefits 31.02 33.03 8.13 6.00 4.01 82.19
Total User Disbenefits 0.00 0.00 0.00 0.00 0.00 0.00
Net User Benefit 31.02 33.03 8.13 6.00 4.01 82.19
Net User Disbenefit 0.00 0.00 0.00 0.00 0.00 0.00
Share of Net User Benefits 38% 40% 10% 7% 5% 100%
Share of Net User Disbenefits 0% 0% 0% 0% 0% 0%
Share of Population 22.0% 35.1% 16.2% 17.1% 9.6% 100.0%
Assessment
Table 3-14: Distributional Analysis for Users Benefits -PM period

© Mouchel 2016 84
The user benefits are mainly distributed among the quintiles 1 and 2 (being Q1 the
most deprived) which represents around 57% of the population in the considered
area of analysis. This pattern is consistent across the AM, IP and PM periods of
travel demand. The distributional impact shows that the scheme mainly benefits the
less well-off sectors of the local population.
3.10.2 Distributional analysis of accident benefits
The distribution of accident benefits was also investigated using the guidance set out
within TAG Unit 4-2.
As shown in Table 3-15, none of the links identified in the analysis area have more
than 50 casualties in a period of 5 years (2010-2014). Therefore, a detailed analysis
is not required by WebTAG. A summary of existing data by age and mode of
transport is provided below.
Description No of Casualties
A1117 42
A1144 15
A1145 4
A12 47
A146 8
B roads 6
C roads 14
Local roads (145 links) 50
Total 186
Table 3-15: Description of Screened Lowestoft links and number of casualties
The distribution of road accident casualties by age group and mode of transport is
shown in the tables below:
Group Total % in Lowestoft analysis area (2010-2014)
% in accidents (national average)
Children (under 16 years old) 22 12% 9%
Young People (16-24) 60 32% 25%
Older People (65+) 10 5% 9%
Other ages 94 51% 58%
Total 186 100% 100%
Table 3-16: Casualties by age group

© Mouchel 2016 85
Group Total % in Lowestoft analysis area (2010-2014)
% in accidents (national average)
Pedestrian 23 12% 13%
Cyclist 39 21% 11%
Motorcycle 20 11% 10%
Other (Inc. car drivers, passengers) 104 56% 66%
Total 186 100% 100%
Table 3-17: Casualties by mode
These values are based on existing road data, and show that the proportion of the
vulnerable group casualties on the affected links is higher in comparison with the
national average for some categories.
3.11 Environmental Impacts
This section summarises the expected impacts of the proposed scheme on the
environment.
The impacts are discussed in more detail in the Environmental Options Appraisal
Report (Appendix K). This was prepared to inform the appraisal of short listed
options, as described in the Options Appraisal (Appendix A), and – for the avoidance
of doubt – the Central (C11) option in those reports equates to the proposed
scheme.
At this stage, the only impacts to have been monetarised are greenhouse gas
emissions, which are extracted from the TUBA analysis.
The Environmental Appraisal of the proposed scheme will be updated for the full
business case, and will include fully quantified and monetarised assessments where
required by WebTAG.
The assessed environmental impacts are:
Noise;
Air quality;
Greenhouse gases;
Townscape;
Historic environment;

© Mouchel 2016 86
Biodiversity; and
Water environment.
3.11.1 Noise
The noise impacts depend on the number of dwellings and other sensitive receptors
(e.g. education, health and community facilities, and noise important areas identified
by Defra) close to the scheme, and on changes in the volume of traffic on the local
road network as a result of the scheme. These are detailed in Table 3-18 below:
Banding Zones
0-50m 50-100m 100-200m 200-300m
Dwellings 54 162 446 887
Sensitive receptors 2 3 3 4
Defra noise important areas 0 0 0 0
Table 3-18: Noise sensitive receptors.
The noise impacts of traffic flow changes have not been quantified at this stage.
In general, the proposed scheme will relieve congestion on the wider Lowestoft road
network, and this will lead to a reduction in noise impacts on many existing roads.
However traffic flow will increase on some roads in the vicinity of the scheme (e.g.
Peto Way and Tom Crisp Way) which could increase noise levels for adjacent
receptors.
At this stage, an overall assessment of Slight Adverse has been given, as there will
be noise impacts on sensitive receptors close to the scheme. This may change when
the noise impact on the wider network has been quantified. It may also change as a
result of measures to mitigate noise impact, as the design is developed.
3.11.2 Air quality
The air quality impacts depend upon changes in traffic flows, composition, speeds
and distance travelled as a result of the scheme.
Emissions of oxides of Nitrogen (NOx) and particulates with an aerodynamic
diameter of 10µm or less (PM10) are of particular concern in urban areas.
Sensitive receptors for air quality include:
Residential dwellings;
Designated ecological sites;
Nurseries and care homes;
Hospitals; and

© Mouchel 2016 87
Schools.
A high level, qualitative review of potential air quality impacts of the scheme has
been undertaken, based on initial traffic forecasts for the opening year (2020). Links
with a forecast change in daily traffic changes in traffic flow of 1,000 or more were
identified, and the number of sensitive properties counted.
AADT change Air quality impacts
Number of links Number of Receptors within 200m
Increase >1,000 13 8,532
Decrease >1,000 48 13,236
+/- <1,000 170 60,866
Total 231 82,634
Table 3-19: Air quality impacts
More receptors experience a reduction in traffic than an increase as a result of the
scheme. At this stage, however, an overall assessment of neutral has been given. A
more detailed appraisal will be undertaken, and the assessment category reviewed
for the Full Business Case.
3.11.3 Greenhouse gases
Greenhouse gas impacts depend upon changes in traffic flows, composition, speeds
and distance travelled as a result of the scheme. As such, the proposed scheme is
expected to have an impact on levels of greenhouse gas emissions.
As defined by the Intergovernmental Panel on Climate Change, GHG emissions are
expressed as tonnes of carbon dioxide equivalent (tCO2e) for the purposes of this
appraisal.
The UK is legally bound by the Climate Change Act 2008 to achieve a target to
reduce GHG emissions to at least 80% below base year (1990) levels by 2050.
For the purposes of the OBC, the Transport User Benefit Appraisal (TUBA) software
program was used to assess the impacts of the scheme over a 60 year appraisal
period (2020 – 2079). TUBA calculates and evaluates the discounted prevent value
of changes in CO2e for non-traded (i.e. petrol, diesel, fuel oil) and traded (e.g.
electricity) fuel consumption. The results are shown in Table 3-20 below.
Emissions Class
Appraisal Period GHG Emissions (tCO2e) Change
(tCO2e) Net Present
Value Do Minimum Do Something
Non-traded 18,781,302 18,696,541 -84,760 £3,916,000
Traded 39,246 39,102 -144
Table 3-20: Change in greenhouse gas emissions (TUBA outputs)

© Mouchel 2016 88
The proposed scheme is expected to reduce greenhouse gas emissions. The
forecast reduction in non-traded emissions (84,760 tCO2e) equates to a NPV benefit
of £3,916,000.
3.11.4 Townscape
Townscape covers the physical and social characteristics of the built and non-built
urban environment and the way in which people perceive those characteristics. The
methodology used for appraising the impact of the scheme on townscape is based
on a qualitative approach and uses the standard Townscape Worksheet from
WebTAG Unit A3.
The quality of urban form surrounding Lake Lothing is fragmented. Its northern edge
is flanked by the town’s railway, which separates a prominent industrial lake margin
from the residential and retail fringes of north Lowestoft. To the south of the lake is a
mix of maritime related industry, large tracts of vacant land and areas of new retail
and commercial development. It is a townscape in transition, the area having been
identified for significant regeneration within the Lowestoft Lake Lothing and Outer
Harbour Area Action Plan (AAP). The AAP aims to deliver a new, more diverse
mixed-use townscape, with public access to the water frontage and public spaces for
people to meet and play, the water space being a primary focus and driver for this
regeneration.
The road crossing would introduce a new feature in the existing townscape pattern. It
would influence to some degree the future regeneration layout in respect of the Area
Action Plan, although the existing road framework and adjacent built development
would not alter significantly. The new bridge and elevated approaches would have a
minor influence on the sense of open scale associated with the lake setting, and
would become a townscape feature in their own right.
At this stage, an overall assessment of Slight Adverse has been given, as the
bridge will clearly have an impact on the townscape.
3.11.5 Biodiversity
Biodiversity has been assessed using the qualitative and quantitative techniques set
out within WebTAG using the standard TAG Worksheet. It addresses the potential
impacts of the scheme on ecological receptors, including direct impacts resulting
from activities integral to the project, indirect impacts and cumulative impacts. A desk
study and Phase I Habitat Survey was undertaken to inform the appraisal of options
for this business case, in order to identify changes to known biodiversity resources
previously identified by other studies and to identify any new features.
The route passes through suitable reptile and nesting bird habitat, and is within
0.5km of known populations of reptiles. There are also buildings with 50m of the
proposed alignment that could offer suitable bat roosting sites. These protected
species may therefore be affected.
© Mouchel 2016 89
At this stage, an initial assessment of Moderate Adverse has been given. However,
once assessment of these populations have been made and potential mitigating
activities completed the overall result should not exceed a Slight Adverse effect.
3.11.6 Historic environment
The Historic Environment comprises buildings and sites of architectural and historic
significance. The impact of the scheme on historic environment has been appraised
qualitatively using the standard WebTAG Worksheet.
The scheme would bisect Lake Lothing resulting in a moderate adverse impact on
the character of the historic landscape and a slight adverse impact on the setting of
the Port House.
The scheme would have neutral impact on a listed building located c.300m to the
north. It also has the potential to have a major adverse impact on unknown sub-
surface heritage assets including palaeoenvironmental remains.
At this stage, an overall assessment of Slight Adverse has been given. This may
change as the design is refined, and as studies and site investigations are
undertaken.
3.11.7 Water Environment
The potential impacts on the water environment cover effects on surface hydrology
and quality; groundwater quality and hydrogeology; and fluvial geomorphology. A
desk study of the hydrological and hydrogeological features associated with the
proposed alignments has been undertaken and a site walk-over was carried out to
supplement the desk study.
The scheme consists of a bridge structure spanning Lake Lothing’s Inner Harbour. At
this location the water body is approximately 100m wide and is characterised as a
heavily modified water body, with artificial, developed banks and a tidal flow regime.
The main impact is related to the floodplain. Approximately 500m of flood plain is
crossed and the southern connection with the existing road network crosses areas of
flood zone 2. The flood plain is heavily developed with urban environments and
artificial surfaces where the scheme crosses land. Major compensation of the flood
plain is likely to be required.
At this stage an overall assessment of Moderate Adverse has been given. This will
be reviewed as the scheme and mitigation and management proposals are
developed for the Full Business Case.
3.12 Regeneration impacts
The DfT Value for Money note (2013) permits the use of regeneration benefits in the
calculation of the adjusted BCR. Regeneration benefits are not included in the
calculation of the adjusted BCR here, and are reported as qualitative benefits. This is
because there is no “dependent development” associated with the scheme, and
© Mouchel 2016 90
therefore no direct land value uplift (planning gain) that is directly attributable. The
benefits captured in the other assessments above are considered to include
regeneration benefits already. Inclusion of additional regeneration benefits would
therefore “double-count” these benefits. This is considered a conservative approach
to the calculation of scheme benefits. A summary of the regeneration aspects of the
scheme are outlined below, which were considered as part of a regeneration review.
The regeneration benefits of a third crossing in Lowestoft are considered in
qualitative terms looking at the future growth trajectory of the town in addition to the
consequences should a third crossing not be delivered. The analysis of the local
economy points to an area with future prospects for growth in jobs and economic
activity. These are anchored in the energy sector (mainly growth in the offshore wind
sector), investments in the Great Yarmouth and Lowestoft Enterprise Zone, as well
as growth encouraged through the Lowestoft Lake Lothing and Outer Harbour AAP.
The review identified the following types of benefits the scheme could generate,
including:
Benefits associated with improved journey times and reduced congestion;
Benefits associated with improved access to development sites and premises
directly resulting from a third crossing;
Benefits resulting from enhanced accessibility (and therefore enhanced
marketability and take up) of sites and premises; and
Benefits associated with the improvement in Lowestoft (both real and how the
town is perceived) as a place to live, work and invest in.
Many of these benefits are already captured within the transport modelling and
economic appraisal described in the previous chapter, and including these as
additional scheme benefits could be considered to be “double counting” the benefits.
3.12.1.1 Current and Upcoming Investments in Lowestoft
Lowestoft and the surrounding areas are expected to benefit from a number of
investments over the next 10-20 years, independent of whether a third crossing is
delivered or not. These opportunities will generate additional traffic and the
movement of people and goods, and may exacerbate current problems in the town
unless investments aimed at addressing the town’s congestion and resilience are
implemented.
The energy sector is expected to become more important over the next decade or
so, both in terms of employment numbers as well as the transformative impact it will
have on Lowestoft. The New Anglia LEP’s SEP estimates that around £50 billion will
be invested in the onshore and offshore wind and oil and gas sectors across the
county over the next 10 years, securing hundreds of jobs directly and in their supply

© Mouchel 2016 91
chain. In addition, the £14 billion investment at Sizewell C (to the south of Lowestoft)
is likely to require port support for which Lowestoft is ideally positioned.
The Lowestoft Lake Lothing and Outer Harbour AAP (which includes the PowerPark
and parts of the Lowestoft and Great Yarmouth Enterprise Zone) is expected to
generate a number of opportunities for the town. The PowerPark is expected to
focus on energy-related growth.
Elsewhere, the Riverside Road and South Lowestoft Industrial Estate Enterprise
Zone sites are expected to offer further opportunities for growth and investment in
the town over the next decade or so. Overall, the Enterprise Zone is expected to
cover over 120 hectares of developable land, supporting between 150 and 200
businesses and enabling the creation of around 9,000 direct jobs (and a further
4,500 indirect and induced jobs). An added benefit of the Enterprise Zone in
Lowestoft has been the improvements to the town’s fabric and appearance, in
addition to increased demand for employment land. The outputs and outcomes from
resulting from the Enterprise Zone has already been counted as part of its
application, and should therefore not be counted as additional benefits (under the
regeneration case) unless there is a very strong case for additionality.
3.12.2 Lowestoft Town Centre and Employment Space
Congestion is currently a key issue in Lowestoft and the development of a third
crossing will need to be accompanied by other interventions across the road
network. A recent survey of members of the Suffolk Chamber of Commerce has
highlighted the time lost to congestion as a major issue for many businesses in
Lowestoft, especially those located south of the Inner Harbour.
A third crossing over the Inner Harbour has the potential to increase local basket
spend, resulting in increased turnover and jobs creation for businesses in the town
centre. In addition, a third crossing will help regenerate the town centre and bring
more areas in South Lowestoft closer to it.
Vacancy rates in the town centre is a key issue and many believe that a third
crossing will help address this by making Lowestoft more marketable and
encouraging more people to visit. A spin-off of lower vacancy rates would be the
possibility of attracting a higher-value brand into the town centre which in turn would
have the potential to attract even more people to Lowestoft. Furthermore, this has
the potential to change people’s perception of the town centre. Ultimately these
improvements will help the town centre compete better with its local competitors
which include the North Quay Retail Park and Beccles town centre.
From the perspective of employment land, a third crossing is expected to open up
land for development by making it more accessible (in terms of time savings) and
more marketable. In reality, no new land will be opened following the construction of
a third crossing – also referred to as “dependant development”.

© Mouchel 2016 92
Finally, a third crossing over the Inner Harbour is expected to improve Lowestoft’s
relationship with Great Yarmouth. This will lead to the overall growth of the sub-
region, creating a stronger (energy-related) hub in the context of the North Sea and
Europe, capable of benefitting from increased opportunities elsewhere.
3.12.3 The Demand for Labour
All the changes discussed above are expected to lead to the creation of new jobs in
Lowestoft.
The new jobs that will be created as a result of current and upcoming investments in
Lowestoft as well as those created following the construction of a third crossing are
expected to be in a mix of sectors and will require a mix of skills. Data from the 2011
Census of Population identifies Lowestoft as having a higher proportion of its
population with no qualifications when compared with Suffolk, New Anglia and
England.
Growth in the energy sector and port-related activities is expected to lead to a
greater demand for a highly skilled workforce. However, unless there is a change in
the way young people are prepared for the workforce in addition to making it easier
for people already in employment to access further training, Lowestoft’s population
will not be able to benefit from the new jobs that are created in the area. Things are
however starting to change. Organisations and large businesses (such as ABP) are
starting to work with higher and further education institutions to identify any local
skills gaps in the current workforce whilst also better preparing it for future
opportunities.
The table below lists the effects discussed above and identifies the timescales over
which these are expected to delivered which include the short (1-2 years), medium
(2-5 years) and long (5 years and over) terms.
Short term
Medium term
Long term
The need for more and better employment land x x
Changes in property values x x
Growth in the energy sector (incl. offshore wind and civil nuclear)
x x
Investment in port facilities by ABP x x
Developments progressed through AAP (incl. PowerPark)
x x
Growth Great Yarmouth and Lowestoft Enterprise Zone sites (incl. Riverside Road and South Lowestoft Industrial Estate)
x x
Reduction in congestion x x
Inward investment x x
Regeneration of town centre x x
Increase in town centre footfall x
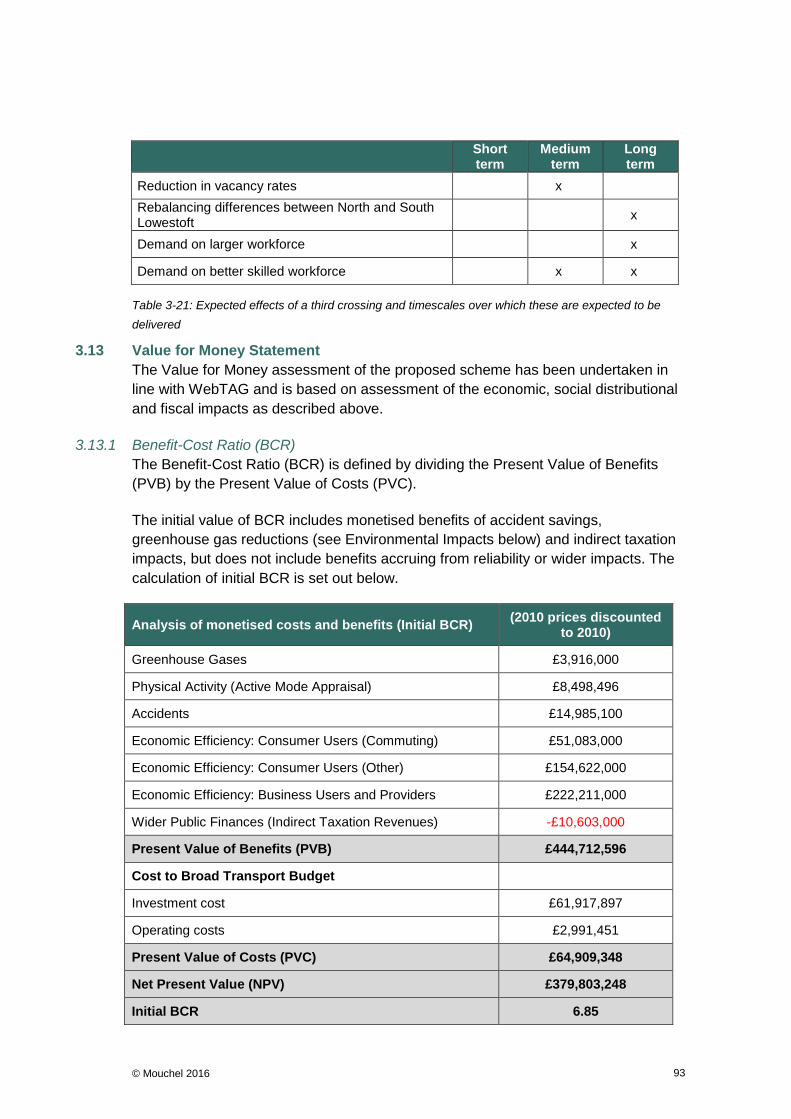
© Mouchel 2016 93
Short term
Medium term
Long term
Reduction in vacancy rates x
Rebalancing differences between North and South Lowestoft
x
Demand on larger workforce x
Demand on better skilled workforce x x
Table 3-21: Expected effects of a third crossing and timescales over which these are expected to be
delivered
3.13 Value for Money Statement
The Value for Money assessment of the proposed scheme has been undertaken in
line with WebTAG and is based on assessment of the economic, social distributional
and fiscal impacts as described above.
3.13.1 Benefit-Cost Ratio (BCR)
The Benefit-Cost Ratio (BCR) is defined by dividing the Present Value of Benefits
(PVB) by the Present Value of Costs (PVC).
The initial value of BCR includes monetised benefits of accident savings,
greenhouse gas reductions (see Environmental Impacts below) and indirect taxation
impacts, but does not include benefits accruing from reliability or wider impacts. The
calculation of initial BCR is set out below.
Analysis of monetised costs and benefits (Initial BCR) (2010 prices discounted
to 2010)
Greenhouse Gases £3,916,000
Physical Activity (Active Mode Appraisal) £8,498,496
Accidents £14,985,100
Economic Efficiency: Consumer Users (Commuting) £51,083,000
Economic Efficiency: Consumer Users (Other) £154,622,000
Economic Efficiency: Business Users and Providers £222,211,000
Wider Public Finances (Indirect Taxation Revenues) -£10,603,000
Present Value of Benefits (PVB) £444,712,596
Cost to Broad Transport Budget
Investment cost £61,917,897
Operating costs £2,991,451
Present Value of Costs (PVC) £64,909,348
Net Present Value (NPV) £379,803,248
Initial BCR 6.85
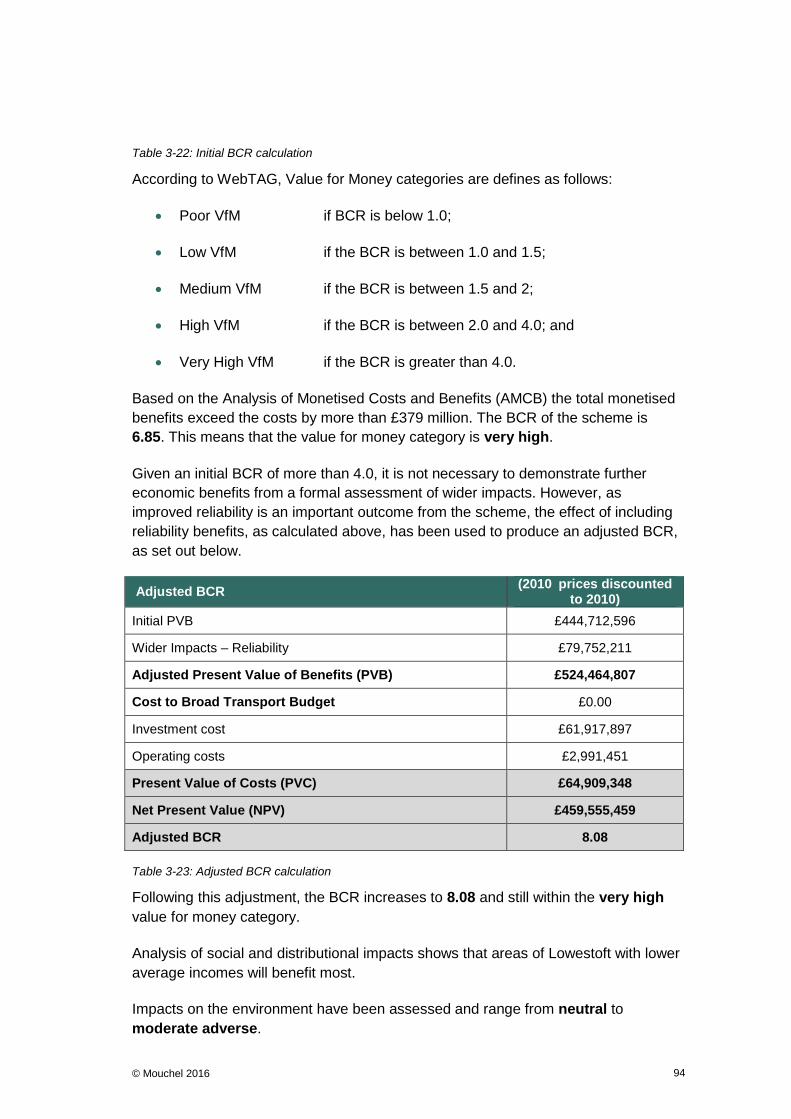
© Mouchel 2016 94
Table 3-22: Initial BCR calculation
According to WebTAG, Value for Money categories are defines as follows:
Poor VfM if BCR is below 1.0;
Low VfM if the BCR is between 1.0 and 1.5;
Medium VfM if the BCR is between 1.5 and 2;
High VfM if the BCR is between 2.0 and 4.0; and
Very High VfM if the BCR is greater than 4.0.
Based on the Analysis of Monetised Costs and Benefits (AMCB) the total monetised
benefits exceed the costs by more than £379 million. The BCR of the scheme is
6.85. This means that the value for money category is very high.
Given an initial BCR of more than 4.0, it is not necessary to demonstrate further
economic benefits from a formal assessment of wider impacts. However, as
improved reliability is an important outcome from the scheme, the effect of including
reliability benefits, as calculated above, has been used to produce an adjusted BCR,
as set out below.
Adjusted BCR (2010 prices discounted
to 2010)
Initial PVB £444,712,596
Wider Impacts – Reliability £79,752,211
Adjusted Present Value of Benefits (PVB) £524,464,807
Cost to Broad Transport Budget £0.00
Investment cost £61,917,897
Operating costs £2,991,451
Present Value of Costs (PVC) £64,909,348
Net Present Value (NPV) £459,555,459
Adjusted BCR 8.08
Table 3-23: Adjusted BCR calculation
Following this adjustment, the BCR increases to 8.08 and still within the very high
value for money category.
Analysis of social and distributional impacts shows that areas of Lowestoft with lower
average incomes will benefit most.
Impacts on the environment have been assessed and range from neutral to
moderate adverse.
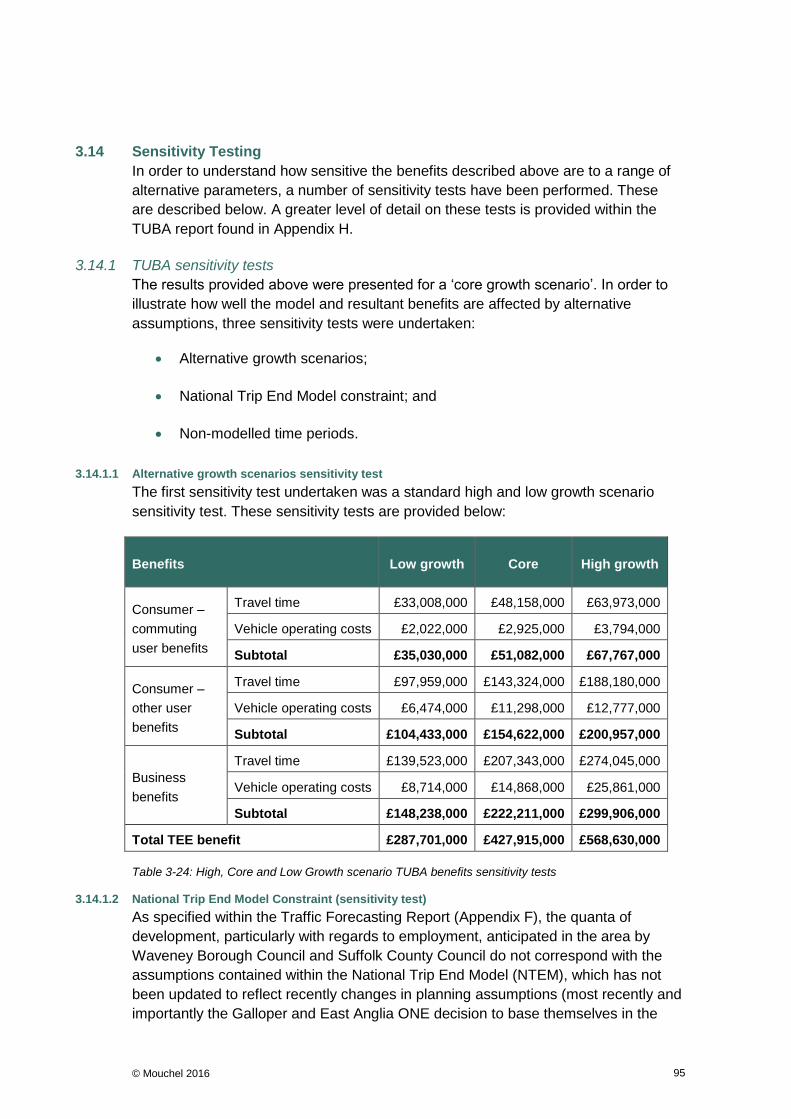
© Mouchel 2016 95
3.14 Sensitivity Testing
In order to understand how sensitive the benefits described above are to a range of
alternative parameters, a number of sensitivity tests have been performed. These
are described below. A greater level of detail on these tests is provided within the
TUBA report found in Appendix H.
3.14.1 TUBA sensitivity tests
The results provided above were presented for a ‘core growth scenario’. In order to
illustrate how well the model and resultant benefits are affected by alternative
assumptions, three sensitivity tests were undertaken:
Alternative growth scenarios;
National Trip End Model constraint; and
Non-modelled time periods.
3.14.1.1 Alternative growth scenarios sensitivity test
The first sensitivity test undertaken was a standard high and low growth scenario
sensitivity test. These sensitivity tests are provided below:
Benefits Low growth Core High growth
Consumer –
commuting
user benefits
Travel time £33,008,000 £48,158,000 £63,973,000
Vehicle operating costs £2,022,000 £2,925,000 £3,794,000
Subtotal £35,030,000 £51,082,000 £67,767,000
Consumer –
other user
benefits
Travel time £97,959,000 £143,324,000 £188,180,000
Vehicle operating costs £6,474,000 £11,298,000 £12,777,000
Subtotal £104,433,000 £154,622,000 £200,957,000
Business
benefits
Travel time £139,523,000 £207,343,000 £274,045,000
Vehicle operating costs £8,714,000 £14,868,000 £25,861,000
Subtotal £148,238,000 £222,211,000 £299,906,000
Total TEE benefit £287,701,000 £427,915,000 £568,630,000
Table 3-24: High, Core and Low Growth scenario TUBA benefits sensitivity tests
3.14.1.2 National Trip End Model Constraint (sensitivity test)
As specified within the Traffic Forecasting Report (Appendix F), the quanta of
development, particularly with regards to employment, anticipated in the area by
Waveney Borough Council and Suffolk County Council do not correspond with the
assumptions contained within the National Trip End Model (NTEM), which has not
been updated to reflect recently changes in planning assumptions (most recently and
importantly the Galloper and East Anglia ONE decision to base themselves in the

© Mouchel 2016 96
port of Lowestoft). Consequently, there is a significant discrepancy when considering
the growth in traffic shown by TEMPRO. This is illustrated below.
Year Metric NTEM District Difference
2020 Households 1878 3070 1192
Jobs 174 3157 2983
2035 Households 5891 3304 -2587
Jobs -611 3157 2546
Table 3-25: Local change in planning data from Waveney District
In developing the core growth scenario, TAG Unit M4 (November 2014) relating to
forecasting was followed, namely controlling background growth to NTEM totals
through the Alternative Planning Assumptions tool in TEMPRO. Since there is
insufficient planned growth in Waveney District, the balance was removed from the
wider Suffolk County TEMPRO zone. However, since the model does not cover the
whole of Suffolk, the impact on growth within the study of adjusting the county-wide
planning assumptions is minimal.
TAG Unit M4 paragraph 7.3.7 (November 2014) sets out a step-by-step guide on
producing Reference Case matrices. The final point requests that modellers “check
and report the total trip ends. These should be very close to the NTEM total for the
given NTEM zone”. Due to a combination of the discrepancy between NTEM
forecasts and planned developments, the adjustment made at a higher level than
that covered by the model, and the use of development-specific trip rates, growth in
trips in the model forecasts is significantly different to the growth in trips predicted by
NTEM, despite constraining growth in planning data to NTEM totals.
Given these points, the core scenario as developed is considered to be the most
accurate and realistic forecast of future growth within the study area. However, to
demonstrate the robustness of the scheme, a series of alternative Reference Case
matrices were developed, where growth in trips is constrained to NTEM forecasts.
The component elements of the Reference Case matrices are shown below
compared against target totals from NTEM calculated by applying factors extracted
from TEMPRO without applying any alternate planning assumptions.
Year Time
Period Base
Background
growth
Modelled
developments
Reference
case total
NTEM
Target
2020
AM 13,627 13,900 3,909 17,809 14,042
IP 12,052 12,803 2,214 15,017 12,932
PM 14,680 15,395 3,656 19,052 15,565
2035 AM 13,267 15,986 4,216 20,202 16,155
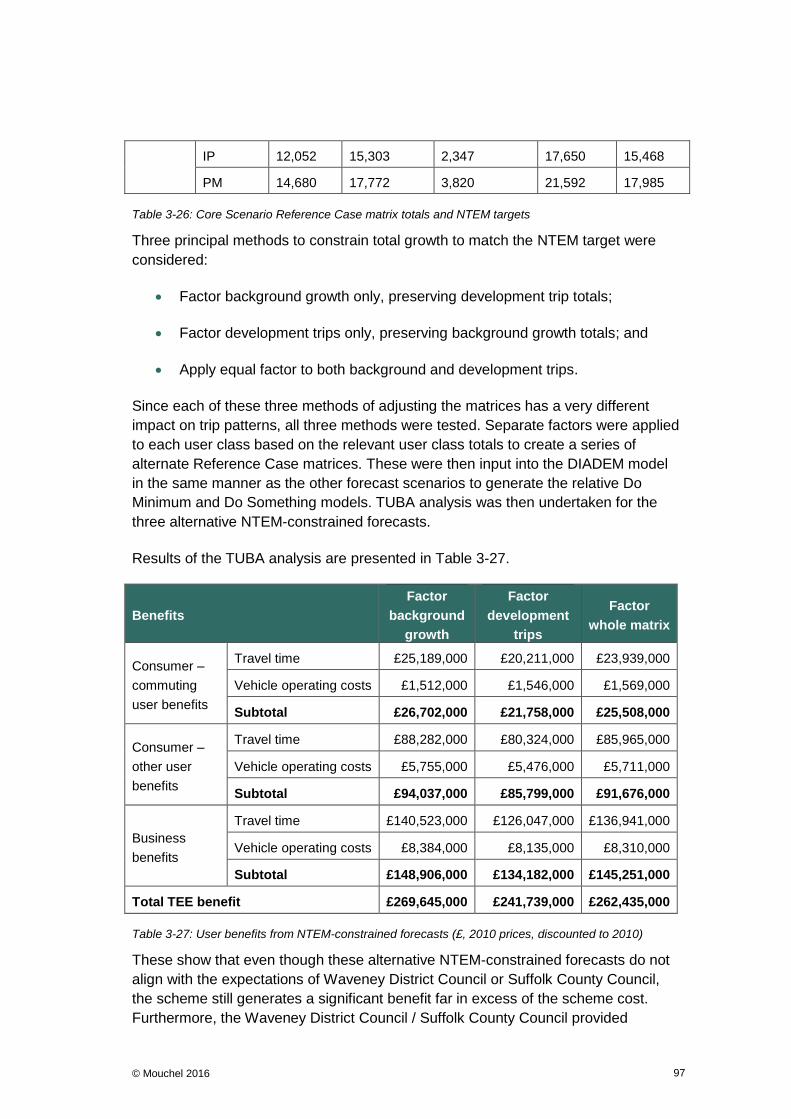
© Mouchel 2016 97
IP 12,052 15,303 2,347 17,650 15,468
PM 14,680 17,772 3,820 21,592 17,985
Table 3-26: Core Scenario Reference Case matrix totals and NTEM targets
Three principal methods to constrain total growth to match the NTEM target were
considered:
Factor background growth only, preserving development trip totals;
Factor development trips only, preserving background growth totals; and
Apply equal factor to both background and development trips.
Since each of these three methods of adjusting the matrices has a very different
impact on trip patterns, all three methods were tested. Separate factors were applied
to each user class based on the relevant user class totals to create a series of
alternate Reference Case matrices. These were then input into the DIADEM model
in the same manner as the other forecast scenarios to generate the relative Do
Minimum and Do Something models. TUBA analysis was then undertaken for the
three alternative NTEM-constrained forecasts.
Results of the TUBA analysis are presented in Table 3-27.
Benefits
Factor
background
growth
Factor
development
trips
Factor
whole matrix
Consumer –
commuting
user benefits
Travel time £25,189,000 £20,211,000 £23,939,000
Vehicle operating costs £1,512,000 £1,546,000 £1,569,000
Subtotal £26,702,000 £21,758,000 £25,508,000
Consumer –
other user
benefits
Travel time £88,282,000 £80,324,000 £85,965,000
Vehicle operating costs £5,755,000 £5,476,000 £5,711,000
Subtotal £94,037,000 £85,799,000 £91,676,000
Business
benefits
Travel time £140,523,000 £126,047,000 £136,941,000
Vehicle operating costs £8,384,000 £8,135,000 £8,310,000
Subtotal £148,906,000 £134,182,000 £145,251,000
Total TEE benefit £269,645,000 £241,739,000 £262,435,000
Table 3-27: User benefits from NTEM-constrained forecasts (£, 2010 prices, discounted to 2010)
These show that even though these alternative NTEM-constrained forecasts do not
align with the expectations of Waveney District Council or Suffolk County Council,
the scheme still generates a significant benefit far in excess of the scheme cost.
Furthermore, the Waveney District Council / Suffolk County Council provided

© Mouchel 2016 98
development information is considered more realistic than the TEMPRO data, for
reasons already discussed (related to newly secured investment and jobs).
3.14.1.3 Non-modelled time periods
The TUBA results included all 8,760 hours in a year based on factors applied to
existing matrices to generate models for the non-modelled time periods. In part, this
is to comply with TAG Unit A3 (November 2014). However, in the case of the off-
peak and weekend periods, it is possible that applying a simple factor to the
interpeak to represent what may be a significantly different and varied set of traffic
conditions may be considered an oversimplification.
Since there are no validated models for these time periods, this cannot be
determined with any certainty. Benefits from the core TUBA results disaggregated
into the separate time periods have been presented in Table 3-6, but for
completeness, an alternative set of TUBA results has been undertaken that excludes
the off peak and weekend periods completely. These are shown in Table 3-28, and
should be compared to the full version in Table 3-5.
Benefits
Consumer –
commuting user
benefits
Travel time £44,707,000
Vehicle operating costs £2,753,000
Subtotal £47,460,000
Consumer – other
user benefits
Travel time £120,767,000
Vehicle operating costs £8,839,000
Subtotal £129,605,000
Business benefits
Travel time £184,193,000
Vehicle operating costs £13,902,000
Subtotal £198,094,000
Total TEE benefit £375,159,000
Table 3-28: TEE benefits excluding off peak and weekends (£, 2010 prices, discounted to 2010)
These results demonstrate that the off peak and weekend do not contribute a
significant level of benefits to the overall scheme assessment. The analysis therefore
does not rely heavily on time periods using unvalidated models.
3.14.2 Active Mode Appraisal Sensitivity Testing
As recommended in TAG Unit A5.1, the potential differences in uplift for pedestrians
and cycle users as a result of the scheme has been considered, and this has been
reflected in a high and low growth sensitivity test, which is provided alongside the
core scenario presented above. The table below summarises the proportions of
forecast pedestrian and cycling demand used in the sensitivity tests to generate
Active Mode benefits.

© Mouchel 2016 99
Assumptions and Results
Scenario Tests
Low Core High
Pedestrian Uplifts 5% 10% 15%
Cycle user Uplift 5% 17.5% 30%
Pedestrians Benefits £3,809,865 £5,476,361 £6,842,421
Cycle users Benefits £2,406,688 £3,022,135 £5,165,786
Total Benefits £6,216,554 £8,498,496 £12,008,207
Table 3-29: Low and High Uplift Sensitivity Test Results (rounded to nearest £1)
3.15 Appraisal Summary Table (AST)
The AST presents in a single table all the evidence from the economic appraisal. It
records all the impacts which have been assessed and described above – economic,
fiscal, social distributional and environmental impacts – assessed using monetised,
quantitative or qualitative information as appropriate. The AST is included at
Appendix M.
3.16 Summary and conclusion
An analysis of the monetised benefits of the proposed scheme demonstrates that it
offers Very High value for money with a BCR of 6.85. Inclusion of reliability benefits
increases this still further to 8.08. Sensitivity testing with a range of growth scenarios
shows that the scheme would still offer very good value for money in a low growth
scenario. Analysis of social and distributional impacts shows that areas of Lowestoft
with lower average incomes will benefit most.
About half of the forecast time and vehicle operating cost savings are identified as
benefits to business. Business will benefit from reduced congestion, faster journeys
and improved journey time reliability, with reduced costs and better access to
markets, whilst commuters will similarly benefit from shorter, more reliable, journeys
to work. These benefits, which are included in the BCR calculations will support local
development and the regeneration of Lowestoft’s economy.
Impacts on the environment have been assessed and range from neutral to
moderate adverse. These will be reviewed for the Full Business Case in the light of
more detailed assessment and consideration of measures to mitigate, manage or
compensate for the impacts. The scheme is expected to lead to a reduction in
greenhouse gas emissions; these have been monetised and included in the BCR.

© Mouchel 2016 100
4 The Financial Case
4.1 Introduction
This chapter sets out the financial case for the proposed scheme to demonstrate its
affordability. This chapter describes:
How much the proposed scheme is expected to cost, and how this has been
calculated;
Risks that could affect the cost of the scheme;
How the scheme will be paid for and by whom; and
The anticipated profile of expenditure over time (whole life costs).
This chapter deals with costs and accounting issues. The question of value for
money is dealt with separately in the Economic Case.
4.2 Costs
The estimated capital cost of the scheme, at 2015:Q4 prices, but excluding future
inflation, client costs and non-recoverable VAT, is:
Scheme Costs
Lake Lothing Third Crossing £80,346,702
Table 4-1: Estimated capital costs of the proposed scheme
The build-up of the cost estimate and spend profile over time is demonstrated in
Table 4-2.
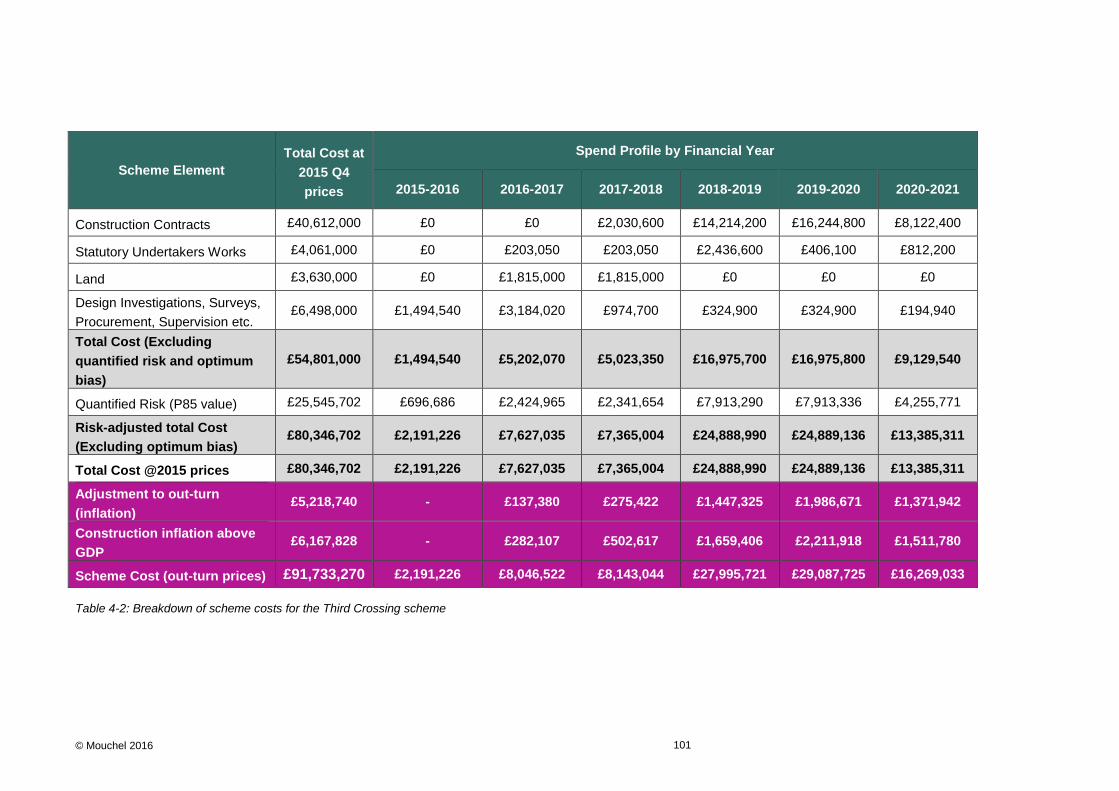
© Mouchel 2016 101
Scheme Element
Total Cost at
2015 Q4
prices
Spend Profile by Financial Year
2015-2016 2016-2017 2017-2018 2018-2019 2019-2020 2020-2021
Construction Contracts £40,612,000 £0 £0 £2,030,600 £14,214,200 £16,244,800 £8,122,400
Statutory Undertakers Works £4,061,000 £0 £203,050 £203,050 £2,436,600 £406,100 £812,200
Land £3,630,000 £0 £1,815,000 £1,815,000 £0 £0 £0
Design Investigations, Surveys,
Procurement, Supervision etc. £6,498,000 £1,494,540 £3,184,020 £974,700 £324,900 £324,900 £194,940
Total Cost (Excluding
quantified risk and optimum
bias)
£54,801,000 £1,494,540 £5,202,070 £5,023,350 £16,975,700 £16,975,800 £9,129,540
Quantified Risk (P85 value) £25,545,702 £696,686 £2,424,965 £2,341,654 £7,913,290 £7,913,336 £4,255,771
Risk-adjusted total Cost
(Excluding optimum bias) £80,346,702 £2,191,226 £7,627,035 £7,365,004 £24,888,990 £24,889,136 £13,385,311
Total Cost @2015 prices £80,346,702 £2,191,226 £7,627,035 £7,365,004 £24,888,990 £24,889,136 £13,385,311
Adjustment to out-turn
(inflation) £5,218,740 - £137,380 £275,422 £1,447,325 £1,986,671 £1,371,942
Construction inflation above
GDP £6,167,828 - £282,107 £502,617 £1,659,406 £2,211,918 £1,511,780
Scheme Cost (out-turn prices) £91,733,270 £2,191,226 £8,046,522 £8,143,044 £27,995,721 £29,087,725 £16,269,033
Table 4-2: Breakdown of scheme costs for the Third Crossing scheme
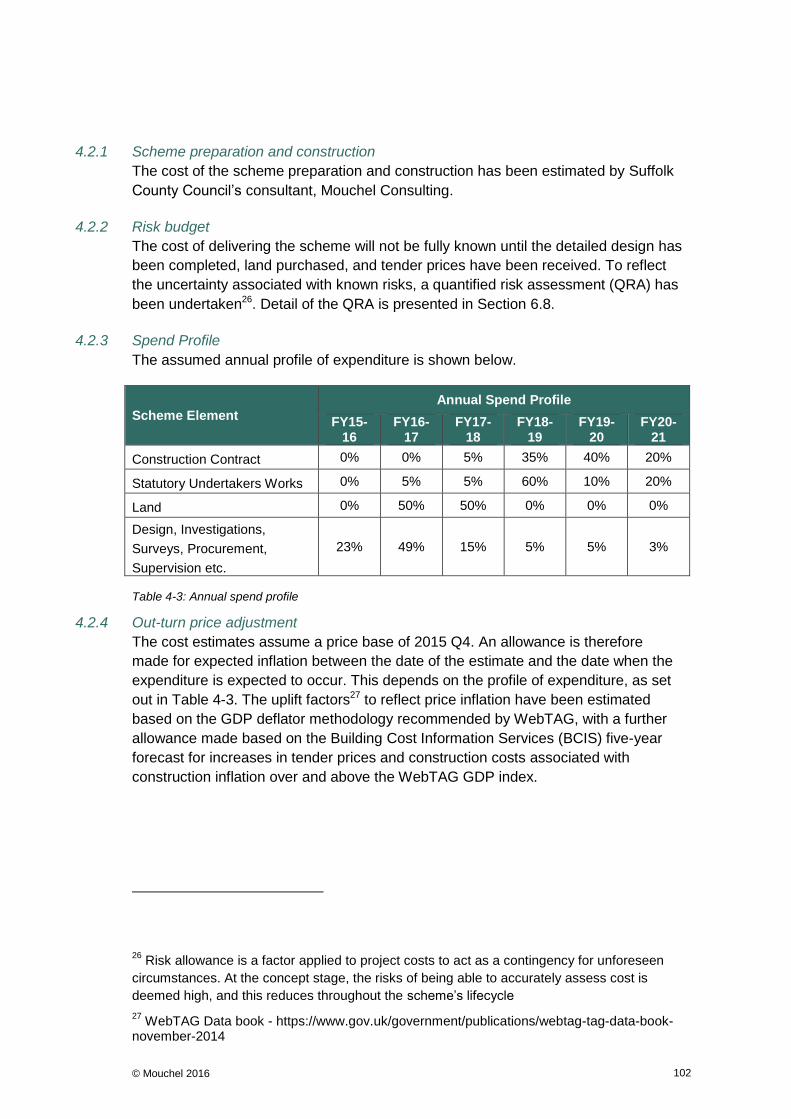
© Mouchel 2016 102
4.2.1 Scheme preparation and construction
The cost of the scheme preparation and construction has been estimated by Suffolk
County Council’s consultant, Mouchel Consulting.
4.2.2 Risk budget
The cost of delivering the scheme will not be fully known until the detailed design has
been completed, land purchased, and tender prices have been received. To reflect
the uncertainty associated with known risks, a quantified risk assessment (QRA) has
been undertaken26. Detail of the QRA is presented in Section 6.8.
4.2.3 Spend Profile
The assumed annual profile of expenditure is shown below.
Scheme Element
Annual Spend Profile
FY15-16
FY16-17
FY17-18
FY18-19
FY19-20
FY20-21
Construction Contract 0% 0% 5% 35% 40% 20%
Statutory Undertakers Works 0% 5% 5% 60% 10% 20%
Land 0% 50% 50% 0% 0% 0%
Design, Investigations,
Surveys, Procurement,
Supervision etc.
23% 49% 15% 5% 5% 3%
Table 4-3: Annual spend profile
4.2.4 Out-turn price adjustment
The cost estimates assume a price base of 2015 Q4. An allowance is therefore
made for expected inflation between the date of the estimate and the date when the
expenditure is expected to occur. This depends on the profile of expenditure, as set
out in Table 4-3. The uplift factors27 to reflect price inflation have been estimated
based on the GDP deflator methodology recommended by WebTAG, with a further
allowance made based on the Building Cost Information Services (BCIS) five-year
forecast for increases in tender prices and construction costs associated with
construction inflation over and above the WebTAG GDP index.
26 Risk allowance is a factor applied to project costs to act as a contingency for unforeseen
circumstances. At the concept stage, the risks of being able to accurately assess cost is
deemed high, and this reduces throughout the scheme’s lifecycle
27 WebTAG Data book - https://www.gov.uk/government/publications/webtag-tag-data-book-
november-2014

© Mouchel 2016 103
Scheme Option Allowance
Adjustment to out-turn (Inflation) £5,218,740
Construction inflation above GDP £6,167,828
Table 4-4: Inflation allowance for the scheme option
4.3 Budgets / Funding Cover
4.3.1 Funding
It is likely that the scheme will be funded entirely from public finances, and it is not
clear at this stage whether any private financial contribution will be available.
The largest contribution to the scheme costs would be provided by the Government’s
Department for Transport. A local contribution, underwritten by Suffolk County
Council, will account for 20% of the scheme costs. This is confirmed in a letter of
intent, written by the Council’s Section 151 officer contained in Appendix N. In
addition to underwriting the 20% contribution, the letter also confirms that the Council
will underwrite any potential increase in scheme costs above those set out below.
The exact composition of this local contribution has not yet been finalised, given the
uncertainty around available funding mechanisms, such as the potential devolution
infrastructure fund which would be available to NALEP and Suffolk County Council.
However, this 20% local contribution would come from a combination of the following
sources:
Rates retention from the Lowestoft and Great Yarmouth Enterprise Zone;
Pooled business rates;
Future arrangements for business rates retention;
A potential infrastructure fund resulting from potential successful local
devolution proposal;
Private sector contributions from Community Infrastructure Levy (CIL) /
Section 106 contributions; and
Potential Long term NALEP Growth Deal funding.
In view of the uncertainties around the sources of the local contribution Suffolk
County Council will underwrite this cost. The details of the local funding mechanism
will be clarified as the scheme is developed.
The Council is also prepared to enter into credit arrangements under the prudential
borrowing powers from the Local Government Act 2003.

© Mouchel 2016 104
4.3.2 Budgetary Impact
An estimated budgetary impact summary outlined in Table 4-5 is split by the financial
year. Of an estimated scheme cost of £91.73m, a fixed sum of £73.39m is being
sought from Department for Transport. The remaining £18.35m will be funded by the
local contribution. The assumed spend profile and drawdown profile are aligned.
Source Budgetary Impact Summary (£m)
2015-16 2016-17 2017-18 2018-19 2019-20 2020-21 Total
Government / DfT
Funding 1.75 6.44 6.51 22.40 23.27 13.02 73.39
Local Contribution 0.44 1.61 1.63 5.60 5.82 3.25 18.35
Total 2.19 8.05 8.14 28.00 29.09 16.27 91.73
Table 4-5: Budgetary Impact Summary
4.4 Whole Life Costs
The Lake Lothing Third Crossing scheme will give rise to additional revenue liabilities
for capital renewals and maintenance and for the cost of day to day operation of the
bridge, when compared to a future scenario in which the Lake Lothing Third
Crossing does not exist. All maintenance obligations will be met as part of the
maintenance regime operated by Suffolk County Council.
4.4.1 Capital Renewal Costs
Approximately £1.5 million (at current 2015 price base) will be required for the
purposes of resurfacing / renewing the new highway infrastructure (including the
bridge approaches and bridge surface) over a 60 year period. It is anticipated that
the surface and binder courses would need to be replaced every 15 years after
scheme opening, with a full depth reconstruction after 45 years.
Approximately £1.5 million (at current 2015 price base) will be required for the
purposes of bridge repair and rehabilitation costs over a 60 year period. This
includes the costs incurred to avoid structural corrosion, painting the structure and
make structural repairs with an allowance for the bridge parapets to be replaced after
45 years.
4.4.2 Annual Maintenance and Operating Costs
Approximately £10,000 (at current 2015 price base) will be required to meet annual
highways maintenance liabilities including communications equipment, drainage
clearance, road and street lighting operation, winter maintenance (i.e. application of
salt and snow clearance) and infrastructural and safety inspections.
Approximately £132,000 (at current 2015 price base) will be required to meet annual
bridge maintenance liabilities. These costs are mainly comprised of operation and
maintenance of the bascule bridge.
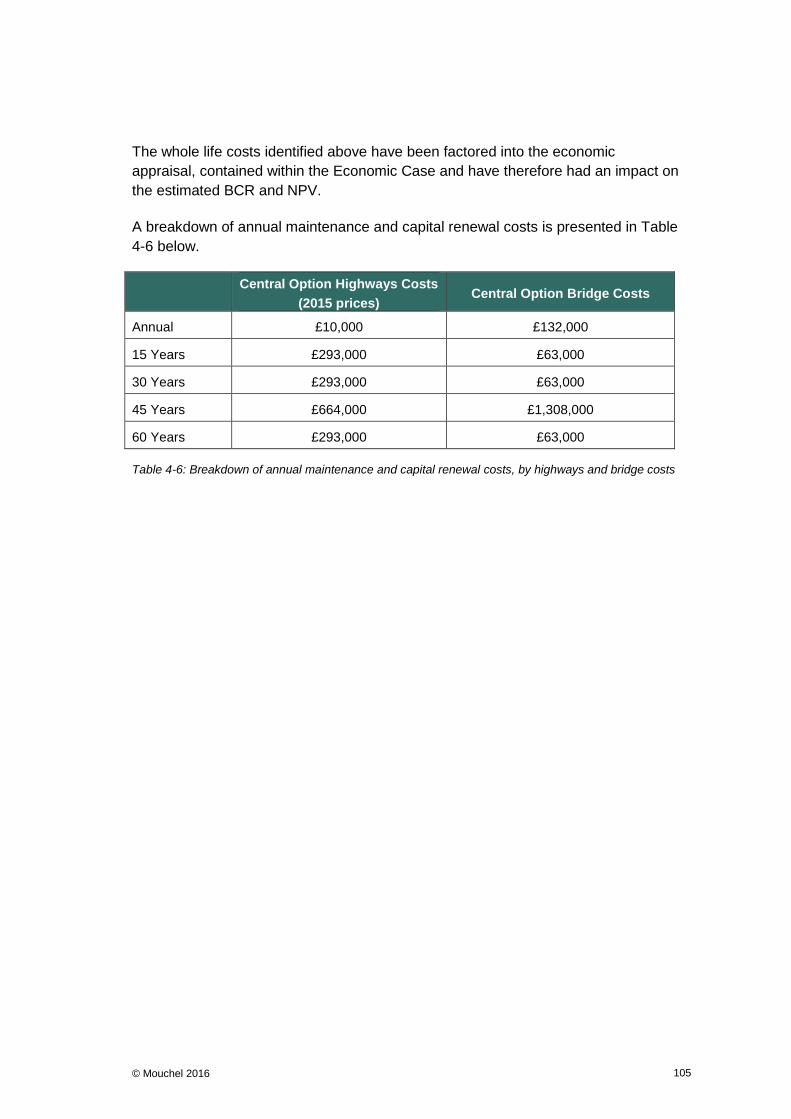
© Mouchel 2016 105
The whole life costs identified above have been factored into the economic
appraisal, contained within the Economic Case and have therefore had an impact on
the estimated BCR and NPV.
A breakdown of annual maintenance and capital renewal costs is presented in Table
4-6 below.
Central Option Highways Costs
(2015 prices) Central Option Bridge Costs
Annual £10,000 £132,000
15 Years £293,000 £63,000
30 Years £293,000 £63,000
45 Years £664,000 £1,308,000
60 Years £293,000 £63,000
Table 4-6: Breakdown of annual maintenance and capital renewal costs, by highways and bridge costs

© Mouchel 2016 106
5 The Commercial Case
This chapter outlines the commercial viability of the scheme, and the procurement
strategy which will be used to engage the market. It provides the intended approach
to risk allocation and transfer, contract and implementation timescales, as well as
how the capability and technical expertise of the team delivering the project will be
secured.
5.1 Introduction
The scheme is commercially viable with a robust contracting and procurement
strategy. It will use an OJEU ‘restricted procedure’ procurement tendering process,
which has been utilised by the Council on a number of previous large-scale transport
infrastructure schemes. It has been developed in full accordance with the Council’s
procurement systems and processes28, with the Council’s Senior Procurement
Officer consulted and agreeing the approach.
The procurement route includes risk management as a core principle, using
strategies of risk allocation and transfer to the contractor, including the use of
disincentives to achieve delivery on time to the required quality (such as the use of
penalties for programme overruns / missing key delivery milestones in the
programme).
There is a well-developed market for the proposed procurement approach and it is
anticipated, based on previous evidence of procuring large infrastructure schemes in
the County (such as the Stowmarket Relief Road, the Lowestoft Southern Relief
Road and the Lowestoft Northern Spine Road), that there will be a high demand and
strong competition amongst engineering contractors to secure the contract for the
construction of this scheme.
The Council have confidence that the contractual and commercial arrangements
proposed are appropriate and workable, having applied the arrangements in the
aforementioned schemes. The Council are currently procuring the Bury St Edmunds
Eastern Relief Road in the same manner.
28 SCC Procurement Rules (2015),
https://www.suffolk.gov.uk/assets/suffolk.gov.uk/Business/Supplying%20Us/2015-03-19, %20Suffolk%20County%20Council%20Procurement%20Regulations%20v1%208Final.pdf SCC Sustainable Procurement Strategy (2012-2014), https://www.suffolk.gov.uk/assets/suffolk.gov.uk/Business/Supplying%20Us/2012-10-10Procurement%20Strategy%20Large%20Font%2012-14V1%202.pdf

© Mouchel 2016 107
5.2 Procurement Strategy
5.2.1 Available procurement procedures
The Official Journal of the European Union (OJEU) is the publication in which all
public sector tenders valued above £4,104,39429 (for infrastructure projects) must be
advertised.
There are several procurement procedures available to schemes to which the OJEU
values apply. These each have particular benefits and use cases, as follows:
5.2.1.1 Open Procedure
This procedure allows an unlimited number of interested parties to tender against
defined parameters. There are no restrictions (e.g. pre-qualification) on the parties
who are permitted to tender, meaning that some parties may not be suitable to carry
out the work. This procedure is straightforward and transparent but can attract a
large number of potential bidders (which will require a greater degree of assessment
and resource requirements). This route is not usually recommended for construction
projects due to the high number of tenders that could be expected and the particular
skills and experience that may be required of potential bidders.
5.2.1.2 Restricted Procedure
This is a two-stage procedure. The first stage allows the contracting authority to set
the minimum criteria relating to technical, economic and financial capabilities that the
potential bidders have to satisfy. Following evaluation of the responses to the first
stage a minimum of five bidders (unless fewer qualify) are invited to tender in the
second stage. This process is typically used to appoint consultants or contractors on
traditionally procured projects.
5.2.1.3 Accelerated Restricted Procedure
This procedure is only intended for use where, for reasons of urgency, the
contracting authority must procure the contract in a reduced time frame. Any
contracting authority wishing to use this procedure must be able to demonstrate the
reasons of urgency that necessitate its use. It is identical to the Restricted Procedure
except that the timescales for each stage are reduced.
29 Effective from 1st January 2016. This figure is currently £4,322,012 effective from 1st January 2014
until 31st December 2015.
© Mouchel 2016 108
5.2.1.4 Competitive Dialogue Procedure
This procedure is appropriate for complex contracts where contracting authorities:
are not objectively able to define the technical means capable of satisfying their needs or objectives; and / or
are not objectively able to specify the legal and/or financial make-up of a project.
This is a multi-stage procedure. The first stage is a pre-qualification to select the
potential bidders to participate in the dialogue. In the second stage the contracting
authority enters into a dialogue with the potential bidders to identify and define the
means best suited to satisfying their needs. Any aspect of the contract may be
discussed, including technical requirements for the works to be delivered and the
commercial / contractual arrangements to be used. The dialogue may be conducted
in successive phases with the remaining bidders being invited to tender. By the end
of the dialogue phase the contracting authority’s requirements will have been
determined such that the scheme can be tendered. In the final stage, the remaining
bidders from the dialogue phase are invited to tender for the scheme.
5.2.1.5 Competitive Procedure with Negotiation
This relatively new procedure is intended to be used where minimum requirements
are able to be specified but negotiations with bidders may be needed to improve the
initial tenders. The grounds for using this procedure are as follows:
Where needs cannot be met without adaptation of readily available solutions;
Where the contract includes design or innovative solutions;
Where the requirement is complex in nature, in its legal and financial make-up or because of its risks;
Where the technical specifications cannot be established with sufficient precision; or
In the case of unacceptable/irregular tenders.
Within this procedure, bidders initially submit tenders based on the information
issued by the contracting authority. The contracting authority is then able to review
the tenders it has received and negotiate with the bidders, following which the
tenders will be resubmitted. This procedure may therefore be useful where the
requirements are well developed initially and full tender documents can be produced
but it is felt that there may be advantage in retaining the ability to hold negotiations if
there are certain aspects which bidders raise.
5.2.2 Preferred procurement procedure
This scheme will likely be procured using the Restricted Procedure due to the fact
that it will be possible to publish a well-defined tender package for bidders to price

© Mouchel 2016 109
against although variant tenders would be accepted in order to allow bidders to
propose alternative solutions. The Restricted Procedure also has defined timescales
for each stage which will allow the Council to ensure that the tenders can be
received by the dates required by the overall project programme.
The Council currently uses the Restricted Procedure for procuring highway
engineering schemes and is well-practised in its use. However, the Council will also
consider the use of the Competitive Procedure with Negotiation as it may offer
benefits, such as being able to discuss initial tenders with the bidders if they identify
elements of the scheme that could be improved if carried out differently from the
tender proposals. The selected procedure will be confirmed in the Full Business
Case.
The information required from the bidders during the PQQ and ITT stages will ensure
that the objectives set out within the Economic Case are achieved, particularly the
timely completion of the works in order to realise the economic benefits to the public
arising from the provision of the new crossing.

© Mouchel 2016 110
5.2.3 Details of preferred procurement procedure
The following flowchart outlines the Restricted Procedure:
Figure 5-1: Restricted Procedure Flowchart 30
Summarising the key processes within this procedure, a Pre-Qualification
Questionnaire (PQQ) will be issued, which will allow potential bidders to be scored
on a range of commercial, financial and technical criteria as well as on their
processes for dealing with quality, health and safety, environmental management
and compliance with statutory legislation. The responses received from potential
bidders will be scored according to pre-determined criteria in order to identify those
who will be eligible to participate in the tender. Of the eligible bidders, a minimum of
5 would be selected to continue to the ITT stage, unless there are fewer than 5
eligible bidders in which case they would all continue.
The bidders who are successful at PQQ stage will issued with the Invitation to
Tender (ITT) documentation which will include the following documents:
30 Reproduced from A User’s Guide to EU Procurement Rules, Sweett Group, May 2012,
https://www.apm.org.uk/sites/default/files/open/EU%20Procurement%20Guide_May%202012.pdf
Issue prior information notice (PIN)
Submit contract notice
PQQ return date
Issue pre qualification evaluation
Issue invitation to tender
Pre qualification assessment
Tender return date
Tender evaluation
10 day standstill period
Contract award notice
No: Full minimum
timescales to be
adhered to
Yes: reduced
timescales can be
used
36 days (generally
no less than 22)
40 days (35 for
electronic)
37 days (30 for
electronic)
37 days (30 for
electronic)

© Mouchel 2016 111
Instructions for Tendering and Guidance Notes;
Contract Data part one;
Form of Tender, Form of Agreement, Contract Data part two;
Works Information;
Contract Drawings;
Bill of Quantities;
Site Information; and
Pre-Construction Information.
The bidders will be expected to return the following information within their tender:
5.2.3.1 Quality Statement
The following information will be required in the Quality Statement:
Key staff and contract management – details of key individuals, including CVs
with their skills and experience. The site management and supervisory
arrangements, contract management arrangements and arrangements for the
management of sub-contractors.
Programme, including risk – detailed programme including the pre-
construction, construction and commissioning/handover phases of the project
with critical path analysis.
Construction – details of how the scheme would be constructed, taking the
site constraints into account. Evidence of experience undertaking similar
projects. Descriptions of how the safe operation of the construction site(s) will
be managed (including reference to traffic management).
Financial management – including details of any mitigation and avoidance
strategies to reduce risks to time, cost and quality, and any value engineering
efficiencies which have enabled the costs to be kept down.
Stakeholder management and communication – description of the bidder’s
approach to stakeholder engagement and management, including the use of
electronic and social media.
The completion of a Health and Safety questionnaire, provided by the
Council.
Insurance – details of insurance policies, including a statement undertaking
responsibility for dealing with claims, or parts of such claims, within the
excess amount.

© Mouchel 2016 112
Bidders will be given the opportunity to submit alternative designs (where
improvements to quality, cost, or delivery can be identified) as variant bids. If they
intend to do this, they will be requested to supply the following information:
The revised plans, drawings and documentation;
Schedule of changes from the original design;
Report on the Environmental Impact of the alternative design, including
mitigation measures;
A statement on how the outline Health & Safety Plan would change resulting
from the alternative design;
The following completed documents:
o Approval in Principle forms for each alternative structure;
o Addendum Approval in Principle Forms;
o Stage 1 Safety Audit Certificate.
5.2.3.2 Financial Statement
The following information will be required in the Financial Statement:
Completed Form of Tender;
Fully priced bill of quantities; and
Completed Contract Data part two.
If a variant bid is submitted in Part A then the following additional information will be
required:
A fully priced extension to the bill of quantities;
A statement setting out the cost savings; and
All other information required to be submitted at the tender stage.
Each tender will be assessed by pre-determined weightings to the sections of
information provided in the Quality and Financial Statements. A final assessment will
require the three top-scoring bidders to make a presentation to a tender assessment
panel and answer questions, usually based on the quality aspect of their submission.
5.2.4 Procurement method
The Council, with the services of Mouchel Consulting, has developed the scheme
through to preferred option stage during the production of this Outline Business

© Mouchel 2016 113
Case. Mouchel Consulting will be retained to produce the Full Business Case and
associated tasks, which will include undertaking the detailed design and preparing
the documents required for the NSIP / DCO process. This ensures continuity of
approach and retains invested scheme knowledge to build a robust defence against
any potential objections.
Considering that the detailed design will have been completed in order for the
construction contract to be tendered, allowing determination of the costs required for
inclusion in the Full Business Case, this scheme will be procured using a ‘traditional’
approach as opposed to ‘design and build’. This allows for a more efficient overall
programme and price, as it removes the need for the selected contractor’s designer
to take on the design. If this were to happen there would be a period following
contract award during which the contractor’s designer would need to appraise the
design and satisfy themselves with it, in order to adopt it as their own. This would
delay the start of the construction works. There would also be additional costs, both
in terms of the designer’s fees and in the contractor taking on design liability.
5.2.5 Form of contract
The Council will use the NEC3 Engineering and Construction (ECC) form of contract
which is the standard form of contract used for construction works in the UK. The
NEC3 ECC consists of a set of Core Clauses to which is added one of the following
Options A to F:
Option A: Priced with activity schedule;
Option B: Priced with bill of quantities;
Option C: Target cost with activity schedule;
Option D: Target cost with bill of quantities;
Option E: Cost reimbursable; and
Option F: Management contract.
Option A will be selected for this contract in order to provide increased levels of cost
certainty.
5.3 Sourcing Options
As described in Section 5.2, the scheme will be sourced through advertisement in
the Official Journal of the European Union (OJEU) due to its value. This will allow
companies from across the EU to bid for the work.
5.4 Payment mechanisms
Payment would be made to the contractor by monthly valuation with a BACS
payment within 28 days of issue of the initial valuation.

© Mouchel 2016 114
5.5 Pricing Framework and Charging Mechanisms
As discussed in Section 5.2.5, the NEC3 ECC contract will be used with Main Option
A. The contractor will therefore submit a priced activity schedule for the works at
tender stage which will be reviewed at each assessment date and payment made for
completed activities.
Secondary Option X7 will be included in the contract, defining the financial penalties
to be levied against the contractor if the works run beyond the completion date
shown in the accepted programme.
5.6 Risk Allocation and Transfer
The construction contract will include clauses to facilitate the transfer of appropriate
risks from the Council to the contractor, such as risks associated with construction
costs increasing above those predicted in the financial case.
The scheme costs currently include optimism bias and contingency associated with
risk, following the Quantified Risk Assessment (in alignment with the DfT guidance
on the production of Outline Business Cases). The detailed description of this
process is outlined with Section 6.8 in the Management Case. The risk of costs
being higher than currently predicted remains until the tendering process is
complete, which is the point that this risk can be transferred to the contractor.
The indicative allocation of risks resulting from the contractual and procurement
arrangements is summarised in the following table. At this Outline Business Case
stage, ticks have been provided to indicate where each risk type rests: with the
public sector (the Council / Government Treasury) or the private sector (the
consultants and contractors), or whether these risks are shared between the two. At
Full Business Case stage, once the procurement and contractual arrangements have
been finalised, these ticks will be converted into percentages.
Risk Category Public Private Shared
Design risk
Construction risk
Transition and implementation risk
Operating risk
Termination risks
Financing risks
Legislative risks
Table 5-1: Indicative Risk Allocation Table
5.7 Contract Length
The tender invitations will assume a construction period of 28 months. It is possible
that tender submissions will propose a shorter period than this, as the programme
contains elements of contingency following the risk assessment.

© Mouchel 2016 115
The contract programme is considered in further detail within the Management Case,
(Section 6). The key contract dates are included in Table 5-2.
Programme Activity Start Date End Date
Prequalification period June 2016 May 2017
Tender period (culminating in Council’s
appointment of the Preferred Bidder May 2017 September 2017
Development Consent process (including NSIP
decision) June 2016 February 2018
Award of Contract - February 2018
Detailed design (including technical approval
by the Council) May 2016 April 2017
Construction period (including mobilisation and
commissioning/handover) February 2018 November 2020
Third Crossing Opening - November 2020
Table 5-2: Key Contract Dates
5.8 Human Resource Issues
No significant human resources issues have been identified that could affect the
deliverability of the scheme. Further details of the required capabilities and assigned
resources are set out in the Management Case (Section 6).
However, the Suffolk County Council Project Manager for the scheme, identified
within the Management Case will need to be appointed. This appointment would be
initiated following approval to proceed to Full Business Case stage. The Council do
not anticipate any difficulties or delays in being able to appoint a resource to this
position. Furthermore, staff from either Suffolk County Council or the term contract
consultant (Mouchel Consulting or the wider Kier Group) could be placed in this role
in an interim basis whilst the appointment was being finalised.
5.9 Contract Management
The form of contract selected (Option A – Priced with activity schedule) provides the
Council with a suitable contract at construction to minimise risk, but with increased
ability to bring forward the detailed design process in the programme.
The Council will also provide officers to perform the role of contract manager and
create a small site supervision team.

© Mouchel 2016 116
6 The Management Case
6.1 Introduction
This chapter forms the management case for the Lake Lothing Third Crossing
scheme. It describes how the scheme will be delivered through project management
best practice, confirming that the timescales are realistic, and demonstrating that an
appropriate governance structure is in place to oversee the project.
Specifically the section provides and sets out:
evidence of similar projects;
programme and project dependencies
the governance structure (management framework);
the scheme / project scheduling (i.e. the development of the project
programme, and the process for monitoring progress against the milestones
within the programme);
the stakeholder management process (how stakeholders have been
identified, and their influence on the project managed);
the risk management process; and
how the benefits set out in the economic case will be monitored and realised.
6.2 Evidence of Similar Projects
The delivery of the scheme will build upon experience gained with a number of major
highway and transport schemes delivered by Suffolk County Council in recent times.
A selection of key schemes have been listed in Table 6-1, summarising the scope of
works, capital costs, time scales for implementation and the procurement strategy
employed. Opportunities will be taken, wherever possible, to improve delivery
processes, through acting upon lessons learnt.

© Mouchel 2016 117
No. Contract Description Works Date Form of Contract Approximate
Value
Project
Delivered
Successfully
1 Suffolk Highways
Services Contract
Fabrication, construction and
installation of a new pedestrian and
cycle bridge over the A14 at Bury
St Edmunds (Thingoe Hill to
Northgate Avenue).
April 2014 –
September 2014
Through the Support
Services Contract
(NEC)
£1,500,000 Yes
2 Suffolk Highways
Services Contract
Construction of a flood alleviation
scheme on the A12 at Blythburgh
which included the installation of
800m of steel sheet piling and earth
embankments.
May 2014 –
September 2014
Through the Support
Services Contract
(NEC)
£800,000 Yes
3 Competitive Tender
The B1115 Stowmarket Relief
Road was a major transport
scheme consisting of a new road
and alterations to the existing
Stowmarket inner relief road
(Gipping Way) to help to relieve
congestion around the town centre,
and to integrate new developments
on the outskirts of the town with the
town centre. It also included the
provision of a bridge over the
Norwich to London railway line and
removal of a level crossing.
May 2008 –
August 2010 NEC Option C £12,000,000 Yes
4 Suffolk Highways
Services Contract / OGC
‘Ipswich Transport Fit For the 21st
Century’ (Travel Ipswich scheme)
July 2012 –
September 2015
NEC Option B and
Through the Support £21,000,000 Yes

© Mouchel 2016 118
No. Contract Description Works Date Form of Contract Approximate
Value
Project
Delivered
Successfully
Framework / Competitive
Tender
was an integrated scheme
involving:
competitive tender for
reconstruction of two bus
stations (Old Cattle Market and
Tower Ramparts), one junction
and associated works;
OGC Framework Contract for
provision of Variable Message
Signing and Real Time
Passenger Information system;
Suffolk Highways Services
Contract for the modernisation
of traffic signal junctions and
connection into and
implementation of an Urban
Traffic Management and
Control system.
The scheme also included a
detailed programme of
improvements to walking and
cycling routes and crossings in and
around the town centre.
Services Contract
5 Lowestoft Southern Relief
Road
Construction of a new 3km single
carriageway relief road, as well as
January 2005 –
February 2007 NEC Contract £31,000,000 Yes

© Mouchel 2016 119
No. Contract Description Works Date Form of Contract Approximate
Value
Project
Delivered
Successfully
750m of ‘on-line’ widening and
other improvements to the existing
carriageway in order to maximise
key brownfield sites to the south of
Lake Lothing. It also provides an
Urban Traffic Management and
Control (UTMC) system, including:
SCOOT traffic signals;
Bus priority measures;
Real time passenger
information;
Variable Message Signing;
Air Quality monitoring.
The associated traffic management
measures were completed in early
2007, following the construction of
the main relief road (Tom Crisp
Way) in June 2006.
6
Mutford Lock
Refurbishment
(Competitive Tender)
Construction of Mutford Lock lift
bridges comprising a 12m span
steel bascule bridge with fixed
approach spans on both
approaches and an 8.6m span
timber overhead bascule pedestrian
bridge, together with associated
1992 ICE Conditions of
Contract £6,000,000 Yes

© Mouchel 2016 120
No. Contract Description Works Date Form of Contract Approximate
Value
Project
Delivered
Successfully
approach road / junction
improvements and reconstruction of
adjacent railway level crossing.
7 Eastern Highways
Alliance Framework 1
The Lowestoft Northern Spine
Road Phase 5 construction of a
1.5km section of single carriageway
road with one associated
roundabout connecting in to the
Trunk Road network.
July 2014 –
March 2015 NEC Option B £5,000,000 Yes
Table 6-1: Evidence of similar projects

© Mouchel 2016 121
6.2.1 Contractor experience
As important as the promoter’s experience in delivering the scheme will be the
selection of a contractor with significant experience of delivering similar large-scale,
complex bridge and highway construction projects. The selection and procurement of
the contractor is summarised in the Commercial Case, but the management of the
contractor is discussed within the project governance section below.
6.3 Programme / Project Dependencies
The Third Crossing scheme is a ‘stand-alone’ scheme, which can be delivered as
designed and costed independently. It is not dependent upon any other scheme or
project. Similarly, no other future projects or schemes are dependent upon it.
The scheme is, however, dependent upon a number of other activities (outlined
within the Project Programme), stakeholders and is subject to risks (as set out in the
Risk Register). The scheme is also dependent upon the receipt of Government
Funding, which could include the Local Majors Fund (announced in the Chancellors
Budget Statement, 25th November 2015). If the value for money of the scheme
cannot be demonstrated, it will not proceed past gateway points at Outline Business
Case Stage (Conditional Approval), or Full Business Case Stage (Full Approval), as
discussed in Section 6.6).
6.4 Project Governance, Organisation Structure and Roles
A well-functioning governance structure will be crucial to the successful delivery of
the scheme. Suffolk County Council (SCC) will therefore establish a Project Board, a
Project Delivery Team and a Stakeholder Group to work together to deliver the
scheme. This organisational and governance structure is illustrated in Figure 6-1.
6.4.1 Project Board
The Project Board’s primary function is decision-making and review, and will provide
strategic governance, as opposed the technical input of the Delivery Team. The
Board will be responsible for:
Managing the scheme and ensuring its successful delivery;
Keeping track of the contractor’s adherence to the project programme and
completion of milestones, ensuring the scheme is delivered within the
constraints of time and budget;
Providing guidance and support to the Project Manager;
Authorising necessary funds and spending (to the Contractor);
Stakeholder management; and
Managing risks (a shared responsibility with the contractor).

© Mouchel 2016 122
Figure 6-1: High-level governance structure for the Third Crossing project
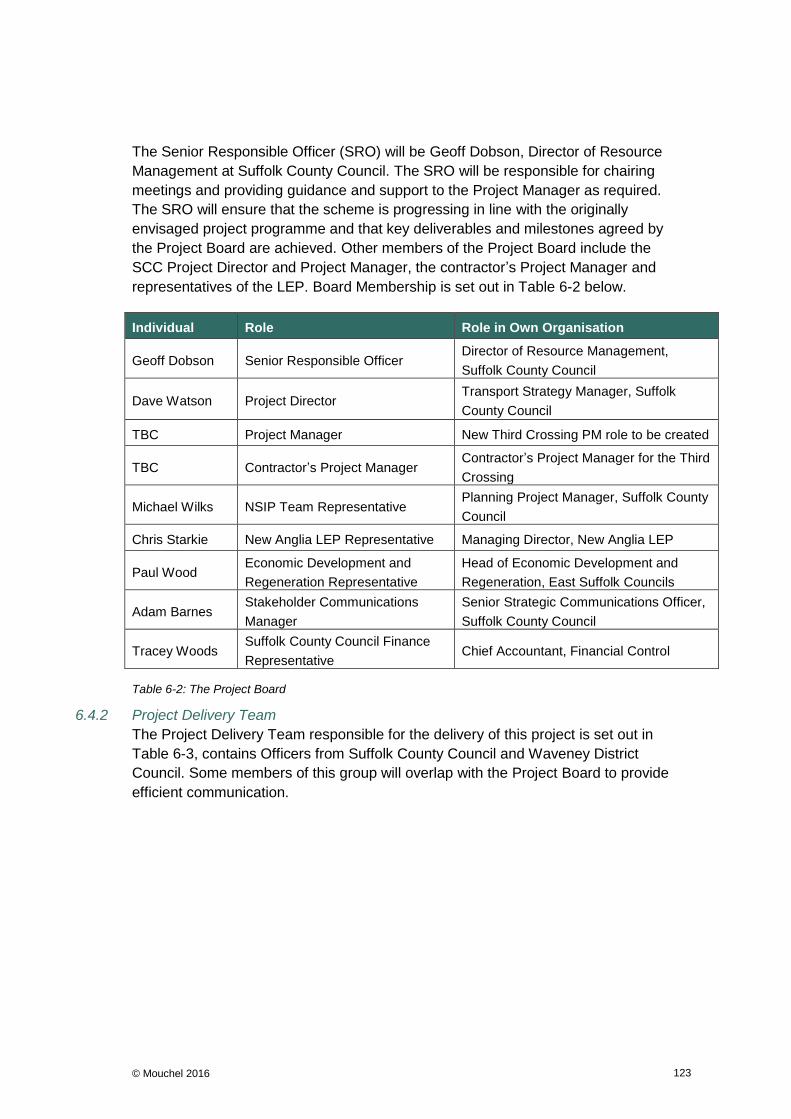
© Mouchel 2016 123
The Senior Responsible Officer (SRO) will be Geoff Dobson, Director of Resource
Management at Suffolk County Council. The SRO will be responsible for chairing
meetings and providing guidance and support to the Project Manager as required.
The SRO will ensure that the scheme is progressing in line with the originally
envisaged project programme and that key deliverables and milestones agreed by
the Project Board are achieved. Other members of the Project Board include the
SCC Project Director and Project Manager, the contractor’s Project Manager and
representatives of the LEP. Board Membership is set out in Table 6-2 below.
Individual Role Role in Own Organisation
Geoff Dobson Senior Responsible Officer Director of Resource Management,
Suffolk County Council
Dave Watson Project Director Transport Strategy Manager, Suffolk
County Council
TBC Project Manager New Third Crossing PM role to be created
TBC Contractor’s Project Manager Contractor’s Project Manager for the Third
Crossing
Michael Wilks NSIP Team Representative Planning Project Manager, Suffolk County
Council
Chris Starkie New Anglia LEP Representative Managing Director, New Anglia LEP
Paul Wood Economic Development and
Regeneration Representative
Head of Economic Development and
Regeneration, East Suffolk Councils
Adam Barnes Stakeholder Communications
Manager
Senior Strategic Communications Officer,
Suffolk County Council
Tracey Woods Suffolk County Council Finance
Representative Chief Accountant, Financial Control
Table 6-2: The Project Board
6.4.2 Project Delivery Team
The Project Delivery Team responsible for the delivery of this project is set out in
Table 6-3, contains Officers from Suffolk County Council and Waveney District
Council. Some members of this group will overlap with the Project Board to provide
efficient communication.

© Mouchel 2016 124
Individual Role Role in Own Organisation
TBC Suffolk County Council Project
Manager
New 3rd
Crossing PM role
to be created
Engineers x 3 Suffolk County Council
Engineering Leads
Highways/Structures
Engineers
Graeme Mateer Suffolk County Council
Transport Policy Lead
Transport Policy Specialist
Transport Strategy
Strategic Development
Mike Dowdall Suffolk County Council
Economic Development lead
Economic Development
Manager
Brian Foster
Suffolk County Council
Procurement lead
Senior Officer –
Procurement and Contract
Management
Michael Wilks NSIP Team Representative Planning Project Manager,
Suffolk County Council
Nick Collinson Suffolk County Council
Environment lead
Natural Environment
Manager
Table 6-3: Project Delivery Team
Additional discipline specialist expertise will be requested to attend the Delivery
Team as and when required.
6.4.3 Stakeholder Group
Representatives from the key statutory stakeholders (the DfT, Network Rail,
Highways England and Association of British Ports (ABP)) and project partners (i.e.
Waveney District Council, Suffolk and Waveney Chamber of Commerce and the
New Anglia LEP), and Peter Aldous, the Member of Parliament for Waveney will be
invited by the promoter (Suffolk County Council) to form a stakeholder group31 for the
scheme. This group will identify key constraints to scheme delivery, capture wider
stakeholder opinion and disseminate information to other stakeholder and the wider
public.
6.5 Programme / Project Plan
A project programme has been developed for this Outline Business Case setting out
all the key project tasks and their duration, the interdependencies between each of
the tasks, and key milestones and gateways. Certain elements of the programme
have built in tolerance / contingency to account for risks identified within the risk
register (which could have an impact upon the programme).
31 This group up until this point have formed the Steering Group for the scheme (discussed in
subsequent sections).

© Mouchel 2016 125
The programme will be a live document, with progress on planned task completion
being monitored against actual progress on a weekly basis by the project manager.
The Project Manager will report progress against plan to the Project Board.
A greater level of detail will be introduced into the programme during the Full
Business Case production, as detailed design of the scheme progresses and as risk
quantification and impacts change.
Construction is programmed to commence in February 2018 and will be completed
in November 2020. The programme key stages, developed in MS Project, are
illustrated in Figure 6-2.

© Mouchel 2016 126
Figure 6-2: Project Programme
6.6 Assurance and Approvals Plan
Responsibility for the assurance and approval of the Outline and Full Business
Cases rests initially with the DfT, who will assess the technical content of the
business cases against appropriate business case and transport appraisal guidance
in order to confirm that the scheme represents value for money to the taxpayer. The
DfT will then advise Transport Ministers to approve (or decline) the Business Case
and scheme.
The DfT typically follow a three-staged gateway process of funding approval:
Programme Entry. The Government’s commitment to the investigation of the
feasibility of the Lake Lothing Third Crossing scheme and the request to produce an
Outline Business Case, following earlier assessment, acted as the programme entry
agreement. This assessment was backed the New Anglia LEP.
Conditional Approval will occur following the DfT’s acceptance / approval of the
Outline Business Case (including its value for money). It is the gateway to proceed to
the development of the Full Business Case but does not guarantee full funding or
commitment to the scheme. It does provide the mandate for Suffolk County Council
to begin the process of obtaining the requisite statutory powers to construct the
scheme (including the NSIP / DCO / planning consents / compulsory purchase etc.).
Full Approval occurs after the selection of a preferred contractor following the
procurement process, which will achieve a fixed scheme cost and increased scheme
cost certainty. The Full Business Case will be submitted at this point and if approved,
Suffolk County Council will be able to start drawing down funding and begin
construction.
The promoter will liaise with the DfT and the New Anglia LEP to develop and agree
the Assurance and Approvals plan during the development of the Full Business
Case.
6.6.1 Local Contribution Funding Approval
The local funding contribution is discussed within the Financial Case. However, to
confirm, Suffolk County Council’s Section 151 Officer has underwritten the local
contribution. As a member of the Steering Group, the S151 Officer will also approve
the release of local funding, when satisfied and appropriate to do so.
6.7 Communications and Stakeholder Management Plan
Suffolk County Council’s approach to developing and maintaining the active support
and commitment of stakeholders and the community, to facilitate the timely and
successful implementation of the project, is described below.
A stakeholder management methodology, as set out in the Office of Government
Commerce (OGC) paper ‘Category Management Toolkit – Stakeholder Management
Plan’ will be adopted. This involves the systematic identification and mapping of
stakeholders; assessing stakeholder impacts; and managing any negative influences
and impacts.
The stakeholder management plan is closely linked with the risk management
strategy outlined within Section 6.8.
6.7.1 Stakeholder Identification
The following key stakeholders have the potential to influence the outcome of the
scheme, the project programme or project costs, and were identified at project
inception.
Peter Aldous MP;
Associated British Ports;
Department for Transport;
Environment Agency;
Highways England;
Lowestoft and Waveney Chamber of Commerce;
Lowestoft Vision;
Network Rail;
New Anglia LEP;
Suffolk Chamber of Commerce;
Suffolk County Council; and
Waveney District Council.
These stakeholders have been consulted on the project to highlight issues and
constraints which fed into the development of options set out in the Option Appraisal.
In addition to this process, a project steering group was formed to maximise the flow
of information and communication between statutory consultees, stakeholders and
project partners, so that relevant project constraints could be quickly identified and
mitigated against.
Other stakeholders contacted during the production of the business case include
local business, detailed below:
Arnolds Keys (Agent for Jeld Wen);

Boston Putford Offshore Safety Limited;
CEFAS;
Dudman Limited;
Excelsior Trust;
Haven Marine Ship Management Limited;
Holmans Marine Solutions;
International Boat Training College;
Kirkley Business Association;
Lowestoft Cruising Club;
Lowestoft Haven Marina;
National Oilwell Varco Limited;
Nexen Lift Trucks;
Northgate Marine Limited;
OGN Group;
Peter Colby Commercials;
Petans Limited;
Sembmarine SLP; and
Small & Co. (Marine Engineering) Limited.
Finally, two key stakeholder engagement events were organised to capture
stakeholder opinion and to feed into the stakeholder analysis: a public consultation
and a business consultation event.
6.7.2 Stakeholder Engagement – Public Consultation
Public consultation events to disseminate information on the preliminary optioneering
(option type, location and option development), to capture public opinion and degree
of support for the scheme, and to record and measure responses, were undertaken
on Friday 20th June and Saturday 21st June 2014. Full details of this consultation are
contained in Appendix O.

A formal presentation of work undertaken to date was followed by question and
answers. This format allowed the public an opportunity to debate the scheme with
officers from Suffolk County Council and Waveney District Council. The public were
also invited to complete a questionnaire to formally record their opinions for later
processing and analysis.
The public consultation events were advertised in several local press releases in the
local newspaper, and a poster was displayed at key locations around the town centre
(e.g. Lowestoft Library, Council offices and 60+ club) throughout the consultation
period.
For those members of the public unable to attend the consultation on the provided
dates, display boards were exhibited in the Marine Customer Service Centre,
Lowestoft, from Monday 23rd June to Sunday 20th July 2014. Copies of the display
boards and the online questionnaire were also available online until Wednesday 30th
July 2014.
Table 6-4 below summarises the responses of the public from 175 completed
questionnaires and online submissions.
Preferred Location Count %
Western 43 23.9%
Central 109 60.6%
Eastern – Option A 4 2.2%
Eastern – Option B 6 3.3%
Eastern – Option C 5 2.8%
Other 8 4.4%
No response given 5 2.8%
Total 18032
100.0%
Table 6-4: Results of questionnaire regarding preferred location
The results show that approximately 61% of the respondents favoured the central
crossing option, with key reasons given for their choices being:
It would link up to the Southern Relief Road and Peto Way; and
It would free up the existing eastern bridge (the bascule bridge) for buses,
taxis and local access.
32 Count exceeds number of respondents as 5 individuals gave more than one preferred
location

The second most favoured option was the western option, which was supported by
almost 24% of respondents. Key reasons for their choice are as follows:
It would allow for more sea-berth development;
It would make use of unoccupied industrial land;
It would take traffic away from the town centre, reducing congestion; and
The western part of town has seen major growth and the western crossing
would cater for this increased traffic.
8.3% of respondents favoured a crossing in an eastern location (though no single
option generated more than 3.3% of the responses), with key reasons being:
This is considered to be the most convenient for linking the Southern
Lowestoft Relief Road with the new Northern Spine Road and Denmark
Road;
It would leave the existing bridges for local traffic; and
It could bridge the railway line to the north of the Lake (another barrier to
travel and movement in the town).
4.4% of respondents did not favour any of the proposed locations, with responses for
alternative options including:
A fly-over bridge, crossing both the river and railway, starting from Peto Way
roundabout;
A crossing from Riverside Road across to Rotterdam Road;
A four lane bridge to maximise bridge capacity; and
A plan that does not involve a single lifting bridge.
This information was used in the development and refinement of further options, and
in the formal option assessment process described and reported on in Section 2.13.
The key outcome from this event was the clear preference for a crossing in the
central location, and a clear vote against a crossing in an eastern location.
Should this business case proceed to Full Business Case stage (following sign-off
from the DfT and Transport Ministers), further public consultation will be undertaken
during the DCO process.
6.7.3 Stakeholder Engagement – Business Engagement
An extensive engagement exercise was undertaken involving local businesses in
September 2015. The objectives were:

to understand the impacts of congestion on existing business activities and
the extent to which it constrains prospects for growth;
to understand the likely value that a third crossing would add for local
businesses; and
to determine which route corridor would be most acceptable to local
businesses.
The exercise was commissioned by Suffolk County Council and the Suffolk Chamber
of Commerce and undertaken by the Suffolk Business School. It was also supported
by Lowestoft and Waveney Chamber of Commerce, Lowestoft Vision, the Institute of
Directors, the Federation of Small Businesses, New Anglia LEP Local Transport
Board, Invest in Suffolk, and NWES, each of whom sent details of the survey to their
members. Links to the survey and the event invitation were publicised on Twitter and
LinkedIn as a way to attempt to reach as many businesses as possible. The exercise
involved an online survey and a business consultation event in Lowestoft.
Survey
The survey was developed through the use of questions derived from Office for
National Statistics and Scottish Executive guidance on the calculation of value-
added in similar proposals. Three ‘free text’ questions were included to prompt
respondents to explain the impact of the current situation and proposed changes to
their business. 151 businesses responded to the online survey.
Consultation event
Businesses in the area were also invited to a consultation event at which the
consultation and business case work were explained and at which discussions on
the plans were held. 77 businesspeople attended representing a broad range of local
businesses of all sizes and from a variety of sectors.
The full study report is included in Appendix C. Key results are summarised below.
Key survey findings
More than 70% of the responses were from businesses with fewer than 24
employees. The majority of respondents reported a turnover of over £1 million in the
previous year, indicating that the responses are from business making a significant
economic contribution to the area.
A majority of respondents reported that traffic causes “very significant problems”
to their business, as illustrated in Figure 6-3 below.
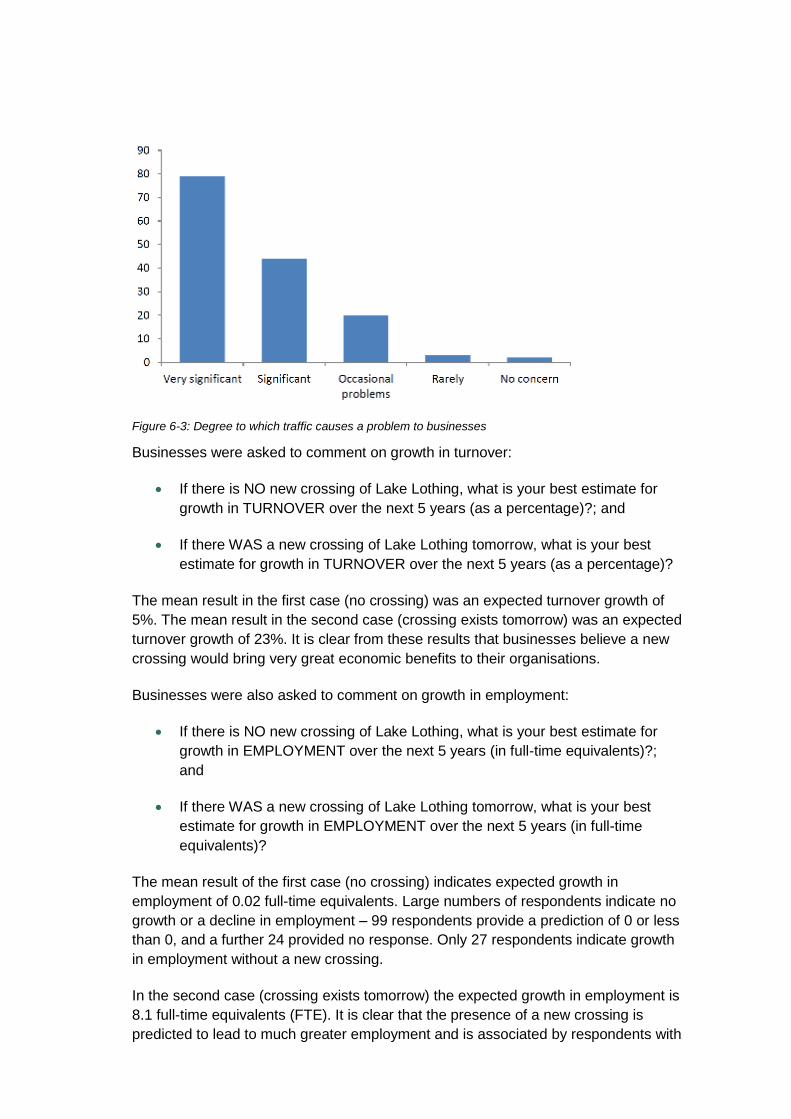
Figure 6-3: Degree to which traffic causes a problem to businesses
Businesses were asked to comment on growth in turnover:
If there is NO new crossing of Lake Lothing, what is your best estimate for
growth in TURNOVER over the next 5 years (as a percentage)?; and
If there WAS a new crossing of Lake Lothing tomorrow, what is your best
estimate for growth in TURNOVER over the next 5 years (as a percentage)?
The mean result in the first case (no crossing) was an expected turnover growth of
5%. The mean result in the second case (crossing exists tomorrow) was an expected
turnover growth of 23%. It is clear from these results that businesses believe a new
crossing would bring very great economic benefits to their organisations.
Businesses were also asked to comment on growth in employment:
If there is NO new crossing of Lake Lothing, what is your best estimate for
growth in EMPLOYMENT over the next 5 years (in full-time equivalents)?;
and
If there WAS a new crossing of Lake Lothing tomorrow, what is your best
estimate for growth in EMPLOYMENT over the next 5 years (in full-time
equivalents)?
The mean result of the first case (no crossing) indicates expected growth in
employment of 0.02 full-time equivalents. Large numbers of respondents indicate no
growth or a decline in employment – 99 respondents provide a prediction of 0 or less
than 0, and a further 24 provided no response. Only 27 respondents indicate growth
in employment without a new crossing.
In the second case (crossing exists tomorrow) the expected growth in employment is
8.1 full-time equivalents (FTE). It is clear that the presence of a new crossing is
predicted to lead to much greater employment and is associated by respondents with
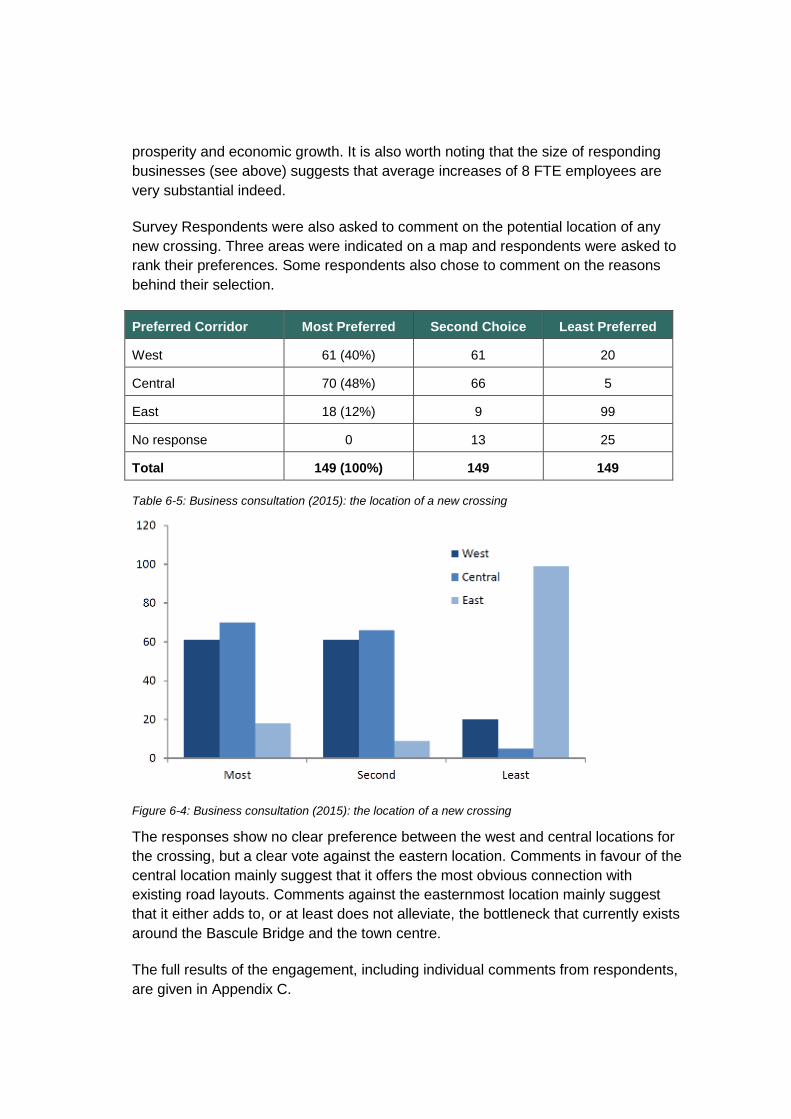
prosperity and economic growth. It is also worth noting that the size of responding
businesses (see above) suggests that average increases of 8 FTE employees are
very substantial indeed.
Survey Respondents were also asked to comment on the potential location of any
new crossing. Three areas were indicated on a map and respondents were asked to
rank their preferences. Some respondents also chose to comment on the reasons
behind their selection.
Preferred Corridor Most Preferred Second Choice Least Preferred
West 61 (40%) 61 20
Central 70 (48%) 66 5
East 18 (12%) 9 99
No response 0 13 25
Total 149 (100%) 149 149
Table 6-5: Business consultation (2015): the location of a new crossing
Figure 6-4: Business consultation (2015): the location of a new crossing
The responses show no clear preference between the west and central locations for
the crossing, but a clear vote against the eastern location. Comments in favour of the
central location mainly suggest that it offers the most obvious connection with
existing road layouts. Comments against the easternmost location mainly suggest
that it either adds to, or at least does not alleviate, the bottleneck that currently exists
around the Bascule Bridge and the town centre.
The full results of the engagement, including individual comments from respondents,
are given in Appendix C.

6.7.4 Steering Group
Representatives from the key statutory stakeholders (the DfT, Network Rail,
Highways England and Association of British Ports (ABP)) and project partners (i.e.
Waveney District Council, Suffolk and Waveney Chamber of Commerce and the
New Anglia LEP), were invited by the promoter (Suffolk County Council) to form a
steering group to oversee the development of the scheme. Individuals from the
group will become the stakeholder group, described above during the development
of the Full Business Case.
This group, chaired by Peter Aldous, the MP for Waveney and scheme champion,
aims to identify key constraints to scheme delivery, capture wider stakeholder
opinion, disseminate information to other stakeholder and the wider public, to steer
the development of the scheme, and monitor progress of the scheme and
development of the business case.
6.7.5 Association of British Ports (ABP)
ABP has been consulted during the development of the initial design. However,
before they could fully support the scheme, they would need to understand more
detail of the potential impacts on the Port and how it may impact on their future
plans, strategies and investment in Lowestoft. ABP will therefore be engaged
monthly to identify specific design issues. This affords the opportunity for any
designs, during the detailed design process, to be adapted to mitigate any potential
adverse impact upon the Port.
It has been agreed already with the Steering Group and ABP that a ‘boat simulation’,
using an ABP-assigned pilot, which will be developed by the boat college, will be
undertaken to ascertain how the proposed bridge will impact upon vessel movement
and activity.
In order to determine in detail the potential negative economic impact of the scheme
on future investment plans by ABP, which might have the effect of slightly reducing
the wider scheme benefits, the development of a bespoke methodology will be
necessary. This will be discussed with the DfT and ABP during further development
of the scheme. Given the small footprint of the bridge, and the mitigation strategies
which will flow from the stakeholder group, this negative impact is considered to be
minimal at this stage.
6.7.6 Lake Lothing Third Crossing website
A website has been set-up in order to provide current and up-to-date information
relating to the progress of the Lake Lothing Third Crossing project. This will update
local residents and businesses on the progress of the transport business case,
funding streams and approvals for the scheme, amongst other relevant information.
This will ensure that all stakeholders and local residents are kept aware of the latest
developments relating to the scheme. The website can be found at the following
URL: www.lowestoftcrossing.co.uk.

6.7.7 Resources
The communication activities for this scheme will be resourced by both Suffolk
County Council and Waveney District Council’s Corporate Communications Team.
Adam Barnes is the Senior Strategic Communications Officer at Suffolk County
Council and will be the named communications lead for this scheme. Phil Harris is
the Communications Manager at Waveney District Council.
6.7.8 Communication Protocols
All communications regarding the scheme will be approved by the Council’s
Corporate Communications Team.
6.7.9 Notice of works
All requirements for the advance notice of works will be led by the contractor. The
contractor will be required to identify all the communication activities necessary to
support a proposed start of works date and ongoing construction milestones.
6.8 Risk Management Strategy
Risk management is the methodical approach to identifying, quantifying and
managing risks that occur during the lifecycle of a project. The key to effectively
mitigating risks is to develop a series of well-defined steps to support better decision-
making through an understanding of the potential risks inherent to a scheme and
their likely impact. Annex 4 of Treasury Green Book emphasises that “effective risk
management helps the achievement of wider aims, such as: effective change
management; the efficient use of resources; better project management; minimising
waste and fraud; and supporting innovation”.
The Book recommends a four-stage process which is broadly cyclical (plan-do-
review) requiring on-going review and update of risks to ensure that effective
controls are implemented during scheme development and delivery. The risk
management strategy is illustrated in Figure 6-5.
Identify Risks
Assess & Evaluate
Establish Response Plan
& Responsibilities
Implement & Review

Figure 6-5: Risk Management Strategy
6.8.1 Risk management process
Risk management is seen as a key process underpinning good scheme governance
and achievement of scheme objectives in a cost effective manner. TAG Unit A1.2
requires all project related risks, which may impact on the scheme costs, to be
identified and quantified in a Quantified Risk Assessment (QRA) to produce a risk-
adjusted cost estimate.
The outcome of the QRA process is the prediction of an ‘expected’ risk value which
is the average of all risk outcomes, factoring in the various probabilities of these risks
materialising. This ‘expected’ value effectively becomes the ‘risk adjusted cost
estimate’. The risk assessment has been undertaken using the following four-stage
process:
Risk identification;
Risk quantification;
o Assessing the impacts of risk;
o Assessing the likelihood of risk; and
Managing risk.
This process is described below.
6.8.2 Risk identification
For this scheme, risks have been identified during multi-disciplinary discussions,
including inputs from technical experts in highway and structural engineering,
geotechnical, planning, transport planning, quantity surveyors and environmental
disciplines. Suffolk County Council and Waveney District Council have also provided
input for the risk identification process. These risks have been catalogued within a
risk register, which is contained within Appendix P.
The scheme risks can largely be grouped into the following categories:
Risks to the project programme;
Political risks;
Risks to scheme cost;
Risks to scheme funding;
Risks to the operation of the transport network;

Design and information risks;
Health and safety risks;
Reputational risks; and
The risk to impact on existing highway network.
6.8.3 Quantification of risks
6.8.3.1 Assessing the impact of risk (costs)
Each risk has been evaluated in terms of the cost outcomes of the risk. Whilst DfT
recommends33 the use of empirical evidence to estimate a range of cost outcomes,
wherever possible, it is noted that ‘common sense approximations’ should be used
when such empirical data is not available, rather than aiming for unrealistic levels of
accuracy. At this stage, the cost range associated with the consequences of each
risk was estimated, where the 85th percentile is the most likely value. The estimates
have been derived following input from each discipline specialist working alongside
the Quantity Surveyor, to ensure estimates of cost (and probability, discussed within
the next section) are complete and accurate, and consistent with the basis of the
base cost estimate.
6.8.3.2 Estimating the likelihood of the outcomes occurring
Having estimated the likely impact (in cost terms), the likelihood (probability) of the
risk occurring also needs to be estimated. Assigning probabilities is not an exact
science34 and therefore the scheme team technical specialists, including Quantity
Surveyors, have had to apply a degree of judgement based experience gained from
working on other similar projects (as noted within Section 6.2).
Once the ‘impacts’ and ‘probabilities’ have been estimated, the risks were mapped
onto a 5-point risk matrix (see Table 6-6) to generate an overall ‘risk score’.
Each risk has been assigned a likelihood rating, which is expressed in terms of a
percentage. This has been multiplied by the estimated financial value of the risk
occurring, to give an expected value. The sum of these expected values forms the
total included in the financial case as the ‘cost of risks identified in quantified risk
assessment’.
33 TAG Unit A1.2, p8, para 3.2.10
34 TAG Unit A1.2 scheme Costs, p8, para 3.2.14

The Risk Matrix
Overall Risk = Impact x
Probability
HIGH RISK
Negligible Unlikely Possible Probable Almost Certain
MEDIUM RISK
Very Low Low Medium High Very High
LOW RISK
<5% 6-20% 21-50% 51-80% >80%
IM
PA
> 5% >
20% Major
Very High / Showstopper 5 10 15 20 25
3 to 5% 10 to 20%
Large High 4 8 12 16 20
1 to 3% 5 to 10%
Moderate Medium 3 6 9 12 15
0.5 to 1% 1 to 5%
Minor Low 2 4 6 8 10
< 0.5% < 1% Minimal Very Low 1 2 3 4 5
Cost as % of
Project cost (not
just fees)
Time Quality Overall IMPACT
Score
Cost / time and quality may be affected differently by a single risk. If overall risk is required, use the most severe
affected component or give consideration to managing each separately.
Table 6-6: Impact / Probability Matrix
6.8.3.3 Deriving the probability distribution for the costs of the scheme
As mentioned above, the outcome of the QRA process is the prediction of an
‘expected’ value which is the average (or a percentile) of all risk outcomes, weighted
by the various probabilities of these outcomes materialising. It is to this ‘expected’
value, also known as the ‘mean’ or ‘unbiased’ risk adjusted outcome, that the
optimism bias has been applied. A probability distribution around the costs of the
scheme has been derived using @Risk v6.335 and is illustrated in Figure 6-6 and
Figure 6-7 below.
These graphs provide the following values of risk. The mean cost has been used in
the preparation of the overall scheme cost as it is the ‘expected value’ which
represents the weighted average of all outcomes and probabilities36.
35 @Risk v6.3 is a proprietary software that performs risk analysis using Monte Carlo
simulation. The software carries out 10,000 iterations per run, randomly creates simulations
of differing risk occurrence scenarios and estimates a range of risk costs
36 TAG Unit A1.2: scheme Costs, p9, paragraph 3.2.18 (2014)
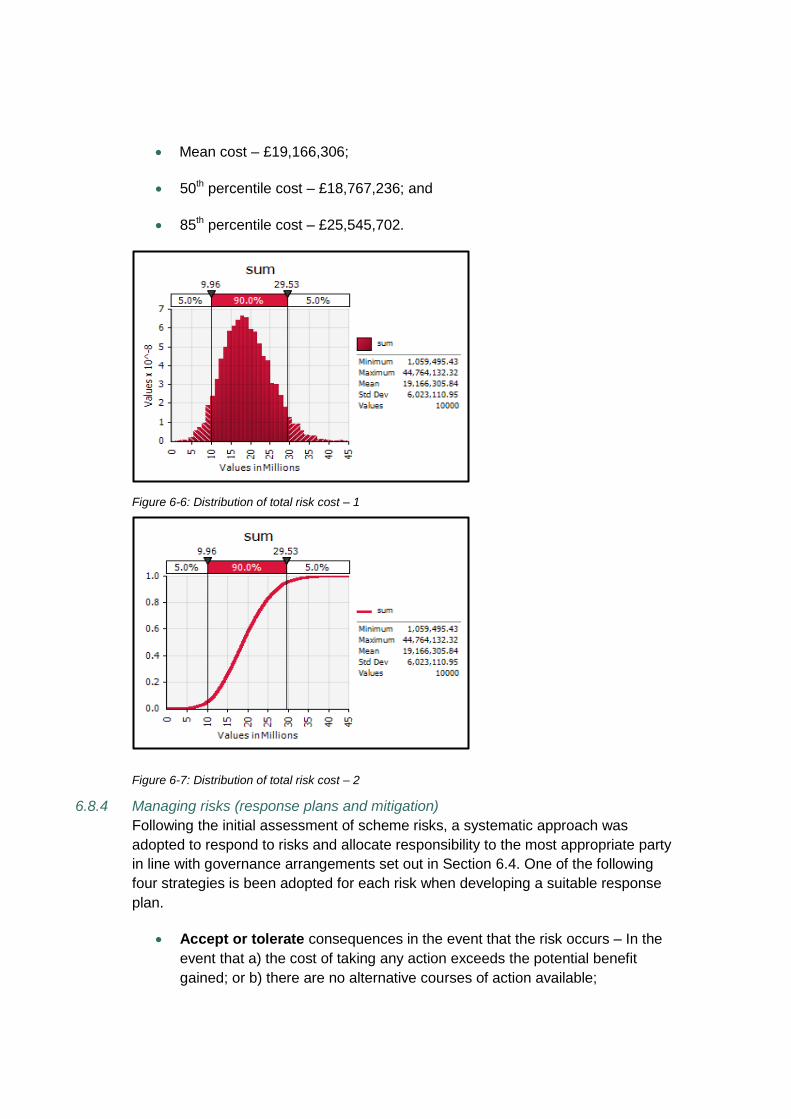
Mean cost – £19,166,306;
50th percentile cost – £18,767,236; and
85th percentile cost – £25,545,702.
Figure 6-6: Distribution of total risk cost – 1
Figure 6-7: Distribution of total risk cost – 2
6.8.4 Managing risks (response plans and mitigation)
Following the initial assessment of scheme risks, a systematic approach was
adopted to respond to risks and allocate responsibility to the most appropriate party
in line with governance arrangements set out in Section 6.4. One of the following
four strategies is been adopted for each risk when developing a suitable response
plan.
Accept or tolerate consequences in the event that the risk occurs – In the
event that a) the cost of taking any action exceeds the potential benefit
gained; or b) there are no alternative courses of action available;

Treating the risk – Continuing with the activity that caused the risk by
employing four different types of control including preventative, corrective,
directive and detective controls37;
Transferring the risk – Risks could be transferred to a third party e.g. insurer
or contractor; and
Terminating the activity that gives rise to the risk.
Development of the response plans to manage risks have been undertaken only
where the likelihood and of occurrence and impact can be risks can be cost
effectively managed.
6.8.5 Implementation and review
Effectiveness of the response plan is dependent on the proper implementation and
review of the residual risk (including any secondary risk associated with
implementation). Reviews of the status of scheme risk assessments and their related
response plans (as part of project reporting) will be an integral part progress
meetings (and at the Project Board) during progression of detailed design and the
construction period. All key risks will be formally reviewed at key decision points in
the scheme lifecycle.
6.9 Benefits Realisation Plan
A Benefits Realisation Plan will be prepared for the Lake Lothing Third Crossing
scheme. The plan is designed to enable benefits, and disbenefits, that are expected
to be derived from the project, to be planned for, managed, tracked and realised.
The plan will help demonstrate whether the scheme objectives identified in Section
2.7 are able to generate the desired ‘measures for success’. This can be assessed
by tracking and realising the desired outputs and outcomes of the project.
Desired outputs are those tangible effects that are funded and produced directly as a
result of the scheme. Desired outcomes are the final impacts brought about by the
scheme in the short, medium and long-term. The scheme objectives, together with
the desired outputs and outcomes, are summarised in Table 6-7.
Scheme Objectives Desired Outputs Desired Outcomes
To open up opportunities for
regeneration and
development in Lowestoft
A scheme that improves the
traffic issues currently
experienced by business
users and residents by
providing a third road
Reduced congestion on the
approaches to the existing
bridges
Reduced journey time and
To provide the capacity
needed to accommodate
37 The Orange Book, HM Treasury (2004)
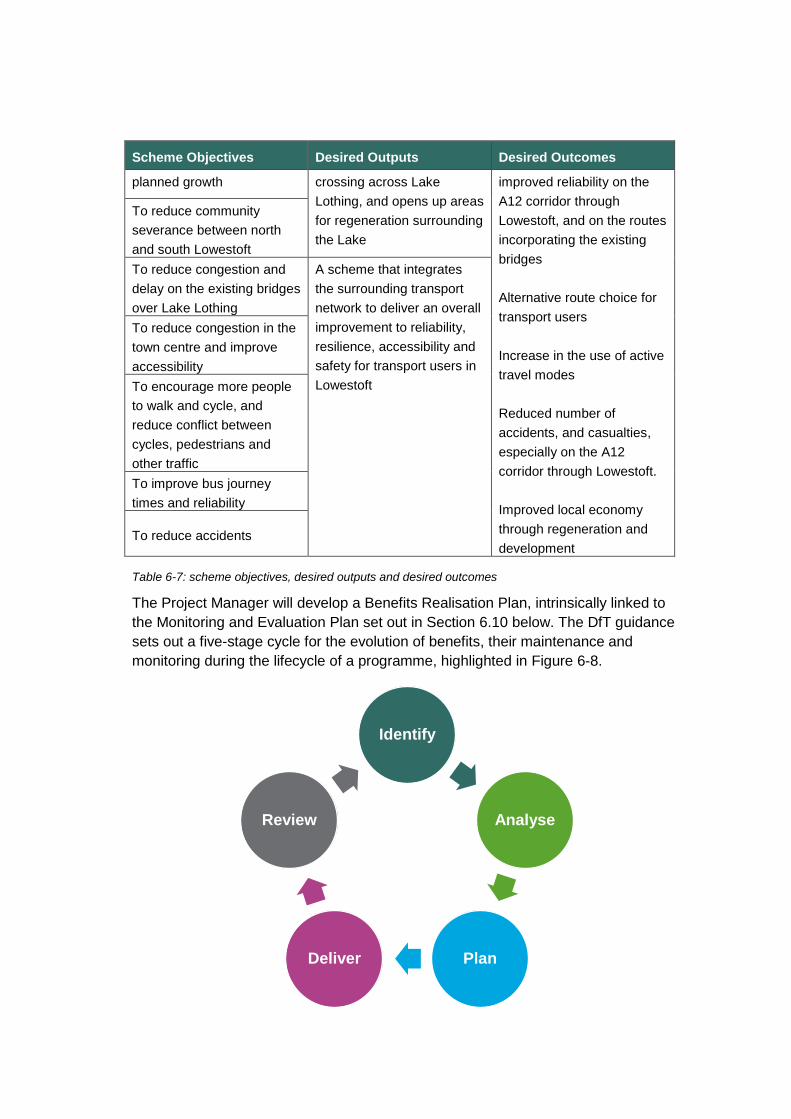
Scheme Objectives Desired Outputs Desired Outcomes
planned growth crossing across Lake
Lothing, and opens up areas
for regeneration surrounding
the Lake
improved reliability on the
A12 corridor through
Lowestoft, and on the routes
incorporating the existing
bridges
Alternative route choice for
transport users
Increase in the use of active
travel modes
Reduced number of
accidents, and casualties,
especially on the A12
corridor through Lowestoft.
Improved local economy
through regeneration and
development
To reduce community
severance between north
and south Lowestoft
To reduce congestion and
delay on the existing bridges
over Lake Lothing
A scheme that integrates
the surrounding transport
network to deliver an overall
improvement to reliability,
resilience, accessibility and
safety for transport users in
Lowestoft
To reduce congestion in the
town centre and improve
accessibility
To encourage more people
to walk and cycle, and
reduce conflict between
cycles, pedestrians and
other traffic
To improve bus journey
times and reliability
To reduce accidents
Table 6-7: scheme objectives, desired outputs and desired outcomes
The Project Manager will develop a Benefits Realisation Plan, intrinsically linked to
the Monitoring and Evaluation Plan set out in Section 6.10 below. The DfT guidance
sets out a five-stage cycle for the evolution of benefits, their maintenance and
monitoring during the lifecycle of a programme, highlighted in Figure 6-8.
Identify
Analyse
Plan Deliver
Review
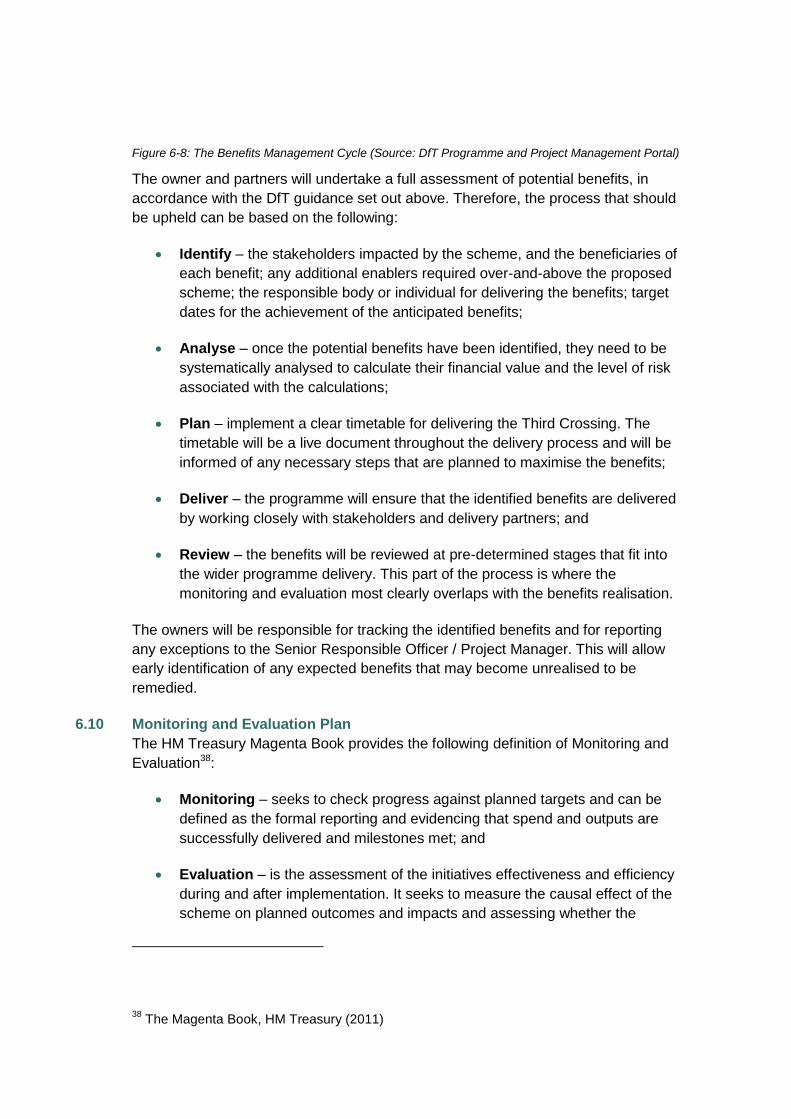
Figure 6-8: The Benefits Management Cycle (Source: DfT Programme and Project Management Portal)
The owner and partners will undertake a full assessment of potential benefits, in
accordance with the DfT guidance set out above. Therefore, the process that should
be upheld can be based on the following:
Identify – the stakeholders impacted by the scheme, and the beneficiaries of
each benefit; any additional enablers required over-and-above the proposed
scheme; the responsible body or individual for delivering the benefits; target
dates for the achievement of the anticipated benefits;
Analyse – once the potential benefits have been identified, they need to be
systematically analysed to calculate their financial value and the level of risk
associated with the calculations;
Plan – implement a clear timetable for delivering the Third Crossing. The
timetable will be a live document throughout the delivery process and will be
informed of any necessary steps that are planned to maximise the benefits;
Deliver – the programme will ensure that the identified benefits are delivered
by working closely with stakeholders and delivery partners; and
Review – the benefits will be reviewed at pre-determined stages that fit into
the wider programme delivery. This part of the process is where the
monitoring and evaluation most clearly overlaps with the benefits realisation.
The owners will be responsible for tracking the identified benefits and for reporting
any exceptions to the Senior Responsible Officer / Project Manager. This will allow
early identification of any expected benefits that may become unrealised to be
remedied.
6.10 Monitoring and Evaluation Plan
The HM Treasury Magenta Book provides the following definition of Monitoring and
Evaluation38:
Monitoring – seeks to check progress against planned targets and can be
defined as the formal reporting and evidencing that spend and outputs are
successfully delivered and milestones met; and
Evaluation – is the assessment of the initiatives effectiveness and efficiency
during and after implementation. It seeks to measure the causal effect of the
scheme on planned outcomes and impacts and assessing whether the
38 The Magenta Book, HM Treasury (2011)

anticipated benefits have been realised, how this was achieved, or if not, why
not.
The DfT has also published a document entitled, ‘Monitoring and Evaluation
Framework for Local Authority Major Schemes’ (2012), designed to make the
process as consistent and proportionate as possible. It also aimed to be
complementary with the devolution of decision making. The document sets out three
levels of monitoring and evaluation:
Standard monitoring;
Enhanced monitoring; and
Fuller evaluation.
All schemes are required to conduct the ‘standard monitoring’ approach, whereas
schemes costing more than £50 million are expected to follow the ‘enhanced’
guidance. Only selected schemes, identified by the DfT are expected to conduct
‘fuller’ evaluation. As the Third Crossing scheme will have an expected outturn cost
of above £50 million, it will follow the DfT’s enhanced monitoring guidance. It is
expected that the scheme will undertake enhanced monitoring in addition to the
standard measures. The measures that fall into the ‘enhanced monitoring’ category
are summarised in Table 6-8.
Item Stage Collection Timing Rationale Information Required
Noise Impact
Pre or during
delivery / post
opening (up to 5
years)
Accountability /
Knowledge
Effect of the scheme on
noise levels at important
receptor locations and
analysis of the difference
between outturn results
and scheme forecasts
Local Air
Quality Impact
Pre or during
delivery / post
opening (up to 5
years)
Accountability /
Knowledge
Effect of the scheme on
local air quality in the
area of interest and
analysis of the difference
between outturn results
and scheme forecasts
Accidents Impact
Pre or during
delivery / post
opening (up to 5
years)
Accountability /
Knowledge
Effect of the scheme on
traffic accidents in the
area of interest and
analysis of the difference
between outturn results
and scheme forecasts
Table 6-8: Enhanced monitoring measures
The Monitoring and Evaluation Plan for the Third Crossing project is set out below.

6.10.1 Description
A full description of the scheme has been provided in 1.4.
6.10.2 Logic Model
A logic model is shown in Figure 6-9. It provides an illustrative overview of the inputs
and activities of the scheme, and refers to its outcome measures of performance.
Figure 6-9: Logic Model
6.10.3 Type of Evaluation
The type of evaluation method proposed to evaluate the scheme will be an ‘outcome
evaluation’. Outcome evaluations compare the existing situation, i.e. before the
intervention (the Lake Lothing Third Crossing) has been introduced, against the
situation with the intervention in place. Any observed changes (in the metrics
described in Sections 6.10.4 and 6.10.5 below) are assumed to be the result of the
intervention.
6.10.4 Data requirements
The metrics proposed for the Lake Lothing Third Crossing project, associated data
collection requirements and frequency of data collection are as follows:
Metric Frequency Data
INPUTS
Expenditure Post Opening Financial monitoring of project
Funding Breakdown Post Opening Financial monitoring of project
In kind resources provided During delivery Monitoring of resources delivering the
project (use of project diary)
Input:
Capital and revenue
investment, staffing &
skills, procurement & delivery of
services
Activities:
Construction of a third
road crossing over Lake Lothing
Output:
A Third Crossing over Lake
Lothing with associated sustainable
travel measures
Direct Outcomes:
Improvement to journey
time reliability on
the A12 corridor;
decreased congestion in
the town centre & on
the approaches
to the existing bridges;
reduction in vehicular
emissions in the town centre
Indirect Outcomes:
Increased economic activity in Lowestoft; improved access to
employment & local
services, facilitation of
local development (e.g. Kirkley
Rise)

Metric Frequency Data
OUTPUTS
Delivered scheme Post Opening
Full description of implemented scheme
outputs including design changes post
funding approval with reasons for such
changes, post scheme as built drawings
of works completed
OUTCOMES
Air quality
Pre and post
construction,
Annual up to 5
years post
opening
Data from continuous monitoring
stations located in the vicinity of the
Third Crossing
Average daily traffic and by
peak / non-peak periods
Pre and post
construction,
Years 1 and 5
post opening
Annual ATCs and turning counts,
collected at junctions where
interventions are and wider ATCs
across the network
Average AM and PM peak
journey time on key routes
(journey time
measurement)
Pre and post
construction,
Years 1 and 5
post opening
Journey time surveys and DfT
Congestions Statistics on LA A Roads
Cycling and walking usage
Pre and post
construction,
Years 1 and 5
post opening
Mode share surveys (including walking,
cycling and public transport – bus, rail &
Park and Ride)
Accident and casualty rates
Pre and post
construction,
Years 1 and 5
post opening
Annual monitoring of collisions (STATS
19)
Average annual CO2
emissions
Pre and post
construction,
Years 1 and 5
post opening
DfT’s Local Authority Carbon Toolkit
Table 6-9: Data requirements and frequency of data collection
6.10.5 Sources of Data
The following surveys will be undertaken by Suffolk County Council and Waveney
District Council:
Journey times;
Automatic Traffic Counts (ATCs);

ANPR survey;
Turning counts; and
Mode share.
Other data will be collected by the Council on an annual basis including accidents
(STATS19), financial and planning data (e.g. Annual Monitoring Report), retail sales
and Lowestoft footfall figures.
6.10.6 Implementation
Resourcing
The monitoring and evaluation for the Lake Lothing Third Crossing project will be
undertaken by Suffolk County Council. The surveys cost will be calculated at Full
Business Case stage and will be funded through Suffolk County Council’s monitoring
budget.
Timing
Prior to starting on site, any gaps in the required baseline evidence will be collected.
A baseline evidence report will be completed by February 2018, prior to construction
of the crossing. Regular monitoring reports will be provided on a quarterly basis to
the New Anglia LEP / DfT in terms of progress against programme, costs and risks.
In addition, an annual monitoring summary will be undertaken. Principles of
monitoring and evaluation will be in line with Highway England Post Opening Project
Evaluation (POPE) requirements.
POPE for the scheme will use baseline data to be collected from 2016, which will
include journey times, traffic flows, traffic speeds and accidents alongside planning
data. Data will then be collected one year and five years post opening (2021 and
2025), which will be compared against the baseline data to quantify the extent of
benefits realised. ‘1 year after’ and ‘5 year after’ evaluation reports will be produced,
which contains the results of a meta-analysis of all scheme evaluations carried out
so far, highlighting any interesting and emerging trends. It is, however, anticipated
that wider economic benefits may take longer time frames to manifest. This would
invariably have a bearing on the timing of surveys and subsequent reporting.
6.10.7 Responsibility
Details of the individual responsible for implementing the monitoring and evaluation
plan, at Suffolk County Council, are set out in Table 6-10 below.
Name Dave Watson
Address Endeavour House, 8 Russell Road, Ipswich, Suffolk, IP1 2BX
Telephone 01473 264822
Email [email protected]

Table 6-10: Details of the individual responsible for the monitoring and evaluation plan
Setting targets
The Council recognises the importance of setting specific indicators and targets, and
accepts that the Monitoring and Evaluation Plan does not yet include these. The
Plan will be updated in the Full Business Case to include these. It may be possible to
involve stakeholders to take ownership of some parts of the monitoring and
evaluation; this will become clearer after the consultation phase.
6.10.8 Summary of analysis
The monitoring and evaluation will be used to answer the following key questions:
1. Have the anticipated outcomes and impacts been achieved?
To what extent are the observed changes additional to what would have
happened in the absence of the intervention?
Were there any unanticipated impacts / displacement effects?
Which elements of the scheme were particularly influential in achieving
the overall goals?
What lessons can be learnt for future scheme / policy development?
What is the contribution of the policy to the LEPs strategic goals?
2. To what extent did the anticipated costs and benefits match the actual
outcome?
3. Has the scheme been successful? If not, why not?
The evaluation of the scheme will:
Measure the level of traffic congestion on the existing network;
Measure the level of traffic congestion on the improved network; and
Measure the levels of accidents on the existing and improved network.
The initial one year impact assessment will be used to understand the impact mainly
on journey times and travel patterns. There may be some evidence at this stage of
the scheme impact in terms of developments and jobs. The 5 year assessment will
look at longer term benefits including accidents, travel patterns and jobs / additional
investment.

6.10.9 Linking indicators to outcomes
It is important to demonstrate how the proposed indicators relate to the desired
outcomes. The Monitoring and Evaluation Plan will therefore be updated in the Full
Business Case. A more detailed logic map / causal chain diagram was a contained
within the Strategic Case. This will show how interventions link to the achievement of
objective is provided below, and how these can be monitored either directly or
indirectly.
6.10.10 Uses of evaluation
With such emphasis on economic impact, the Monitoring and Evaluation will have to
consider attribution of outcomes to the intervention and whether a clear link between
the delivery of the scheme and the wider economic benefits can be achieved. As
such, Suffolk County Council’s partners will work with the LEP and DfT to consider
any additional longer term evaluation work to undertake case studies or meta-
analysis in order to further understand the economic benefits arising from the Third
Crossing project, subject to availability of resources.

7 Appendices

Appendix A – Options Assessment Report

Appendix B – Lake Lothing and Outer Harbour Area Action Plan (AAP)

Appendix C – Business Consultation Report

Appendix D – Data Collection Report

Appendix E – Local Model Validation Report (LMVR)

Appendix F – Forecasting Report

Appendix G – TEE, PA and AMCB Tables

Appendix H – Transport User Benefits Appraisal (TUBA) Report

Appendix I – Active Mode Appraisal Technical Note

Appendix J – Reliability Benefits

Appendix K – Environmental Options Appraisal Report

Appendix L – Regeneris Report

Appendix M – Appraisal Summary Table

Appendix N – Letter of Intent

Appendix O – Public Consultation Report

Appendix P – Risk Register

![Document Reference: 5.1 The Lake Lothing (Lowestoft) Third Crossing ... · The Lake Lothing (Lowestoft) Third Crossing Order 201[*] _____ _____ Document 5.1: Consultation Report _____](https://img.pdfslide.us/doc/110x75/5ed0857a94292a06451f06b4/document-reference-51-the-lake-lothing-lowestoft-third-crossing-the-lake.jpg)
![The Lake Lothing (Lowestoft) Third Crossing Order 201[*] · Document Reference: 5.1 The Lake Lothing (Lowestoft) ... authorise the construction, operation and maintenance of a new](https://img.pdfslide.us/doc/110x75/5fd6fc09bbb3fd3e712db104/the-lake-lothing-lowestoft-third-crossing-order-201-document-reference-51.jpg)