Embed Size (px)
Citation preview
510 510
Introduction
Penetration of solar photovoltaic (PV) systems in the Netherlands and worldwide has remarkably increased the past years and it is forecasted to keep growing in the future [1]. Particularly the application of building inte-grated and building attached photovoltaic (BIPV and BAPV) systems are projected to thrive in the following years as a result of increasing electricity prices for the residential sector and decreasing PV component costs.
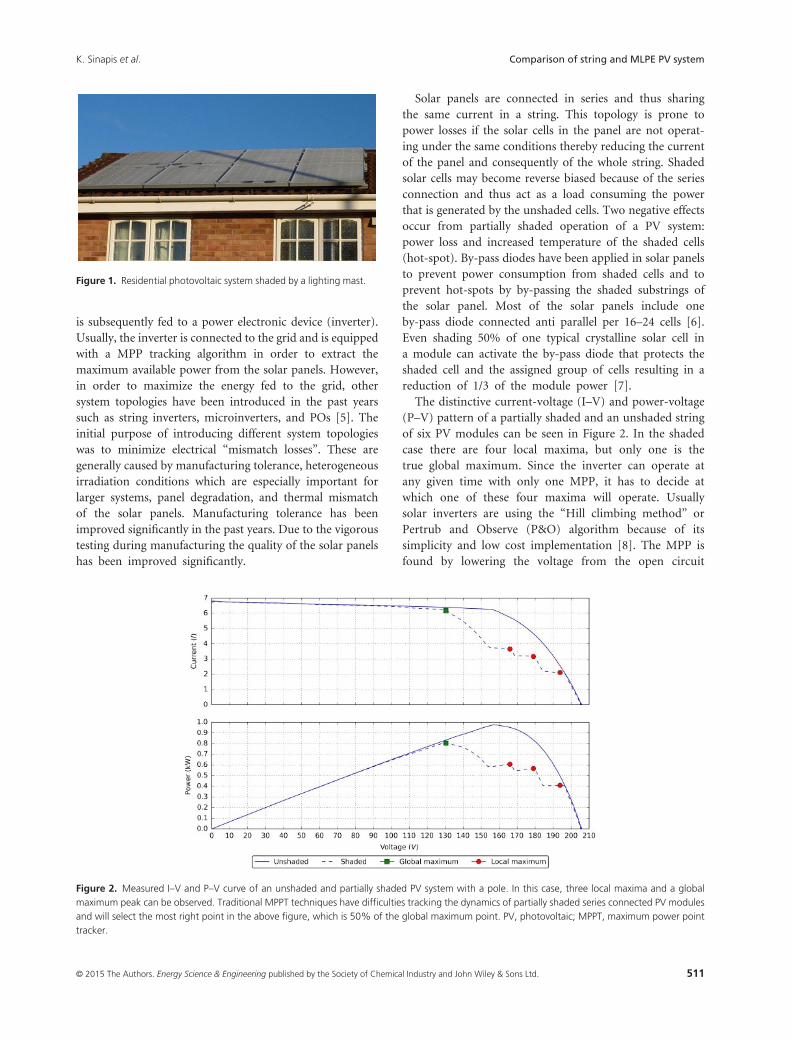
Residential and small commercial PV systems are typi-cally installed in an urban environment. Roofs and terraces are often affected by shade coming from the close proximity of buildings, poles, antennas, dormers etc. A good example can be seen in Figure 1. Various researchers have studied shading operation of traditional PV systems in the past [2, 3] but the quantitative impact on energy yield of shade in different PV architectures remains unclear.
Several approaches have been proposed to mitigate these types of heterogeneous circumstances. A common feature of these approaches is to bring maximum power tracking to the module level. These are called Module Level Power Electronics (MLPE) devices and can be distinguished into two main categories: micro- inverters and power optimizers (POs). The PO category consists of several DC/DC con-verter topologies such as: buck, boost, and buck- boost converters [4]. On the other hand, traditional central and string inverters are evolving and offering high performance, hybrid maximum power point tracker (MPPT) techniques, detailed monitoring capabilities etc.
Review and evolution of PV systems
Traditionally, solar panels are connected in series forming one or more strings. The strings are then connected in parallel, forming arrays. The total DC power of the array
IN THE FIELD
Outdoor characterization and comparison of string and MLPE under clear and partially shaded conditionsKostas Sinapis1, Geert Litjens2, Menno van den Donker1, Wiep Folkerts1 & Wilfried van Sark2
1Solar Energy Application Centre, Eindhoven, The Netherlands2Copernicus Institute, Utrecht University, Utrecht, The Netherlands
© 2015 The Authors. Energy Science & Engineering published by the Society of Chemical Industry and John Wiley & Sons Ltd. This is an open access article under the terms of the Creative Commons Attribution License, which permits use, distribution and reproduction in any medium, provided the original work is properly cited.
KeywordsBAPV, BIPV, micro-inverters, MLPE, outdoor testing, partial shading, power optimizers
CorrespondenceKostas Sinapis, Solar Energy Application Centre, Eindhoven, The Netherlands. Tel: +31 612339374; E-mail: [email protected]
Funding InformationThis work is supported by Netherlands Enterprise Agency (RVO) via the project: Module Level Power Management (MLPM) with grant number TKIZ01005.
Received: 12 June 2015; Revised: 3 August 2015; Accepted: 12 August 2015
Energy Science and Engineering 2015; 3(6):510–519
doi: 10.1002/ese3.97
Abstract
Building integrated and building attached photovoltaic (BIPV, BAPV) systems may suffer from lower performance than predicted as a result of unwanted partial shading. New system architectures have been proposed to optimize per-formance. The common approach of these new architectures is to track the maximum power point of every solar module individually. This paper demon-strates the effect of shading on energy yield by evaluating power level manage-ment on the module level compared to string level. Three independent PV systems were installed and extensively monitored in Eindhoven, a reference string inverter system, a power optimizer system and a micro inverter system. The DC and AC performance ratio (PR) of the systems have been analyzed for different weather types based on the clearness index. A pole shading covering 1–2% of the total system surface has been used to evaluate system performance under a specific type of partial shading. Module Level Power Electronics (MLPE) is capable of increasing the PR up to 35% under certain partial shading condi-tions. However, the string inverter system outperformed MLPE under unshaded operation conditions.
511© 2015 The Authors. Energy Science & Engineering published by the Society of Chemical Industry and John Wiley & Sons Ltd.
Comparison of string and MLPE PV systemK. Sinapis et al.
is subsequently fed to a power electronic device (inverter). Usually, the inverter is connected to the grid and is equipped with a MPP tracking algorithm in order to extract the maximum available power from the solar panels. However, in order to maximize the energy fed to the grid, other system topologies have been introduced in the past years such as string inverters, microinverters, and POs [5]. The initial purpose of introducing different system topologies was to minimize electrical “mismatch losses”. These are generally caused by manufacturing tolerance, heterogeneous irradiation conditions which are especially important for larger systems, panel degradation, and thermal mismatch of the solar panels. Manufacturing tolerance has been improved significantly in the past years. Due to the vigorous testing during manufacturing the quality of the solar panels has been improved significantly.
Solar panels are connected in series and thus sharing the same current in a string. This topology is prone to power losses if the solar cells in the panel are not operat-ing under the same conditions thereby reducing the current of the panel and consequently of the whole string. Shaded solar cells may become reverse biased because of the series connection and thus act as a load consuming the power that is generated by the unshaded cells. Two negative effects occur from partially shaded operation of a PV system: power loss and increased temperature of the shaded cells (hot- spot). By- pass diodes have been applied in solar panels to prevent power consumption from shaded cells and to prevent hot- spots by by- passing the shaded substrings of the solar panel. Most of the solar panels include one by- pass diode connected anti parallel per 16–24 cells [6]. Even shading 50% of one typical crystalline solar cell in a module can activate the by- pass diode that protects the shaded cell and the assigned group of cells resulting in a reduction of 1/3 of the module power [7].
The distinctive current- voltage (I–V) and power- voltage (P–V) pattern of a partially shaded and an unshaded string of six PV modules can be seen in Figure 2. In the shaded case there are four local maxima, but only one is the true global maximum. Since the inverter can operate at any given time with only one MPP, it has to decide at which one of these four maxima will operate. Usually solar inverters are using the “Hill climbing method” or Pertrub and Observe (P&O) algorithm because of its simplicity and low cost implementation [8]. The MPP is found by lowering the voltage from the open circuit
Figure 1. Residential photovoltaic system shaded by a lighting mast.
Figure 2. Measured I–V and P–V curve of an unshaded and partially shaded PV system with a pole. In this case, three local maxima and a global maximum peak can be observed. Traditional MPPT techniques have difficulties tracking the dynamics of partially shaded series connected PV modules and will select the most right point in the above figure, which is 50% of the global maximum point. PV, photovoltaic; MPPT, maximum power point tracker.
512 © 2015 The Authors. Energy Science & Engineering published by the Society of Chemical Industry and John Wiley & Sons Ltd.
K. Sinapis et al.Comparison of string and MLPE PV system
voltage using a prescribed narrow voltage range. The tracking efficiency of the algorithm is slow (typically a few seconds) under rapidly changing irradiance and especially when multiple power maxima are present [9].
The concept of the micro inverter or AC module has been introduced in the past years and many pilot projects have been realized with satisfying results. Distributed MPPT strategies have been proposed by many authors to be beneficial in terms of increased yield where high mismatch losses are present [10]. Additionally such distributed architectures offer detailed monitoring capabilities per module and increased safety due to the lack of high DC voltages. Failure disturbances can also be minimized due to the fact that there is no single point of failure. At the moment there are at least 15 companies active in the micro inverter market [11].
POs (DC/DC converters) have been proposed by several authors in order to mitigate partial shading problems and they come in three different topologies: buck, boost, and buck boost. In this paper only boost DC/DC converters will be discussed. POs are installed usually at the back of each solar panel. The output of the POs is then con-nected in parallel forming a decentrilized 380 VDC grid. A centralized inverter is used without MPPT capability since this operation is now performed at the module level. In this way, the inverter can be simplified and always operate at a fixed voltage (380 V) regardless of ambient temperatures and by- passed substrings.
Traditional string and central inverters for PV systems have reached maturity. Inverter manufacturers launch new products with high efficiency and innovative topologies. Transformer- less topologies have already been commercial-ized with success by major inverter players [12]. This inverter topology minimizes conversion losses and manufacturing price due to the lack of the bulky transformer. In addition, new MPPT algorithms are used in an effort to optimize performance. Hybrid P&O MPPT strategies including P–V scanning in short intervals have been implemented and commercialized by various inverter manufacturers such as SMA (Optitrac) and Mastervolt (Intellishade) (http://files.sma.de/dl/3491/TECHOPTITRAC-AEN082412.pdf, http://www.mastervoltsolar.com/high-yield/). In this way the global MPP can be easily determined in a string of panels and thus optimize the performance under partially shaded conditions.
Experimental Set- Up and Methodology
System set- up
The aim of our field test is to compare three different PV system architectures under identical operation conditions.
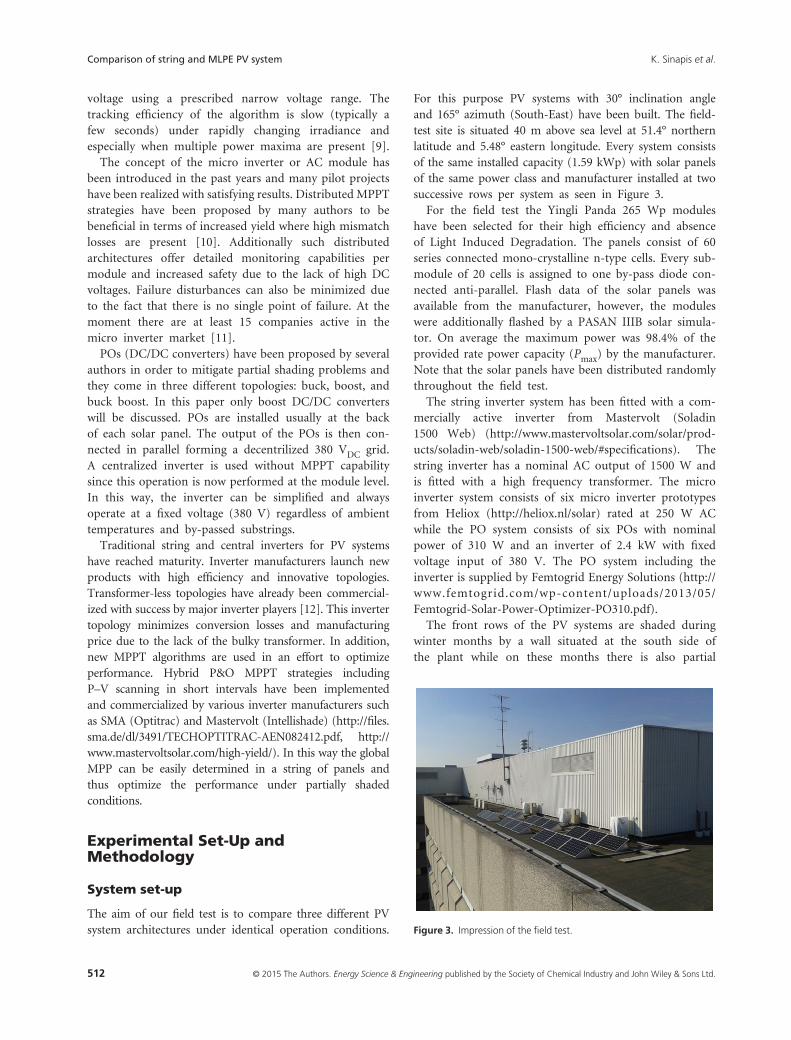
For this purpose PV systems with 30° inclination angle and 165° azimuth (South- East) have been built. The field- test site is situated 40 m above sea level at 51.4° northern latitude and 5.48° eastern longitude. Every system consists of the same installed capacity (1.59 kWp) with solar panels of the same power class and manufacturer installed at two successive rows per system as seen in Figure 3.
For the field test the Yingli Panda 265 Wp modules have been selected for their high efficiency and absence of Light Induced Degradation. The panels consist of 60 series connected mono- crystalline n- type cells. Every sub-module of 20 cells is assigned to one by- pass diode con-nected anti- parallel. Flash data of the solar panels was available from the manufacturer, however, the modules were additionally flashed by a PASAN IIIB solar simula-tor. On average the maximum power was 98.4% of the provided rate power capacity (Pmax) by the manufacturer. Note that the solar panels have been distributed randomly throughout the field test.
The string inverter system has been fitted with a com-mercially active inverter from Mastervolt (Soladin 1500 Web) (http://www.mastervoltsolar.com/solar/prod-ucts/soladin-web/soladin-1500-web/#specifications). The string inverter has a nominal AC output of 1500 W and is fitted with a high frequency transformer. The micro inverter system consists of six micro inverter prototypes from Heliox (http://heliox.nl/solar) rated at 250 W AC while the PO system consists of six POs with nominal power of 310 W and an inverter of 2.4 kW with fixed voltage input of 380 V. The PO system including the inverter is supplied by Femtogrid Energy Solutions (http://www.femtogrid.com/wp-content/uploads/2013/05/Femtogrid-Solar-Power-Optimizer-PO310.pdf).
The front rows of the PV systems are shaded during winter months by a wall situated at the south side of the plant while on these months there is also partial
Figure 3. Impression of the field test.
513© 2015 The Authors. Energy Science & Engineering published by the Society of Chemical Industry and John Wiley & Sons Ltd.
Comparison of string and MLPE PV systemK. Sinapis et al.
shadowing from row to row. Additionally neighboring buildings are situated on the east and west side of the PV systems further reducing the horizon view and thus the available irradiation. Since the goal of the field test is to make a direct and absolute comparison of the three PV systems, a shading analysis was done to determine which parts of the day there is uncontrolled shade.
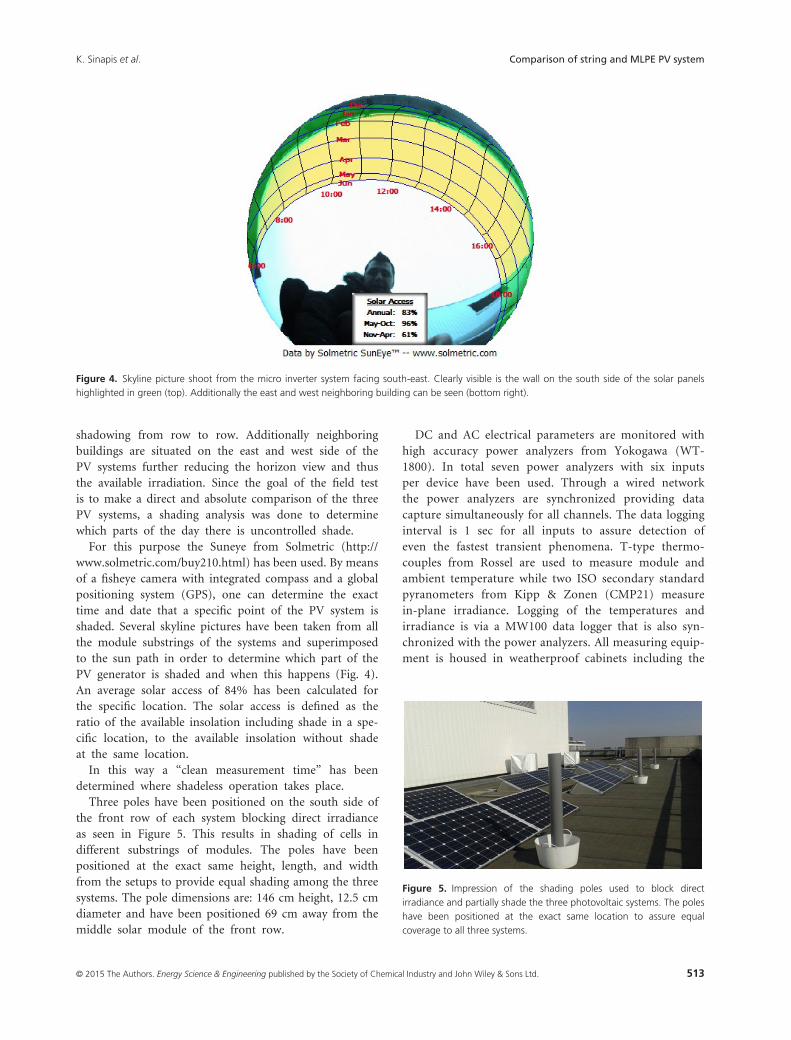
For this purpose the Suneye from Solmetric (http://www.solmetric.com/buy210.html) has been used. By means of a fisheye camera with integrated compass and a global positioning system (GPS), one can determine the exact time and date that a specific point of the PV system is shaded. Several skyline pictures have been taken from all the module substrings of the systems and superimposed to the sun path in order to determine which part of the PV generator is shaded and when this happens (Fig. 4). An average solar access of 84% has been calculated for the specific location. The solar access is defined as the ratio of the available insolation including shade in a spe-cific location, to the available insolation without shade at the same location.
In this way a “clean measurement time” has been determined where shadeless operation takes place.
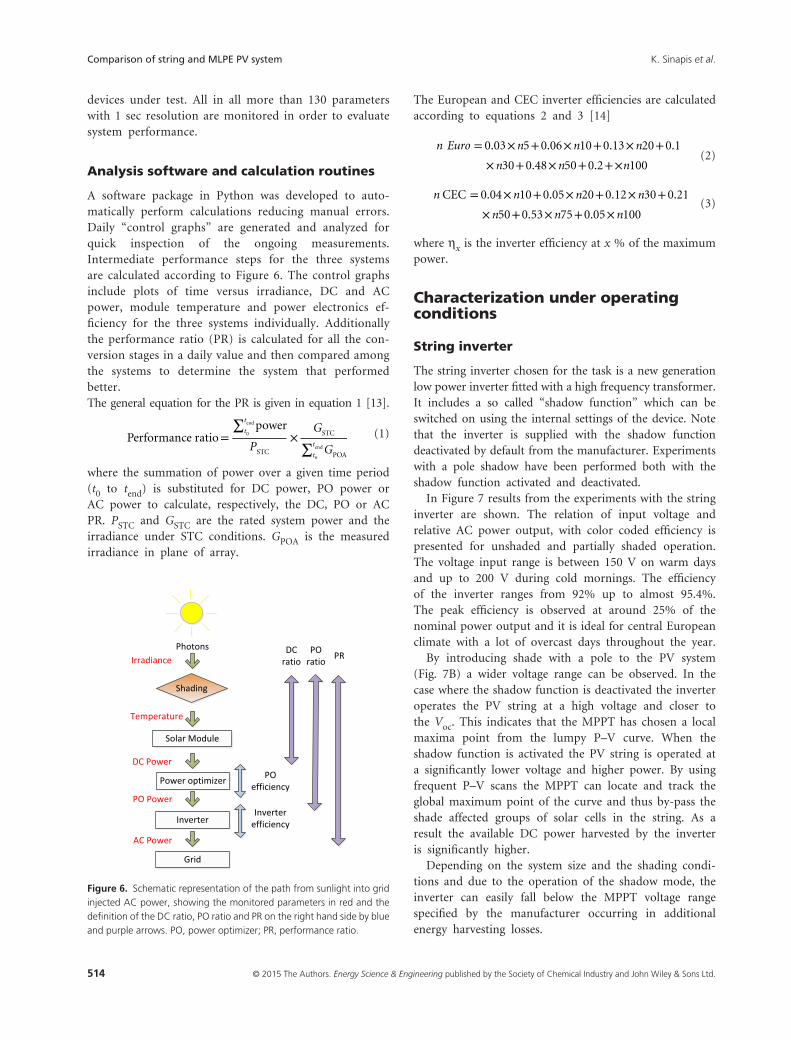
Three poles have been positioned on the south side of the front row of each system blocking direct irradiance as seen in Figure 5. This results in shading of cells in different substrings of modules. The poles have been positioned at the exact same height, length, and width from the setups to provide equal shading among the three systems. The pole dimensions are: 146 cm height, 12.5 cm diameter and have been positioned 69 cm away from the middle solar module of the front row.
DC and AC electrical parameters are monitored with high accuracy power analyzers from Yokogawa (WT- 1800). In total seven power analyzers with six inputs per device have been used. Through a wired network the power analyzers are synchronized providing data capture simultaneously for all channels. The data logging interval is 1 sec for all inputs to assure detection of even the fastest transient phenomena. T- type thermo-couples from Rossel are used to measure module and ambient temperature while two ISO secondary standard pyranometers from Kipp & Zonen (CMP21) measure in- plane irradiance. Logging of the temperatures and irradiance is via a MW100 data logger that is also syn-chronized with the power analyzers. All measuring equip-ment is housed in weatherproof cabinets including the
Figure 4. Skyline picture shoot from the micro inverter system facing south- east. Clearly visible is the wall on the south side of the solar panels highlighted in green (top). Additionally the east and west neighboring building can be seen (bottom right).
Figure 5. Impression of the shading poles used to block direct irradiance and partially shade the three photovoltaic systems. The poles have been positioned at the exact same location to assure equal coverage to all three systems.
514 © 2015 The Authors. Energy Science & Engineering published by the Society of Chemical Industry and John Wiley & Sons Ltd.
K. Sinapis et al.Comparison of string and MLPE PV system
devices under test. All in all more than 130 parameters with 1 sec resolution are monitored in order to evaluate system performance.
Analysis software and calculation routines
A software package in Python was developed to auto-matically perform calculations reducing manual errors. Daily “control graphs” are generated and analyzed for quick inspection of the ongoing measurements. Intermediate performance steps for the three systems are calculated according to Figure 6. The control graphs include plots of time versus irradiance, DC and AC power, module temperature and power electronics ef-ficiency for the three systems individually. Additionally the performance ratio (PR) is calculated for all the con-version stages in a daily value and then compared among the systems to determine the system that performed better.The general equation for the PR is given in equation 1 [13].
(1)
where the summation of power over a given time period (t0 to tend) is substituted for DC power, PO power or AC power to calculate, respectively, the DC, PO or AC PR. PSTC and GSTC are the rated system power and the irradiance under STC conditions. GPOA is the measured irradiance in plane of array.
The European and CEC inverter efficiencies are calculated according to equations 2 and 3 [14]
(2)
(3)
where ηx is the inverter efficiency at x % of the maximum power.
Characterization under operating conditions
String inverter
The string inverter chosen for the task is a new generation low power inverter fitted with a high frequency transformer. It includes a so called “shadow function” which can be switched on using the internal settings of the device. Note that the inverter is supplied with the shadow function deactivated by default from the manufacturer. Experiments with a pole shadow have been performed both with the shadow function activated and deactivated.
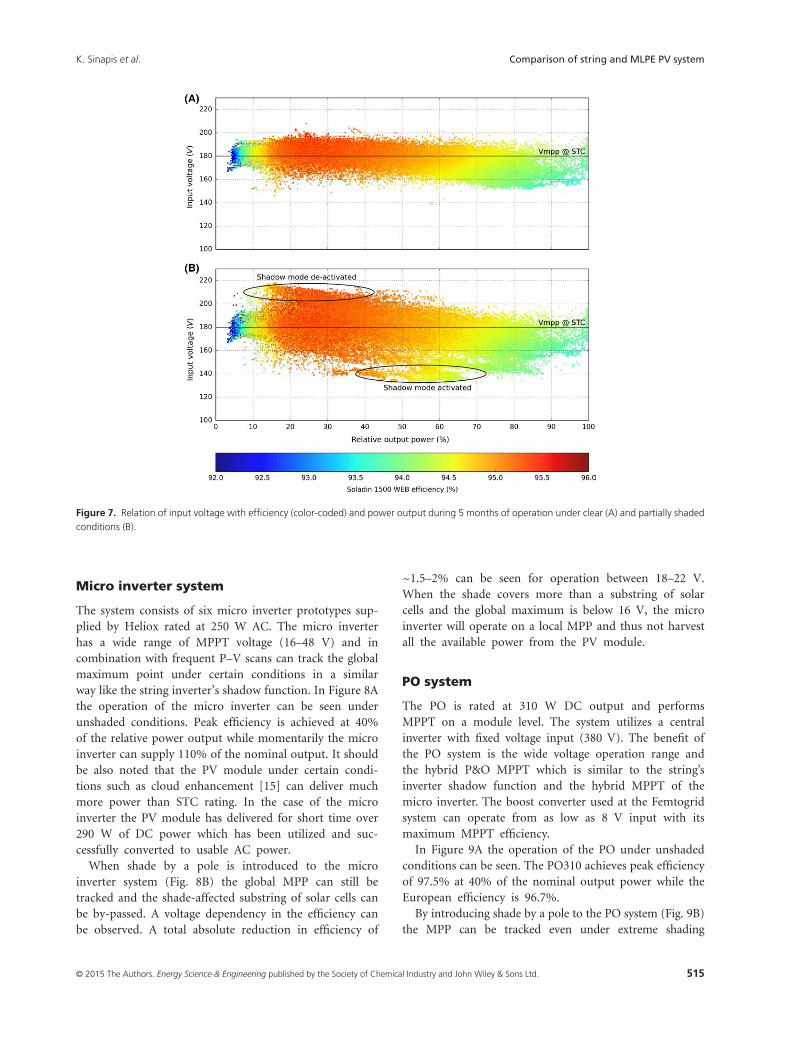
In Figure 7 results from the experiments with the string inverter are shown. The relation of input voltage and relative AC power output, with color coded efficiency is presented for unshaded and partially shaded operation. The voltage input range is between 150 V on warm days and up to 200 V during cold mornings. The efficiency of the inverter ranges from 92% up to almost 95.4%. The peak efficiency is observed at around 25% of the nominal power output and it is ideal for central European climate with a lot of overcast days throughout the year.
By introducing shade with a pole to the PV system (Fig. 7B) a wider voltage range can be observed. In the case where the shadow function is deactivated the inverter operates the PV string at a high voltage and closer to the Voc. This indicates that the MPPT has chosen a local maxima point from the lumpy P–V curve. When the shadow function is activated the PV string is operated at a significantly lower voltage and higher power. By using frequent P–V scans the MPPT can locate and track the global maximum point of the curve and thus by- pass the shade affected groups of solar cells in the string. As a result the available DC power harvested by the inverter is significantly higher.
Depending on the system size and the shading condi-tions and due to the operation of the shadow mode, the inverter can easily fall below the MPPT voltage range specified by the manufacturer occurring in additional energy harvesting losses.
Performance ratio=
∑tend
t0
power
PSTC
×
GSTC
∑tend
t0
GPOA
n Euro = 0.03×n5+0.06×n10+0.13×n20+0.1
×n30+0.48×n50+0.2+×n100
n CEC = 0.04×n10+0.05×n20+0.12×n30+0.21
×n50+0.53×n75+0.05×n100
Figure 6. Schematic representation of the path from sunlight into grid injected AC power, showing the monitored parameters in red and the definition of the DC ratio, PO ratio and PR on the right hand side by blue and purple arrows. PO, power optimizer; PR, performance ratio.
515© 2015 The Authors. Energy Science & Engineering published by the Society of Chemical Industry and John Wiley & Sons Ltd.
Comparison of string and MLPE PV systemK. Sinapis et al.
Micro inverter system
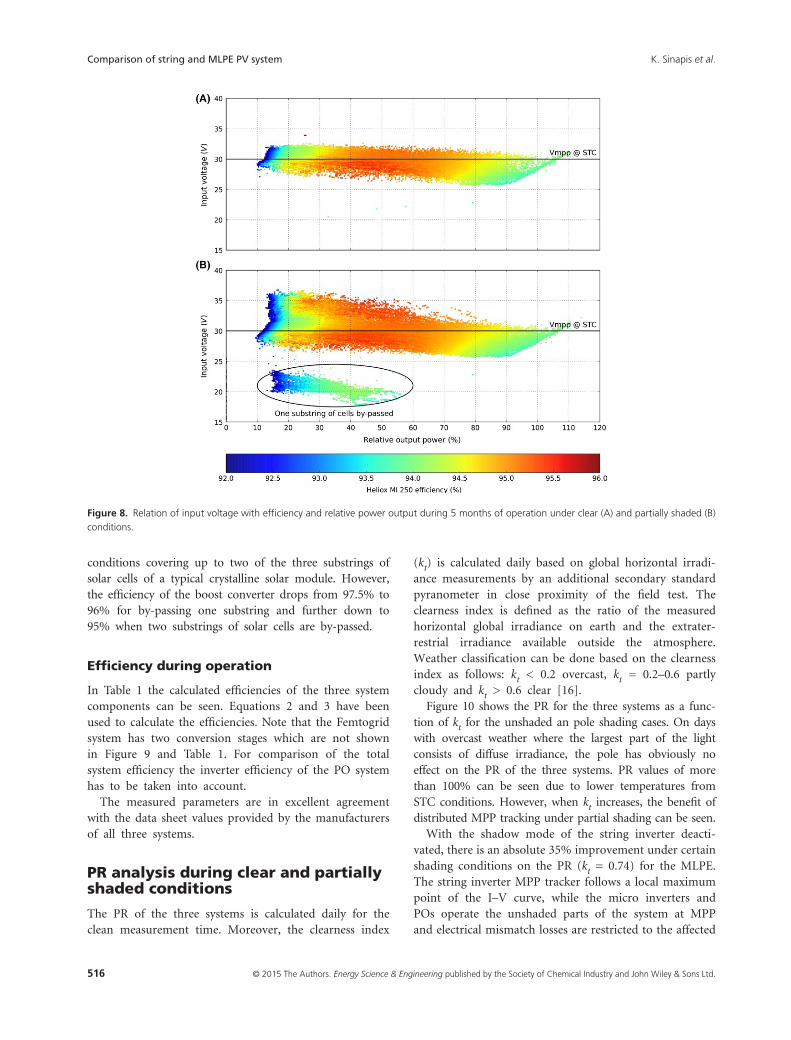
The system consists of six micro inverter prototypes sup-plied by Heliox rated at 250 W AC. The micro inverter has a wide range of MPPT voltage (16–48 V) and in combination with frequent P–V scans can track the global maximum point under certain conditions in a similar way like the string inverter’s shadow function. In Figure 8A the operation of the micro inverter can be seen under unshaded conditions. Peak efficiency is achieved at 40% of the relative power output while momentarily the micro inverter can supply 110% of the nominal output. It should be also noted that the PV module under certain condi-tions such as cloud enhancement [15] can deliver much more power than STC rating. In the case of the micro inverter the PV module has delivered for short time over 290 W of DC power which has been utilized and suc-cessfully converted to usable AC power.
When shade by a pole is introduced to the micro inverter system (Fig. 8B) the global MPP can still be tracked and the shade- affected substring of solar cells can be by- passed. A voltage dependency in the efficiency can be observed. A total absolute reduction in efficiency of
~1.5–2% can be seen for operation between 18–22 V. When the shade covers more than a substring of solar cells and the global maximum is below 16 V, the micro inverter will operate on a local MPP and thus not harvest all the available power from the PV module.
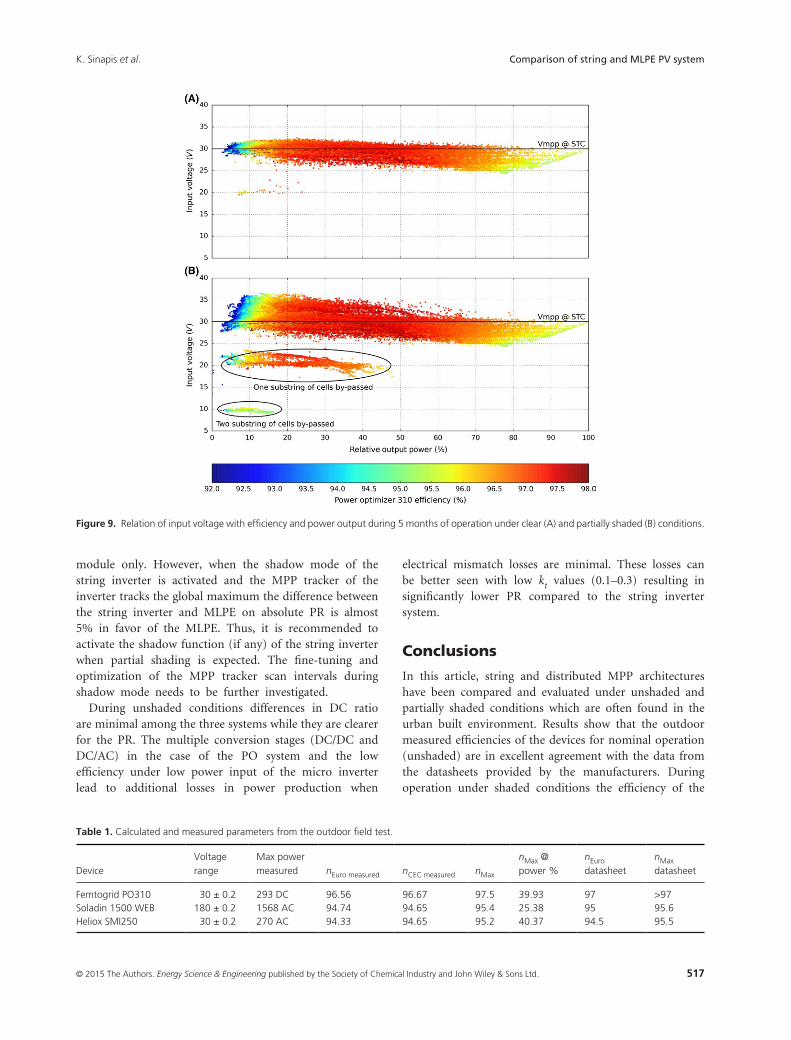
PO system
The PO is rated at 310 W DC output and performs MPPT on a module level. The system utilizes a central inverter with fixed voltage input (380 V). The benefit of the PO system is the wide voltage operation range and the hybrid P&O MPPT which is similar to the string’s inverter shadow function and the hybrid MPPT of the micro inverter. The boost converter used at the Femtogrid system can operate from as low as 8 V input with its maximum MPPT efficiency.
In Figure 9A the operation of the PO under unshaded conditions can be seen. The PO310 achieves peak efficiency of 97.5% at 40% of the nominal output power while the European efficiency is 96.7%.
By introducing shade by a pole to the PO system (Fig. 9B) the MPP can be tracked even under extreme shading
Figure 7. Relation of input voltage with efficiency (color- coded) and power output during 5 months of operation under clear (A) and partially shaded conditions (B).
516 © 2015 The Authors. Energy Science & Engineering published by the Society of Chemical Industry and John Wiley & Sons Ltd.
K. Sinapis et al.Comparison of string and MLPE PV system
conditions covering up to two of the three substrings of solar cells of a typical crystalline solar module. However, the efficiency of the boost converter drops from 97.5% to 96% for by- passing one substring and further down to 95% when two substrings of solar cells are by- passed.
Efficiency during operation
In Table 1 the calculated efficiencies of the three system components can be seen. Equations 2 and 3 have been used to calculate the efficiencies. Note that the Femtogrid system has two conversion stages which are not shown in Figure 9 and Table 1. For comparison of the total system efficiency the inverter efficiency of the PO system has to be taken into account.
The measured parameters are in excellent agreement with the data sheet values provided by the manufacturers of all three systems.
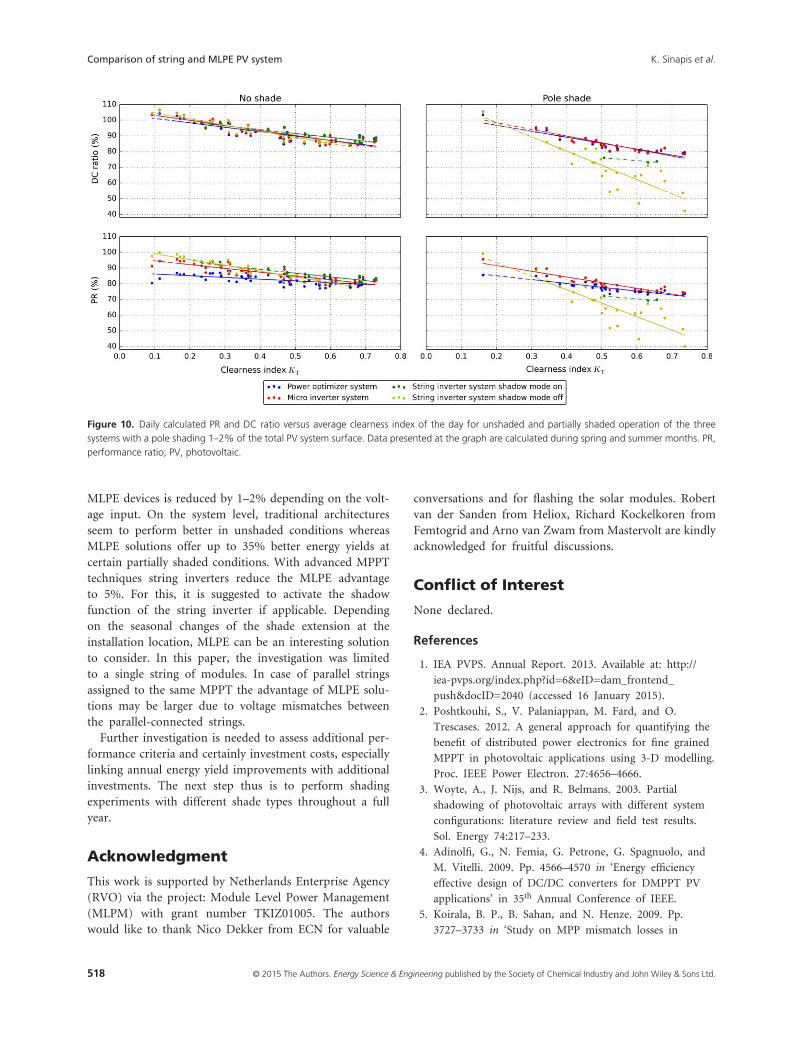
PR analysis during clear and partially shaded conditions
The PR of the three systems is calculated daily for the clean measurement time. Moreover, the clearness index
(kt) is calculated daily based on global horizontal irradi-ance measurements by an additional secondary standard pyranometer in close proximity of the field test. The clearness index is defined as the ratio of the measured horizontal global irradiance on earth and the extrater-restrial irradiance available outside the atmosphere. Weather classification can be done based on the clearness index as follows: kt < 0.2 overcast, kt = 0.2–0.6 partly cloudy and kt > 0.6 clear [16].
Figure 10 shows the PR for the three systems as a func-tion of kt for the unshaded an pole shading cases. On days with overcast weather where the largest part of the light consists of diffuse irradiance, the pole has obviously no effect on the PR of the three systems. PR values of more than 100% can be seen due to lower temperatures from STC conditions. However, when kt increases, the benefit of distributed MPP tracking under partial shading can be seen.
With the shadow mode of the string inverter deacti-vated, there is an absolute 35% improvement under certain shading conditions on the PR (kt = 0.74) for the MLPE. The string inverter MPP tracker follows a local maximum point of the I–V curve, while the micro inverters and POs operate the unshaded parts of the system at MPP and electrical mismatch losses are restricted to the affected
Figure 8. Relation of input voltage with efficiency and relative power output during 5 months of operation under clear (A) and partially shaded (B) conditions.
517© 2015 The Authors. Energy Science & Engineering published by the Society of Chemical Industry and John Wiley & Sons Ltd.
Comparison of string and MLPE PV systemK. Sinapis et al.
module only. However, when the shadow mode of the string inverter is activated and the MPP tracker of the inverter tracks the global maximum the difference between the string inverter and MLPE on absolute PR is almost 5% in favor of the MLPE. Thus, it is recommended to activate the shadow function (if any) of the string inverter when partial shading is expected. The fine- tuning and optimization of the MPP tracker scan intervals during shadow mode needs to be further investigated.
During unshaded conditions differences in DC ratio are minimal among the three systems while they are clearer for the PR. The multiple conversion stages (DC/DC and DC/AC) in the case of the PO system and the low efficiency under low power input of the micro inverter lead to additional losses in power production when
electrical mismatch losses are minimal. These losses can be better seen with low kt values (0.1–0.3) resulting in significantly lower PR compared to the string inverter system.
Conclusions
In this article, string and distributed MPP architectures have been compared and evaluated under unshaded and partially shaded conditions which are often found in the urban built environment. Results show that the outdoor measured efficiencies of the devices for nominal operation (unshaded) are in excellent agreement with the data from the datasheets provided by the manufacturers. During operation under shaded conditions the efficiency of the
Table 1. Calculated and measured parameters from the outdoor field test.
DeviceVoltage range
Max power measured nEuro measured nCEC measured nMax
nMax @ power %
nEuro datasheet
nMax datasheet
Femtogrid PO310 30 ± 0.2 293 DC 96.56 96.67 97.5 39.93 97 >97Soladin 1500 WEB 180 ± 0.2 1568 AC 94.74 94.65 95.4 25.38 95 95.6Heliox SMI250 30 ± 0.2 270 AC 94.33 94.65 95.2 40.37 94.5 95.5
Figure 9. Relation of input voltage with efficiency and power output during 5 months of operation under clear (A) and partially shaded (B) conditions.
518 © 2015 The Authors. Energy Science & Engineering published by the Society of Chemical Industry and John Wiley & Sons Ltd.
K. Sinapis et al.Comparison of string and MLPE PV system
MLPE devices is reduced by 1–2% depending on the volt-age input. On the system level, traditional architectures seem to perform better in unshaded conditions whereas MLPE solutions offer up to 35% better energy yields at certain partially shaded conditions. With advanced MPPT techniques string inverters reduce the MLPE advantage to 5%. For this, it is suggested to activate the shadow function of the string inverter if applicable. Depending on the seasonal changes of the shade extension at the installation location, MLPE can be an interesting solution to consider. In this paper, the investigation was limited to a single string of modules. In case of parallel strings assigned to the same MPPT the advantage of MLPE solu-tions may be larger due to voltage mismatches between the parallel- connected strings.
Further investigation is needed to assess additional per-formance criteria and certainly investment costs, especially linking annual energy yield improvements with additional investments. The next step thus is to perform shading experiments with different shade types throughout a full year.
Acknowledgment
This work is supported by Netherlands Enterprise Agency (RVO) via the project: Module Level Power Management (MLPM) with grant number TKIZ01005. The authors would like to thank Nico Dekker from ECN for valuable
conversations and for flashing the solar modules. Robert van der Sanden from Heliox, Richard Kockelkoren from Femtogrid and Arno van Zwam from Mastervolt are kindly acknowledged for fruitful discussions.
Conflict of Interest
None declared.
References
1. IEA PVPS. Annual Report. 2013. Available at: http://
iea-pvps.org/index.php?id=6&eID=dam_frontend_
push&docID=2040 (accessed 16 January 2015).
2. Poshtkouhi, S., V. Palaniappan, M. Fard, and O.
Trescases. 2012. A general approach for quantifying the
benefit of distributed power electronics for fine grained
MPPT in photovoltaic applications using 3- D modelling.
Proc. IEEE Power Electron. 27:4656–4666.
3. Woyte, A., J. Nijs, and R. Belmans. 2003. Partial
shadowing of photovoltaic arrays with different system
configurations: literature review and field test results.
Sol. Energy 74:217–233.
4. Adinolfi, G., N. Femia, G. Petrone, G. Spagnuolo, and
M. Vitelli. 2009. Pp. 4566–4570 in ‘Energy efficiency
effective design of DC/DC converters for DMPPT PV
applications’ in 35th Annual Conference of IEEE.
5. Koirala, B. P., B. Sahan, and N. Henze. 2009. Pp.
3727–3733 in ‘Study on MPP mismatch losses in
Figure 10. Daily calculated PR and DC ratio versus average clearness index of the day for unshaded and partially shaded operation of the three systems with a pole shading 1–2% of the total PV system surface. Data presented at the graph are calculated during spring and summer months. PR, performance ratio; PV, photovoltaic.
519© 2015 The Authors. Energy Science & Engineering published by the Society of Chemical Industry and John Wiley & Sons Ltd.
Comparison of string and MLPE PV systemK. Sinapis et al.
photovoltaic applications’ Proceeding of 24th European
Photovoltaic Solar Energy Conference.
6. Silvestre, S., A. Boronat, and A. Chouder. 2009. Study
of by- pass diodes configurations on PV modules. Appl.
Energy 86:1632–1640.
7. Deline, C. 2009. Pp. 1268–1273 in ‘Partially shaded
operation of a Grid Tied PV System’, Proceeding of
34th IEEE Photovoltaic specialists conference.
8. Florea, M. L., and A. Baltatanu. 2013. Pp. 1–4 in
‘Modeling photovoltaic arrays with MPPT Perturb and
Observe algorithm’ Advanced Topics in Electrical
Engineering.
9. Sanchis, P., J. Lopez, A. Ursua, E. Gubia, and L.
Marroyo. 2007. On the testing, characterization and
evaluation of PV inverters and dynamic MPPT
performance under real varying operation conditions.
Prog. Photovolt. Res. Appl. 15:541–556.
10. Deline, C., J. Meydbray, and M. Donovan. ‘Photovoltaic
Shading Testbed for Module Level Power Electronics:
2014 update’ NREL Technical report. Available at:
http://www.nrel.gov/docs/fy14osti/62471.pdf (accessed 15
January 2015).
11. Sinapis, K., and W. Folkerts. “MLPM Benchmark report
2013”, Solar Energy Application Centre. Available at:
http://www.seac.cc/fileadmin/seac/user/doc/SEAC_
External_Benchmark_Report_MLPM_2013.pdf (accessed
15 January 2015).
12. Poliseno, M. C., R. A. Mastromauro, and M. Liserre.
2012. Pp. 3088–3097 in ‘A performance comparison of
high efficiency transformer-less PV inverters’ Proceeding
of 27th EU PVSEC.
13. Reich, N. H., B. Mueller, A. Armbruster, W. G. J. H.
M. Van Sark, K. Kiefer, and C. Reise. 2012.
Performance ratio revisited: are PR>90% realistic? Prog.
Photovolt. Res. Appl. 20:717–726.
14. Haeberlin, H., F. Kaeser, Ch. Liebl, and Ch. Beutler.
1995. Results of recent performance and reliability tests
of the most popular inverters for grid connected PV
systems in Switzerland, Proceeding of 13th EU PVSEC.
15. Yordanov, G. H., O. M. Midtgard, T. O. Saetre, and H.
K. Nielsen. 2013. Overirradiance (cloud enhancement)
events at high latitudes. IEEE J. Photovolt. 3:271–277.
16. Reindl, D. T., W. A. Beckman, and J. A. Duffie. 1990.
Diffuse fraction correlations. Sol. Energy 45:1–7.
![JSI Series Single Phase String Inverter Features - … · 2015-02-22 · JSI Series Single Phase String Inverter 01 JSI-1500TL Output Power/Rated Power [%] ... Transformerless design](https://img.pdfslide.us/doc/110x75/5b3e2ce57f8b9ace408ea398/jsi-series-single-phase-string-inverter-features-2015-02-22-jsi-series.jpg)