Embed Size (px)
Citation preview
Note: This study was prepared for Mark Flannery, Director and Chief Economist of the Division of Economic and Risk Analysis. Trevor Tatum provided research assistance. Numerous Commission staff provided helpful comments and feedback, including Chris Arnold, Scott Bauguess, Jason Berkowitz, Terrence Bohan, Audra Boone, Margaret
Cain, Joseph Darragh, Owen Donley, Michael Fioribello, Mark Flannery, Sebastian Gomez Abero, John Guidroz, Rahman Harrison, Stephen Johnson, Christina McGlosson-Wilson, Lauren Moore, Holly Pal, Michael Paley, Amy
Reischauer, Eric Schmidt, Nancy Snow, Josephine Tao, and Pamela Urban. The U.S. Securities and Exchange Commission, as a matter of policy, disclaims responsibility for any private publication or statement of any of its employees. The views expressed in this paper are those of the author and do not necessarily reflect the views of the
Commission, or its staff, or of the authors’ colleagues.
Outcomes of Investing in OTC Stocks Joshua T. White
DECEMBER 16, 2016
ABSTRACT
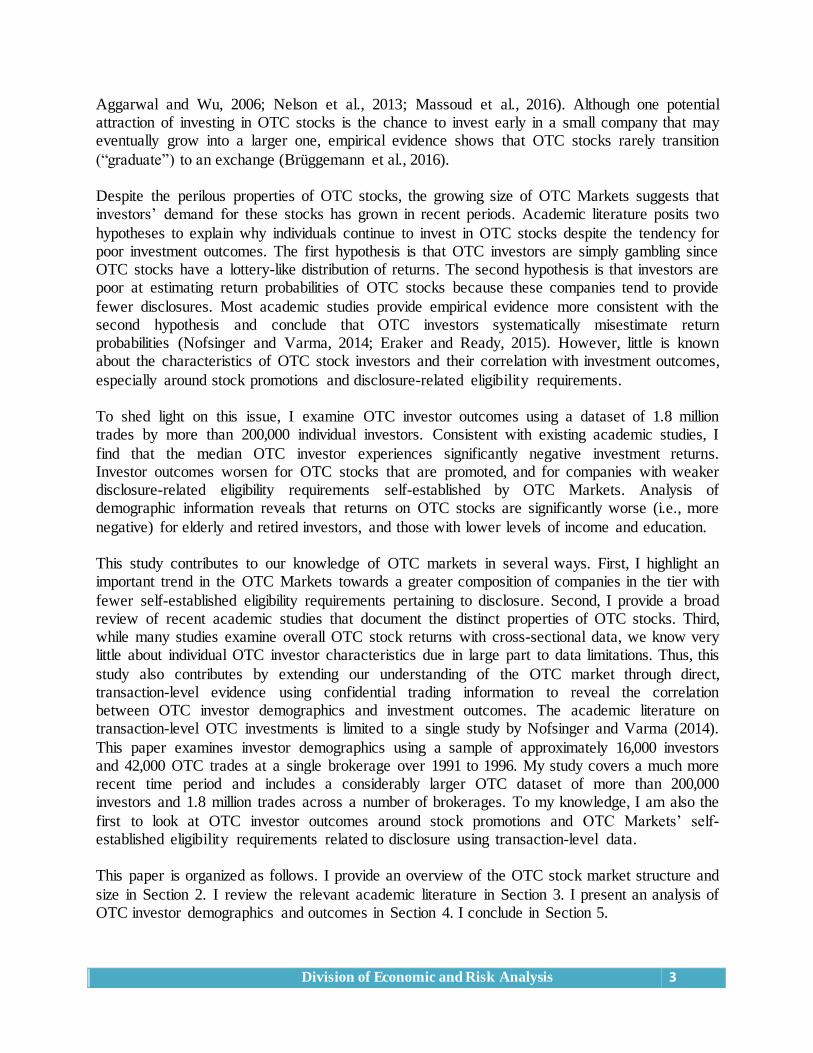
This paper analyzes three aspects of over-the-counter (OTC) stocks: (1) the recent trends in the
OTC stock market structure and size; (2) the documented properties of OTC stocks; and (3) the differences in returns based on investor and stock characteristics. Approximately 10,000 OTC stocks were quoted at the end of 2013 through 2015, generating a total trading volume of over $200 billion per year. Dollar volume has grown substantially since 2012 and is now concentrated
in the segment of the OTC market with no requirements of registration or reporting to the U.S. Securities and Exchange Commission (SEC). A synthesis of recent academic literature reveals troubling properties of OTC stocks. Academic studies find that OTC stocks tend to be highly illiquid; are frequent targets of alleged market manipulation; generate negative and volatile
investment returns on average; and rarely grow into a large company or transition to listing on a stock exchange. Moreover, these properties tend to worsen when the OTC company has fewer disclosure-related eligibility requirements. I examine the relationship between OTC investor demographics and investment outcomes using a proprietary database of transaction-level OTC
data with confidential investor information. Analysis of 1.8 million trades by over 200,000 individual investors confirms that the typical OTC investment return is severely negative. Investor outcomes worsen for OTC stocks that experience a promotional campaign or have weaker disclosure-related eligibility requirements. Demographic analysis reveals that older,
retired, low-income, and less educated investors experience significantly poorer outcomes in OTC stock markets. Given that retail investors are the predominant owners of OTC stocks, and the documented trend towards less transparent OTC companies, the results of this study have important implications for investor protection.
U.S. Securities and Exchange Commission
Division of Economic and Risk Analysis (DERA)
Division of Economic and Risk Analysis 2
1. Introduction The preponderance of empirical evidence on investment outcomes focuses on companies with
equity listed on a stock exchange such as the New York Stock Exchange (NYSE) or Nasdaq. Yet, another broad set of companies, consisting primarily of smaller firms, have stock that is quoted on OTC markets. While the stock of companies listed on exchanges are predominately held by institutional investors, OTC stocks are owned and traded almost exclusively by
individual (“retail”) investors (Ang et al., 2013). This distinction is important because academic research shows that institutional investors play a crucial role in monitoring companies and encouraging better disclosure and governance practices.
1 Further, many companies with OTC-
quoted stock are not required to register or report interim or ongoing financial information with
the SEC. Given the dearth of institutional ownership participation in OTC markets, and the likely informational disadvantage of retail investors, I believe that understanding this market is paramount to investor protection. Therefore, I study three aspects of the OTC stock market: (1) the current OTC market structure and size; (2) the documented properties of OTC stocks; and (3)
the differences in returns based on investor and stock characteristics. In the past few years, a number of important trends have reshaped OTC markets. For many years, the market for OTC equities has been segmented between quotations on the OTC Bulletin
Board (OTCBB) and OTC Markets (formerly the Pink Sheets).2 To be eligible for OTCBB
quotation, companies must register and report to the SEC (Bushee and Leuz, 2005). Yet, in 2015, the trading volume of OTCBB stocks totaled just $9 billion and averaged fewer than 500 quoted stocks. In contrast to the OTCBB, almost 10,000 stocks were quoted on OTC Markets at the end
of each year during 2013 to 2015, generating a total trading volume of more than $200 billion per year. Trading activity on OTC Markets has grown substantially in recent years, as dollar volume traded in 2015 ($200 billion) is almost 50% higher than 2012 ($136 billion). Further analysis reveals that the composition of OTC Markets has evolved towards more companies
quoted on the Pink Tier that has no SEC registration or reporting requirements. Currently, about 70% of quoted securities and 85% of dollar volume traded on the OTC Markets is concentrated in the Pink Tier. Consequently, the overwhelming majority of OTC companies have considerable discretion in the amount of information they provide to investors.
Next, I review the distinct properties of OTC stocks by synthesizing the burgeoning academic literature on this market. A number of recent academic studies establish that OTC stocks differ from those listed on an exchange because they tend to have poor liquidity and generate severely
negative and volatile returns for investors (Ang et al., 2013; Eraker and Ready, 2015; Brüggemann et al., 2016). Research further indicates that the troubling characteristics of OTC stocks are exacerbated as companies are permitted to disclose less (Luft et al., 2001; Luft and Levine, 2004; Litvak, 2009; Jiang et al., 2015; Brüggemann et al., 2016). This latter point is
particularly salient because OTC stocks are also frequent targets of market manipulation by fraudsters, who often promote OTC stocks by releasing false or misleading information (e.g.,
1 For stocks listed on an exchange, higher levels of institutional ownership are linked to the following: greater
monitoring of company management resulting in more innovation (Aghion et al., 2013); increased firm disclosure leading to better stock liquidity (Boone and White, 2015); more dividend payouts and larger stock repurchases
(Crane et al., 2016); and improved corporate governance policies that increase firm value (Appel et al., 2016). 2 Section 2 provides a detailed description of the OTC market structure and size.
Division of Economic and Risk Analysis 3
Aggarwal and Wu, 2006; Nelson et al., 2013; Massoud et al., 2016). Although one potential attraction of investing in OTC stocks is the chance to invest early in a small company that may eventually grow into a larger one, empirical evidence shows that OTC stocks rarely transition
(“graduate”) to an exchange (Brüggemann et al., 2016). Despite the perilous properties of OTC stocks, the growing size of OTC Markets suggests that investors’ demand for these stocks has grown in recent periods. Academic literature posits two
hypotheses to explain why individuals continue to invest in OTC stocks despite the tendency for poor investment outcomes. The first hypothesis is that OTC investors are simply gambling since OTC stocks have a lottery-like distribution of returns. The second hypothesis is that investors are poor at estimating return probabilities of OTC stocks because these companies tend to provide
fewer disclosures. Most academic studies provide empirical evidence more consistent with the second hypothesis and conclude that OTC investors systematically misestimate return probabilities (Nofsinger and Varma, 2014; Eraker and Ready, 2015). However, little is known about the characteristics of OTC stock investors and their correlation with investment outcomes,
especially around stock promotions and disclosure-related eligibility requirements. To shed light on this issue, I examine OTC investor outcomes using a dataset of 1.8 million trades by more than 200,000 individual investors. Consistent with existing academic studies, I
find that the median OTC investor experiences significantly negative investment returns. Investor outcomes worsen for OTC stocks that are promoted, and for companies with weaker disclosure-related eligibility requirements self-established by OTC Markets. Analysis of demographic information reveals that returns on OTC stocks are significantly worse (i.e., more
negative) for elderly and retired investors, and those with lower levels of income and education. This study contributes to our knowledge of OTC markets in several ways. First, I highlight an important trend in the OTC Markets towards a greater composition of companies in the tier with
fewer self-established eligibility requirements pertaining to disclosure. Second, I provide a broad review of recent academic studies that document the distinct properties of OTC stocks. Third, while many studies examine overall OTC stock returns with cross-sectional data, we know very little about individual OTC investor characteristics due in large part to data limitations. Thus, this
study also contributes by extending our understanding of the OTC market through direct, transaction-level evidence using confidential trading information to reveal the correlation between OTC investor demographics and investment outcomes. The academic literature on transaction-level OTC investments is limited to a single study by Nofsinger and Varma (2014).
This paper examines investor demographics using a sample of approximately 16,000 investors and 42,000 OTC trades at a single brokerage over 1991 to 1996. My study covers a much more recent time period and includes a considerably larger OTC dataset of more than 200,000 investors and 1.8 million trades across a number of brokerages. To my knowledge, I am also the
first to look at OTC investor outcomes around stock promotions and OTC Markets’ self-established eligibility requirements related to disclosure using transaction-level data. This paper is organized as follows. I provide an overview of the OTC stock market structure and
size in Section 2. I review the relevant academic literature in Section 3. I present an analysis of OTC investor demographics and outcomes in Section 4. I conclude in Section 5.
Division of Economic and Risk Analysis 4
2. Market Structure and Size OTC-quoted equities are not listed on a national securities exchange. Instead, OTC stocks are
quoted through interdealer quotation services such as those described below.3
2.1 OTCBB
The OTCBB is the electronic interdealer quotation system operated by the Financial Industry Regulatory Authority (FINRA).4 To be eligible for OTCBB quotation, companies must, among
other things, register the class of securities with the SEC and file periodic financial reports to the SEC, or its banking or insurance regulators. In 2015, aggregate OTCBB dollar (share) volume was $8.8 billion (62 billion shares).5 Although
the OTCBB averaged 471 quoted stocks during 2015, this number declined to fewer than 400 during the first calendar quarter of 2016.
2.2 OTC Markets
OTC Markets Group (formerly known as the Pink Sheets, Pink Sheets LLC, and Pink OTC Markets) privately owns the OTC Markets venue. Subscribing broker-dealers quote securities on the OTC Markets through the OTC Link ATS interdealer quotation system.6
The OTC Markets Group classifies securities into three marketplace tiers (QX, QB, and Pink), on the basis of self-established eligibility requirements, including initial and ongoing reporting and standards of financial disclosure.
7 Importantly, many companies quoted on OTC Markets do
3 Global OTC is another electronic interdealer OTC quotation service that is operated by Archipelago Trading
Services, Inc. See www.globalotc.com.
4 See http://www.finra.org/industry/faq-otcbb-frequently-asked-questions.
5 These figures are based on data from FINRA, available at http://otce.finra.org/MSEquityTradingDataMonthly.
6 See http://www.otcmarkets.com/. OTC Markets Group publishes real-time quotes of the best bid and ask price for
each stock on its website. 7 OTC Markets Group currently publishes these self-established eligibility requirements for domestic companies
quoted on OTC Markets:
QX Tier: Financial reporting depends on whether the company reports to the SEC. SEC reporting companies (including those reporting under Regulation A) must be current and fully compliant with initial and ongoing annual, quarterly, and interim reports filed to the SEC. Non-SEC reporting companies must comply with the
annual, quarterly, and current reporting obligations in the “OTCQX U.S. Disclosure Guidelines” (see http://www.otcmarkets.com/content/doc/OTCQXGuidelines.pdf). All companies on the QX Tier must also
provide timely disclosures of material news releases through a press release; periodically verify its company profile on the OTC Markets website; and submit an initial and annual third-party sponsored ‘advisor’ letter verifying a review of the company’s disclosure practices.
QB Tier: Financial reporting depends on whether the company reports to the SEC or a banking regulator. SEC reporting companies must be current and fully compliant with initial and ongoing annual, quarterly, and interim reports filed to the SEC. Bank reporting companies must post all disclosures filed with the banking regulator to
the OTC Markets website unless it is deemed non-public. All companies on the QB Tier must also submit an initial and annual certification signed by the CEO and/or CFO identifying the company’s regulator (SEC or
bank regulator) and confirm that the company is current in its reporting obligations to its regulator and maintains a current and complete profile on the OTC Markets website; disclose the total shares outstanding and in public float at the prior fiscal year end; and report the names and ownership percentages of all officers and
directors, as well as beneficial shareholders that own more than 5% of outstanding shares.
Division of Economic and Risk Analysis 5
not register any class of securities or report to the SEC.8 OTC Markets’ self-established eligibility requirements pertaining to disclosure are stronger for the QX and QB Tiers than the Pink Tier.9
OTC Markets Group also reports data on non-quoted securities traded in the Grey
Market. “Grey Market” transactions are unsolicited trades by consenting individuals in securities that are not currently publicly quoted on either the OTCBB or OTC Markets, nor listed on an exchange. Many of these securities have trading symbols, but lack general investor interest or currently available information.10
OTC Markets further classifies the Pink Tier into three categories according to the availability of company-provided disclosures. Those classifications are “Current Information,” “Limited Information,” and “No Information.” To warn investors of potentially negative or nefarious
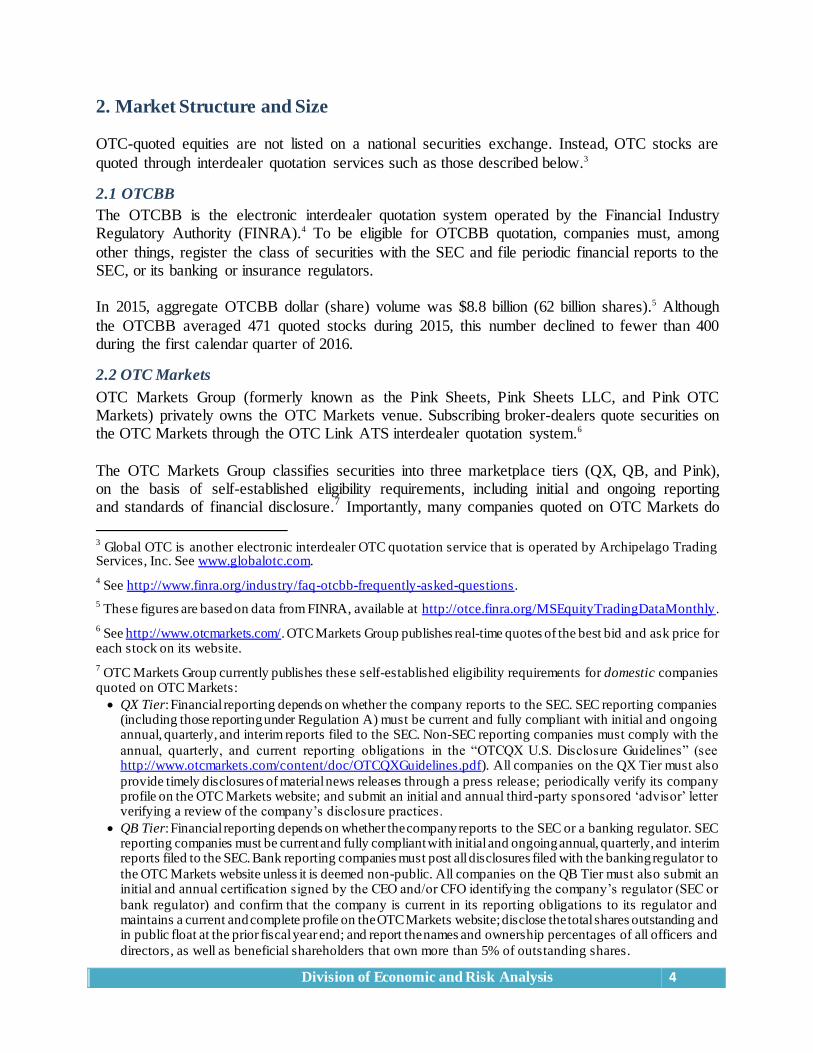
activities, OTC Markets also labels stocks in all tiers with certain concerns (e.g., market manipulation) as “Caveat Emptor.”11 Figure 1 plots the aggregate size of the QX, QB, and Pink tiers between 2012 and 2015. The left
y-axis and vertical bars depict the annual volume traded in billions of dollars. The line graph and corresponding right y-axis plot the number of quoted securities at the end of each calendar year. Figure 1 shows that the total dollar volume of trades on OTC Markets has grown in recent years.
For example, the dollar volume traded in 2015 ($200 billion) is 47% larger than the dollar volume traded in 2012 ($136 billion). During 2013 to 2015, the yearly dollar volume traded on OTC Markets totals between $200 and $238 billion.
Figure 1 also shows that dealers quoted approximately 10,000 securities on OTC Markets at the end of each of the years. By comparison, just over 2,700 securities were listed on Nasdaq during this same period, and approximately one-quarter of those securities traded on Nasdaq’s tier for smaller companies.12
Pink Tier: Financial reporting to a regulator is not required. The “Current Information” category requires that
companies must post initial and ongoing annual financial statements to the OTC Markets website. Quarterly and
annual financial reports are due within 45 and 90 days of the quarter end, respectively. However, those financial statements are not required to be audited by a firm registered with the Public Company Accounting Oversight Board (PCAOB). “Current Information” category companies must also publish a news release within 4 business
days to the OTC Markets website following specific material corporate events (see http://www.otcmarkets.com/ content/doc/OTCPinkGuidelines.doc). The “Limited Information” category requires that companies either have
financial information no older than 6 months published on the OTC Markets website or have made at least one required filing with the SEC in the past 6 months. “No Information” companies are those not reporting to a regulator and or OTC Markets, or those with information older than 6 months on the OTC Markets website.
8 A company (other than a bank or bank holding company) must register its securities with the SEC under Section
12(g) of the Securities Exchange Act of 1934 if it has (1) more than $10 million of total assets; and (2) a class of equity securities (other than those that are exempted) that is “held of record” by either 2,000 or more persons or 500 or more persons who are not accredited investors. A company must also register its securities with the SEC if it lists
them on any national securities exchange. See, generally, Section 12 of the Securities Exchange Act of 1934. 9 See http://www.otcmarkets.com/learn/otc-market-tiers, http://www.otcmarkets.com/learn/otc-company-reporting.
10 See http://www.otcmarkets.com/learn/otc-market-tiers.
11 See Litvak (2009), Jiang et al. (2015), and Brüggemann et al. (2016) for discussions on tiers of OTC Markets.
12 See Nasdaq, Inc. SEC Form 10-K, https://www.sec.gov/Archives/edgar/data/1120193/000112019316000020/
ndaq-20151231x10k.htm. In May 2016, about a quarter (805 out of 3,142) of the securities listed on Nasdaq trade on
Division of Economic and Risk Analysis 6
Figure 1. Annual size of equity securities trading on OTC Markets
Source: The data in Figure 1 is based on annual reports that the OTC Markets Group publishes on its website (see
http://www.otcmarkets.com/investor-relations/financials). These data do not include securities quoted on the OTCBB or traded in
the Grey Market.
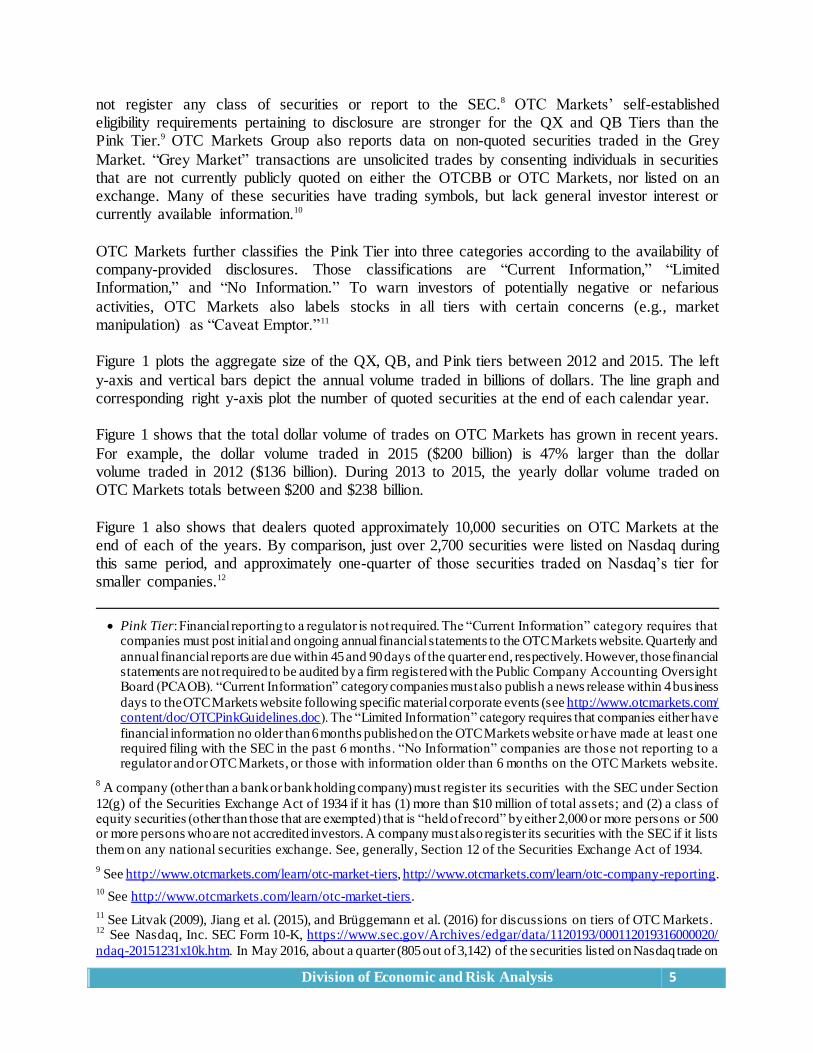
Figure 2 displays the number of securities quoted on OTC Markets at year-end by tier. The graph depicts 35% growth in the number of companies quoted on the Pink Tier since 2012, and a 70%
decline in the number quoted on the QB Tier in the same period.13 Approximately 85% of OTC Markets equity securities were quoted on the Pink Tier by the end of 2015.
14 Thus, while the
total number of securities quoted on the OTC Markets has remained mostly constant during this period, the composition of the OTC Markets has shifted towards a greater proportion of
companies in the Pink Tier, which has the weakest self-established eligibility requirements pertaining to disclosure.
its Capital Market Tier for smaller companies (formerly the Nasdaq SmallCap Market). See http://www.nasdaq.com/screening/companies -by-industry.aspx?exchange=NASDAQ. 13
Some of the decline in the QB Tier is due to changes in OTC Markets’ self-established eligibility requirements in
May 2014. As of that date, to remain in the QB Tier, a company has to meet a minimum bid price test and submit an annual certification. OTC Markets Group downgrades, to the Pink Tier, companies not meeting those standards. See https://www. otciq.com/otciq/ajax/showFinancialReportById.pdf?id=133631. 14
As of November 7, 2016, approximately 62.3% of companies in the Pink Tier are categorized as “Current
Information,” 4.4% are “Limited Information,” and 33.3% are “No Information.”
9,000
10,000
11,000
12,000
50
70
90
110
130
150
170
190
210
230
250
2012 2013 2014 2015
Nu
mb
er
of
se
cu
riti
es
Do
llar
vo
lum
e (
bil
lio
ns)
Dollar volume Number of securities
Division of Economic and Risk Analysis 7
Figure 2. Number of equity securities trading on the OTC Markets by tier
Source: The data in Figure 2 is based on annual reports that the OTC Markets Group publishes on its website (see
http://www.otcmarkets.com/investor-relations/financials). These data do not include securities quoted on the OTCBB or traded in
the Grey Market.
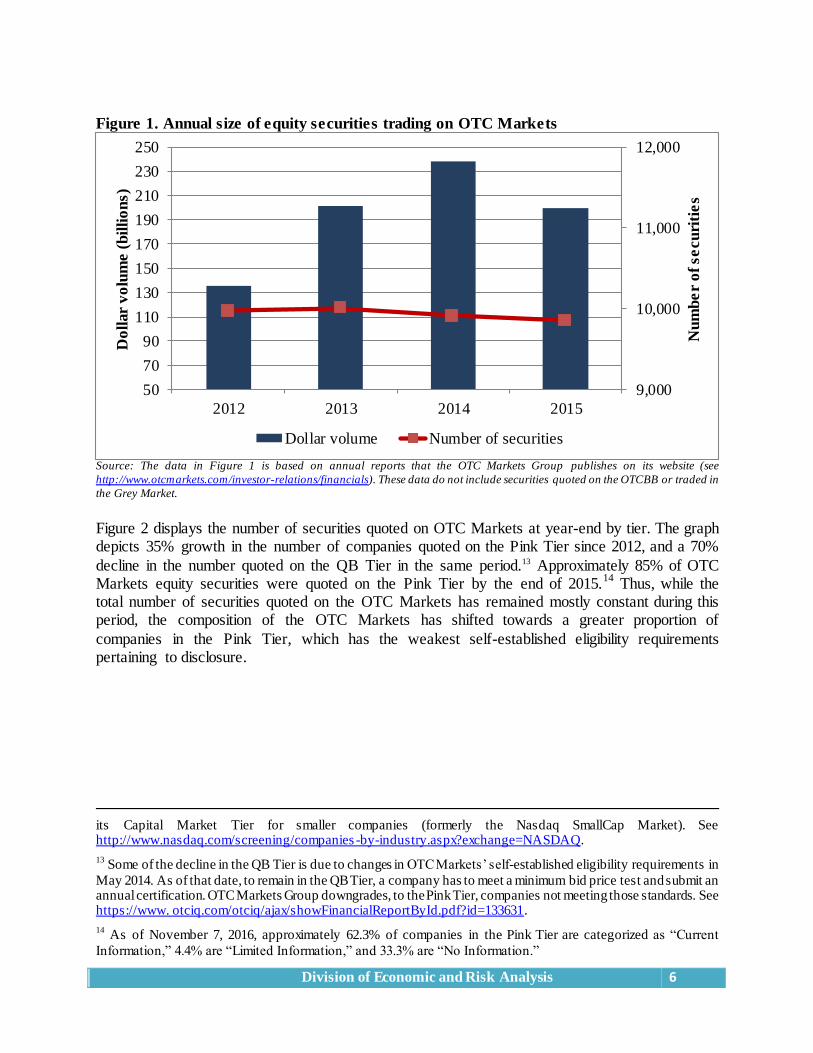
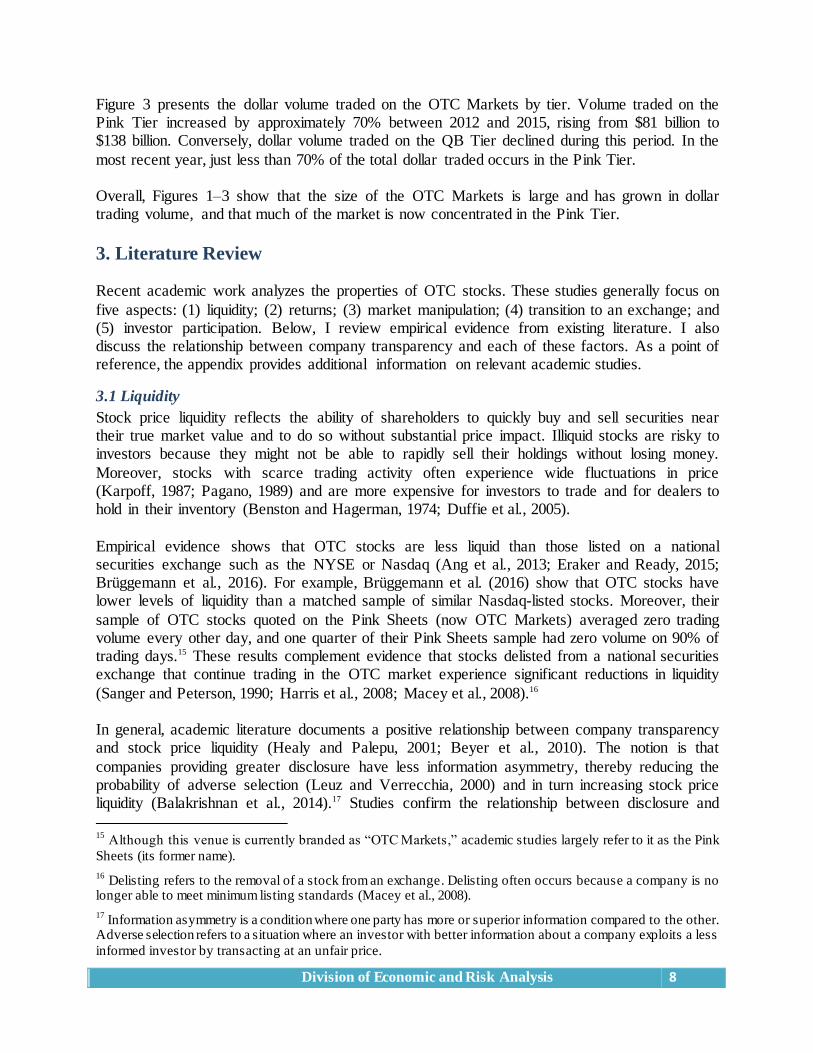
Figure 3. Dollar volume of equity securities trading on the OTC Markets by tier
Source: The data in Figure 3 is based on annual reports that the OTC Markets Group publishes on its website (see http://www.otcmarkets.com/investor-relations/financials). These data do not include securities quoted on the OTCBB or traded in
the Grey Market.
0
2,000
4,000
6,000
8,000
10,000
12,000
2012 2013 2014 2015
Nu
mb
er
of
se
cu
riti
es
Pink QX QB
0
50
100
150
200
250
300
2012 2013 2014 2015
Do
llar
vo
lum
e (
bil
lio
ns)
Pink QX QB
Division of Economic and Risk Analysis 8
Figure 3 presents the dollar volume traded on the OTC Markets by tier. Volume traded on the Pink Tier increased by approximately 70% between 2012 and 2015, rising from $81 billion to $138 billion. Conversely, dollar volume traded on the QB Tier declined during this period. In the
most recent year, just less than 70% of the total dollar traded occurs in the Pink Tier. Overall, Figures 1–3 show that the size of the OTC Markets is large and has grown in dollar trading volume, and that much of the market is now concentrated in the Pink Tier.
3. Literature Review Recent academic work analyzes the properties of OTC stocks. These studies generally focus on
five aspects: (1) liquidity; (2) returns; (3) market manipulation; (4) transition to an exchange; and (5) investor participation. Below, I review empirical evidence from existing literature. I also discuss the relationship between company transparency and each of these factors. As a point of reference, the appendix provides additional information on relevant academic studies.
3.1 Liquidity
Stock price liquidity reflects the ability of shareholders to quickly buy and sell securities near their true market value and to do so without substantial price impact. Illiquid stocks are risky to investors because they might not be able to rapidly sell their holdings without losing money.
Moreover, stocks with scarce trading activity often experience wide fluctuations in price (Karpoff, 1987; Pagano, 1989) and are more expensive for investors to trade and for dealers to hold in their inventory (Benston and Hagerman, 1974; Duffie et al., 2005).
Empirical evidence shows that OTC stocks are less liquid than those listed on a national securities exchange such as the NYSE or Nasdaq (Ang et al., 2013; Eraker and Ready, 2015; Brüggemann et al., 2016). For example, Brüggemann et al. (2016) show that OTC stocks have lower levels of liquidity than a matched sample of similar Nasdaq-listed stocks. Moreover, their
sample of OTC stocks quoted on the Pink Sheets (now OTC Markets) averaged zero trading volume every other day, and one quarter of their Pink Sheets sample had zero volume on 90% of trading days.15 These results complement evidence that stocks delisted from a national securities exchange that continue trading in the OTC market experience significant reductions in liquidity
(Sanger and Peterson, 1990; Harris et al., 2008; Macey et al., 2008).16 In general, academic literature documents a positive relationship between company transparency and stock price liquidity (Healy and Palepu, 2001; Beyer et al., 2010). The notion is that
companies providing greater disclosure have less information asymmetry, thereby reducing the probability of adverse selection (Leuz and Verrecchia, 2000) and in turn increasing stock price liquidity (Balakrishnan et al., 2014).17 Studies confirm the relationship between disclosure and
15
Although this venue is currently branded as “OTC Markets,” academic studies largely refer to it as the Pink
Sheets (its former name). 16
Delisting refers to the removal of a stock from an exchange. Delisting often occurs because a company is no longer able to meet minimum listing standards (Macey et al., 2008). 17
Information asymmetry is a condition where one party has more or superior information compared to the other. Adverse selection refers to a situation where an investor with better information about a company exploits a less
informed investor by transacting at an unfair price.
Division of Economic and Risk Analysis 9
liquidity among OTC stocks. For example, Bushee and Leuz (2005) examine the mandatory phase-in of SEC reporting requirements for firms quoted on the OTCBB between July 1999 and June 2000. Their study documents a positive association between mandatory increases in
OTCBB disclosure requirements and stock price liquidity. More recently, Brüggemann et al. (2016) document a similar relationship between company transparency and the liquidity of OTC stocks. In their paper, OTC stocks exhibit a monotonic
decline in liquidity, as reporting and eligibility requirements pertaining to disclosure weaken across the OTCBB, Pink Sheets, and Grey Market. Even within the Pink Sheets (now OTC Markets), studies find that stock liquidity is lower for categories of companies with less transparency (Jiang et al., 2015; Brüggemann et al., 2016).
Academic research also links company opacity with deterioration in the value of OTC stocks. Ang et al. (2013) find that illiquidity premiums (i.e., the larger discount rates that investors apply to stocks that are illiquid) are highest for OTC stocks held by individual investors and those
supplying fewer periodic disclosures of financial information. Their paper shows that even the most liquid OTC stocks generate a negative risk-adjusted return.18 Overall, academic literature finds that OTC stocks tend to be illiquid, especially when companies have fewer disclosures.
3.2 Returns
The return properties of OTC stocks are distinct from stocks listed on national securities exchanges. Empirical evidence shows that OTC stock returns are typically negative, volatile, and highly skewed.
Investing in OTC stocks, on average, generates negative returns for investors (Luft et al., 2001; Ang et al., 2013; Nofsinger and Varma, 2014; Eraker and Ready, 2015; Jiang et al., 2015; Brüggemann et al., 2016). For example, Brüggemann et al. (2016) study a sample of over 10,000
OTC stocks from 2001 to 2010 and find average and median annual returns of –27% and –37%, respectively. Similarly, Eraker and Ready (2015) study a sample of approximately 6,800 OTC stocks between 2000 and 2008. The investors in their sample average a –24% annual return after accounting for transaction costs. Moreover, these OTC investors lost an aggregate of $180
billion over the sample period. For many years, academic papers have identified stocks of smaller companies as being riskier investments than those of larger ones (e.g., Banz, 1981). Brüggemann et al. (2016) report that the
majority of OTC stocks have a small market capitalization and that the median OTC stock is priced as a penny stock.19 Moreover, the prior subsection discusses how OTC stocks have greater liquidity risk than those trading on a national securities exchange. Thus, one natural question is whether the negative returns in OTC stocks might simply reflect the exposure of investors to
18
“Risk-adjusted return” is a measure of the return relative the amount of risk taken.
19 Market capitalization is calculated by multiplying the current market price per share times the number of total
shares outstanding. Companies with a small market capitalization are frequently classified as “microcap” or
“nanocap.” The term “penny stock” generally refers to stocks that trade below $5 per share. See Section 15(h) and Rules 15g-1 through 15g-100, and 3a51-1 under the Securities Exchange Act of 1934.
Division of Economic and Risk Analysis 10
larger amounts of risk. In other words, OTC stocks might generate a negative actual return but a positive risk-adjusted return. Empirical evidence rejects this notion.
To answer this question, academic studies examine OTC stock returns after accounting for known risk factors, such as company size. These studies find that, in addition to negative actual returns, OTC stocks also exhibit negative risk-adjusted returns (Ang et al., 2013; Eraker and Ready, 2015; Brüggemann et al., 2016). Eraker and Ready (2015) show that a portfolio of OTC
stocks underperforms a portfolio of exchange-listed stocks by about 2% percent per month including transaction costs. As noted above, Ang et al. (2013) find that even the most liquid OTC stocks still generate a negative risk-adjusted return.
The returns of OTC stocks are also significantly more volatile than exchange-listed stocks (Ang et al., 2013; Brüggemann et al., 2016). For example, Brüggemann et al. (2016) find the volatility of OTC stock returns is more than two times larger than the return volatility of a matched sample of Nasdaq-listed stocks.
Academic studies point to a lack of information produced by OTC companies as one determinant of negative and volatile OTC stock returns (Luft et al., 2001; Luft and Levine, 2004). Leuz et al. (2008) study a sample of just under 500 companies that stop reporting to the SEC (i.e., “go
dark”), but continue to be quoted on the OTC markets. They find that the stock price of those companies experiences an abnormal decline of approximately 10% when the company announces the decision to suspend disclosures to the SEC.20 Litvak (2009) studies OTC stocks after OTC Markets introduced a classification of tiers on the basis of self-established eligibility
requirements pertaining to company provided information and finds that the market reaction was significantly negative for companies assigned to the lower-disclosing categories. Another possible determinant of negative OTC stock returns is short-sale constraints (Aggarwal
and Wu, 2006; Ang et al., 2013; Eraker and Ready, 2015). In the presence of constraints on short selling, stock prices do not fully reflect the views of bearish investors and thus are less informative about the true market value (Miller, 1977). In equilibrium, this situation results in stock prices that are too high (Jarrow, 1980) and increases the risk of large declines in stock
prices around bad news (Hong and Stein, 2003). Ang et al. (2013) and Eraker and Ready (2015) argue that the short-selling of OTC stocks is challenging for investors because of brokerage restrictions and difficulties in locating OTC shares to sell short. Ang et al. (2013) further suggest that negative risk-adjusted returns due to short-sale constraints should be stronger for stocks with
a greater divergence in opinions between optimistic and pessimistic investors. Using a subset of OTC companies that do not disclose financial information, they find that stocks with a high divergence of opinions among investors have more negative risk-adjusted returns. Jain and Jain (2016) study short-selling activity in OTC stocks. They provide suggestive evidence that return
patterns and short interest levels reflect manipulative behavior by OTC short sellers that is not informative.
20
Leuz et al. (2008) note that a portion of this decline also reflects negative information conveyed about current financial distress, future firm growth prospects, and shareholder concerns of weakening governance.
Division of Economic and Risk Analysis 11
Studies also report that the return distribution of OTC stocks is highly positively skewed (Eraker and Ready, 2015; Brüggemann et al., 2016). Such a distribution of returns indicates that investors frequently lose small investments in OTC stocks, but on occasion earn an extremely
large return. For instance, Eraker and Ready (2015) find that 25% of the OTC stocks in their sample lose 99% of their initial value. A few OTC stocks, however, exhibit extremely large, positive returns, which generates a lottery-like distribution. Eraker and Ready (2015) show the skewed return distribution of OTC stocks is larger than the skewed return distribution for those
listed on the NYSE, NYSE MKT (formerly the American Stock Exchange), and Nasdaq.
3.3 Market manipulation
OTC stocks have been frequent targets of alleged market manipulation (Aggarwal and Wu, 2006;
Böhme and Holz, 2006; Frieder and Zittrain, 2007; Nelson et al., 2013). For example, Cumming et al. (2015) document that companies quoted on the Pink Sheets (now OTC Markets) have the highest percentage of alleged fraud as measured by litigated cases among exchanges and trading platforms in the United States, Canada, and the United Kingdom. In their sample, the majority of
litigation related to companies quoted on the Pink Sheets centers on delinquent filings with regulators, fraudulent disclosures, illegal distribution of securities, and pump-and-dump schemes.21 OTC investor losses due to penny stock fraud were estimated to be $2 billion per year in the 1980s, and $6 billion per year in the late 1990s.22
In general, market manipulation schemes are meant to increase the stock price and liquidity of targeted stocks to facilitate the sale of shares at inflated prices by informed parties, such as insiders, promoters, or others involved in the scheme (Aggarwal and Wu, 2006). Eraker and
Ready (2015) argue that the OTC markets are a preferred forum for fraudulent behavior due to the lack of or deficiencies in company-provided disclosures. The notion here is twofold. First, misleading statements by fraudulent parties about a company are more likely to result in stock price and volume movements if investors lack alternative sources of information, such as well-
disseminated, timely, and credible disclosures. Second, as discussed in Subsection 3.1, the most opaque OTC companies tend to have the least liquid stocks. For those companies, even small levels of trading activity might be viewed as abnormal or informative, thereby mechanically increasing the stock price even in the absence of false information (Allen and Gale, 1992).
Manipulation in OTC stocks occurs in several ways, such as through the release of false or exaggerated information via email spam campaigns, rumors in Internet chat rooms or forums, or dubious press releases (e.g., Hanke and Hauser, 2008; Nelson et al., 2013; Cumming and Johan,
2013). OTC companies are also commonly touted through paid promotions, where the fact of the compensation to the promoter is often not disclosed (Massoud et al., 2016), or in so-called boiler rooms, where OTC stocks are recommended via high-pressure sales tactics like those depicted in the movie, “The Wolf of Wall Street” (Lampe, 1990; Eraker and Ready, 2015). These tactics are
21
A “pump-and-dump” scheme typically involves the release of false information meant to increase (“pump”) the
stock price. Once the promoters sell (“dump”) their shares, the price quickly declines and remaining investors bear the loss (Böhme and Holz, 2006; Hanke and Hauser, 2008; Cumming and Johan, 2013). 22
See Michael Schroeder, “Penny-Stock Fraud ‘Remedies’ Are Adding to Abuse Problem,” Wall Street Journal, September 4, 1997, available at http://www.wsj.com/articles/SB873321424244042000. These figures are referenced
in the U.S. Senate hearing titled, “Fraud in the Micro-Capital Markets Including Penny Stock Fraud,” September 22, 1997, available at https://www.gpo.gov/fdsys/pkg/CHRG-105shrg44227/html/CHRG-105shrg44227.htm.
Division of Economic and Risk Analysis 12
meant to give potential investors the (mis)perception of investing in a small company that will grow into a bigger company with a higher stock price. A unique aspect of the OTC market is that information-based manipulations often contain false information that is overly optimistic (i.e.,
positive news) rather than overly pessimistic (i.e., negative news), likely because of short sales constraints that limit the ability of fraudsters to exploit negative news (Aggarwal and Wu, 2006). In markets that have fewer short-sale constraints, information-based manipulations might rely on either positive or negative information.
Several recent academic papers examine spam emails touting OTC stocks (Böhme and Holz, 2006; Frieder and Zittrain, 2007; Bouraoui et al., 2013; Nelson et al., 2013). For example, Nelson et al. (2013) document that there is considerable variation in the content of stock spam
messages. The authors find spam messages that are both optimistic about a stock’s prospects and whose information is viewed as credible have a particularly large impact on stock prices and trading volume. Nelson et al. (2013) posit that fraudsters frequently seek credibility by referencing prior company disclosures, such as press releases. These results are consistent with
the model of Benabou and Laroque (1992), who show that stock market manipulation, in general, is facilitated by difficulties in verifying truthful company disclosures. Massoud et al. (2016) examine a sample that includes OTC companies that hire promoters to
engage in secret stock promotions to increase their stock price and liquidity. They find that secret stock promotions typically coincide with trading by insiders, which is consistent with pump-and-dump schemes.
Academic studies also show that OTC market manipulations are generally effective during the manipulation period. Aggarwal and Wu (2006), for example, examine SEC-litigated instances of alleged market manipulation in stocks quoted on the OTCBB and Pink Sheets (now OTC Markets). They find that stock prices, liquidity, and volatility all increase during the alleged
manipulation period, but dissolve quickly once the scheme ends. Similarly, Böhme and Holz (2006), Frieder and Zittrain (2007), and Hanke and Hauser (2008) find that spam email campaigns create spikes in trading volume and stock prices, followed by a prompt reversal in both measures over the next several trading days.
While the patterns of short-term price and volume movements around stock spam emails are consistent with stock touting rather than changes in OTC company prospects or information asymmetry, some spikes in OTC trading volume might not reflect market manipulation. For
example, Bollen and Christie (2009) provide statistics suggesting that some periods of extreme increases in OTC trading volume represent changes in company fundamentals rather than market manipulation schemes. This result highlights the importance of credible and accurate information flow in OTC markets so that investors can better discern between informative and manipulative
trading volume. Overall, academic literature establishes that OTC stocks are frequent targets of alleged market manipulation. These studies reveal that fraudulent schemes, such as spam emails, lead to near-
term increases in stock prices, liquidity, and volatility during the manipulation period, followed by reversals once the scheme ends.
Division of Economic and Risk Analysis 13
3.4 Transition to exchanges
One allure of investing in OTC stocks is the potential opportunity to invest in young, growth companies that might grow into larger companies that meet the eligibility requirements to list on a national securities exchange, such as Nasdaq or the NYSE. If a company transitions to an
exchange, its stock price could increase significantly as disclosure requirements and liquidity improves and the company is able to attract institutional investors and analysts. Although Subsection 3.2 indicates that OTC stocks typically realize negative investment returns,
recent work considers whether OTC stocks, over time, “graduate” to an exchange. To the extent that OTC markets are a viable market for transitioning companies, then we would expect a sizeable portion of OTC companies to eventually trade on a national securities exchange (Brüggemann et al., 2016).23
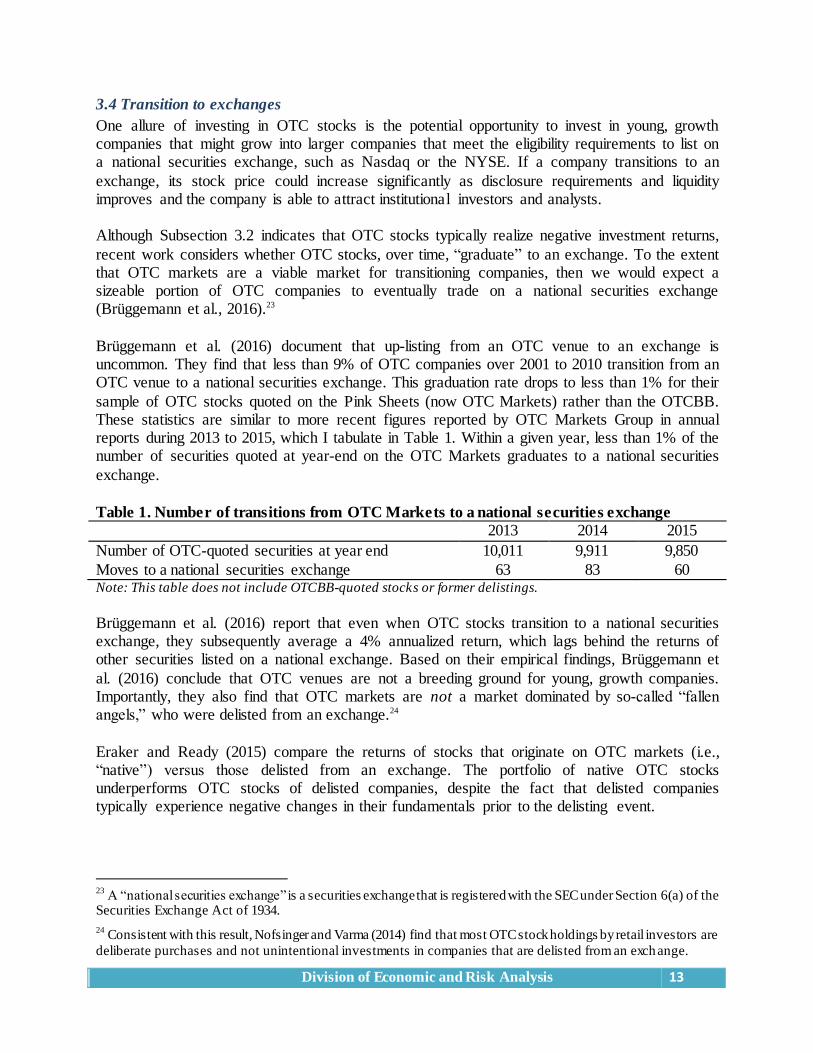
Brüggemann et al. (2016) document that up-listing from an OTC venue to an exchange is uncommon. They find that less than 9% of OTC companies over 2001 to 2010 transition from an OTC venue to a national securities exchange. This graduation rate drops to less than 1% for their
sample of OTC stocks quoted on the Pink Sheets (now OTC Markets) rather than the OTCBB. These statistics are similar to more recent figures reported by OTC Markets Group in annual reports during 2013 to 2015, which I tabulate in Table 1. Within a given year, less than 1% of the number of securities quoted at year-end on the OTC Markets graduates to a national securities
exchange.
Table 1. Number of transitions from OTC Markets to a national securities exchange
2013 2014 2015
Number of OTC-quoted securities at year end 10,011 9,911 9,850
Moves to a national securities exchange 63 83 60 Note: This table does not include OTCBB-quoted stocks or former delistings.
Brüggemann et al. (2016) report that even when OTC stocks transition to a national securities exchange, they subsequently average a 4% annualized return, which lags behind the returns of other securities listed on a national exchange. Based on their empirical findings, Brüggemann et
al. (2016) conclude that OTC venues are not a breeding ground for young, growth companies. Importantly, they also find that OTC markets are not a market dominated by so-called “fallen angels,” who were delisted from an exchange.24
Eraker and Ready (2015) compare the returns of stocks that originate on OTC markets (i.e., “native”) versus those delisted from an exchange. The portfolio of native OTC stocks underperforms OTC stocks of delisted companies, despite the fact that delisted companies typically experience negative changes in their fundamentals prior to the delisting event.
23
A “national securities exchange” is a securities exchange that is registered with the SEC under Section 6(a) of the Securities Exchange Act of 1934. 24
Consistent with this result, Nofsinger and Varma (2014) find that most OTC stock holdings by retail investors are
deliberate purchases and not unintentional investments in companies that are delisted from an exch ange.
Division of Economic and Risk Analysis 14
Taken together, these studies reject the perception that OTC markets are a birthplace for young and high growth stocks that frequently transition to a national securities exchange.
3.5 Investor participation
To summarize the literature reviewed so far, academic studies find that OTC stocks have unique characteristics. They tend to be illiquid; are frequently targets of alleged market manipulation; generate negative and volatile returns; and rarely transition to a national securities exchange.
Empirical evidence finds that these characteristics are exacerbated when OTC-quoted companies provide fewer disclosures. Yet, Figures 1–3 indicate that the market for OTC stocks remains large and is growing by volume, especially in the Pink Tier of OTC Markets, which has the weakest self-established eligibility requirements pertaining to disclosure. Moreover, studies find
that OTC stocks tend to be held by retail investors rather than institutions (Ang et al., 2013). So this leads to the important question of why retail investors participate in OTC markets. As discussed further below, academic literature posits at least two explanations of why
individual investors might purchase OTC stocks when those investments typically have negative risk-adjusted returns. The first hypothesis is that investors are drawn to securities with lottery-like payoffs, and the other is that investors are systematically duped about the stock return probabilities.
3.5.1 Opportunity for lottery-like payoffs
OTC stocks are predominantly low-priced securities (i.e., penny stocks) of microcap companies. One attraction of investing in these stocks is that a small change in price can generate a large investment return in terms of percentages, even if the actual dollar return is small. The payoff
structure for these securities is uniquely asymmetric. The largest percentage loss for OTC stocks is 100% (as it is for all stocks), but there is opportunity, although extremely rare, to gain more than a 100% return on an OTC stock investment.
As Subsection 3.2 discusses, academic studies find that the return distribution of OTC stocks is highly positively skewed (e.g., Brüggemann et al., 2016). This lottery-like distribution indicates that investors frequently lose small investments in OTC stocks, but occasionally receive an extremely large return. Eraker and Ready (2015) note that it is surprising that investors are
willing to hold OTC stocks given that they earn significantly lower returns, on average, than exchange-listed stocks. They hypothesize that investors might accept negative OTC stock returns on average in order to gain exposure to an asset with lottery-like payoffs, which is similar in spirit to a model of investor behavior developed by Barberis and Huang (2008).25
Nofsinger and Varma (2014) hypothesize that if investors are simply gambling in OTC stocks, then we might expect their demographic profiles to be similar to that of a typical gambler. They point to evidence in Kumar (2009), who finds that investors in stocks on a national securities
exchange with lottery-type payoffs tend to have socioeconomic profiles similar to individuals who participate more often in state lotteries. For example, Kumar (2009) finds that investors in
25
In the model of Barberis and Huang (2008), some investors, who overweight “tails” of stock return distributions, are willing to make large, non-diversified investments in a stock with expected returns that are skewed. These
investors accept negative returns in order to gain exposure to the possibility of a large, positive gain. (Generally, the term “tail” refers to the part of the return distribution that is farthest from the average value.)
Division of Economic and Risk Analysis 15
lottery-type stocks on a national securities exchange tend to be younger, poorer, less educated, and stem from areas with greater unemployment rates. The risk-adjusted returns of those investors tend to be negative.
3.5.2 Inaccurate estimates of payoff probabilities
A second explanation of OTC investor behavior is that retail investors might not accurately estimate payoff probabilities of OTC stocks, especially when the company provides limited
financial information (Eraker and Ready, 2015). Academic studies have found that individual investors have limited attention spans and tend to select and invest in stocks that catch their attention (Barber and Odean, 2008). Accordingly,
OTC investors might fall victim to market manipulation schemes such as stock promotions or spam email campaigns. Stock promotions also might be successful because individual investors might not fully process information on the incentives of fraudsters in promoting OTC stocks (Hirshleifer and Teoh, 2003). Moreover, OTC stocks are many times promoted by fraudsters that
do not disclose that the promotion is paid for by a company (Massoud et al., 2016).
3.5.3 Existing evidence on investor participation
Eraker and Ready (2015) provide evidence that is more consistent with investors being systematically duped about return probabilities rather than having a preference for lottery-like
payoffs. After controlling for the shape of the return distribution, the authors find that delisted Nasdaq and NYSE stocks trading on the OTC market outperform native OTC stocks. Thus, even in stocks with lottery-like payoffs, the OTC stocks of companies with more available information tend to outperform those of less transparent companies.
26
Nofsinger and Varma (2014) examine historical brokerage data from the early 1990s on individual investor trades. The authors find that half of the retail investors in this sample invested in stocks quoted on the OTCBB and Pink Sheets (now OTC Markets). Demographic information
reveals that these OTC investors do not meet the typical profile of a lottery player or gambler. Instead, OTC investors in this period tended to be older, more diversified, and have greater wealth and investing experience than investors that did not invest in OTC stocks. This result suggests that even experienced retail investors tend to experience negative outcomes when
participating in OTC equity markets. Overall, current empirical evidence suggests OTC investors are not simply seeking lottery-type stocks. Instead, these studies lend support to the idea that even more experienced retail investors
tend to be systematically poor at estimating return probabilities and generating positive returns in OTC stocks due to informational disadvantages and market manipulation. Importantly, these findings do not rule out the possibility that OTC investors might include both individuals seeking lottery-type payoffs and those that are susceptible to market manipulation.
4. Transaction-level Data Analysis
26
The notion here is that the average OTC stock delisted from an exchange has better available information, likely due to prior reporting requirements, than the average OTC stock that has never been listed on an exchange (Eraker
and Ready, 2015).
Division of Economic and Risk Analysis 16
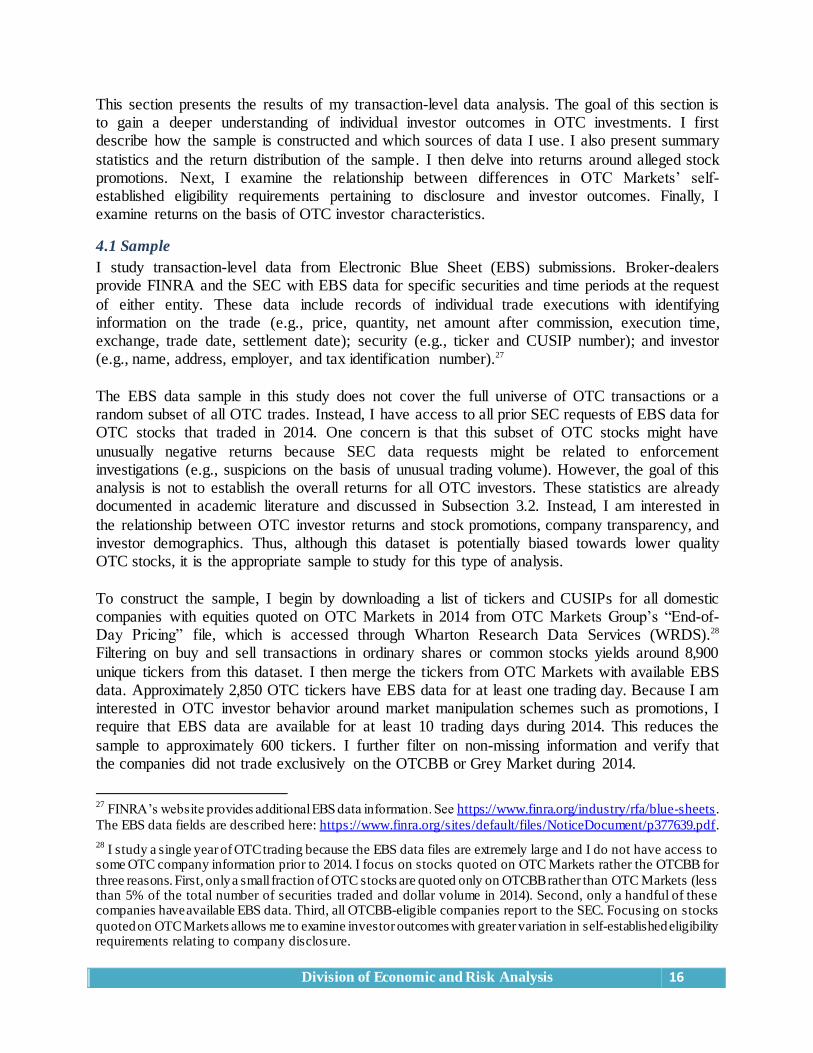
This section presents the results of my transaction-level data analysis. The goal of this section is to gain a deeper understanding of individual investor outcomes in OTC investments. I first describe how the sample is constructed and which sources of data I use. I also present summary
statistics and the return distribution of the sample. I then delve into returns around alleged stock promotions. Next, I examine the relationship between differences in OTC Markets’ self-established eligibility requirements pertaining to disclosure and investor outcomes. Finally, I examine returns on the basis of OTC investor characteristics.
4.1 Sample
I study transaction-level data from Electronic Blue Sheet (EBS) submissions. Broker-dealers provide FINRA and the SEC with EBS data for specific securities and time periods at the request
of either entity. These data include records of individual trade executions with identifying information on the trade (e.g., price, quantity, net amount after commission, execution time, exchange, trade date, settlement date); security (e.g., ticker and CUSIP number); and investor (e.g., name, address, employer, and tax identification number).27
The EBS data sample in this study does not cover the full universe of OTC transactions or a random subset of all OTC trades. Instead, I have access to all prior SEC requests of EBS data for OTC stocks that traded in 2014. One concern is that this subset of OTC stocks might have
unusually negative returns because SEC data requests might be related to enforcement investigations (e.g., suspicions on the basis of unusual trading volume). However, the goal of this analysis is not to establish the overall returns for all OTC investors. These statistics are already documented in academic literature and discussed in Subsection 3.2. Instead, I am interested in
the relationship between OTC investor returns and stock promotions, company transparency, and investor demographics. Thus, although this dataset is potentially biased towards lower quality OTC stocks, it is the appropriate sample to study for this type of analysis.
To construct the sample, I begin by downloading a list of tickers and CUSIPs for all domestic companies with equities quoted on OTC Markets in 2014 from OTC Markets Group’s “End-of-Day Pricing” file, which is accessed through Wharton Research Data Services (WRDS).28 Filtering on buy and sell transactions in ordinary shares or common stocks yields around 8,900
unique tickers from this dataset. I then merge the tickers from OTC Markets with available EBS data. Approximately 2,850 OTC tickers have EBS data for at least one trading day. Because I am interested in OTC investor behavior around market manipulation schemes such as promotions, I require that EBS data are available for at least 10 trading days during 2014. This reduces the
sample to approximately 600 tickers. I further filter on non-missing information and verify that the companies did not trade exclusively on the OTCBB or Grey Market during 2014.
27
FINRA’s website provides additional EBS data information. See https://www.finra.org/industry/rfa/blue-sheets.
The EBS data fields are described here: https://www.finra.org/sites/default/files/NoticeDocument/p377639.pdf. 28
I study a single year of OTC trading because the EBS data files are extremely large and I do not have access to some OTC company information prior to 2014. I focus on stocks quoted on OTC Markets rather the OTCBB for
three reasons. First, only a small fraction of OTC stocks are quoted only on OTCBB rather than OTC Markets (less than 5% of the total number of securities traded and dollar volume in 2014). Second, only a handful of these companies have available EBS data. Third, all OTCBB-eligible companies report to the SEC. Focusing on stocks
quoted on OTC Markets allows me to examine investor outcomes with greater variation in self-established eligibility requirements relating to company disclosure.
Division of Economic and Risk Analysis 17
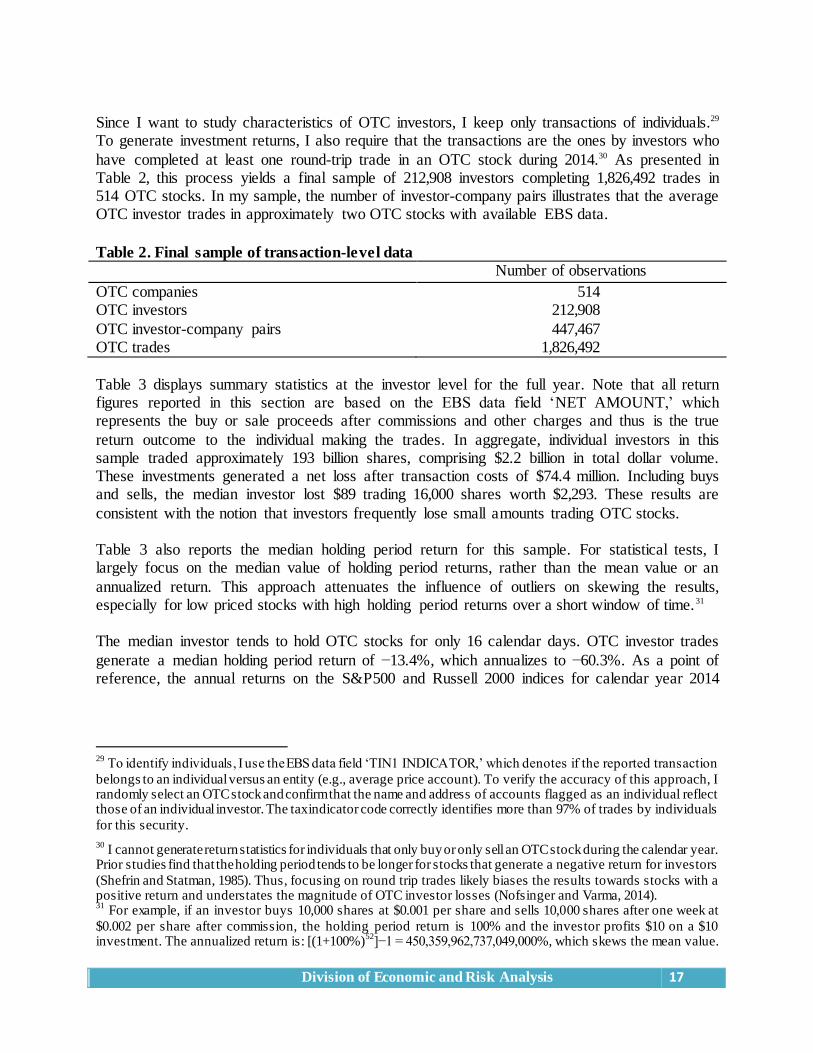
Since I want to study characteristics of OTC investors, I keep only transactions of individuals.29 To generate investment returns, I also require that the transactions are the ones by investors who
have completed at least one round-trip trade in an OTC stock during 2014.30 As presented in Table 2, this process yields a final sample of 212,908 investors completing 1,826,492 trades in 514 OTC stocks. In my sample, the number of investor-company pairs illustrates that the average OTC investor trades in approximately two OTC stocks with available EBS data.
Table 2. Final sample of transaction-level data
Number of observations
OTC companies 514 OTC investors 212,908
OTC investor-company pairs 447,467 OTC trades 1,826,492
Table 3 displays summary statistics at the investor level for the full year. Note that all return figures reported in this section are based on the EBS data field ‘NET AMOUNT,’ which represents the buy or sale proceeds after commissions and other charges and thus is the true
return outcome to the individual making the trades. In aggregate, individual investors in this sample traded approximately 193 billion shares, comprising $2.2 billion in total dollar volume. These investments generated a net loss after transaction costs of $74.4 million. Including buys and sells, the median investor lost $89 trading 16,000 shares worth $2,293. These results are
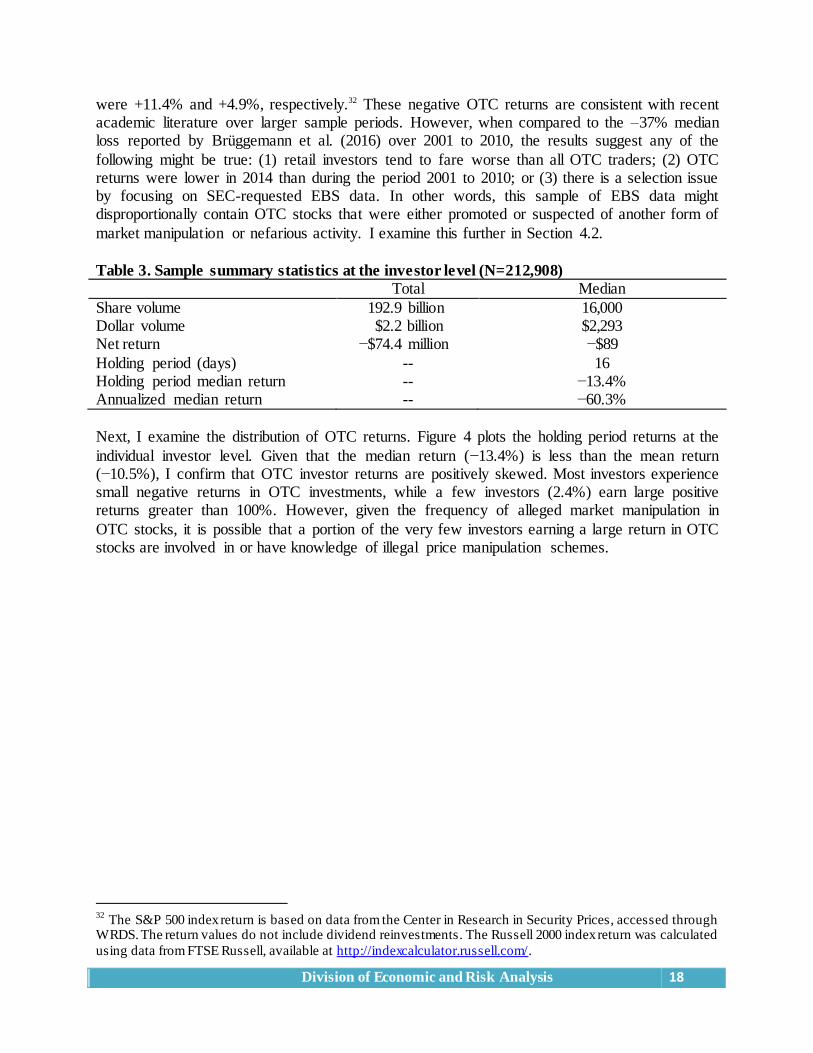
consistent with the notion that investors frequently lose small amounts trading OTC stocks. Table 3 also reports the median holding period return for this sample. For statistical tests, I largely focus on the median value of holding period returns, rather than the mean value or an
annualized return. This approach attenuates the influence of outliers on skewing the results, especially for low priced stocks with high holding period returns over a short window of time. 31 The median investor tends to hold OTC stocks for only 16 calendar days. OTC investor trades
generate a median holding period return of −13.4%, which annualizes to −60.3%. As a point of reference, the annual returns on the S&P500 and Russell 2000 indices for calendar year 2014
29
To identify individuals, I use the EBS data field ‘TIN1 INDICATOR,’ which denotes if the reported transaction
belongs to an individual versus an entity (e.g., average price account). To verify the accuracy of this approach, I randomly select an OTC stock and confirm that the name and address of accounts flagged as an individual reflect those of an individual investor. The tax indicator code correctly identifies more than 97% of trades by individuals
for this security. 30
I cannot generate return statistics for individuals that only buy or only sell an OTC stock during the calendar year. Prior studies find that the holding period tends to be longer for stocks that generate a negative return for investors
(Shefrin and Statman, 1985). Thus, focusing on round trip trades likely biases the results towards stocks with a positive return and understates the magnitude of OTC investor losses (Nofsinger and Varma, 2014). 31
For example, if an investor buys 10,000 shares at $0.001 per share and sells 10,000 shares after one week at
$0.002 per share after commission, the holding period return is 100% and the investor profits $10 on a $10 investment. The annualized return is: [(1+100%)
52]−1 = 450,359,962,737,049,000%, which skews the mean value.
Division of Economic and Risk Analysis 18
were +11.4% and +4.9%, respectively.32 These negative OTC returns are consistent with recent academic literature over larger sample periods. However, when compared to the –37% median loss reported by Brüggemann et al. (2016) over 2001 to 2010, the results suggest any of the
following might be true: (1) retail investors tend to fare worse than all OTC traders; (2) OTC returns were lower in 2014 than during the period 2001 to 2010; or (3) there is a selection issue by focusing on SEC-requested EBS data. In other words, this sample of EBS data might disproportionally contain OTC stocks that were either promoted or suspected of another form of
market manipulation or nefarious activity. I examine this further in Section 4.2.
Table 3. Sample summary statistics at the investor level (N=212,908)
Total Median
Share volume 192.9 billion 16,000 Dollar volume $2.2 billion $2,293 Net return −$74.4 million −$89
Holding period (days) -- 16 Holding period median return -- −13.4% Annualized median return -- −60.3%
Next, I examine the distribution of OTC returns. Figure 4 plots the holding period returns at the
individual investor level. Given that the median return (−13.4%) is less than the mean return (−10.5%), I confirm that OTC investor returns are positively skewed. Most investors experience small negative returns in OTC investments, while a few investors (2.4%) earn large positive returns greater than 100%. However, given the frequency of alleged market manipulation in
OTC stocks, it is possible that a portion of the very few investors earning a large return in OTC stocks are involved in or have knowledge of illegal price manipulation schemes.
32
The S&P 500 index return is based on data from the Center in Research in Security Prices, accessed through WRDS. The return values do not include dividend reinvestments. The Russell 2000 index return was calculated
using data from FTSE Russell, available at http://indexcalculator.russell.com/.
Division of Economic and Risk Analysis 19
Figure 4. Distribution of OTC holding period returns at the investor level (N=212,908)
Figure 5. OTC dollar returns at the investor level (N=212,908)
0
5,000
10,000
15,000
20,000
25,000
30,000
35,000
[−100,−
90]
[−89,−
80]
[−79,−
70]
[−69,−
60]
[−59,−
50]
[−49,−
40]
[−39,−
30]
[−29,−
20]
[−19,−
10]
[−9,
0]
[+1
,+1
0]
[+1
1,+
20
]
[+2
1,+
30
]
[+3
1,+
40
]
[+4
1,+
50
]
[+5
1,+
60
]
[+6
1,+
70
]
[+7
1,+
80
]
[+8
1,+
90
]
[+9
1,+
10
0]
[10
1+
]
Co
un
t o
f O
TC
in
ve
sto
rs
Total holding period return range (%)
67.1%
32.9% Loss
Gain
Division of Economic and Risk Analysis 20
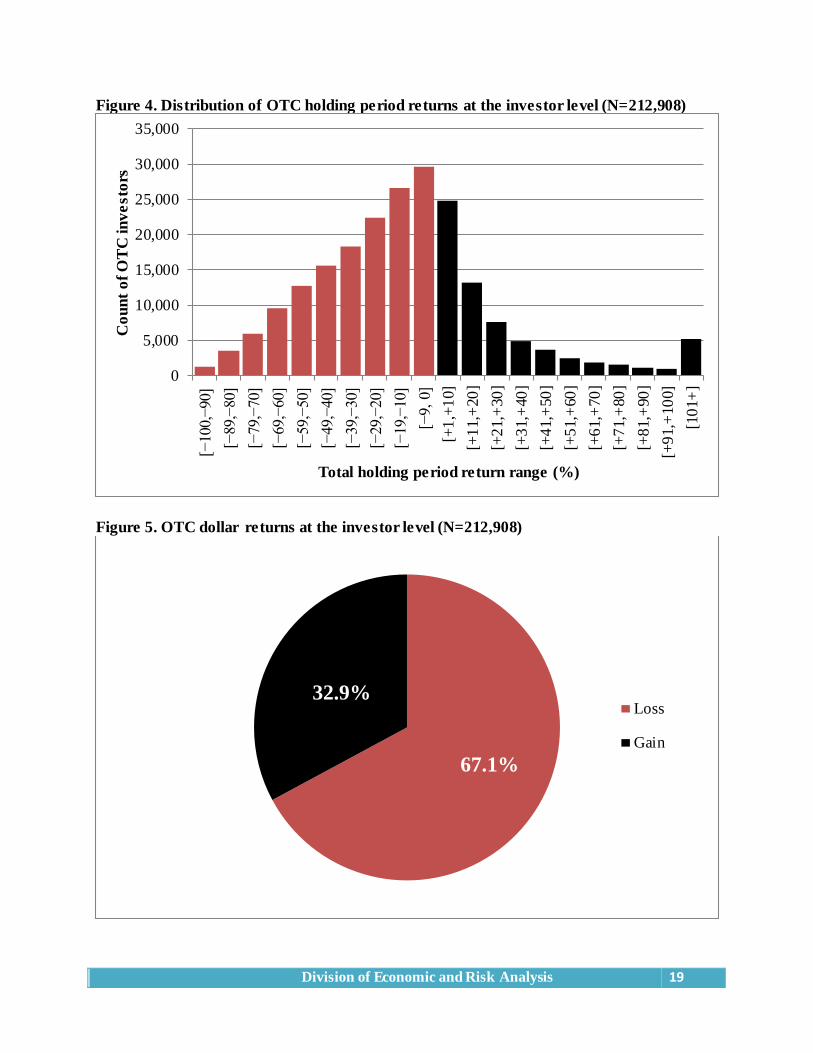
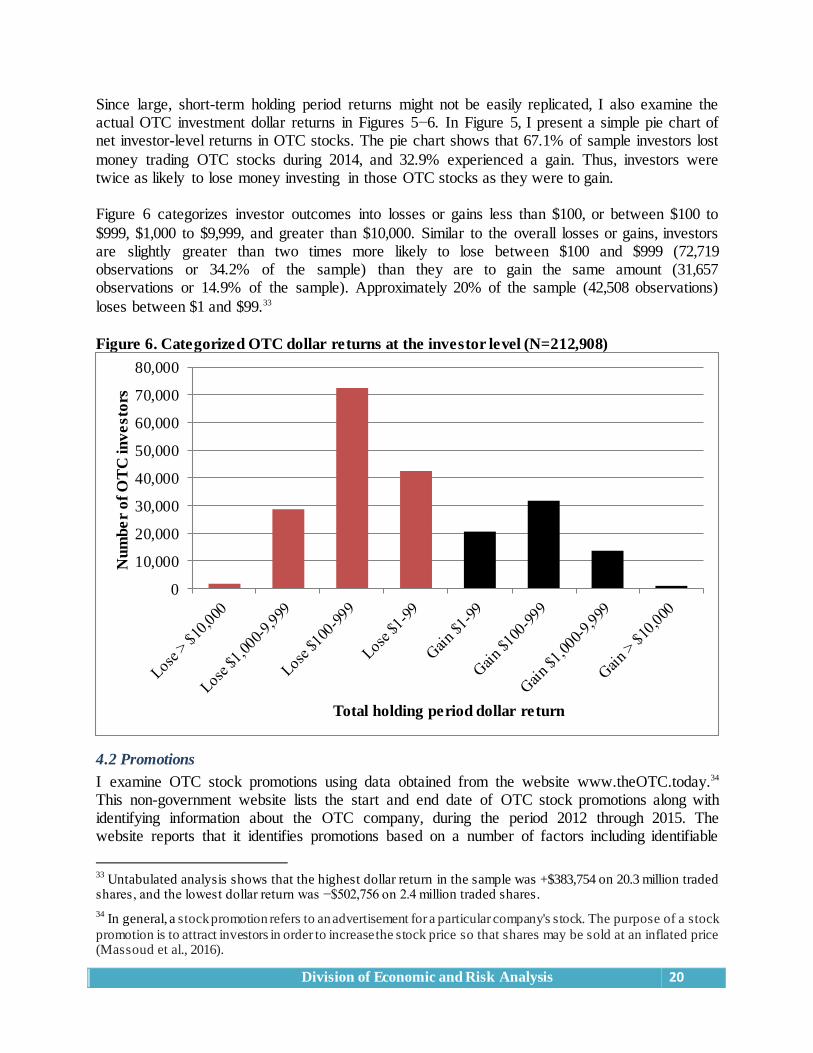
Since large, short-term holding period returns might not be easily replicated, I also examine the actual OTC investment dollar returns in Figures 5−6. In Figure 5, I present a simple pie chart of net investor-level returns in OTC stocks. The pie chart shows that 67.1% of sample investors lost
money trading OTC stocks during 2014, and 32.9% experienced a gain. Thus, investors were twice as likely to lose money investing in those OTC stocks as they were to gain. Figure 6 categorizes investor outcomes into losses or gains less than $100, or between $100 to
$999, $1,000 to $9,999, and greater than $10,000. Similar to the overall losses or gains, investors are slightly greater than two times more likely to lose between $100 and $999 (72,719 observations or 34.2% of the sample) than they are to gain the same amount (31,657 observations or 14.9% of the sample). Approximately 20% of the sample (42,508 observations)
loses between $1 and $99.33
Figure 6. Categorized OTC dollar returns at the investor level (N=212,908)
4.2 Promotions
I examine OTC stock promotions using data obtained from the website www.theOTC.today.34 This non-government website lists the start and end date of OTC stock promotions along with identifying information about the OTC company, during the period 2012 through 2015. The website reports that it identifies promotions based on a number of factors including identifiable
33
Untabulated analysis shows that the highest dollar return in the sample was +$383,754 on 20.3 million traded shares, and the lowest dollar return was −$502,756 on 2.4 million traded shares. 34
In general, a stock promotion refers to an advertisement for a particular company's stock. The purpose of a stock
promotion is to attract investors in order to increase the stock price so that shares may be sold at an inflated price (Massoud et al., 2016).
0
10,000
20,000
30,000
40,000
50,000
60,000
70,000
80,000
Nu
mb
er
of
OT
C in
ve
sto
rs
Total holding period dollar return
Division of Economic and Risk Analysis 21
pump-and-dump schemes and the dissemination of blatantly false information. I randomly select 30 reported OTC stock promotions from the website and confirm that almost all of these stocks have abnormally large trading volume during the reported period of promotion. Also, as noted
above, one potential concern is that the EBS data that the SEC requests might disproportionately reflect OTC stocks with greater suspicions of market manipulation. Examining promotion statistics sheds some light on the potential bias of the sample towards lower quality OTC stocks.
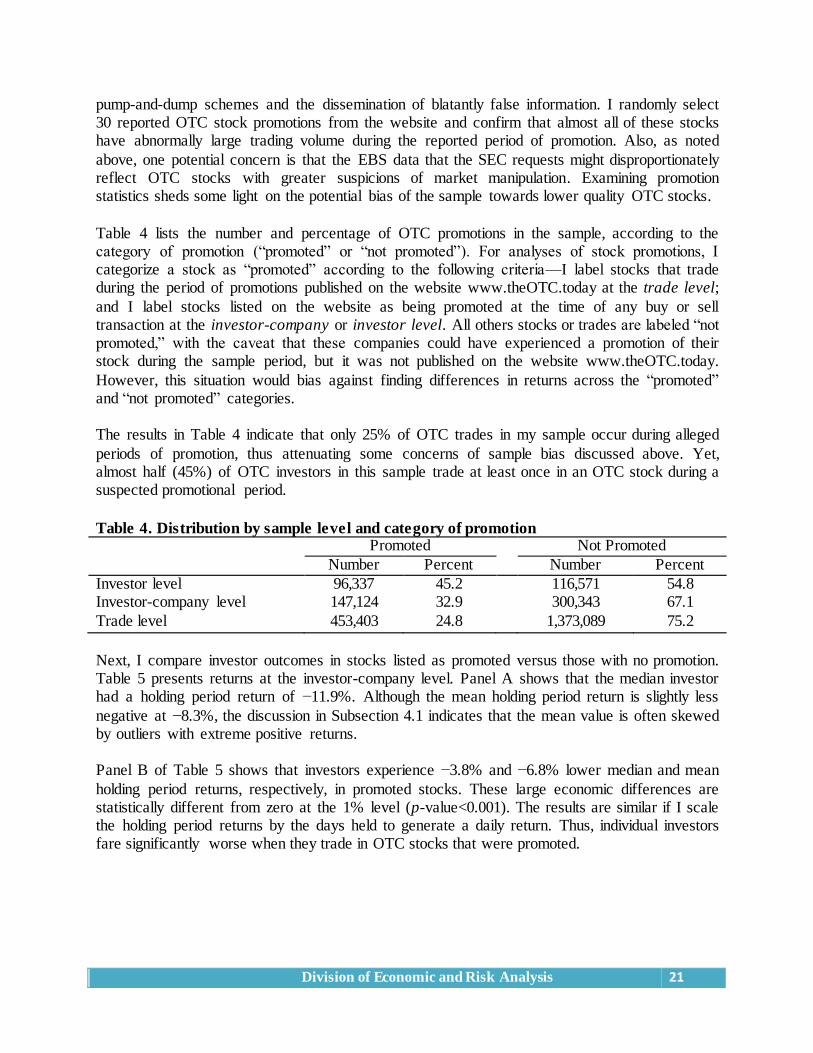
Table 4 lists the number and percentage of OTC promotions in the sample, according to the category of promotion (“promoted” or “not promoted”). For analyses of stock promotions, I categorize a stock as “promoted” according to the following criteria—I label stocks that trade during the period of promotions published on the website www.theOTC.today at the trade level;
and I label stocks listed on the website as being promoted at the time of any buy or sell transaction at the investor-company or investor level. All others stocks or trades are labeled “not promoted,” with the caveat that these companies could have experienced a promotion of their stock during the sample period, but it was not published on the website www.theOTC.today.
However, this situation would bias against finding differences in returns across the “promoted” and “not promoted” categories. The results in Table 4 indicate that only 25% of OTC trades in my sample occur during alleged
periods of promotion, thus attenuating some concerns of sample bias discussed above. Yet, almost half (45%) of OTC investors in this sample trade at least once in an OTC stock during a suspected promotional period.
Table 4. Distribution by sample level and category of promotion Promoted Not Promoted
Number Percent Number Percent
Investor level 96,337 45.2 116,571 54.8 Investor-company level 147,124 32.9 300,343 67.1
Trade level 453,403 24.8 1,373,089 75.2
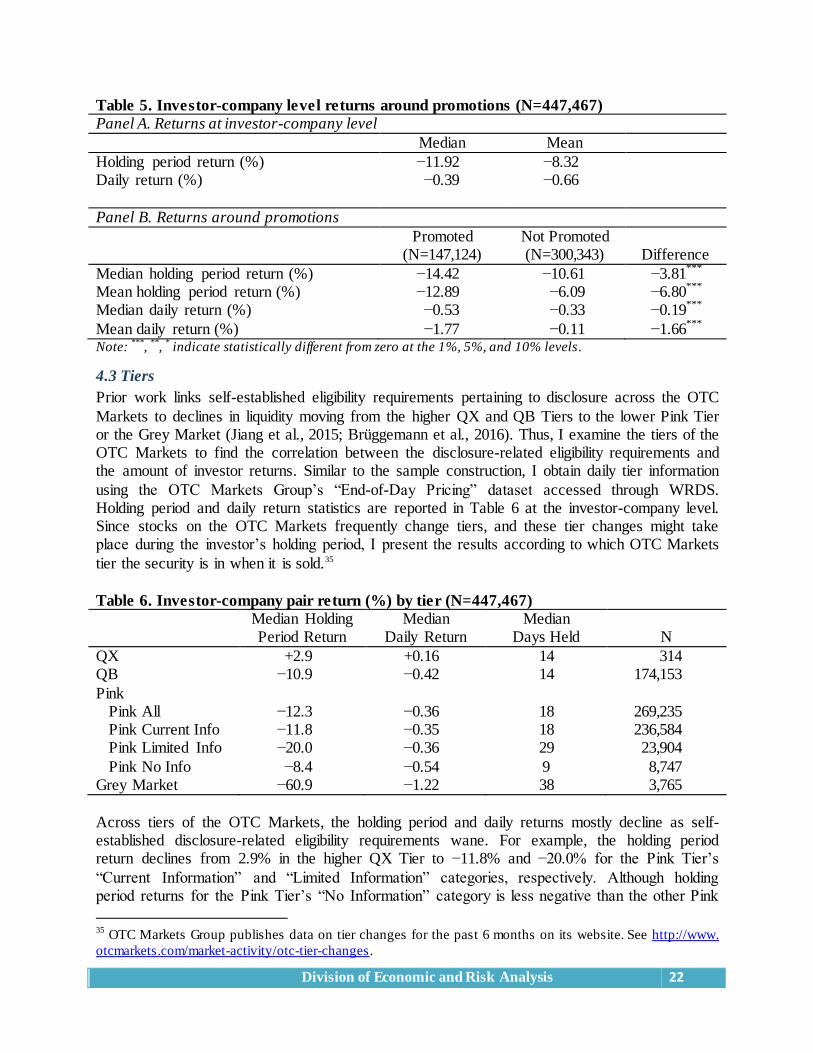
Next, I compare investor outcomes in stocks listed as promoted versus those with no promotion. Table 5 presents returns at the investor-company level. Panel A shows that the median investor had a holding period return of −11.9%. Although the mean holding period return is slightly less
negative at −8.3%, the discussion in Subsection 4.1 indicates that the mean value is often skewed by outliers with extreme positive returns. Panel B of Table 5 shows that investors experience −3.8% and −6.8% lower median and mean
holding period returns, respectively, in promoted stocks. These large economic differences are statistically different from zero at the 1% level (p-value<0.001). The results are similar if I scale the holding period returns by the days held to generate a daily return. Thus, individual investors fare significantly worse when they trade in OTC stocks that were promoted.
Division of Economic and Risk Analysis 22
Table 5. Investor-company level returns around promotions (N=447,467)
Panel A. Returns at investor-company level
Median Mean
Holding period return (%) −11.92 −8.32 Daily return (%) −0.39 −0.66
Panel B. Returns around promotions
Promoted
(N=147,124) Not Promoted (N=300,343) Difference
Median holding period return (%) −14.42 −10.61 −3.81***
Mean holding period return (%) −12.89 −6.09 −6.80
***
Median daily return (%) −0.53 −0.33 −0.19***
Mean daily return (%) −1.77 −0.11 −1.66***
Note:
***,
**,
* indicate statistically different from zero at the 1%, 5%, and 10% levels.
4.3 Tiers
Prior work links self-established eligibility requirements pertaining to disclosure across the OTC
Markets to declines in liquidity moving from the higher QX and QB Tiers to the lower Pink Tier or the Grey Market (Jiang et al., 2015; Brüggemann et al., 2016). Thus, I examine the tiers of the OTC Markets to find the correlation between the disclosure-related eligibility requirements and the amount of investor returns. Similar to the sample construction, I obtain daily tier information
using the OTC Markets Group’s “End-of-Day Pricing” dataset accessed through WRDS. Holding period and daily return statistics are reported in Table 6 at the investor-company level. Since stocks on the OTC Markets frequently change tiers, and these tier changes might take place during the investor’s holding period, I present the results according to which OTC Markets
tier the security is in when it is sold.35
Table 6. Investor-company pair return (%) by tier (N=447,467)
Median Holding Period Return
Median Daily Return
Median Days Held N
QX +2.9 +0.16 14 314 QB −10.9 −0.42 14 174,153
Pink Pink All −12.3 −0.36 18 269,235 Pink Current Info −11.8 −0.35 18 236,584 Pink Limited Info −20.0 −0.36 29 23,904
Pink No Info −8.4 −0.54 9 8,747 Grey Market −60.9 −1.22 38 3,765
Across tiers of the OTC Markets, the holding period and daily returns mostly decline as self-established disclosure-related eligibility requirements wane. For example, the holding period return declines from 2.9% in the higher QX Tier to −11.8% and −20.0% for the Pink Tier’s
“Current Information” and “Limited Information” categories, respectively. Although holding period returns for the Pink Tier’s “No Information” category is less negative than the other Pink
35
OTC Markets Group publishes data on tier changes for the past 6 months on its website. See http://www.
otcmarkets.com/market-activity/otc-tier-changes.
Division of Economic and Risk Analysis 23
Tiers, the daily return values are more negative for the Pink Tier’s “No Information” category, which indicates that investors tend to hold stocks in the higher Pink Tier categories for longer periods of time. The median investor in OTC stocks that eventually trade in the most illiquid and
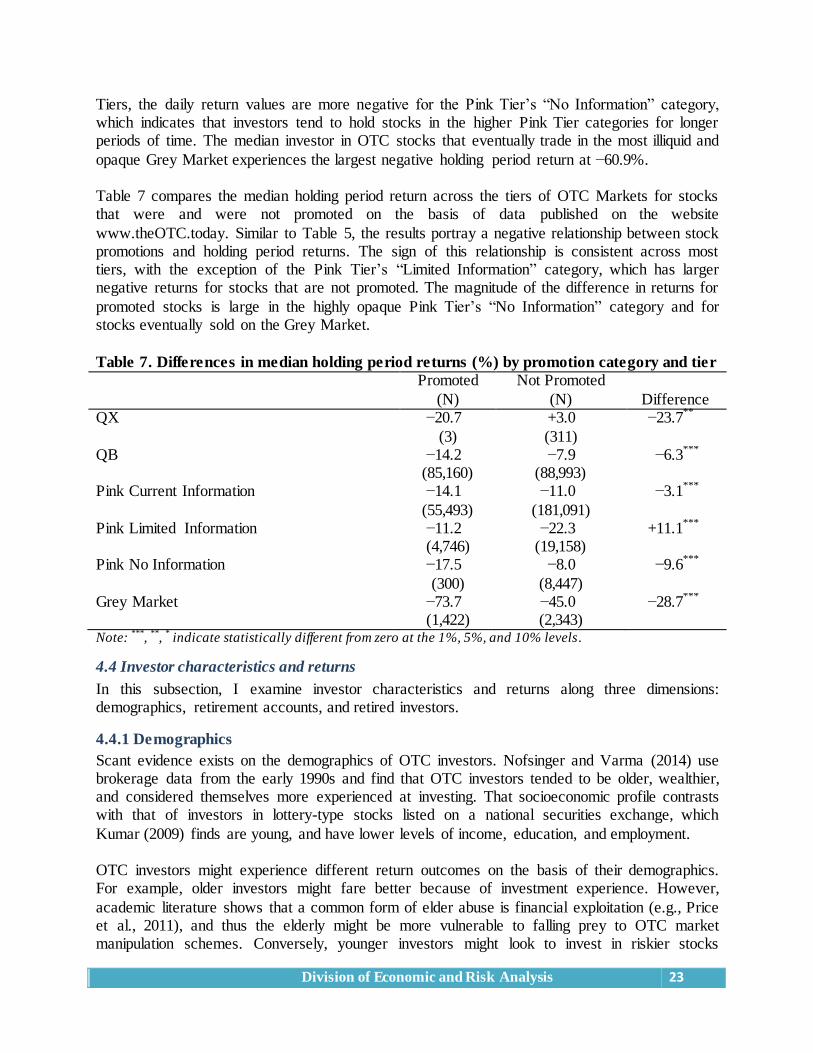
opaque Grey Market experiences the largest negative holding period return at −60.9%. Table 7 compares the median holding period return across the tiers of OTC Markets for stocks that were and were not promoted on the basis of data published on the website
www.theOTC.today. Similar to Table 5, the results portray a negative relationship between stock promotions and holding period returns. The sign of this relationship is consistent across most tiers, with the exception of the Pink Tier’s “Limited Information” category, which has larger negative returns for stocks that are not promoted. The magnitude of the difference in returns for
promoted stocks is large in the highly opaque Pink Tier’s “No Information” category and for stocks eventually sold on the Grey Market.
Table 7. Differences in median holding period returns (%) by promotion category and tier
Promoted
(N)
Not Promoted
(N) Difference QX −20.7 +3.0 −23.7
**
(3) (311) QB −14.2 −7.9 −6.3
***
(85,160) (88,993) Pink Current Information −14.1 −11.0 −3.1
***
(55,493) (181,091) Pink Limited Information −11.2 −22.3 +11.1
***
(4,746) (19,158) Pink No Information −17.5 −8.0 −9.6
***
(300) (8,447) Grey Market −73.7 −45.0 −28.7
***
(1,422) (2,343) Note:
***,
**,
* indicate statistically different from zero at the 1%, 5%, and 10% levels.
4.4 Investor characteristics and returns
In this subsection, I examine investor characteristics and returns along three dimensions: demographics, retirement accounts, and retired investors.
4.4.1 Demographics
Scant evidence exists on the demographics of OTC investors. Nofsinger and Varma (2014) use brokerage data from the early 1990s and find that OTC investors tended to be older, wealthier, and considered themselves more experienced at investing. That socioeconomic profile contrasts with that of investors in lottery-type stocks listed on a national securities exchange, which
Kumar (2009) finds are young, and have lower levels of income, education, and employment. OTC investors might experience different return outcomes on the basis of their demographics. For example, older investors might fare better because of investment experience. However,
academic literature shows that a common form of elder abuse is financial exploitation (e.g., Price et al., 2011), and thus the elderly might be more vulnerable to falling prey to OTC market manipulation schemes. Conversely, younger investors might look to invest in riskier stocks
Division of Economic and Risk Analysis 24
(Kumar, 2009). To the extent that poorer and less educated investors have less access to credible sources of information, they might also be more prone to investing in OTC stocks with less transparency or respond at a greater rate to manipulation schemes.
EBS data do not include investor-level demographic information, such as income, age, or education. Thus, I proxy for these investor characteristics by using zip-code-level variables provided by the U.S. Census Bureau. Specifically, I use the zip code associated with the address
of each account holder and match these to census data.36 Although census values do not reflect the actual demographic profile of the OTC investor, this proxy is common in academic literature. As discussed above, certain investors may be more prone to investing in OTC stocks. In addition
to age, education, income, and wealth, I also examine residence stability. The notion here is that a change in residence is likely correlated with employment transitions, which studies find are due to higher levels of unemployment (e.g., Crowder and South, 1997). Kumar (2009) finds a positive correlation between investing in risky exchange-listed stocks and unemployment levels.
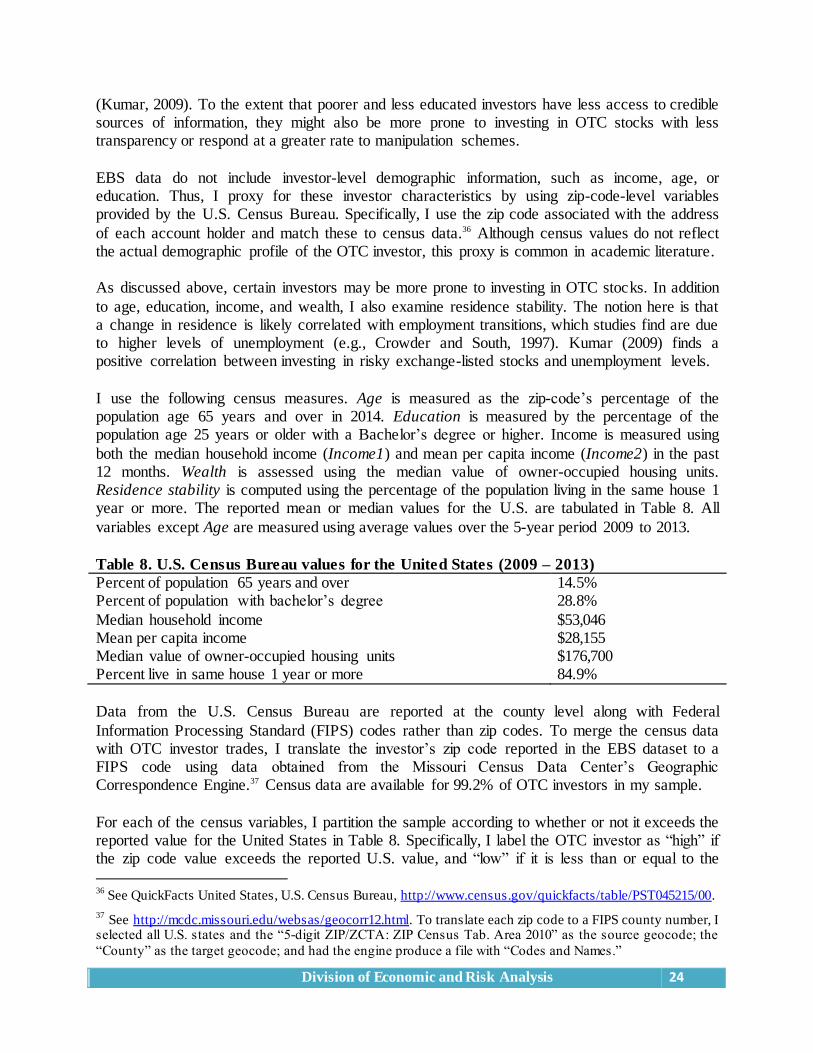
I use the following census measures. Age is measured as the zip-code’s percentage of the population age 65 years and over in 2014. Education is measured by the percentage of the population age 25 years or older with a Bachelor’s degree or higher. Income is measured using
both the median household income (Income1) and mean per capita income (Income2) in the past 12 months. Wealth is assessed using the median value of owner-occupied housing units. Residence stability is computed using the percentage of the population living in the same house 1 year or more. The reported mean or median values for the U.S. are tabulated in Table 8. All
variables except Age are measured using average values over the 5-year period 2009 to 2013.
Table 8. U.S. Census Bureau values for the United States (2009 – 2013)
Percent of population 65 years and over 14.5% Percent of population with bachelor’s degree 28.8%
Median household income $53,046 Mean per capita income $28,155 Median value of owner-occupied housing units $176,700 Percent live in same house 1 year or more 84.9%
Data from the U.S. Census Bureau are reported at the county level along with Federal
Information Processing Standard (FIPS) codes rather than zip codes. To merge the census data with OTC investor trades, I translate the investor’s zip code reported in the EBS dataset to a FIPS code using data obtained from the Missouri Census Data Center’s Geographic Correspondence Engine.37 Census data are available for 99.2% of OTC investors in my sample.
For each of the census variables, I partition the sample according to whether or not it exceeds the reported value for the United States in Table 8. Specifically, I label the OTC investor as “high” if the zip code value exceeds the reported U.S. value, and “low” if it is less than or equal to the
36
See QuickFacts United States, U.S. Census Bureau, http://www.census.gov/quickfacts/table/PST045215/00. 37
See http://mcdc.missouri.edu/websas/geocorr12.html. To translate each zip code to a FIPS county number, I selected all U.S. states and the “5-digit ZIP/ZCTA: ZIP Census Tab. Area 2010” as the source geocode; the
“County” as the target geocode; and had the engine produce a file with “Codes and Names.”
Division of Economic and Risk Analysis 25
U.S. value. For example, an investor is labeled “high” median household income if the zip code associated with that investor has a median household income greater than $53,046 in 2014.
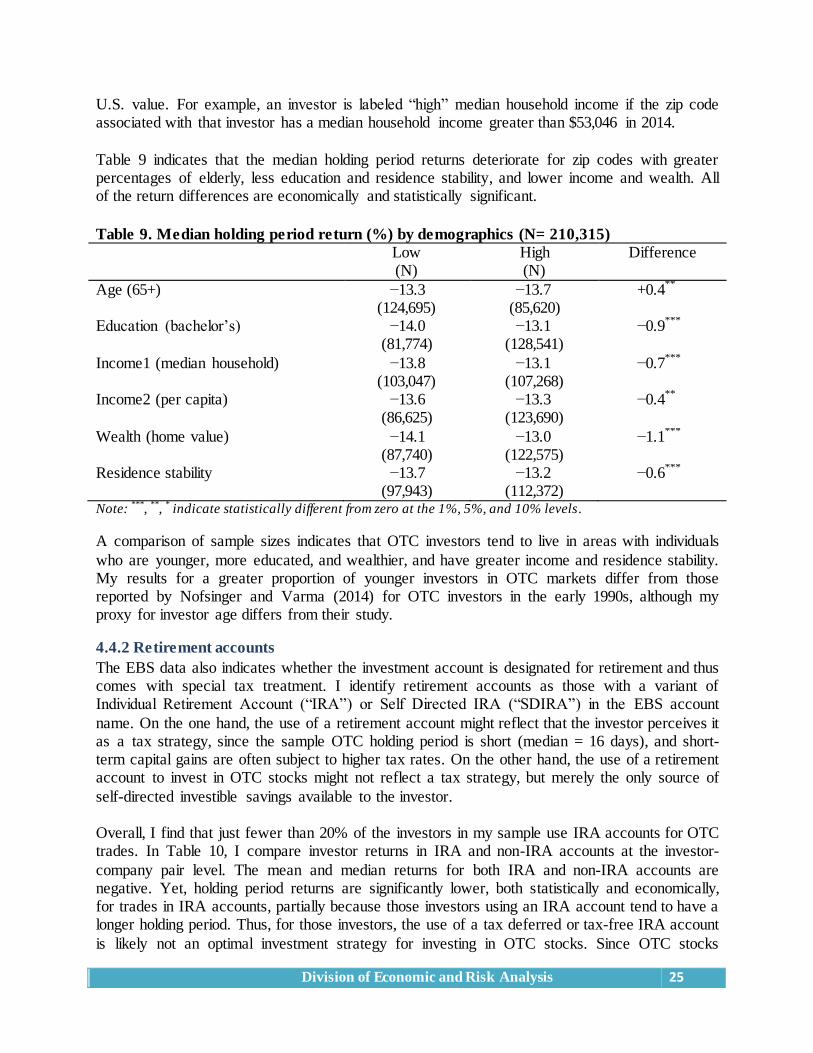
Table 9 indicates that the median holding period returns deteriorate for zip codes with greater percentages of elderly, less education and residence stability, and lower income and wealth. All of the return differences are economically and statistically significant.
Table 9. Median holding period return (%) by demographics (N= 210,315)
Low (N)
High (N)
Difference
Age (65+) −13.3 −13.7 +0.4**
(124,695) (85,620) Education (bachelor’s) −14.0 −13.1 −0.9
***
(81,774) (128,541)
Income1 (median household) −13.8 −13.1 −0.7***
(103,047) (107,268) Income2 (per capita) −13.6 −13.3 −0.4
**
(86,625) (123,690)
Wealth (home value) −14.1 −13.0 −1.1***
(87,740) (122,575) Residence stability −13.7 −13.2 −0.6
***
(97,943) (112,372) Note:
***,
**,
* indicate statistically different from zero at the 1%, 5%, and 10% levels.
A comparison of sample sizes indicates that OTC investors tend to live in areas with individuals
who are younger, more educated, and wealthier, and have greater income and residence stability. My results for a greater proportion of younger investors in OTC markets differ from those reported by Nofsinger and Varma (2014) for OTC investors in the early 1990s, although my proxy for investor age differs from their study.
4.4.2 Retirement accounts
The EBS data also indicates whether the investment account is designated for retirement and thus comes with special tax treatment. I identify retirement accounts as those with a variant of Individual Retirement Account (“IRA”) or Self Directed IRA (“SDIRA”) in the EBS account
name. On the one hand, the use of a retirement account might reflect that the investor perceives it as a tax strategy, since the sample OTC holding period is short (median = 16 days), and short-term capital gains are often subject to higher tax rates. On the other hand, the use of a retirement account to invest in OTC stocks might not reflect a tax strategy, but merely the only source of
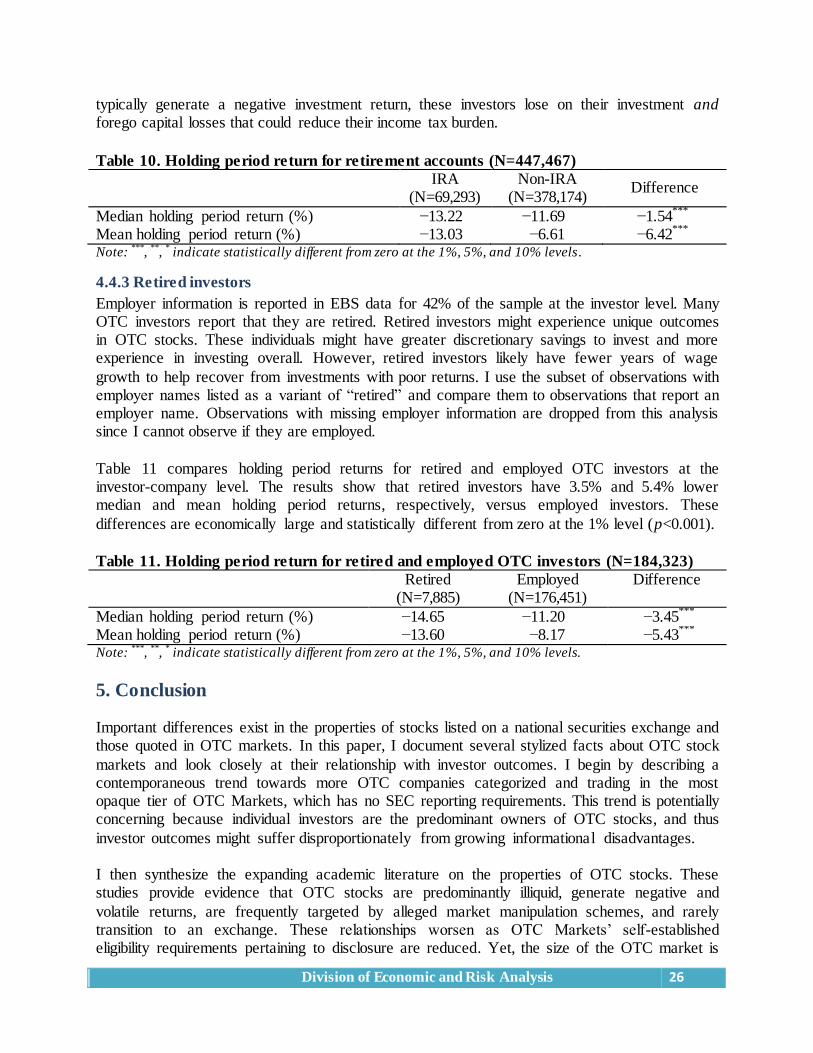
self-directed investible savings available to the investor. Overall, I find that just fewer than 20% of the investors in my sample use IRA accounts for OTC trades. In Table 10, I compare investor returns in IRA and non-IRA accounts at the investor-
company pair level. The mean and median returns for both IRA and non-IRA accounts are negative. Yet, holding period returns are significantly lower, both statistically and economically, for trades in IRA accounts, partially because those investors using an IRA account tend to have a longer holding period. Thus, for those investors, the use of a tax deferred or tax-free IRA account
is likely not an optimal investment strategy for investing in OTC stocks. Since OTC stocks
Division of Economic and Risk Analysis 26
typically generate a negative investment return, these investors lose on their investment and forego capital losses that could reduce their income tax burden.
Table 10. Holding period return for retirement accounts (N=447,467)
IRA
(N=69,293) Non-IRA
(N=378,174) Difference
Median holding period return (%) −13.22 −11.69 −1.54***
Mean holding period return (%) −13.03 −6.61 −6.42
*** Note:
***,
**,
* indicate statistically different from zero at the 1%, 5%, and 10% levels.
4.4.3 Retired investors
Employer information is reported in EBS data for 42% of the sample at the investor level. Many OTC investors report that they are retired. Retired investors might experience unique outcomes in OTC stocks. These individuals might have greater discretionary savings to invest and more experience in investing overall. However, retired investors likely have fewer years of wage
growth to help recover from investments with poor returns. I use the subset of observations with employer names listed as a variant of “retired” and compare them to observations that report an employer name. Observations with missing employer information are dropped from this analysis since I cannot observe if they are employed.
Table 11 compares holding period returns for retired and employed OTC investors at the investor-company level. The results show that retired investors have 3.5% and 5.4% lower median and mean holding period returns, respectively, versus employed investors. These
differences are economically large and statistically different from zero at the 1% level (p<0.001).
Table 11. Holding period return for retired and employed OTC investors (N=184,323)
Retired (N=7,885)
Employed (N=176,451)
Difference
Median holding period return (%) −14.65 −11.20 −3.45***
Mean holding period return (%) −13.60 −8.17 −5.43
***
Note: ***
, **
, * indicate statistically different from zero at the 1%, 5%, and 10% levels.
5. Conclusion Important differences exist in the properties of stocks listed on a national securities exchange and those quoted in OTC markets. In this paper, I document several stylized facts about OTC stock
markets and look closely at their relationship with investor outcomes. I begin by describing a contemporaneous trend towards more OTC companies categorized and trading in the most opaque tier of OTC Markets, which has no SEC reporting requirements. This trend is potentially concerning because individual investors are the predominant owners of OTC stocks, and thus
investor outcomes might suffer disproportionately from growing informational disadvantages. I then synthesize the expanding academic literature on the properties of OTC stocks. These studies provide evidence that OTC stocks are predominantly illiquid, generate negative and
volatile returns, are frequently targeted by alleged market manipulation schemes, and rarely transition to an exchange. These relationships worsen as OTC Markets’ self-established eligibility requirements pertaining to disclosure are reduced. Yet, the size of the OTC market is
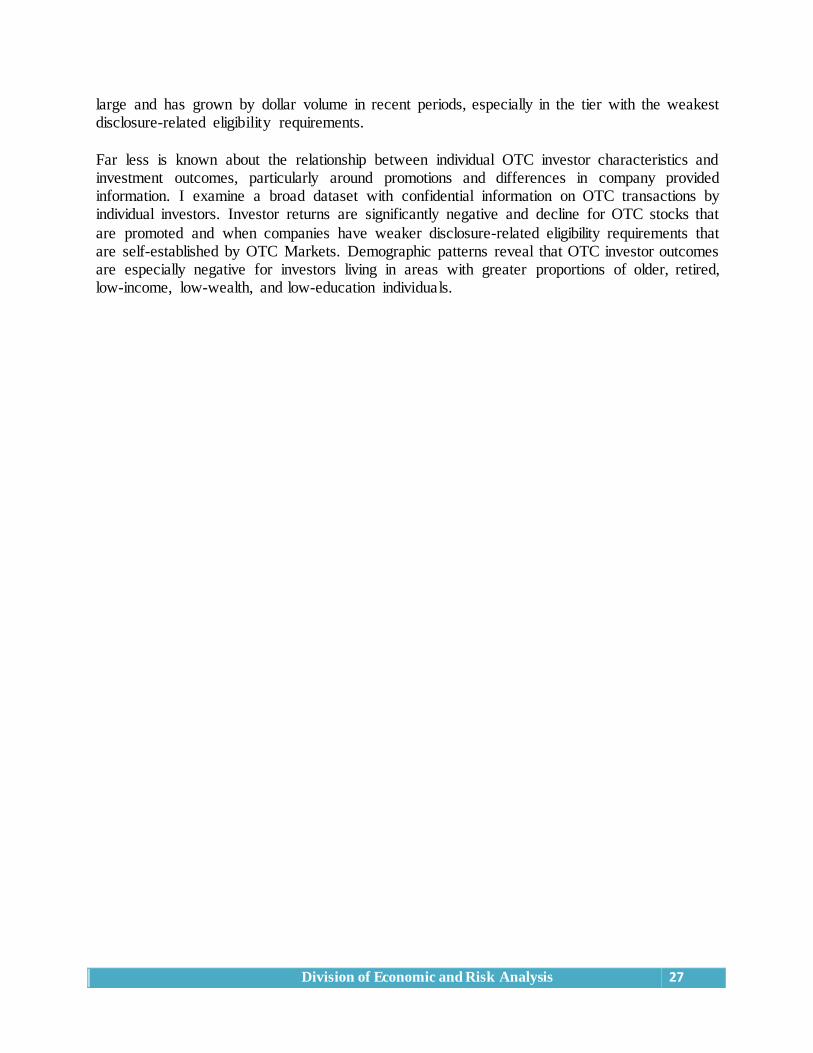
Division of Economic and Risk Analysis 27
large and has grown by dollar volume in recent periods, especially in the tier with the weakest disclosure-related eligibility requirements.
Far less is known about the relationship between individual OTC investor characteristics and investment outcomes, particularly around promotions and differences in company provided information. I examine a broad dataset with confidential information on OTC transactions by individual investors. Investor returns are significantly negative and decline for OTC stocks that
are promoted and when companies have weaker disclosure-related eligibility requirements that are self-established by OTC Markets. Demographic patterns reveal that OTC investor outcomes are especially negative for investors living in areas with greater proportions of older, retired, low-income, low-wealth, and low-education individuals.
Division of Economic and Risk Analysis 28
References Aggarwal, R., Wu, G., 2006. Stock market manipulations. Journal of Business 79, 1915–1953.
Aghion, P., Van Reenen, J., Zingales, L. 2013. Innovation and institutional ownership. American Economic Review 103, 277–304.
Allen, F., Gale, D., 1992. Stock-price manipulation. Review of Financial Studies 5, 503–529.
Ang, A., Shtauber, A., Tetlock, P., 2013. Asset pricing in the dark: The cross section of OTC stocks. Review of Financial Studies 26, 2985–3028.
Appel, I., Gormley, T., Keim, D., 2016. Passive investors, not passive owners. Journal of Financial Economics 121, 111–141.
Balakrishnan, K., Billings, M., Kelly, B., Ljungqvist, A., 2014. Shaping liquidity: On the causal effects of voluntary disclosure. Journal of Finance 69, 2237–2278.
Banz, R., 1981. The relationship between return and market value of common stocks. Journal of Financial Economics 9, 3–18.
Barber, B., Odean, T., 2000. Trading is hazardous to your wealth: The common stock investment performance of individual investors. Journal of Finance 55, 773–806.
Barber, B., Odean, T., 2008. All that glitters: The effect of attention and news on the buying behavior of individual and institutional investors. Review of Financial Studies 21, 785–818.
Benabou, R., Laroque, G., 1992. Using privileged information to manipulate markets: Insiders, gurus, and credibility. Quarterly Journal of Economics 107, 921–958.
Benston, G., Hagerman, R., 1974. Determinants of bid-ask spreads in the over-the-counter market. Journal of Financial Economics 1, 353–364.
Beyer, A., Cohen, D., Lys, T., Walther, B., 2010. The financial reporting environment: Review of the recent literature. Journal of Accounting and Economics 50, 296–343.
Böhme, R., Holz, T., 2006. The effect of stock spam on financial markets. Working Paper, University of Innsbruck.
Bollen, N., Christie, W., 2009. Market microstructure of the Pink Sheets. Journal of Banking and Finance 33, 1326–1339.
Boone, A., White, J., 2015. The effect of institutional ownership on firm transparency and information production. Journal of Financial Economics 117, 508–533.
Bouraoui, T., Mehanaoui, M., Bahli, B., 2013. Stock spams: Another kind of stock prices manipulation. Journal of Applied Business Research 29, 79–90.
Brüggemann, U., Kaul, A., Leuz, C., Werner, I., 2016. The twilight zone: OTC regulatory regimes and market quality. Working Paper, National Bureau of Economic Research.
Bushee, B., Leuz, C., 2005. Economic consequences of SEC disclosure regulation: Evidence from the OTC Bulletin Board. Journal of Accounting and Economics 39, 233–264.
Crane, A., Michenaud, S., Weston, J., 2016. The effect of institutional ownership on payout policy: Evidence from index thresholds. Review of Financial Studies, forthcoming.
Crowder, K., South, S., 1997. Residential mobility between cities and suburbs: Race, suburbanization, and back-to-the-city moves. Demography 34, 525–538.
Cumming, D., Dannhauser, R., Johan, S., 2015. Financial market misconduct and agency conflicts: A synthesis and future directions. Journal of Corporate Finance 34, 150–168.
Division of Economic and Risk Analysis 29
Cumming, D., Johan, S., 2013. Listing standards and fraud. Managerial and Decision Economics 34, 451–470.
Duffie, D., Gârleanu, N., Pedersen, L., 2005. Over-the-counter markets. Econometrica 73, 1815–1847.
Eraker, B., Ready, M., 2015. Do investors overpay for stocks with lottery-like payoffs? An examination of the returns of OTC stocks. Journal of Financial Economics 115, 486–504.
Frieder, L., Zittrain, J., 2007. Spam works: Evidence from stock touts and corresponding market activity. Working Paper, Purdue University.
Hanke, M., Hauser, F., 2008. On the effects of stock spam e-mails. Journal of Financial Markets 11, 57–83.
Harris, J., Panchapagesan, V., Werner, I., 2008. Off but not gone: A study of NASDAQ delistings. Working Paper, Ohio State University.
Healy, P., Palepu, K., 2001. Information asymmetry, corporate disclosure, and the capital
markets: A review of the empirical disclosure literature. Journal of Accounting and Economics 31, 405–440.
Hirshleifer, D., Teoh, S., 2003. Limited attention, information disclosure, and financial reporting. Journal of Accounting and Economics 36, 337–386.
Hong, H., Stein, J., 2003. Differences of opinion, short-sales constraints, and market crashes. Review of Financial Studies 16, 487–525.
Jain, A., Jain, C., 2016. Short selling in OTC stocks: Information or manipulation? Working Paper, Rochester Institute of Technology.
Jarrow, R., 1980. Heterogeneous expectations, restrictions on short sales, and equilibrium asset prices. Journal of Finance 35, 1105–1113.
Jiang, J., Petroni, K., Wang, I., 2015. Private intermediary innovation and market liquidity: Evidence from the Pink Sheets® market. Contemporary Accounting Research, forthcoming.
Karpoff, J., 1987. The relation between price changes and trading venue. A survey. Journal of Financial and Quantitative Analysis 22, 109–126.
Kumar, A., 2009. Who gambles in the stock market? Journal of Finance 64, 1889–1933.
Lampe, C., 1990. Penny Stock Reform Act of 1990: A costly solution to a serious problem. George Mason University Law Review 13, 779–801.
Leuz, C., Triantis, A., Wang, T., 2008. Why do firms go dark? Causes and economic consequences of voluntary SEC deregistrations. Journal of Accounting and Economics 45, 181–208.
Leuz, C., Verrecchia, R., 2000. The economic consequences of increased disclosure. Journal of Accounting Research 37, 91–124.
Litvak, K. 2009. Summary disclosure and the efficiency of the OTC market: Evidence from the recent Pink Sheets experiment. Working paper, Northwestern University School of Law.
Luft, C., Levine, L., Larson, S., 2001. Over the Counter Bulletin Board Exchange: Market structure, risk, and return. Journal of Alternative Investments 4, 33–42.
Luft, C., Levine, L., 2004. Over the Counter Bulletin Board Exchange: The impact of liquidity and size to return, volatility, and bid/ask spread. Journal of Alternative Investments 7, 95–106.
Division of Economic and Risk Analysis 30
Macey, J., O’Hara, M., Pompilio, D., 2008. Down and out in the stock market: The law and economics of the delisting process. Journal of Law and Economics 51, 683–713.
Massoud, N., Scholnick, B., Ullah, S., 2016. Does it help firms to secretly pay for stock promoters? Journal of Financial Stability 26, 45–61.
Miller, M., 1977. Risk, uncertainty, and divergence of opinion. Journal of Finance 64, 1889–1933.
Nelson, K., Price, R., Rountree, B., 2013. Are individual investors influenced by the optimism and credibility of stock spam recommendations? Journal of Business Finance and Accounting 40, 1155–1183.
Nofsinger, J., Varma, A., 2014. Pound wise and penny foolish? OTC stock investor behavior. Review of Behavioral Finance 6, 2–25.
Price, T., King, P., Dillard, R., Bulot, J., 2011. Elder financial exploitation: Implications for
future policy and research in elder mistreatment. Western Journal of Emergency Medicine 12, 354–356.
Sanger, G., Peterson, J., 1990. An empirical analysis of common stock delistings. Journal of Financial and Quantitative Analysis 25, 261–272.
Shefrin, H., Statman, M., 1985. The disposition to sell winners too early and ride losers too long: Theory and evidence. Journal of Finance 40, 777–790.
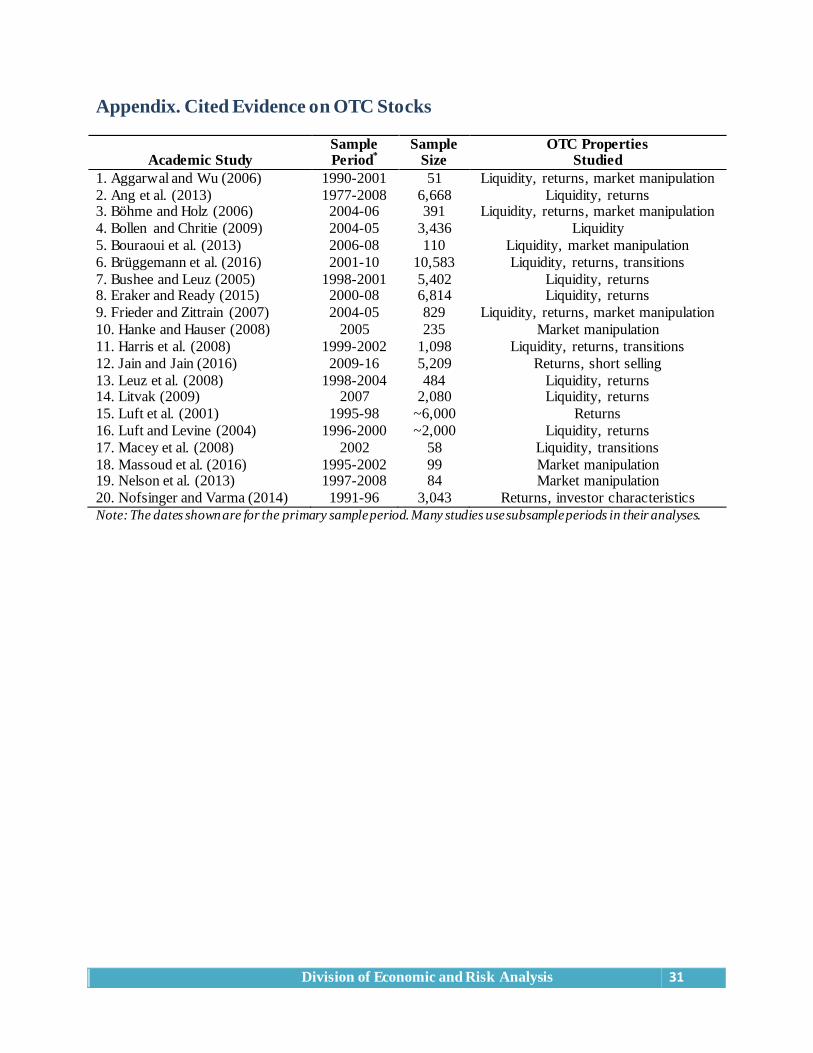
Division of Economic and Risk Analysis 31
Appendix. Cited Evidence on OTC Stocks
Academic Study Sample Period*
Sample Size
OTC Properties Studied
1. Aggarwal and Wu (2006) 1990-2001 51 Liquidity, returns, market manipulation
2. Ang et al. (2013) 1977-2008 6,668 Liquidity, returns 3. Böhme and Holz (2006) 2004-06 391 Liquidity, returns, market manipulation
4. Bollen and Chritie (2009) 2004-05 3,436 Liquidity
5. Bouraoui et al. (2013) 2006-08 110 Liquidity, market manipulation
6. Brüggemann et al. (2016) 2001-10 10,583 Liquidity, returns, transitions
7. Bushee and Leuz (2005) 1998-2001 5,402 Liquidity, returns 8. Eraker and Ready (2015) 2000-08 6,814 Liquidity, returns
9. Frieder and Zittrain (2007) 2004-05 829 Liquidity, returns, market manipulation
10. Hanke and Hauser (2008) 2005 235 Market manipulation
11. Harris et al. (2008) 1999-2002 1,098 Liquidity, returns, transitions
12. Jain and Jain (2016) 2009-16 5,209 Returns, short selling
13. Leuz et al. (2008) 1998-2004 484 Liquidity, returns 14. Litvak (2009) 2007 2,080 Liquidity, returns
15. Luft et al. (2001) 1995-98 ~6,000 Returns
16. Luft and Levine (2004) 1996-2000 ~2,000 Liquidity, returns
17. Macey et al. (2008) 2002 58 Liquidity, transitions
18. Massoud et al. (2016) 1995-2002 99 Market manipulation 19. Nelson et al. (2013) 1997-2008 84 Market manipulation
20. Nofsinger and Varma (2014) 1991-96 3,043 Returns, investor characteristics
Note: The dates shown are for the primary sample period. Many studies use subsample periods in their analyses.