Embed Size (px)
Citation preview
Outcome Indicators and Outcome Management
Harry P. Hatry Elaine Morley
Martin Abravanel Martha Marshall
Outcome Indicators and Outcome Management
Final Report
July 15, 2002
Prepared By:
Harry P. Hatry Elaine Morley
Martin Abravanel Martha Marshall
The Urban Institute
Washington, DC
Submitted To:
Corporation for National and Community Service
Contract No. GS-23F-8198H UI No. 07112-004-00
The Urban Institute is a nonprofit, nonpartisan policy research and educational organization that examines the social, economic, and governance problems facing
the nation. The views expresses are those of the authors and should not be attributed to the Urban Institute, its trustees, or its funders.
TABLE OF CONTENTS
Introduction Section 1 — Overall Recommendations on the Measurement, Reporting, and Use
of Annual Outcome Information Section 2 — Review of AmeriCorps Performance Indicators Section 3 — Review of Senior Corps Performance Indicators Section 4 — Outcome Indicators for Objective 1: Improving Lives of
Members/Volunteers Section 5 — Outcome Indicators for Objective 2: Strengthening Community
Organizations Hosting Members/Volunteers Section 6 — Outcome Indicators for Objective 3: Improving the Lives of
AmeriCorps End Beneficiaries Section 7 — Outcome Indicators for Objective 3: Improving the Lives of National
Senior Service Corps End Beneficiaries Section 8 — Review and Recommended Outcome Indicators for Learn and Serve
America
i
Introduction General Approach, Scope, and Limitations
The Corporation for National and Community Service asked us to examine the current outcome indicators in use, especially those associated with the Government Performance and Results Act (such as the annual performance plan and performance reports) and provide improvement recommendations. Thus, this effort focused on identifying outcomes, outcome indicators, and data sources that will enable the Corporation to track the outcomes of its programs, while at the same time using the outcome information to make the Corporation a results-oriented agency, one using outcome management. This will enable the Corporation, and all its partners to do better budgeting, planning, and ongoing resource allocation, and to use performance information to make improvements.
This effort had three major components:
1. Examination of indicators the Corporation currently reports to Congress for its major programs, particularly the February 4, 2003 “Fiscal 2003 Budget Estimate and Performance Plan.”
2. Identification of a set of outcome measures we recommend that the Corporation
consider adopting for each major Corporation program.
3. Detailed recommendations to improve the measurement and reporting of outcomes for purposes of annual outcome management.
We have attempted in this four-month effort to identify performance measurement steps
that should satisfy the legislative requirements of Congress and, at the same time, provide information that the Corporation, its major program offices, State offices, State Commissions, and individual grantees can use to make program/service improvements. (This, indeed, is one of the intents of GPRA, but the accountability purpose has received most emphasis thus far.)
We focused primarily on the major Corporation programs: AmeriCorps and its State and
National, Vista, and NCCC programs; Senior Service Corps and its RSVP, Senior Companions, and Foster Grandparent programs; and the Learn and Serve America program. While support services, such as program administration, training and technical assistance, evaluation and the National Service Trust are important activities, they primarily provide intermediate outcomes, and are generally of less direct interest to Congress and Executive Branch policy officials. Therefore, and because of our limited time and resources, we did not directly address these activities.
The recommendations we present address what the Corporation can do to better track the
outcomes of Corporation efforts on a regular basis (at least annually). Such regular tracking serves the purpose of accountability to the public for effective use of public funds, as well as
ii
providing key information to help improve the effectiveness of Corporation programs. Our work does not address other forms of indicators, such as efficiency and cost containment.
Methodology Our primary procedures involved reviewing a variety of documents (outlined below),
particularly documents reporting outcomes or related indicators (such as accomplishments), and conducting interviews with key Corporation personnel. We conducted in-person interviews with key personnel in the DC area for each major Corporation program and major sub-programs. We also conducted telephone interviews with high-level Corporation personnel at a small number of State Offices and Commissions. Resource and time limitations precluded conducting a large number of telephone interviews with state-level personnel or with personnel from community organizations participating in Corporation programs, although we were able to conduct a small number of brief interviews with personnel from the latter, as discussed below.
Following is a more detailed description of procedures used and interviews conducted.
In the course of our work we: • Reviewed mission/objective/goal statements in Corporation documents, such as its
strategic plan, annual performance plan, and program descriptions; • Conducted a detailed review of the performance indicators included in the
Corporation’s latest annual performance plans, annual performance reports, and strategic plans, particularly those reported in the “Fiscal 2003 Budget Estimate and Performance Plan.” This is the document that, as of the time we began our four-month work, contained the latest set of Corporation outcome indicators. Our assumption is that this is the outcome information that provides at least part of the basis for the establishment, and justification, of the Corporation’s budget request.
• Reviewed reports on evaluations of Corporation programs conducted by external
evaluators.
• Reviewed training and technical assistance material providing recommendations for outcome measurement and related data collection activities on the part of community based organizations and agencies (subgrantees) hosting Corporation members/volunteers.
• Reviewed data collection tools (such as client questionnaires) used by selected
subgrantees (identified by state office or state commission personnel as providing good examples of subgrantee outcome measurement).
• Developed semi-structured interview guides to use in conducting interviews with
Corporation personnel at the national and state level.
iii
• Held a group meeting with the Corporation’s GPRA Working Group.
• Conducted in-person interviews with key Corporation program personnel in the DC area for each major Corporation program and major sub-programs. We conducted five interview sessions with high-level personnel of AmeriCorps and its subprograms (VISTA, NCCC, and State and National), one interview session with high level personnel of Senior Corps, and one session with Learn and Serve. However, since most of our interviews involved two or more Corporation personnel, these seven sessions included 13 Corporation officials.
• Conducted four interviews with high-level Corporation personnel in the DC area that
cut across programs, including an interview with the Corporation’s CEO. • Conducted telephone interviews with high-level Corporation personnel at three of the
Corporation’s State Offices and at one State Commission.
• Conducted a telephone interview with personnel of a contractor that conducts studies and evaluations of Corporation programs, prepares accomplishment reports, and provides training and technical assistance to community organizations on performance measurement.
• Solicited, through Corporation officials, state-level recommendations as to local
programs believed to have made particularly good progress in outcome measurement. We received 31 suggestions, of which we were able to follow up briefly on six, as noted in later in the report.
• Conducted brief telephone interviews with personnel representing six subgrantee
organizations to obtain information about outcome indicators they report and their data collection practices, and to request copies of their data collection instruments.
We have attempted to use as a guideline in our recommendations that most of the information obtained from the Corporation’s outcome monitoring process should be established so as to be of value, not only to the Corporation’s executive office, but also to its State Field Offices, State Commission, and to grantees/sub-grantees that are providing the services. The information collected should be useful to each of these levels for policy and budgeting purposes, and for making program and service improvements.
We did not have the time nor resources to look for and examine outcome indicators, and associated data collection procedures, in use by individual grantees, such as those that might have been reported through the Corporation’s WBRS, in progress reports, or other sources. This step would likely have identified other useful outcome indicators and provided a precedent for the collection of such information by other grantees.
iv
Corporation Goals This report addresses what appear to be the three major Corporation outcome objectives:
1. Encouraging people to provide service to communities and enrich the lives of these members and volunteers.
2. Strengthening grantee (or subgrantee) organizations. 3. Improving the lives of the end beneficiaries that are the recipients of services provided by
the Corporation sponsored members and volunteers.
Our recommendations for outcome indicators are grouped under those objectives. Definitions Used in This Report Throughout this report we categorize indicators as to whether they represent outputs, “intermediate” outcomes, or “end’ outcomes. The following are the approximate definitions we have used:
• Output indicators. These are counts of the amount of service that the members or volunteers have completed. These do not provide information on benefits or other changes to the lives of beneficiaries of program services.
• Intermediate outcome indicators. These generally count the number of beneficiaries
for which some change in their lives has occurred, but the change is still short of being an important benefit to them.
• End outcome indicators. These generally count the number of beneficiaries for
which some important change in their lives has occurred that seems likely to be an important benefit for them.
We have labeled each indicator that we reviewed or recommend. However, assigning these categories is not a science. For some indicators, ambiguity and differences in opinion exist as to which category a particular indicator would fall into. Corporation programs use a complex variety of grants and sub-grantees. For simplicity, throughout this report we generally use the word “grantee” or even “project” or “program” to refer to an entity that is receiving Corporation funds to help it provide services. Corporation programs use both the words “members” and “volunteers” to refer to their participants. AmeriCorps appears to use the word members for its participants, who generally receive a living allowance or other support funds. The Senior Corps generally uses the term
v
volunteer, though Foster Grandparents and Senior Companions receive small stipends. We are not aware of official rules regarding the use of these terms. In this report, we have used both terms, depending on the circumstance. We also use the term “community volunteer” to refer to non-member volunteers recruited by members. Remainder of this Report
Section 1 presents our overall recommendations to the Corporation for outcome management, including suggestions on the measurement, reporting, and use of outcomes for annual monitoring purposes. Sections 2 and 3 present our assessments, respectively, of the performance indicators currently reported for AmeriCorps and Senior Corps programs, especially as reported in the Corporation’s “Fiscal 2003 Budget Estimate and Performance Plan.” .
Sections 4 and 5 present our recommendations for outcome indicators related to two major Corporation outcome objectives: improving the lives of members/volunteers (Section 4); and strengthening community organizations hosting members/volunteers (Section 5). These objectives are cross-cutting, and generally apply to all of the Corporation’s programs (AmeriCorps, Senior Corps, and Learn and Serve). However, particular indicators may not apply to all programs. In Sections 6, 7 and 8, we present recommendations for outcome indicators to help monitor progress in achieving the third major Corporation objective: improving the lives of end beneficiaries for, respectively, AmeriCorps (Section 6), Senior Service Corps (Section 7), and Learn and Serve (Section 8). The Learn and Serve section also includes our review of its current performance indicators as contained in the “Fiscal 2003 Budget Estimate and Performance Plan.”
Finally, we urge all readers to read the overall recommendations in Section 1, (which will facilitate understanding of the more detailed recommendations presented in the later sections and suggest ways to make outcome findings more useful) and Sections 4 and 5 (which suggest outcome indicators relevant to all the Corporation’s programs for two of the Corporation’s primary objectives.). In addition, readers primarily interested in the AmeriCorps programs should focus on Sections 2 and 6, those primarily interested in the Senior Corps programs should focus on Sections 3 and 7, and those primarily interested in the Learn and Serve program should focus on Section 8.
1-1
Section 1 Overall Recommendations
On the Measurement, Reporting, and Use of Annual Outcome Information
The recommendations presented in this section address what the Corporation can do to better
track the outcomes of the Corporation’s efforts, on a regular basis (at least annually), for the purposes of being accountable to the public for effective use of public monies and for improving the effectiveness of the Corporation’s programs. They do not cover efficiency, cost containment, or internal administrative indicators. Nor do we address the need for ad hoc, in-depth, program evaluations, another very important source of outcome information.
We note that the Corporation has not had sufficient resources nor, in the past, the motivation
to undertake a major effort at regular outcome monitoring. Clearly, unless this changes, the recommendations we provide below will not likely be very useful to the Corporation.
The information contained in such documents as the “Fiscal 2003 Budget Estimate and
Performance Plan” appears to make the most of existing outcome information. However, as will be described in Sections 2 and 3, the presence of current outcome data available on a regular basis to the Corporation is currently highly limited.
Recommendations are grouped into two categories: (a) those that involve major “technical”
issues; and (b) those that address what can be called “process” issues aimed at strengthening the Corporation’s outcome management process. The process recommendations are considerably more readily implemented than the technical recommendations. However, the technical elements are, of course, crucial for providing the basic information around which outcome management can be applied. Together, such recommendations as these provide the basis for Corporation continual learning and service improvement.
As a first step, the Corporation and its programs should review their outcome indicators to
make them considerably more outcome/results-oriented. We have identified a number of candidates in Sections 4-8 for which annual outcome data might be sought. These suggested outcome indicators can be used as a starting point for each program’s review. As discussed in these sections, and below, considerable work will be needed to implement some of these indicators. Corporation program staff will undoubtedly be able to make many practical improvements to the indicators we have identified.
The services provided by the Corporation’s support are enormously varied and often
provided in small portions so that the effects on end beneficiaries will be quite hard to detect (even by special studies). We have used our judgment in singling out specific services for which the effects are likely to be at least roughly measurable.

1-2
At the end of each recommendation we comment on the likely: (a) added monetary cost and effort to the Corporation (i.e., large, medium, little, or none), including state field offices and State Commissions, of implementing the recommendations; and (b) payoff in improved information and, subsequently, better outcomes for the Corporation’s beneficiaries. Such estimates are rough, usually depending on a number of uncertainties.
Major Technical Recommendations
1. Develop guidelines, with substantial input from grantees, that define the minimum amount of service (e.g., hours) that volunteers or members need to apply to an activity for an outcome (or output) to be counted. For example, to count a home as rehabilitated by the efforts of a member or volunteer, is it sufficient that members or volunteers spend, say, only one or two hours working on the home to be included as a product? This step is complicated by the fact that these minimum levels are likely to differ somewhat among the many services provided by grantees. Note that for many services the minimum amount of service would refer to the collective efforts of members or volunteers, such as for indicators of numbers of houses rehabilitated. (Medium cost/effort; provides more valid data.)
2. Specify a minimum amount of work time that is needed to include an individual in the count of the number of members or volunteers (for the Corporation’s objective of enriching lives of members/volunteers). For example, should a volunteer who spent only a total of one day working on a Corporation project be included in the count of volunteers? (Low cost; provides more valid data.)
3. Ask grantees to provide outcome data not only in the aggregate but also broken out by key characteristics of the served population—characteristics that a local organization and/or the Corporation is likely to believe helps point to actions that should be taken to produce improvements. For example, breakouts by sex, age group, race/ethnicity, and/or income category of a project’s beneficiaries could help pinpoint where problems in unsuccessful outcomes lie.
Where possible, the Corporation should seek characteristics of the served population that distinguishes among different degrees of difficulty-to-help (such as for tutoring and mentoring projects, the extent to which the youth who are served had severe problem histories). If the outcomes for various levels of difficulty are broken out, this will yield fairer and more informed comparisons.
Such breakout information is likely to be very useful at all levels in identifying problem areas and success stories.
1-3
(Medium cost/effort; provides a major increase in the amount of useful information on outcomes.)
4. Consider an approach in which the Corporation identifies those service activities for which Corporation members and volunteers provide a substantial amount of resources and the service is one in which an identifiable client is directly served. Then develop, with substantial input from the field, a short, core set of outcome measurements on which local projects providing these services are asked to provide data.
It appears, based on our limited examination, that the following services would be good initial candidates for establishing a core set of widely-applicable outcome indicators: • Mentoring programs • Tutoring programs • Senior companion programs • Foster grandparents programs We suspect that other such services exist and recommend that the Corporation, in conjunction with its state offices and State Commissions, work to identify others. Each of the above services appears to have major common outcome objectives, regardless of where provided in the United States or which Corporation program provides the service. In addition, for each of these particular services, procedures appear to exist for obtaining data. A number of practical options as to outcome indicators and data collection procedures are likely to be available for each of the above services. Sources include procedures used in past Corporation evaluation studies and data collection instruments provided by Project Star. These materials can be very useful as starting points for developing core performance indicators for particular services. In the exhibits to Sections 6 and 7, we provide examples to illustrate this. In addition, since many of the Corporation’s services are parallel to those of other government agencies, outcome measurement procedures used by other federal or local government agencies, such as the Departments of Education and Health and Human Services, may also be applicable. Inevitably, grantees will disagree over choices of core performance indicators, including the particular instruments to be used to collect the data. To alleviate this problem, and make the Corporation's final data requests more acceptable to grantees, we urge the Corporation to select the core performance indicators and data collection procedures only after using a cooperative procedure such as establishing working groups that include substantial representation from representatives of the grantees providing the service as well as state organizations and experts. The working group should include grantees that have had experience in outcome measurement for the particular service. It could best be
1-4
done during a one or two-week retreat dedicated to developing core performance indicators, data collection instruments, and procedures. The working group’s product should then be reviewed by other interested parties before finalizing the indicators. The Corporation should sponsor pilot testing of the instrumentation and procedures developed by the working groups in each service area. This pilot testing is needed to identify the inevitable problems that should be corrected before the procedures are promulgated across all grantees. A second option is for the Corporation, after core outcomes indicators have been established, to let local programs use their own data collection instruments if the instruments are accepted by, say, a panel of experts who agree that the instruments provide approximately the same information on the core outcome indicators. Whichever of these options is used, the process should enable grantees to add other data elements to their data collection. The required core outcome information should be short, both to enable local programs to seek additional information and to reduce grantee data collection burden. To make this effort more acceptable and more useful to grantees, grantees should be encouraged to add questions to the data collection instruments tailored to the grantees’ own service. For most services, a customer feedback instrument is likely to be appropriate for use on a regular basis by grantees, probably administered to all the clients in that program (though programs with very large numbers of clients may need to sample their clients). Feedback may be obtained from the customers themselves or a family member, such as parents of clients in youth programs and teachers in programs involving student learning. To obtain outcome information for some services, data from other agencies may be needed, such as school grades for youth tutoring programs. Such procedures involve other complications that would need to be worked out. The work needed does not stop there. The Corporation would need to sponsor the preparation of concise, readable, users’ manuals and development of software to ease grantee data collection, data entry, and report preparation. The Corporation should offer training and technical assistance to grantees who request it. These steps will help assure reasonable comparability among grantees in their data collection and reporting. The written guidelines and software should provide for local tailoring to make the information obtained more interesting and useful to the local programs. Data entry will likely be one of the major limitations and burdens for local programs. A form of digital scanning equipment, which we understand can be reasonably inexpensive, should be considered for use by these projects and funded by the Corporation. It is likely to be a worthwhile investment, encouraging local data collection and, then, use of outcome information. If data entry can be web-based, tabulations and report generation done centrally (such as
1-5
at the national and/or state level) would greatly ease the work of the individual programs. The American Red Cross is in the process of developing such a process using a standard set of questionnaires that each of its local chapters are to complete, such as for its “Health, Safety and Community Services” programs. (See “Guide for Conducting Service Quality and Effectiveness Surveys: Indicators of Chapter Performance and Potential,” American Red Cross, Falls Church, VA, May 2002.) Another way to ease the transition to this process is to phase implementation across grantees. Some grantees might be excused from early implementation, such as those that are very small or that otherwise provide evidence of their inability to move forward with the data collection effort even with technical assistance. (Considerable cost/effort; would provide major improvement in information on key outcomes.)
5. Ask grantees to administer a customer feedback questionnaire that contains a core set of basic questions from which performance indicators can be obtained — for all services that provide direct service to individual customers. Questionnaire administration would likely be best done at, or a short time after, the work was completed for each particular customer.
The previous recommendation would provide the Corporation with outcome data on selected individual programs. As a very crude estimate, such procedures would cover programs that require perhaps 40 percent to 50 percent of the Corporation’s grant funds. To cover many of the other services, the option presented here is for the Corporation to develop standardized instrumentation that would obtain customer feedback data from all grantees’ programs that directly serve individual customers, regardless of the service. Customers would be asked a small set of basic questions such as about the degree of helpfulness of the service they received, whether their own condition had improved since receiving the help, and the extent to which they feel that the help contributed to the improvement. Some questions would likely need to be tailored somewhat to the specific service the members/volunteers provided. Grantees, especially those without previous experience in conducting customer surveys, would likely need training and technical assistance. As in the previous recommendation, the Corporation would likely also need to provide written guidance materials and software to ease the burden of data collection, data entry, and report preparation. To make this effort more acceptable and more useful to grantees, grantees should be encouraged to include additional questions in the questionnaire tailored to their own service. The written guidelines and software should provide for such local tailoring. If data entry by projects can be web-based, the option of tabulations and report
1-6
generation being done centrally, such as at the national and/or state level, could greatly ease the work of the individual projects. We suggest that those projects with capability be encouraged to do their own tabulations and reports, even if also done later by the state or national Corporation offices. An option is for the Corporation itself to fund a national survey of a representative sample of customers. As some of the Corporation’s contractors have found out when doing more in-depth studies, however, drawing representative samples presents difficulties that would need to be overcome. For either option, a number of problems would need to be worked out, including obtaining survey approval from OMB. (Medium cost; provides considerably more, though limited, aggregate outcome data.)
6. Tabulate the number and percent of grantees/projects that had achieved or exceeded its outcome targets during the reporting period. This option is a “fall back,” “last resort,” or at least a temporary approach while the Corporation seeks to implement common core outcome indicators for at least selected major services. This is a much simpler option for aggregating data across grantees. The findings could be aggregated and reported by state and by type of project.
This procedure can readily be accomplished. It can be an option if enough local programs are obtaining and reporting meaningful outcome information. Nevertheless, the outcome information provided here has quite limited value. The aggregations not only combine apples and oranges, but also introduce another variable, whether the targets set by the local program were easy or hard to meet. (Low cost; provides added aggregated, but highly limited, outcome information.)
Major Outcome Management Process Recommendations
7. Categorize and group indicators by major Corporation objectives, such as whether the indicators assess: (a) benefits to Corporation members and volunteers; (b) the effects on sustainability of local community organizations; or (c) benefits to citizens assisted by the services. This will help users more quickly gain perspective as to what is being measured and avoid confusion over the intent of the indicator.
(Negligible cost; provides more clarity in reporting outcome information.)
8. Within each of the above categories, categorize indicators as to whether they are inputs,
outputs, intermediate outcomes, or end (higher levels of importance) outcomes.
1-7
This will also help users obtain a better perspective as to what is being measured. The current set of indicator tables in the “Fiscal 2003 Budget Estimate and Performance Plan” is something of a hodge-podge, making it unnecessarily difficult for readers to sort out the various indicators. Indicators of the “number of clients served” are a special case. Some persons categorize these as outputs; other people think of them as intermediate outcomes. Most such indicators say nothing about whether the service provided any real help to the clients served. However, these numbers seem likely to be important for public officials, including some members of Congress. We, thus, suggest that reports, both internal and external, continue to provide such information, particularly if the Corporation provides guidelines as to the minimum amounts of service required for such service to be included in the count. See recommendation #1, above, for more discussion. (Negligible cost; provides more clarity in reporting outcome information.)
9. Include customer satisfaction indicators as “performance indicators.” For example,
currently the “Fiscal 2003 Budget Estimate and Performance Plan” puts these categories of indicators into two separate tables. It is legitimate and common practice to consider customer satisfaction as outcome indicators. For most service indicators, customer/beneficiary satisfaction indicators are better considered as intermediate, not end, outcomes.
(Negligible cost; provides more clarity in reporting outcome information.)
10. Consider the age of the data from Corporation program evaluations to include in GPRA
performance plans and reports. It is, of course, appropriate to include findings from program evaluations in performance reports, such as the “Fiscal 2003 Budget Estimate and Performance Plan” and annual performance reports. However, the Corporation should be confident that it can make a strong case that the findings reported are still relevant. A problem is that many of the evaluation findings reported in the “Fiscal 2003 Budget Estimate and Performance Plan” are from reports dated 1999 or earlier. The Plan properly shows the dates of the respective evaluation reports, but readers may not pay attention to the dates.
Somewhat old program evaluation material can be useful, even though it pertains to previous years. However, for the purposes of regular, annual outcome monitoring and reporting, such as for GPRA, if findings are more than a year or so old they may be of limited use for identifying trends or current progress. The Corporation has had very limited resources to do program evaluations. For any particular program, the Corporation normally undertakes in-depth evaluations only once every several years, so the data may not be timely or valid for new annual performance plans or reports. Older program
1-8
evaluation findings can be useful in assessing the basic program design, but outcomes are also affected by the quality of implementation.
(Negligible cost; provides more clarity in reporting outcome information.)
11. Extract from the Corporation’s accomplishments reports and grantee progress reports those indicators that can be considered outcomes, and report them as such. While most of what the Corporation calls “accomplishments indicators” are better labeled outputs, some appear to fall into the category of outcome indicators (such as the “number of homes repaired, rehabilitated, or constructed”). These can be included in outcome reports the Corporation prepares and disseminates. Our suggestions as to accomplishment indicators (at least variations of them) that can also be considered as outcomes are included in the later sections of this report.
Our rationale for inclusion of “accomplishments” is briefly provided in those sections. In general, we have included accomplishments indicators where the product was completed and delivered to customers, and the mere fact that the product was delivered seems very likely to provide an immediate value to recipients. This applies to such services as providing food, shelter, and immunizations.
Corporation officials should undertake their own review to determine which accomplishments indicators should be reported as outcomes. (Negligible cost; provides more clarity in reporting outcome information.)
12. Strengthen the language in the grant application guidelines to ask more explicitly that applicants identify specific performance indicators that the organization expects to use to track outcomes. For example, the wording in the National Senior Service Corps Grants Application form of 4/19/01 calls for grantees to identify “the longer term and permanent change or improvement expected in the community due to the service activities” (Part III — Section C. Workplan for Impact-Based Activities), but does not explicitly require grantees to identify the outcome indicators that they plan to use.
Asking grantees/subgrantees to identify specific performance indicators will increase the likelihood that the organization is on the right track, will better enables the Corporation to review the application, and should encourage more specific thinking by local organizations as to what measurements is needed to be undertaken. (Negligible cost; would lead to more substantive outcome measurement by grantees and thus better outcome information.)
1-9
13. Ask grantees to set annual target values for each outcome indicator. This will enable both local organizations and the Corporation to better assess subsequent progress. For outcome indicators new to a grantee/subgrantee, the grantee may need to hold off providing targets until it has gained some experience with the data.
Whether in their proposals or annual renewal requests, grantees (and sub-grantees) should be asked to set targets for each of their outcome indicators. These might be annual targets or, if the projects are asked to report more frequently to a state office, targets for each such reporting period.
Setting targets is a desirable management tool for all levels — project, state, and national levels. State offices and the national office, as well as projects, will want to compare actual performance to targets. The state and national offices will likely want to use such comparisons to help them make decisions as to needed actions, including future funding decisions. However, target setting is something of an art, especially for outcome indicators, and is subject to “gaming.” Nevertheless, the target-setting process and comparing actual results to targets are likely to be useful. Upper-level Corporation offices, however, should, at the very least, include a “hold harmless” period of a year or two for any new outcome indicators used by a project. Another major Corporation use of grantee/subgrantee target information is as a major basis for its own aggregate estimates of future outcomes for its various budget justification and GPRA reports. The Corporation should not later use grantee performance shortfalls as a club with which to batter local organizations. Rather, sustained, substantial shortfalls should be the trigger for a search for explanations for the shortfall and consideration of any needed technical assistance and training. The Corporation’s focus should be on encouraging improvement. (Low cost; would provide added useful outcome information.)
14. Ask grantees, as part of their reporting process, to explain any substantial differences between the actual achievement and the target set by local organizations for any outcome indicators. Providing grantees the explicit opportunity to provide explanatory information, and not only numbers, is likely to somewhat reduce grantee fear of misuse of its data. This process can also provide a considerably better perspective on progress to State offices and Commissions and to the Corporation’s national office.
(Negligible cost; would provide considerably more useful outcome information.)
15. Continue to include in the Corporation’s outcome reports key findings from evaluations
completed in recent fiscal years that represent reasonable current data; however, place
1-10
more emphasis in the future on evaluations of what happened to customers who were provided with assistance. The focus on customers should not consist primarily of feedback from persons in organizations that provide assistance or services (as had been the case in a number of past evaluations). Information from customers themselves will provide more valid, credible outcome information with respect to the Corporation’s objective relating to ultimate beneficiaries. However, to obtain feedback on the Corporation’s objectives of improving organizational sustainability and providing benefits to members/volunteers, organizations, members, and volunteers will need to be surveyed.
(Medium cost; provides improved evaluation outcome information.)
16. Retain reporting of “accomplishments” (including counts of times spent on various
services and estimates of the numbers of clients served), even though most of the indicators are measurements of outputs rather than outcomes. In our interviews with Corporation officials we heard that at least some members of Congress, and others, are impressed by the accomplishments reports. In any case, such counts should be useful to the individual projects and probably to the State Commissions and Corporation in keeping track of what grantees and sub-grantees are doing. However, the Corporation should label these indicators as outputs, and not outcomes.
The reporting burden on grantees should be periodically reviewed to assure that it is not excessive. We note, however, that keeping track of such numbers is probably part of good project management and should not be discouraged by the Corporation. (No added cost; retains basic service activity information.)
17. Limit the amount of performance-based grants at this time. However, it seems appropriate for the Corporation to move towards outcome “contracting” as grantees move to better outcome measurement. The Corporation would like to move toward performance “contracting/granting,” that is, including outcome targets in the grants, with various types of incentives relating to whether grantees meet, exceed, or fall short of the targets. A danger for the Corporation is that if the targets are set for outputs, this can push grantees to focus on quantity at the expense of quality, especially if monetary rewards are used. The current problem is the scarcity of outcome indicators, and sufficient experience with them, so as to provide a good and fair basis for performance grants.
The Corporation, as it moves into performance contracting, needs to be careful that this process does not become perceived by grantees as being unfair and threatening. The Corporation would need to be constructive and avoid taking penalizing actions for shortfalls, particularly short-term ones.
1-11
An attractive use of outcome data is to emphasize positive, rather than negative rewards. Non-monetary recognition awards might be made annually—both for high levels of outcomes and for making grantees that have made substantial improvements in outcomes from previous years. Whether or not performance grants are used, the Corporation should consider including past performance as one of the criteria in its assessments of grant applications. (Little near-future cost; would ultimately provide incentives for improved performance.)
18. Imbue the Corporation’s internal activities with a focus on results (e.g., outcomes), combined with regular outcome information reporting (such as quarterly). For example, the Corporation should consider an approach used by the State of Florida’s Department of Environmental Protection. The Corporation, after receiving grantees’ performance report, would ask the state commissions and its state offices to classify the performance of each grantee on each outcome indicator into three categories, such as:
• “good” (or “green light”) in which no further action is needed; • “watch” (or “yellow light”) in which the grantee is asked to provide interim reports to
enable the States and the Corporation to assess progress towards correcting the short falls; and
• “focus” (or “red light”) when the grantee’s outcomes are poor and the grantee is then asked to provide an action plan to correct the problems.
The categories might be red, yellow, or green lights, similar to the approach recently taken by OMB in the “Fiscal Year 2003 Budget of the U.S, Government.” (Negligible cost; high payoff in encouraging service improvements.)
19. Also consider encouraging use of a form of “How Are We Doing?” sessions after each performance report. The apparent success of the New York City Police Department and Parks and Recreations Department, and the City of Baltimore in moving toward such efforts (respectively labeled CompStat, ParkStat, and CitiStat) indicates that such an approach can be quite effective in motivating personnel to seek improvements.
In such sessions, a ranking Corporation official would discuss with program officials the latest reports to identify successes and problem areas. Reasons would be discussed, and an attempt made to determine any actions needed. The Corporation might encourage state offices (both State Commissions and Corporation state offices) to undertake such reviews. (A good description of these efforts is provided in “Using Performance Data for accountability: the New York City Police Department’s CompStat Model of Police Management,” Paul E. O’Connell, The PricewaterhouseCoopers Endowment for the Business of Government, August 2001.)
(Negligible cost; high payoff in encouraging service improvements, especially once a
1-12
reasonable amount of outcome data becomes regularly available.)
20. Place even more emphasis on building the capacity of local project organizations to
regularly assess the outcomes of their work. Much of the outcome information inevitably is likely to come from local programs.
Place considerable emphasis in training and technical assistance on help to these local organizations in how they can use outcome information to help them improve their services to their clients, as well as how to obtain outcome information. Undertaking outcome measurement should be in their self-interest, not just undertaken because of requests from funders. They should help them improve their ability to help their clients. (This, however, may be a hard sell.)
An example of this is effort being made by many local United Way organizations to
encourage agencies they fund to undertake outcome measurement. Local United Ways were, in turn, provided considerable training and some technical assistance by their national organization, United Way of America. UWA provided both outcome measurement manuals and training packages.
(Moderate cost; considerable long-term payoff in quality of the outcome data for both grantees and the Corporation.)
21. Collect more detailed data that permit comparisons against a variety of “benchmarks.” Have the outcome data received by the state and national offices examined in a number of ways, depending on the particular data available. Here are some options:
• Comparisons to outcomes for prior time periods, including analysis of trends; • Comparisons to outcome targets;
• Comparisons among the various demographic group breakouts;
• Comparisons of outcomes among, and within, individual states;
• Comparisons of outcomes for various types and amounts of volunteer/member
activity;
• Comparisons of outcomes by various categories of volunteers/members, such as by sex, age, race/ethnicity, etc.;
1-13
• Comparisons of outcomes among various types of nonprofit organizations, perhaps using Form 990 data, such as by size or funding sources and NTEE-CC taxonomy category and whether faith-based;
• Comparisons among grantees providing similar services for similar customers.
The analysis should also consider any explanatory information provided by projects — as suggested earlier in #14. Such information should add considerably to the understandability and usefulness of outcome information. (Modest cost; high payoff in the understanding and usefulness of the outcome data.)
22. Use the comparative data to:
• Develop benchmarks; • Help identify “Best Practices,” including helping to identify successful program
design characteristics (by identifying those grantees with unusually good performance); and
• Provide the basis for national and State level recognition award programs for high
performers. Awards could be provided for each major service. They probably should be provided for both level of performance and for improvement in performance.
(Modest cost; high payoff in the usefulness of the outcome data.)
23. Encourage grantees to use their outcome measurement process to experiment with
revised or new approaches to service delivery. For example, innovative project managers could, at least in some circumstances, apply new procedure to every other client, adding a code to the client record as to which service approach was used. The outcomes for each service approach would then be compared to provide evidence as to which approach produced better outcomes.
(Negligible cost; high yield in improved service delivery approaches where experiments are undertaken.)
1-14
24. Introduce data quality assessments on a regular basis. As outcome information becomes more available and more used, the stakes will be raised, and the temptation towards playing games with the numbers will increase. The Corporation can take such steps as: • Asking state offices and encouraging State Commissions, as they perform their
regular site visits, to check grantees’ data collection procedures and quality control process.
• Asking the Inspector General’s Office to review annually a sample of key outcome
indicators, examining a random sample of grantees and their data collection procedures — to obtain regular feedback on the quality of outcome information.
• Forming standing audit teams that periodically review grantee data. • Reviewing grantees that evince problems with data quality more frequently than
those with better histories. • Checking for missing data, and ask the grantee to complete or to take steps to reduce
the amount of future missing data • Indicating in the grant applications form that grantee/sub-grantee managers will be
asked to attest to the accuracy of the data—and identify the sanctions/penalties if significant data quality problems are found doing field inspections.
(Medium cost; considerable improvement in data quality and the data’s credibility.)
Implementation Time Table It is premature to lay out a specific time table. However, here are some observations:
• Most, if not all, of the “Major Outcome Management Process Options,” can be readily implemented without much out-of-pocket cost and could be done quickly, say, within a few months. However, the recommendation for continued and more intensive capacity building in outcome measurement and outcome management would need to be continued indefinitely.
• Implementing the “Major Technical Options” is another matter. Recommendations 1-3
and 6 could probably be done at least roughly over the next six months. The other recommendations are likely to require one to three years, if not more, to fully implement properly. These options are also likely to require Corporation expenditures to administer the working groups and other input likely to be required, as well as the development of written guidelines and software.

1-15
2-1
Section 2
Review of AmeriCorps Performance Indicators This section reviews the performance indicators reported by the Corporation in its
“Fiscal 2003 Budget Estimate and Performance Plan” submitted to Congress for its three AmeriCorps programs: AmeriCorps State and National, AmeriCorps VISTA, and AmeriCorps NCCC (National Civilian Community Corps).1 We first describe the format of the indicators in the “Fiscal 2003 Budget Estimate and Performance Plan.” In general, the Corporation has done a good job of providing the information it had, making use of data available from a variety of sources. However, in terms of annual outcome data, a number of important limitations exist.
First, the presentation can be improved. The indicators are not grouped in a way that enables easy review. Within each program’s section, separate tables are used to present performance indicators drawn from different sources. In addition, the indicators in these tables are not grouped by Corporation objective nor by category of indicator (such as intermediate or end outcome). Another limitation is that the indicators presented are not all drawn from the same time period, and the dates for the data provided are not always supplied. In some cases the date of the source of the data, such as an evaluation report, is supplied, but not the time period for the data. These reporting practices result in a presentation that is confusing for the reader to follow. Finally, and most importantly, as the Corporation and its evaluation office recognizes (and is seeking to correct), the coverage of recent outcomes relating to the Corporation’s objectives is quite limited.
The following three types of indicator tables are used for all three AmeriCorps programs (though the titles of the tables vary somewhat by program):
• “Performance Indicators” for the respective program for a specified time periods (such as
1998-2002, or 1999-2003). These tables provide annual performance data on each indicator for three prior years and goals for those indicators for two future years (some tables use program years and others use calendar years). The indicators in these tables are based on data compiled from various Corporation data sources, such as the National Service Trust Database, VISTA Management System, or the NCCC Project Database. Indicators in these tables generally address member performance.
• Indicators drawn from “independent program evaluation studies.” These tables present
selected indicators from various evaluation reports. The information presented is not always quantitative, and the reports and the data on which they are based may be several
1 VISTA is included in the Fiscal 2003 Budget Estimate and Performance Plan for Activities Authorized by the Domestic and Volunteer Service Act, State and National and NCCC are in the Fiscal 2003 Budget Estimate and Performance Plan for Activities Authorized by the National and Community Service Act.
2-2
years older than the time period of the Budget Estimate and Performance Plan. This information is included to provide outcomes associated with particular types of programs, particularly if service provision methods have not changed substantially over time.
• AmeriCorps State and National has a third table presenting selected data from its most
recent Accomplishment Review. The NCCC and VISTA sections did not include data from accomplishment reports. Indicators in the Accomplishment Review are based on annual reports provided by State and National grantees and sub-grantees to Aguirre International, which prepares Accomplishment reports. These data may include output indicators and outcome indicators.
Indicators from Performance Indicators Tables
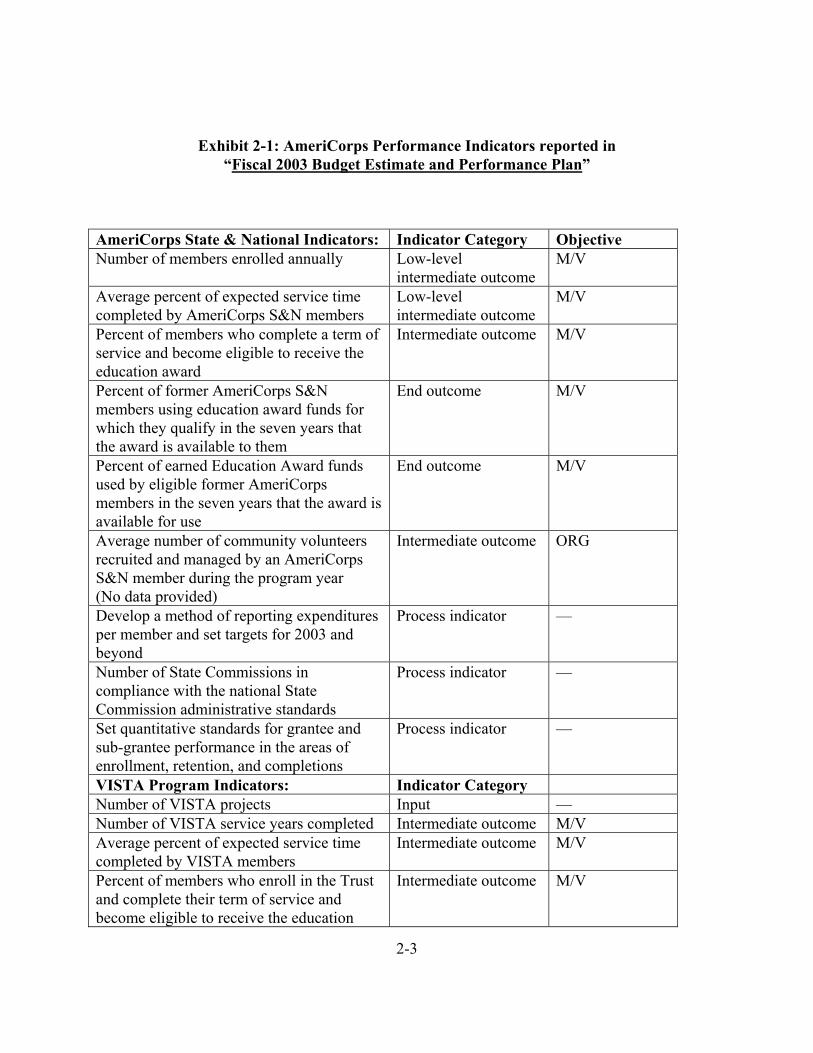
Exhibit 2-1, below, presents indicators for the three AmeriCorps programs drawn from the respective performance indicator tables in “Fiscal 2003 Budget Estimate and Performance Plan.”2 The majority of these indicators (all but seven) also are reported in the “Fiscal 2001 Performance and Accountability Report to Congress.”
The indicators in Exhibit 2-1 are grouped by program. Indicators are listed in the first column. Column two identifies the category of indicator we feel each indicator represents (such as end outcome, intermediate outcome, output, and so forth). The third column identifies the Corporation objective addressed by the indicator, using the following symbols:
• M/V = member/volunteer objective • ORG = organizational strengthening or capacity building • BEN = end beneficiary – the direct service recipient, which may include the
community in which the service was provided. As can be seen in Exhibit 2-1, several indicators related to member objectives are the
same, or are worded in very similar terms, for two or even all three AmeriCorps programs.
2 Corporation for National and Community Service (2002), Fiscal 2003 Budget Estimate and Performance Plan: Activities Authorized by the National and Community Service Act, Submission to Congress February 4, 2002: Table 5-3, p. 71 and Table 5-4, p. 72 (NCCC) and Table 2-6, pp. 36-37and Table 2-7, p. 37 (State and National); and Corporation for National and Community Service (2002), Fiscal 2003 Budget Estimate and Performance Plan: Activities Authorized by the Domestic and Volunteer Service Act, Submission to Congress February 4, 2002: Table 1-3, pp. 37-38; Table 1-4, and p. 38 (VISTA).
2-3
Exhibit 2-1: AmeriCorps Performance Indicators reported in
“Fiscal 2003 Budget Estimate and Performance Plan” AmeriCorps State & National Indicators: Indicator Category Objective Number of members enrolled annually Low-level
intermediate outcome M/V
Average percent of expected service time completed by AmeriCorps S&N members
Low-level intermediate outcome
M/V
Percent of members who complete a term of service and become eligible to receive the education award
Intermediate outcome M/V
Percent of former AmeriCorps S&N members using education award funds for which they qualify in the seven years that the award is available to them
End outcome M/V
Percent of earned Education Award funds used by eligible former AmeriCorps members in the seven years that the award is available for use
End outcome M/V
Average number of community volunteers recruited and managed by an AmeriCorps S&N member during the program year (No data provided)
Intermediate outcome ORG
Develop a method of reporting expenditures per member and set targets for 2003 and beyond
Process indicator —
Number of State Commissions in compliance with the national State Commission administrative standards
Process indicator —
Set quantitative standards for grantee and sub-grantee performance in the areas of enrollment, retention, and completions
Process indicator —
VISTA Program Indicators: Indicator Category Number of VISTA projects Input — Number of VISTA service years completed Intermediate outcome M/V Average percent of expected service time completed by VISTA members
Intermediate outcome M/V
Percent of members who enroll in the Trust and complete their term of service and become eligible to receive the education
Intermediate outcome M/V
2-4
award Number of VISTA projects focused on children’s literacy
Input —
Number of VISTA service years completed in projects where the focus of activity is children’s literacy
Input? Explanatory?
Number of VISTA projects focused on welfare-to-work challenges
Input? Explanatory?
Number of VISTA projects focused on technology issues
Input? Explanatory?
NCCC Program Indicators Indicator Category Objective Number of members enrolled Intermediate outcome M/V Average percent of expected service time completed by NCCC members
Intermediate outcome M/V
Percent of members who complete a one-year term of service and become eligible to receive the education award
Intermediate outcome M/V
Average number of community volunteers recruited and managed by an AmeriCorps NCCC member during the program year (Data only provided for 2000)
Intermediate outcome ORG
Percent of NCCC members red-card certified to provide fire-fighting support to U.S. Forest Service and Park Service
Intermediate outcome BEN
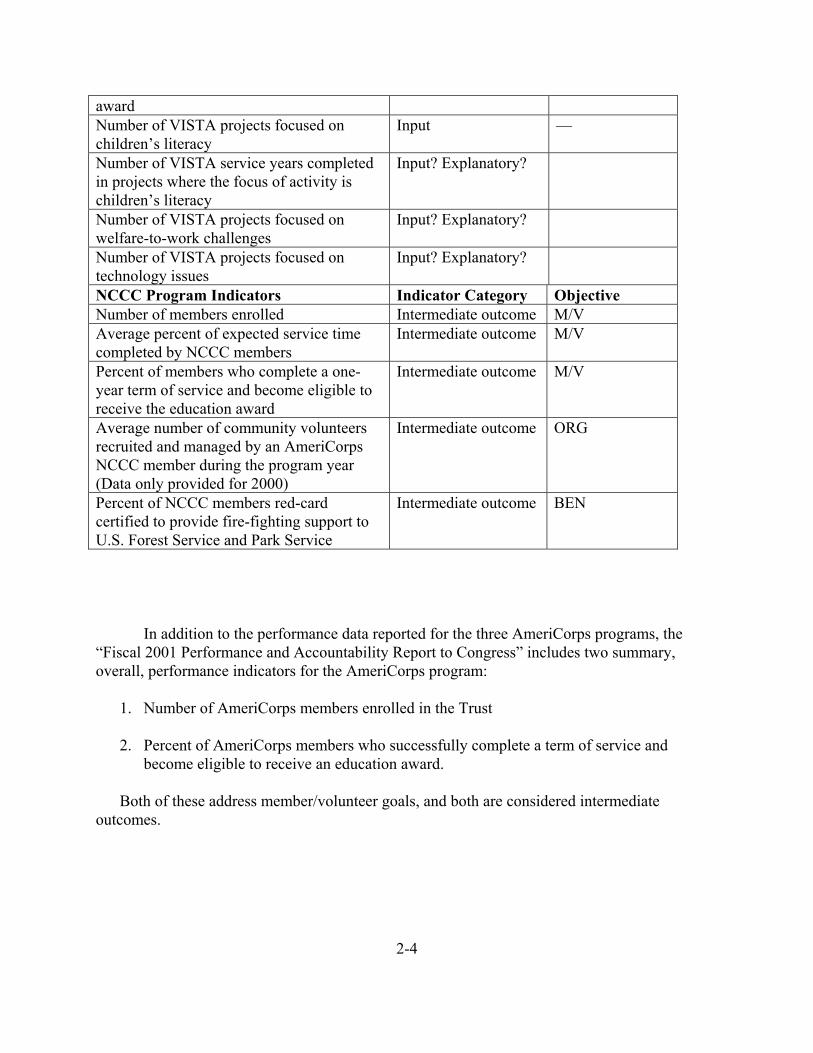
In addition to the performance data reported for the three AmeriCorps programs, the “Fiscal 2001 Performance and Accountability Report to Congress” includes two summary, overall, performance indicators for the AmeriCorps program:
1. Number of AmeriCorps members enrolled in the Trust 2. Percent of AmeriCorps members who successfully complete a term of service and
become eligible to receive an education award.
Both of these address member/volunteer goals, and both are considered intermediate outcomes.
2-5
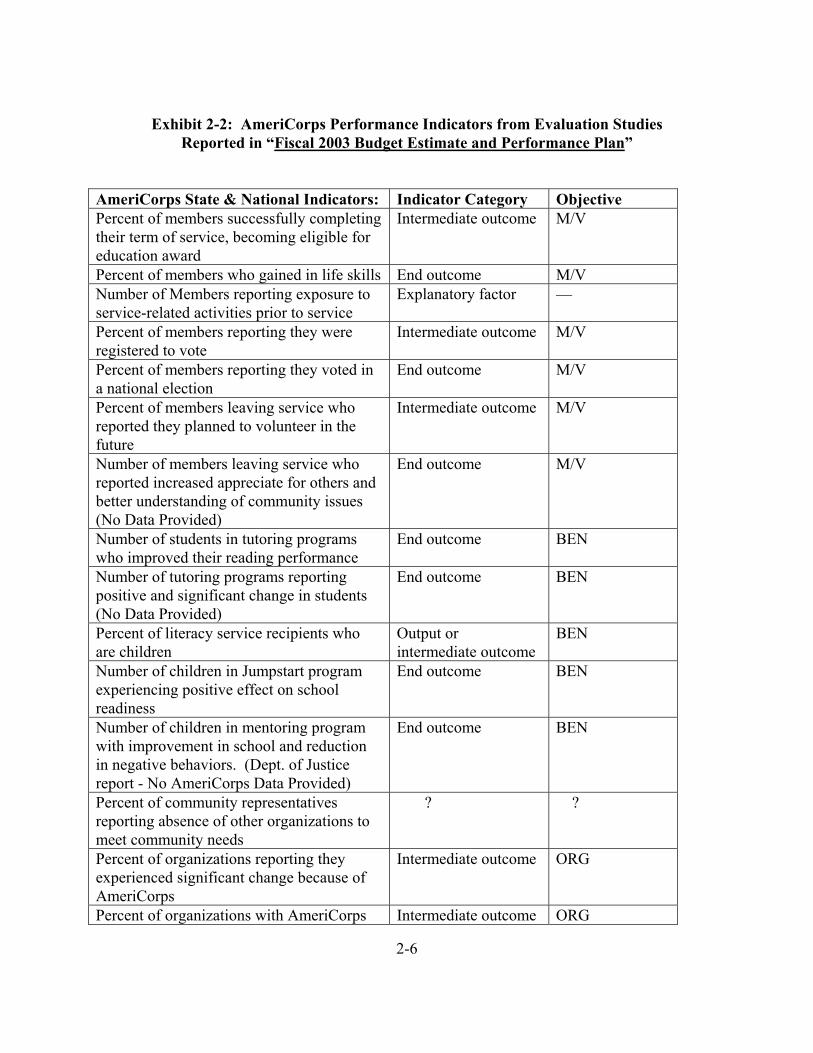
Indicators drawn from independent evaluations
The Corporation reports selected outcome findings drawn from independent program evaluation studies in its “Fiscal Year 2003 Budget Estimate and Performance Plan” for each of the AmeriCorps programs. These indicators are drawn from a variety of program evaluations, most of which appear to be ad hoc, one-time evaluations. In some cases the evaluations are based on data that are several years older than the time period covered by the Budget Estimate and Performance Plan.
The information is often presented in the form of qualitative, summary descriptions of
evaluation findings rather than actual indicators and related data. For example, one entry reads “AmeriCorps tutoring programs report positive and significant change for the students who receive tutoring.” The Budget Estimate and Performance Plan did not generally include the specific data on which the summary findings are based.
Although the tables presenting evaluation findings refer to them as “end outcomes” (for AmeriCorps State and National) or “performance outcomes” (for VISTA and NCCC), not all of the indicators qualify as outcomes. Exhibit 2-2 presents indicators for the three AmeriCorps programs drawn from the respective evaluation studies tables in the “Fiscal 2003 Budget Estimate and Performance Plan” volumes.3
Exhibit 2-2 follows the same format as Exhibit 2-1, that is: indicators are grouped by
program, and the indicator category and Corporation objective addressed by the indicator are identified in columns two and three. Exhibit 2-2 includes only those indicators that we feel qualify as outcomes (intermediate or end). In most cases we have modified the wording originally presented (which often consisted of several sentences) to express the findings as indicators.
3 Corporation for National and Community Service (2002), Fiscal 2003 Budget Estimate and Performance Plan: Activities Authorized by the National and Community Service Act, Submission to Congress February 4, 2002: Table 2-5, pp. 33-35 (State and National) and Tables 5-2, p. 70 and 5-3, p. 71 (NCCC); and Corporation for National and Community Service (2002), Fiscal 2003 Budget Estimate and Performance Plan: Activities Authorized by the Domestic and Volunteer Service Act, Submission to Congress February 4, 2002: Table 1-2 pp. 35-36 (VISTA).
2-6
Exhibit 2-2: AmeriCorps Performance Indicators from Evaluation Studies
Reported in “Fiscal 2003 Budget Estimate and Performance Plan” AmeriCorps State & National Indicators: Indicator Category Objective Percent of members successfully completing their term of service, becoming eligible for education award
Intermediate outcome M/V
Percent of members who gained in life skills End outcome M/V Number of Members reporting exposure to service-related activities prior to service
Explanatory factor —
Percent of members reporting they were registered to vote
Intermediate outcome M/V
Percent of members reporting they voted in a national election
End outcome M/V
Percent of members leaving service who reported they planned to volunteer in the future
Intermediate outcome M/V
Number of members leaving service who reported increased appreciate for others and better understanding of community issues (No Data Provided)
End outcome M/V
Number of students in tutoring programs who improved their reading performance
End outcome BEN
Number of tutoring programs reporting positive and significant change in students (No Data Provided)
End outcome BEN
Percent of literacy service recipients who are children
Output or intermediate outcome
BEN
Number of children in Jumpstart program experiencing positive effect on school readiness
End outcome BEN
Number of children in mentoring program with improvement in school and reduction in negative behaviors. (Dept. of Justice report - No AmeriCorps Data Provided)
End outcome BEN
Percent of community representatives reporting absence of other organizations to meet community needs
? ?
Percent of organizations reporting they experienced significant change because of AmeriCorps
Intermediate outcome ORG
Percent of organizations with AmeriCorps Intermediate outcome ORG
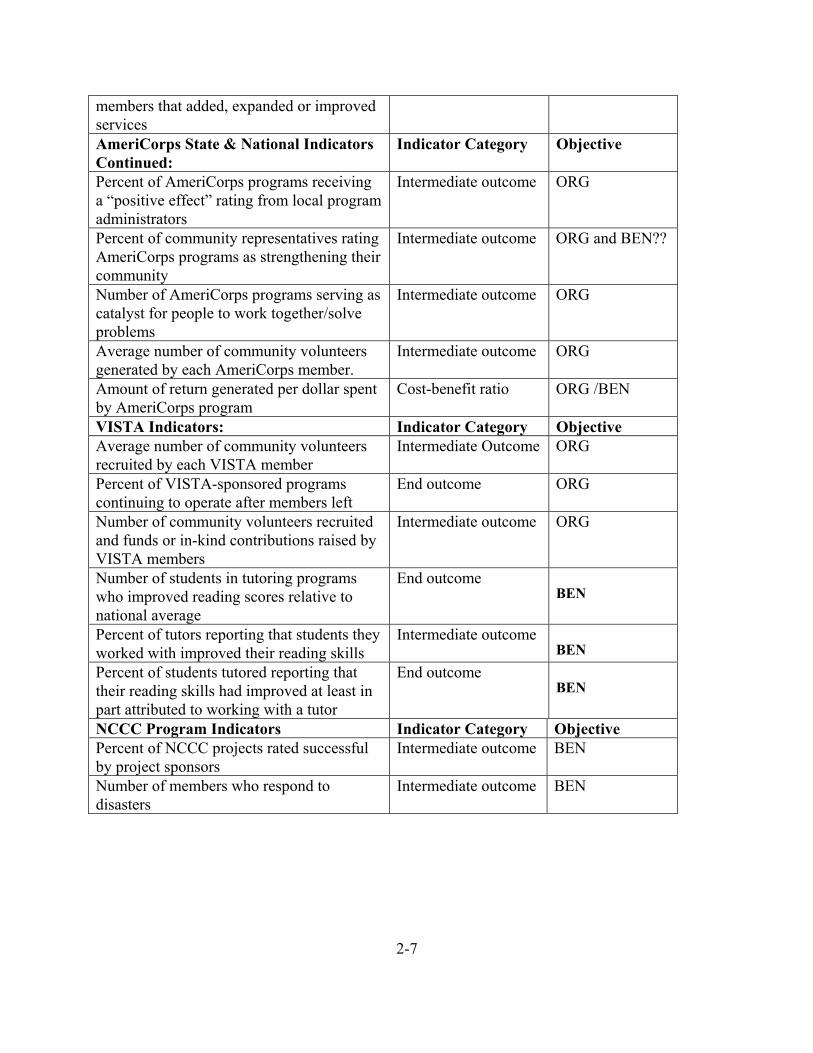
2-7
members that added, expanded or improved services AmeriCorps State & National Indicators Continued:
Indicator Category Objective
Percent of AmeriCorps programs receiving a “positive effect” rating from local program administrators
Intermediate outcome ORG
Percent of community representatives rating AmeriCorps programs as strengthening their community
Intermediate outcome ORG and BEN??
Number of AmeriCorps programs serving as catalyst for people to work together/solve problems
Intermediate outcome ORG
Average number of community volunteers generated by each AmeriCorps member.
Intermediate outcome ORG
Amount of return generated per dollar spent by AmeriCorps program
Cost-benefit ratio ORG /BEN
VISTA Indicators: Indicator Category Objective Average number of community volunteers recruited by each VISTA member
Intermediate Outcome ORG
Percent of VISTA-sponsored programs continuing to operate after members left
End outcome ORG
Number of community volunteers recruited and funds or in-kind contributions raised by VISTA members
Intermediate outcome ORG
Number of students in tutoring programs who improved reading scores relative to national average
End outcome BEN
Percent of tutors reporting that students they worked with improved their reading skills
Intermediate outcome BEN
Percent of students tutored reporting that their reading skills had improved at least in part attributed to working with a tutor
End outcome BEN
NCCC Program Indicators Indicator Category Objective Percent of NCCC projects rated successful by project sponsors
Intermediate outcome BEN
Number of members who respond to disasters
Intermediate outcome BEN
2-8
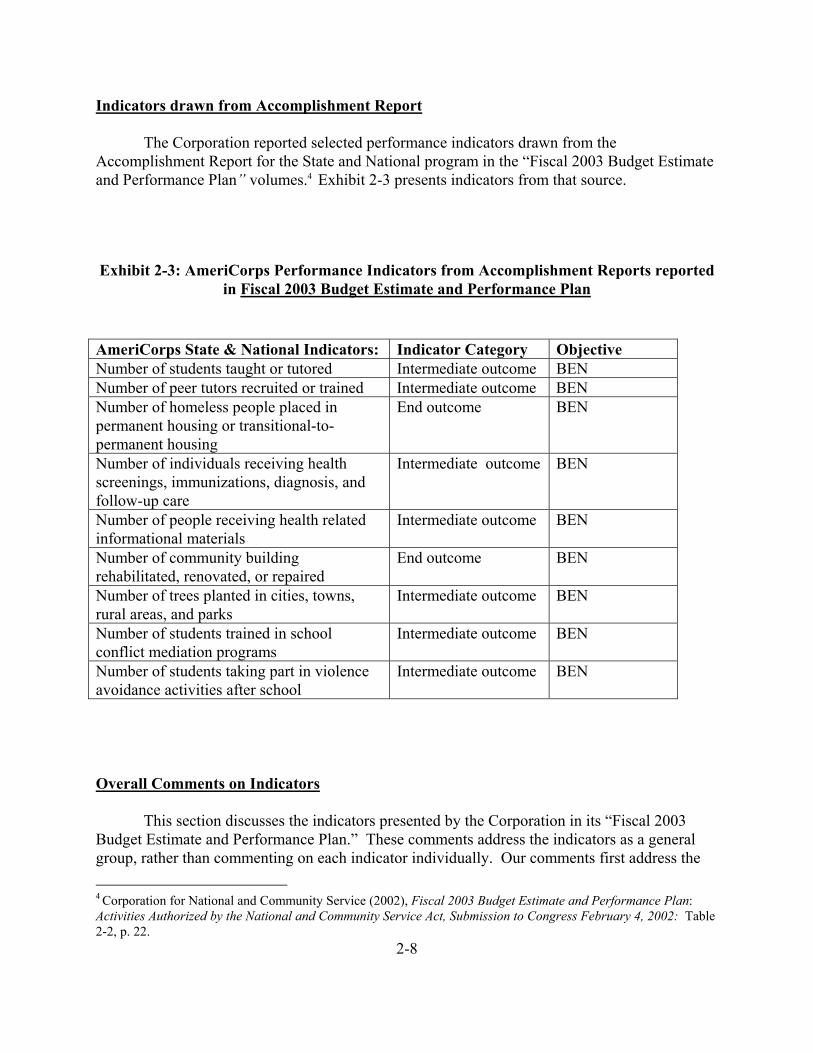
Indicators drawn from Accomplishment Report
The Corporation reported selected performance indicators drawn from the Accomplishment Report for the State and National program in the “Fiscal 2003 Budget Estimate and Performance Plan” volumes.4 Exhibit 2-3 presents indicators from that source.
Exhibit 2-3: AmeriCorps Performance Indicators from Accomplishment Reports reported in Fiscal 2003 Budget Estimate and Performance Plan
AmeriCorps State & National Indicators: Indicator Category Objective Number of students taught or tutored Intermediate outcome BEN Number of peer tutors recruited or trained Intermediate outcome BEN Number of homeless people placed in permanent housing or transitional-to-permanent housing
End outcome BEN
Number of individuals receiving health screenings, immunizations, diagnosis, and follow-up care
Intermediate outcome BEN
Number of people receiving health related informational materials
Intermediate outcome BEN
Number of community building rehabilitated, renovated, or repaired
End outcome BEN
Number of trees planted in cities, towns, rural areas, and parks
Intermediate outcome BEN
Number of students trained in school conflict mediation programs
Intermediate outcome BEN
Number of students taking part in violence avoidance activities after school
Intermediate outcome BEN
Overall Comments on Indicators
This section discusses the indicators presented by the Corporation in its “Fiscal 2003 Budget Estimate and Performance Plan.” These comments address the indicators as a general group, rather than commenting on each indicator individually. Our comments first address the 4 Corporation for National and Community Service (2002), Fiscal 2003 Budget Estimate and Performance Plan: Activities Authorized by the National and Community Service Act, Submission to Congress February 4, 2002: Table 2-2, p. 22.
2-9
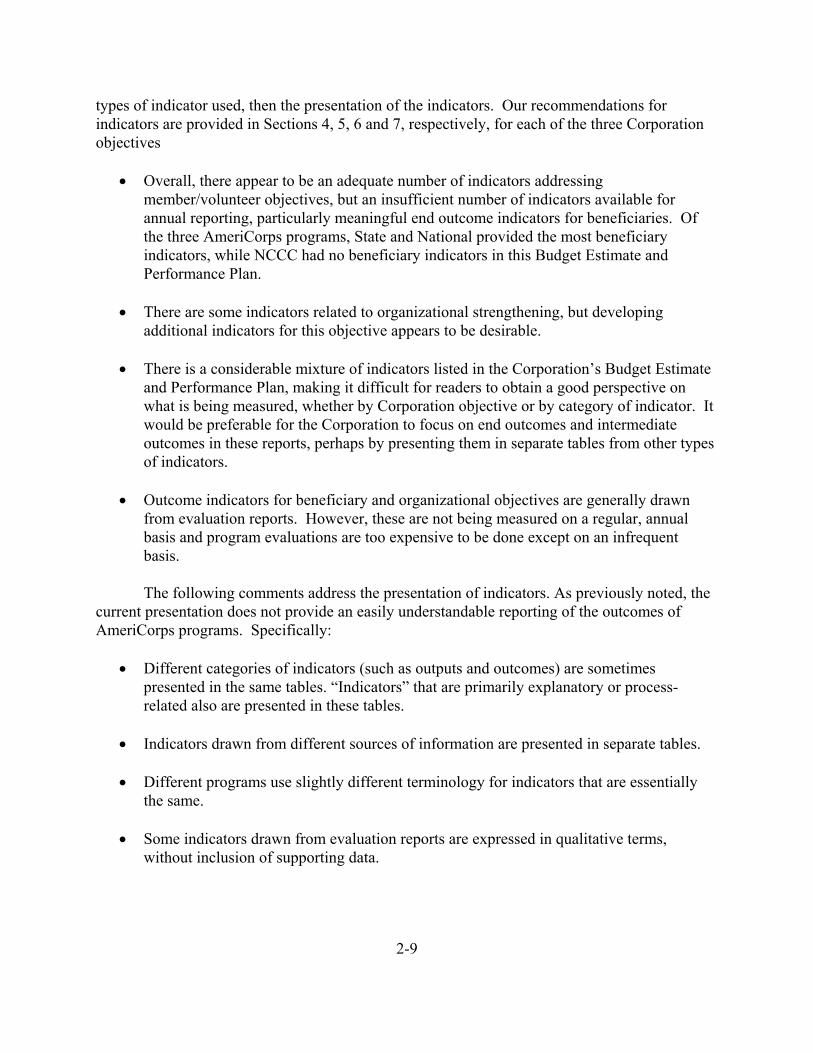
types of indicator used, then the presentation of the indicators. Our recommendations for indicators are provided in Sections 4, 5, 6 and 7, respectively, for each of the three Corporation objectives
• Overall, there appear to be an adequate number of indicators addressing
member/volunteer objectives, but an insufficient number of indicators available for annual reporting, particularly meaningful end outcome indicators for beneficiaries. Of the three AmeriCorps programs, State and National provided the most beneficiary indicators, while NCCC had no beneficiary indicators in this Budget Estimate and Performance Plan.
• There are some indicators related to organizational strengthening, but developing
additional indicators for this objective appears to be desirable. • There is a considerable mixture of indicators listed in the Corporation’s Budget Estimate
and Performance Plan, making it difficult for readers to obtain a good perspective on what is being measured, whether by Corporation objective or by category of indicator. It would be preferable for the Corporation to focus on end outcomes and intermediate outcomes in these reports, perhaps by presenting them in separate tables from other types of indicators.
• Outcome indicators for beneficiary and organizational objectives are generally drawn
from evaluation reports. However, these are not being measured on a regular, annual basis and program evaluations are too expensive to be done except on an infrequent basis.
The following comments address the presentation of indicators. As previously noted, the
current presentation does not provide an easily understandable reporting of the outcomes of AmeriCorps programs. Specifically:
• Different categories of indicators (such as outputs and outcomes) are sometimes
presented in the same tables. “Indicators” that are primarily explanatory or process-related also are presented in these tables.
• Indicators drawn from different sources of information are presented in separate tables. • Different programs use slightly different terminology for indicators that are essentially
the same. • Some indicators drawn from evaluation reports are expressed in qualitative terms,
without inclusion of supporting data.
3-1
Section 3 Review of Senior Corps Performance Indicators
This section reviews the performance indicators reported by the Corporation in its
“Fiscal 2003 Budget Estimate and Performance Plan” submitted to Congress for its three National Senior Service Corps programs: Retired Senior Volunteer Corps, Senior Companion Program and Foster Grandparent Program. The Corporation reported nearly all the same indicators in its “2001 Performance and Accountability Report to Congress.” We first describe the format of the indicators in the “Fiscal 2003 Budget Estimate and Performance Plan.” In general, the Corporation has done a good job of providing the information it had, making use of data available from a variety of sources. However, in terms of reporting annual outcome data, a number of important limitations exist. The indicators are not grouped in a way that enables easy review. Within each program’s section, separate tables are used to present performance indicators drawn from different sources. The indicators in these tables are not grouped by objective or by category of indicator (such as intermediate or end outcome). Another area of confusion is that the data for the indicators are not all drawn from the same time period. Some data provided seem old for inclusion in a fiscal 2003 plan. In addition, the dates for the data provided are not always supplied. In some cases the date of the source of the data, such as an evaluation report, is supplied, but not the time period. These reporting practices result in a presentation that can be confusing for readers.
Finally, and most importantly, as the Corporation and its evaluation office recognizes (and is seeking to correct), the coverage of recent outcomes relating to the Corporation’s objectives is quite limited. We focused our review on the indicators presented in the tables, not any indicators only identified in the accompanying text. Our assumption is that the indicators in the tables represent the official indicators used by the Corporation for tracking progress.
In the Corporation’s report, for each of the three Senior Corps programs, the following four types of indicators are presented in separate tables:
• “Performance Indicators.” This table provides annual performance data on each indicator
for three prior fiscal years (FY 1999-FY 2001) and goals for those indicators for two future years (FY 2002-FY 2003). This is the only category of indicator for which the Corporation projects future performance targets. These data are collected annually from the Corporation’s Government Performance and Results Act Project Data Reports submitted by grantees.
• “Accomplishment Indicators.” These estimate the number of volunteers, number of hours served, and number of persons served by particular activities. These are, at best, low-level intermediate outcome indicators that express the type and quantity of services
3-2
provided to end beneficiaries. The accomplishment indicators listed in separate detailed accomplishment reports seem useful internally for keeping track of the work done. However, many readers of the Corporation’s official reports are not likely to consider most of those indicators as program outcomes.
• “Customer Satisfaction Indicators.” This table summarizes a Senior Corps sponsored survey, primarily of those persons supervising the work of volunteers. A contractor conducted the survey in fiscal 2001, asking respondents to assess fiscal 2000 activities.5 The end beneficiaries of the volunteer services were not surveyed in this work.
• Indicators drawn from Corporation-sponsored evaluation research. This table presented selected indicators from various past evaluation reports. The information presented was not always quantitative and were often based on evaluations that was at least a few years old.
The following sections present our review of each of these sets of indicators, identifying the category of indicator (whether it is an output, intermediate outcome, end outcome, or something else) and which of the three primary Corporation’s objectives the indicator pertains. The three objectives are: 1. To enrich the lives of members and volunteers by providing them meaningful opportunities
for community service — labeled “M/V” 2. To strengthen and build the capacity of organizations providing community services —
labeled “ORG” . 3. To improve the lives of the beneficiaries, and their communities, of those provided assistance
— labeled “BEN”.
Indicators from the “Performance Indicator” Tables
Exhibit 3-1 presents the 14 indicators for the three Senior Corps programs that are in the performance indicator tables in the “Fiscal 2003 Budget Estimate and Performance Plan.” 6 The majority of these indicators (all but three) also are reported in the “Fiscal 2001 Performance and Accountability Report to Congress.” The three indicators not reported in the latter are identified by an * in Exhibit 3-1.
The indicators in Exhibit 3-1 are grouped by Senior Corps program. Indicators are listed
5 RTI International (January 2002), Community Customer Satisfaction Survey Final Report (Version Two) 6 Corporation for National and Community Service (2002), Fiscal 2003 Budget Estimate and Performance Plan: Activities Authorized by the Domestic and Volunteer Service Act, Table 2a-5, p. 52; Table 2b-4 p. 59 and Table 2c-5, p. 67.
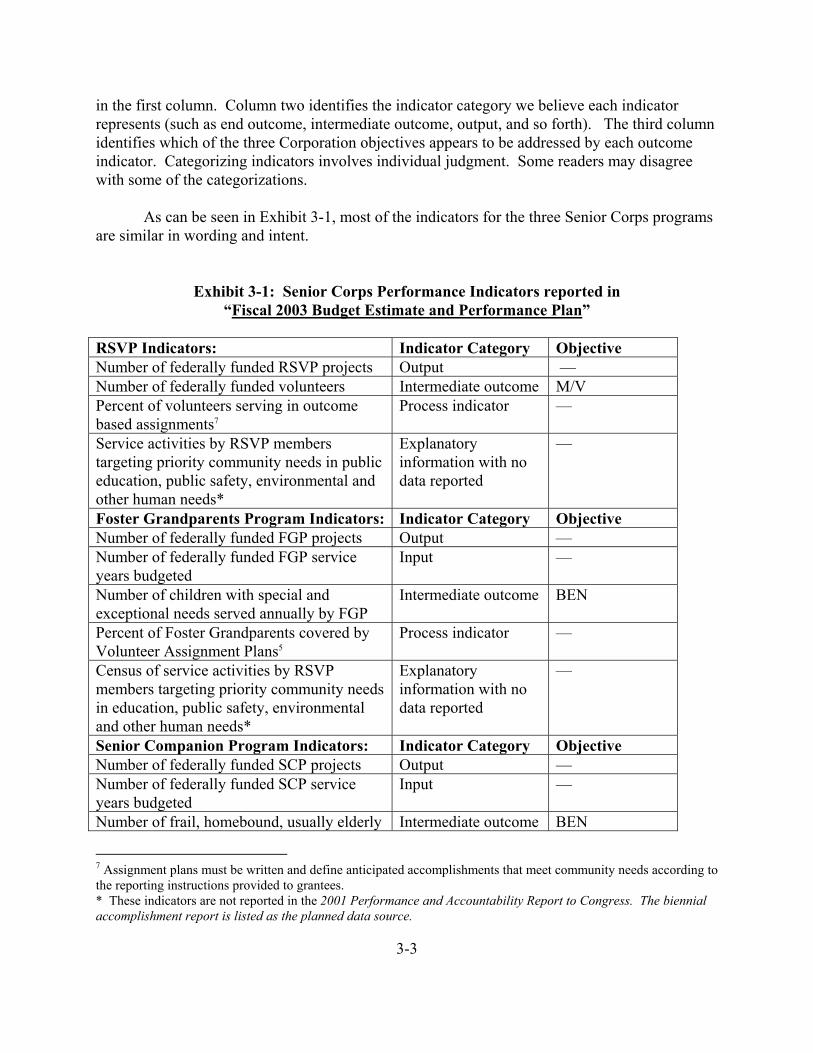
3-3
in the first column. Column two identifies the indicator category we believe each indicator represents (such as end outcome, intermediate outcome, output, and so forth). The third column identifies which of the three Corporation objectives appears to be addressed by each outcome indicator. Categorizing indicators involves individual judgment. Some readers may disagree with some of the categorizations.
As can be seen in Exhibit 3-1, most of the indicators for the three Senior Corps programs
are similar in wording and intent.
Exhibit 3-1: Senior Corps Performance Indicators reported in “Fiscal 2003 Budget Estimate and Performance Plan”
RSVP Indicators: Indicator Category Objective Number of federally funded RSVP projects Output — Number of federally funded volunteers Intermediate outcome M/V Percent of volunteers serving in outcome based assignments7
Process indicator —
Service activities by RSVP members targeting priority community needs in public education, public safety, environmental and other human needs*
Explanatory information with no data reported
—
Foster Grandparents Program Indicators: Indicator Category Objective Number of federally funded FGP projects Output — Number of federally funded FGP service years budgeted
Input —
Number of children with special and exceptional needs served annually by FGP
Intermediate outcome BEN
Percent of Foster Grandparents covered by Volunteer Assignment Plans5
Process indicator —
Census of service activities by RSVP members targeting priority community needs in education, public safety, environmental and other human needs*
Explanatory information with no data reported
—
Senior Companion Program Indicators: Indicator Category Objective Number of federally funded SCP projects Output — Number of federally funded SCP service years budgeted
Input —
Number of frail, homebound, usually elderly Intermediate outcome BEN
7 Assignment plans must be written and define anticipated accomplishments that meet community needs according to the reporting instructions provided to grantees. * These indicators are not reported in the 2001 Performance and Accountability Report to Congress. The biennial accomplishment report is listed as the planned data source.
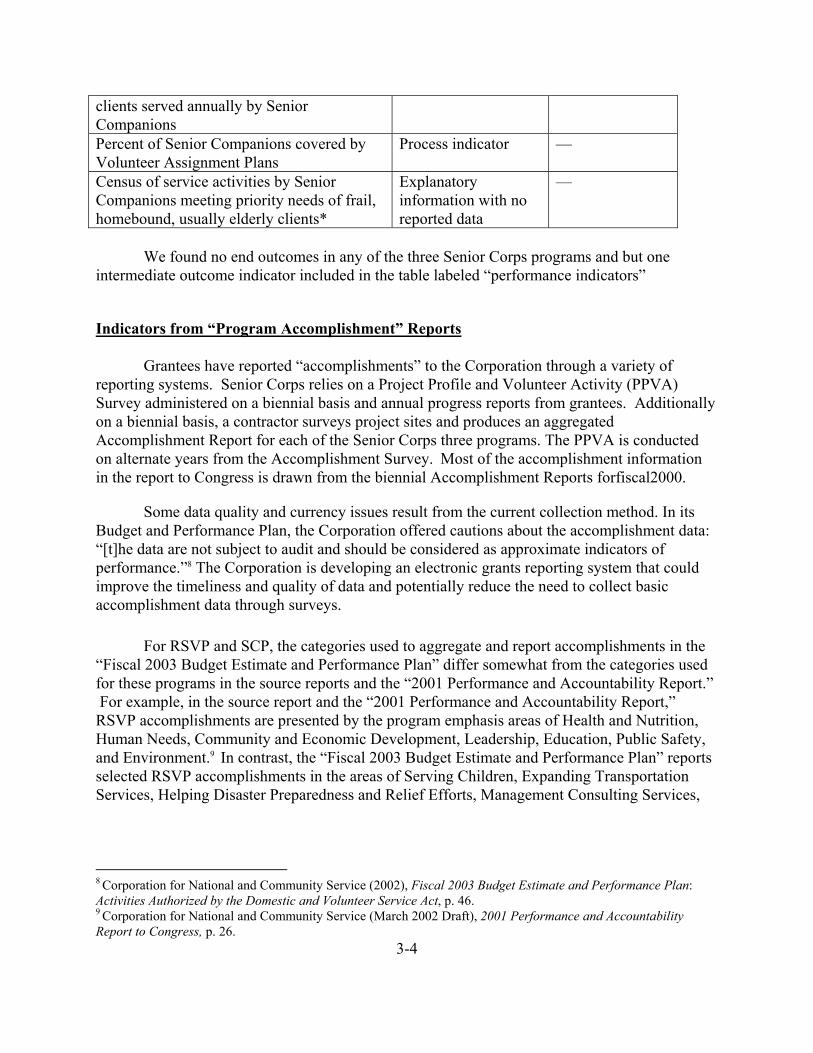
3-4
clients served annually by Senior Companions Percent of Senior Companions covered by Volunteer Assignment Plans
Process indicator —
Census of service activities by Senior Companions meeting priority needs of frail, homebound, usually elderly clients*
Explanatory information with no reported data
—
We found no end outcomes in any of the three Senior Corps programs and but one
intermediate outcome indicator included in the table labeled “performance indicators”
Indicators from “Program Accomplishment” Reports
Grantees have reported “accomplishments” to the Corporation through a variety of reporting systems. Senior Corps relies on a Project Profile and Volunteer Activity (PPVA) Survey administered on a biennial basis and annual progress reports from grantees. Additionally on a biennial basis, a contractor surveys project sites and produces an aggregated Accomplishment Report for each of the Senior Corps three programs. The PPVA is conducted on alternate years from the Accomplishment Survey. Most of the accomplishment information in the report to Congress is drawn from the biennial Accomplishment Reports forfiscal2000.
Some data quality and currency issues result from the current collection method. In its Budget and Performance Plan, the Corporation offered cautions about the accomplishment data: “[t]he data are not subject to audit and should be considered as approximate indicators of performance.”8 The Corporation is developing an electronic grants reporting system that could improve the timeliness and quality of data and potentially reduce the need to collect basic accomplishment data through surveys.
For RSVP and SCP, the categories used to aggregate and report accomplishments in the “Fiscal 2003 Budget Estimate and Performance Plan” differ somewhat from the categories used for these programs in the source reports and the “2001 Performance and Accountability Report.” For example, in the source report and the “2001 Performance and Accountability Report,” RSVP accomplishments are presented by the program emphasis areas of Health and Nutrition, Human Needs, Community and Economic Development, Leadership, Education, Public Safety, and Environment.9 In contrast, the “Fiscal 2003 Budget Estimate and Performance Plan” reports selected RSVP accomplishments in the areas of Serving Children, Expanding Transportation Services, Helping Disaster Preparedness and Relief Efforts, Management Consulting Services,
8 Corporation for National and Community Service (2002), Fiscal 2003 Budget Estimate and Performance Plan: Activities Authorized by the Domestic and Volunteer Service Act, p. 46. 9 Corporation for National and Community Service (March 2002 Draft), 2001 Performance and Accountability Report to Congress, p. 26.
3-5
Increasing Public Safety and Focusing on the Environment.10 The usefulness of accomplishment reporting can be improved by using consistent categories that can be tracked over time.
For Senior Corps we have not provided an exhibit that lists the accomplishment
indicators. This would require a very long table to include close to100 indicators identified in the fiscal 2003 plan. However, the indicators fall into three basic types.
For each of the three programs, the Program Accomplishment tables provide the
following information for each of a number of different activities undertaken by the program (such as tutoring, performing disaster preparedness services, visiting and nurturing hospitalized children, and providing respite care to caregivers of frail adults):
• Number of volunteers • Total number of volunteer hours • Estimated number of clients of the particular activity (In a few instances, the clients
were private nonprofit or public agencies, rather than individual citizens.) These indicators may be considered by some as outputs; however, because these are all
represent an accomplishment of the Corporation, such as attracting volunteers, we prefer to consider these intermediate outcomes. They are not end outcomes, not telling us anything about the consequences of the work.
Categorizing these indicators as to which of the three Corporation objectives they
contribute is a problem. It is not clear from the indicators whether the activities that were performed by the volunteers supported work for end beneficiaries (the third objective) or was aimed at strengthening community organizations (the second objective). The number of volunteers is also related to the first objective (that of enriching the lives of the volunteers).
Indicators drawn from “Customer Satisfaction” Surveys Senior Corps sponsored a survey in 2001, asking respondents about the work done in
fiscal 2000, primarily of those persons supervising the work of volunteers (not the end beneficiaries of the volunteer services).11 The study design sampled individuals at community stations (organizations) where volunteers served; most respondents supervised volunteers. This narrowness in coverage of respondents suggests that the title, “Customer Satisfaction Survey,” may be at least somewhat misleading. No indicators were included that provide feedback from the end beneficiaries of Senior Corps services.
Exhibit 3-2 lists the indicators the Corporation reported in the fiscal 2003 plan. The
10 Corporation for National and Community Service (2002), Fiscal 2003 Budget Estimate and Performance Plan: Activities Authorized by the Domestic and Volunteer Service Act, Table 2a-2, pp. 46-47. 11 RTI International (January 2002), Community Customer Satisfaction Survey Final Report (Version Two)
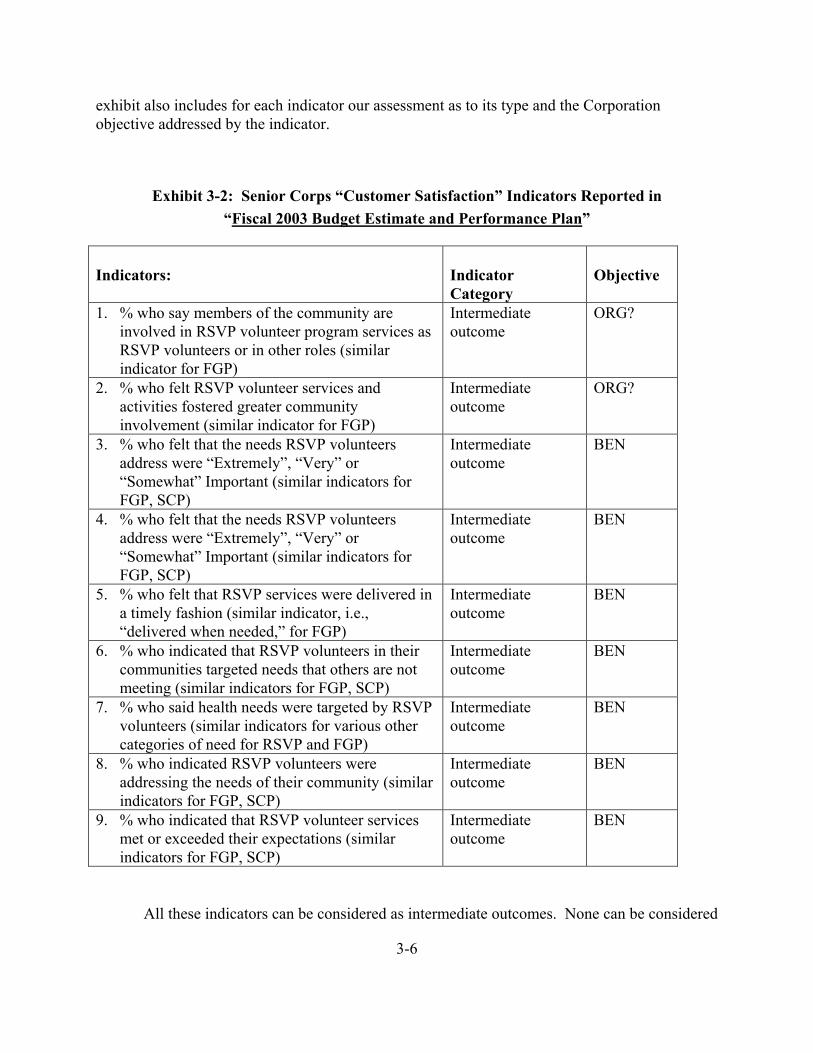
3-6
exhibit also includes for each indicator our assessment as to its type and the Corporation objective addressed by the indicator.
Exhibit 3-2: Senior Corps “Customer Satisfaction” Indicators Reported in “Fiscal 2003 Budget Estimate and Performance Plan”
Indicators:
Indicator Category
Objective
1. % who say members of the community are involved in RSVP volunteer program services as RSVP volunteers or in other roles (similar indicator for FGP)
Intermediate outcome
ORG?
2. % who felt RSVP volunteer services and activities fostered greater community involvement (similar indicator for FGP)
Intermediate outcome
ORG?
3. % who felt that the needs RSVP volunteers address were “Extremely”, “Very” or “Somewhat” Important (similar indicators for FGP, SCP)
Intermediate outcome
BEN
4. % who felt that the needs RSVP volunteers address were “Extremely”, “Very” or “Somewhat” Important (similar indicators for FGP, SCP)
Intermediate outcome
BEN
5. % who felt that RSVP services were delivered in a timely fashion (similar indicator, i.e., “delivered when needed,” for FGP)
Intermediate outcome
BEN
6. % who indicated that RSVP volunteers in their communities targeted needs that others are not meeting (similar indicators for FGP, SCP)
Intermediate outcome
BEN
7. % who said health needs were targeted by RSVP volunteers (similar indicators for various other categories of need for RSVP and FGP)
Intermediate outcome
BEN
8. % who indicated RSVP volunteers were addressing the needs of their community (similar indicators for FGP, SCP)
Intermediate outcome
BEN
9. % who indicated that RSVP volunteer services met or exceeded their expectations (similar indicators for FGP, SCP)
Intermediate outcome
BEN
All these indicators can be considered as intermediate outcomes. None can be considered
3-7
end outcomes. A key issue here is that the respondents to this particular survey will not be perceived as being impartial. They represent organizations receiving help from the Senior Corps.
Indicators drawn from Contractor Evaluations
The table in the Fiscal 2003 plan contained selected outcome findings from program evaluation studies funded by the Corporation. For some of the reported indicators the evaluation data are several years old. (One study referenced was dated 1984.) It can be argued that the basic character of these programs has changed little in recent years, and, thus, old findings are still applicable. On the other hand, the quality of implementation and characteristics of client groups are also major factors in determining outcomes, and these can change from year to year.
In some instances, the information is presented only in the form of qualitative, summary
descriptions of the evaluation findings, rather than including indicators and related data. For example, one entry reads “Foster Grandparents benefit through service.” 12 Finally, it is not always clear whether the information cited was from a study of Corporation activities or pertained to another population.
Exhibit 3-3 lists the indicators for the three Senior Corps programs contained in respective evaluation studies tables in the “Fiscal 2003 Budget Estimate and Performance Plan.”13 Exhibit 3-3 follows the same format as the previous tables. Indicators are grouped by program, and the type of indicator and objective addressed are identified. The table includes only those two indicators for which indicator data were provided. Most of the information included in the “evaluation research” tables was qualitative. While qualitative summary statements can be useful, they do not appear to warrant identification as performance indicators. We have modified the wording originally presented (which often consisted of several sentences) to express the findings as indicators.
12 Corporation for National and Community Service (2002), Fiscal 2003 Budget Estimate and Performance Plan: Activities Authorized by the Domestic and Volunteer Service Act, p. 54. Here the Corporation notes “83% of participants reported being more satisfied with life compared to 52% of those on a waiting list to join the program”. 13 Corporation for National and Community Service (2002), Fiscal 2003 Budget Estimate and Performance Plan: Activities Authorized by the Domestic and Volunteer Service Act, Table 2-a 4, p. 50; pp. 53-54 (For Foster Grandparent Program the data were provided in the text, not in a table); and Table 2c-4, pp. 65-66.
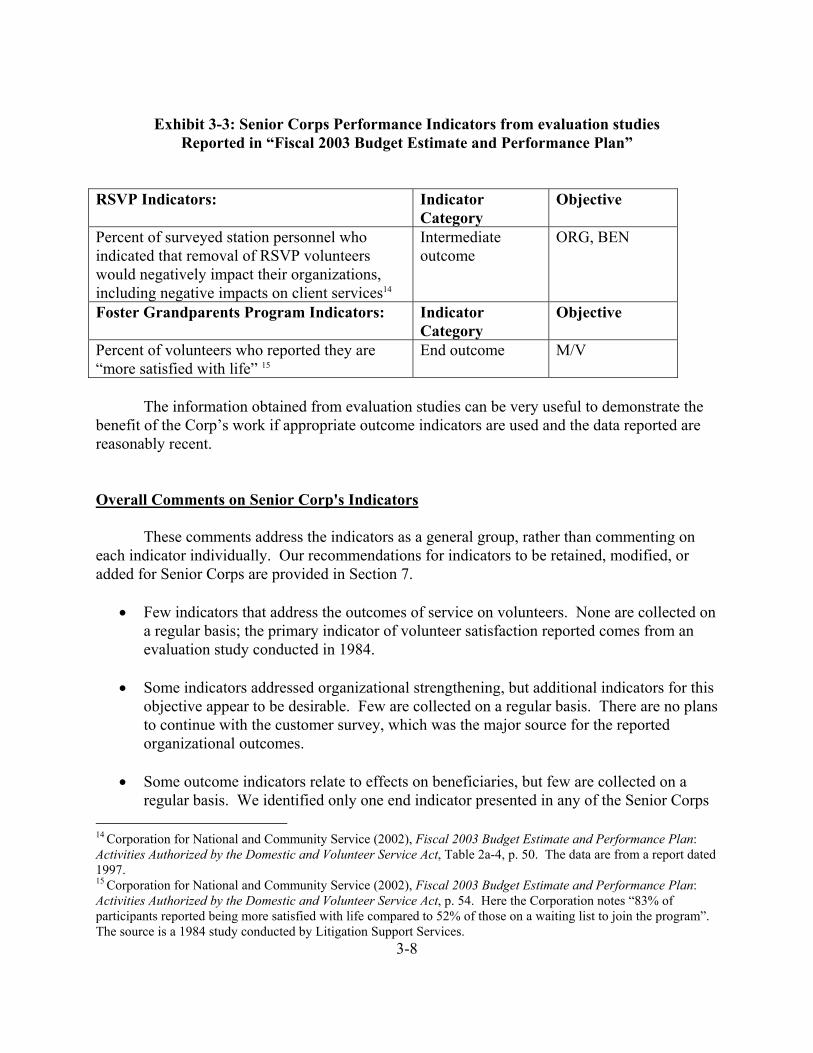
3-8
Exhibit 3-3: Senior Corps Performance Indicators from evaluation studies
Reported in “Fiscal 2003 Budget Estimate and Performance Plan” RSVP Indicators: Indicator
Category Objective
Percent of surveyed station personnel who indicated that removal of RSVP volunteers would negatively impact their organizations, including negative impacts on client services14
Intermediate outcome
ORG, BEN
Foster Grandparents Program Indicators: Indicator Category
Objective
Percent of volunteers who reported they are “more satisfied with life” 15
End outcome M/V
The information obtained from evaluation studies can be very useful to demonstrate the
benefit of the Corp’s work if appropriate outcome indicators are used and the data reported are reasonably recent. Overall Comments on Senior Corp's Indicators
These comments address the indicators as a general group, rather than commenting on each indicator individually. Our recommendations for indicators to be retained, modified, or added for Senior Corps are provided in Section 7.
• Few indicators that address the outcomes of service on volunteers. None are collected on a regular basis; the primary indicator of volunteer satisfaction reported comes from an evaluation study conducted in 1984.
• Some indicators addressed organizational strengthening, but additional indicators for this objective appear to be desirable. Few are collected on a regular basis. There are no plans to continue with the customer survey, which was the major source for the reported organizational outcomes.
• Some outcome indicators relate to effects on beneficiaries, but few are collected on a regular basis. We identified only one end indicator presented in any of the Senior Corps
14 Corporation for National and Community Service (2002), Fiscal 2003 Budget Estimate and Performance Plan: Activities Authorized by the Domestic and Volunteer Service Act, Table 2a-4, p. 50. The data are from a report dated 1997. 15 Corporation for National and Community Service (2002), Fiscal 2003 Budget Estimate and Performance Plan: Activities Authorized by the Domestic and Volunteer Service Act, p. 54. Here the Corporation notes “83% of participants reported being more satisfied with life compared to 52% of those on a waiting list to join the program”. The source is a 1984 study conducted by Litigation Support Services.
3-9
tables in the “Fiscal 2003 Budget Estimate and Performance Plan” (and we suspect that some readers would not consider that one to be an end outcome.). The only regularly collected indicators measure the extent to which volunteers are covered by assignment plans and/or participating in outcome related assignments. These indicators measure process quality more than impact on beneficiaries.
• Indicators for beneficiary and organizational objectives are generally drawn from evaluation reports or Accomplishment Reports. As a result, these data are usually older, sometimes several years older, than the time period covered by the “Fiscal 2003 Budget Estimate and Performance Plan.”
• Few indicators are reported for more than one program. It would be desirable to report
the same indicators across programs, so they could be aggregated for Corporation reporting and accountability purposes.
The following comments address the presentation of indicators. As previously noted, the
current presentation does not provide an easily understandable reporting of the outcomes of Senior Corps programs. Specifically:
• Different categories of indicators (such as outputs and outcomes) are sometimes
presented in the same tables. “Indicators” that are primarily explanatory or process-related also are presented in these tables.
• Indicators drawn from different sources of information are presented in separate tables. • Some indicators are difficult to classify, and may best be thought of as process or
explanatory indicators. It would be preferable for the Corporation to focus on end outcomes and intermediate outcomes in these reports, perhaps by presenting them in separate tables from other types of indicators.
• Some indicators drawn from evaluation reports are expressed in qualitative terms, without inclusion of supporting data or reporting of the outcome indicator measured. Most come from studies that precede the period of the report by a number of years.

4-1
Section 4 Outcome Indicators for
Objective 1: Improving Lives of Members/volunteers
This section recommends outcome indicators for the Corporation’s objective to improve the lives of members/volunteers. We present outcome indicators for the following outcome categories:
• Completion of term of service • Educational opportunities and attainment • Engagement in civic affairs • Commitment to community service • Broadening and strengthening life/employment skills • Social and other benefits (“improve members lives”)
Each category reflects a different way in which service can improve the lives of members/volunteers. We use the following conventions in presenting each recommended outcome indicator.
• We first list the indicator, using footnotes to identify the source from which we drew the indicator. In a number of cases the indicator we present is a modified version of an indicator or a data category presented in that source, or is based on a concept discussed in that source
• The type of indicator is presented in brackets following the description of the indicator,
using the following abbreviations: [INT] = intermediate outcome [END] = end outcome
• Likely source of data for the indicator, for example: Source: Annual exit survey of members leaving service.
• In this section, we use the term “member” to refer to those who serve in the three
AmeriCorps programs, and “volunteer” to refer to those who serve in the Senior Corps programs. Some indicators apply to one or the other. Some apply to both programs. For example, only AmeriCorps members are eligible for educational benefits from the Corporation upon completion of their expected term of service. Another example, AmeriCorps members, who are generally young adults, are expected to gain “life skills,” which are primarily employment skills, from participation in their program. This expectation does not appear to apply to Senior Corps volunteers.
4-2
• In some cases we have used “X” or “Y” within an indicator to indicate a time period that
needs to be determined by the Corporation, preferably with input from various stakeholders. For example, “Percent of former members/volunteers who began using education award within X years after service completion.”
Completion of term of service
1. Number of different (unduplicated) members and volunteers enrolled as of the end of the program year (for each program and aggregated across programs). [END] Source: National Service Trust Database. (Note: Modifications to the reporting system may be needed to generate data for this indicator. Senior Corps and VISTA reportedly have used “volunteer service year” data, and may not maintain annual enrollment data.)
2. Number and percent of members and volunteers who, during the reporting period,
completed the expected term of service.∗ INT]
Source: National Service Trust Database (for AmeriCorps programs); grantee reports for Senior Corps. “Expected term” of service applies to the three AmeriCorps programs, Senior Companions and Foster Grandparents. The latter two programs expect a commitment of 20 hours per week, but do not specify the duration of commitment. A “hoped for level of service” might also be established for RSVP.
3. Number and percent of members who, during the year, dropped out of service before
end of expected completion period. [INT] Source: Grantee reports.
4. Number and percent of volunteers who completed at least X days of service [INT]
Source: Grantee reports. Educational opportunities and attainment
∗ Indicators marked with an * are reported in (or based on those reported in) Fiscal 2003 Budget Estimate and Performance Plan for Activities Authorized by the Domestic and Volunteer Service Act, (for VISTA program) and Fiscal 2003 Budget Estimate and Performance Plan for Activities Authorized by the National and Community Service Act (State and National and NCCC).
4-3
5. Number and percent of members who complete a term of service and become eligible to receive the education award * [INT] Source: National Service Trust Database
6. Number and percent of former members who used the education award funds in the
seven years that the award is available to them * [INT]
Source: National Service Trust Database 7. Number and percent of former members who, at some time during the reporting
period, drew down (that is, used at least some of) their education award. [END]
Source: National Service Trust Database or annual exit survey of members leaving service.
8. Number and percent of former members who used the education award and ultimately
completed college. [END] Source: Longer term follow-up survey.
Engagement in Civic Affairs 9. Number and percent of members/volunteers (at service completion and one year after
completion) registered to vote.16 [INT]
Source: Annual exit survey of members/volunteers leaving service and one-year post program follow-up survey of former members.
10. Number and percent of members/volunteers who voted in most recent election
(national, state or local) a) at service completion, and b) one year after completion17 [END]
Source: Annual exit survey of members/volunteers leaving service and one-year post program follow-up survey of former members.
16 Based on Assessment of Long-Term Impacts on Service Participants: A Profile of Members at Baseline. Abt Associates, Inc. May 2001 17 Ibid.
4-4
Community service 11. Percent of former members and volunteers who performed volunteer service during
the year after leaving service18 (The Corporation should specify some minimum level of service on the part of the member/volunteer for use of this indicator) [END]
Source: One-year post program follow-up survey of former member and /volunteers
12. Percent of former members and volunteers who performed volunteer service during the year after leaving service who report their involvement in AmeriCorps positively affected their decision to participate in that volunteer service. [END]
Source: One-year post program follow-up survey of former members and volunteers
13. Percent of members at end of service who report they have accepted, or expect to
take, a paying community service job (such as a position in an organization that provides community service).19 [INT]
Source: Annual exit survey of members leaving service.
14. Percent of former members who report they are employed in a paid community
service job one year after service completion (such as a position in an organization that provides community service). [END]
Source: One-year post program follow-up survey of former members.
Note: The Corporation will need to develop and provide a definition or examples of paid community service jobs for survey questions seeking information for indicators #13 and #14. These might include paid positions in community-based or faith-based organizations, or in government agencies that provide community services.
Life/Employment Skills
15. Percent of members completing service who report their service experience has “significantly” increased their skills in at least X number of life or employment skills domains such as communication skills, working as part of team, analytical and
18 City Year 1999 Longitudinal Alumni Survey 19 Ibid
4-5
problem solving skills, leadership, and technology (including computers).20 (See Exhibit 4-1 for an illustration of such a question. It is likely that an index will need to be developed to analyze responses to this type of question). [INT or END]
Source: Annual exit survey of members/volunteers leaving service.
16. Percent of members who, one year after service, report they used, to a considerable
extent, the skills learned during service in (a) their place of employment and (b) their community volunteering activities [END]
Source: One-year post program follow-up survey of former members.
Social and Other Benefits 17. Number and percent of members reporting greater appreciation and understanding of
those of different ethnic or racial groups.21 [INT] Source: Annual exit survey of members/volunteers leaving service.
18. Number and percent of members and volunteers who felt their talents and abilities were used effectively during their service assignment. [INT]
Source: Annual exit survey of members volunteers leaving service.
19. Number and percent of members and volunteers completing service who report their service experience contributed significantly to their (a) having more satisfaction with life; (b) increased sense of self-worth. [END]
Source: Annual exit survey of members and volunteers leaving service.
20. Number and percent of volunteers who report their service experience contributed
significantly to their having (a) more social interaction; (b) greater access to resources; [END]
Source: Annual exit survey of members/volunteers leaving service.
20 Ibid and Getting Things Done in the Delta Campbell/UNC February 2000
21 Assessment of Long-Term Impacts on Service Participants: A Profile of Members at Baseline. Abt Associates Inc. May 2001. Also reported in Fiscal 2003 Budget Estimate and Performance Plan
4-6
Commentary
• An annual exit survey of members and volunteers leaving service is recommended as the source for obtaining data for many of these indicators. Since there is some variation in the indicators for members and volunteers, a separate questionnaire should be developed for each. In addition, separate questionnaires should be developed for those who leave at completion of their expected term of service and those who “drop out” at an earlier point. The latter should include a question asking why the member or volunteer terminated service early.
Indicators related to engagement in civic affairs, community service, and life/employment skills are applicable to members or volunteers who have been involved in the program for some period of time. The time period should be determined by the Corporation, with input from the field.
• For some indicators (#11, 12, 14, and 16) we recommend a one-year post program
follow-up survey of former members or volunteers. Such follow-up surveys begin to address the longer-term effects of program participation. Separate versions of the questionnaires may need to be developed for former members and former versions of the volunteers.
• Questionnaires should be distributed to all volunteers and members applicable (such as
all those leaving service during the reporting period), or to a reasonably large random sample, to obtain adequate representation.
• A written questionnaire is likely to be simpler and cost less than a questionnaire to be
administered orally in person or over the telephone. The latter may result in higher response rates, however. If a mailed survey is used, multiple mailings and other techniques should be used to increase response rates.
• Whichever method of survey administration is used, questionnaires should be reasonably
short and simple, to help achieve a reasonable response rate.
• We recommend that all questionnaires include space for open ended comments, such as place to explain any unsatisfactory or low ratings for questions that request ratings of some kind. We particularly suggest that the Corporation include a question asking for recommendations on ways to improve the member’s or volunteer’s experience. This can provide information to the Corporation and grantees to help them improve member and volunteer experience.
• Preferably the exit surveys would be administered by grantees. An option is for them to
be administered centrally by the Corporation, by state offices, or state commissions.
4-7
Having grantees distribute and collect exit questionnaires, perhaps along with other paperwork that may be required at the end of service, is likely to result in a higher response rate than if the questionnaires are mailed to members and volunteers.
• Steps will need to be taken to ensure confidentiality of responses. For example, members
and volunteers might be asked to place completed questionnaires in a sealed envelope to place in a container for the subgrantee to mail to the corporation (or a designated organization that will tabulate and analyze the data). Alternatively, they could be given a postage-paid envelope addressed to the Corporation to mail themselves (although some respondents are likely to fail to take that step).
• The Corporation may be in the best position to conduct follow-up surveys of members,
since it is likely to have the best source of information on former member and volunteer names and addresses. However, since it appears that the Corporation does not maintain a centralized roster of volunteers, the Corporation will likely need to make arrangements to either obtain volunteer contact information from community organizations and placement stations, or to have them distribute the questionnaires.
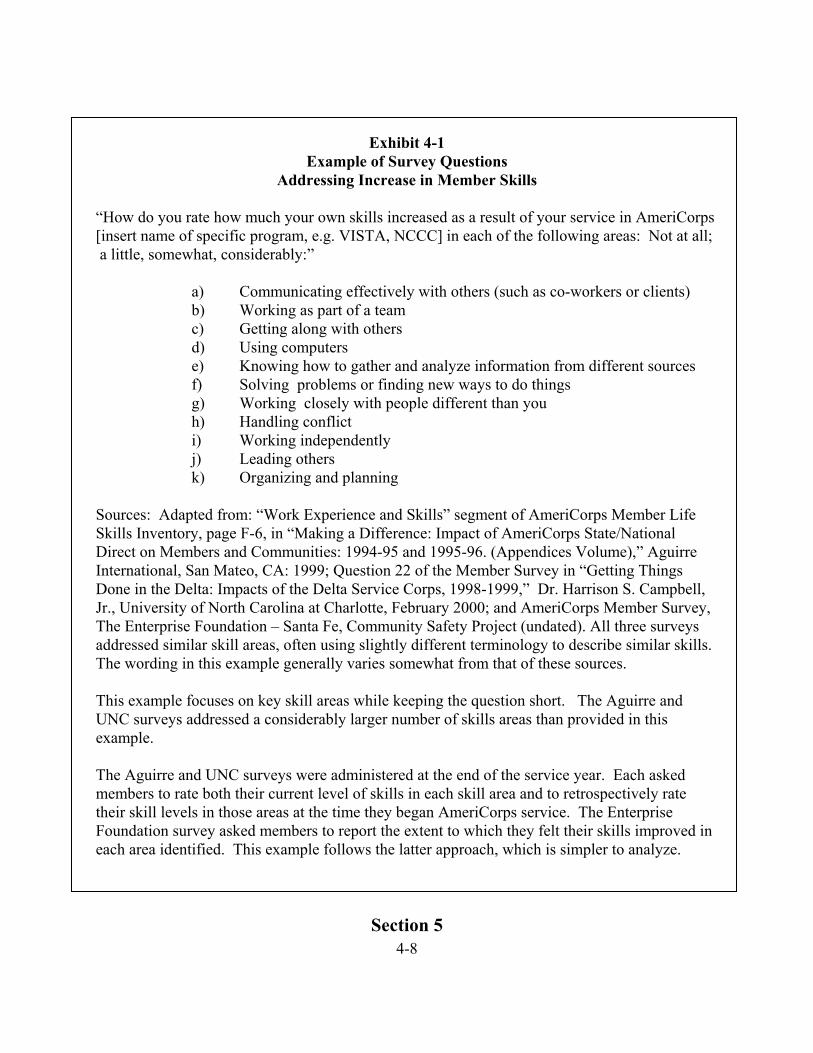
4-8
Exhibit 4-1
Example of Survey Questions Addressing Increase in Member Skills
“How do you rate how much your own skills increased as a result of your service in AmeriCorps [insert name of specific program, e.g. VISTA, NCCC] in each of the following areas: Not at all; a little, somewhat, considerably:”
a) Communicating effectively with others (such as co-workers or clients) b) Working as part of a team c) Getting along with others d) Using computers e) Knowing how to gather and analyze information from different sources f) Solving problems or finding new ways to do things g) Working closely with people different than you h) Handling conflict i) Working independently j) Leading others k) Organizing and planning
Sources: Adapted from: “Work Experience and Skills” segment of AmeriCorps Member Life Skills Inventory, page F-6, in “Making a Difference: Impact of AmeriCorps State/National Direct on Members and Communities: 1994-95 and 1995-96. (Appendices Volume),” Aguirre International, San Mateo, CA: 1999; Question 22 of the Member Survey in “Getting Things Done in the Delta: Impacts of the Delta Service Corps, 1998-1999,” Dr. Harrison S. Campbell, Jr., University of North Carolina at Charlotte, February 2000; and AmeriCorps Member Survey, The Enterprise Foundation – Santa Fe, Community Safety Project (undated). All three surveys addressed similar skill areas, often using slightly different terminology to describe similar skills. The wording in this example generally varies somewhat from that of these sources. This example focuses on key skill areas while keeping the question short. The Aguirre and UNC surveys addressed a considerably larger number of skills areas than provided in this example. The Aguirre and UNC surveys were administered at the end of the service year. Each asked members to rate both their current level of skills in each skill area and to retrospectively rate their skill levels in those areas at the time they began AmeriCorps service. The Enterprise Foundation survey asked members to report the extent to which they felt their skills improved in each area identified. This example follows the latter approach, which is simpler to analyze.
Section 5
5-2
Outcome Indicators for Objective 2: Strengthening Community Organizations
Hosting Members/Volunteers
This section presents outcome indicators for strengthening community organizations participating in Corporation programs. We present indicators under the following two categories:
• Increasing Sustainability of Community Organizations and their Programs • Increasing Community Organization Capacity
The first category addresses the continuation of the community organization or specific
program to which members/volunteers are assigned for their service. The second focuses on enhanced community organization capacity associated with assignment of members/volunteers.
Outcome Objective 2 is primarily applicable to two of the AmeriCorps programs, VISTA and AmeriCorps State and National, and to some RSVP volunteers. VISTA, in particular, has emphasized increasing community organization capacity as the role of VISTA members/volunteers. Other Corporation programs do not appear to have the goal of strengthening the organization to which its members are assigned, although Senior Corps volunteers or other AmeriCorps members may at times contribute to this. We use the following conventions in presenting each recommended outcome indicator:
• We first list the indicator, using footnotes to identify the source from which we drew the indicator. In a number of cases the indicator we present is a modified version of an indicator or a data category presented in that source, or is based on a concept discussed in that source
• The type of indicator is presented in brackets following the description of the indicator,
using the following abbreviations: [INT] = intermediate outcome [END] = end outcome
• Likely source of data for the indicator, for example: Source: One-year post program follow-up survey of administrators of community organizations.
5-3
• We use the term “community organizations” to include community based organizations,
faith-based organizations, and governmental agencies (including schools) that participate in CNCS programs by hosting AmeriCorps members or Senior Service Corps volunteers.
• We use the term “member” to refer to those who serve in the three AmeriCorps
programs.
Increasing Sustainability of Community Organizations and Their Programs
1. Percent of organizations that report the status of program/service with which members assisted one year after assignment ended as:22 [END]
• Maintained at same level • Expanded • Reduced • Terminated • Transferred to another organization
Source: One-year post program follow-up survey of administrators of community/faith-based organizations.
2. Percent of community organizations in which members/volunteers were placed to assist
with sustainability (especially VISTA) that continued to exist one year after member assignment ended. [END] Source: One-year post program follow-up survey of administrators of community organizations.
Increased Organizational Capacity
3. Total and average number of community volunteers recruited by AmeriCorps State/National, NCCC or VISTA members during the program year.23 [INT]
22 The Sustainability of AmeriCorps*VISTA Programs and Activities. PeopleWorks, Inc. August 1997 23 Fiscal 2003 Budget Estimate and Performance Plan for Activities Authorized by the Domestic and Volunteer Service Act (for VISTA) and Fiscal 2003 Budget Estimate and Performance Plan for Activities Authorized by the National and Community Service Act (State and National and NCCC).
5-4
Source: Web-based Reporting System, Corporation for National and Community Service (for State and National) and survey of VISTA project administrators.
Note: We use the term “community volunteers” to refer to community members who are often recruited by and work with members/volunteers, but who have not joined any of the Corporation programs. This is consistent with the Corporation’s terminology for community residents who volunteer in community organizations which host Corporation members/volunteers. A standardized definition is needed for “community volunteers” to enable consistency in reporting across programs. The standard might be based on some specified minimum amount of service (such as a specified number of hours or days per year) provided by the community volunteer. Alternatively, separate minimum times might be set for casual or occasional community volunteers, and those who provide service on a regular basis. Similarly, a standard definition should be developed for the meaning of “recruited by” a member, to identify some minimum contribution to the recruitment on the part of the member.
4. Total and average amount in cash and in-kind resources generated by each member.24
[INT]
Note: A standard definition for both “in kind resources” and “generated by” a member is needed for consistency in reporting. The latter might include some minimum amount of involvement in generating the resources reported. (Fund-raising historically was applicable only to VISTA members, but it is anticipated that it will apply to all AmeriCorps members in the future.) Source: Survey of project administrators.
5. Percent of organizations that report member assignment led to increased involvement
with other agencies/organizations (such as collaborations, consortia, or networking a) at end of assignment and b) one year later. 25 [INT] Source: Survey of project administrators at end of project and one year later.
24 Fiscal 2003 Budget Estimate and Performance Plan for Activities Authorized by the Domestic and Volunteer Service Act (for VISTA) and Fiscal 2003 Budget Estimate and Performance Plan for Activities Authorized by the National and Community Service Act (State and National and NCCC) and Aguirre International 1999 AmeriCorps VISTA Accomplishments, October 2000 25 Based on Making A Difference: Impact of AmeriCorps*State/National Direct on Members and Communities: 1994-95 and 1995-96. Aguirre International, San Mateo, CA: 1999 and AmeriCorps State/National Direct Five Year Evaluation Report, Aguirre International, San Mateo, CA: 1999
5-5
6. Percent of organizations that report that assignment of members strengthened their organization somewhat or considerably a) at end of assignment and b) one year later.26 [INT] Source: Survey of project administrators at end of project and one year later.
7. Percent of organizations that report that member assignment improved the visibility and reputation of their organization (somewhat or considerably) a) at end of assignment and b) one year later.27 [INT] Source: Survey of project administrators at end of project and one year later.
8. Percent of organizations that report that member assignment strengthened (somewhat or
considerably) their organization’s ability to obtain funding a) at end of assignment and b) one year later. [INT] Source: Survey of project administrators at end of project and one year later.
9. Percent of organizations that report that community acceptance of their programs had increased a) at end of assignment and b) one year later.28 [INT]
Source: Survey of project administrators at end of project and one year later.
10. Percent of organizations that report, one year later, that they used somewhat or considerably more community volunteers as a result of member assignment. [END] Source: Survey of project administrators at end of project and one year later.
11. Percent of organizations that report that their funding had increased one year after end of assignment and that member assignment had contributed to this (somewhat or considerably). [END] Source: Survey of project administrators at end of project and one year later.
26 Based on Making A Difference: Impact of AmeriCorps*State/National Direct on Members and Communities: 1994-95 and 1995-96. Aguirre International, San Mateo, CA: 1999) 27 Based on Getting Things Done in the Delta Campbell/UNC February 2000 28 Based on Making A Difference: Impact of AmeriCorps*State/National Direct on Members and Communities: 1994-95 and 1995-96. Aguirre International, San Mateo, CA: 1999
5-6
Commentary
• An annual survey of administrators of grantee organizations hosting members or volunteers is recommended as the source for obtaining data for most of the outcome indicators recommended in this section. We use the phrase “at end of project” to refer to the termination of the period during which members or volunteers are assigned. See commentary in Section 4 for comments related to survey administration.
• For outcome indicators 1, 2, and 10, it also would be desirable to periodically conduct
studies to identify these outcomes, two or more years after the assignment ends.
6-1
Section 6 Outcome Indicators for Objective 3:
Improving the Lives of AmeriCorps’ End Beneficiaries
This section recommends outcome indicators for AmeriCorps programs related to Objective 3—benefits to those who are end beneficiaries of AmeriCorps service. General Observations
A major objective of AmeriCorps is to improve the lives of the direct recipients or end
beneficiaries (hereafter, 'beneficiaries') of the assistance provided by members, volunteers, and sub-grantees. Beneficiaries are individuals or households that receive goods or services. At present, the Corporation uses information derived from various sources to evaluate and report on its performance with respect to this objective, including:
• Project/program accomplishments data assembled and submitted by sponsoring
agencies/non-profit organizations • Surveys of sponsoring agencies'/non-profit organizations' ratings of project success • Surveys of Corporation members' ratings of project success • Surveys of "community representatives’" ratings of project success • Reports of ad-hoc program evaluation studies The following observations can be made about the credibility and usefulness of these
sources. • Measuring improvement in the lives of beneficiaries based primarily on observations
and ratings by sponsoring agencies, non-profit organizations, members, and other community representatives—who have a direct relationship to the projects in which members and volunteers participate—is quite limiting. These organizations and persons have an interest in promoting positive beneficiary outcomes and, therefore, the objectivity of such parties can be called into question. Feedback from participating organizations can be useful to the Corporation, especially for assessing the quality of the Corporation’s own services to these organizations. However, their ratings of benefits to their own beneficiaries are likely to have low credibility.
• Since much of the Corporation's accomplishments data on beneficiary outcomes
relies on information reported by sponsoring agencies/non-profit organizations, Aguirre International has correctly observed that such information would be considered more valuable if used in conjunction with data derived from beneficiaries themselves (such as tutored students) or third-party sources (such as parents or
6-2
teachers of tutored students).29 Clearly, more reliance on data from end beneficiaries is needed to enable the Corporation to annually track progress on the key Corporation objective of improving the lives of beneficiaries.
• With respect to all data reported by sponsoring agencies/non-profit organizations,
some form of quality control and arms-length validation, on at least a sample basis, is appropriate to enhance the credibility of these data.30
• Outcome data derived from formal program evaluations tend to be expensive;
moreover, evaluations are generally undertaken only periodically, on an irregular basis. Many are one-time efforts. As such, they do not permit tracking of outcomes on a routine schedule that is useful for continuing project management purposes.
• If outcome indicators are at least roughly standardized over many, if not all, projects,
the annual findings can serve both (a) local project management purposes, such as identifying if, and where, problems exist; and (b) be converted into index scores for reporting to the Corporation and aggregating across projects—providing benchmarks and a basis for identifying national “best practices.”
Given the limitations of the indicators currently being used to assess improvement in the lives of beneficiaries, and the need to enhance their credibility, frequency, and value, we have recommended below a number of outcome indicators. Some have been used in ad hoc program evaluation studies done for AmeriCorps. They are recommended here, however, for use on a regular basis—and in a more standardized fashion. 31
The outcome indicators have been selected to be of value to both project sponsors (for internal management purposes) and the Corporation (for policy development and aggregate reporting purposes). The more such indicators are standardized across projects, the more useful they will be for purposes of comparison and aggregation.
29As stated in An Analysis of 1996/97 AmeriCorps Tutoring Outcomes, Aguirre International, p. 111, "Self reported program data is limited by the program’s interest in showing positive outcomes, their limited experience in data collection, and lack of resources. Program data can be useful, however, when combined with other externally collected data. Confirming program findings with externally collected data could both save time and resources for external evaluators and provide new sources of best practices for programs to improve their own evaluations." 30Aguirre International has previously done this, to some extent. Their report, AmeriCorps*State/National Annual Accomplishments Review Reliability and Validity Issues (September 2000), focuses on the documentation underlying a sample of WBRS Automated Progress Reports accomplishments data. Since, however, Aguirre is an intermediary in the production of such data, a more independent validation would lend additional credibility to these data. 31For example, as observed by Aguirre International, tutoring sites use a wide range of outcome measures. These include: grades, attendance records, parent/teacher surveys, developed measures, homework/classwork scores, classroom behavior records, standardized tests, surveys/interviews with clients, progression/retention rates, classroom test scores, parent involvement scales, and goal setting (An Analysis of 1996/97 AmeriCorps Tutoring Outcomes). This variation makes aggregation and comparison across sites extremely difficult and problematic, thereby limiting the value of such aggregation to the Corporation.
6-3
Recommended Outcome Indicators
Although there are different organizational arrangements and emphases across the AmeriCorps divisions of State and National Direct, National Civilian Community Corps (NCCC), and VISTA, our recommended outcome indictors are grouped by activity category rather than organizational unit. This is not intended to ignore differences across divisions:
• VISTA emphasizes member service to strengthen and expand the capacity of organizations that have as their ultimate objective the reduction of poverty;
• NCCC emphasizes direct, relatively short duration, team-based service to communities
and persons, which often have physical products; and • State and National Direct emphasizes direct service—through such entities as local and
national not-for-profit organizations, local and state government agencies, Indian tribes, and educational institutions—that provide community services and benefits.
Notwithstanding these differences, all three of AmeriCorps’ divisions permit direct service activities or service to organizations that address unmet human, educational, environmental, or public safety needs. Outcome indicators can be common, therefore, despite differences in activities and in the means by which they are accomplished. Indeed, there is a benefit to the Corporation in using the same indicators across divisions for purposes of cross-division comparison as well as for aggregation to the higher, AmeriCorps level.
Activities categories. We present recommended outcome indicators of improvement in the lives of beneficiaries of AmeriCorps activities for the following major categories:
• Educational support and enhancement • Housing provision and improvement • Health, nutrition, and human services provision and enhancement • Environment & neighborhood/community enhancement
AmeriCorps sponsoring agencies and non-profit organizations provide assistance in
many areas, yet the above categories appear to represent a significant proportion of direct-service activities undertaken by members, volunteers, and sponsoring agencies. While not covered here, there are other possible issue-categories for which outcome indicators could also be developed—depending on the extent of assistance provided, commonalities across projects, and the ability to link service to identifiable beneficiaries. Such activities include:
• Social and emotional support and enhancement • Employment support and improvement • Public safety enhancement
6-4
• Transportation provision Notation conventions. We use the following conventions in presenting recommended
indicators.
• We first list the indicator, using footnotes, where appropriate, to identify the source from which we drew the indicator. In a number of cases the indicator is a modified version of an indicator or a data category presented in that source, or is based on a concept discussed in that source.
• The type of indicator is presented in brackets following the description of the
indicator, using the following abbreviations: [INT] = intermediate outcome [END] = end outcome
• The source for future collection of data for that indicator, for example: Source: Annual survey of beneficiaries. Methodologies for new sources of indicator data are discussed following the presentation of indicators.
• In some cases we have used “X” within an indicator to represent an unknown time
period that needs to be determined by the Corporation with input from various stakeholders. For example, “Percent of former members/volunteers who began using education award within X years after service completion.”
The following sections present our recommended outcome indicators for the major issue
area categories in which the Corporation's grants are primarily used. Educational Support and Enhancement
This category includes programs for tutoring school-age children, providing
reading/literacy training for adults, and mentoring youth. 1. Percent of tutored students, to whom AmeriCorps members or volunteers32 provided a
significant amount of service, who showed improvement in: (a) reading performance scores using a standardized reading test33 or (b) overall school performance as
32 The term ‘volunteers’ refers to community volunteers, as distinct from AmeriCorps members who are provided with education awards or other benefits for their service. 33This could involve, for example, multiple administrations of a Reading Performance Battery consisting of standardized assessments—such as Identification of Capital Letters, Identification of Lower Case Letters, the Yopp-Singer Test of Phoneme Segmentation, the Woodcock Reading mastery Test Subtests (consisting of Word Identification, Word Attack, and Passage Comprehension) and the Durrell Analysis of Reading Difficulty Subtests (Oral Reading Time and Oral Reading Comprehension). See Evaluation of DC Reads: Year 2 Final Report, January 31, 2000, Macro International, Inc.
6-5
measured by grade point average or other standard indicators in the post-tutoring period34 [END]
Source: Aggregation of differences between standardized tests administered prior to start of tutoring, and X months following completion of tutoring that occurred during the reporting period. Note: For the outcome indicators in this section, the Corporation—preferably with considerable input from the field—will need to define for each indicator the minimum amount of member-time necessary to meet the "significant-amount-of-service” criterion.
2. Percent of tutored students’ parents or teachers reporting improved: (a) attitudes, behavior, and reading skills for their child/student;35 (b) motivation, attendance, classroom behavior, homework, and academic skills; and (c) improvements in self-esteem and social skills36 [INT] Source: Aggregation of surveys of parents or teachers of tutored students administered X months following completion tutoring that occurred during the reporting period. The tutored students would be those to whom AmeriCorps members or volunteers provided a significant amount of service.
3. Percent of tutored students, to whom AmeriCorps members or volunteers provided a significant amount of service, who report improvement in reading skills, grades, subject understanding, school-related activities, self-esteem, and/or constructive/positive school-related behaviors as a result of tutoring experiences, and who are willing to recommend their tutor to a friend.37 [INT]
Source: Aggregation of surveys of tutored students administered X months following completion of tutoring that occurred during the reporting period. Note: See Exhibit 6-1 for an example of a Project STAR tutoring questionnaire of the
34Currently reported by some sub-grantees in annual performance reports. Comparisons based on grades or scores from tests administered at pre- and post-tutoring periods, and judged against the standard gain expected for a typical child at grade level. 35Project Respite: Foster Parent Tutoring/Mentoring Survey (Project Star Mentoring Instruments), Teacher Questionnaire (Project Star Mentoring Instruments); and AmeriCorp Tutoring Outcomes Study. 36Such as the Behavioral Academic Self-Esteem (BASE) and Social Skills Rating System (SSRS) standardized teacher rating scales. 37Fiscal 2003 Budget Estimate and Performance Plan; Evaluation of DC Reds: Year 2 Final Report; AmeriCorpsTutoring Program—Student Survey (Project Star Mentoring Instruments); Project Respite: Foster Children's Mentoring Survey Grades 7-12 (Project Star Mentoring Instruments); and Youth Reding Self-Assessment Survey (Project Star Mentoring Instruments).
6-6
type that might be adapted for use by projects. For reporting to the Corporation, the items for each youth can be converted into an index score and aggregated across projects.
4. Percent of adult reading/literacy training program participants, to whom AmeriCorps
members or volunteers provided a significant amount of service, who passed the GED or other high school graduation equivalent.38 [END]
Source: Aggregation of surveys of training participants administered X months following completion of training that occurred during the reporting period.
5. Percent of adult reading/literacy training program participants, to whom AmeriCorps members or volunteers provided a significant amount of service, who report improvement in reading skills, self-esteem, and/or quality of life as a result of the program. [INT]
Source: Aggregation of surveys of training participant administered X months following completion of training.
6. Percent of mentored youth (or, alternatively, their parents), to whom AmeriCorps members or volunteers provided a significant amount of service, who report: (a) reduced or no crime activity, (b) reduced or no alcohol use, (c) reduced or no engagement in anti-social behavior, (d) improved school attendance or performance, and/or (e) improved relations with peers and families.39 [END]
Source: Aggregation of surveys of mentored youth, or their parents, administered after X months of mentoring activity. Note: See Exhibit 6-1 for an example of a Project STAR questionnaire that might be adapted for use by local projects. For reporting to the Corporation, the items for each youth can be converted into an index score and aggregated across projects.
Commentary
Ideally, for each of the above outcome indicators the Corporation would select one
standard data collection instrument for use by all programs providing that particular service. As is, the variety of instruments and data collection procedures currently in use is considerable, limiting the potential for program comparisons or meaningful aggregation. However, complete standardization is not likely to be feasible, and many sponsoring organizations are likely to oppose it. Therefore, a compromise between allowing the use of any instrument and data
381999 AmeriCorps Vista Accomplishments. 39Fiscal 2003 Budget Estimate and Performance Plan.
6-7
collection procedure, on the one hand, or requiring standard instruments and data collection procedures, on the other, would be for the Corporation to work with stakeholder organizations to develop a limited core set of acceptable data-collection items. These would allow establishment of quality standards and permit comparisons and summation across programs or program categories. This would also enable individual projects to add other data items they believe would be useful to them. Housing Provision and Improvement This service category includes programs for constructing and modernizing housing and for providing shelter assistance to homeless persons.
1. Number of low-income, elderly, or disabled households (or, alternatively, individuals) who have been provided single- or multifamily housing units, for which AmeriCorps members or volunteers provided a significant amount of service to their construction, rehabilitation, renovation (including painting, weatherization, handicapped accessibility), or major repair, completed during the reporting period.40 [INT]
Source: Aggregation of unduplicated counts, prepared and submitted at the project level, of households provided assistance.
2. Percent of beneficiaries of single- or multifamily housing units for which AmeriCorps
members or volunteers provided a significant amount of service related to their construction, rehabilitation, renovation (including painting, weatherization, handicapped accessibility), or major repairs who, as of X months after completion, report quality-of-life benefits as a consequence. [END]
Source: Project-administered survey of beneficiaries of housing conducted X months following completion of the work
3. Unduplicated number of homeless or potentially homeless households (or
individuals) who were either (a) placed in transitional, transitional-to-permanent, or permanent housing, or (b) provided independent living assistance through projects in which AmeriCorps members or volunteers provided a significant amount of service during the reporting period.41 [INT]
Source: Aggregation of number of persons assisted, prepared and submitted at the
401999 AmeriCorps Vista Accomplishments; AmeriCorps National Civilian Community Corps: Annual Summary of Service, October 1999-December 2000. 41 1999 AmeriCorps Vista Accomplishments; Making A Difference: Impact of AmeriCorps State/National Direct on Members and Communities, 1994-95 and 1995-96; and Summary of AmeriCorps State/National Accomplishments 1999-2000.
6-8
project level.
4. Percent of homeless or potentially homeless households who were either (a) placed in transitional, transitional-to-permanent, or permanent housing or (b) provided independent living assistance during this reporting period—as a result of projects in which AmeriCorps members or volunteers provided a significant amount of service—who report this improved the quality of their lives. [END]
Source: Project administered survey of beneficiaries of housing conducted X months following initial placement or provision.
5. Number of shelter and voucher (i.e., person) nights of housing provided to homeless
persons through programs for which AmeriCorps members or volunteers provided a significant amount of service during the reporting period. [INT/END]
Source: Aggregation of person-nights of shelter (counting each member of a household separately) prepared and submitted at the project level.
6. Percent of homeless persons provided with emergency shelter or vouchers—through
programs in which members and volunteers provided a significant amount of service during the reporting period—who report quality-of-life benefits. [END] Source: Project-administered survey of beneficiaries either conducted at the time of service or, if possible, X months following time of service.
7. Percent of homeless persons (or households) provided assistance—through programs
in which AmeriCorps members and volunteers provided a significant amount of service during the reporting period—who have moved to more stable housing. [END]
Source: Project-administered follow-up of beneficiaries conducted X months following time of service—where there are community-wide Homeless Management Information Systems that allow for such tracking and follow-up. Note: More stable housing for those provided emergency shelter or vouchers consists of transitional or permanent (and permanent supportive) housing; for those provided transitional housing, it consists of permanent (and permanent supportive) housing.
Commentary An indicator currently reported by AmeriCorps involves the number of homeless persons,
rather than person-nights, who are provided shelter or vouchers. Although an unduplicated count of the number of persons aided would be desirable, the nature of homeless assistance generally precludes such a count when information has to be aggregated across separate providers or communities. The recommended indicator, therefore, considers the number of
6-9
shelter or voucher nights of assistance provided—which is a more reasonable and credible indicator under the circumstances.
Current indicators of the extent to which AmeriCorps assists in the provision of housing
appear to make no distinction with respect to the amount of member or volunteer assistance provided—a crucial matter for reasonable and credible performance measurement. The outcome indicators recommended attempt to rectify this by explicitly recognizing that the amount of member or volunteer contribution should be significant for it to be counted. The recommended indictors do not, however, define "significant." While the Corporation could independently establish such a standard (using, say, minimum number of hours of effort or percent of total effort involving members or volunteers), it is advisable to work in consultation with grantee and sub-grantee stakeholders when establishing such a definition. Health, Nutrition, and Human Services Provision and Enhancement This category includes programs for providing immunizations, food, and clothing for persons in need.
1. Number of children or adults immunized during the reporting period through projects in which AmeriCorps members or volunteers provided a significant amount of service.42 [END]
Source: Aggregation of counts of persons provided immunizations, prepared and submitted at the project level.
2. Number of persons provided items of clothing or number of meals served to those in
need of assistance (i.e., homeless persons, disaster victims, relief workers, etc.) during the reporting period, through projects in which AmeriCorps members or volunteers provided a significant amount of service.43 [INT]
Source: Aggregation of counts of persons provided clothing or of meals served, prepared and submitted at the project level.
3. Percent of beneficiaries of (a) items of clothing or (b) meals served by projects in which AmeriCorps members or volunteers provided a significant amount of service, who report quality-of-life benefits as a consequence of this service during the
421999 AmeriCorps Vista Accmplishments; Making a Difference: Impact of AmeriCorps State/National Direct on Members and Communities, 1994-95 and 1995-96. 43Making a Difference: Impact of AmeriCorps State/National Direct on Members and Communities, 1994-95 and 1995-96; and AmeriCorps*National Civilian Community Corps, Annual Summary of Service: Year VII (October 2000-December 2001).

6-10
reporting period. [END] Source: Provider-administered survey of beneficiaries of clothing or food, conducted at the time services are provided or X days following such service.
Environment & neighborhood/community enhancement This category includes environmental and disaster assistance as well as environmental educational programs.
1. Number of units (i.e., miles, acres, feet, tons, etc.) of environmental or community (a) restoration, (b) refurbishment, (c) clean-up, (d) or renewal accomplished through projects in which AmeriCorps members or volunteers provided a significant amount of service.44 [INT] Source: Aggregation of counts of units of measure—appropriate to the particular activity—of land, trails, irrigation systems, streambeds, riverbeds, riverbanks, shoreline, footbridges, toxic vegetation, trees, parks, gardens, fencing, wildlife habitats, historical and community buildings, etc. that are restored, refurbished, cleaned up, or renewed (including trees moved or planted), prepared and submitted at the project level.
2. Percent of beneficiaries who can be identified as recipients of environmental,
community, or disaster assistance, or environmental educational programs in which AmeriCorps members or volunteers provided a significant amount of service, who report quality-of-life benefits as a consequence of this service during the reporting period. [END]
Source: Provider-administered survey of all, or a sample of those benefiting from environmental, community, or disaster assistance programs, conducted at the time assistance is provided or X days following such assistance. Note: For this outcome indicator, as well as for others that may not involve direct, person-to-person service, providers need to develop explicit definitions and procedures for identifying beneficiaries and report these along with the results.
General Recommendations: We offer several general recommendations regarding AmeriCorps outcome indicators of
44AmeriCorps*National Civilian Community Corps, Annual Summary of Service: Year VII (October 2000-December 2001).
6-11
improvement in the lives of beneficiaries:
• The Corporation, for each service, should develop a catalog of brief basic data collection instruments that individual grantees can administer routinely to persons receiving or benefiting from Corporation-supported activities. Where activities are similar across divisions, the instruments should contain the same items.
• The Corporation should identify those services that are provided by many of its
grantees and lend themselves to measuring outcomes of individual beneficiaries, such as tutoring and mentoring. It should work with grantees and experts to develop a core set of outcome items on which the Corporation would ask its grantees to report annually. This would enable the Corporation to aggregate the data across the nation, provide benchmarks and comparative information for use at all levels, and lay the groundwork for identifying best practices.
• Benefits to beneficiaries should be assessed not only at (or shortly after) the time the
service was completed but at a later time, where feasible—such as six to 12 months after the service has ended. This is needed for programs that purport to provide sustainable benefits to clients. Such client follow-up, of course, usually adds difficulty to outcome measurement.
• Where feasible, outcome data should be disaggregated by type of activity and type of
client served and, for national use, by State and type of sponsoring organization—for comparative purposes and for analysis of patterns and trends.
• The Corporation should review existing indicators of improvement of the lives of
beneficiaries that are currently being used by individual grantees and identified in their project reports. Currently, AmeriCorps reports only a limited number of independent, unobtrusive measures of beneficiary outcomes, although there is such measurement at the project level (reported in WBRS, for example). We did not have the resources to review these in detail, but recommend that this be done by the Corporation to determine if such indicators can be adapted as standard indicators for particular services.
• The Corporation should review outcome indicators used by other Federal agencies to
see if they are relevant to AmeriCorps. Since the public service efforts of AmeriCorps members and volunteers are often similar to beneficiary assistance provided by agencies such as the U.S Departments of Education, HHS, HUD, and Labor, their outcome indicators should be of interest for either purposes of comparison or cross-agency standardization.

6-12
Exhibit 6-1: SAMPLE TUTORING AND MENTORING INSTRUMENTS FOR RECIPIENTS — PROJECT STAR
A. AmeriCorps Tutoring Program Student Survey Please answer the following questions about the tutoring you have received this year from an AmeriCorps member. Circle the word that best shows how you feel about each question. 1. Do you feel the tutoring has helped you get better grades? YES yes no No 2. Do you feel the tutoring has helped you better understand your schoolwork? YES yes no No 3. Would you recommend your tutor to a friend? YES yes no No 4. Would you use an AmeriCorps tutor next year if you have the opportunity? YES yes no No 5. Please indicate whether or not your tutor helps you in the following ways:
a. Doing homework YES yes no No b. Organizing you work YES yes no No c. Helping you study for tests YES yes no No d. Encouraging you YES yes no No e. Listening when you need to talk about personal problems YES yes no No
6. Has tutoring changed how You think about school or yourself as a student? YES yes no No If yes, please describe: 7. Please comment on your relationship with the AmeriCorps Tutor. B. Project Respite: Foster Children's Mentoring Survey Grades 7-12
Grade Level (circle one) 7 8 9 10 11 12 Gender (circle one) Female Male Ethnicity (check one or two) __Asian/Pacific Islander __Black/African American __Hispanic/Latino __Native American __White __Other: Today’s Date: _________
Dear Student: Please complete this form and give it to your mentor. This information will help us to improve our program. Thanks 1. How long have you been receiving mentoring services from Project Respite? (check one) __ less than 1 month __ 1 to 3 months __ 4 to 6 months __ 7 months or more Please circle one rating for each item in terms of how helpful the mentoring services provided through Project Respite have been to you in…:
Extremely Helpful
Very Helpful
Moderately Helpful
Slightly Helpful
Not Helpful
2. …feeling better about yourself. 3. …going to school more regularly 4. …getting into less trouble at school 5. …getting into less trouble outside of school 6. …getting along better with your foster parents 7. …getting along better with other kids 8. …making new friends more easily' 9. …liking school more 10. …getting more involved in school, church, and community activities 11. …feeling more helpful about your future 12. …understanding why education is important to you 13. List at least one difference that the Project Respite mentoring services has made for you. 14. How could the Project Respite mentoring services better serve you and other foster children?
7-1
Section 7 Outcome Indicators for Objective 3:
Improving the Lives of National Senior Service Corps End Beneficiaries
This section recommends outcome indicators for the National Senior Service Corps for Objective 3, benefits to end beneficiaries. The end beneficiary is the direct service recipient, which may include the community in which the service was provided.
Each of the three Senior Corps programs has a different emphasis and intended beneficiaries:
• RSVP: The Retired and Senior Volunteer Program (RSVP) helps people 55 and older find worthwhile service opportunities in their communities. RSVP volunteers serve from a few to over forty hours a week, providing hundreds of services in public and non-profit organizations that range from education centers to police departments to hospitals. RSVP seeks to involve seniors at all income levels in service that matches their personal interests and makes use of their skills and life experiences to address priority needs in over 1,500 counties across the nation.45
• The Foster Grandparent Program offers seniors age 60 and older opportunities to serve as mentors, tutors, and caregivers for children and youth with special needs. They serve in community organizations such as schools, hospitals, Head Start, and youth centers. Foster Grandparents offer emotional support to children who have been abused and neglected, mentor troubled teenagers and young mothers, and care for premature infants and children with physical disabilities.46 The program has income restrictions and expects a time commitment averaging 20 hours weekly in return for a modest stipend.
• Through the Senior Companion Program, people age 60 and older provide assistance and friendship to frail individuals who are homebound and, generally, living alone. By taking care of simple chores, providing transportation to medical appointments, and offering contact to the outside world, Senior Companions often provide the essential services that enable frail older Americans to continue to live in their own homes. They also provide respite care to relieve live-in caretakers for short periods of time.47 The program has income restrictions and expects a time commitment averaging 20 hours weekly in return for a modest stipend.
For each of the three Senior Corps programs, a contractor has been producing a biennial
Accomplishment Report. Each program’s Accomplishment Report provides performance indicator data on the number of volunteers, volunteer hours, and persons served — organized by
45 http://www.seniorcorps.org/research/html (June 2002) RSVP Program Overview 46 http://www.seniorcorps.org/research/html (June 2002) Foster Grandparent Program Overview 47 http://www.seniorcorps.org/research/html (June 2002) Senior Companion Program Overview
7-2
major emphasis areas. These emphasis areas correspond directly to the service category codes used by the National Senior Services Corps in its current grant application form.48 The Corporation selected highlights from the complete set of indicators presented in the Accomplishments Reports to include in the “2003 Budget Estimate and Performance Plan.”
We use the following conventions in presenting recommended indicators:
• We first list the indicator, using footnotes, where appropriate, to identify the document
from which we drew the indicator. In some cases the indicator is a modified version of an indicator or a data category presented in that source, or is based on a concept discussed in that source.
• The type of indicator is presented in brackets following the description of the indicator,
using the following abbreviations: [INT] = intermediate outcome [END] = end outcome
• The source for future collection of data for that indicator, for example: Source: Annual exit survey of members leaving service. Methodologies for new sources of indicator data are discussed following the presentation of indicators. We first provide recommendations that apply to all three Senior Corps programs and then
provide a few additional recommendations applicable to one of the three programs. For the Senior Corps programs, we distinguish six categories of services:
• Educational • Health and Nutrition • Other Human Needs • Environmental • Community and Economic Development • Public Safety These categories are derived from those used in the fiscal 2000 Accomplishments
Reports. According to those reports, the first three categories were the largest services in terms of the number of volunteer hours. The figures given as to the estimated percent of volunteer hours applied to each service area are those provided in the respective fiscal 2000 Accomplishments Reports for each of the three Corporation programs.
48 National Senior Service Corps grant application form OMB Control No. 3045-0035 p. 20.
7-3
Senior Corps Outcome Indicators that Apply to All Three Senior Corps Programs
Here, we provide our recommendations for outcome indicators that are applicable to all three Senior Corps programs. 1. Number and percent of clients who were provided a significant amount of __________
service by program volunteers and expressed satisfaction with the service provided. [INT]
Source: See discussion under recommendation #3.
2. Number and percent of clients who were provided a significant amount of __________ service by program volunteers and reported that their condition/quality of life had significantly improved since receiving the service. [END]
Source: See discussion under recommendation #3.
3. Number and percent of clients who were provided a significant amount of __________ service by program volunteers, reported that their condition/quality of life had significantly improved since receiving the service, and that they felt that the service provided had contributed significantly to the improvement. [END]
Source: Aggregation of survey responses of service end beneficiaries administered XX months after completion of the service. The Corporation will have to define “significant amount.” Exhibit 7-1, adapted from a past questionnaire administered by Family Services of America, illustrates the questions that might be used. These three outcome indicators are progressively more important for assessing outcomes. Number 2 only measures customer satisfaction. Number 3 focuses on improvement, i.e., the condition of the client. Number 3 goes further by providing the client’s perspective on “attribution.” These indicators only apply to services for which the local program can identify individual clients (or family members) from whom feedback can reasonably be sought. Preferably, local programs would seek feedback from all clients. An option, especially for very large grantees, is for them to sample their client population. This procedure is discussed at greater length in Section 1.
4. Number and percent of local grantees that met their outcome targets.
This provides a relatively easy way for the Corporation to aggregate results over its programs. This tabulation option can be considered a fall-back option, or a temporary option, to the option described next. This approach recognizes the considerable difficulty for outcome measurement posed by these programs, which are enormously varied in the services
7-4
they provide, the client groups they serve, and the amount of service provided clients. However, because of the likely considerable differences in the way the outcomes and outcome targets will be set, this information seems highly limited in value. INT] Source: Aggregations of outcome data from grantee progress reports.
5. Number and percent of clients who were provided a significant amount of the __________
service by program volunteers and for whom evidence is present that the client’s condition/quality of life had significantly improved since receiving the service. [END]
Source: These indicators are applicable to those particular services that are common to many local programs, for which the Corporation and its volunteers provide a substantial amount of resources, and that serve individual, identifiable, clients. The Corporation will need to develop a core set of outcome indicators and data collection procedures for each such service. The Corporation would then ask grantees that provide these particular services to provide regular, at least annual, data. For example, Senior Corp appears to provide substantial effort for:
• youth mentoring (e.g., RSVP); • support to elderly and homebound adults (e.g., SC); and • support to low-income children (e.g., FGP).
An important element in assessing outcomes for these, and other human service programs, is that their benefits should be assessed not only at (or shortly) after the time of service delivery but also at a later time, such as 6 or 12 months after the service to the client has ended. This later follow up is necessary for programs that are seeking to provide sustainable benefits to clients. Such client follow-ups can add considerable difficulty to outcome measurement but provide considerably more valid outcome information.
This option could be considerably strengthened, if the Corporation also provided software to help local programs enter and process the data, and, also, if the Corporation can develop a web-based system in which the Corporation undertook the tabulations and report preparation, thus, considerably lessening the burden of local programs.
Exhibit 6-1 (in Section 6) provides an example of outcomes items that might be included in such a data collection procedure for mentoring (as well as tutoring). Mentoring and possibly tutoring are services for which both AmeriCorps and Senior Corps provide substantial resources. The outcome indicators and data collection procedures are likely to be the same, or at least very similar, and, thus the outcomes might be aggregated across these programs. Exhibit 7-2 provides an example of the items that might be included in data collection procedure for Senior Companion Services. This option is discussed at greater length in Section 1.
7-5
6. Number of persons who were provided a significant amount of the __________ service by
program volunteers. Output or INT?]
This is a variation of a common form of indicator, but it is still questionable whether it should be considered an outcome, even if only an intermediate outcome. The indicator provides no information about whether the client was helped. The data for the number of clients served, however (preferably with guidelines provided as to how much service the volunteers need to have provided before the product can be counted), will be of interest to the Corporation and should be collected and reported. The counts also are needed to provide the denominators for some outcome indicators that are expressed as percents. We suggest that number of clients-served indicators be included in reports, but in a separate table, labeled, “Numbers of clients served.”) Source: Accomplishment Reports or Project Progress Reports.
7. For each of the above Senior Corps outcome indicators, the data collection procedures should
be constructed to provide information that permits appropriate breakouts, and, therefore, comparisons of outcome indicator findings by such characteristics as which State, type of activity, type of client served, type of NGO providing the service, etc. This will provide grantees, state offices, and the Corporation’s central office officials with considerably more insight into what is happening and where.
Source: The same sources as above, but with the individual outcomes classified by the appropriate breakout categories.
8. Do not include as outcome indicators counts of the number of volunteers or volunteer hours
(even if the indicator includes only those volunteers in outcome-related services) as indicators of the benefits to the ultimate intended beneficiaries, the subject of this section. These indicators, however, are included as intermediate outcomes in Section 4, as part of the Corporation’s objective to improve the lives of volunteers.
However, while we do not recommend that the number of volunteer hours and volunteers be considered outcomes here, they should continue to be reported by the programs. Counts of the number of volunteers and volunteer hours should be collected and reported for each major activity supported by Corporation volunteers, but not labeled outcomes. These data indicate the amount of “input” into the respective activities. As recommended in Section 4, the Corporation should identify a minimum amount of service that a volunteer should have provided during the reporting period for the volunteer to be included in the volunteer count.

7-6
These counts should be available to states and the central Corporation officials to provide a vital perspective on the amount of volunteer activity for each program and in aggregate.
The above recommendations apply to each of the three major Senior Corps programs. The following sections identify additional outcome indicator candidates, ones specific to one of the three.
7-7
Additional Retired Senior Volunteer Program (RSVP) Outcome Indicators
In this, and the next sections on the Senior Companion and Foster Grandparents, Programs, we provide recommendations for either additional outcome indicators or variations of one of those listed in the preceding section that pertain directly to the program.
RSVP volunteers provide a very wide variety of services. Because of the great variation
in activities they perform, the varied “dosage” of assistance provided, and the short-term nature of some services, it is particularly difficult for RSVP to produce fully meaningful end outcome indicators for its impact on end beneficiaries.
However, the Corporation can encourage sponsors and stations to collect client outcome
information on a voluntary basis for specific services, especially those where the grantees are applying considerable resources. As discussed in Section 1, the Corporation needs to continue to actively encourage and facilitate local programs’ outcome measurement efforts, such as by developing “tool kits” of indicators and data collection procedures that are feasible for collection by projects and stations. Such efforts will be needed to provide the data needed for the outcome indicators.
In the lists below, we have included many “number of clients served” indicators. In a
few cases, we feel these can legitimately be considered outcomes because they appear likely to represent real value to clients. For most of these, however, we have indicated that the indicator is likely to be considered an output by some and an intermediate outcome by others. The information, whatever it is labeled, is likely to be useful to the Corporation. We suggest that these latter client-served counts be included in a separate table, labeled “Numbers of Clients Served.”
In many of the following indicators, we have included the qualification that “a significant
amount of service” should have been provided in order to be included in the counts. This is to avoid counting as products, situations in which volunteers contributed too little effort to have made a meaningful contribution to the service’s clients.
Health and Nutrition (36% of total fiscal 2000 volunteer hours)
21. Number of person-meals distributed. [INT/END]
Source: Modification of Accomplishment Reports or project progress reports, which currently report tons of food. A focus on the number of clients helped seems likely to be a more important perspective. This outcome indicator assumes that receiving the food is important to these clients, a quite reasonable assumption.
7-8
2. Number of (a) children and (b) adults immunized with a significant amount of assistance
provided by program volunteers. [INT]
Source: Accomplishments Reports or project progress reports. This is considered an outcome since persons immunized are presumed to have received health protection from the targeted diseases.
3. Number of persons provided a significant amount of home care services by program volunteers. [Output or INT?]
Source: Accomplishment Reports or project progress reports.
4. Percent of home care recipients who report satisfaction with the home care service they received. [END]
Source: To obtain aggregate data, the Corporation will need to sponsor an effort to identify a common data collection instrument that would be administered by projects. Such a process is discussed further in Section 1. An example of the questions for such an instrument is provided in Exhibit 7-2. Such a questionnaire probably should also ask how much better off they believe they are having had that care.
5. Percent of care recipients’ families who report satisfaction with the home care service
provided their family member. [END]
Source: The previous indicator sought the outcome information from the care receiver. In this variation, the information is obtained from a care recipient’s family member. To obtain aggregate data, the Corporation will need to sponsor an effort to identify a common data collection instrument that would be administered by projects. Such a process is discussed further in Section 1. The illustrative examples of the questions for such an instrument provided in Exhibit 7-2 could be readily adapted. The Corporation contractor who prepared and used these instruments has prepared both versions.
6. Number of persons provided a significant amount of health and nutrition-related service
by program volunteers — broken out by the particular service. [Output or INT?]
Source: Modification of Accomplishment Survey.
7-9
Human Needs Services (20% of total fiscal 2000 volunteer hours)
7. Number of low-income, elderly, or disabled households (or individuals) provided a new, repaired, or rehabilitated housing unit to which effort volunteers contributed significantly. [INT]
Source: Accomplishment Reports or project progress reports. This is considered an outcome because completed new, repaired, or rehabilitated housing units can generally be expected to provide immediate value to customers.
8. Number of persons provided a significant amount of service by program volunteers, both
in total and broken out, by particular human needs services (such as mentoring and disaster relief) for which separate information is wanted. [Output or INT?]
Source: Accomplishment Reports or project progress reports.
Education (11% of total fiscal 2000 volunteer hours)
9. Number of persons provided a significant amount of education-related service by program volunteers, both in total and broken out, by particular education services for which separate information is wanted, such as tutoring. [Output or INT?]
Source: Accomplishment Reports or project progress reports.
Environment (1% of total fiscal 2000 volunteer hours)
10. Number of miles of beaches and streams cleaned with significant input from program volunteers. [INT] Source: Accomplishment Reports or project progress reports. Guidelines need to be provided as to when a mile can be considered to have been “cleaned.”
7-10
Community and Economic Development (17% of total fiscal 2000 volunteer hours)
11. Number of persons provided a significant amount of service by program volunteers in community and economic development related assignments, both in total and broken out by individual services for which such information is wanted. [Output or INT?]
Source: Accomplishment Reports or project progress reports.
12. Number of private, non-profit or public agencies provided a significant amount of management consulting services by program volunteers working on community and economic development related assignments. [Output or INT?] Source: Accomplishment Reports or project progress reports.
13. Number of volunteers recruited for community-based volunteer programs. [INT] Source: Accomplishment Reports or Project Progress Reports
14. Number of clients provided transportation services. [INT]
This indicator is considered an intermediate outcome indicator because the clients are presumed to be provided transportation to a place those clients want to go. It seems highly likely that these clients value the service.
Source: Accomplishment Reports or Project Progress Reports
15. Number of client-miles of transportation provided. [INT]
This is a variation of the previous indicator. It is also considered an intermediate outcome indicator because the clients are presumed to be provided transportation to a place those clients want to go. It seems highly likely that these clients valued the service.
Source: Accomplishment Reports or project progress reports.
Public Safety (3% of total fiscal 2000 volunteer hours)
16. Number of persons provided a significant amount of public safety related service by program volunteers, both in total and broken out by individual services for which such information is wanted. [Output or INT?] Source: Accomplishment Reports or project progress reports.

7-11
17. Number of local police and community organizations provided a significant amount of
public safety related service by program volunteers, both in total and broken out by individual services for which such information is wanted. [Output or INT?] Source: Accomplishment Reports or project progress reports.
7-12
Additional Foster Grandparent Program Outcome Indicators
Education – (70% of total fiscal 2000 volunteer hours)
18. Number of students provided a significant amount of education-related service by program volunteers, both in total and broken out by individual services for which such information is wanted. [Output or INT?] Source: Accomplishment Reports or project progress reports.
19. Number of students provided a significant amount of tutoring service by program volunteers. [Output or INT?] Source: Accomplishment Reports or project progress reports.
20. Percent of students who received significant amounts of tutoring from program volunteers with improved reading or academic performance. [END]
Source: To obtain aggregate data, the Corporation will need to sponsor an effort to identify common reading, and/or other academic performance instruments, instruments that it would ask projects to administer. Such a process is discussed further in Section 1.
21. Percent of tutored students who report that the tutoring had helped them get better grades. [INT/END]
Source: To obtain aggregate data, the Corporation will need to sponsor an effort to identify a core set of questions to be administered to tutored students. An illustration of part of such an instrument is presented in Exhibit 6-1. To obtain aggregate data, the Corporation would need to ask projects to use those core questions. Such a process is discussed further in Section 1.
Human Needs Services (13% of total fiscal 2000 volunteer hours)
22. Number of persons provided a significant amount of human needs service by program volunteers, both in total and broken out by individual services for which such information is wanted. [Output or INT?] Source: Accomplishment Reports or project progress reports.
7-13
23. Number of children with special and exceptional needs served by FGP. [INT]
Source: GPRA Reports from grantees
24. Number of children, youth and young adults who were provided a significant amount of mentoring service by program volunteers. [Output or INT?] Source: Accomplishment Reports or project progress reports.
25. Percent of mentored students who reported that the assistance had been helpful in enabling them to perform better in school and become more satisfied with their lives.
[END]
Source: To obtain aggregate data, the Corporation will need to sponsor an effort to identify a common data collection instrument that would be administered by projects. Such a process is discussed further in Section 1. An example of such an instrument is contained in Exhibit 6-1. With this questionnaire, the Corporation would likely need to select an algorithm that would be used to combine the responses to the various questions on the questionnaire.
Health and Nutrition (12% of total fiscal 2000 volunteer hours)
26. Number of persons who were provided a significant amount of health and nutrition service by program volunteers, both in total and broken out by individual services for which such information is wanted. [Output or INT?]
Source: Accomplishment Reports or project progress reports.
Public Safety (5% of total fiscal 2000 volunteer hours)
27. Number of persons provided a significant amount of public safety-related service by program volunteers, both in total and broken out by individual services for which such information is wanted. [Output or INT?] Source: Accomplishment Reports or project progress reports.
28. Number of youth offenders/ex-offenders provided a significant amount of public safety-related service by program volunteers [Output or INT?] Source: Accomplishment Reports or project progress reports.
7-14
Additional Senior Companion Program Outcome Indicators
We have drawn several indicators from the customer satisfaction indicators currently
reported in the 2003 Budget Estimate and Performance Plan. However, we recommend some changes in indicator wording, and more importantly, some changes in the survey data collection methodology. These methodological issues are covered in the conclusion of this section.
Human Needs and Health and Nutrition Services (93% of fiscal 2000 volunteer hours)
29. Number of frail, homebound, usually elderly, clients provided a significant amount of
home care service by Senior Companions during the reporting period. [Output or INT?] Source: Accomplishment Reports or project progress reports.
30. Number of persons served through health and nutrition services, both in total and broken
out by individual services for which such information is wanted. [Output or INT?] Source: Accomplishment Reports or project progress reports.
31. Percent of home care recipients who report satisfaction with and improved quality of life at least in part due to the home care service they received. [END]
Source: To obtain aggregate data, the Corporation will need to sponsor an effort to identify a common data collection instrument that would be administered by projects. Such a process is discussed further in Section 1. An example of the questions for such an instrument is provided in Exhibit 7-2. Such a questionnaire should also ask how much better off they believe they are, having had that care.
32. Percent of care recipients’ families who report satisfaction with the home care service
provided their family member. [END]
Source: The previous indicator sought the outcome information from the care receiver. In this variation, the information is obtained from a care recipient’s family member. To obtain aggregate data, the Corporation will need to sponsor an effort to identify a common data collection instrument that would be administered by projects. Such a process is discussed further in Section 1. The illustrative examples of the questions for such an instrument provided in Exhibit 7-2 could be readily adapted. The Corporation contractor who prepared and used these instruments has prepared both the version addressed to care recipients and the one addressed to the families of care recipients.
7-15
33. Number of hours of respite care provided to caregivers of frail adults. [INT/END] Receiving respite care is normally by itself of considerable value to family members, and, thus, this indicator can be considered an outcome, not an output.
Source: Accomplishment Reports or project progress reports.
34. Percent of recipients of respite care services who report improved quality of life (being cheered up, feeling less lonely, feeling better about self, having better health). 49 [END]
Source: To obtain aggregate data, the Corporation will need to sponsor an effort to identify a common data collection instrument that would be administered by projects. Such a process is discussed further in Section 1. An example of such an instrument is likely to have been included in the cited report, though that report is quite old.
Community and Economic Development (5% of total fiscal 1999 volunteer hours)
35. Number of clients provided transportation. [INT] As noted under #14 above, this indicator is considered an intermediate outcome indicator because the clients are presumed to be provided transportation to a place those clients want to go. It seems highly likely that these clients value the service.
Source: Accomplishment Reports or Project Progress Reports
36. Number of client-miles of transportation provided. [INT] As noted under #15 above, this is a variation of the previous indicator. It is also considered an intermediate outcome indicator because the clients are presumed to be provided transportation to a place those clients want to go. It seems highly likely that these clients valued the service.
Source: Accomplishment Reports or Project Progress Reports
49 Corporation for National and Community Service (2002), Fiscal 2003 Budget Estimate and Performance Plan: Activities Authorized by the National and Community Service Act, Submission to Congress February 4, 2002: Table 2c-4, p. 65. The study referenced was conducted by Sociometrics and published in 1988.
7-16
Public Safety (2% of total 1999 volunteer hours)
37. Number of persons provided a significant amount of public safety-related service by program volunteers, both in total and broken out by individual services for which such information is wanted. [Output or INT?] Source: Accomplishment Reports or project progress reports.
7-17
Comments
• Data collection on end beneficiary outcomes poses substantial challenges for Senior Corps because of the intentionally decentralized nature of its operations. Historically, the Corporation has steered away from proscribing specific indicators and has allowed grantees, projects and stations to develop their own indicators and instruments for measuring success. Through Project STAR and Programming for Impact, the Corporation has provided information, resources and myriad options for outcome measurement. In order to produce indicators that can be aggregated for Senior Corps, a more prescriptive approach would be necessary--narrowing options for acceptable indicators for certain widely practiced activities such as tutoring and mentoring.
• Many of the indicators in the Accomplishment Reports report the number of clients served.
As we suggested earlier, for such indicators we recommend modifying the data collection procedure to add the qualification that a minimum amount of volunteer service should be provided in order to be included in the count. Each indicator will need to be reviewed to determine the minimum level. Different services may warrant at least somewhat different levels of service.
• Some indicators derived from the Accomplishment Reports appear to be meaningful outcome indicators and we have included those above. These are indicators that are likely to provide immediate value to end beneficiaries, such as better homes, food, and transportation. We have included in the above lists some other “service-provided” indicators labeled “Output or INT?” We suggest that if included in major Corporation reports that they be put into a separate table, one labeled something like “Amount of Services Provided.”
• Most Accomplishment Report indicators seem, at best, to be low-level intermediate outcome indicators that express the quantity and type of service provided to end beneficiaries (and many people will consider such indicators to be outputs rather than outcomes). The accomplishment indicators, however, appear to be of interest to Congress and others. They indicate the amount and type of activity as well as the large numbers of people involved in providing and receiving services. We recommend that such counts be retained by the Corporation.
• Many of the outcome indicators we have listed above include a phrase such as “significant
amount of service by program volunteers.” The purpose is for the Corporation to attempt to ensure that reported outcome counts represent meaningful levels of input by Corporation-
7-18
sponsored volunteers. Outcomes resulting from very small amounts of effort should normally not be included in the counts.
• Some services can be provided by more than one Senior Corps Program (and by an AmeriCorps Program as well). For example, the same home-care outcome indicators are included in the RSVP and SC programs. Such outcome indicators can be aggregated across programs.
• The level of detail included in the Accomplishments Reports is clearly unnecessary for most
Corporation external reports. However, some of our interviewees indicated that at least some members of Congress found the detailed Accomplishment Reports of interest and impressive and so probably should be continued to be externally reported.
• To date, the Corporation has not provided common, central automated data collection tools for its Senior Corps grantees to use as may now be contemplated with the electronic grants reporting system. Historically, sponsors have acquired their own systems for tracking volunteers and project performance data to the extent they have them. The decentralization is such that even for fiscal operations, each sponsor produces its own paychecks to compensate FGP and SCP volunteers. There is no centralized roster or database of active volunteers and active stations. The Accomplishment Reports and many of the evaluation studies make mention of the difficulty in obtaining accurate and current rosters for Senior Corps. The Corporation, as it enhances its collection of outcome data will need to provide relevant software and assistance to help grantees collect, enter, and tabulate their outcome data. This is discussed further in Section 1.
• In future collection of Accomplishment Reports, care should be taken to address and control
for potential double counting of hours and beneficiaries. The most recent Accomplishment Reports for RSVP and SCP caution that when broken into categories the number of hours and clients served may add to more than the total number of hours and clients served.50 This occurs in the accomplishment reporting process because volunteers may provide multiple services to the same client. Instructions should direct the information provider to report hours and clients using only one service code which best fits the services delivered or to divide the hours among service categories.
• The “2003 Budget Estimate and Performance Plan” reports on “community customer
satisfaction” for the three Senior Corps programs.51 The data were obtained through telephone interviews of individuals representing community organizations where volunteers were placed, many of whom actually supervised the volunteers. We have not included these indicators in the above list of recommended indicators because such reports can be
50 Aguirre International (2001), RSVP Program Accomplishment Report: October 1999 – September 2000, p. 12 and Aguirre International (2001), Senior Companion Program Accomplishment Report: October 1999 – September 2000, p. 8. 51 Their source is the Community Customer Satisfaction Survey, Research Triangle Institute, January 2002.
7-19
perceived, particularly by external readers, as being biased because the respondents are receiving resources from the Corporation. The Corporation may, however, want to periodically obtain such information for internal use. In any case, we recommend that the title of such reports be reworded to make it clear to users of the data that the respondents are representatives of assisted agencies or volunteer supervisors, and do not represent an unbiased sample of persons in the community. Regular surveys would better focus on end beneficiaries to obtain their perceptions of benefits and satisfaction with services.
• All the recommendations provided throughout this section relate to annual (or more frequent) data collection. The Corporation will need to complement the annual outcome information by periodic special studies, ad hoc program evaluations, to obtain more in-depth information on its programs.

7-20
Exhibit 7-1 Mail Survey Questions on
Family Counseling 1. How satisfied were you with the way you and your counselor got along with each other?
__Very satisfied __Satisfied __No particular feelings one way or the other __Somewhat dissatisfied __Very dissatisfied
2. Since you started at the agency, has there been any change for better or worse in the way
the members of your family get along with each other? Would you say you now get along:
__Much better __Somewhat better __Same __Somewhat worse __Much worse
3. How do you feel the service provided by the agency influenced the changes you have
reported?
__Helped a great deal __Helped some __Made no difference __Made things somewhat worse __Made things much worse
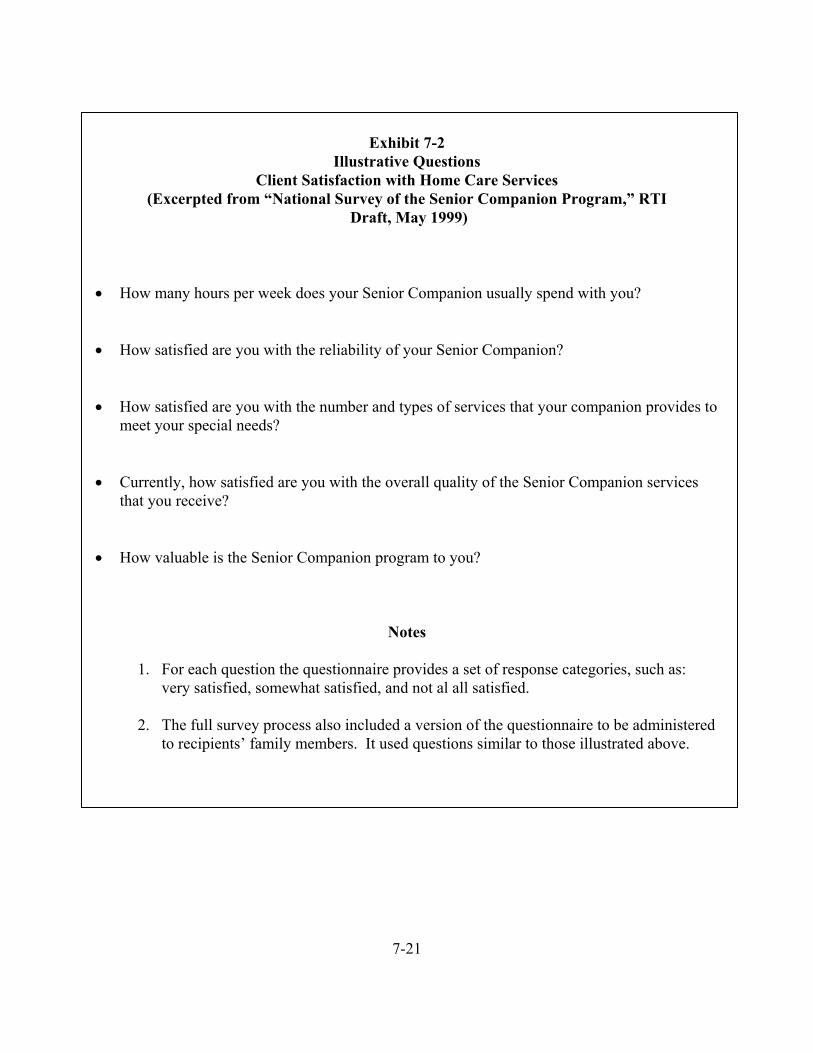
7-21
Exhibit 7-2
Illustrative Questions Client Satisfaction with Home Care Services
(Excerpted from “National Survey of the Senior Companion Program,” RTI Draft, May 1999)
• How many hours per week does your Senior Companion usually spend with you? • How satisfied are you with the reliability of your Senior Companion? • How satisfied are you with the number and types of services that your companion provides to
meet your special needs? • Currently, how satisfied are you with the overall quality of the Senior Companion services
that you receive? • How valuable is the Senior Companion program to you?
Notes
1. For each question the questionnaire provides a set of response categories, such as: very satisfied, somewhat satisfied, and not al all satisfied.
2. The full survey process also included a version of the questionnaire to be administered
to recipients’ family members. It used questions similar to those illustrated above.
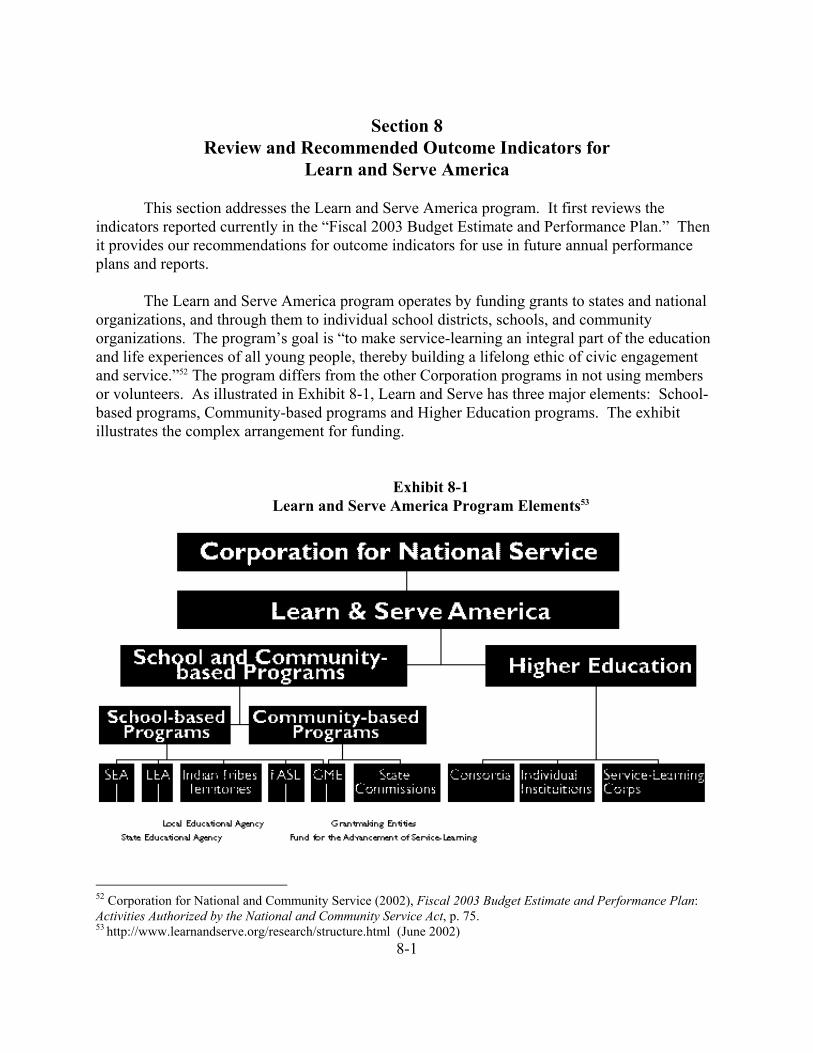
8-1
Section 8 Review and Recommended Outcome Indicators for
Learn and Serve America
This section addresses the Learn and Serve America program. It first reviews the indicators reported currently in the “Fiscal 2003 Budget Estimate and Performance Plan.” Then it provides our recommendations for outcome indicators for use in future annual performance plans and reports.
The Learn and Serve America program operates by funding grants to states and national organizations, and through them to individual school districts, schools, and community organizations. The program’s goal is “to make service-learning an integral part of the education and life experiences of all young people, thereby building a lifelong ethic of civic engagement and service.”52 The program differs from the other Corporation programs in not using members or volunteers. As illustrated in Exhibit 8-1, Learn and Serve has three major elements: School-based programs, Community-based programs and Higher Education programs. The exhibit illustrates the complex arrangement for funding.
Exhibit 8-1 Learn and Serve America Program Elements53
52 Corporation for National and Community Service (2002), Fiscal 2003 Budget Estimate and Performance Plan: Activities Authorized by the National and Community Service Act, p. 75. 53 http://www.learnandserve.org/research/structure.html (June 2002)
8-2
Review of Indicators Reported by the Corporation
This section reviews the performance indicators reported by the Corporation for Learn
and Serve America in its “Fiscal 2003 Budget Estimate and Performance Plan.” As noted in Section 2 and 3, the presentation of indicators is not grouped in a way that
enables easy review of the indicators. Within each program’s section, separate tables are used to present performance indicators drawn from different sources. The indicators in these tables are not grouped by objective nor by category of indicator (such as intermediate or end outcome). Another area of confusion is that the indicators presented are not all drawn from the same time period. In addition, the dates for the data provided are not always supplied. In some cases the date of the source of the data, such as an evaluation report, is supplied but not the time period when the data were collected. These reporting practices result in a presentation that is confusing for the reader to follow.
The use of the term “participant” within Learn and Serve is another potential source of
confusion for report readers. Learn and Serve uses different definitions for participants in its Higher Education versus School–based programs. For School-based programs, participant refers to the student who participates in the sponsored service-learning. In Higher Education programs, participants include faculty, staff and community members who are engaged in the service-learning as well as students.54
The “Fiscal 2003 Budget Estimate and Performance Plan” provides two tables that identify
performance indicators: • A ‘Performance Indicator” table for the period fiscal1999-2003. This table provides
annual performance data on each indicator for three prior fiscal years and goals for those indicators for two future years. This is the only category of indicator for which the Corporation projects future performance targets.
• A table of “outcomes” drawn from contractor ad hoc evaluation studies. This table provides selected indicators from various evaluation reports. The information presented is not always quantitative, and the reports and the data on which they are based may be several years older than the time period of the Budget Estimate and Performance Plan.
54 Corporation for National and Community Service (2002), Fiscal 2003 Budget Estimate and Performance Plan: Activities Authorized by the National and Community Service Act, pp 86-87.
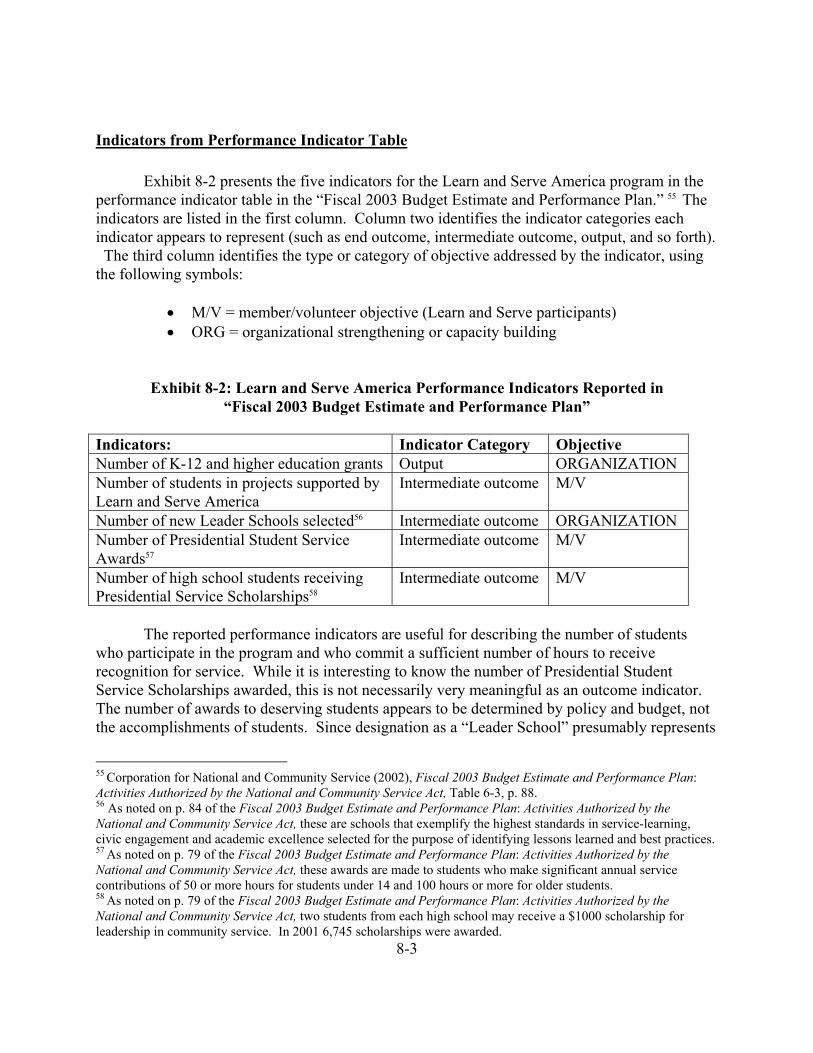
8-3
Indicators from Performance Indicator Table
Exhibit 8-2 presents the five indicators for the Learn and Serve America program in the performance indicator table in the “Fiscal 2003 Budget Estimate and Performance Plan.” 55 The indicators are listed in the first column. Column two identifies the indicator categories each indicator appears to represent (such as end outcome, intermediate outcome, output, and so forth). The third column identifies the type or category of objective addressed by the indicator, using the following symbols:
• M/V = member/volunteer objective (Learn and Serve participants) • ORG = organizational strengthening or capacity building
Exhibit 8-2: Learn and Serve America Performance Indicators Reported in
“Fiscal 2003 Budget Estimate and Performance Plan”
Indicators: Indicator Category Objective Number of K-12 and higher education grants Output ORGANIZATION Number of students in projects supported by Learn and Serve America
Intermediate outcome M/V
Number of new Leader Schools selected56 Intermediate outcome ORGANIZATION Number of Presidential Student Service Awards57
Intermediate outcome M/V
Number of high school students receiving Presidential Service Scholarships58
Intermediate outcome M/V
The reported performance indicators are useful for describing the number of students who participate in the program and who commit a sufficient number of hours to receive recognition for service. While it is interesting to know the number of Presidential Student Service Scholarships awarded, this is not necessarily very meaningful as an outcome indicator. The number of awards to deserving students appears to be determined by policy and budget, not the accomplishments of students. Since designation as a “Leader School” presumably represents
55 Corporation for National and Community Service (2002), Fiscal 2003 Budget Estimate and Performance Plan: Activities Authorized by the National and Community Service Act, Table 6-3, p. 88. 56 As noted on p. 84 of the Fiscal 2003 Budget Estimate and Performance Plan: Activities Authorized by the National and Community Service Act, these are schools that exemplify the highest standards in service-learning, civic engagement and academic excellence selected for the purpose of identifying lessons learned and best practices. 57 As noted on p. 79 of the Fiscal 2003 Budget Estimate and Performance Plan: Activities Authorized by the National and Community Service Act, these awards are made to students who make significant annual service contributions of 50 or more hours for students under 14 and 100 hours or more for older students. 58 As noted on p. 79 of the Fiscal 2003 Budget Estimate and Performance Plan: Activities Authorized by the National and Community Service Act, two students from each high school may receive a $1000 scholarship for leadership in community service. In 2001 6,745 scholarships were awarded.
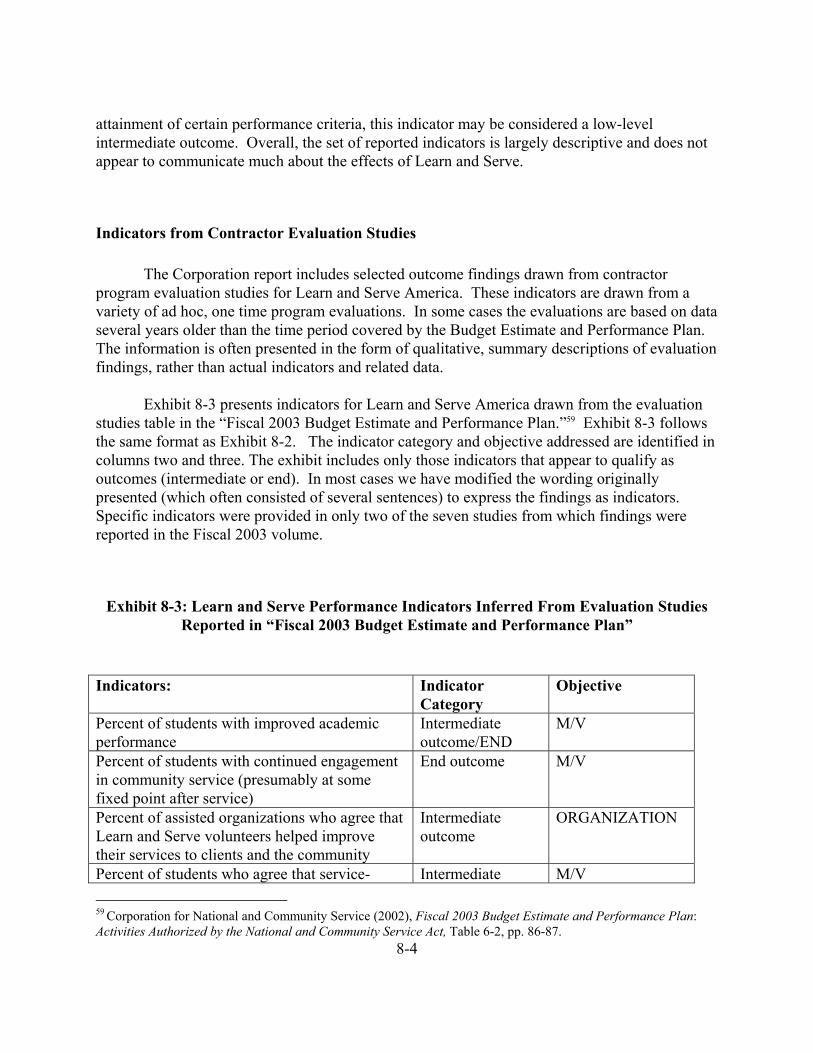
8-4
attainment of certain performance criteria, this indicator may be considered a low-level intermediate outcome. Overall, the set of reported indicators is largely descriptive and does not appear to communicate much about the effects of Learn and Serve.
Indicators from Contractor Evaluation Studies
The Corporation report includes selected outcome findings drawn from contractor program evaluation studies for Learn and Serve America. These indicators are drawn from a variety of ad hoc, one time program evaluations. In some cases the evaluations are based on data several years older than the time period covered by the Budget Estimate and Performance Plan. The information is often presented in the form of qualitative, summary descriptions of evaluation findings, rather than actual indicators and related data.
Exhibit 8-3 presents indicators for Learn and Serve America drawn from the evaluation studies table in the “Fiscal 2003 Budget Estimate and Performance Plan.”59 Exhibit 8-3 follows the same format as Exhibit 8-2. The indicator category and objective addressed are identified in columns two and three. The exhibit includes only those indicators that appear to qualify as outcomes (intermediate or end). In most cases we have modified the wording originally presented (which often consisted of several sentences) to express the findings as indicators. Specific indicators were provided in only two of the seven studies from which findings were reported in the Fiscal 2003 volume.
Exhibit 8-3: Learn and Serve Performance Indicators Inferred From Evaluation Studies Reported in “Fiscal 2003 Budget Estimate and Performance Plan”
Indicators: Indicator
Category Objective
Percent of students with improved academic performance
Intermediate outcome/END
M/V
Percent of students with continued engagement in community service (presumably at some fixed point after service)
End outcome M/V
Percent of assisted organizations who agree that Learn and Serve volunteers helped improve their services to clients and the community
Intermediate outcome
ORGANIZATION
Percent of students who agree that service- Intermediate M/V 59 Corporation for National and Community Service (2002), Fiscal 2003 Budget Estimate and Performance Plan: Activities Authorized by the National and Community Service Act, Table 6-2, pp. 86-87.
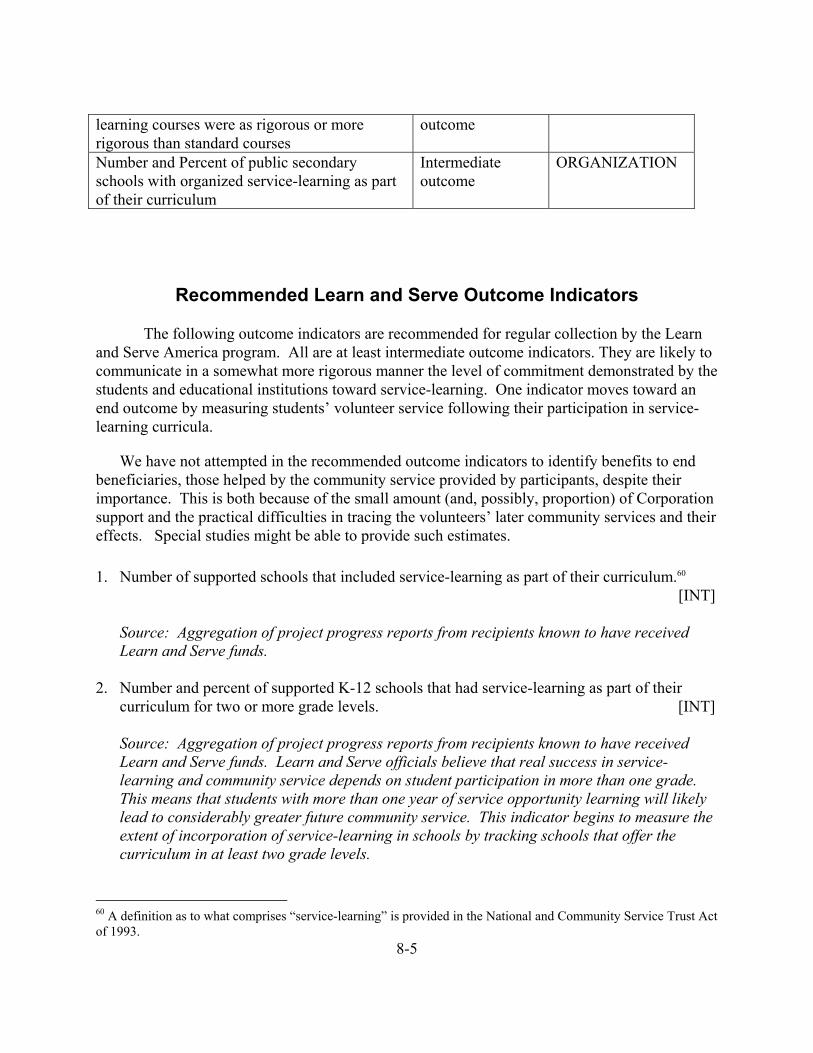
8-5
learning courses were as rigorous or more rigorous than standard courses
outcome
Number and Percent of public secondary schools with organized service-learning as part of their curriculum
Intermediate outcome
ORGANIZATION
Recommended Learn and Serve Outcome Indicators The following outcome indicators are recommended for regular collection by the Learn and Serve America program. All are at least intermediate outcome indicators. They are likely to communicate in a somewhat more rigorous manner the level of commitment demonstrated by the students and educational institutions toward service-learning. One indicator moves toward an end outcome by measuring students’ volunteer service following their participation in service-learning curricula.
We have not attempted in the recommended outcome indicators to identify benefits to end beneficiaries, those helped by the community service provided by participants, despite their importance. This is both because of the small amount (and, possibly, proportion) of Corporation support and the practical difficulties in tracing the volunteers’ later community services and their effects. Special studies might be able to provide such estimates. 1. Number of supported schools that included service-learning as part of their curriculum.60
[INT]
Source: Aggregation of project progress reports from recipients known to have received Learn and Serve funds.
2. Number and percent of supported K-12 schools that had service-learning as part of their curriculum for two or more grade levels. [INT]
Source: Aggregation of project progress reports from recipients known to have received Learn and Serve funds. Learn and Serve officials believe that real success in service-learning and community service depends on student participation in more than one grade. This means that students with more than one year of service opportunity learning will likely lead to considerably greater future community service. This indicator begins to measure the extent of incorporation of service-learning in schools by tracking schools that offer the curriculum in at least two grade levels.
60 A definition as to what comprises “service-learning” is provided in the National and Community Service Trust Act of 1993.
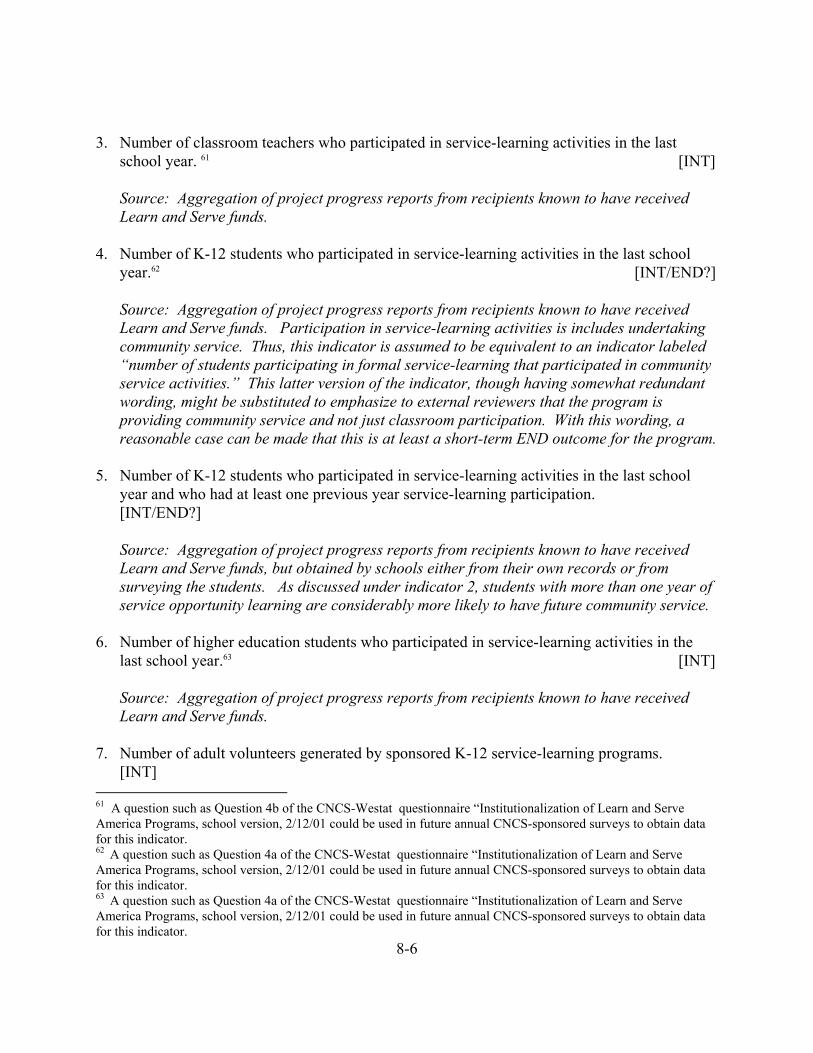
8-6
3. Number of classroom teachers who participated in service-learning activities in the last
school year. 61 [INT]
Source: Aggregation of project progress reports from recipients known to have received Learn and Serve funds.
4. Number of K-12 students who participated in service-learning activities in the last school
year.62 [INT/END?]
Source: Aggregation of project progress reports from recipients known to have received Learn and Serve funds. Participation in service-learning activities is includes undertaking community service. Thus, this indicator is assumed to be equivalent to an indicator labeled “number of students participating in formal service-learning that participated in community service activities.” This latter version of the indicator, though having somewhat redundant wording, might be substituted to emphasize to external reviewers that the program is providing community service and not just classroom participation. With this wording, a reasonable case can be made that this is at least a short-term END outcome for the program.
5. Number of K-12 students who participated in service-learning activities in the last school year and who had at least one previous year service-learning participation. [INT/END?]
Source: Aggregation of project progress reports from recipients known to have received Learn and Serve funds, but obtained by schools either from their own records or from surveying the students. As discussed under indicator 2, students with more than one year of service opportunity learning are considerably more likely to have future community service.
6. Number of higher education students who participated in service-learning activities in the last school year.63 [INT]
Source: Aggregation of project progress reports from recipients known to have received Learn and Serve funds.
7. Number of adult volunteers generated by sponsored K-12 service-learning programs.
[INT] 61 A question such as Question 4b of the CNCS-Westat questionnaire “Institutionalization of Learn and Serve America Programs, school version, 2/12/01 could be used in future annual CNCS-sponsored surveys to obtain data for this indicator. 62 A question such as Question 4a of the CNCS-Westat questionnaire “Institutionalization of Learn and Serve America Programs, school version, 2/12/01 could be used in future annual CNCS-sponsored surveys to obtain data for this indicator. 63 A question such as Question 4a of the CNCS-Westat questionnaire “Institutionalization of Learn and Serve America Programs, school version, 2/12/01 could be used in future annual CNCS-sponsored surveys to obtain data for this indicator.

8-7
Source: Aggregation of project progress reports from recipients known to have received Learn and Serve funds.
8. Number of students in supported schools who had been in a Learn and Serve supported
program who undertook at least X hours of unpaid community service activities that were not linked to the organized curriculum, during the twelve months after the school year in which they participated in student learning activities. [END]
Source: Annual surveys of students approximately twelve months after the school year in which they participated in student learning activities. Preferably, the schools that received Learn and Serve funds would administer the survey. The count would include those students who in this later twelve-month period were participating in another service-learning program.
9. Percent of supported students who reported that the Learn and Serve supported program had
greatly increased their interest in community service and their intention to provide volunteer community service in the future. [INT]
Source: the same annual surveys of students used to obtain data for the preceding outcome indicator.
Comments on the Indicators 1. Indicators 1-6 are primarily intermediate outcome indicators. The source of data would be
the schools receiving Learn and Serve funding. Schools/school districts might be asked by the Corporation to report this information annually as part of Learn and Serve grants, or the Corporation could contract for annual surveys of at least a representative sample of recipient schools.
2. For each of these indicators, the Corporation should develop guidelines, with assistance form
the field, as to what can be considered a minimum level of participation for the schools, teachers, and student to be included in the counts. This is particularly important for indicators 3-7.
3. Indicator 8 indicates that students actually provided volunteer community service following participation in earlier service-learning activities. Depending on ones own perspective, these can be considered either intermediate or end outcomes. The indicator will likely require surveys of participants of these school activities, unless the schools themselves arrange to collect the data from participants. The value of “X” would need to be determined by the Corporation with input from the field. Learn and Serve could consider offering a small amount of additional funding to organizations that will track the volunteer efforts of its participants.
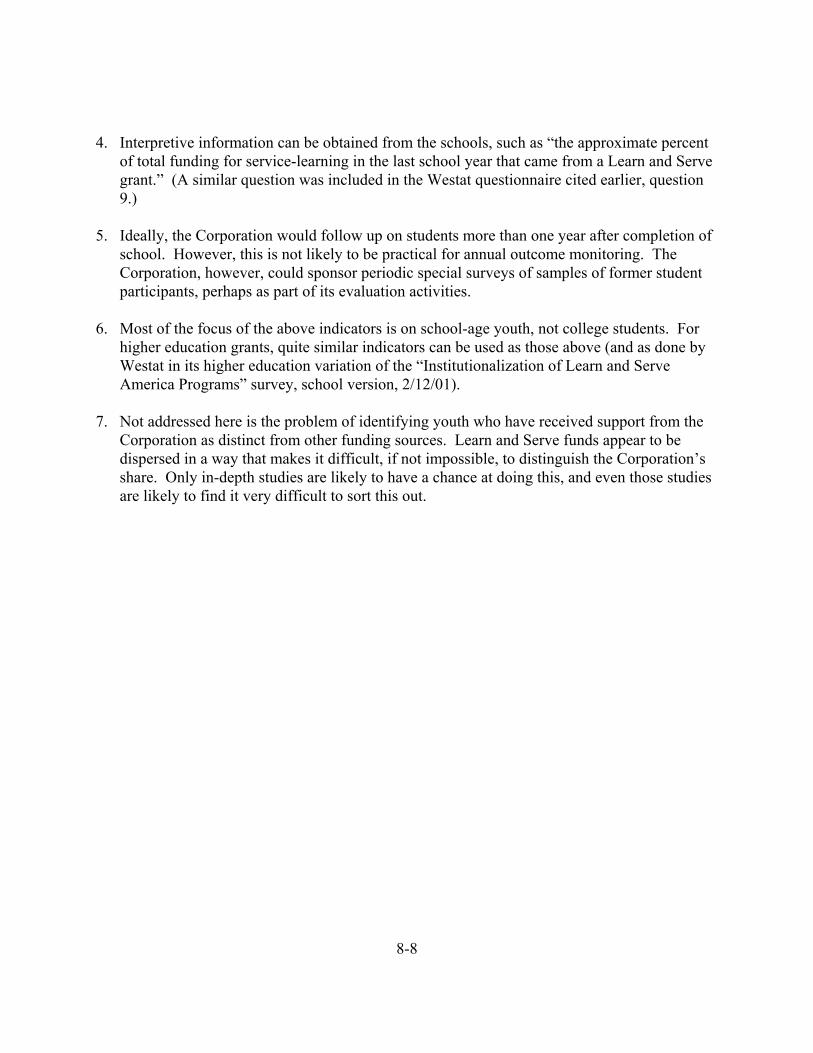
8-8
4. Interpretive information can be obtained from the schools, such as “the approximate percent
of total funding for service-learning in the last school year that came from a Learn and Serve grant.” (A similar question was included in the Westat questionnaire cited earlier, question 9.)
5. Ideally, the Corporation would follow up on students more than one year after completion of
school. However, this is not likely to be practical for annual outcome monitoring. The Corporation, however, could sponsor periodic special surveys of samples of former student participants, perhaps as part of its evaluation activities.
6. Most of the focus of the above indicators is on school-age youth, not college students. For
higher education grants, quite similar indicators can be used as those above (and as done by Westat in its higher education variation of the “Institutionalization of Learn and Serve America Programs” survey, school version, 2/12/01).
7. Not addressed here is the problem of identifying youth who have received support from the
Corporation as distinct from other funding sources. Learn and Serve funds appear to be dispersed in a way that makes it difficult, if not impossible, to distinguish the Corporation’s share. Only in-depth studies are likely to have a chance at doing this, and even those studies are likely to find it very difficult to sort this out.