Embed Size (px)
Citation preview
INTRODUCTIONGovernment has agreed on 12 outcomes as a key focus of workbetween now and 2014. Each outcome has a limited number ofmeasurable outputs with targets. Each output is linked to a set ofactivities that will help achieve the targets and contribute to theoutcome. Each of the 12 outcomes has a delivery agreementwhich in most cases involve all spheres of government and a rangeof partners outside government. Combined, these agreementsreflect governments delivery and implementation plans for itsforemost priorities.
This delivery agreement is a negotiated charter which reflectsthe commitment of the key partners involved in the directdelivery process to working together to undertake activitieseffectively and on time to produce the mutually agreed-uponoutputs which in turn will contribute to achieving outcome 10.
The delivery agreement provides detail to the outputs, targets,indicators and key activities to achieve outcome 10, identifiesrequired inputs and clarifies the roles and responsibilities of thevarious delivery partners. It spells out who will do what, by whenand with what resources. The outcomes apply to the whole ofgovernment and are long term. While the delivery agreementmay contain longer term outputs and targets, it also includesoutputs and associated targets that are realisable in the next 4 years.
It also considers other critical factors impacting on theachievement of outcome 10, such as the legislative andregulatory regime, the institutional environment and decision-making processes and rights, the resources needed and re-allocation of resources where appropriate.
The normal budgeting process will continue to determine theallocations to Departments. These Delivery Agreements will be animportant input into the budgeting process for 2011/2012 and thefinal budget allocations will affect the order of priorities andphasing of the implementation of this Delivery Agreement. For 2012/13 and subsequently, the annual revisions to theDelivery Agreement will be timed to link with the budget processso that the revised Delivery Agreement is signed off after thebudget is signed off.
This Delivery Agreement will be reviewed annually in the light oflearning by doing and monitoring and evaluation (M&E) findings.Accordingly it will be refined over time and become moreinclusive of the relevant delivery partners.
Delivery agreement for outcome 10
1
CC OO NN TT EE NN TT SSINTRODUCTION 1
1. HIGH LEVEL PROBLEM STATEMENT 1
2. IDENTIFICATION OF DELIVERY PARTNERS XX
3. LINKING OUTPUTS TO OUTCOME 10 XX3.1 Output 1: Enhanced quality and quantity of
water resources XX3.2 Output 2: Reduced greenhouse gas emissions,
climate change impacts and improved air/atmospheric quality XX
3.3 Output 3: Sustainable environmental management XX3.4 Output 4: Protected biodiversity. XX
4. ACTIONS NEEDED TO ACHIEVE EACH OUTPUT XX4.1 Output 1: enhanced quality and quantity of water
resources XX4.2 Output 2: reduced greenhouse gas emissions,
climate change impacts and improvedair/atmospheric quality XX
4.3 Output 3: sustainable environmental management XX4.4 Output 4: protected biodiversity. XX
5. INDICATORS, BASELINES AND TARGETS FOR OUTCOME. XX
6. SYNOPSIS OF KEY ACTIVITIES XX
7. RISKS, CONSTRAINTS AND MITIGATION STRATEGIES XX
8. GOVERNANCE AND REPORTING ARRANGEMENTS XX
9. SIGNATORIES & IMPLEMENTING PARTNERS XX
APPENDIX A: RESULTS CHAIN XX
APPENDIX B: HIGH LEVEL IMPLEMENTATION PLAN BY SUB-OUTPUT XX
APPENDIX C: PROVINCIAL DELIVERABLES XXKWAZULU-NATALFREE STATEWESTERN CAPEMPUMALANGALIMPOPONORTH WEST
For further information, please contact: Department of Environmental Affairs Private Bag X447 Pretoria 0001 Republic of South Africa
Email: [email protected] [email protected]
Web site: 8http://www.environment.gov.za
ACTS OF PARLIAMENT
• The National Environmental Management Act (NEMA), 1998,(Act No. 107 of 1998), which establishes the concepts ofparticipatory, cooperative and developmental governance inenvironmental management. It establishes principles forenvironmental management and provides for structures tofacilitate these;
• The National Environmental Management Amendment Act,2003 (Act No. 46 of 2003), which deals with compliance andenforcement and provides for environmental managementinspectors (EMIs);
• The National Environmental Management Amendment Act,2004 (Act No. 8 of 2004), which streamlines the process ofregulating and administering the impact assessment process.Chapter 5 of the act lays down procedures with which theMinister or MEC, as the case may be, must comply beforelisting or delisting an activity;
• The National Environmental Management: Protected AreasAmendment Act, 2009 (Act 15 of 2009), which provides for theassignment of national parks, special parks and heritage sitesto South African National Parks; makes provision for flightcorridors and permission of the management authority to flyover a special national park, national park or heritage site; andprovides for the winding up and dissolution of South AfricanNational Parks;
• The National Environment Laws Amendment Act, 2008 (ActNo. 44 of 2008), which amends the National Environmental
Management Act, 1998, so as to clarify an uncertainty in theact; authorises the Minister of Water Affairs and Forestry todesignate persons as environmental management inspectors;provides for environmental management inspectors to beregarded as peace officers as contemplated in the CriminalProcedure Act, 1977; and amends the National EnvironmentalManagement: Air Quality Act, 2004, so as to substituteSchedule 1 to that Act;
• The National Environmental Management Amendment Act,2008 (Act No. 62 of 2008), which empowers the Minister ofMinerals and Energy to implement environmental matters interms of the National Environmental Management Act, 1998, inso far as it relates to prospecting, mining, exploration orrelated activities; aligns environmental requirements in theMineral and Petroleum Resources Development Act (MPRDA),Act 28 2002, with NEMA (1998), by providing for the use of one environmental system and by providing for environmentalmanagement programmes; and further regulatesenvironmental authorisations;
• The National Environment Laws Amendment Act, 2009 (ActNo. 14 of 2009), which amends the Atmospheric PollutionPrevention Act, 1965, so as to adjust the penalties provided forin the said act, the Environment Conservation Act, 1989, so asto adjust the penalties provided for in the said act, theNational Environmental Management: Air Quality Act, 2004, soas to provide for a processing fee to review a license, and toinclude directors or senior managers in a juristic person for thecriteria for a fit and proper person;
Delivery agreement for outcome 10
3
1. HIGH LEVEL PROBLEM STATEMENTSection 24 of the Constitution stipulates that all South Africanshave a right to an environment that is not harmful to their healthor well-being and to have the environment protected for thebenefit of present and future generations. The Constitutioncompels us to take reasonable steps to prevent pollution andecological degradation, promote conservation and secureecologically sustainable development and use of naturalresources. Given the Constitutional imperative the vision is: a South Africa where environmental assets and naturalresources are valued, protected and continually enhanced.
As with the rest of the world, South Africa is not immune to theglobal environmental crisis. The country faces a number ofcurrent and emerging issues related to climate change, requiringintensive mobilisation to effectively respond to these challenges.Sustainable development and efforts to mitigate climate changeand/or adapt to its impacts, in general, have a mutuallybeneficial relationship. Efforts to address climate change haveco-benefits that contribute to sustainable development goals,and development that is sustainable, creates conditions thatfacilitate and enhance efforts to address climate change. Due to the nature of its impacts on environmental, social andeconomic systems Climate Change can no longer be regarded asan environmental challenge but rather a sustainable developmentchallenge.
South Africa needs to respond to declining groundwater reserves,water quality and the integrity of our ecosystems in the contextof growing demand for water. The country has a rich diversity of
natural assets and is considered one of the world’s most bio-diverse countries. Although South Africa makes up just 2% ofthe global land area it is home to almost 10% of the world’s plantsand 7% of reptiles, birds and mammals. Sadly much of ourterrestrial ecosystems and over 80 percent of our river systemsare threatened. South Africa ranks among the world’s 20 biggestgreenhouse gas emitters and it is the highest emitter within theAfrican Continent. Unaddressed, these issues could seriouslyundermine South Africa’s ability to pursue a sustainabledevelopment path. Spatial planning and spatial developmentdecisions are still fragmented and there is still a need to addresscompeting land uses and ensure that industry and infrastructuredevelopment programmes ensures the long term sustainability ofnatural systems and the environment.
This summary suggests the need to address four critical problems:
1. Water is unsustainably used and the quality and quantity ofwater resources is in decline;
2. Reduce green house gas emissions, prepare strategies to copewith projected climate change impacts and reverse the risingtrend in relation to the release of pollutants into theatmosphere;
3. Proper and better management of our environment; and
4. Protection of our biodiversity.
In addressing the imperatives for sound environmentalmanagement and protection of natural assets, the following interalia; pieces of legislation were enacted to give effect to theconstitutional rights of South Africans:
2
Delivery agreement for outcome 10

• Sea Shores Act, 1935, (Act No. 21 of 1935), which declares thePresident to be the owner of the sea-shore and the sea withinSouth Africa’s territorial water and regulate the granting ofrights and alienation thereof.
• Sea Birds and Seals Protection Act, 1973 (Act No. 46 of 1973),which provides for control over certain islands and rocks forthe protection and conservation of seabirds and seals;
• Dumping at Sea Control Act, 1980 (Act No. 73 of 1980), whichregulates the control of dumping substances at sea;
• Sea Fishery Act, 1988 (Act No. 12 of 1988). Most of the powersin terms of this Act had been transferred to the Minister ofAgriculture, Forestry and Fisheries. The Minister only retainspowers in terms of section 38 of the Act;
• Antarctic Treaties Act, 1996 (Act No. 60 of 1996), whichprovides for the implementation of certain treaties relating toAntarctica. The treaty is primarily concerned with the regulationof activities in Antarctica, including territorial claims, researchand strict environmental protection in general and theprotection of certain identified species such as seals;
• Marine Living Resources Act, 1998 (Act No. 18 of 1998), whichdeal with the long-term sustainable utilisation of marine livingresources. Most of the powers and functions in terms of this Acthad been transferred to the Minister of Agriculture Forestryand Fisheries. The Minister of Water and Environmental Affairsonly retained functions pertaining to the Marine ProtectedAreas, certain regulatory powers that relates to the protectionof the marine environment;
• Prince Edward Islands Act, 1948 (Act No. 43 of 1948), whichprovide for the confirmation of the annexation to the Union ofSouth Africa of the Prince Edward Islands, and for theadministration, government and control of the said islands;
• The Minerals and Petroleum Resources Development Act, 2002(Act 28 of 2002), which inter alia aims to ensure ecologicallysustainable development of mineral and petroleum resourcesand to promote economic and social development;
• National Water Act, 1998 (Act No. 36 of 1998), which providesthat the National Government is the public trustee of theNational’s water resources and acting through the Minister ofWater & Environmental Affairs, has the power to regulate theuse, flow and control of all water in the Republic; and
• Water Services Act, 1997 (Act No 108 of 1997) Section 156,read in conjunction with Part B of Schedule 4 of theConstitution of the Republic of South Africa (Act 108 of 1996)vests the executive authority and responsibility to support andstrengthen the capacity of municipalities to manage their ownaffairs, to exercise their powers and to perform theirfunctions.
REGULATIONS
ENVIRONMENT CONSERVATION ACT, 1989 (ACT NO. 73 OF 1989)• Waste Tyre Regulations, 2008, which regulate the management
of waste tyres by providing for the regulatory mechanisms.
Delivery agreement for outcome 10
5
HIGH LEVEL PROBLEM STATEMENT (continued)
• The World Heritage Convention Act, 1999 (Act No. 49 of1999), which provides for the cultural and environmentalprotection and sustainable development of, and relatedactivities in a world heritage site;
• The National Environmental Management: Biodiversity Act,2004 (Act No. 10 of 2004), which significantly reforms SouthAfrica’s laws regulating biodiversity. Its sets out themechanisms for managing and conserving South Africa’sbiodiversity and its components; protecting species andecosystems that warrant national protection; the sustainableuse of indigenous biological resources; the fair and equitablesharing of benefits arising from bioprospecting, includingindigenous biological resources; and the establishment of theSouth African National Biodiversity Institute;
• National Environmental Management: Protected Areas Act,2003 (Act No. 57 of 2003), which provides for the protectionand conservation of ecologically viable areas. It furtherprovides for the establishment of a national register ofprotected areas and the proclamation and management ofthese areas;
• The National Environmental Management: Protected AreasAmendment Act, 2004 (Act No. 31 of 2004), which provides fora national system of protected areas in South Africa as part ofa strategy to manage and conserve the country’s biodiversity.A significant part of this act is that the state is appointed asthe trustee of protected areas in the country;
• The National Environmental Management: Air Quality Act,2004 (Act No. 39 of 2004), which reforms the law regulating air
quality in order to protect the environment by providingreasonable measures for the prevention of pollution andecological degradation and for securing ecologicallysustainable development; and provides for national norms andstandards regulating air quality monitoring;
• The National Environmental Management: Integrated CoastalManagement Act, 2008 (Act No. 24 of 2008), which establishesa system of integrated coastal and estuarine management in theRepublic; ensures that development and the use of naturalresources within the coastal zone is socially and economicallyjustifiable and ecologically sustainable; determines theresponsibilities of organs of state in relation to coastal areas;controls dumping at sea and pollution in the coastal zone; andgives effect to South Africa’s international obligations in relationto coastal matters;
• The National Environmental Management: Waste Act, 2008(Act No. 59 of 2008), which reforms the law regulating wastemanagement in order to protect health and the environmentby providing reasonable measures for the prevention ofpollution; provides for national norms and standards forregulating the management of waste by all spheres ofgovernment; and provides for the licensing and control ofwaste management activities;
• South African Weather Service Act, 2001 (Act No. 8 of 2001),which established the South African Weather Service;determined its objects, functions and method of work, themanner in which it is to be managed; and governs andregulates its staff matters and financial affairs;
4
Delivery agreement for outcome 10

• Regulations for the management of the Pondoland MarineProtected Area, which provides for zonation and control ofactivities in the marine protected area;
• Regulations for the management of the Bird Island MarineProtected Area, which provides for zonation and control ofactivities in the marine protected area;
• Regulations for the management of the Still Bay MarineProtected Area, which provides for zonation and control ofactivities in the marine protected area;
• Regulations to manage boat-based whale-watching andprotection of turtles, which promotes the economic growth ofthe boat-based whale-watching industry and to redress pastracial and gender discrimination in this industry; provides forcontrol of the boat-based viewing of whales and dolphins, sothat these activities may take place in a manner that does notthreaten the safety of individuals or the wellbeing of thewhales and dolphins; and provides for control over the viewingof turtles to protect and minimise any adverse impact on turtles;
• Regulations for the management of white shark cage diving,which promotes the economic growth of the white sharkindustry and redresses past racial and gender discrimination inthis industry; provides for control over diving to view whitesharks or the boat-based viewing of white sharks, so that theseactivities may take place in a manner that does not threatenthe safety of divers or the wellbeing of the white sharks; andprovides for control over the number of white shark cage divingoperations in order to manage any adverse impact on whiteshark behaviour and to protect white sharks;
• National Water Act, 1998 (Act No. 36 of 1998), Regulation havebeen published to ensure that South Africa’s water resourcesare protected used developed, conserved, management andcontrolled in a sustainable and equitable manner for thebenefit of all persons; and
• Water Services Act, 1997 (Act No 108 of 1997), Regulationshave been published which ensure that the rights of access tobasic water supply and basic sanitation by setting nationalstandards and norms.
Delivery agreement for outcome 10
7
HIGH LEVEL PROBLEM STATEMENT (continued)
NATIONAL ENVIRONMENTAL MANAGEMENT ACT, 1998 (ACT NO.107 OF 1998)• Environment Impact Assessment (EIA) Regulations, which
regulate procedures and criteria, as contemplated in Chapter5 of NEMA, for the submission, processing, consideration anddecision of applications for environmental authorisations ofactivities and for matters pertaining thereto. The Minister hasjust published draft revised EIA Regulations, under section24(5) of the NEMA, 1998, for public comment;
• Regulations controlling the use of vehicles in the coastal zone:The original regulations were made in 2001 and were amendedin 2004. The amended regulations centre on imposing a generalduty of care on persons using 4x4 vehicles in the coastal zone,as well as a general prohibition on the use of 4x4 vehicles inthe coastal zone unless it is a permissible use.
NATIONAL ENVIRONMENTAL MANAGEMENT: PROTECTED AREASACT, 2003 (ACT NO. 57 OF 2003)• Regulations for the proper Administration of the Knysna
Protected Environment.
NATIONAL ENVIRONMENTAL MANAGEMENT: BIODIVERSITY ACT,2004 (ACT NO. 10 OF 2004)• Threatened or Protected Species (TOPS) Regulations, which
further regulate the permit system set out in Chapter 7 of theBiodiversity Act. Previously South Africa used to haveprovincial ordinances for the different provinces, and these arethe first national regulations. The aim is to make TOPS the onlyregulations in South Africa for indigenous species;
• Regulations for bioprospecting, access and benefit-sharing:While the Biodiversity Act was promulgated in 2004, theregulations relating to Chapter 6 (Bioprospecting, Access andBenefit-sharing) and Chapter 7 (Permit System) came into forceon 1 April 2008. These regulations further regulate the permitsystem set out in Chapter 7 of the Biodiversity Act in so far asthat system applies to bioprospecting involving any indigenousbiological resources; set out the contents of, and therequirements and criteria for benefit-sharing and materialtransfer agreements; and protect the interest of stakeholders.
SEA SHORE ACT, 1935 (ACT NO. 21 OF 1935)• General regulations for the management of the seashore
including the removal of sand, rock etc from the seashore andthe charging of fees.
DUMPING AT SEA CONTROL ACT, 1980 (ACT NO. 73 OF 1980)• Provides for the process for permitting dumping activities
at sea.
ANTARCTIC TREATIES ACT, 1996 (ACT NO. 60 OF 1996)• Prohibits the catching of any Antarctic marine living resource
protected by conventions without a permit. This is both anenvironmental and fisheries regulation.
MARINE LIVING RESOURCES ACT, 1998 (ACT NO. 18 OF 1998)• Regulations for the management of the Table Mountain Marine
Protected Area, which provides for zonation and control ofactivities in the marine protected area;
• Regulations for the management of the Aliwal Shoal MarineProtected Area, which provides for zonation and control ofactivities in the marine protected area;
6
Delivery agreement for outcome 10

OUTPUT 3: SUSTAINABLE ENVIRONMENTAL MANAGEMENT
Coordinating Departments: Department of EnvironmentalAffairs; Agriculture, Forestry and Fisheries; Mineral Resources;Cooperative Governance and Traditional Affairs; Public Works;Rural Development and Land Reform.
Core Departments: Water Affairs; 9 Provincial EnvironmentDepartments (including representation from Provincial RuralDevelopment and Agriculture, Forestry and Fisheries); Energy;Rural Development and Land Reform; Human Settlements;Science and Technology; Trade and Industry; EconomicDevelopment; Treasury; Health; Transport; Social Development;Sport and Recreation (Environmental awareness) ; Arts andCulture (Environmental awareness); Basic Education and HigherEducation (Environmental Education); Extended MINTECHWorking Group 3.
Public Entities: SALGA; Cities Network; SANBI; SANPARKS; WorldHeritage Management authorities; Provincial conservationagencies; SAWS; CSIR; WRC; ARC.
OUTPUT 4: PROTECTED BIODIVERSITY
Coordinating Departments: Department of EnvironmentalAffairs; Agriculture, Forestry and Fisheries; National Treasury.
Core Departments: Water Affairs; 9 Provincial EnvironmentDepartments (including representation from Provincial RuralDevelopment and Agriculture, Forestry and Fisheries); RuralDevelopment and Land Reform; Science and Technology(Biotechnology); Cooperative Governance and Traditional Affairs;Economic Development; Extended MINTECH Working Group 1;StatsSA.
Public Entities: SALGA; Cities Network; SANBI; SANPARKS; WorldHeritage Management authorities; Provincial conservationagencies; CSIR; ARC.
Delivery agreement for outcome 10
9
2. IDENTIFICATION OF DELIVERY PARTNERSThe Management of the environment and protection of naturalresources is a concurrent function. The monitoring andcoordination of implementation of deliverables as outlined in thedelivery agreement annexes is coordinated through theIntergovernmental Relations intergovernmental mechanism(MINTECH/MINMEC) extended to include key departments, publicentities and other partners that contribute to the achievement ofoutputs. The executive Implementation Forum (extended MINMEC)and technical Implementation Forum (Headcom/extendedMINTECH) are therefore used. The MINTECH working groups arealigned per output to coordinate the output activities and report tothe technical Implementation Forum that makes recommendationsto the executive Implementation Forum.
The key partners that contribute to the achievement of outcome10 are identified per output. These partners are drawn fromnational, provincial departments, local government and publicentities. The following tables reflects partners contributing toeach of the outputs, and it should be noted that while care wastaken to ensure that all key implementing partners are reflected,the; list should not be viewed as exhaustive.
OUTPUT 1: ENHANCED QUALITY AND QUANTITY OF WATERRESOURCES
Coordinating Departments: Departments of Water Affairs; RuralDevelopment and Land Reform; Cooperative Governance andTraditional Affairs; Human Settlements.
Core Departments: Environmental Affairs (Conservation andpollution management); Energy (Industrial water quality andquantity); Agriculture, Forestry and Fisheries (Sector growth
strategy); Mineral Resources (Mining and water quality &quantity); Science and Technology (Diversification of waterresources technology and innovation); Trade and Industry(Industrial water quality and quantity); Public Works; Treasury;Economic Development (Water quantity to grow economy).
Public Entities: SALGA; Cities Network; SAWS; CSIR; WRC; ARC;SANBI.
OUTPUT 2: REDUCED GREENHOUSE GAS EMISSIONS, CLIMATECHANGE IMPACTS AND IMPROVED AIR/ATMOSPHERIC QUALITY
Coordinating Departments: Departments of EnvironmentalAffairs; Economic Development; Transport; Energy; Science andTechnology; Trade and Industry; Treasury.
Core Departments: Water Affairs; 9 Provincial EnvironmentDepartments (including representation from Provincial RuralDevelopment and Agriculture, Forestry and Fisheries); RuralDevelopment and Land Reform; Agriculture, Forestry andFisheries; Human Settlements (Health impacts); CooperativeGovernance and Traditional Affairs (Coordination with localgovernment on Air/atmospheric quality); Science and Technology(Climate change, green industries technology and innovation);Trade and Industry (Industrial Air/atmospheric quality, GreenIndustries); StatsSA; Health (Health impacts); Extended MINTECHWorking Group 2; Air Quality Officer’s Forum and extendedIntergovernmental Committee on Climate Change (IGCCC).
Public Entities: SALGA; Cities Network; SANBI; Council of Geo-Science; SAWS; CSIR; WRC; ARC; SANERI; National Centre forCarbon Capture and Storage; National Energy Efficiency Agency (NEEA).
8
Delivery agreement for outcome 10

rehabilitated should increase from 95 to 100 per year.Furthermore, action needs to be taken to increase the numberof wetlands under formal protection from the current level of19 as well ensuring that the number of rivers with healthyecosystems increases significantly; and
c) Regulation of water quality: % of water works plants assessedand monitored from 94% to 100% by 2014 and % waste watertreatment works (WWTW) assessed and monitored from 53% to100% by 2014.
3.2 OUTPUT 2: REDUCED GREENHOUSE GAS EMISSIONS,CLIMATE CHANGE IMPACTS AND IMPROVED AIR/ATMOSPHERICQUALITY
Climate change is considered to be amongst, if not the, mostserious threat to humanity and sustainable development withadverse impacts expected on food and water security, economicactivity, human health, physical infrastructure and naturalresources. These impacts will seriously undermine efforts toachieve sustainable development and the attainment ofMillennium Development Goals particularly in developingcountries which are both the most vulnerable, and the leastequipped to deal with climate change. Conversely, addressingclimate change by mitigating greenhouse gas emissions andbuilding resilient communities will make a major contributiontowards achieving a sustainable society.
The following sub-outputs are critical:
a) Reduction of Emission of CO2: To mitigate the catastrophicimpacts of climate change it is imperative that through the
necessary financial support and capacity building from theinternational climate change regime; we reduce total CO2
emissions by 34% from the “Business As Usual” scenario by 2020and 42% by 2025;
b) Reduction of Atmospheric pollutants: In order to ensure theprogressive realisation of everyone’s Right to air that is notharmful to health and well-being, it is imperative that there isa progressive reduction in atmospheric pollutants to levels thatresult in full compliance with Ambient Air Quality Standards;
c) Renewable Energy Deployment: To begin reducing SouthAfrica’s footprint with regard to greenhouse gas emission, thepercentage of power generation from renewable sourcesshould increase from 2 000GW/hours to 10 000GW/hours by 2014;
d) Adapting to the impacts of climate change: To better copewith the unpredictable and severe impacts of climate change,adaptation plans for key sectors of the economy must bedeveloped (Water, Forestry, Biodiversity, Tourism, Agriculture,Human Settlements, Land & Social Development, Fisheriesdevelopment, Rural livelihoods); and
e) Energy Efficiency: Mobilise the public, business and otherplayers to act responsibly and save energy both as collectivesand in their individual capacity, including through a mandatorynational energy efficiency programme. Industrial andcommercial buildings have particular potential for efficiencyimprovements. The Energy Efficiency will improve fromcurrent baseline to 12% by 2014.
Delivery agreement for outcome 10
11
3. LINKING OUTPUTS TO OUTCOME 10To ensure that Environmental assets and natural resources arewell protected and continually enhanced, the key partners willfocus on the following four key outputs and related sub-outputs:
OUTPUTS SUB-OUTPUTS
1. Enhanced quality • Water demand and quantity of • Water resource protection water resources • Regulation of water quality
2. Reduced greenhouse • Reduction of Emission of CO2gas emissions, climate • Reduction of Atmospheric change & improved pollutantsair/atmospheric • Renewable Energy Deploymentquality • Adapting to the impacts of
climate change• Energy Efficiency
3. Sustainable • Restoration & rehabilitation ofenvironmental management degraded ecosystems
• Deforestation & forestmanagement
• Less and better managed waste• Management of environmental
impacts from mining and relatedactivities
• Sustainable land use management
4. Protected biodiversity • Expansion of the conservationestate
• Reduced climate change impactson biodiversity
• Protected ecosystem & species • Valuing the ecosystem services • Protection of agricultural land
A NUMBER OF OUTCOME 10 SIGNATORIES WILL ALSO BECONTRIBUTING TO THE REALISATION OF THE FOLLOWINGOUTCOMES:
Outcome 8: Sustainable Human Settlements and ImprovedQuality of Household Life;
Outcome 9: Responsive, Accountable, Effective and EfficientLocal Government System;
Outcome 4: Decent Employment through Inclusive EconomicGrowth;
Outcome 11: Create a better South Africa and contribute to abetter and safer Africa and World; and
Outcome 7: Vibrant, equitable and sustainable rural communitieswith food security for all.
3.1 OUTPUT 1: ENHANCED QUALITY AND QUANTITY OF WATERRESOURCES
Water demand is expected to rise by 52% over the next 30 yearswhile supply of water is likely to decline if current trends due toleakage from old and poorly maintained municipal infrastructureand the loss of wetlands persist. This would make the prospect ofwater shortage a frightening reality in the near future. To enablemore efficient management of our water resources, the followingsub-outputs are critical:
a) Water demand: Reduction of water loss from distributionnetworks from current levels of approximately 30% to 15% by2014 coupled with encouraging users to save water;
b) Water resource protection: To preserve groundwater reservesand prevent further loss of wetlands, the number of wetlands
10
Delivery agreement for outcome 10

challenge, while at the same time the DMR synchronouslyprioritises and implements, where possible (with a limitedbudget) rehabilitation measure aimed at stabilising thesemining operations to present continuing pollution of air, waterand soil; and
e) Sustainable land use management: Integration ofenvironmental considerations with spatial planning remains amajor challenge to achieving sustainable development. Ensuregreater alignment of sustainability criteria in all levels ofintegrated and spatial planning, as well as in projectformulation.
3.4 OUTPUT 4: PROTECTED BIODIVERSITY
Keeping our biodiversity intact is vital for sustainable economicgrowth and development. This ensures ongoing provision ofecosystem services such as the production of clean air, clean waterthrough good catchment management and prevention of erosionand carbon storage to counteract global warming. Considerationshould be given to limit further loss of natural habitat inthreatened ecosystems by more deliberate preservation andconservation of protected areas. In this regard the following sub-outputs are critical:
a) Expansion of the conservation estate: Land protection andrehabilitation by increasing the percentage of land mass underconservation from 6% to 9% and the percentage of coastlinewith partial protection to increase from 12% to14%;
b) Reduced climate change impacts on biodiversity: To developclimate change adaptation frameworks for major biomes &aquatic ecosystems (desert, succulent karoo, fynbos, nama
karoo, grassland, savanna, forest and Albany thicket) & aquatic(freshwater, estuaries, marine and coastal ecosystems);
c) Protected ecosystem & species: Consistent with the draftNational Biodiversity Framework, the percentage of coastlineprohibiting fishing and any form of harvesting that aredetrimental to the benthic environment are prohibited shouldbe maintained at 9%, and clear targets set for the number of kilometres of coast, rivers and lakes to be cleaned andrehabilitated.
To preserve our biodiversity and protect ecosystems andspecies the number of species under formal protection shouldincrease and the proportion of species threatened withextinction should decline from current levels of 6,5%;
d) Valuing the ecosystem services: Inadequate understanding ofthe value for ecosystem and biodiversity services means thatthe benefits we derive from these goods (often public innature) are usually neglected or undervalued in decision-making. This in turn leads to actions that not only result inbiodiversity loss, but also impact on human well-being; and
e) Protection of agricultural land: To protect 81% of highpotential agricultural land.
Delivery agreement for outcome 10
13
LINKING OUTPUTS TO OUTCOME 10 (continued)
3.3 OUTPUT 3: SUSTAINABLE ENVIRONMENTAL MANAGEMENT
The environment plays an essential role in determining futureopportunities and constraints for growth and development. The past development has emphasised exploitation andoptimisation of South Africa’s mineral and natural resources withlittle concern for long-term environmental impacts andsustainability. It has largely ignored constraints arising from thefinite character of non-renewable natural resources and theecological cycles that sustain renewable natural resources.
The following sub-outputs are critical:
a) Restoration & Rehabilitation of degraded ecosystems: Thehectares of land rehabilitated per year should increase from800 000ha to 3 200mha by 2014 and 160 rural developmentsites by 2014 in order to contribute to ecosystem resilience;
b) Deforestation & forest management: Net deforestation to bemaintained at not more than 5% woodlands by 2020 andprotection of indigenous forest assets be transferred toappropriate conservation and relevant agencies by 2014;
c) Less and better managed waste: Solid waste management andminimisation through improved collection and disposal andrecycling by ensuring that the percentage of households withbasic waste collection should increase from 64% to 75% by2014; percentage of landfill sites with permits increased to 80%by 2015 and that 25% percent of municipal waste gets divertedfrom landfill sites for recycling by 2012;
d) Management of environmental impacts from mining andrelated activities: Whilst the Mine Rehabilitation Fund and the
current regime around rehabilitation and closure should ensurerehabilitation and environmentally responsible closure ofmining operations, a specific challenge relates to suchrehabilitation and closure when it comes to abandoned,derelict and ownerless mines, accordingly the target for thesector to ensure the rehabilitation and closure in accordancewith an approved EMP of mines classified as abandoned,derelict and ownerless per annum. In addition, the sector willensure that new mining operations are limited in agreed areasof high environmental importance and that environmentalimpacts of mining operations (new and current) are assessed,mitigated and managed through an aligned, integrated andcoordinated regulatory system.
New and existing mining operations are required to consider SouthAfrica’s comprehensive range of legislation applying the social andeconomic sustainability of the operation including: theconservation of agricultural resources; the interim protection andrestitution of land rights to those dispossessed of their land;informal as well as communal land rights; the preferentialprocurement framework; employment equity and skillsdevelopment as well as legislation applying to competition.
A total of nine derelict and ownerless mine sites wererehabilitated during the 6 year period of the implementationof the MPRDA. The 2014 target includes finalising the strategyfor rehabilitation of derelict and ownerless mines, continuingresearch to accurately delineate the quantum of theenvironmental challenge and its inherent liability and designthe permanent solutions that are adequately responsive to the
12
Delivery agreement for outcome 10
4.1.1 OUTPUT 1: SUB-OUTPUT 1: WATER DEMAND
What will need to be done differently?
South Africa can no longer afford water losses and therefore it isimperative that the focus on water conservation and waterdemand management must be strengthened, especially as thereis a greater return on investment through water loss control andwater use efficiency. The Department of Water Affairs willprioritise the establishment of the water demand fundingfacilitation unit to provide support to municipalities in theireffort to introduce water conservation and demand management.WC/WDM measures must be implemented and properlymaintained on a sustainable basis. The cost of implementingWC/WDM measures is often less than maintenance costs. The useof the latest technologies for different sectors includingretrofitting (agriculture, mining, industry, energy and domestic)is critical. For example, providing incentives to irrigators mustalso be emphasised in order to implement more efficientirrigation systems through: linking water tariffs to assurance ofsupply; balancing weirs; removal of alien vegetation; irrigationpipelining and volumetric scheduling and pricing. Improveefficiency of effluent treatment plants (reverse osmosis). In orderto augment water supply, the following will be considered:further impoundments; desalination of sea water and groundwater; water distribution networks will have to be improved;water purification and re-use must be intensified; and, leakagesfrom existing systems will be a major focus.
4.1.2 OUTPUT 1: SUB-OUTPUT 2: WATER RESOURCEPROTECTION
What will need to be done differently?
Human societies rely on numerous services from inland watercourses, in particular wetlands. Biodiversity underpins thoseservices and the protection of these ecosystem services hasrelevance to human health, sustainable development, climatechange, poverty reduction and the attainment of variousMillennium Development Goals. The overall continuing loss ofwetlands and the biodiversity of inland water ecosystems and therapid increasing pressures from the drivers of change in theseecosystems have serious implications on the associated criticalwater related services. Such implications have significant bearingon water quality and supply for both ecosystems and the people.Furthermore, are impacts on the capacity of these systems in themitigation of hydrological extremes, resulting in significantescalation in economic, social and environmental costs.
The formal protection, restoration and rehabilitation of wetlandsneed to be strengthened through improvements in land-useplanning, land and development management policies as well asoperational and regulatory means at various scales (National,Provincial and local levels). The adoption of ecosystem basedapproaches and aggressive implementation of the open spaceplanning and management programmes will add impetus in theprotection of these systems and associated services, especially ata local government level. Such implementation will require
Delivery agreement for outcome 10
15
4. ACTIONS NEEDED TO ACHIEVE EACH OUTPUT4.1 OUTPUT 1: ENHANCED QUALITY AND QUANTITY OF WATERRESOURCES
Historically, investment by the Department of Water Affairs(DWA) in securing water supplies took the form of dams,reservoirs and accompanying infrastructure. Most of the best damsites have been developed and there is currently very littlepotential in this regard apart from some parts of KwaZulu-Nataland the Eastern Cape. With the emerging findings of thereconciliation strategies and potential water shortages in South Africa’s largest urban centre’s, the Department mustconsider other viable water supplies to serve the varying needs of each water-reliant sector. Apart from traditional augmentation schemes, other water supply options includeeffluent re-use, desalination and inter-basin transfers. Demand-supply options include water loss control and water useefficiency.
The deterioration in water quality threatens to undermine waterfor growth and development in South Africa. The cause of this isnot the lack of appropriate tools for measurement andintervention, but rather a systematic eroding of managementthrough poor institutional arrangements, insufficient capacity,convoluted decision-making requirements, lack of delegatedauthority and accountability, and poor access to the use ofincentives, disincentives and regulation to address water qualityproblems. Water quality is highly variable in rivers, wetlands,estuaries and groundwater reserves, and with uneven focus andmeasurement on these different systems (the strongest focus
being on dams). The major threats to water quality in aquaticenvironments are:
(a) mine drainage;
(b) eutrophication;
(c) municipal sewage effluent;
(d) salinisation;
(e) agrichemicals;
(f) toxic organic pollutants (including Persistent OrganicPollutants, endocrine disruptors and cyan bacterial toxins);
(g) climate change;
(h) water abstraction; and
(i) invasive alien plants.
Impact on aquatic ecosystems and loss of wetlands raised publicconcerns about the status of the quality of the country’s waterresources. Steps have been undertaken to strengthen itscompliance enforcement and monitoring as a way of clampingdown on water use behaviour that have a detrimental impact onour water resources. It has also identified that a key challenge tosustained and healthy water supplies is the poor maintenance ofwaste water treatment works (WWTW) and the Department willwork closely with core departments to ensure that adequatefunding is provided for the purposes of WWTW rehabilitation andconstruction. Lastly, the Department will take rapid and effectiveaction to address the threat the mine drainage (including AMD)poses to the immediate and long-term integrity of our water quality.
14
Delivery agreement for outcome 10
water sector to implement a regulatory framework for reducingunlawful water use and levels of pollution in South African rivers,groundwater and estuaries.
A primary thrust is to emphasise the life-sustaining importance ofwater as a scarce resource and to focus attention on the factthat, unless the continuous judicious use and effectivemanagement of our water resources is taken on board by everystakeholder, water availability threatens to become a constrainton growth and development. Our water management policies andlegislation provide for participative water governance and aspectrum of water management and water services institutions isenvisaged for the delegation of powers and responsibilities torelevant levels. Although many of these institutions have alreadybeen established, the processes for establishing these institutionsand instigating shared water management in conjunction withthem are complex. DWA has embarked on a process ofinstitutional and organisational re-alignment as well as review ofits existing water legislation. Effective water management largelydepends on the establishment and commissioning of a resoluteinstitutional framework for water management, with clear rolesand responsibilities, both in terms of water resource managementand water services. The DWA has already initiated a programmethat will create the required regulatory framework. It will beessential that institutions enhance their co-operation to affectredress, minimise duplications, and maximize efficiencies. The water sector will have to work together to ensure that these institutions have the required capacity to deliver upon their mandates.
Co-operative planning in the water sector: Within the watersector, the DWA is aiming to ensure better interaction betweenplanning initiatives around water resource management andwater services, thereby progressing South African watermanagement towards integrated water resource management.
The roles and responsibilities for the spectrum of role-players inwater resource management and water services need to be moreclearly defined. An example is the development of firm roles andresponsibilities for water services authorities with regard towater sources within their areas of jurisdiction.
Co-operative planning in other sectors/departments: There is adistinct need for institutions beyond the water sector to take duecognisance of constraints originating from the country’s scarcewater resources in planning and development decisions. To makethis possible, the Department strives to re-package the conceptsand information regarding water management in a more user-friendly way to simplify its use and understanding.
Acid Mine drainage: The establishment of a Public PrivatePartnership has been proposed by the Department of Water Affairsand in principle been accepted by representatives from the MiningHouses as well as from the other Departments represented in theGovernment Task Team (GTT). Although other options have beenconsidered, this option is the most preferred, bringing both thegovernment and mining operators together towards managing theAMD challenge. The option will enable both the current and newmining operators to continue with mining, and to contribute to theprocessing of effluent. Both government and the mine owners will
Delivery agreement for outcome 10
17
ACTIONS NEEDED TO ACHIEVE EACH OUTPUT (continued)
integrated approaches and the involvement of multiple sectorsparticularly those dealing with human settlements, developmentand planning.
The River Health Reports will be used for assessing the pattern ofwater quality. Generally water quality is good in the uplandregions and deteriorates downstream, particularly in areasaffected by mining and urban development. Because of thelongitudinal nature of rivers, poor water quality may extend fardownstream of the source of pollutants.
The implementation of resource directed measures (i.e.ecological water requirements/Reserve, the classification ofwater resources and the setting of resource quality objectives aspart of water use authorisations) also indicated a need for themassification of natural resource management programmes suchas Working for Water, Working for Wetlands, Working on Fire,Working for Woodlands and Working for Energy as these are keycomponents of the management of water quantity and quality inSouth Africa. Compliance monitoring and enforcement should beimproved through the use of legislation, incentives, disincentives,advocacy and research. Other specific interventions include:
• Commit to implementing the Ecological Water Requirements/Reserve;
• Empower water managers to understand the water balance, forwater use license applications;
• Streamline and synchronise procedures for Reservedeterminations, to facilitate the provision of Ecological Water
Requirements and RHP information at numerous nodes within acatchment;
• Invest in capacity and data that will enable sufficientlyconsidered decisions to be taken; and
• As a specific target, it is recommended that the necessaryinvestments are made in at least two catchments/sub-catchments, where resource directed measures,environmental planning and implementation are undertaken,to demonstrate the value to water for growth and developmentof securing these across the country.
4.1.3 OUTPUT 1: SUB-OUTPUT 3: REGULATION OF WATERQUALITY
What will need to be done differently?
The Department of Water Affairs, as the regulator of the watersector, will strengthen the enforcement of its regulations. From aninstitutional perspective, it will enhance and capacitate itscompliance, monitoring and enforcement unit, which will ensureenforcement of its regulations and take action against non-compliance and infringements such as illegal abstractions fromwater resources. It also undertakes to improve the monitoring ofboth raw and drinking water quality and build on public awarenesscampaigns such as the Blue Drop and Green Drop initiatives. It willaddress the current threats to water service and water qualitystandards by ensuring overall refurbishment and maintenance ofwater infrastructure in general. The Department also requires thedevelopment of co-operative institutional capacity across the
16
Delivery agreement for outcome 10
4.2.1 OUTPUT 2: SUB-OUTPUT 1: REDUCTION OF EMISSION OF CO2
What will need to be done differently?
On the eve of the UN climate negotiations in Copenhagen(December 2009), South Africa announced that it will undertakemitigation actions which will result in a deviation below thecurrent emissions baseline of around 34% by 2020 and by around42% by 2025, on provision that the necessary finance, technologyand capacity building support is received. This call for anaccelerated pace in implementing the listed NationallyAppropriate Mitigation Actions, these are:
Energy use and supply
• Improved efficiency in industry: Mandatory improvements inaggressive industrial energy efficiency, meeting the existinggoal of final energy demand reduction of 15% by 2015 andsustained efficiency beyond. This includes the current plannedEskom DSM programme, but meeting the 15% target requiresfurther action, given current levels of ambition as expressed inthe IEP;
• Efficient commercial building and public buildings:Mandatory improvements in aggressive efficiency measures innew commercial and public buildings, with new build to higherstandards and retro-fitting existing buildings, meeting theexisting goal of final energy demand reduction of 15% by 2015and sustained efficiency beyond;
• A switch from electricity to gas for domestic use: LPG gas forcooking and space heating;
• Sustainable housing development: Development of housing inmore efficient, comfortable and cleaner way, meeting theexisting goal of final energy demand reduction of 10% by 2015and sustained efficiency beyond;
• Initial lower CO2 electricity supply: Renewable energytechnologies and nuclear power; and
• Enhanced lower CO2 electricity supply: Earlier renewable andnuclear technologies.
Transport and liquid fuels
• Sustainable transport development: Passengers shift fromprivate car to public transport, freight from road to rail, andfrom domestic air to intercity rail/bus. Accelerate theimprovement in efficiency of the vehicle fleet;
• Advanced transport options: Use of hybrid vehicles to replacepetrol cars; development and greater penetration of electricvehicles, encourage use of smaller vehicles; and
• Liquid fuel supply options: Incentives for biofuels and carbontax including on synfuel production, which results in no furthercoal-to-liquid plants.
Non-energy emissions
• Reducing industrial process emissions: CCS on new synfuelplants, PFC capture in existing aluminium plant, methanecapture at existing synfuel plants and coal mines, clinkerreduction in cement;
• Waste minimisation: Waste minimisation and composting;
Delivery agreement for outcome 10
19
ACTIONS NEEDED TO ACHIEVE EACH OUTPUT (continued)
contribute to the capital infrastructure requirements for bothprocessing and pumping.
The PPP model should involve the identification of a State Agency(in existence or to be established) which will oversee thepumping and treating of acid mine drainage (AMD). This modelwill also ensure collaboration and joint operation among all thestakeholders, including current and new mines and government.All stakeholders will have specific roles and responsibilitiestowards ensuring environmental protection, sustainability andeffective management of AMD. The end use of the treated AMDwill be determined by the mentioned studies. It is necessary toexplore scientific innovations for the optimal re-use and recyclingof polluted waste water.
Output 1 Evaluation of the legislative environment
The second National Water Resources Strategy (NWRS) is beingdeveloped and will be published:
• Reviewing the National Water Act and Water Services Act; and
• Development of Integrated Water Resource Plan.
Output 1 Evaluation of the existing regulatory framework
Reviewing the existing regulatory environment and investigatingoptions for the establishment of an economic regulator for thewater sector.
Output 1 Evaluation of the existing institutional arrangements
DWA has embarked on a process of institutional andorganisational re-alignment as well as review of its existing waterlegislation.
Output 1 Evaluation of the management systems, processesand skills
There is a need to strengthen and support the Water learningacademy in terms of learnerships, internships, internal andexternal training and continuous professional development forengineering and science professionals. In order to respond to theskills challenge DWA has also coordinated a multi-stakeholderinitiative aimed at the development and implementation of afunded, co-ordinated, resourced skills development and trainingprogramme for the water sector through the Water SectorLeadership Group’s Skills Task Team. Through this Task Team theDepartment has developed a draft framework for a CoordinatedResponse to Skills and Human Resource Development needs in thewater sector which identifies the need for a water sector skillsintelligence facility that will not only be able track the nature,scope and location of the skills needs across the entire watercycle chain, but to also have the capacity to analyse thesepatterns and provide for the necessary intelligence to influencethe education, training and skills development responses of theDepartment and the water sector as a whole in the future.
Output 1 Funding framework
The current water pricing strategy and the funding model for thedevelopment of infrastructure is underway.
4.2 OUTPUT 2: REDUCED GREENHOUSE GAS EMISSIONS,CLIMATE CHANGE IMPACTS AND IMPROVED AIR/ATMOSPHERICQUALITY
18
Delivery agreement for outcome 10

1/10 of the OEL (Occupational Exposure Limit) which is 0,1 mg/m3;
Regulations 9.2.(7) of the Mine Health and Safety Act, theemployer must submit reports containing information onairborne pollutants (dust etc) which is one of the aspect ofOccupational Hygiene measurements to the Regional PrincipalInspector of Mines on forms prescribed by Chapter 21 of theMHSA. This report must be submitted within 60 days from theend of the relevant reporting period; and
Regulations 9.2.3 of the MHSA The employer must engage acompetent person to report on Occupational Hygiene riskassessment and Occupational hazards that may cause illness oradverse health effects to persons.
The health impacts of mining tailing dumps on communitiesproximal to mine operations are being quantified through aresearch project approved during the 2010/11 financial. This project is currently focused on at data collection (stage 1) with the intention of completing the research by 2013 and implementing recommendations immediatelythereafter.
Output 2 — Sub-output 2: Evaluation of the legislativeenvironment
As described above, the legislative environment for air qualitymanagement has changed dramatically over the last few years.However, in order to exploit the full potential of the AQA, variousregulations are still envisaged over the next few years. Most
important of these are likely to be regulations in respect of costrecovery for Atmospheric Emission Licensing services.Furthermore, it is also expected that there are likely to besubstantial changes to municipal air quality management by-lawsover the next few years as municipalities take on their full airquality management responsibilities.
Finally, there remains one very significant source of air pollution that is not effectively covered by the new approach to air quality management, namely, air pollution from mines andmining operations. Law reform in this area must be investigatedover the next few years especially as air pollution from mines andmining operations is significant in all of the National Air PollutionControl Priority Areas identified under the AQA.
Output 2 — Sub-output 2: Evaluation of the existing regulatoryframework
Given that the devolution of regulatory air quality managementauthority to the local spheres of government is a relatively recentevent, it is still too early to do a meaningful evaluation of thisnew regulatory framework. However, anecdotal evidence appearsto confirm that many municipalities are effectively rising to thechallenge and many, especially Metros, are already delivering abetter quality service than the national department has renderedsince 1965.
Output 2 — Sub-output 2: Evaluation of the existinginstitutional arrangements
One of the most significant air quality governance changes that hascome about with the APPA-AQA transition are the intergovernmental
Delivery agreement for outcome 10
21
ACTIONS NEEDED TO ACHIEVE EACH OUTPUT (continued)
• Improved agriculture: Reduced tillage, manure managementand improved enteric fermentation; and
• Emission reductions in LULUCF: Reduction in fire episodes insavannah and afforestation of commercial forests.
4.2.2 OUTPUT 2: SUB-OUTPUT 2: REDUCTION OF ATMOSPHERICPOLLUTANTS
What will need to be done differently?
The partners aim to significantly reduce the number ofmunicipalities with poor ambient air quality over the mediumterm period. Guidelines on air quality management planning arein place.
On 1 April 2010, the National Environmental Management: AirQuality Act (Act No. 39 of 2004, “the AQA”) came into full effectand, at the same time, the Atmospheric Pollution Prevention Act(Act No. 45 of 1965, “The APPA”) was repealed. This eventmarked the final APPA-AQA transition — a transition from anoutdated “emissions control” approach to an “outcomes” or“objectives-orientated” approach. In this regard, the AQA and itsimplementation plan, the 2007 National Framework for AirQuality Management in South Africa, heralds a very differentapproach to air quality management in that all air qualitymanagement interventions are aimed at achieving the samedesired outcome or objective, namely, ambient air quality that isnot harmful to health and well being (i.e. the “air quality”component of the Constitution’s S.24 Environmental Right).
Furthermore, another extremely important difference is thatprogress in respect of achieving this desired outcome ismeasurable, reportable and verifiable as: (i) Ambient air that is not harmful to health and well-being is defined by NationalAmbient Air Quality Standards set in terms of the AQA; (ii) A National Ambient Air Quality Monitoring Network (NAAQMN) consisting of over 90 air quality monitoring stations hasbeen established and this network is measuring and reportingquality controlled and quality assured ambient air quality data;and (iii) Data from the NAAQMN is being reported to the SouthAfrican Air Quality Information System (SAAQIS) where it iscompared to air quality standards and is reported publicly via the internet.
The final significant way in which air quality is being manageddifferently is that local authorities are now fully empowered toimplement their Constitutional “air pollution” control function.As an example of this, the AQA makes the Metropolitan andDistrict Municipalities the Licensing Authorities in respect ofAtmospheric Emission Licenses for all significant industrialsources of air pollution.
The mine health and safety summit of 2003 committed allstakeholder to achieve a zero levels of silica exposure by 2013. Tothis effect, the DMR developed legislative provisions as follow:
Regulation 9.2 (1) of the Mine Health and Safety Act (MHSA)state that the employer must ensure the occupationalexposure to health hazards of employees is maintained belowthe limit of which the limit for particulates (dust) less or equal
20
Delivery agreement for outcome 10

quality management training, this scarcity will be addressed overthe next few years.
Output 2 — Sub-output 2: Funding framework
There are indications from all spheres of government that thereis never enough budget for air quality management. However, inthe absence of any meaningful calculation of “what is enough”,the department is working on ’cost recovery’ mechanisms for, forexample, Atmospheric Emission Licensing services. However, thedepartment is also involved in the development of various ’cost-benefit’ analyses around the concept of “an investment in airquality management is an investment in public health” that maybe used by Licensing Authorities in their bids for funding. Finally,the department is also exploring new and novel ways ofimplementing the “polluter-pays” principle to ensure adequatefunding in respect of air quality governance.
4.2.3 OUTPUT 2: SUB-OUTPUT 3: RENEWABLE ENERGYDEPLOYMENT
What will need to be done differently?
Energy security has become a huge challenge in South Africa sinceapproval of the existing policy with very slim reserve margin inthe electricity sector. Electricity price has increased dramaticallymaking renewable energy more and more competitive. The 2012Government’s commitment to universal access to electricity hasbecome more and more challenging and therefore innovativeapproaches for widening access to modern energy includingrenewable energy become imperative.
The World Summit on Sustainable Development held inJohannesburg in 2002 placed the spotlight on renewable energy.
Renewable energy resources are naturally occurring, non-depletable sources of energy such as solar, wind, biomass andhydro. Less than 1% of the 200 000 GWh of electricity generatedannually in South Africa originates from renewable energysources. Renewable energy is becoming a readily tradablecommodity worldwide. Electricity produced by renewable energyIndependent Power Producers will be fed into the nationalelectricity grid or to specific users through stand-alone powerplants connected to localised or mini-grids. Growing numbers ofSouth African industries and exporters, like counterpartselsewhere in the world, need to align themselves with greenpractices in order to make their products and services moreacceptable in many international markets.
Output 2 — Sub-output 2: Evaluation of the legislativeenvironment
The Integrated Resource Plan 2 is being developed under theDepartment of Energy’s Electricity Regulation Act which plans thefuture energy mix for South Africa including a greater capacity forenergy from renewable energy sources. The Energy Act 2008provides the overall framework for the deployment of variousforms of energy including renewable energy. The New GenerationCapacity Regulations of 2009 provides the regulatory, institutionaland funding framework for the implementation of renewableenergy through the Renewable Energy feed-in Tariff (REFIT).
Delivery agreement for outcome 10
23
ACTIONS NEEDED TO ACHIEVE EACH OUTPUT (continued)
coordination and cooperation institutional arrangements. In contrastto the APPA era that was marked by intergovernmental andjurisdictional conflict, jealousies and turf-battles, the AQA hasbrought in a new era of efficient and effective air qualitycooperative governance through: (i) The Quarterly National-Provincial Air Quality Officer’s Forum (the air quality component ofthe MINTECH: Environment Working Group II — now also consideredto be the “delivery forum” for this, and all other air quality related,sub-outputs); (ii) The Quarterly Provincial-Municipal Air QualityOfficer’s Forums; and (iii) The Annual National Air QualityGovernance Lekgotla — the premier intergovernmental air qualitygovernance coordination and cooperation event.
This notwithstanding, as mentioned above, given that the devolutionof regulatory air quality management authority to the local spheresof government is a relatively recent event, it is still too early to doa meaningful evaluation of, for example, institutional arrangementswithin municipalities. However, although anecdotal evidenceappears to indicate that, at least in some cases, new municipal airquality management institutional arrangements are effective or, atleast, adequate, this is not the case nation-wide. However, asprovided for in the AQA, provinces have taken on the air qualitymanagement responsibilities of municipalities with little, if any,capacity. In terms of the department’s strategic plan, this situationwill be reviewed in the form of an air quality governance capacityaudit over the next few years.
Output 2 — Sub-output 2: Evaluation of the managementsystems, processes and skills
The Further Education and Training (FET) Colleges play a key role
in fulfilling artisanal skills for environmental management. Thereis a need to implement agreement with education institutions inrespect of formal post-graduate training as well as informal skillsenhancement of the priority areas including:
• air quality managers
• artisans and renewable energy technicians
• Atmospheric scientists, forecasters
• Landscape architectures and GIS specialists
• Engineers and conservation scientists
• Planners and data managers
It is still too early to assess the air quality management systems,processes and skills of the new Licensing Authorities at this stage.However, the national department has been very proactive overthe APPA-AQA transition period in providing manuals, templates,standard formats and training in respect of air qualitymanagement systems and processes with a view to building airquality governance skills and expertise. The department also hasan ongoing dialogue with tertiary education institutions in respectof formal post-graduate air quality management training.
However, air quality management is a relatively new disciplineand, as a result, well-qualified and experienced air qualitymanagers are currently scarce. However, this scarcity should beconsidered with the understanding that, from 1965 to 2010, only6 — 10 officials were involved, full-time, in air qualitymanagement in South Africa. Thus, although there may be acurrent scarcity of skilled air quality managers now, it is likelythat with the interventions already in place or planned for air
22
Delivery agreement for outcome 10
In addition to that, the impacts of climate change on HumanSettlements in South Africa have not been comprehensivelydocumented to cover all dimensions to include infrastructure,local economic development, and land use planning implicationsincluding disaster preparedness. An understanding ofinfrastructure deficit and future infrastructure needs; climatechange impact on local economy of municipalities; and spatialplanning adjustments emanating from climate change need to be understood.
The impacts of climate change on Tourism, the South Africaneconomy and Financial Services with particular reference toinsurance services has not received as much attention as thebiophysical aspects of climate change.
Understanding of vulnerability and adaptive capacity of selectedsectors in the South African economy, and the ability of thecountry achieve its growth targets to meet social and economictargets and development.
4.2.5 OUTPUT 2: SUB-OUTPUT 5: ENERGY EFFICIENCY
Output 2 Evaluation of the legislative environment
The 2007 National Framework for Air Quality Management inSouth Africa was updated and amended. Focus will continue to beon raising awareness regarding air quality in densely populatedperi-urban settlements i.e. cleaner fires campaign.
Output 2 Evaluation of the existing regulatory framework
Although the National Climate Change Response Strategy forSouth Africa published in September 2004 was government’s first
formal provision of policy direction for national climate changeresponses, this strategy was developed in the context of thepolicies in place at the time and not within the context of aspecific climate change policy.
The initiation of a dedicated climate change response policydevelopment process took place at the National Climate ChangeConference held in Midrand, Johannesburg, in October 2005. This conference resulted in a detailed conference statementthat, importantly, rejected climate change denialism and, amongothers, provided a detailed list of climate change interventions tobe implemented by government, business and industry, scientistsand non-governmental organisations. In terms of the governmentcommitments, two of these set the scene for the development ofa dedicated climate change policy for South Africa.
The first was the acknowledgment that climate change’s causesand impacts are cross-cutting and have implications for allelements of South Africa’s society, economy and environmentand, hence, government committed itself to the participatorydevelopment of a comprehensive, integrated, coherent andcohesive National Climate Change Response Policy.
The second was the acknowledgement of the importance of acontinued science-policy dialogue in the policy developmentprocess and, with this, a decision to “initiate a detailed scenariobuilding process to map out how South Africa can meet its Article2 commitment to greenhouse gas stabilisation whilst ensuring itsfocus on poverty alleviation and job creation.”
Delivery agreement for outcome 10
25
ACTIONS NEEDED TO ACHIEVE EACH OUTPUT (continued)
Output 2 — Sub-output 2: Evaluation of the existing regulatoryframework
The Department of Energy’s Renewable Energy White Paper of2003 sets a target of 10 000 GigaWatt hour (GWh) by 2013 to beproduced from renewable energy source. The Renewable EnergySummit of 2009 resolved to review the Renewable Energy WhitePaper Policy to assess if the target, objectives and deliverablesare being achieved, and also to determine whether the policydirection remains appropriate. The review of Renewable EnergyWhite Paper Policy will set targets for the medium term and thelong term, for renewable contribution into the energy mix. Thepolicy will be reviewed and revised in the context of energysecurity, climate change, energy poverty, approved South AfricanIntegrated Resource Plan, Electricity Regulations on NewGeneration Capacity, Renewable Energy Feed-In-Tariff and theStandard Power Purchase Agreement for IPPs.
Output 2 — Sub-output 2: Evaluation of the existinginstitutional arrangements
The New Generation Capacity Regulations provides for newinstitutions for the procurement and purchase of renewableenergy including a new Independent Systems and Market Operator(ISMO) that will approve grid connections and power purchaseagreements from renewable energy power producers which hasbeen the major blockage preventing the deployment ofrenewable energy to date.
Output 2 — Sub-output 2: Evaluation of the managementsystems, processes and skills
The deployment of government’s one million solar heaterprogramme will seek to improve the skills shortage in this sector.Skills shortage is also being addressed by SANERI and variousuniversities and institutions in the country which provides experttraining in the field of renewable energy.
Output 2, sub-output 2: Funding framework
The REFIT will be funded through the fiscus via Eskom which willeffect a pass-through to consumers. Eskom currently provides asubsidy for SWHs.
The Clean Technology Fund provides funding for SA’s firstcommercial wind farm, CSP, industrial energy efficiency, SWH andefficient transport systems. Other incentives and funding on asmaller scale is provided by the DoE and DTI.
4.2.4 OUTPUT 2: SUB-OUTPUT 4: ADAPTING TO THE IMPACTSOF CLIMATE CHANGE
What will need to be done differently?
The impacts of climate change to a number of sectors of theeconomy are not well documented, evidence being in thecoverage of the sectors in the baseline work for the Long TermMitigation Scenarios (LTMS). For example, the impacts of climatechange on human health are understood in terms of (i) physicalaspects such as heat and cold stress; (ii) disease and vectorspread such as malaria, schistosomiasis, haemorrhagic fevers; (iii)social and nutrition related diseases, such as TB, AIDS, etc are notwell understood.
24
Delivery agreement for outcome 10
climate change issues that have a strong bearing of economicgrowth and employment creation, the Infrastructure clustershall continue to provide strategic leadership on allinfrastructure related aspects of this policy and theInternational Cooperation Cluster shall continue to providestrategic leadership on international engagements as theyrelate to climate change;
Intergovernmental Committee on Climate Change (IGCCC)
Chapter 3 of the Constitution enjoins government agencies tooperate in accordance with the principles of cooperativegovernment and intergovernmental relations that it sets out.
These include that: “All spheres of government and all organsof state within each sphere must... co operate with oneanother in mutual trust and good faith by: (i) fosteringfriendly relations; (ii) assisting and supporting one another;(iii) informing one another of, and consulting one another on,matters of common interest; (iv) co ordinating their actionsand legislation with one another; (v) adhering to agreedprocedures; and (vi) avoiding legal proceedings against oneanother. Thus, the exchange of information, consultation,agreement, assistance and support are key features ofcooperative government. In order to operationalisecooperative governance in the area of climate change, theIntergovernmental Committee on Climate Change (IGCCC) hasbeen established to foster the exchange of information,consultation, agreement, assistance and support among thespheres of government with respect to climate change andgovernment’s response to climate change;
Provincial and Local Government cooperation
Climate Change impacts on all levels of Government, and avertical cooperation mechanism is required to ensureenhanced government coordination and policy alignment. TheMinisterial political (MINMEC) and technical (MINTECH)structures as set up through the Intergovernmental RelationsAct (IGR) facilitate a high level of policy and strategycoherence between the three spheres of government, andshould be used to guide Climate Change work across the 3spheres. Several technical working groups meet regularly todiscuss and advise on issues of biodiversity and heritage, impactmanagement, pollution and waste management, and planningand reporting and a working group that deals with cross-cuttingissues (i.e. Working Group 3) would coordinate climate changeresponse. These working groups feed into the MINTECH andultimately to MINMEC. South African Local GovernmentAssociation (SALGA) as a body mandated to coordinate localgovernment action will continue to coordinate vulnerability andrisk assessments in key municipalities and ensure the integrationof climate adaptation and mitigation actions into IntegratedDevelopment Plans as well as massively up-scaled publiceducation, awareness, media and information on climatechange; and
Partnering with Stakeholders
The National Committee on Climate Change (NCCC) has beenset up to ensure consultation with stakeholders from keysectors impacted by and/or impacting on climate change. The Committee advises on matters relating to national
Delivery agreement for outcome 10
27
ACTIONS NEEDED TO ACHIEVE EACH OUTPUT (continued)
In response to this latter decision, in March 2006 Cabinetmandated a national process of building scenarios of possiblegreenhouse gas emission futures, informed by the best availableresearch and information, to define not only South Africa’sposition on future commitments under international treaties, butalso to shape the nation’s climate change policy for the longer-term future. In line with the Cabinet mandate, the Long-Term Mitigation Scenario (LTMS) process was launched in mid-2006.
The focus of the LTMS process, as the name suggests, wasmitigation (i.e. reducing emissions of greenhouse gases). The thenDepartment of Environmental Affairs and Tourism (DEAT), as thefocal point for climate change in South Africa, convened andmanaged the process, which was overseen by the Inter-MinisterialCommittee on Climate Change. DEAT appointed the EnergyResearch Centre at the University of Cape Town to project managethe entire process and they, in turn, convened and contracted theprocess specialists and set up the personnel for four focussedResearch Support Units. The LTMS Scenario Building Team wasestablished in late 2006 to carry out the technical aspects of theprocess. The Scenario Building Team was made up of individualstakeholders from government, industry, labour, civil society, aswell as other relevant players. The products of the LTMS weresigned-off by the Scenario Building Team in November 2007.
The LTMS process and its products were well received by allstakeholders and are regarded as being robust and broadlysupported. It was also clear that there was consensus that the
results had been achieved through a sound technical methodologyand extensive stakeholder involvement.
In July 2008, following a discussion around various developmentsin the climate change field, including the LTMS findings, Cabinetapproved a climate change policy development process andassociated development timeframes and also provided 6 broadpolicy themes to focus the development of the policy. Insummary, the policy development plan required a high-profilelaunch of the process, the production and publication of a GreenPaper by April 2010 and a final draft policy to be submitted by theend of 2010.
Output 2 Evaluation of the existing institutional arrangements
For Climate change, the current mechanisms include:
The Inter-Ministerial Committee on Climate Change
The strategic, multi-faceted and cross-cutting nature of climatechange response activities necessitate the formation of acoordination committee at Executive (Cabinet) level, which willensure coordination of actions and alignment of all actions withnational policies and legislation. To this end, an Inter-MinisterialCommittee on Climate Change shall exercise oversight over allaspects of the implementation of this policy;
FOSAD Clusters
The national climate change response actions shall be guidedby the relevant FOSAD clusters based on the different elementsof their mandate. The Economic Sectors and EmploymentCluster shall continue to provide strategic leadership on all
26
Delivery agreement for outcome 10

development of guidelines and information resources to supportthe built and natural environments to design in and incorporatesustainability criteria into land rehabilitation programmes.Mitigation options such as restoring degraded biomes need to beconsidered, to prevent desertification, soil degradation, and lossof food security while improving water retention. Sustainableland use management is required to reduce the country’s overallcarbon balance.
Soil degradation causes increased incidence of desertification.Over 0,7 million hectares of land is degraded and left bare by soilerosion, however over 91% of South Africa comprises of dry landsmaking it susceptible to desertification. This reduces the land’sability to withstand climate variations, which in turn impacts ona community’s and ecosystems’ ability to adapt to climatechange. A sustainable approach will need to include the followingkey elements:
• Community-Based Natural Resource Management in whichstakeholders from different backgrounds share commonproblems and devise solutions. It is this grass roots approachthat is driving the Landcare programme and has been a majorreason for its success;
• Partnerships between the public, community and privatesector;
• Local Action through local economic development andemployment creation in which local Landcare groups haveaccess to technical information and advice;
• Food Security including greater productivity and poverty relief;
• Integrated & Innovative Approaches to natural resourcemanagement in which the causes of environmental andresource degradation are addressed rather than the symptoms;and
• Redress through assisting resource-poor communities fromrural areas and addressing the needs of former disadvantagedgroups.
4.3.2 OUTPUT 3: SUB-OUTPUT 2: DEFORESTATION & FORESTMANAGEMENT
What will need to be done differently?
Forestry has a marked impact on the natural environment andaffects biodiversity, water and soil resources and air quality.Apart from the obvious transformation of the natural landscapeand resultant loss of biodiversity (such as in biodiversity richgrassland habitats), the exotic tree species planted commerciallyfor forestry are known to consume vast volumes of water. This hasa severe impact on available surface and groundwater resources.Programmes such as Forest and Forest Products Certification,development and implementation of systems, procedures, andtools such as Principles, Criteria, Indicators and Standards forSustainable Forest Management, and conducting StrategicEnvironmental Impact Assessments before developing newplantations should be implemented
4.3.3 OUTPUT 3: SUB-OUTPUT 3: LESS AND BETTER MANAGEDWASTE
What will need to be done differently?
In terms of Pollution and Waste Management, the sector aims toprotect the environment so that all the people of South Africa can
Delivery agreement for outcome 10
29
ACTIONS NEEDED TO ACHIEVE EACH OUTPUT (continued)
responsibilities with respect to climate change, and inparticular in relation to the United Nations FrameworkConvention on Climate Change and the Kyoto protocol and theimplementation of climate change related activities.
The following institutional arrangements are considerednecessary for the implementation of the national climatechange policy:
• Executive national coordination;
• An organisation for Research, Development and Innovationcoordination;
• An organisation for coordinating national adaptationactions;
• An organisation for low-carbon power generationcoordination;
• An organisation for measuring, reporting and verifyingclimate change responses;
• An organisation for facilitating and promoting the use of theclean development mechanism or similar carbon trading andoff-set schemes; and
• An organisation for auditing Government policies, strategiesand legislation to ensure alignment.
However, with the implementation of the policy, and as thetransition to a climate resilient and low-carbon economy andsociety evolves, it may be appropriate to adjust theseinstitutional arrangements accordingly.
4.3 OUTPUT 3: SUSTAINABLE ENVIRONMENTAL MANAGEMENT
4.3.1 OUTPUT 3: SUB-OUTPUT 1: RESTORATION &REHABILITATION OF DEGRADED ECOSYSTEMS
What will need to be done differently?
South Africa is dominated by very shallow sandy soils with severeinherent limitations from an agricultural point of view. Only 3% ofour land is considered high potential land. If we use theinternational norm of 0.4 hectares of arable land to feed aperson, then South Africa’s 14 million hectares would feed atmost 35 million people.
The new emphasis on agriculture as an employment generatorand the re-prioritisation of land reform is directly threatened by soil degradation and the negative impact of the over-use of oil-derived chemical inputs, erosion and inappropriate irrigationpolicies.
As soil degradation becomes an increasing obstacle to growth inthe agricultural sector, there is an opportunity to develop anational capacity in soils analysis coupled to investment in know-how (e.g. organic farming, bio-dynamic farming and bio-mimicry)that could result in reduced dependency on oil-based andexpensive chemical inputs. Restoring and rehabilitating ournatural resources can stimulate rural economies, create rural andurban jobs, support carbon sinks and help maintain criticalecosystem services vital to the economy.
Effective planning and management is needed to balance social,economic and environmental pressures. For instance the
28
Delivery agreement for outcome 10
Targets for recovery, reuse and recycling of waste for all the mainwaste categories will be developed progressively over five years,in line with the development and implementation of IndWMPs asper section 30(2) of the Waste Act. The IndWMP for the paper andpackaging industry will set clear targets for the recovery, reuseand recycling of metal beverage cans, paper, plastic and glass, forwhich there are accurate baseline statistics. In relation to otherwaste streams, the initial focus of IndWMPs for these sectors willbe to establish accurate baseline data. Furthermore, as alreadyindicated, the current pricing of waste disposal must be reviewedin order to build in incentives for waste minimisation byconsumers. Further economic instruments to promote wasteminimisation will be considered by government once the pricingof waste services and disposal has been addressed.
The partnerships to promote the development of the recyclingindustry, particularly for the recycling of plastic bags, bysupporting Buyisa-e-bag, though ensuring compliance with andenforcement of the plastic bag regulations and promotingawareness about the need to recycle.
4.3.4 OUTPUT 3: SUB-OUTPUT 4: MANAGEMENT OFENVIRONMENTAL IMPACTS FROM MINING AND RELATEDACTIVITIES:
What will need to be done differently?
The Minerals Petroleum Resources development Act is progressivein its provisions for rehabilitation and especially in establishingthe Mine Rehabilitation Fund through contributions of holders ofmining related permissions, permits and rights. The effectivenesshowever of dealing with old order rights (mine closure related to
these) and rehabilitation and closure of derelict (abandoned) andownerless mines can be questioned. A strategy to addressrehabilitation and closure of historic mines that have caused andcontinue to cause environmental degradation accordingly needsto be developed and its implementation expedited.
The inability of the current spatial planning and land usemanagement system to integrate mineral development hasresulted in the latter occurring in areas where it permanentlysterilised areas of high agricultural potential or impactedseverely on sensitive and prioritised ecosystems. Mineraldevelopment priority areas should with equal standing “compete”in a spatial planning and land use management system with otherpolicy imperatives such as biodiversity protection, food security,water security, etc. The inclusion of mineral development in thespatial planning and land use management system andidentification of agreed “mining restriction areas” is accordinglyan important step in doing things differently towards achievingthe desired outcome.
Lastly, regulation of environmental management of mining islargely fragmented and takes place in an uncoordinated mannernot conducive to cooperative governance resulting in duplicationin regulatory requirements and sometimes conflicting decisions.There is a need to correct firstly through alignment andintegration of regulatory processes and secondly throughimplementation of intergovernmental forums at and between theappropriate levels of government. Such integrated andcoordinated approach to the assessment of impacts, thedesirability of the activity within the specific context and the appropriate mitigation/management measures to be
Delivery agreement for outcome 10
31
ACTIONS NEEDED TO ACHIEVE EACH OUTPUT (continued)
live and work in a safe and healthy environment. The key issuesinclude fiscal mechanisms, permitting of landfill sites, support tolocal government interventions and implementing the new WasteManagement Act.
The efficacy and sustainability of delivery of solid waste servicesis constrained by severe fiscal challenges. Municipal capital andoperating expenditures are much lower than the required levels,and operating deficits continue to expand. The structure ofcapital financing for waste services is not optimal, with relianceon grant financing, subsidy leakage to non-poor consumers, anduser charge revenues that are too low. The municipal solid wastesector is in general facing a serious fiscal situation, withoperating deficits ballooning to the point at which thesustainability of service delivery will be threatened. In thiscontext, the need to expand delivery solid waste services sectorrequires greater efficiency of fiscal mechanisms and a clearstrategy to improve operating efficiencies, secure financialsustainability of waste services delivery, and boost municipalrevenues. As a first step, municipalities will need to undertakefull cost accounting for waste services, in order to understand thelong term capital and operating costs of the service, and to beable to properly evaluate different options for levels of serviceand extension of services to unserviced areas. Secondlymunicipalities will need to develop and implement cost reflectivetariffs in order to correctly price waste service provision. Oncefinancial sustainability and operational efficiency have beenachieved in waste service provision, further amendments to tariffstructuring to promote waste minimisation can be considered.
To support the requirement for increased capital investment inthe waste sector a Solid Waste Project Development Fund willneed to be established, to ensure that capital expenditures in thesector increase, that a robust pipeline of municipal projects iscreated, and that an appropriate capital financing mix isdeveloped.
A proportion of MIG funding needs to be earmarked for bulk solidwaste infrastructure during the annual MTEC. This earmarkedportion will support infrastructure in instances where MIG fundingcannot be utilised, for example trucks and other infrastructurethat are used for ongoing service delivery in small to mediumsized municipalities.
The situation with unpermitted waste disposal sites is dire andneeds to be corrected. All waste disposal sites must be permittedin order to improve operations on the sites as well as protectcommunities. Financial resources as indicated above must bemade available in order to undertake the necessary authorisationprocesses for the licensing of waste disposal sites. The capacityof Municipalities for integrated waste management planning andoperating landfill sites must be improved. DEA will train landfillmanagers across the country every year in order to deal with thecapacity challenge. Furthermore, DEA will assist municipalities inthe preparation of Integrated Waste Management Plans.
South Africa has historically utilised land filling as the mainoption for dealing with waste. This approach must change and thefocus now must be on waste minimisation. Realistic anddefendable targets and measures for recovery reuse and recyclingof waste will be included in Industry Waste Management Plans.
30
Delivery agreement for outcome 10

plans are agreed to by sector departments and sector basedregulatory functions related to any form of land useimplemented within this framework.
The development of environmental management frameworks(EMF) in terms of Section 24 of the National EnvironmentalManagement Act and the integration of these EMFs into SDFsthrough the Land Use Management Bill could form a good basis forensuring that environmental considerations inform spatial planswhich in turn inform land use patterns. The DFA and MunicipalSystems Act currently require that an SEA be conducted to informSDFs but very little guidance is provided on what this requiredand to the satisfaction of whom.
Availability and accessibility of data to inform EMFs and SDFs andthe trade-offs to be made on land use is also a challenge thatwould need to be overcome through an enabling legislativeenvironment. The protection of data on mineral deposits throughthe Mineral petroleum Resources development and the Council ofGeo Sciences Act for example restricts the ability to developspatial plans also cognisant of mineral development imperativesthe unfortunate consequence is that the presence of a prioritymineral often overrides other land use options. An equallydifficult obstacle is the often crude nature of biodiversity dataresulting in what could be viewed as unjustified sterilisation ofland for uses other than biodiversity protection.
The necessary legislative changes should however be made toexpand the use of NEMA’s EMFs or SEAs to also address the spatialinformation requirements stemming from other acts such as Bio-regional plans, Conservation Plans, Catchment Management
Plans, Integrated Coastal Management Plans, Priority AreaManagement Plans, Mineral development priority areas, etc. Ifnot possible to integrate these into EMFs there must be anagreement on the hierarchy of the plans — for example should anEMF inform a bio-regional plan or the other way around. How canthe information obtained through these processes be integratedto inform decision-making on sustainable land use and land usepatterns.
Output 3 Evaluation of the existing regulatory framework
Regulation of land use is sector based and not executed within astrategic framework with clear sustainability targets. As is thecase for the legislative environment, regulatory functionsassociated with sustainable land use and land use patterns arefragmented, uncoordinated and unable to address sustainability.It is essential that regulatory requirements be as far as possiblealigned and implemented in a coordinated manner.
Output 3 Evaluation of the existing institutional arrangements
Spatial and integrated development planning is the responsibilityof local government and to an extent, provincial — demandsplaced on these plans and accordingly on municipalities do notonly stem from the Development Facilitation Act, the MunicipalSystems Act and in the Western Cape the Land Use PlanningOrdinances but also from sector legislation such as the Water Act,the NEM Waste Act, the NEM Air Quality Act, the NEM IntegratedCoastal Management Act, etc. Apart from the substantialfinancial burden on municipalities, satisfying all these mastersthrough different processes (only integration through stapling
Delivery agreement for outcome 10
33
ACTIONS NEEDED TO ACHIEVE EACH OUTPUT (continued)
implemented will enable informed decisions on cumulativeimpacts and would ensure joint enforcement again resulting inminimising impacts.
The sector will ensure the optimisation of social and economicbenefits from mining, the effective long-term management ofenvironmental, social and health impacts (including dealing withthe legacy of old mining sites), the extension of participation inmining, the strengthening of governance and institutions,effective beneficiation and ongoing research and technologicalinnovation.
4.3.5 SUB-OUTPUT 5: SUSTAINABLE LAND USE MANAGEMENT
What will need to be done differently?
Regulation and management of land use and land use patterns arelargely fragmented and uncoordinated. Competing and oftenconflicting mandates of government departments at all spheresresult in decisions made on land use at site level that is neitherinformed by cumulative impact or benefit, nor promotingecological, social or economic sustainability. The Highveld regionof Mpumalanga where endangered grasslands and wetlands alsoconstitute high potential agricultural land and are underpaid byrich, shallow coal fields serves as an excellent example of theneed to follow an integrated, sustainability focused approachwhen regulating and managing all land uses and land usepatterns. Given climate change imperatives, food and watersecurity and energy demands of the country, it is impossible to atsite level decide which of these land uses should be givenpreference and therefore a different, far more strategicapproach is required. Spatial and develop planning must be:
(a) Integrated and coordinated (governance system);
(b) Informed by environmental considerations (geology,geomorphology, hydrology, ecology, meteorology, etc) bothin terms of opportunities, constraints and levels ofacceptable/desired change; and
(c) Binding on all land use activities including conservation,recreation, urbanisation, energy development,infrastructure development, forestry, agriculture andmining. It cannot only serve as a guide but must determineappropriate and sustainable land use and land use patterns.
Whilst (a) and (c) above are assumed to be addressed through thepresidency’s work to revitalise the development of Land UseManagement legislation, this sub-output concentrate on ensuringthat legally binding integrated Spatial Development Plans areenvironmentally informed and implemented to ensure sustainableuse of undeveloped land.
Output 3 Evaluation of the legislative environment
The legislative environment is one of the key challenges toovercome. A recent audit of legislation regulating naturalresources and environmental management conducted by theDepartment of Environmental Affairs established that no less than80 National or Provincial Acts or Regulations regulates naturalresources and by implication land use. The work done by thepresidency in revitalising the development of a Spatial Planningand Land Use Management Act identified similar constraints. Thislegislative review process should be optimised to derive at alegislative framework where spatial and integrated development
32
Delivery agreement for outcome 10

Output 3 Funding framework
The national department currently has an allocation of R5 000 000 per annum for the development of EMFs whilst someprovinces and even municipalities also have money set aside foreither EMFs or SEAs. In addition funds have been allocatedelsewhere the development of for example bio-regional plans,conservation plans, catchment management plans, etc. It wouldbe important for all authorities that do some form of“environmental” mapping/spatial planning to get together toensure that funds are consolidated to develop integratedenvironmental spatial plans (such as EMFs) that meet all theirrequirements but optimise funds, skills and other resources.
A substantial financial consideration in terms of Output 3 is thecost of rehabilitation and closure of abandoned, derelict andownerless mines. The Department of Mineral Resources isestimate the cost.
4.4 OUTPUT 4: PROTECTED BIODIVERSITY
4.4.1 SUB-OUTPUT 1: EXPANSION OF THE CONSERVATIONESTATE
What will need to be done differently?
• Rationalisation of governance processes, reporting andinstitutions nationally and provincially for managementeffectiveness.
• Create alternative financing mechanisms for expanding theconservation estate including stewardship, co-managementand contractual park arrangements.
• Introduce monetary and fiscal incentives for conservation.
• Create new strategic partnerships to support technological andappropriate skills.
4.4.2 SUB-OUTPUT 2: REDUCED CLIMATE CHANGE IMPACTS ONBIODIVERSITY
What will need to be done differently?
Integrate climate change considerations into existing biodiversitymanagement plans/programmes for climate change adaptation.
4.4.3 SUB-OUTPUT 3: PROTECTED ECOSYSTEM & SPECIES
What will need to be done differently?
• Enhance management of threatened species throughstrengthened partnerships with stakeholders, particularlylandowners and conservation agencies, engaged in species and ecosystem management. This will ensure the developmentof a much greater number of species and ecosystemmanagement plans.
• Facilitate the development of the biodiversity sector researchstrategy to better understand and monitor status and trends ofecosystems and species requiring protection.
• Establish a national mechanism to improve the science policyinterface in order to facilitate improved decision making andpolicy support
• Increase public awareness on environmental particularly onthreatened species and ecosystems.
• Developing innovative financial mechanisms for protection ofthreatened ecosystems and species.
Delivery agreement for outcome 10
ACTIONS NEEDED TO ACHIEVE EACH OUTPUT (continued)
different plans together) of approval, monitoring and reporting iscounterproductive both in terms of service delivery and in termsof integrated environmental management towards sustainableland use. Currently IDPs and SDFs are developed by municipalitieswith very little involvement of the relevant provincial andnational departments and a “mass consideration and approval”process is followed at the end of the development process whererelevant national and provincial departments convene for a weekor two to consider all SDFs and IDPs. In order to optimise theinstrument, these arrangements would need to be fundamentallyreassessed. National and provincial sector departments shouldshare the responsibility of developing sector elements of SDFs andthe integration thereof. The institutional arrangement currentlyfollowed for some environmental management frameworks couldbe considered. These EMFs are developed at the cost of thenational or provincial environmental department but inpartnership (through an MOU) with the relevant municipality. Themunicipality then superimpose its development/growth plans onthis environmental information and trade-offs are negotiated.The result is a SDF that is agreed to between the environmentalauthority and the municipality and the “approval” process thus facilitated.
Institutional arrangements on monitoring implementation of andcompliance with SDFs are either non-existing or totally ineffective.This will need to be addressed if the environmentally informed SDFnon-existing or totally ineffective. This will need to be addressedif the environmentally informed SDF.
Output 3 Evaluation of the management systems, processesand skills
There is a need for educational institutions to align curriculumwith the current conservation imperatives. To integrate therequired skills for implementation, we need to enhancecollaboration with accreditation institutions and relevant SETAs.The Further Education and Training (FET) Colleges play a key rolein fulfilling artisanal skills for waste management, large scalegreening of open spaces- horticulturists, nurseries, opens spaceplanning engineers and planners.
Environmental Management Frameworks are relatively new and astrategy to in time role it out to all areas of the country iscurrently being developed.
The process for developing an EMF is prescribed in regulations andits success in terms of informing SDFs and land use patternsdependent on cooperative governance processes, negotiatingmemoranda of agreement and conflict resolution. Althoughgrowing, the skills base for developing EMFs and especiallynegotiating with the different role players is limited.
Monitoring and evaluation systems on the implementation andupdating of EMFs still need to be developed.
Of great importance is the development of a GIS managementsystem for the different layers of data and the integration thereofto form an EMF/SDF and to monitor transformation of landagainst. The State of Environment Reporting instrument could be considered.
34
Delivery agreement for outcome 10
Threatened or Protected Species (TOPS) Regulations, whichfurther regulate the permit system set out in Chapter 7 of theBiodiversity Act. Previously South Africa use to have provincialordinance for the different provinces, and these are the firstnational regulations. The aim is to make TOPS the onlyregulations in South Africa for indigenous species.
Regulations for bioprospecting, access and benefit sharing: Whilethe Biodiversity Act was promulgated in 2004, the regulationsrelating to Chapter 6 and Chapter 7 came into force on 1 April2008.
General regulations for the management of the seashoreincluding the removal of sand, rock etc from the seashore and thecharging fees.
• Strengthen law reform process and law enforcement.
• Coordination at national level and other departmentsespecially DAFF and DMR.
• Monitoring enforcement.
• Integrated permitting system developed.
• Prosecution of transgressors.
• Detection of illegal trade of species.
Output 4 Evaluation of the existing institutional arrangements
• National guidelines to establish bylaws to support provinces.
• Harmonise activities given human capacity, financial resourceand focal on goals delivery vehicle like (WfW), PFMA. Treasuryfor funding.
• Planning instruments i.e. IDPs.
• Elevate issues to Political forums.
• Participate as critical sector into national planning processesi.e. spatial.
Output 4 Evaluation of the management systems, processesand skills
• Effective management of protected areas.
• Accountability.
• Synergies at high level.
• Educational institutions to align curriculum with currentconservation imperatives.
• Research agenda.
• Retention of scarce skills by attractive incentives.
• OSD to cover forest ecologists and other technical expertise.
Output 4 Funding framework
• Creative funding mechanisms established.
• Sponsorships/Donor funds.
• Roll over of unutilised funds to other projects.
Delivery agreement for outcome 10
37
ACTIONS NEEDED TO ACHIEVE EACH OUTPUT (continued)
4.4.4 SUB-OUTPUT 4: VALUING THE ECOSYSTEM SERVICES
What will need to be done differently?
• Include quantification of the value of ecosystem goods andservices in environmental decision making.
• Establish mechanism to reflect the value of biodiversity inSouth Africa’s national resource accounts.
4.4.5 SUB-OUTPUT 5: PROTECTION OF AGRICULTURAL LAND
What will need to be done differently?
Protection of high potential agricultural land: Start measuringand ensure protection of 81% by 2014.
Output 4 Evaluation of the legislative environment
The partners will ensure the effective implementation of theNational Environmental Management Biodiversity Act (NEMBA) of2004, National Environmental Management: Protected Areas Actof 2003 as well as key conventions such as the Convention onInternational Trade in Endangered Species (CITES) and the UnitedNations Convention on Biodiversity.
It is further important that the sector focus on setting upinstitutional capacity and systems for Implementation ofintegrated Coastal Management Act. The partners will continueto maintain South Africa’s research presence in Antarctica, PrinceEdward and Marion Islands. In this regard we are going tocommence with the re-capitalisation of the vessel for theseresearch programmes:
• National Forest Act needs to be integrated into biodiversityplanning with respect to declaration of controlled areas;
• Alignment of National Biodiversity Act with relevant nationalenvironmental Legislation i.e. National Water Act;
• National guidelines for by-laws;
• National guidelines for biodiversity offsets;
• Guidelines for fiscal incentives;
• Guidelines for land use planning; and
• Policy science interface with society (evidence based scienceto inform policy).
Legislative changes required to achieve the output
• Implementation frameworks overlap — cross-sectoral andharmonising approach in minimising duplication.
• National Fire Act to be cross referenced to the DisasterManagement Act.
• Review of Public Entities mandates to consider broader naturalresource management.
Output 4 Evaluation of the existing regulatory framework
Regulations exist for the proper Administration of the KnysnaProtected Environment.
Regulations controlling the use of vehicles in the coastal zone:The original regulations were made in 2001 and were amended in2004. The amended regulations centre on imposing a general dutyof care on persons using 4X4 vehicles in the coastal zone as wellas a general prohibition on the use of 4X4 vehicles in the coastalzone unless it is a permissible use.
36
Delivery agreement for outcome 10

8. GOVERNANCE AND REPORTING ARRANGEMENTSOutcome 10 implementation is coordinated using the existingintergovernmental mechanism (MINTECH/MINMEC) extended toinclude key departments and public entities and other partnersthat contribute to the achievement of outputs.
MEETINGS SCHEDULE
Output 2 Output 3 Output 4
Extended MINTECH Working Extended ExtendedGroup 2, Air Quality Officer’s MINTECH MINTECH Forum and extended Working Working Intergovernmental Committee Group 3 Group 1on Climate Change (IGCCC)
09 &10 Sep 10 23 July 2010 07 September
16 Sep 2010 2010
Technical Implementation Forum (Headcom and ExtendedMINTECH):
09 July 2010
10 September 2010
05 November 2010
Executive Implementation Forum (Extended MINMEC):
08 July 2010
30 September 2010
02 December 2010
Delivery agreement for outcome 10
39
5. INDICATORS, BASELINES AND TARGETS FOR OUTCOME
6. SYNOPSIS OF KEY ACTIVITIES
7. RISKS, CONSTRAINTS AND MITIGATION STRATEGIES
Appendix A provide more detail on the indicators, baselines and targets for outcome 10 outputs/sub-outputs.
Appendix A provide more detail on each outcome 10 partner’s contribution and commitments to outputs and sub outputs (i.e. roles andresponsibilities are described).
Appendix A provides more detail on risks, constraints and mitigation strategies for each output.
38
Delivery agreement for outcome 10

MINISTERS MEC’S PARTNERS
Minister of Public Enterprises MEC for Agriculture and Rural Development North West Parks and (Eastern Cape) Tourism Board
Minister of Science and Technology MEC for Agriculture, Environmental Affairs and Limpopo Tourism andRural Development (Kwazulu Natal) Parks Board
Minister of Transport South African Energy Research Institution
Minister of Public Works South African National Parks
South African Weather Service
Water Research Commission
South African Weather services
South African National Biodiversity Institute
Delivery agreement for outcome 10
41
9. SIGNATORIES & IMPLEMENTING PARTNERS
MINISTERS MEC’S PARTNERS
Minister of Cooperative Governance and MEC for Agriculture, Rural development and Council of Geo-ScienceTraditional Affairs Land Administration (Mpumalanga Province)
Minister of Agriculture, Forestry MEC for Economic Development, Environment South African Cities Networkand Fisheries and Tourism (Limpopo Province)
Minister of Higher Education MEC for Environmental Affairs and Nature South African LocalConservation (Northern Cape) Government Association
Minister of Human Settlements MEC for Agriculture, Land Reform and Rural Cape NatureDevelopment (Northern Cape)
Minister of Arts and Culture MEC for Agriculture, Conservation, Environment Agricultural Research Counciland Rural Development (North West)
Minister of Trade and Industry MEC for Agriculture and Rural Development Centre for Science and(Gauteng Province) Industrial Research
Minister of Economic Development MEC for Department of Agriculture (Limpopo) Eastern Cape Parks Board
Minister of Energy MEC for Finance, Economic Development and Indalo YethuEnvironmental Affairs (Eastern Cape)
Minister of Finance MEC for Economic Development, Tourism and iSimangaliso Wetlands Environmental Affairs (Limpopo) Park Authority
Minister of Mineral Resources MEC for Department of Agriculture (Western Cape) KwaZulu-Natal Wildlife
Minister of Rural Development and MEC for Department of Environmental Affairs & Mpumalanga Tourism and Land Reform Development Planning ( Western Cape) Parks Agency
40
Delivery agreement for outcome 10
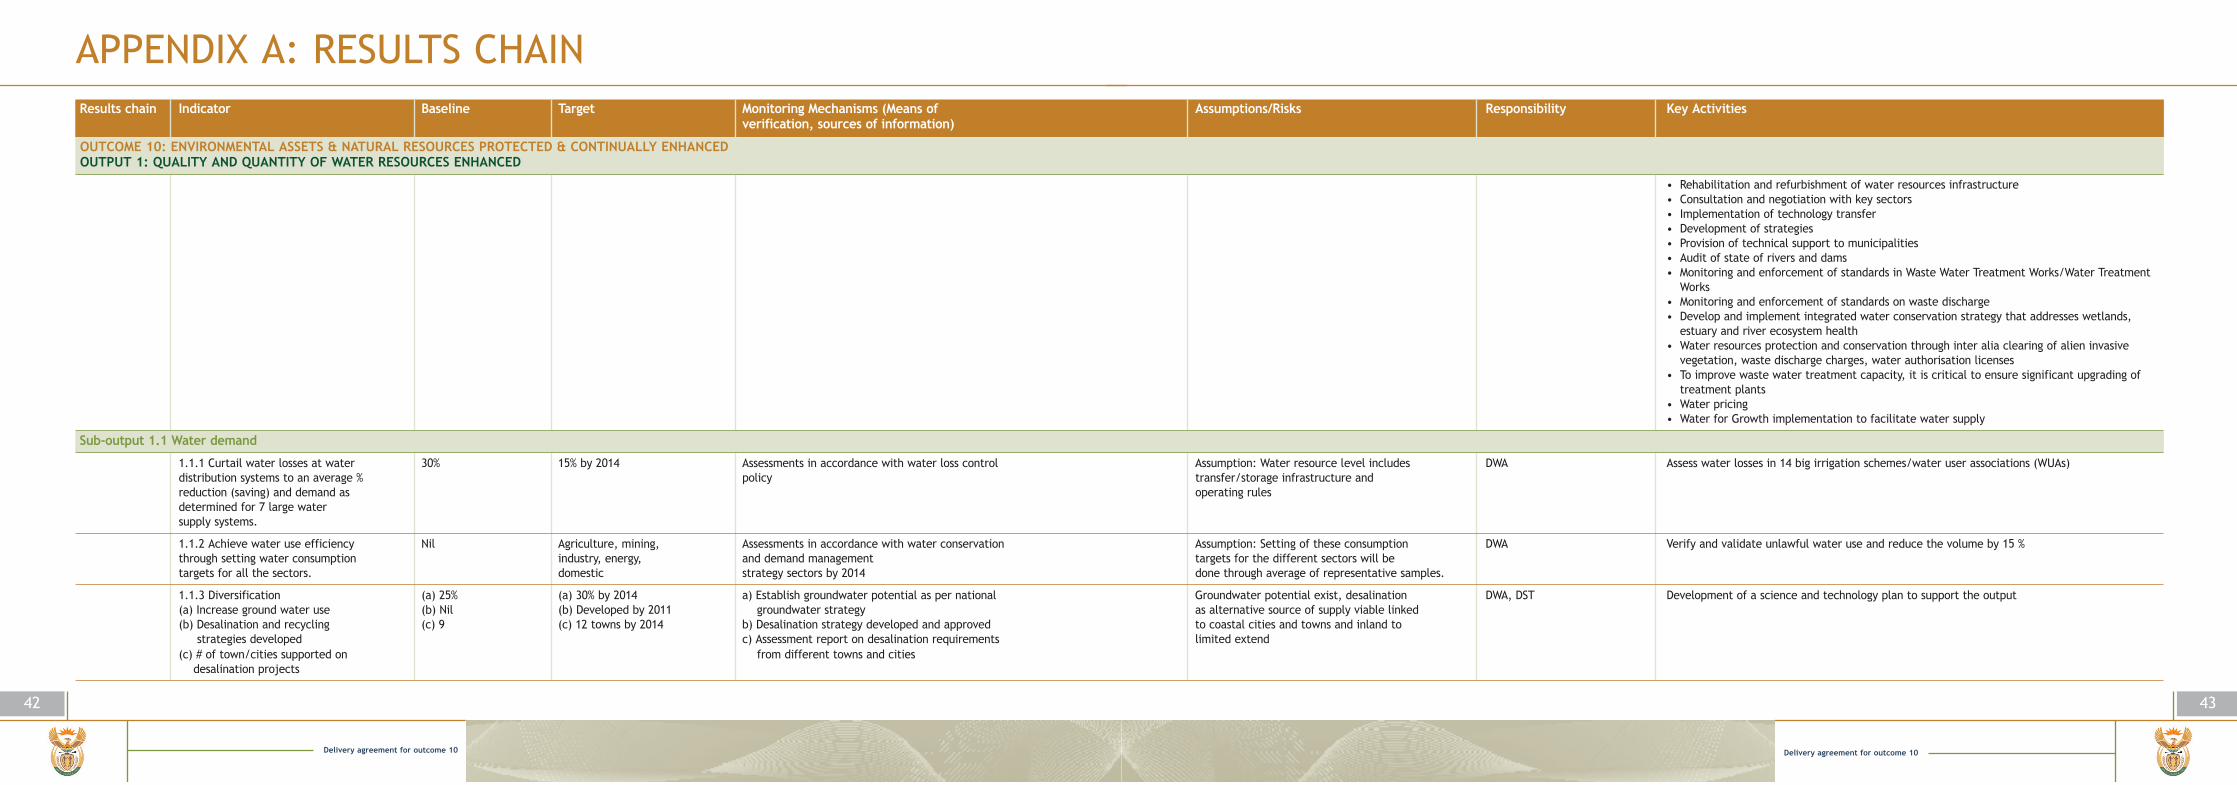
Delivery agreement for outcome 10
43
APPENDIX A: RESULTS CHAINResults chain Indicator Baseline Target Monitoring Mechanisms (Means of Assumptions/Risks Responsibility Key Activities
verification, sources of information)
OUTCOME 10: ENVIRONMENTAL ASSETS & NATURAL RESOURCES PROTECTED & CONTINUALLY ENHANCEDOUTPUT 1: QUALITY AND QUANTITY OF WATER RESOURCES ENHANCED
• Rehabilitation and refurbishment of water resources infrastructure • Consultation and negotiation with key sectors• Implementation of technology transfer• Development of strategies• Provision of technical support to municipalities• Audit of state of rivers and dams • Monitoring and enforcement of standards in Waste Water Treatment Works/Water Treatment
Works• Monitoring and enforcement of standards on waste discharge• Develop and implement integrated water conservation strategy that addresses wetlands,
estuary and river ecosystem health• Water resources protection and conservation through inter alia clearing of alien invasive
vegetation, waste discharge charges, water authorisation licenses• To improve waste water treatment capacity, it is critical to ensure significant upgrading of
treatment plants• Water pricing• Water for Growth implementation to facilitate water supply
Sub-output 1.1 Water demand
1.1.1 Curtail water losses at water 30% 15% by 2014 Assessments in accordance with water loss control Assumption: Water resource level includes DWA Assess water losses in 14 big irrigation schemes/water user associations (WUAs)distribution systems to an average % policy transfer/storage infrastructure and reduction (saving) and demand as operating rules determined for 7 large water supply systems.
1.1.2 Achieve water use efficiency Nil Agriculture, mining, Assessments in accordance with water conservation Assumption: Setting of these consumption DWA Verify and validate unlawful water use and reduce the volume by 15 %through setting water consumption industry, energy, and demand management targets for the different sectors will be targets for all the sectors. domestic strategy sectors by 2014 done through average of representative samples.
1.1.3 Diversification (a) 25% (a) 30% by 2014 a) Establish groundwater potential as per national Groundwater potential exist, desalination DWA, DST Development of a science and technology plan to support the output(a) Increase ground water use (b) Nil (b) Developed by 2011 groundwater strategy as alternative source of supply viable linked (b) Desalination and recycling (c) 9 (c) 12 towns by 2014 b) Desalination strategy developed and approved to coastal cities and towns and inland to
strategies developed c) Assessment report on desalination requirements limited extend(c) # of town/cities supported on from different towns and cities
desalination projects
42
Delivery agreement for outcome 10
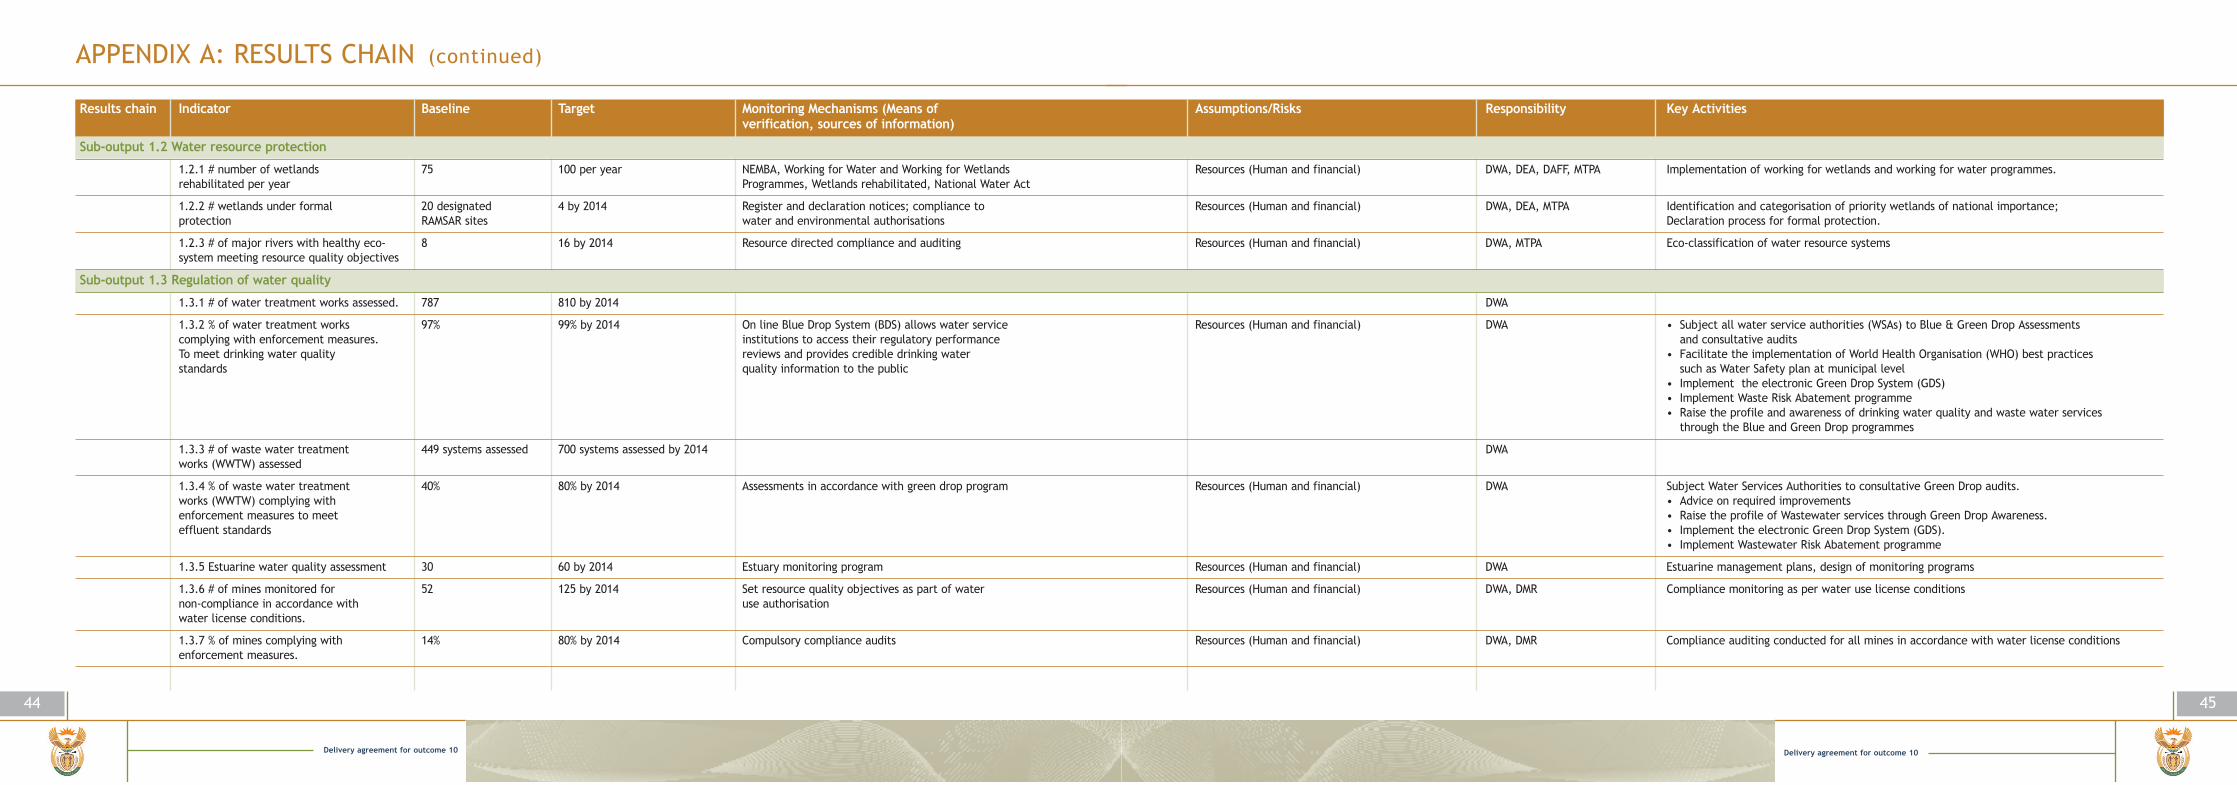
Delivery agreement for outcome 10
45
APPENDIX A: RESULTS CHAIN (continued)
Results chain Indicator Baseline Target Monitoring Mechanisms (Means of Assumptions/Risks Responsibility Key Activities verification, sources of information)
Sub-output 1.2 Water resource protection
1.2.1 # number of wetlands 75 100 per year NEMBA, Working for Water and Working for Wetlands Resources (Human and financial) DWA, DEA, DAFF, MTPA Implementation of working for wetlands and working for water programmes.rehabilitated per year Programmes, Wetlands rehabilitated, National Water Act
1.2.2 # wetlands under formal 20 designated 4 by 2014 Register and declaration notices; compliance to Resources (Human and financial) DWA, DEA, MTPA Identification and categorisation of priority wetlands of national importance; protection RAMSAR sites water and environmental authorisations Declaration process for formal protection.
1.2.3 # of major rivers with healthy eco- 8 16 by 2014 Resource directed compliance and auditing Resources (Human and financial) DWA, MTPA Eco-classification of water resource systems system meeting resource quality objectives
Sub-output 1.3 Regulation of water quality
1.3.1 # of water treatment works assessed. 787 810 by 2014 DWA
1.3.2 % of water treatment works 97% 99% by 2014 On line Blue Drop System (BDS) allows water service Resources (Human and financial) DWA • Subject all water service authorities (WSAs) to Blue & Green Drop Assessments complying with enforcement measures. institutions to access their regulatory performance and consultative auditsTo meet drinking water quality reviews and provides credible drinking water • Facilitate the implementation of World Health Organisation (WHO) best practicesstandards quality information to the public such as Water Safety plan at municipal level
• Implement the electronic Green Drop System (GDS)• Implement Waste Risk Abatement programme• Raise the profile and awareness of drinking water quality and waste water services
through the Blue and Green Drop programmes
1.3.3 # of waste water treatment 449 systems assessed 700 systems assessed by 2014 DWAworks (WWTW) assessed
1.3.4 % of waste water treatment 40% 80% by 2014 Assessments in accordance with green drop program Resources (Human and financial) DWA Subject Water Services Authorities to consultative Green Drop audits.works (WWTW) complying with • Advice on required improvementsenforcement measures to meet • Raise the profile of Wastewater services through Green Drop Awareness.effluent standards • Implement the electronic Green Drop System (GDS).
• Implement Wastewater Risk Abatement programme
1.3.5 Estuarine water quality assessment 30 60 by 2014 Estuary monitoring program Resources (Human and financial) DWA Estuarine management plans, design of monitoring programs
1.3.6 # of mines monitored for 52 125 by 2014 Set resource quality objectives as part of water Resources (Human and financial) DWA, DMR Compliance monitoring as per water use license conditions non-compliance in accordance with use authorisationwater license conditions.
1.3.7 % of mines complying with 14% 80% by 2014 Compulsory compliance audits Resources (Human and financial) DWA, DMR Compliance auditing conducted for all mines in accordance with water license conditions enforcement measures.
44
Delivery agreement for outcome 10
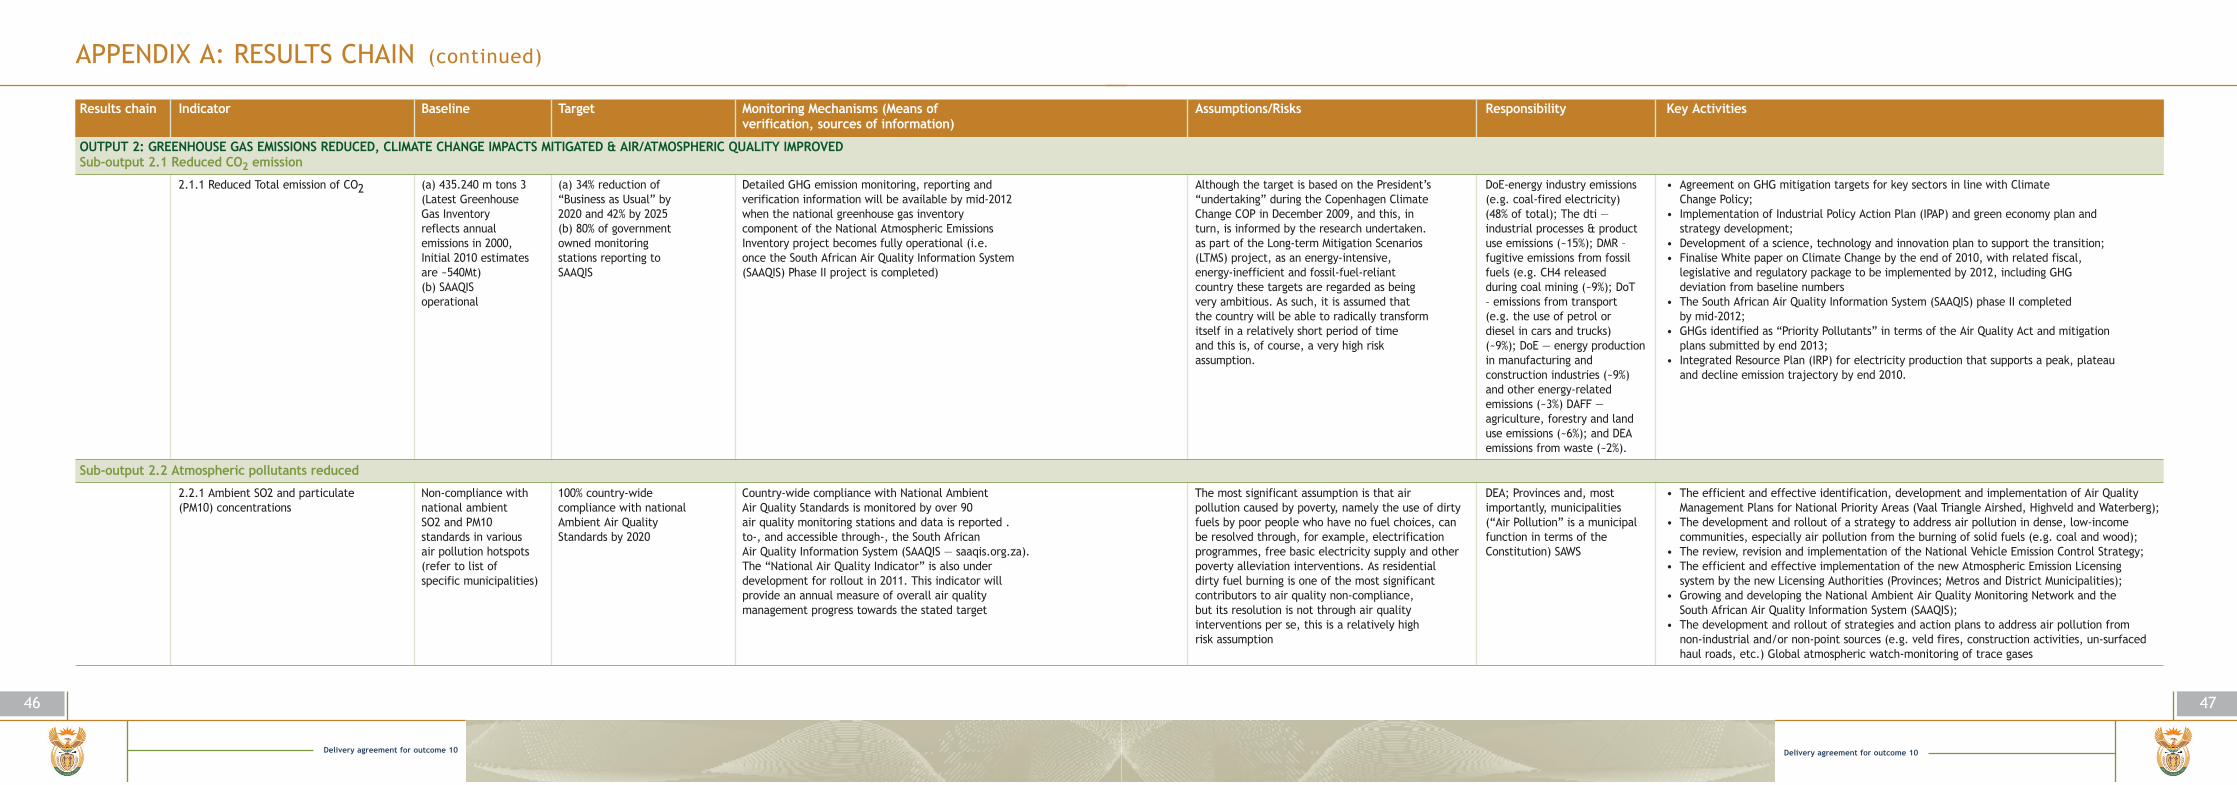
Delivery agreement for outcome 10
47
APPENDIX A: RESULTS CHAIN (continued)
Results chain Indicator Baseline Target Monitoring Mechanisms (Means of Assumptions/Risks Responsibility Key Activities verification, sources of information)
OUTPUT 2: GREENHOUSE GAS EMISSIONS REDUCED, CLIMATE CHANGE IMPACTS MITIGATED & AIR/ATMOSPHERIC QUALITY IMPROVEDSub-output 2.1 Reduced CO2 emission
2.1.1 Reduced Total emission of CO2 (a) 435.240 m tons 3 (a) 34% reduction of Detailed GHG emission monitoring, reporting and Although the target is based on the President’s DoE-energy industry emissions • Agreement on GHG mitigation targets for key sectors in line with Climate (Latest Greenhouse “Business as Usual” by verification information will be available by mid-2012 “undertaking” during the Copenhagen Climate (e.g. coal-fired electricity) Change Policy; Gas Inventory 2020 and 42% by 2025 when the national greenhouse gas inventory Change COP in December 2009, and this, in (48% of total); The dti — • Implementation of Industrial Policy Action Plan (IPAP) and green economy plan and reflects annual (b) 80% of government component of the National Atmospheric Emissions turn, is informed by the research undertaken. industrial processes & product strategy development;emissions in 2000, owned monitoring Inventory project becomes fully operational (i.e. as part of the Long-term Mitigation Scenarios use emissions (~15%); DMR – • Development of a science, technology and innovation plan to support the transition;Initial 2010 estimates stations reporting to once the South African Air Quality Information System (LTMS) project, as an energy-intensive, fugitive emissions from fossil • Finalise White paper on Climate Change by the end of 2010, with related fiscal, are ~540Mt) SAAQIS (SAAQIS) Phase II project is completed) energy-inefficient and fossil-fuel-reliant fuels (e.g. CH4 released legislative and regulatory package to be implemented by 2012, including GHG (b) SAAQIS country these targets are regarded as being during coal mining (~9%); DoT deviation from baseline numbersoperational very ambitious. As such, it is assumed that – emissions from transport • The South African Air Quality Information System (SAAQIS) phase II completed
the country will be able to radically transform (e.g. the use of petrol or by mid-2012;itself in a relatively short period of time diesel in cars and trucks) • GHGs identified as “Priority Pollutants” in terms of the Air Quality Act and mitigation and this is, of course, a very high risk (~9%); DoE — energy production plans submitted by end 2013;assumption. in manufacturing and • Integrated Resource Plan (IRP) for electricity production that supports a peak, plateau
construction industries (~9%) and decline emission trajectory by end 2010.and other energy-related emissions (~3%) DAFF — agriculture, forestry and landuse emissions (~6%); and DEA emissions from waste (~2%).
Sub-output 2.2 Atmospheric pollutants reduced
2.2.1 Ambient SO2 and particulate Non-compliance with 100% country-wide Country-wide compliance with National Ambient The most significant assumption is that air DEA; Provinces and, most • The efficient and effective identification, development and implementation of Air Quality (PM10) concentrations national ambient compliance with national Air Quality Standards is monitored by over 90 pollution caused by poverty, namely the use of dirty importantly, municipalities Management Plans for National Priority Areas (Vaal Triangle Airshed, Highveld and Waterberg);
SO2 and PM10 Ambient Air Quality air quality monitoring stations and data is reported . fuels by poor people who have no fuel choices, can (“Air Pollution” is a municipal • The development and rollout of a strategy to address air pollution in dense, low-income standards in various Standards by 2020 to-, and accessible through-, the South African be resolved through, for example, electrification function in terms of the communities, especially air pollution from the burning of solid fuels (e.g. coal and wood);air pollution hotspots Air Quality Information System (SAAQIS — saaqis.org.za). programmes, free basic electricity supply and other Constitution) SAWS • The review, revision and implementation of the National Vehicle Emission Control Strategy;(refer to list of The “National Air Quality Indicator” is also under poverty alleviation interventions. As residential • The efficient and effective implementation of the new Atmospheric Emission Licensing specific municipalities) development for rollout in 2011. This indicator will dirty fuel burning is one of the most significant system by the new Licensing Authorities (Provinces; Metros and District Municipalities);
provide an annual measure of overall air quality contributors to air quality non-compliance, • Growing and developing the National Ambient Air Quality Monitoring Network and the management progress towards the stated target but its resolution is not through air quality South African Air Quality Information System (SAAQIS);
interventions per se, this is a relatively high • The development and rollout of strategies and action plans to address air pollution from risk assumption non-industrial and/or non-point sources (e.g. veld fires, construction activities, un-surfaced
haul roads, etc.) Global atmospheric watch-monitoring of trace gases
46
Delivery agreement for outcome 10

Delivery agreement for outcome 10
49
APPENDIX A: RESULTS CHAIN (continued)
Results chain Indicator Baseline Target Monitoring Mechanisms (Means of Assumptions/Risks Responsibility Key Activities verification, sources of information)
Sub-output 2.2 Atmospheric pollutants reduced
2.2.2 Mine Dust Not determined Zero exposure to silica DMR Implement the minimum frequency of monitoring; Health impacts of mining tailing dumps on occupational level at all communities proximal to mine operations are being quantified through a research project mines by 2014 approved; Finalising the strategy for rehabilitation of derelict and ownerless mines, continuing
research to accurately delineate the quantum of the environmental challenge and its inherent liability
Sub-output 2.3 Renewable energy deployed
2.3.1 % of power generation that is 2 000 GW/hour 10 000 Gw/hours by 2014 DoE, DPE, DEA, DTI, DST • Alignment and Implementation of Integrated Resource Planrenewable (1% of current • Implementation of Industrial Policy Action Plan and green economy plan and strategy
consumption rate) development• Implementation of Renewable Energy Feed-In Tariff (REFIT) • Finalisation of Renewable Energy White Paper Review
Sub-output 2.4 Identified climate impacts and adaptation framework
2.4.1 Climate change impacts 1 Sector 12 Sectors by 2012 (Biodiversity, DEA, DWA,DAFF,Human • Climate adaptation sectors plans in place by 2012;identified and adaptation frameworks Forestry, Water, Coastal Settlements, Tourism, DST, RDLR • Climate change adaptation plans rolled out to provincial and municipal sphere of government;integrated into national sectoral plans Management, Agriculture, Health,
Tourism, Land & Rural development, Local government,Fisheries, Human settlements,Business/Insurance)
Sub-output 2.5 Efficient energy use
2.5.1 % Energy Efficiency improvement Current Baseline 12% by 2015 DoEnergy, DTI,
OUTPUT 3: SUSTAINABLE ENVIRONMENT MANAGEMENTSub-output 3.1 Degraded ecosystems rehabilitated & restored
3.1.1 Rehabilitation of land affected (a) 800 000 ha per year (a) 3.2 mha by 2014 NEMBA, UNCCD Climate Change, Over utilisation, Farming DAFF; Provinces; DWA; DEA • Implement land care and habitat rehabilitation programmes Woodlands conservation by degradation (b) Rehabilitation at (b) 160 rural development Practices, Pollution, Resources programme
all Comprehensive sites by 2014 • ReforestationRural Development • Rehabilitation of ecosystems to address increasing rates of deforestation, land degradation Sites and dry land expansion and soil erosion
48
Delivery agreement for outcome 10

Delivery agreement for outcome 10
51
APPENDIX A: RESULTS CHAIN (continued)
Results chain Indicator Baseline Target Monitoring Mechanisms (Means of Assumptions/Risks Responsibility Key Activities verification, sources of information)
Sub-output 3.2 Deforestation & improved forest management
3.2.1 Net deforestation 1.2m ha Not more than 5% DAFF, SANBI, Provinces • Alien plants elimination and use as energy source (working for energy) and water preservationwoodlands by 2020 • Deforestation — Enhance energy services in rural areas and thereby reduce rate of deforestation
• Reforestation (trees for carbon storage) — connect with climate change area• Community based natural resource management
3.2.2 Indigenous forest assets Nil 50% DAFF, Provinces Indigenous forest as nature reservestransferred from DAFF to appropriate government conservation agencies
Sub-output 3.3 Less waste that is better managed
3.3.1 % of households with basic 64% of households 75% hh by 2014 DEA, COGTA, SALGA, • Full cost accounting by municipalities;waste collection Municipalities • Development of waste services standards
• Financing mechanism: Review of fiscal mechanism for the the funding of waste services• Analysis of institutional within local governments
3.3.2 % of permitted landfill sites 20% 80% by 2015 DEA, COGTA, SALGA, • Financing mechanism: Review of fiscal mechanism for the the funding of waste services. Municipalities Capacity building for municipalities.
3.3.3 % of municipal waste diverted Not monitored 25% by 2012 DEA, COGTA, SALGA, • Targets for waste minimisation and standards set by end 2010from landfills for recycling Municipalities • Enhance energy potential of waste by harnessing gasses from landfill sites for energy
generation
Sub-output 3.4 Management of environmental impacts from mining and related activities
3.4.1 # of derelict and ownerless 9 derelict and ownerless 1 per financial year DMR, DEA, Provinces, • Rehabilitation and remediation of landmines rehabilitated and closed mine sites rehabilitated pending availability • Management of health impacts of radio active waste materialin line with environmental best during the 6 year period of resources • Vegetation restorationpractice of the implementation
of the MPRDA
3.4.2 Areas identified for restricted Proclaimed protected National areas negotiated DMR, DWA, DEA, Provincesmineral development areas in terms of NEMPAA and published by 2015
3.4.3 Integrated and coordinated Not in place System in place by 2012 DMR, DEA, Provinces, • Monitoring and enforcement of mining activitiesregulatory system for environmentalmanagement of mining
50
Delivery agreement for outcome 10
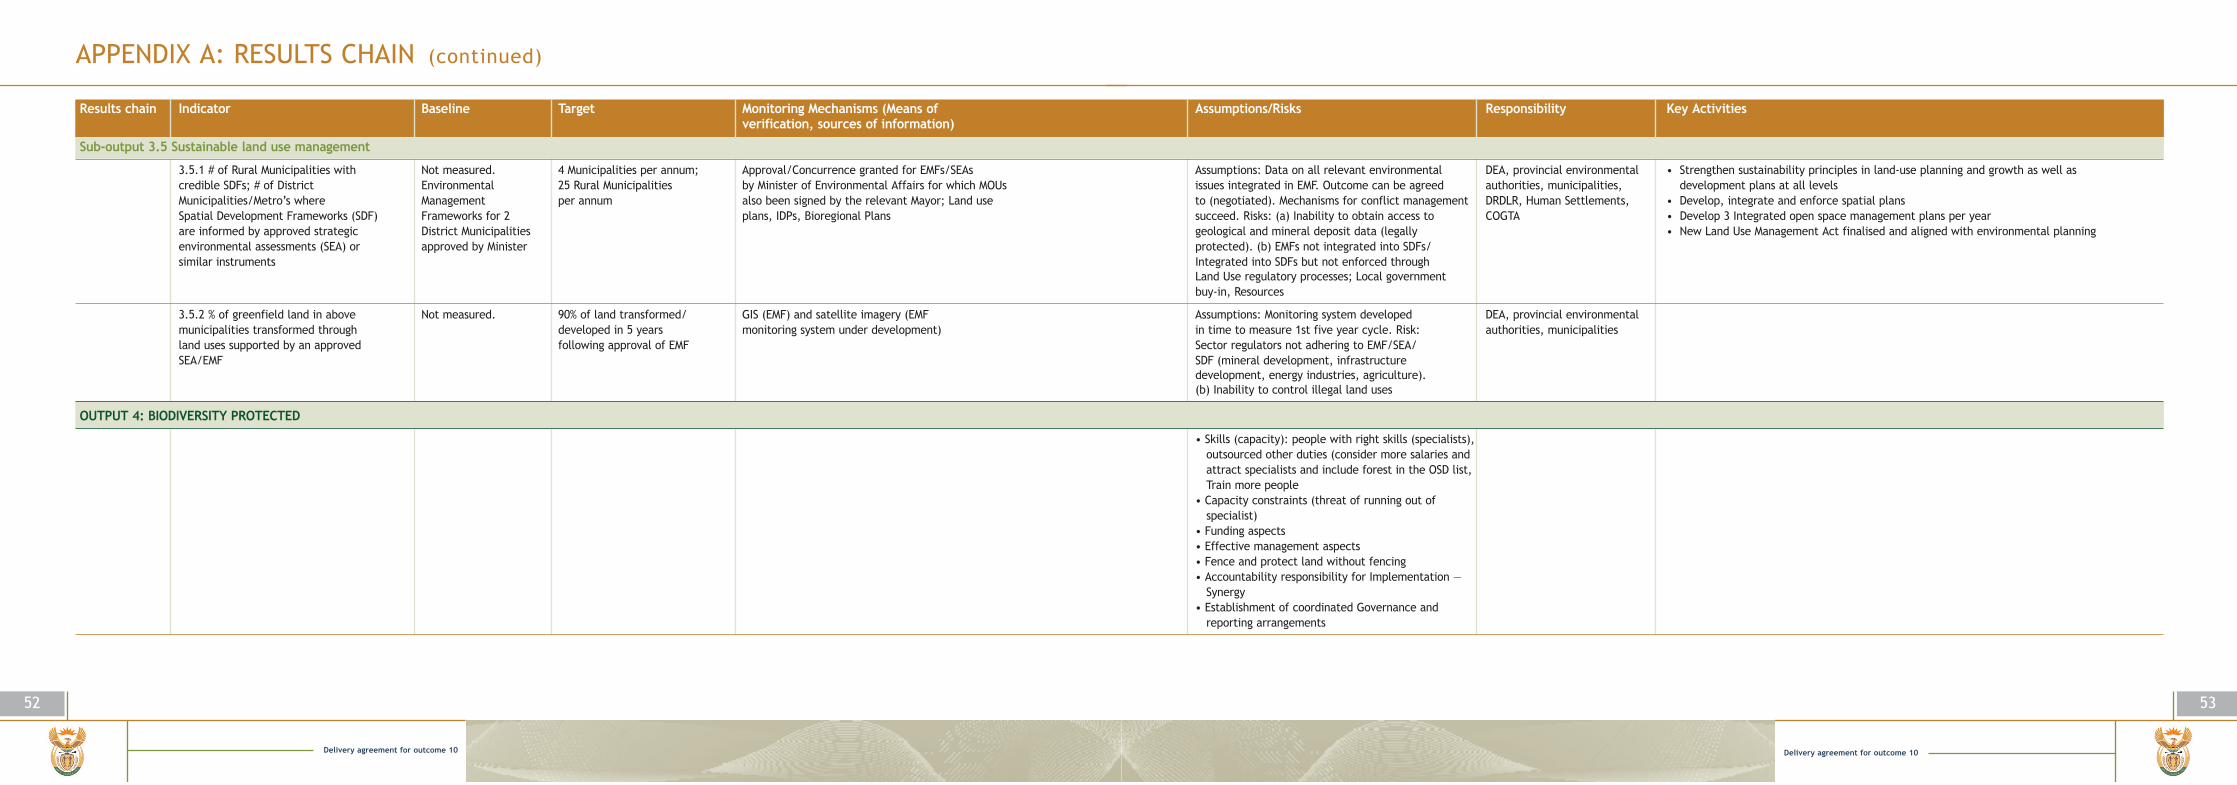
Delivery agreement for outcome 10
53
APPENDIX A: RESULTS CHAIN (continued)
Results chain Indicator Baseline Target Monitoring Mechanisms (Means of Assumptions/Risks Responsibility Key Activities verification, sources of information)
Sub-output 3.5 Sustainable land use management
3.5.1 # of Rural Municipalities with Not measured. 4 Municipalities per annum; Approval/Concurrence granted for EMFs/SEAs Assumptions: Data on all relevant environmental DEA, provincial environmental • Strengthen sustainability principles in land-use planning and growth as well as credible SDFs; # of District Environmental 25 Rural Municipalities by Minister of Environmental Affairs for which MOUs issues integrated in EMF. Outcome can be agreed authorities, municipalities, development plans at all levelsMunicipalities/Metro’s where Management per annum also been signed by the relevant Mayor; Land use to (negotiated). Mechanisms for conflict management DRDLR, Human Settlements, • Develop, integrate and enforce spatial plansSpatial Development Frameworks (SDF) Frameworks for 2 plans, IDPs, Bioregional Plans succeed. Risks: (a) Inability to obtain access to COGTA • Develop 3 Integrated open space management plans per yearare informed by approved strategic District Municipalities geological and mineral deposit data (legally • New Land Use Management Act finalised and aligned with environmental planning environmental assessments (SEA) or approved by Minister protected). (b) EMFs not integrated into SDFs/similar instruments Integrated into SDFs but not enforced through
Land Use regulatory processes; Local governmentbuy-in, Resources
3.5.2 % of greenfield land in above Not measured. 90% of land transformed/ GIS (EMF) and satellite imagery (EMF Assumptions: Monitoring system developed DEA, provincial environmental municipalities transformed through developed in 5 years monitoring system under development) in time to measure 1st five year cycle. Risk: authorities, municipalitiesland uses supported by an approved following approval of EMF Sector regulators not adhering to EMF/SEA/SEA/EMF SDF (mineral development, infrastructure
development, energy industries, agriculture). (b) Inability to control illegal land uses
OUTPUT 4: BIODIVERSITY PROTECTED
• Skills (capacity): people with right skills (specialists), outsourced other duties (consider more salaries and attract specialists and include forest in the OSD list,Train more people
• Capacity constraints (threat of running out of specialist)
• Funding aspects• Effective management aspects• Fence and protect land without fencing• Accountability responsibility for Implementation —
Synergy • Establishment of coordinated Governance and
reporting arrangements
52
Delivery agreement for outcome 10
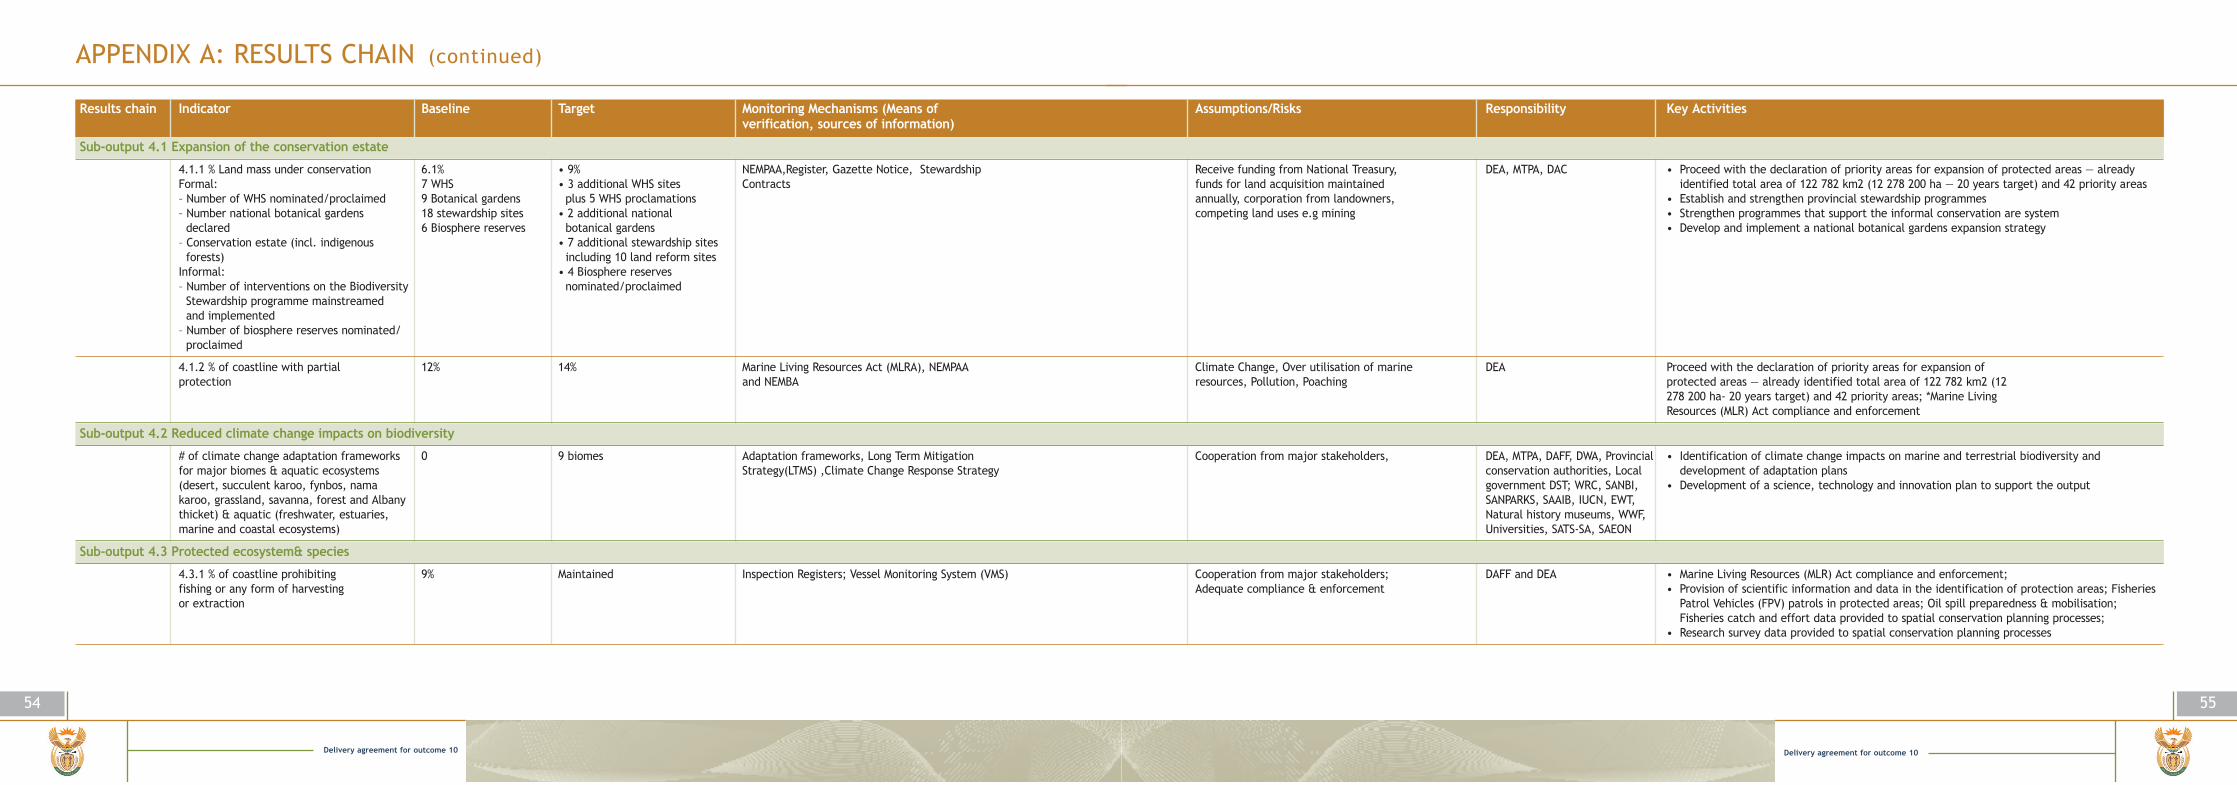
Delivery agreement for outcome 10
55
APPENDIX A: RESULTS CHAIN (continued)
Results chain Indicator Baseline Target Monitoring Mechanisms (Means of Assumptions/Risks Responsibility Key Activities verification, sources of information)
Sub-output 4.1 Expansion of the conservation estate
4.1.1 % Land mass under conservation 6.1% • 9% NEMPAA,Register, Gazette Notice, Stewardship Receive funding from National Treasury, DEA, MTPA, DAC • Proceed with the declaration of priority areas for expansion of protected areas — already Formal: 7 WHS • 3 additional WHS sites Contracts funds for land acquisition maintained identified total area of 122 782 km2 (12 278 200 ha — 20 years target) and 42 priority areas– Number of WHS nominated/proclaimed 9 Botanical gardens plus 5 WHS proclamations annually, corporation from landowners, • Establish and strengthen provincial stewardship programmes – Number national botanical gardens 18 stewardship sites • 2 additional national competing land uses e.g mining • Strengthen programmes that support the informal conservation are system
declared 6 Biosphere reserves botanical gardens • Develop and implement a national botanical gardens expansion strategy– Conservation estate (incl. indigenous • 7 additional stewardship sites
forests) including 10 land reform sitesInformal: • 4 Biosphere reserves – Number of interventions on the Biodiversity nominated/proclaimed
Stewardship programme mainstreamed and implemented
– Number of biosphere reserves nominated/proclaimed
4.1.2 % of coastline with partial 12% 14% Marine Living Resources Act (MLRA), NEMPAA Climate Change, Over utilisation of marine DEA Proceed with the declaration of priority areas for expansion of protection and NEMBA resources, Pollution, Poaching protected areas — already identified total area of 122 782 km2 (12
278 200 ha- 20 years target) and 42 priority areas; *Marine Living Resources (MLR) Act compliance and enforcement
Sub-output 4.2 Reduced climate change impacts on biodiversity
# of climate change adaptation frameworks 0 9 biomes Adaptation frameworks, Long Term Mitigation Cooperation from major stakeholders, DEA, MTPA, DAFF, DWA, Provincial • Identification of climate change impacts on marine and terrestrial biodiversity and for major biomes & aquatic ecosystems Strategy(LTMS) ,Climate Change Response Strategy conservation authorities, Local development of adaptation plans(desert, succulent karoo, fynbos, nama government DST; WRC, SANBI, • Development of a science, technology and innovation plan to support the outputkaroo, grassland, savanna, forest and Albany SANPARKS, SAAIB, IUCN, EWT,thicket) & aquatic (freshwater, estuaries, Natural history museums, WWF, marine and coastal ecosystems) Universities, SATS-SA, SAEON
Sub-output 4.3 Protected ecosystem& species
4.3.1 % of coastline prohibiting 9% Maintained Inspection Registers; Vessel Monitoring System (VMS) Cooperation from major stakeholders; DAFF and DEA • Marine Living Resources (MLR) Act compliance and enforcement; fishing or any form of harvesting Adequate compliance & enforcement • Provision of scientific information and data in the identification of protection areas; Fisheriesor extraction Patrol Vehicles (FPV) patrols in protected areas; Oil spill preparedness & mobilisation;
Fisheries catch and effort data provided to spatial conservation planning processes; • Research survey data provided to spatial conservation planning processes
54
Delivery agreement for outcome 10
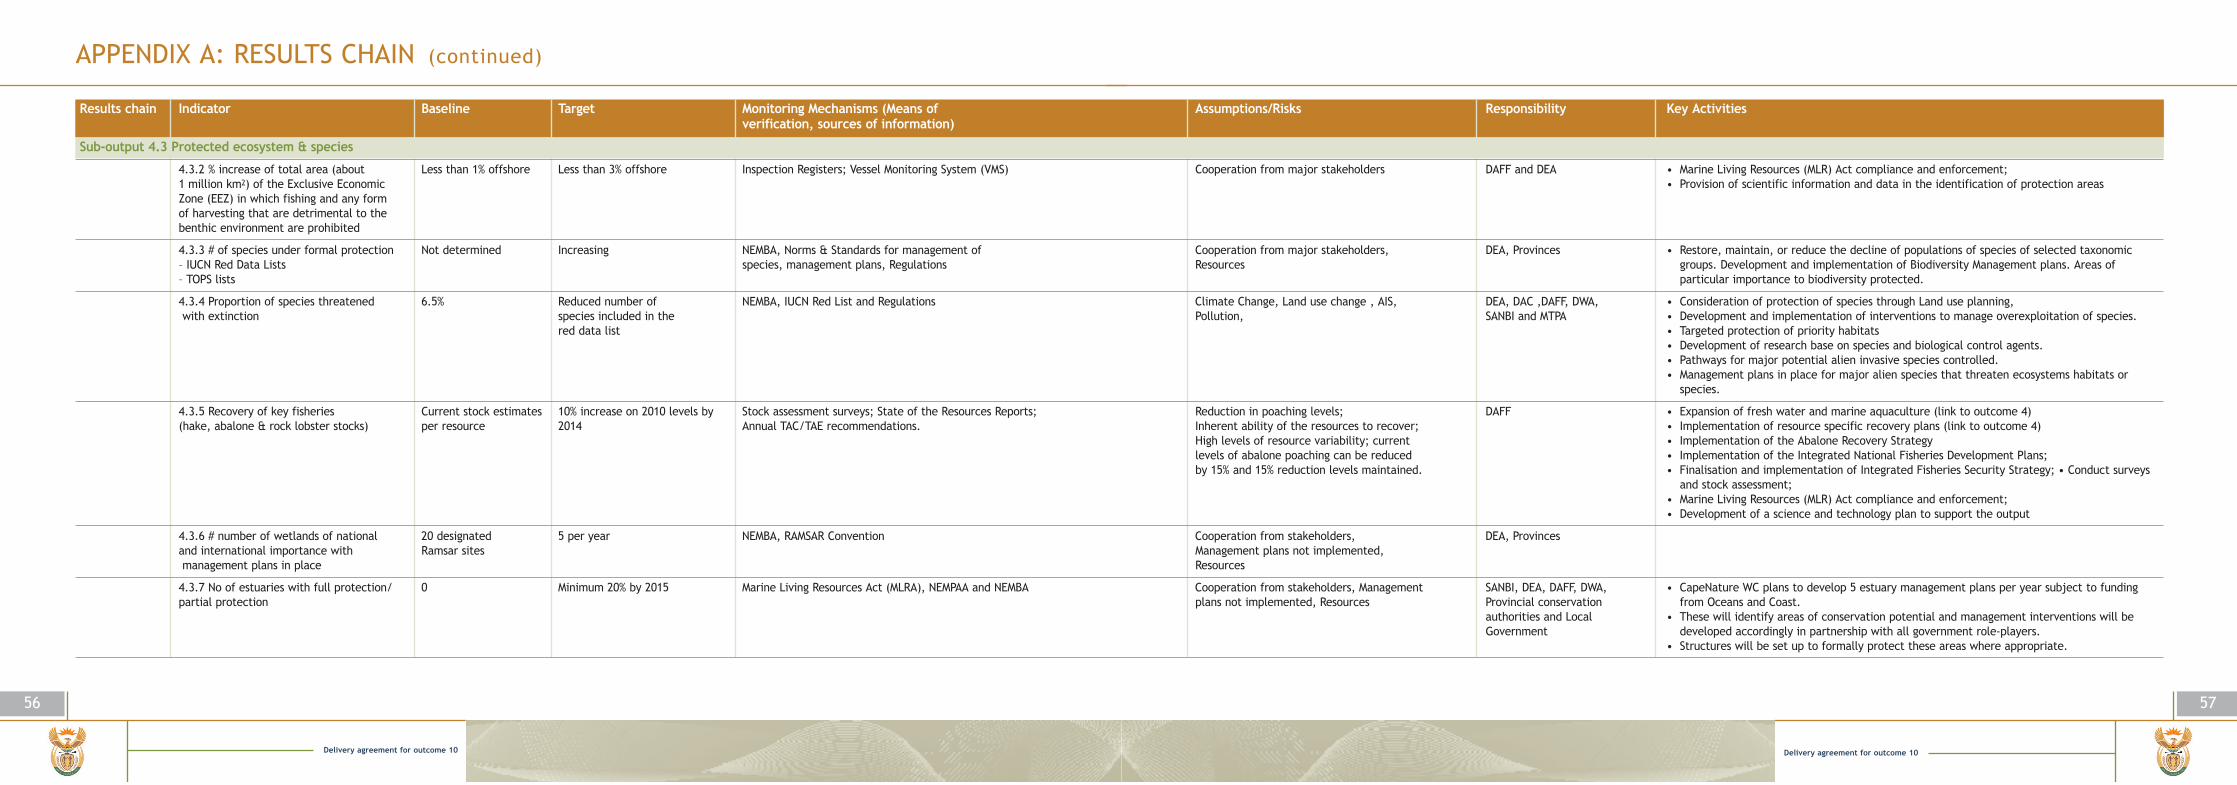
Delivery agreement for outcome 10
57
APPENDIX A: RESULTS CHAIN (continued)
56
Delivery agreement for outcome 10
Results chain Indicator Baseline Target Monitoring Mechanisms (Means of Assumptions/Risks Responsibility Key Activities verification, sources of information)
Sub-output 4.3 Protected ecosystem & species
4.3.2 % increase of total area (about Less than 1% offshore Less than 3% offshore Inspection Registers; Vessel Monitoring System (VMS) Cooperation from major stakeholders DAFF and DEA • Marine Living Resources (MLR) Act compliance and enforcement; 1 million km2) of the Exclusive Economic • Provision of scientific information and data in the identification of protection areasZone (EEZ) in which fishing and any formof harvesting that are detrimental to the benthic environment are prohibited
4.3.3 # of species under formal protection Not determined Increasing NEMBA, Norms & Standards for management of Cooperation from major stakeholders, DEA, Provinces • Restore, maintain, or reduce the decline of populations of species of selected taxonomic – IUCN Red Data Lists species, management plans, Regulations Resources groups. Development and implementation of Biodiversity Management plans. Areas of – TOPS lists particular importance to biodiversity protected.
4.3.4 Proportion of species threatened 6.5% Reduced number of NEMBA, IUCN Red List and Regulations Climate Change, Land use change , AIS, DEA, DAC ,DAFF, DWA, • Consideration of protection of species through Land use planning,with extinction species included in the Pollution, SANBI and MTPA • Development and implementation of interventions to manage overexploitation of species.
red data list • Targeted protection of priority habitats• Development of research base on species and biological control agents.• Pathways for major potential alien invasive species controlled.• Management plans in place for major alien species that threaten ecosystems habitats or
species.
4.3.5 Recovery of key fisheries Current stock estimates 10% increase on 2010 levels by Stock assessment surveys; State of the Resources Reports; Reduction in poaching levels; DAFF • Expansion of fresh water and marine aquaculture (link to outcome 4)(hake, abalone & rock lobster stocks) per resource 2014 Annual TAC/TAE recommendations. Inherent ability of the resources to recover; • Implementation of resource specific recovery plans (link to outcome 4)
High levels of resource variability; current • Implementation of the Abalone Recovery Strategy levels of abalone poaching can be reduced • Implementation of the Integrated National Fisheries Development Plans;by 15% and 15% reduction levels maintained. • Finalisation and implementation of Integrated Fisheries Security Strategy; • Conduct surveys
and stock assessment;• Marine Living Resources (MLR) Act compliance and enforcement;• Development of a science and technology plan to support the output
4.3.6 # number of wetlands of national 20 designated 5 per year NEMBA, RAMSAR Convention Cooperation from stakeholders, DEA, Provincesand international importance with Ramsar sites Management plans not implemented,management plans in place Resources
4.3.7 No of estuaries with full protection/ 0 Minimum 20% by 2015 Marine Living Resources Act (MLRA), NEMPAA and NEMBA Cooperation from stakeholders, Management SANBI, DEA, DAFF, DWA, • CapeNature WC plans to develop 5 estuary management plans per year subject to funding partial protection plans not implemented, Resources Provincial conservation from Oceans and Coast.
authorities and Local • These will identify areas of conservation potential and management interventions will be Government developed accordingly in partnership with all government role-players.
• Structures will be set up to formally protect these areas where appropriate.
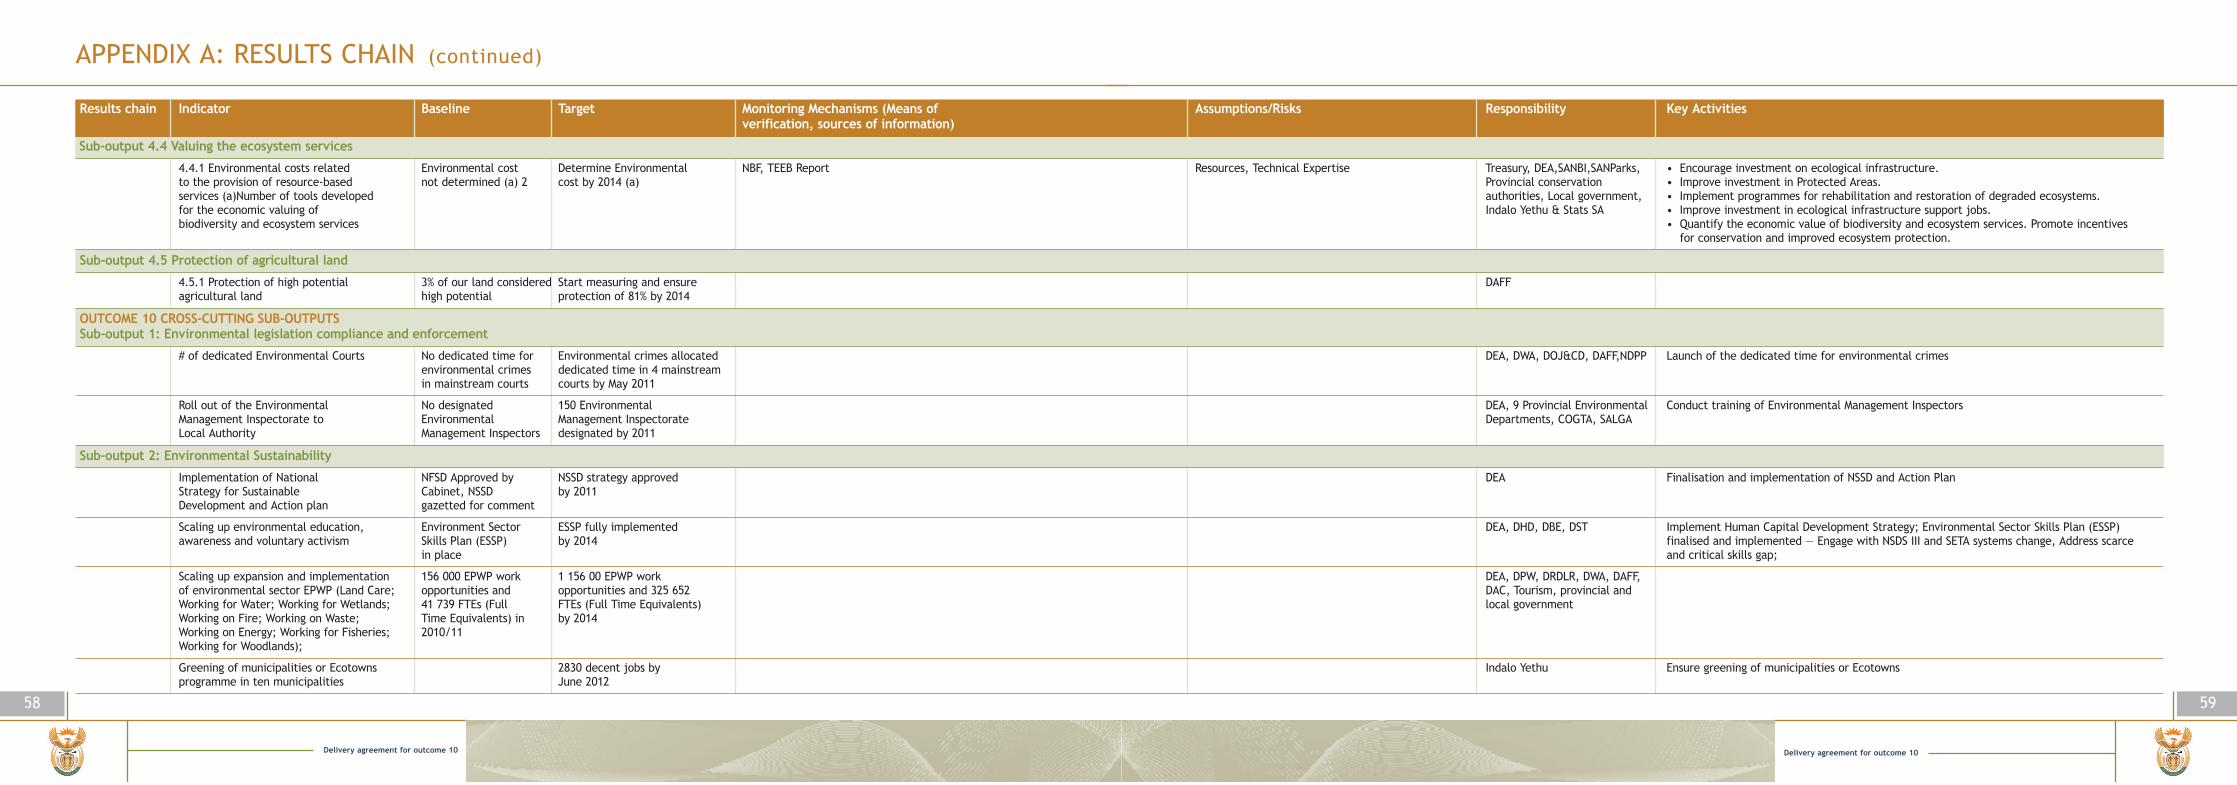
Delivery agreement for outcome 10
59
APPENDIX A: RESULTS CHAIN (continued)
Results chain Indicator Baseline Target Monitoring Mechanisms (Means of Assumptions/Risks Responsibility Key Activities verification, sources of information)
Sub-output 4.4 Valuing the ecosystem services
4.4.1 Environmental costs related Environmental cost Determine Environmental NBF, TEEB Report Resources, Technical Expertise Treasury, DEA,SANBI,SANParks, • Encourage investment on ecological infrastructure.to the provision of resource-based not determined (a) 2 cost by 2014 (a) Provincial conservation • Improve investment in Protected Areas.services (a)Number of tools developed authorities, Local government, • Implement programmes for rehabilitation and restoration of degraded ecosystems.for the economic valuing of Indalo Yethu & Stats SA • Improve investment in ecological infrastructure support jobs.biodiversity and ecosystem services • Quantify the economic value of biodiversity and ecosystem services. Promote incentives
for conservation and improved ecosystem protection.
Sub-output 4.5 Protection of agricultural land
4.5.1 Protection of high potential 3% of our land considered Start measuring and ensure DAFFagricultural land high potential protection of 81% by 2014
OUTCOME 10 CROSS-CUTTING SUB-OUTPUTS Sub-output 1: Environmental legislation compliance and enforcement
# of dedicated Environmental Courts No dedicated time for Environmental crimes allocated DEA, DWA, DOJ&CD, DAFF,NDPP Launch of the dedicated time for environmental crimesenvironmental crimes dedicated time in 4 mainstream in mainstream courts courts by May 2011
Roll out of the Environmental No designated 150 Environmental DEA, 9 Provincial Environmental Conduct training of Environmental Management InspectorsManagement Inspectorate to Environmental Management Inspectorate Departments, COGTA, SALGALocal Authority Management Inspectors designated by 2011
Sub-output 2: Environmental Sustainability
Implementation of National NFSD Approved by NSSD strategy approved DEA Finalisation and implementation of NSSD and Action PlanStrategy for Sustainable Cabinet, NSSD by 2011Development and Action plan gazetted for comment
Scaling up environmental education, Environment Sector ESSP fully implemented DEA, DHD, DBE, DST Implement Human Capital Development Strategy; Environmental Sector Skills Plan (ESSP) awareness and voluntary activism Skills Plan (ESSP) by 2014 finalised and implemented — Engage with NSDS III and SETA systems change, Address scarce
in place and critical skills gap;
Scaling up expansion and implementation 156 000 EPWP work 1 156 00 EPWP work DEA, DPW, DRDLR, DWA, DAFF, of environmental sector EPWP (Land Care; opportunities and opportunities and 325 652 DAC, Tourism, provincial and Working for Water; Working for Wetlands; 41 739 FTEs (Full FTEs (Full Time Equivalents) local governmentWorking on Fire; Working on Waste; Time Equivalents) in by 2014Working on Energy; Working for Fisheries; 2010/11Working for Woodlands);
Greening of municipalities or Ecotowns 2830 decent jobs by Indalo Yethu Ensure greening of municipalities or Ecotownsprogramme in ten municipalities June 2012
58
Delivery agreement for outcome 10

Delivery agreement for outcome 10
61
APPENDIX A: RESULTS CHAIN (continued)
Results chain Indicator Baseline Target Monitoring Mechanisms (Means of Assumptions/Risks Responsibility Key Activities verification, sources of information)
Contribution to Outcome 4 (Decent Employment through Inclusive Economic Growth)-Output 2, Suboutput 5 : Green Economy
Green growth contribution to Draft Green Economy Green economy plan National Green Economy implementation report Financial Resources DEA,DTI,DST,EDD, DPW, Treasury, — Market based instruments (MBIs) to complement regulatory measures and incentivise the use economic growth and employment, plan; May 2010 approved by 2011 DRDLR, COGTA, SALGA, Cities and production of cost effective cleaner and low carbon productswhile preventing environmental Green Economy Network — Mobilise financial resources, domestic and international, from both private and development degradation & pollution, biodiversity Summit Statement finance institutionsloss and unsustainable natural resource of Conclusion — Information and awareness raising initiatives including recognition of the national eco-labelling use (A just transition towards a system which could play a supplementary role to MBIs and regulatory policy measuresresource efficient, low carbon and — Greater localisation of job-intensive green industries and those in which South Africa has a pro-employment growth path) comparative advantage
— Increase new knowledge and skills towards development, deployment and commercialisation of innovative science and technology solutions aimed at advancing a green economy
— Integration of the different work streams and programmes to maximise benefits from investment and finance opportunities arising from the shared efforts between the public and private sectors
— Define the job creation and job protection potential of a green economy growth path persector and small business development and participation
— Direct the implementation of the Industrial Policy Action Plan towards supporting and growinggreen industries
— Scale up and expand the implementation of environmental sector of the Expanded PublicWorks Programme
Sector-specific Elements
Sustainable consumption DTI, DEA, DST,EDD, DRDLR, Formulate and adopt sustainable development performance monitoring to guide the integration and production INDALO YETHUI of economic growth, social equity, and environmental protection including measures for
institutional triple bottom line accounting, Finalisation of the National Eco-label.
Green Buildings and the % reduction in water use in DEA,DTI,DST,EDD, DRDLR, Develop and implement Green building regulatory, enforcement program, awareness and Built Environment commercial and public COGTA capacity building programmes at local level of governance
building sector
Sustainable Transport 9% reduction by 2015 of DOT,DEA,DTI,DST, EDD, COGTA, Reduce transport sector carbon footprint through cost effective interventions, including shifting energy used for transport freight from road to rail as well as passengers towards public and non-motorised transport,
shifting from inefficient and internal combustion engine vehicles to efficient, hybrid and electricvehicles.
60
Delivery agreement for outcome 10
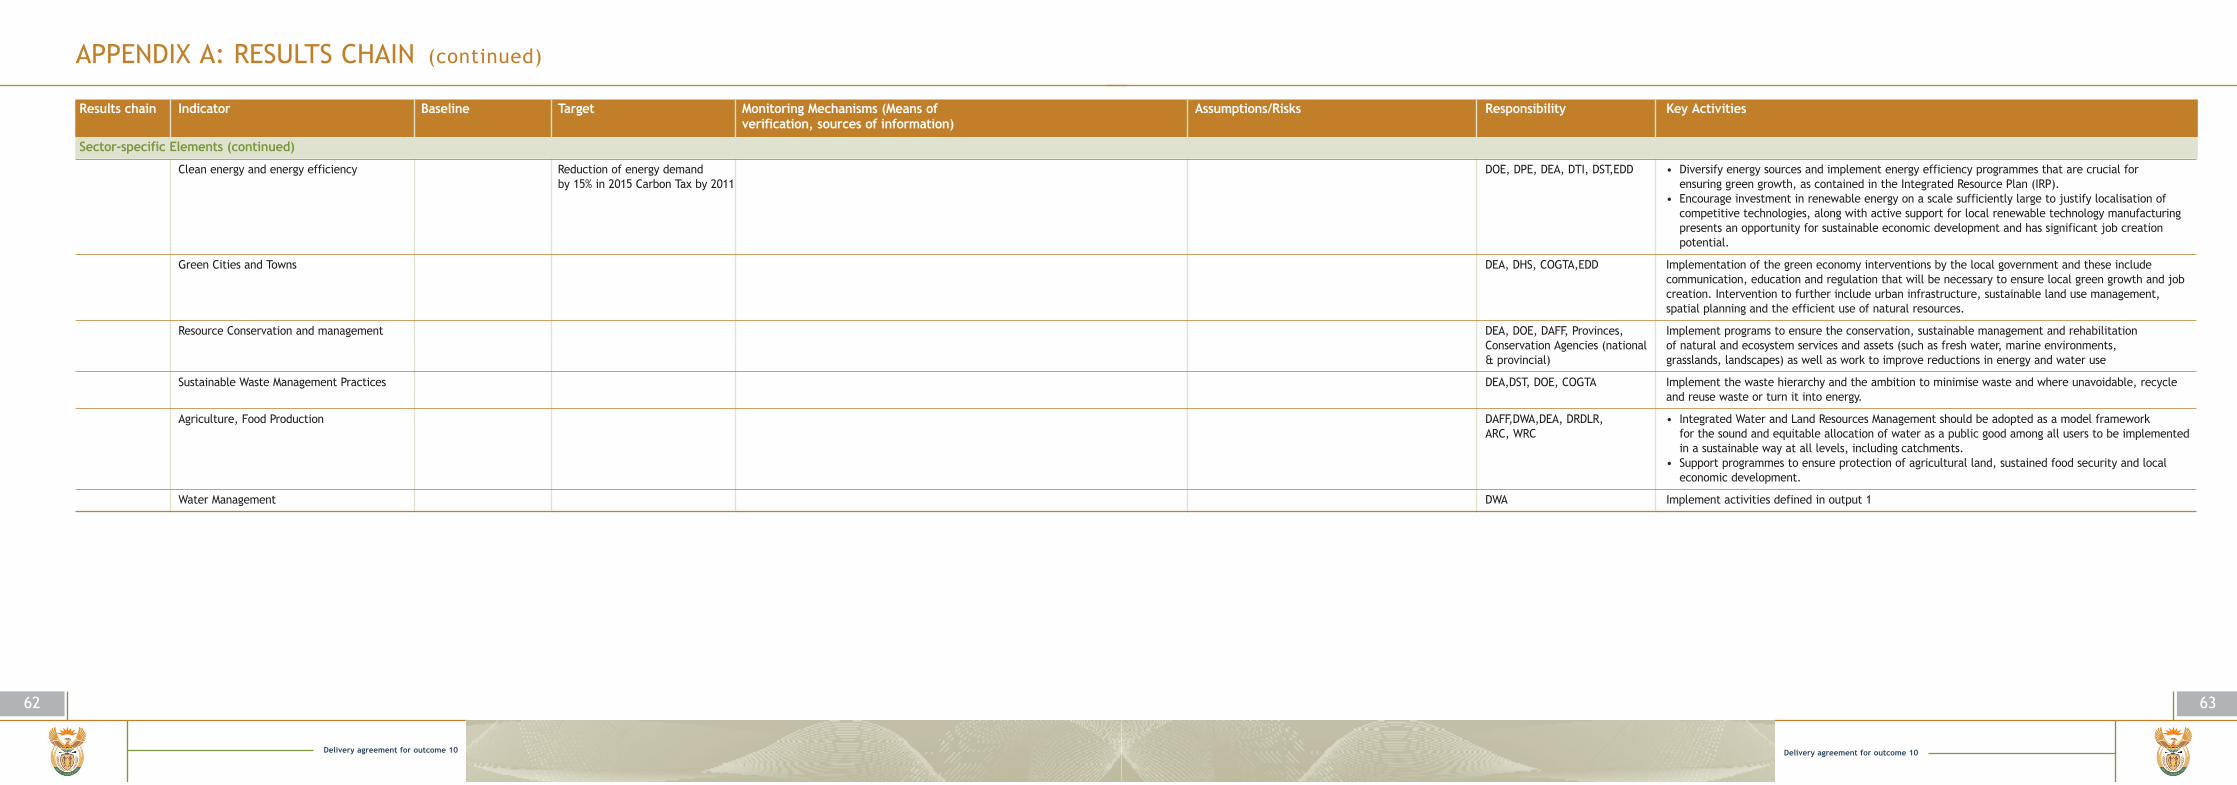
Delivery agreement for outcome 10
63
APPENDIX A: RESULTS CHAIN (continued)
Results chain Indicator Baseline Target Monitoring Mechanisms (Means of Assumptions/Risks Responsibility Key Activities verification, sources of information)
Sector-specific Elements (continued)
Clean energy and energy efficiency Reduction of energy demand DOE, DPE, DEA, DTI, DST,EDD • Diversify energy sources and implement energy efficiency programmes that are crucial for by 15% in 2015 Carbon Tax by 2011 ensuring green growth, as contained in the Integrated Resource Plan (IRP).
• Encourage investment in renewable energy on a scale sufficiently large to justify localisation ofcompetitive technologies, along with active support for local renewable technology manufacturingpresents an opportunity for sustainable economic development and has significant job creationpotential.
Green Cities and Towns DEA, DHS, COGTA,EDD Implementation of the green economy interventions by the local government and these includecommunication, education and regulation that will be necessary to ensure local green growth and jobcreation. Intervention to further include urban infrastructure, sustainable land use management,spatial planning and the efficient use of natural resources.
Resource Conservation and management DEA, DOE, DAFF, Provinces, Implement programs to ensure the conservation, sustainable management and rehabilitation Conservation Agencies (national of natural and ecosystem services and assets (such as fresh water, marine environments, & provincial) grasslands, landscapes) as well as work to improve reductions in energy and water use
Sustainable Waste Management Practices DEA,DST, DOE, COGTA Implement the waste hierarchy and the ambition to minimise waste and where unavoidable, recycleand reuse waste or turn it into energy.
Agriculture, Food Production DAFF,DWA,DEA, DRDLR, • Integrated Water and Land Resources Management should be adopted as a model framework ARC, WRC for the sound and equitable allocation of water as a public good among all users to be implemented
in a sustainable way at all levels, including catchments.• Support programmes to ensure protection of agricultural land, sustained food security and local
economic development.
Water Management DWA Implement activities defined in output 1
62
Delivery agreement for outcome 10

Delivery agreement for outcome 10
65
APPENDIX B: HIGH LEVEL IMPLEMENTATION PLAN BY SUB-OUTPUTOUTCOME 10: PROTECTED AND ENHANCED ENVIRONMENTAL ASSETS AND NATURAL RESOURCESOUTPUT 1: QUALITY AND QUANTITY OF WATER RESOURCES ENHANCED
MILESTONES/DELIVERABLES RESOURCE REQUIREMENTSTARGET/INDICATOR ACTIVITIES YEAR 1 YEAR 2 YEAR 3 YEAR 4 TIME (COMPLETED BY) HUMAN RESOURCES FINANCIAL RESOURCES ROLES AND RESPONSIBILITIES
Sub-output 1.1: Water demand
Curtail water losses at water resource Assess water losses in 14 big 1 irrigation scheme 3 irrigation schemes 5 irrigation schemes 5 irrigation schemes Mar-14 Funded DWAlevel to an average % reduction (saving) irrigation schemes/water user and demands determined for 7 associations (WUAs)large water supply systems (water services) (15% in 2014)
Set selected water efficiency targets Verify and validate unlawful water Initiate verification and Water use reduced by 5% Water use reduced Water use reduced by 5% Mar-14 Funded DWAfor different sectors use and reduce the volume by 15 % =validation process by 5%
Reduction (saving) of demand as Assessment of water requirements 2 water resource management 3 water resource management 1 resource management 1 resource management Mar-14 Funded DWAdetermined in the Reconciliation and water monitoring systems assessed and system assessed and monitored and systems assessed system assessed and Strategies for 7 large water supply systems implemented monitored and monitored monitoredsystems by 15% in 2014
Diversification Re-use strategy developed Commence development �e-use strategy completed Potential increase of Potential increase of 3/31/14 TBD Funded DWA(a) Increase ground water use (from of re-use strategy ground water use by 2% ground water use by 3% 25% to 30% by 2014)
(b) Desalination and recycling strategies Desalination strategy developed Desalination strategy complete feasibility studies completed TBD TBD DWA, DST (Technology/Innovation)developed in support of 5 desalination(Strategies developed in 2011 projects
(c) # of town/cities supported on 12 towns supported on support 9 towns on support 10 towns on support 11 towns on support 12 towns on Mar-14 DWA, Local governmentdesalination projects (from 9 to 12 towns desalination projects by 2014 desalination projects desalination projects desalination projects desalination projectsby 2014)
Sub-output 1.2 Water resource protection
# number of wetlands rehabilitated per Implementation of working for 95 wetlands rehabilitated 100 wetlands rehabilitated 110 wetlands 120 wetlands Mar-14 Rehabilitation teams in SANBI additional operating SANBI — implementationyear (100 per year) wetlands programme through the rehabilitated rehabilitated provinces, scientists and R15 million pa
rehabilitation of priority wetlands, Project Managersdevelopment of rehabilitation plans
64
Delivery agreement for outcome 10

Delivery agreement for outcome 10
67
APPENDIX B: HIGH LEVEL IMPLEMENTATION PLAN BY SUB-OUTPUT (continued)
# wetlands under formal protection Identify wetlands of national Criteria for listing of Assessment of priority Assessment of priority Develop and implement 3/1/14 Scientists, planners, Funded Conservation Authorities — implement (4 by 2014) importance and develop wetlands developed wetlands against criteria wetlands against management plans conservation manager plans, SANBI -scientific criteria
management plan developed criteria developed
Management plans for wetlands of Management plans for five Management plans for Assessment of priority wetlands Develop and implement 3/1/14 Funded Management authorities — develop & international importance developed RAMSAR sites developed five RAMSAR sites develop against criteria developed management plans implement plans, DEA — oversight
Construction of gabions to control 2 Wetlands rehabilitated, 2 Wetlands rehabilitated. 1 wetland rehabilitated, 2 wetlands rehabilitated, domestic 9/1/13 No additional human Additional financial DEA to appoint project implementers and water flow flow and soil erosion 2 dongas prevented from 2 dongas prevented from domestic waste collected waste collected at three local resources required resources required monitor their performance, SANBI to and collection and delivery of expanding, domestic waste expanding, domestic waste at two local municipalities, municipalities, 4 888 work implementwaste to the buyback centres collected at two, local collected at two local 6 181 work Opportunities opportunities and 2 444 Full time
municipalities, 5 835 Work municipalities, 6 279 Work and 3 090 Full Time Equivalents createdOpportunities and 2 918 Opportunities created and Equivalents createdFull Time Equivalents created 3 139 FTEs created
16 major rivers with healthy ecosystem Eco-classification of water resource 1 major river system meeting 1 major river system meeting 1 major river system meeting 1 major river system meeting 3/1/14 DWA, DEAby 2014 systems resource quality objectives resource quality objectives resource quality objectives resource quality objectives
Establish assessment plan Assessment of priority river Assessment of priority Develop and implement 3/1/14 Scientists, planners, land users/ R500 000/a Conservation Authorities — implement plansfor riverhealth ecosystem ecosystems against riverhealth river ecosystems against management plans ownersmonitoring criteria riverhealth criteria
Estuarine water quality assessment Development and implementation Inception report and Implementation in 10 Implementation in 10 Implementation 3/1/14 DEA, DWA, SANBI to implement wetland (30 by 2014) of estuarine monitoring programme implementation plan completed selected estuaries selected estuaries in 10 selected estuaries rehabilitation projects
Sub-output 1.3 Regulation of water quality
# of water treatment works complying 99% of water treatment works 97% 98% 99% 99% Mar-14 Fundedwith enforcement measures to meet complying with enforcement drinking water quality standards measures to meet drinking water
quality standards by 2014
# of water treatment works assessed 810 water water treatment works to 792 plants assessed 797 plants assessed 803 plants assessed 810 plants assessed 3/1/14 Funded DWA and Local governmentbe assessed by 2014 in order to meet effluent standards
% of waste water treatment works 80% of waste water treatment works 40% 55% 75% 80% 3/1/14complying with enforcement measures to comply with enforcement to meet effluent standards measures to meet effluent standards
66
Delivery agreement for outcome 10
MILESTONES/DELIVERABLES RESOURCE REQUIREMENTSTARGET/INDICATOR ACTIVITIES YEAR 1 YEAR 2 YEAR 3 YEAR 4 TIME (COMPLETED BY) HUMAN RESOURCES FINANCIAL RESOURCES ROLES AND RESPONSIBILITIES

Delivery agreement for outcome 10
69
APPENDIX B: HIGH LEVEL IMPLEMENTATION PLAN BY SUB-OUTPUT (continued)
# of mines monitored for non-compliance 125 mines monitored for 62 90 110 125 Additional financial in accordance with water license non-compliance by 2014. resources requiredconditions
% of mines complying 80% of mines to comply with 14% 39% 64% 80% 3/1/14 Funded DWA, DEA, DMRwith enforcement measures enforcement measures by 2014
OUTPUT 2: REDUCED GREENHOUSE GAS EMISSIONS, CLIMATE CHANGE & IMPROVED AIR/ATMOSPHERIC QUALITYSub-output 2.1: Reduced CO2 emission
Reduced total emissions of CO2 by Agreement on GHG mitigation Finalise White paper on Integrated Energy Plan and Related fiscal, legislative GHGs identified as “Priority Mar-14 DEA, DTI, DST (science, technology & 34% reduction; of “Business As Usual” by targets for key sectors in line with Climate Change Integrated Resource Plan (IRP) and regulatory package to be Pollutants” in terms of the Air innovation), Provinces, local government, 2020 and 42% by 2025 80% of Climate Change Policy for electricity production that implemented by 2012, Quality Act and mitigation plans; Energygovernment owned monitoring stations supports a peak, plateau and including GHG deviation from submitted by end 2013reporting to SAAQIS decline emission trajectory by baseline numbers; The South
end 2010 African Air Quality Information System (SAAQIS) phase II completed by mid-2012
Sub-output 2.2: Atmospheric pollutants
100% country-wide compliance with The efficient and effective (i) Vaal Triangle Air-shed (i) Progress and review (i) Vaal Triangle Air-shed On-going DEAnational Ambient Air Quality identification, development Priority Area Air Quality report compiled and Priority Area Air Quality Standards by 2020 and implementation of Air Management Plan under full published for the Vaal management Plan updated,
Quality Management Plans for implementation, (ii) draft plan Triangle Air-shed Priority (ii) Highveld Priority Area Local governmentNational Priority Areas (Vaal for the Highveld Priority Area Area, (ii) Highveld Priority Air Quality full implementation Triangle Air-shed, Highveld developed and published for Area Air Quality Management and (iii) Waterberg and Waterberg) public comment and Plan under Plan promulgated Priority Area Air Quality Provinces
(iii) Minister’s intention to and (iii) Waterberg Priority Area Management Plan publisheddeclare the Waterberg Priority problem analysis completed for public commentArea published
Global atmospheric watch- SAWSmonitoring of trace gases
68
Delivery agreement for outcome 10
MILESTONES/DELIVERABLES RESOURCE REQUIREMENTSTARGET/INDICATOR ACTIVITIES YEAR 1 YEAR 2 YEAR 3 YEAR 4 TIME (COMPLETED BY) HUMAN RESOURCES FINANCIAL RESOURCES ROLES AND RESPONSIBILITIES

Delivery agreement for outcome 10
71
APPENDIX B: HIGH LEVEL IMPLEMENTATION PLAN BY SUB-OUTPUT (continued)
The development and rollout Integrated residential Interdepartmental pilot Residential air pollution Interdepartmental pilot 12/1/2012 The impact of Use of existing human Use of current budget and DEA — overall coordination, ambient air of a strategy to address air air pollution control project/s launched within control case studies project/s progress and review coordinated and integrated resources air pollution the mobilisation of funds quality monitoring and reporting and pollution in dense, low-income strategy that coordinates a key problem area within and associated municipal report compiled and published interdepartmental efforts offset project through appropriate industrial negotiation of industrial air pollution communities, including air and consolidates all one of the National air implementation fully analysed and reported offset projects; DoH — Indoor air quality improvement pollution from the burning of Relevant national pollution Priority Areas guidelines published by October 2013 interventions and air quality monitoring; dirty fuels (e.g. coal, paraffin department, provincial and DOE-Coordination of electrication and wood) municipal interventions interventions and the implementation of
submitted to Cabinet for cleaner fuels and/or basic energyapproval interventions; DHS — Energy and/or
thermal efficiency improvement interventions & DMR — Cleaner fuels (e.g. anthracite) interventions; DMR-Cleaner fuels (e.g Anthracite) interventions; Pilot municipalities — prioritisation of appropriate service supply interventions (e.g. electrification,road-surfacing, tree planting)
The review, revision and Mar-14 DEA, Provinces, Local Governmentimplementation of the National Vehicle Emission Control Strategy
The efficient and effective Mar-14 DEA, Provinces, Local Governmentimplementation of the new Atmospheric Emission Licensing system by the new Licensing Authorities (Provinces; Metros and District Municipalities)
Growing and developing the National Mar-14 DEA, Provinces, Local GovernmentAmbient Air Quality Monitoring Network and the South African Air Quality Information System (SAAQIS)
The development and rollout of Mar-14 DEA, Provinces, Local Governmentstrategies and action plans to address air pollution from non-industrial and/or non-point sources (e.g. veld fires, construction activities, un-surfaced haul roads, etc.)
70
Delivery agreement for outcome 10
MILESTONES/DELIVERABLES RESOURCE REQUIREMENTSTARGET/INDICATOR ACTIVITIES YEAR 1 YEAR 2 YEAR 3 YEAR 4 TIME (COMPLETED BY) HUMAN RESOURCES FINANCIAL RESOURCES ROLES AND RESPONSIBILITIES
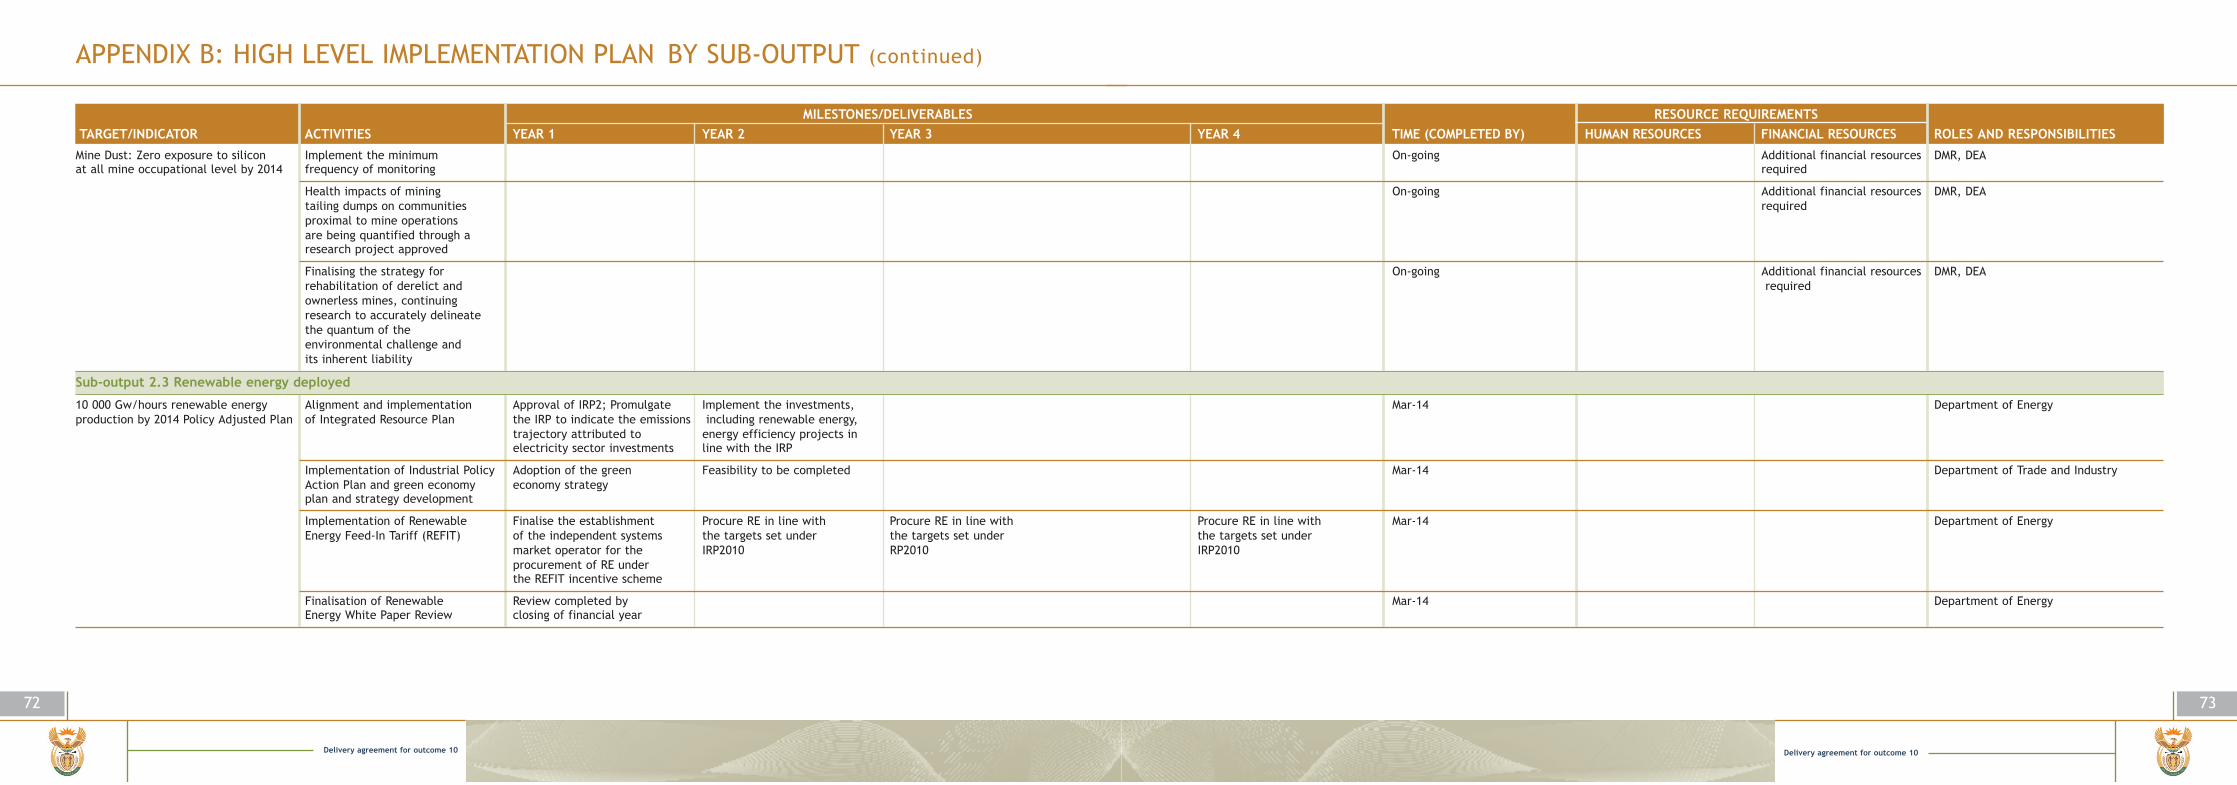
Delivery agreement for outcome 10
73
APPENDIX B: HIGH LEVEL IMPLEMENTATION PLAN BY SUB-OUTPUT (continued)
Mine Dust: Zero exposure to silicon Implement the minimum On-going Additional financial resources DMR, DEAat all mine occupational level by 2014 frequency of monitoring required
Health impacts of mining On-going Additional financial resources DMR, DEAtailing dumps on communities requiredproximal to mine operations are being quantified through a research project approved
Finalising the strategy for On-going Additional financial resources DMR, DEArehabilitation of derelict and requiredownerless mines, continuing research to accurately delineate the quantum of the environmental challenge and its inherent liability
Sub-output 2.3 Renewable energy deployed
10 000 Gw/hours renewable energy Alignment and implementation Approval of IRP2; Promulgate Implement the investments, Mar-14 Department of Energyproduction by 2014 Policy Adjusted Plan of Integrated Resource Plan the IRP to indicate the emissions including renewable energy,
trajectory attributed to energy efficiency projects in electricity sector investments line with the IRP
Implementation of Industrial Policy Adoption of the green Feasibility to be completed Mar-14 Department of Trade and IndustryAction Plan and green economy economy strategyplan and strategy development
Implementation of Renewable Finalise the establishment Procure RE in line with Procure RE in line with Procure RE in line with Mar-14 Department of EnergyEnergy Feed-In Tariff (REFIT) of the independent systems the targets set under the targets set under the targets set under
market operator for the IRP2010 RP2010 IRP2010procurement of RE under the REFIT incentive scheme
Finalisation of Renewable Review completed by Mar-14 Department of EnergyEnergy White Paper Review closing of financial year
72
Delivery agreement for outcome 10
MILESTONES/DELIVERABLES RESOURCE REQUIREMENTSTARGET/INDICATOR ACTIVITIES YEAR 1 YEAR 2 YEAR 3 YEAR 4 TIME (COMPLETED BY) HUMAN RESOURCES FINANCIAL RESOURCES ROLES AND RESPONSIBILITIES
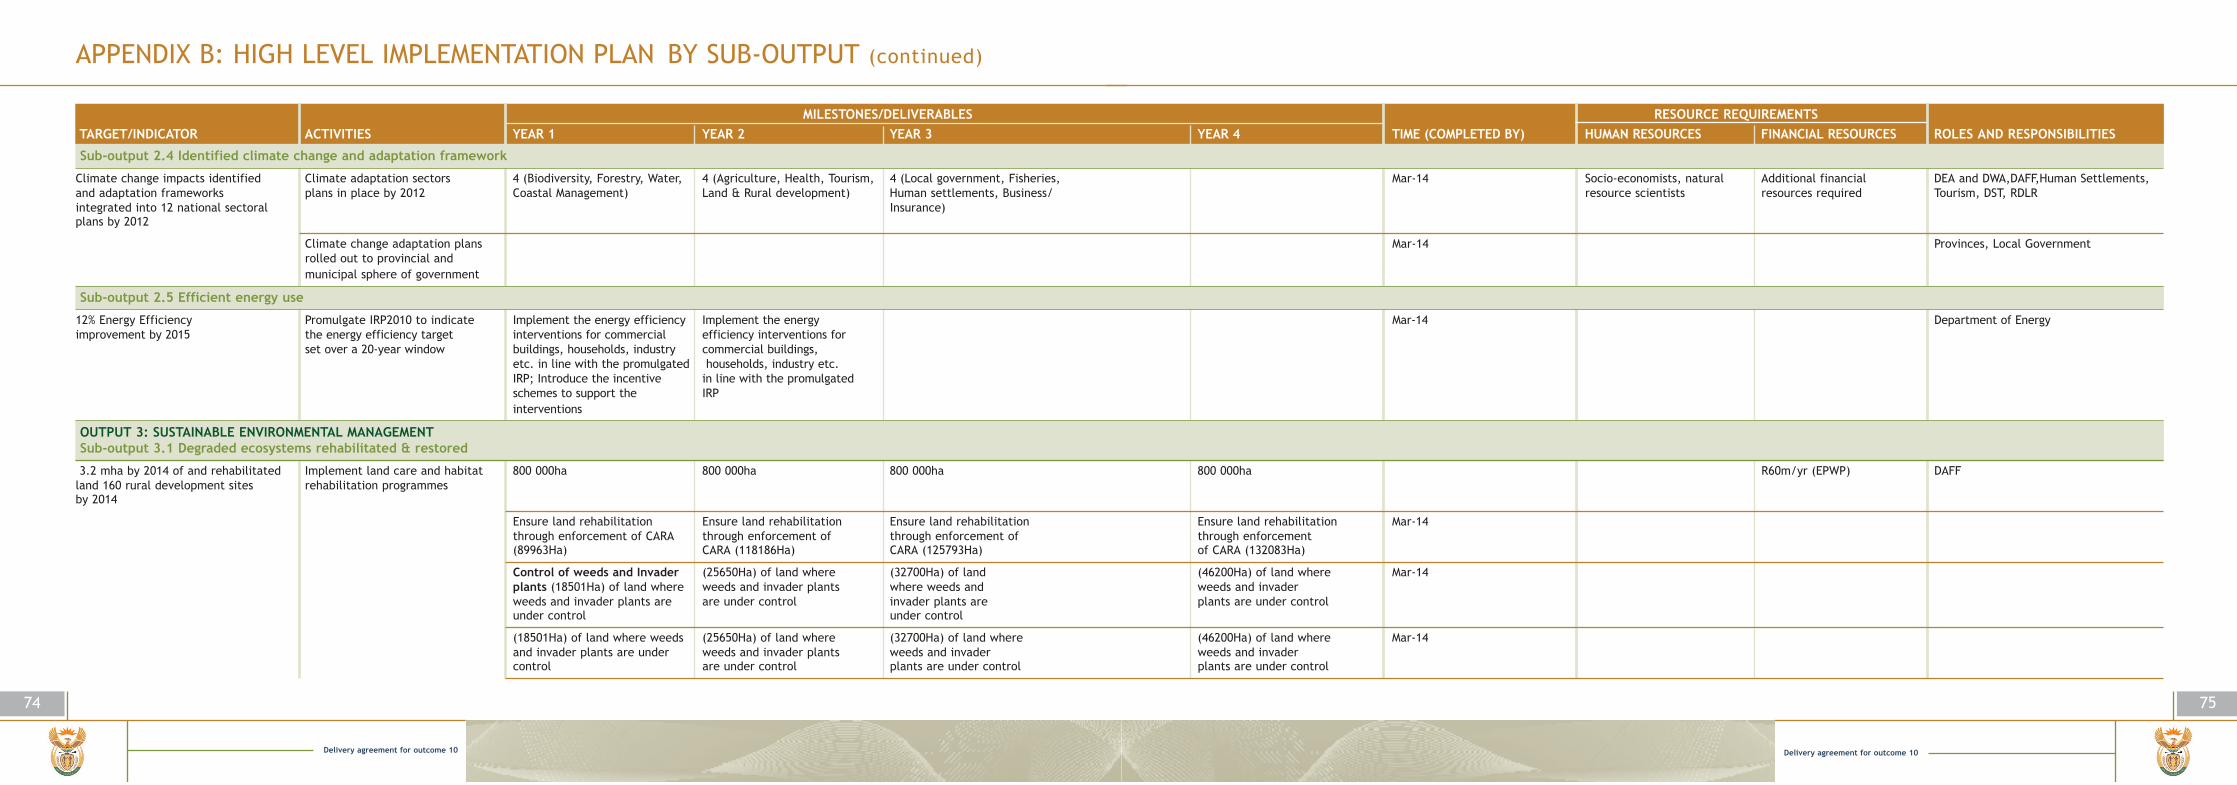
Delivery agreement for outcome 10
75
APPENDIX B: HIGH LEVEL IMPLEMENTATION PLAN BY SUB-OUTPUT (continued)
Sub-output 2.4 Identified climate change and adaptation framework
Climate change impacts identified Climate adaptation sectors 4 (Biodiversity, Forestry, Water, 4 (Agriculture, Health, Tourism, 4 (Local government, Fisheries, Mar-14 Socio-economists, natural Additional financial DEA and DWA,DAFF,Human Settlements,and adaptation frameworks plans in place by 2012 Coastal Management) Land & Rural development) Human settlements, Business/ resource scientists resources required Tourism, DST, RDLRintegrated into 12 national sectoral Insurance)plans by 2012
Climate change adaptation plans Mar-14 Provinces, Local Governmentrolled out to provincial and municipal sphere of government
Sub-output 2.5 Efficient energy use
12% Energy Efficiency Promulgate IRP2010 to indicate Implement the energy efficiency Implement the energy Mar-14 Department of Energyimprovement by 2015 the energy efficiency target interventions for commercial efficiency interventions for
set over a 20-year window buildings, households, industry commercial buildings,etc. in line with the promulgated households, industry etc. IRP; Introduce the incentive in line with the promulgated schemes to support the IRPinterventions
OUTPUT 3: SUSTAINABLE ENVIRONMENTAL MANAGEMENTSub-output 3.1 Degraded ecosystems rehabilitated & restored
3.2 mha by 2014 of and rehabilitated Implement land care and habitat 800 000ha 800 000ha 800 000ha 800 000ha R60m/yr (EPWP) DAFFland 160 rural development sites rehabilitation programmesby 2014
Ensure land rehabilitation Ensure land rehabilitation Ensure land rehabilitation Ensure land rehabilitation Mar-14through enforcement of CARA through enforcement of through enforcement of through enforcement (89963Ha) CARA (118186Ha) CARA (125793Ha) of CARA (132083Ha)
Control of weeds and Invader (25650Ha) of land where (32700Ha) of land (46200Ha) of land where Mar-14plants (18501Ha) of land where weeds and invader plants where weeds and weeds and invader weeds and invader plants are are under control invader plants are plants are under controlunder control under control
(18501Ha) of land where weeds (25650Ha) of land where (32700Ha) of land where (46200Ha) of land where Mar-14and invader plants are under weeds and invader plants weeds and invader weeds and invadercontrol are under control plants are under control plants are under control
74
Delivery agreement for outcome 10
MILESTONES/DELIVERABLES RESOURCE REQUIREMENTSTARGET/INDICATOR ACTIVITIES YEAR 1 YEAR 2 YEAR 3 YEAR 4 TIME (COMPLETED BY) HUMAN RESOURCES FINANCIAL RESOURCES ROLES AND RESPONSIBILITIES
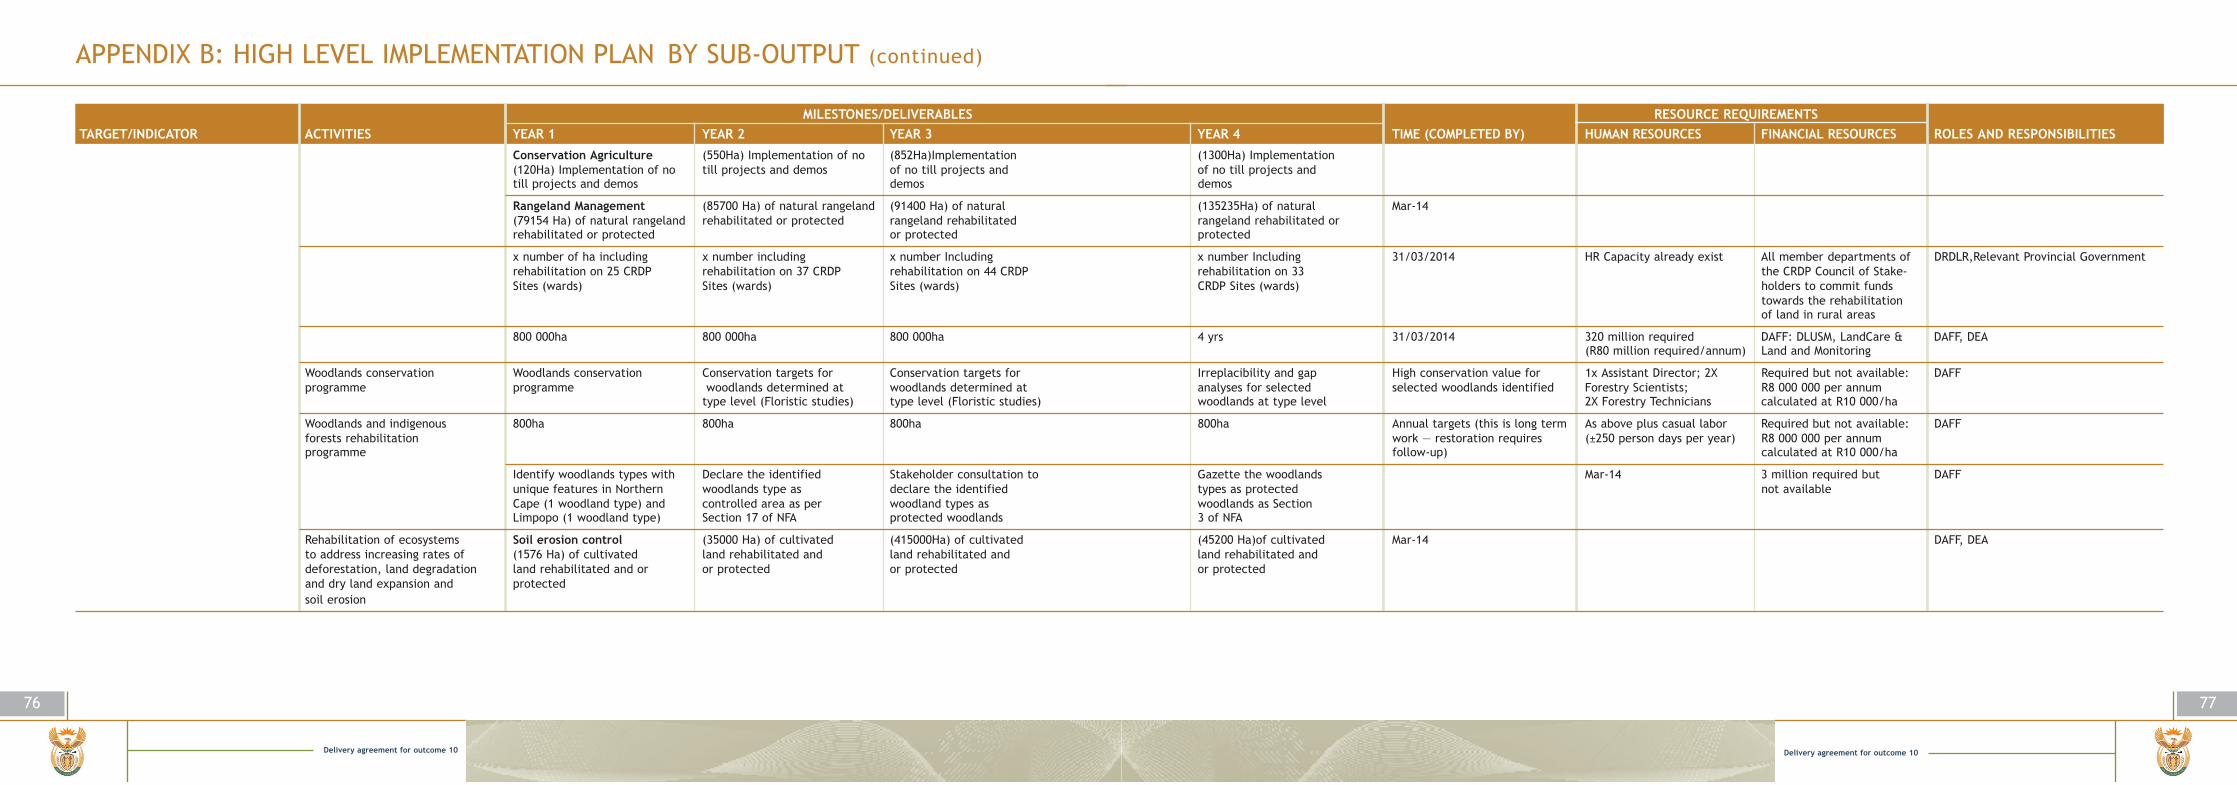
Delivery agreement for outcome 10
77
APPENDIX B: HIGH LEVEL IMPLEMENTATION PLAN BY SUB-OUTPUT (continued)
Conservation Agriculture (550Ha) Implementation of no (852Ha)Implementation (1300Ha) Implementation (120Ha) Implementation of no till projects and demos of no till projects and of no till projects andtill projects and demos demos demos
Rangeland Management (85700 Ha) of natural rangeland (91400 Ha) of natural (135235Ha) of natural Mar-14(79154 Ha) of natural rangeland rehabilitated or protected rangeland rehabilitated rangeland rehabilitated or rehabilitated or protected or protected protected
x number of ha including x number including x number Including x number Including 31/03/2014 HR Capacity already exist All member departments of DRDLR,Relevant Provincial Governmentrehabilitation on 25 CRDP rehabilitation on 37 CRDP rehabilitation on 44 CRDP rehabilitation on 33 the CRDP Council of Stake-Sites (wards) Sites (wards) Sites (wards) CRDP Sites (wards) holders to commit funds
towards the rehabilitation of land in rural areas
800 000ha 800 000ha 800 000ha 4 yrs 31/03/2014 320 million required DAFF: DLUSM, LandCare & DAFF, DEA(R80 million required/annum) Land and Monitoring
Woodlands conservation Woodlands conservation Conservation targets for Conservation targets for Irreplacibility and gap High conservation value for 1x Assistant Director; 2X Required but not available: DAFFprogramme programme woodlands determined at woodlands determined at analyses for selected selected woodlands identified Forestry Scientists; R8 000 000 per annum
type level (Floristic studies) type level (Floristic studies) woodlands at type level 2X Forestry Technicians calculated at R10 000/ha
Woodlands and indigenous 800ha 800ha 800ha 800ha Annual targets (this is long term As above plus casual labor Required but not available: DAFFforests rehabilitation work — restoration requires (±250 person days per year) R8 000 000 per annumprogramme follow-up) calculated at R10 000/ha
Identify woodlands types with Declare the identified Stakeholder consultation to Gazette the woodlands Mar-14 3 million required but DAFFunique features in Northern woodlands type as declare the identified types as protected not availableCape (1 woodland type) and controlled area as per woodland types as woodlands as Section Limpopo (1 woodland type) Section 17 of NFA protected woodlands 3 of NFA
Rehabilitation of ecosystems Soil erosion control (35000 Ha) of cultivated (415000Ha) of cultivated (45200 Ha)of cultivated Mar-14 DAFF, DEAto address increasing rates of (1576 Ha) of cultivated land rehabilitated and land rehabilitated and land rehabilitated and deforestation, land degradation land rehabilitated and or or protected or protected or protectedand dry land expansion and protectedsoil erosion
76
Delivery agreement for outcome 10
MILESTONES/DELIVERABLES RESOURCE REQUIREMENTSTARGET/INDICATOR ACTIVITIES YEAR 1 YEAR 2 YEAR 3 YEAR 4 TIME (COMPLETED BY) HUMAN RESOURCES FINANCIAL RESOURCES ROLES AND RESPONSIBILITIES
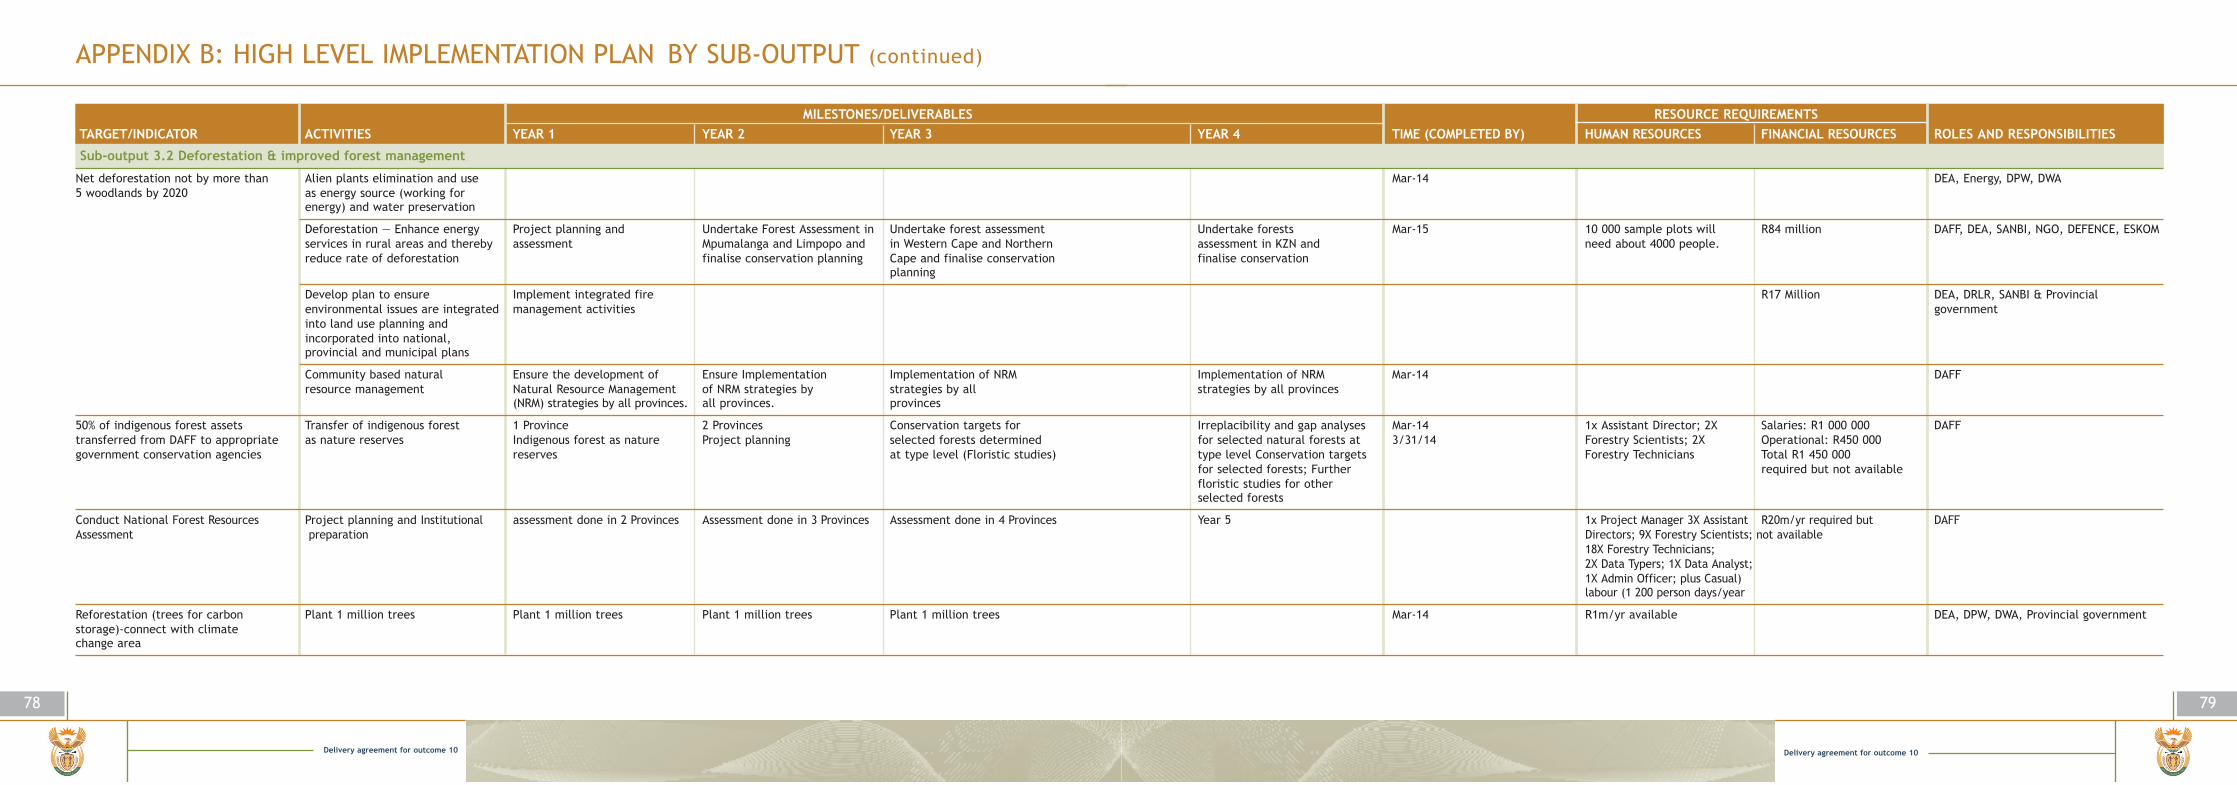
Delivery agreement for outcome 10
79
APPENDIX B: HIGH LEVEL IMPLEMENTATION PLAN BY SUB-OUTPUT (continued)
Sub-output 3.2 Deforestation & improved forest management
Net deforestation not by more than Alien plants elimination and use Mar-14 DEA, Energy, DPW, DWA5 woodlands by 2020 as energy source (working for
energy) and water preservation
Deforestation — Enhance energy Project planning and Undertake Forest Assessment in Undertake forest assessment Undertake forests Mar-15 10 000 sample plots will R84 million DAFF, DEA, SANBI, NGO, DEFENCE, ESKOMservices in rural areas and thereby assessment Mpumalanga and Limpopo and in Western Cape and Northern assessment in KZN and need about 4000 people.reduce rate of deforestation finalise conservation planning Cape and finalise conservation finalise conservation
planning
Develop plan to ensure Implement integrated fire R17 Million DEA, DRLR, SANBI & Provincial environmental issues are integrated management activities governmentinto land use planning and incorporated into national,provincial and municipal plans
Community based natural Ensure the development of Ensure Implementation Implementation of NRM Implementation of NRM Mar-14 DAFFresource management Natural Resource Management of NRM strategies by strategies by all strategies by all provinces
(NRM) strategies by all provinces. all provinces. provinces
50% of indigenous forest assets Transfer of indigenous forest 1 Province 2 Provinces Conservation targets for Irreplacibility and gap analyses Mar-14 1x Assistant Director; 2X Salaries: R1 000 000 DAFFtransferred from DAFF to appropriate as nature reserves Indigenous forest as nature Project planning selected forests determined for selected natural forests at 3/31/14 Forestry Scientists; 2X Operational: R450 000 government conservation agencies reserves at type level (Floristic studies) type level Conservation targets Forestry Technicians Total R1 450 000
for selected forests; Further required but not availablefloristic studies for other selected forests
Conduct National Forest Resources Project planning and Institutional assessment done in 2 Provinces Assessment done in 3 Provinces Assessment done in 4 Provinces Year 5 1x Project Manager 3X Assistant R20m/yr required but DAFFAssessment preparation Directors; 9X Forestry Scientists; not available
18X Forestry Technicians; 2X Data Typers; 1X Data Analyst; 1X Admin Officer; plus Casual)labour (1 200 person days/year
Reforestation (trees for carbon Plant 1 million trees Plant 1 million trees Plant 1 million trees Plant 1 million trees Mar-14 R1m/yr available DEA, DPW, DWA, Provincial governmentstorage)-connect with climate change area
78
Delivery agreement for outcome 10
MILESTONES/DELIVERABLES RESOURCE REQUIREMENTSTARGET/INDICATOR ACTIVITIES YEAR 1 YEAR 2 YEAR 3 YEAR 4 TIME (COMPLETED BY) HUMAN RESOURCES FINANCIAL RESOURCES ROLES AND RESPONSIBILITIES
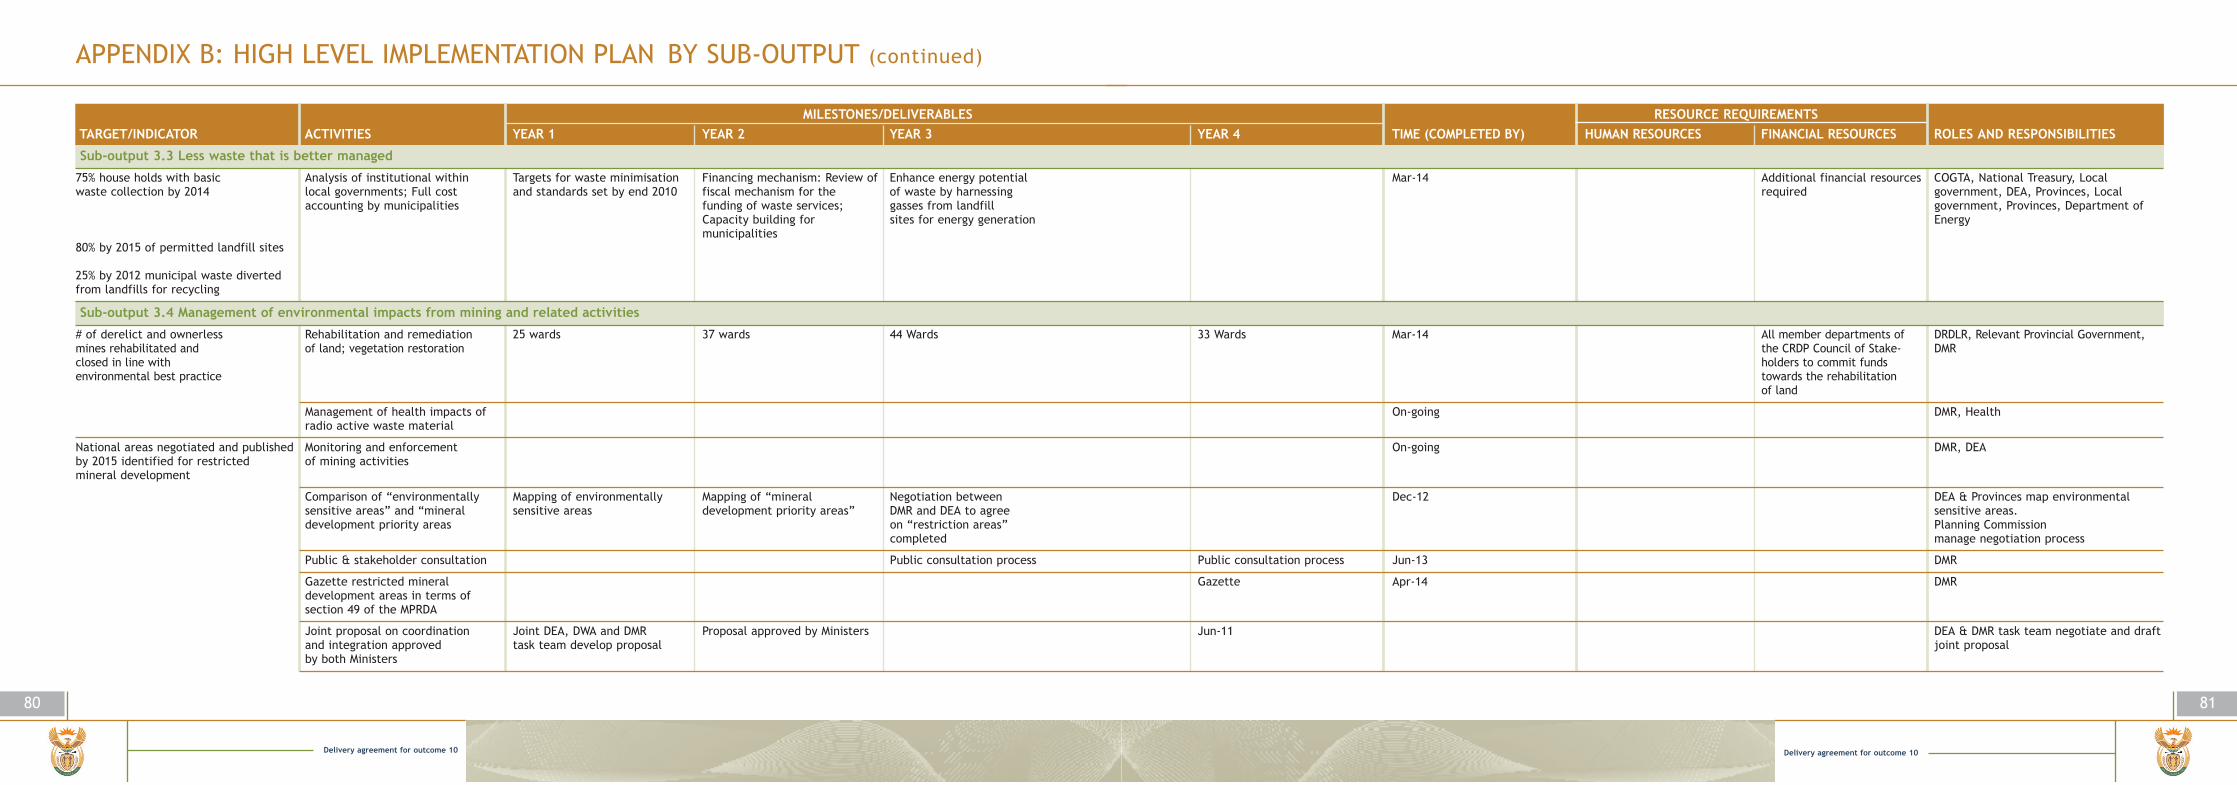
Delivery agreement for outcome 10
81
APPENDIX B: HIGH LEVEL IMPLEMENTATION PLAN BY SUB-OUTPUT (continued)
Sub-output 3.3 Less waste that is better managed
75% house holds with basic Analysis of institutional within Targets for waste minimisation Financing mechanism: Review of Enhance energy potential Mar-14 Additional financial resources COGTA, National Treasury, Local waste collection by 2014 local governments; Full cost and standards set by end 2010 fiscal mechanism for the of waste by harnessing required government, DEA, Provinces, Local
accounting by municipalities funding of waste services; gasses from landfill government, Provinces, Department of Capacity building for sites for energy generation Energymunicipalities
80% by 2015 of permitted landfill sites
25% by 2012 municipal waste diverted from landfills for recycling
Sub-output 3.4 Management of environmental impacts from mining and related activities
# of derelict and ownerless Rehabilitation and remediation 25 wards 37 wards 44 Wards 33 Wards Mar-14 All member departments of DRDLR, Relevant Provincial Government, mines rehabilitated and of land; vegetation restoration the CRDP Council of Stake- DMRclosed in line with holders to commit funds environmental best practice towards the rehabilitation
of land
Management of health impacts of On-going DMR, Healthradio active waste material
National areas negotiated and published Monitoring and enforcement On-going DMR, DEAby 2015 identified for restricted of mining activities mineral development
Comparison of “environmentally Mapping of environmentally Mapping of “mineral Negotiation between Dec-12 DEA & Provinces map environmental sensitive areas” and “mineral sensitive areas development priority areas” DMR and DEA to agree sensitive areas.development priority areas on “restriction areas” Planning Commission
completed manage negotiation process
Public & stakeholder consultation Public consultation process Public consultation process Jun-13 DMR
Gazette restricted mineral Gazette Apr-14 DMRdevelopment areas in terms of section 49 of the MPRDA
Joint proposal on coordination Joint DEA, DWA and DMR Proposal approved by Ministers Jun-11 DEA & DMR task team negotiate and draft and integration approved task team develop proposal joint proposalby both Ministers
80
Delivery agreement for outcome 10
MILESTONES/DELIVERABLES RESOURCE REQUIREMENTSTARGET/INDICATOR ACTIVITIES YEAR 1 YEAR 2 YEAR 3 YEAR 4 TIME (COMPLETED BY) HUMAN RESOURCES FINANCIAL RESOURCES ROLES AND RESPONSIBILITIES
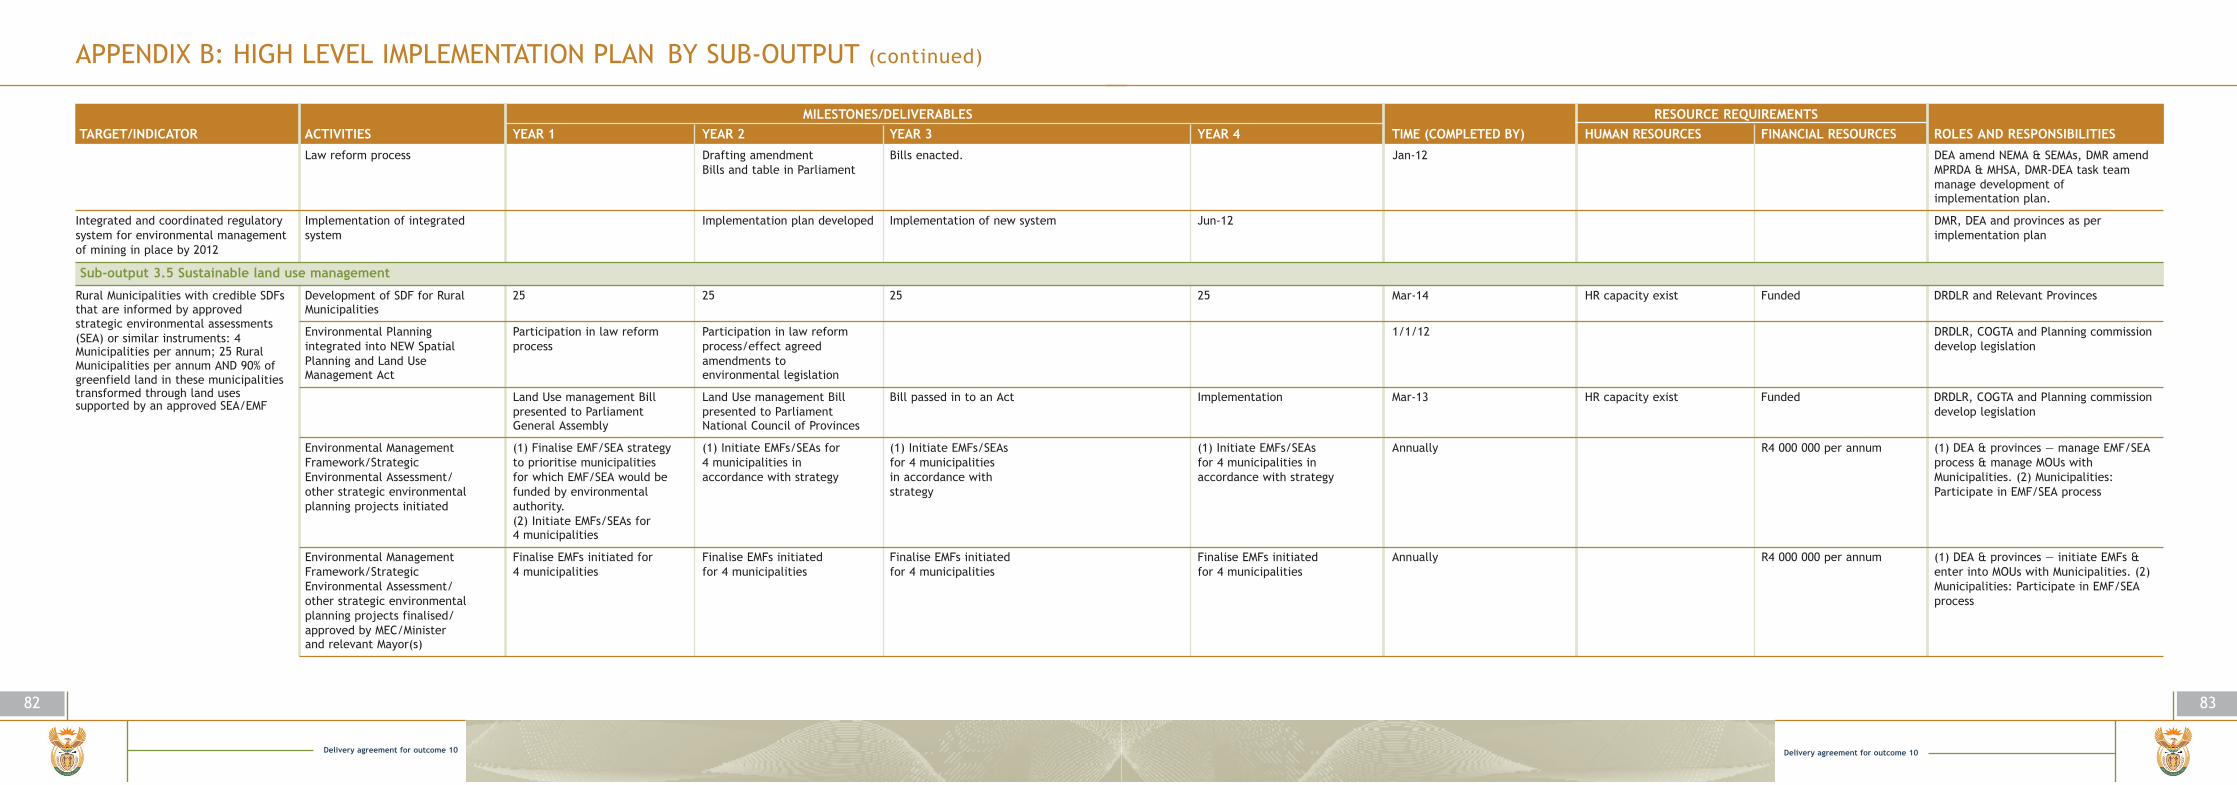
Delivery agreement for outcome 10
83
APPENDIX B: HIGH LEVEL IMPLEMENTATION PLAN BY SUB-OUTPUT (continued)
Law reform process Drafting amendment Bills enacted. Jan-12 DEA amend NEMA & SEMAs, DMR amend Bills and table in Parliament MPRDA & MHSA, DMR-DEA task team
manage development of implementation plan.
Integrated and coordinated regulatory Implementation of integrated Implementation plan developed Implementation of new system Jun-12 DMR, DEA and provinces as per system for environmental management system implementation planof mining in place by 2012
Sub-output 3.5 Sustainable land use management
Rural Municipalities with credible SDFs Development of SDF for Rural 25 25 25 25 Mar-14 HR capacity exist Funded DRDLR and Relevant Provincesthat are informed by approved Municipalities strategic environmental assessments
Environmental Planning Participation in law reform Participation in law reform 1/1/12 DRDLR, COGTA and Planning commission (SEA) or similar instruments: 4 integrated into NEW Spatial process process/effect agreed develop legislationMunicipalities per annum; 25 Rural Planning and Land Use amendments to Municipalities per annum AND 90% of Management Act environmental legislationgreenfield land in these municipalities
Land Use management Bill Land Use management Bill Bill passed in to an Act Implementation Mar-13 HR capacity exist Funded DRDLR, COGTA and Planning commission transformed through land uses
presented to Parliament presented to Parliament develop legislationsupported by an approved SEA/EMF
General Assembly National Council of Provinces
Environmental Management (1) Finalise EMF/SEA strategy (1) Initiate EMFs/SEAs for (1) Initiate EMFs/SEAs (1) Initiate EMFs/SEAs Annually R4 000 000 per annum (1) DEA & provinces — manage EMF/SEA Framework/Strategic to prioritise municipalities 4 municipalities in for 4 municipalities for 4 municipalities in process & manage MOUs with Environmental Assessment/ for which EMF/SEA would be accordance with strategy in accordance with accordance with strategy Municipalities. (2) Municipalities: other strategic environmental funded by environmental strategy Participate in EMF/SEA processplanning projects initiated authority.
(2) Initiate EMFs/SEAs for4 municipalities
Environmental Management Finalise EMFs initiated for Finalise EMFs initiated Finalise EMFs initiated Finalise EMFs initiated Annually R4 000 000 per annum (1) DEA & provinces — initiate EMFs & Framework/Strategic 4 municipalities for 4 municipalities for 4 municipalities for 4 municipalities enter into MOUs with Municipalities. (2) Environmental Assessment/ Municipalities: Participate in EMF/SEA other strategic environmental processplanning projects finalised/approved by MEC/Minister and relevant Mayor(s)
82
Delivery agreement for outcome 10
MILESTONES/DELIVERABLES RESOURCE REQUIREMENTSTARGET/INDICATOR ACTIVITIES YEAR 1 YEAR 2 YEAR 3 YEAR 4 TIME (COMPLETED BY) HUMAN RESOURCES FINANCIAL RESOURCES ROLES AND RESPONSIBILITIES
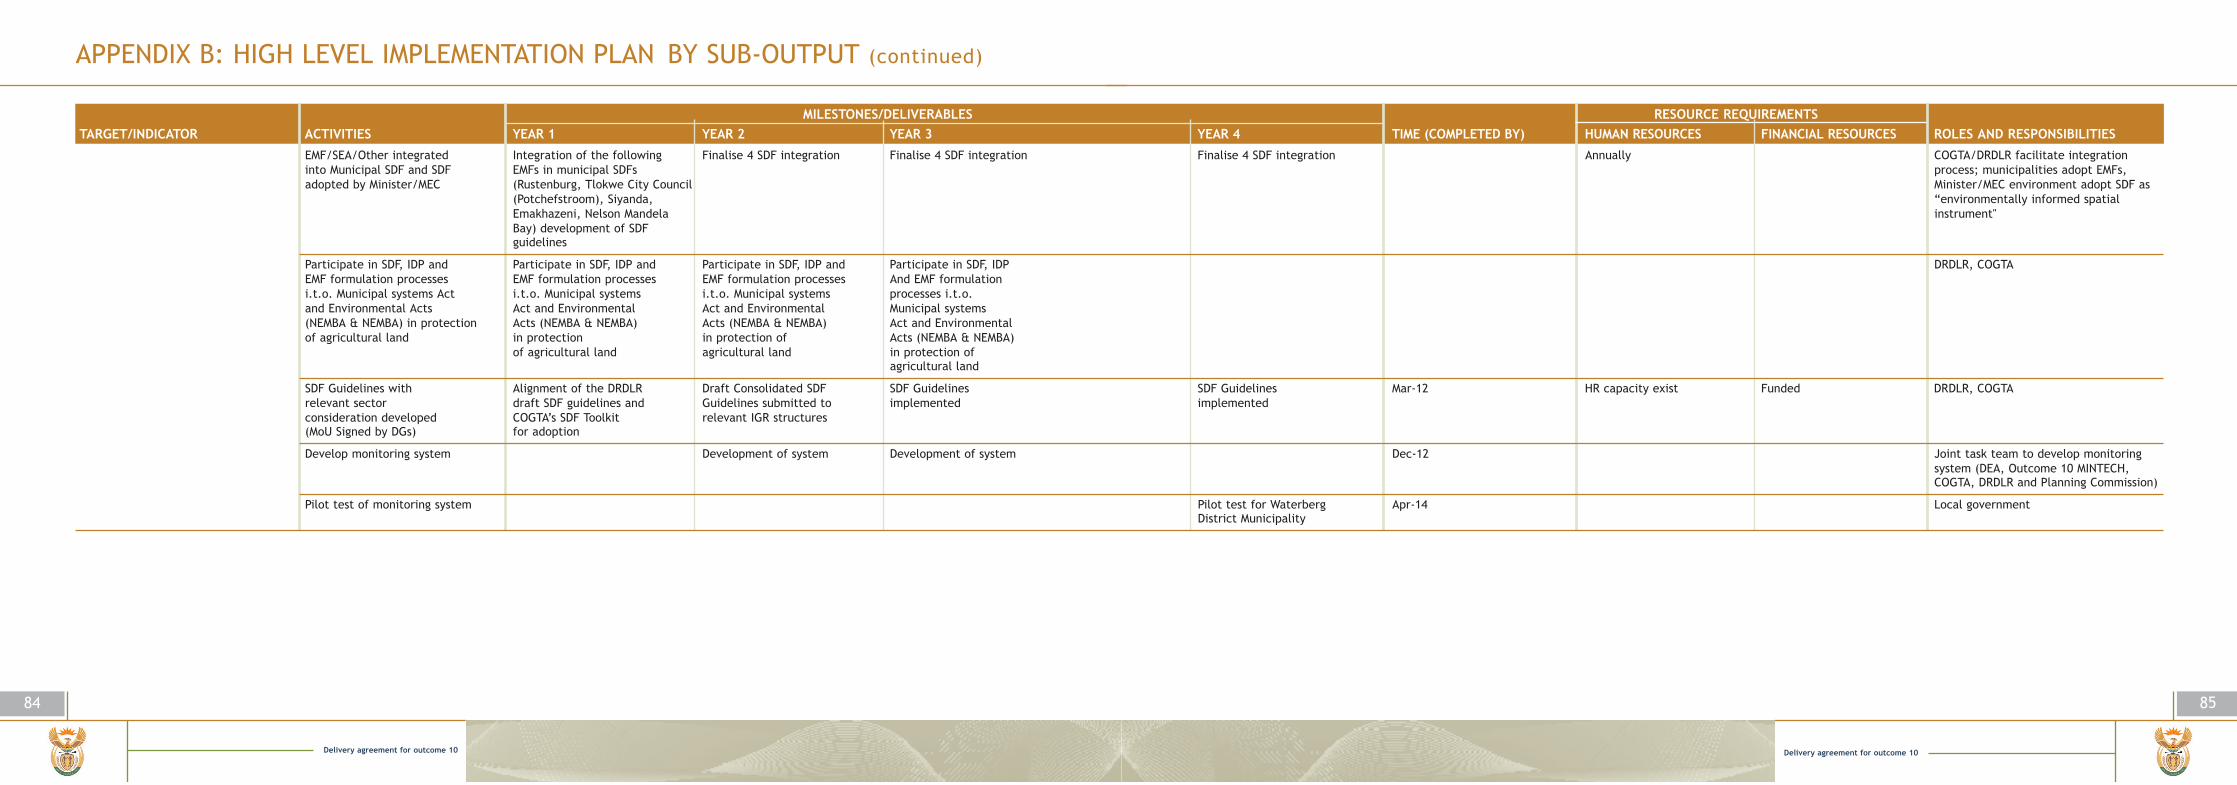
Delivery agreement for outcome 10
85
APPENDIX B: HIGH LEVEL IMPLEMENTATION PLAN BY SUB-OUTPUT (continued)
EMF/SEA/Other integrated Integration of the following Finalise 4 SDF integration Finalise 4 SDF integration Finalise 4 SDF integration Annually COGTA/DRDLR facilitate integration into Municipal SDF and SDF EMFs in municipal SDFs process; municipalities adopt EMFs, adopted by Minister/MEC (Rustenburg, Tlokwe City Council Minister/MEC environment adopt SDF as
(Potchefstroom), Siyanda, “environmentally informed spatial Emakhazeni, Nelson Mandela instrument"Bay) development of SDFguidelines
Participate in SDF, IDP and Participate in SDF, IDP and Participate in SDF, IDP and Participate in SDF, IDP DRDLR, COGTAEMF formulation processes EMF formulation processes EMF formulation processes And EMF formulation i.t.o. Municipal systems Act i.t.o. Municipal systems i.t.o. Municipal systems processes i.t.o. and Environmental Acts Act and Environmental Act and Environmental Municipal systems (NEMBA & NEMBA) in protection Acts (NEMBA & NEMBA) Acts (NEMBA & NEMBA) Act and Environmental of agricultural land in protection in protection of Acts (NEMBA & NEMBA)
of agricultural land agricultural land in protection of agricultural land
SDF Guidelines with Alignment of the DRDLR Draft Consolidated SDF SDF Guidelines SDF Guidelines Mar-12 HR capacity exist Funded DRDLR, COGTArelevant sector draft SDF guidelines and Guidelines submitted to implemented implementedconsideration developed COGTA’s SDF Toolkit relevant IGR structures (MoU Signed by DGs) for adoption
Develop monitoring system Development of system Development of system Dec-12 Joint task team to develop monitoring system (DEA, Outcome 10 MINTECH, COGTA, DRDLR and Planning Commission)
Pilot test of monitoring system Pilot test for Waterberg Apr-14 Local governmentDistrict Municipality
84
Delivery agreement for outcome 10
MILESTONES/DELIVERABLES RESOURCE REQUIREMENTSTARGET/INDICATOR ACTIVITIES YEAR 1 YEAR 2 YEAR 3 YEAR 4 TIME (COMPLETED BY) HUMAN RESOURCES FINANCIAL RESOURCES ROLES AND RESPONSIBILITIES
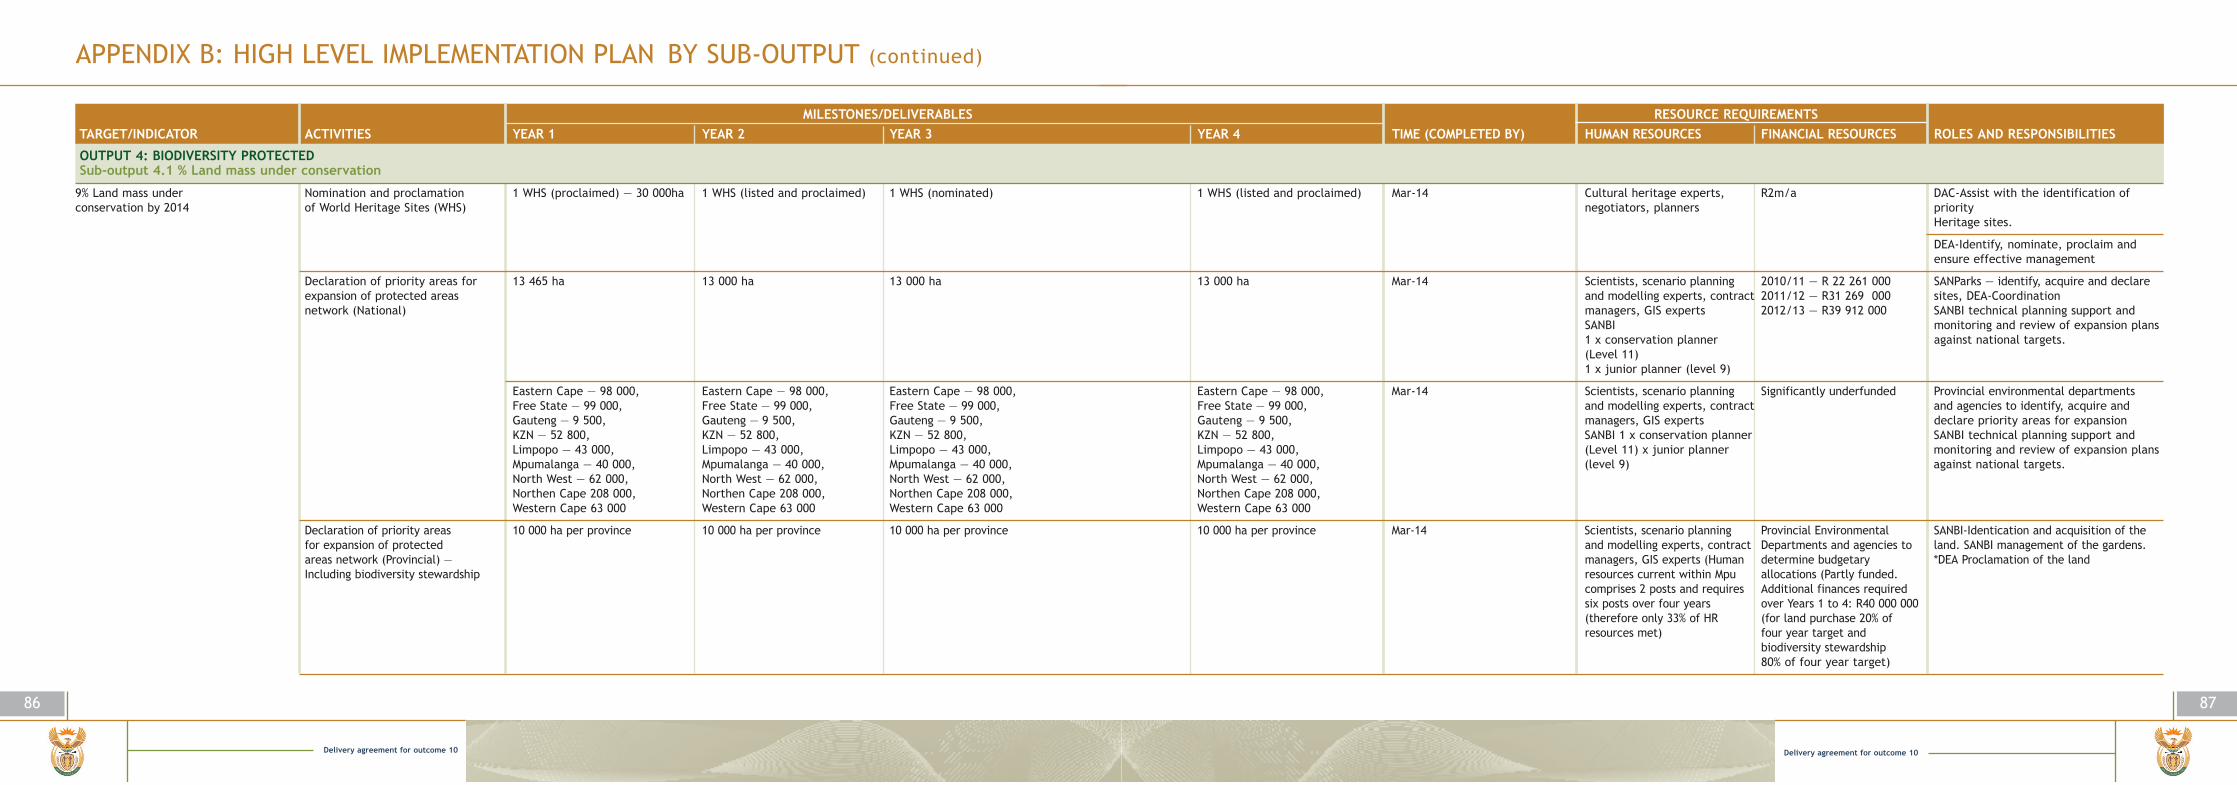
MILESTONES/DELIVERABLES RESOURCE REQUIREMENTSTARGET/INDICATOR ACTIVITIES YEAR 1 YEAR 2 YEAR 3 YEAR 4 TIME (COMPLETED BY) HUMAN RESOURCES FINANCIAL RESOURCES ROLES AND RESPONSIBILITIES
Delivery agreement for outcome 10
87
APPENDIX B: HIGH LEVEL IMPLEMENTATION PLAN BY SUB-OUTPUT (continued)
86
Delivery agreement for outcome 10
OUTPUT 4: BIODIVERSITY PROTECTED Sub-output 4.1 % Land mass under conservation
9% Land mass under Nomination and proclamation 1 WHS (proclaimed) — 30 000ha 1 WHS (listed and proclaimed) 1 WHS (nominated) 1 WHS (listed and proclaimed) Mar-14 Cultural heritage experts, R2m/a DAC-Assist with the identification of conservation by 2014 of World Heritage Sites (WHS) negotiators, planners priority
Heritage sites.
DEA-Identify, nominate, proclaim andensure effective management
Declaration of priority areas for 13 465 ha 13 000 ha 13 000 ha 13 000 ha Mar-14 Scientists, scenario planning 2010/11 — R 22 261 000 SANParks — identify, acquire and declare expansion of protected areas and modelling experts, contract 2011/12 — R31 269 000 sites, DEA-Coordinationnetwork (National) managers, GIS experts 2012/13 — R39 912 000 SANBI technical planning support and
SANBI monitoring and review of expansion plans 1 x conservation planner against national targets.(Level 11)1 x junior planner (level 9)
Eastern Cape — 98 000, Eastern Cape — 98 000, Eastern Cape — 98 000, Eastern Cape — 98 000, Mar-14 Scientists, scenario planning Significantly underfunded Provincial environmental departments Free State — 99 000, Free State — 99 000, Free State — 99 000, Free State — 99 000, and modelling experts, contract and agencies to identify, acquire and Gauteng — 9 500, Gauteng — 9 500, Gauteng — 9 500, Gauteng — 9 500, managers, GIS experts declare priority areas for expansionKZN — 52 800, KZN — 52 800, KZN — 52 800, KZN — 52 800, SANBI 1 x conservation planner SANBI technical planning support and Limpopo — 43 000, Limpopo — 43 000, Limpopo — 43 000, Limpopo — 43 000, (Level 11) x junior planner monitoring and review of expansion plansMpumalanga — 40 000, Mpumalanga — 40 000, Mpumalanga — 40 000, Mpumalanga — 40 000, (level 9) against national targets.North West — 62 000, North West — 62 000, North West — 62 000, North West — 62 000, Northen Cape 208 000, Northen Cape 208 000, Northen Cape 208 000, Northen Cape 208 000, Western Cape 63 000 Western Cape 63 000 Western Cape 63 000 Western Cape 63 000
Declaration of priority areas 10 000 ha per province 10 000 ha per province 10 000 ha per province 10 000 ha per province Mar-14 Scientists, scenario planning Provincial Environmental SANBI-Identication and acquisition of the for expansion of protected and modelling experts, contract Departments and agencies to land. SANBI management of the gardens.areas network (Provincial) — managers, GIS experts (Human determine budgetary *DEA Proclamation of the landIncluding biodiversity stewardship resources current within Mpu allocations (Partly funded.
comprises 2 posts and requires Additional finances required six posts over four years over Years 1 to 4: R40 000 000(therefore only 33% of HR (for land purchase 20% of resources met) four year target and
biodiversity stewardship80% of four year target)
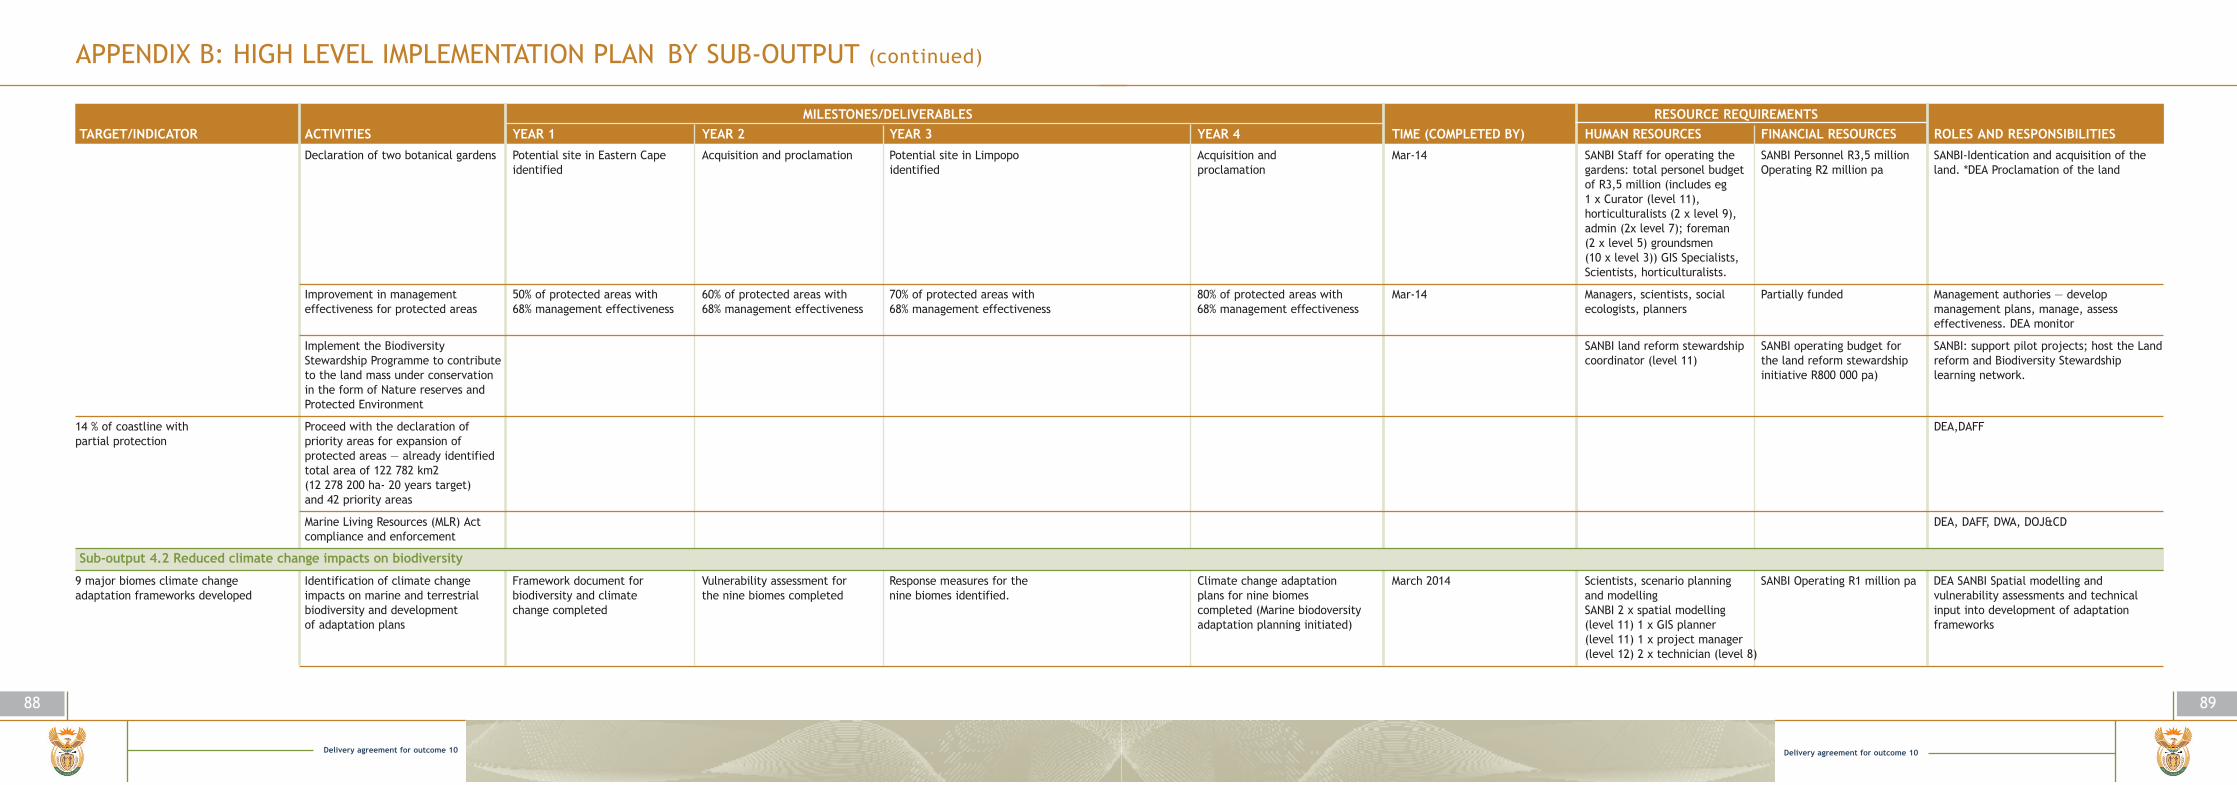
Delivery agreement for outcome 10
89
APPENDIX B: HIGH LEVEL IMPLEMENTATION PLAN BY SUB-OUTPUT (continued)
88
Delivery agreement for outcome 10
MILESTONES/DELIVERABLES RESOURCE REQUIREMENTSTARGET/INDICATOR ACTIVITIES YEAR 1 YEAR 2 YEAR 3 YEAR 4 TIME (COMPLETED BY) HUMAN RESOURCES FINANCIAL RESOURCES ROLES AND RESPONSIBILITIES
Declaration of two botanical gardens Potential site in Eastern Cape Acquisition and proclamation Potential site in Limpopo Acquisition and Mar-14 SANBI Staff for operating the SANBI Personnel R3,5 million SANBI-Identication and acquisition of the identified identified proclamation gardens: total personel budget Operating R2 million pa land. *DEA Proclamation of the land
of R3,5 million (includes eg1 x Curator (level 11),horticulturalists (2 x level 9),admin (2x level 7); foreman (2 x level 5) groundsmen (10 x level 3)) GIS Specialists,Scientists, horticulturalists.
Improvement in management 50% of protected areas with 60% of protected areas with 70% of protected areas with 80% of protected areas with Mar-14 Managers, scientists, social Partially funded Management authories — develop effectiveness for protected areas 68% management effectiveness 68% management effectiveness 68% management effectiveness 68% management effectiveness ecologists, planners management plans, manage, assess
effectiveness. DEA monitor
Implement the Biodiversity SANBI land reform stewardship SANBI operating budget for SANBI: support pilot projects; host the LandStewardship Programme to contribute coordinator (level 11) the land reform stewardship reform and Biodiversity Stewardshipto the land mass under conservation initiative R800 000 pa) learning network.in the form of Nature reserves and Protected Environment
14 % of coastline with Proceed with the declaration of DEA,DAFFpartial protection priority areas for expansion of
protected areas — already identified total area of 122 782 km2 (12 278 200 ha- 20 years target) and 42 priority areas
Marine Living Resources (MLR) Act DEA, DAFF, DWA, DOJ&CDcompliance and enforcement
Sub-output 4.2 Reduced climate change impacts on biodiversity
9 major biomes climate change Identification of climate change Framework document for Vulnerability assessment for Response measures for the Climate change adaptation March 2014 Scientists, scenario planning SANBI Operating R1 million pa DEA SANBI Spatial modelling and adaptation frameworks developed impacts on marine and terrestrial biodiversity and climate the nine biomes completed nine biomes identified. plans for nine biomes and modelling vulnerability assessments and technical
biodiversity and development change completed completed (Marine biodoversity SANBI 2 x spatial modelling input into development of adaptation of adaptation plans adaptation planning initiated) (level 11) 1 x GIS planner frameworks
(level 11) 1 x project manager (level 12) 2 x technician (level 8)

Delivery agreement for outcome 10
91
APPENDIX B: HIGH LEVEL IMPLEMENTATION PLAN BY SUB-OUTPUT (continued)
90
Delivery agreement for outcome 10
MILESTONES/DELIVERABLES RESOURCE REQUIREMENTSTARGET/INDICATOR ACTIVITIES YEAR 1 YEAR 2 YEAR 3 YEAR 4 TIME (COMPLETED BY) HUMAN RESOURCES FINANCIAL RESOURCES ROLES AND RESPONSIBILITIES
Framework for biodiversity and Vulnerability assessment for Response measures for 9 Climate change adaptation 14-Mar Scientist, scenario planners & Unfunded SANBI — scientific inputs, DEA,RDLR, SANBIclimate change response completed the 9 biomes completed biomes identified plans for 9 biomes completed modelling and conservation Provinces — implementation,
experts DEA — co-ordination
Sub-output 4.3 Protected ecosystems and species
Maintain % of coastline prohibiting Marine Living Resources (MLR) Marine spatial biodiversity Data collection and fine scale SANBI SANBI Operating R550 000pa DAFF, DEA fishing or any form of harvesting or Act compliance and enforcement; plan completed and published coastal planning initiated 1 x marine conservation planner SANBI technical planning supportextraction * Provision of scientific information as part of National Biodiversity (Level 11); 2 x marine and monitoring and review of expansion
and data in the identification of Assessment. researchers (level 9); plans against national targets; species protection areas; Fisheries Patrol 1 x marine species monitoring and marine biodiversity Vehicles (FPV) patrols in protected monitoring officer (level 10) research.areas; Oil spill preparedness & mobilisation; Fisheries catch and effort data provided to spatial conservation planning processes;
• Research survey data provided to spatial conservation planning processes
Increase from less than 1% to less that Marine Living Resources (MLR) Act Intensification and monitoring Intensification and monitoring Intensification and monitoring compliance Increase from 9% to 11% 2014 DAFF SANBI 1 x offshore R1 million SANBI Provision of scientific information 3% offshore total area (about 1 million compliance and enforcement; compliance patrols in MPA compliance patrols in MPA patrols in MPA (9% of 3 000 km coastline protected area planner and data in the identification of km2) of the Exclusive Economic Zone * Provision of scientific information (9% of 3 000 km coastline (9% of 3000 km coastline (level 11) protection areas(EEZ) in which fishing and any form of and data in the identification harvesting that are detrimental to the of protection areasbenthic environment are prohibited
Increasing number of species Developing Biodiversity 2 species management 2 species management 2 species management 2 species management plans Mar-14 Species specialists Funded DEA — evaluation & approval, SANBI — under formal protection management plans for species plans developed plans developed plans developed developed SANBI 2 x threatened animal SANBI operating R250 000 pa scientific authority
species specialists (level 10) SANBI technical support for development ofmanagement plans

Delivery agreement for outcome 10
93
APPENDIX B: HIGH LEVEL IMPLEMENTATION PLAN BY SUB-OUTPUT (continued)
92
Delivery agreement for outcome 10
Amending TOPS lists based on Criteria for listing developed “Draft list compiled and List finalised and published Amend Regulations to ensure Mar-14 Species specialists; Scientists; Funded DEA — Development of lists & regulations,specific criteria Non-detriment findings for trade published for public comment Non-detriment findings for trade protection of listed species Taxonomists; Conservation SANBI operating R450 000pa SANBI — taxonomy, scientific criteria &
General operations of the Non-detriment findings for General operations of the Scientific Non-detriment findings for specialists; ecologist listing, Provinces — implementationscientific Authority Compliance trade General operations of the Authority Compliance with CITES trade General operations of SANBI 4 x animal taxonomistswith CITES processes Improved Scientific Authority Compliance processes Improved implementation the Scientific Authority (level 8) 1 x conservationimplementation of TOPS with CITES processes of TOPS Improved animal taxomony Compliance with CITES processes biologists (level 9) 1 x Improved animal taxomony for Improved implementation for threatened species Improved implementation of Administrator (secretariat)threatened species of TOPS. Improved animal TOPS Improved animal taxomony (level 8, requires BSc) 1 x Scientist -
taxomony for threatened species for threatened species animals (level 9) 1 x Population biologist (level 10)
Develop and implement Alien and Invasive Species Alien and Invasive Species “Draft national Strategy National Strategy and Action Mar-14 AIS specialists; Risk assessment Current funding for DEA — Development of strategy & regulations and tools to prevent, regulations finalised Risk Assessment Framework and Action Plan for alien and invasive Plan for alien and invasive specialists; EMIs SANBI implementation inadequate regulations, SANBI — scientific control or eradicate Alien finalised; Draft Guidelines species published for public species finalised and requirement Risk analysis SANBI operating requirement criteria & support for listing, dataand Invasive Species for the preparation of participation; Guidelines for the approved; Development of specialist (level 10) R700 000 p.a. (risk assessment management, risk assessments, monitoring;
monitoring and control plan preparation of monitoring and control monitoring and control plans Data manager (level 9) and targeted research) DWA DAFF & Provinces — implementationfor alien and invasive species plans implemented SANBI: Database of by organs of state initiated; Invasive species scientist R1 500 000 p.a. (monitoring)
invasives and risk assessments Risk Development of species (level 10) Monitoring assessments of invasives (plants & management programmes co-ordinator (level 12)animals) Scientific support for listing initiated SANBI: Database of Monitoring system invasives and risk
assessments Risk assessmentsof invasives (plants & animals) Scientific support for listing Monitoring system
Habitat loss reduced through Criteria for listing of aquatic List of threatened or Threatening processes/activities Enforcement of NEMA 3/1/14 Ecosystem specialists Funded SANBI — scientific authority, development protection of threatened or ecosystems developed protected ecosystems in ecosystems identified and regulated Threatened river, estuary — especially in terms of the SANBI operating R250 000pa of criteria and draft lists, monitoringprotected ecosystems Draft threatened river Draft threatened marine in terms of NEMA Identification of and marine ecosystems gazetted functioning of ecosystems DEA & Provinces — implementation &
ecosystems identified ecosystems identified terrestrial ecosystems under criterion B (dynamics of ecosystems) and NEMA enforcement”draft threatened estuary Threatened river, estuary and marine threatening processes affectingecosystems identified ecosystems gazetted for public comment ecosystems Enforcement
resources SANBI 1 x threatened ecosystems ecologist (level 10)1 x marine threatened ecosystem ecologist(level 11)
MILESTONES/DELIVERABLES RESOURCE REQUIREMENTSTARGET/INDICATOR ACTIVITIES YEAR 1 YEAR 2 YEAR 3 YEAR 4 TIME (COMPLETED BY) HUMAN RESOURCES FINANCIAL RESOURCES ROLES AND RESPONSIBILITIES

Delivery agreement for outcome 10
95
APPENDIX B: HIGH LEVEL IMPLEMENTATION PLAN BY SUB-OUTPUT (continued)
94
Delivery agreement for outcome 10
Reduced number of species included Consideration of protection of Establish programme to Provide capacity development Provide capacity development Provide capacity development 2014 SANBI 10 x Biodiversity advisors SANBI operating DEA, SANBI distribute biodiversity in the red data list: Proportion of species through Land use planning promote integration of opportunities for municipalities opportunities for municipalities opportunities for municipalities (level 10); 1 x programme R1 million pa information and provide capacity species threatened with extinction biodiversity and ecosystem- coordinator (level 11) development support
based approaches to climate change adaptation into land use planning Distribute biodiversity information to all municipalities
Development and implementation Management plans for species Management plans for Management plans for species Management plans for 2014 SANBI requirement 2 SANBI operating requirement DEA, SANBI technical support on of interventions to manage requiring interventions developed species requiring requiring interventions developed species requiring X population R700,000 p.a. development of management plansoverexploitation of species interventions developed interventions developed ecologists (level 10)
Targeted protection of priority 4 draft bioregional plans 2 additional bioregional & 2 additional bioregional & 2 2 additional bioregional 2014 SANBI 1 x bioregional planner SANBI operating R300 000pa DEA, SANBI support development of habitats (NM moss; Gert Sibande; 2 additional biodiversity additional biodiversity sector plans & 2 additional biodiversity (level 11) bioregional and biodiversity sector plans;
Gauteng metros; Namakwa) sector plans sector plans convening of bioregional review panel
Development of research base Implement research Implement research Implement research Implement research 2014 DEA, DST, ARCon species and biological programmes programmes programmes programmescontrol agents
Management plans in place for Draft framework for management Framework for management 2014 SANBI Monitoring co-ordinator SANBI operating requirement DEA, SANBI research and draftingmajor alien species that plans developed plans finalised (level 12); Invasive species R700,000 p.a. of management plansthreaten ecosystems habitats scientist (level 10)or species AND Pathways for major potential alien invasive species controlled
10% increase on 2010 levels for recovery Expansion of fresh water and marine Implementation of the Implementation of the Implementation of the Aquaculture 10% increase on 2010 stock 2014 DAFF, DTIof key fisheries (hake, abalone & aquaculture (link to outcome 4) Aquaculture Development Plan Aquaculture Development Plan Development Plan levels for hake, abalone and rock lobster stocks) by 2014 rock lobster
Implementation of resource specific Conduct annual surveys stocks Conduct annual surveys Conduct annual surveys stocks in 3 10% increase on 2010 stock 2014 DAFF, DTIrecovery plans (link to outcome 4) in 3 fisheries (hake, abalone stocks in 3 fisheries (hake, fisheries (hake, abalone and rock lobsters levels for hake, abalone and
and rock lobsters abalone and rock lobsters rock lobster
Implementation of the Abalone Reduction of poaching by 15% Reduction of poaching by 15% Reduction of poaching by 15% Reduction of poaching by 15% 2025 DAFFRecovery Strategy
MILESTONES/DELIVERABLES RESOURCE REQUIREMENTSTARGET/INDICATOR ACTIVITIES YEAR 1 YEAR 2 YEAR 3 YEAR 4 TIME (COMPLETED BY) HUMAN RESOURCES FINANCIAL RESOURCES ROLES AND RESPONSIBILITIES
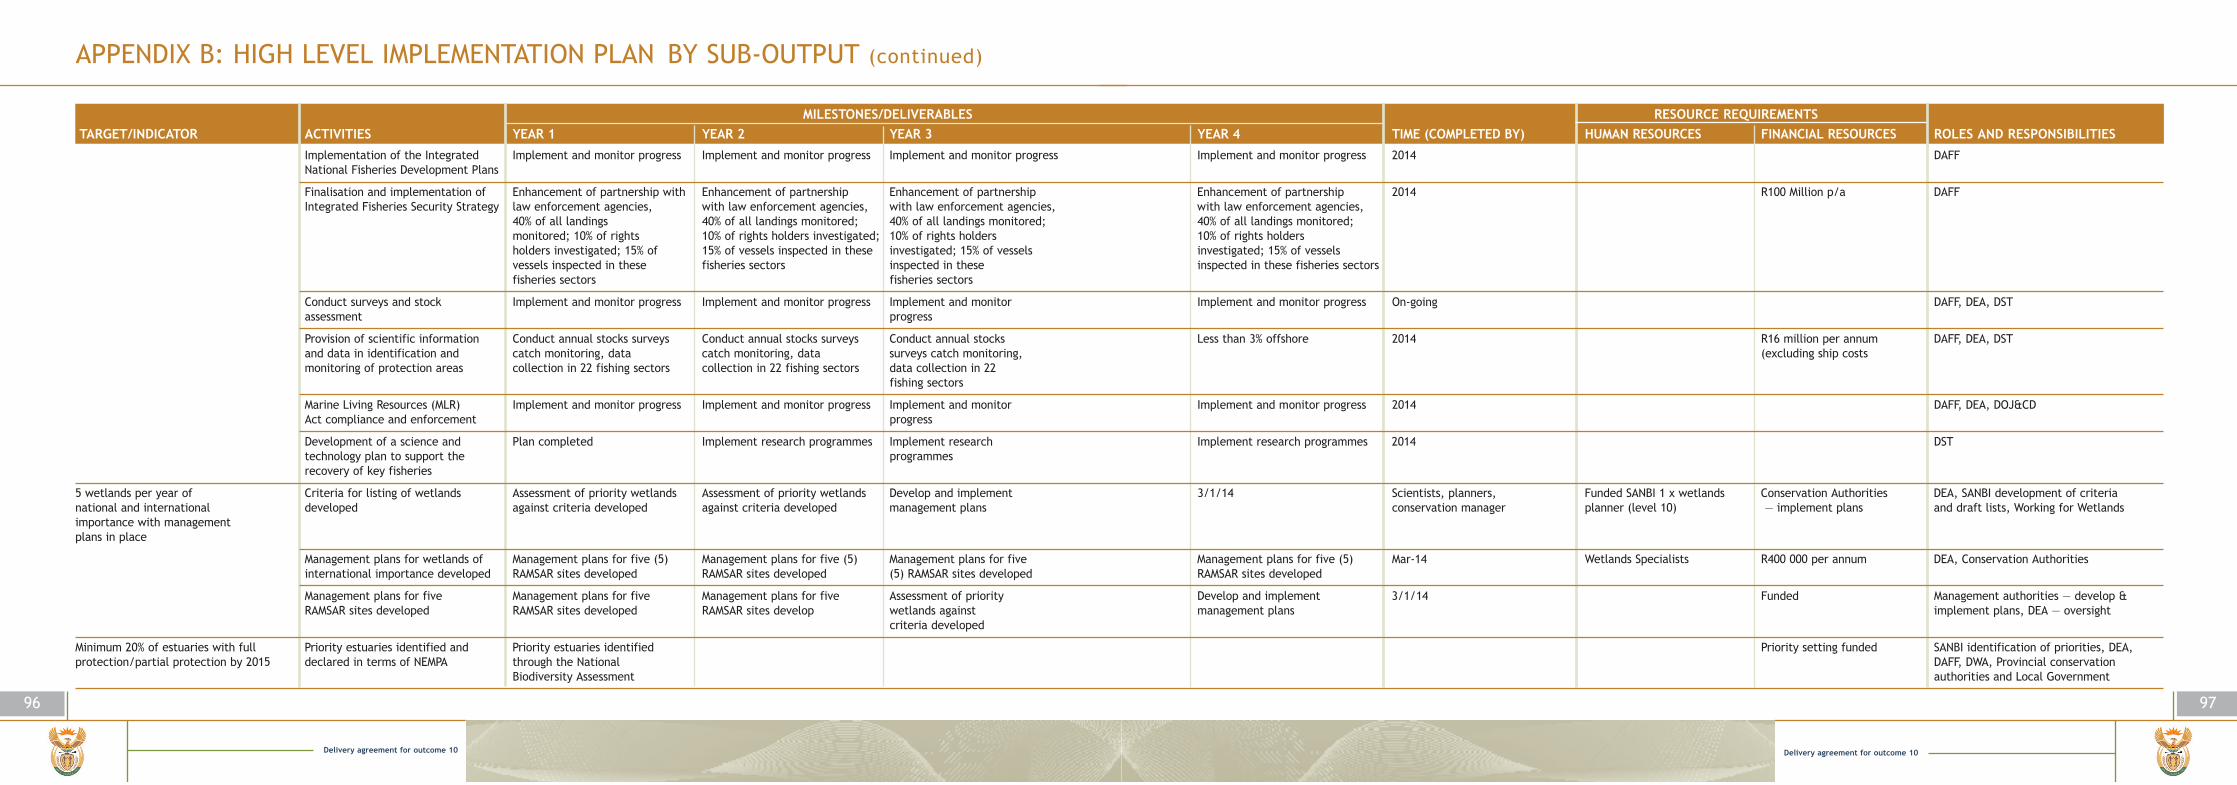
Delivery agreement for outcome 10
97
APPENDIX B: HIGH LEVEL IMPLEMENTATION PLAN BY SUB-OUTPUT (continued)
96
Delivery agreement for outcome 10
MILESTONES/DELIVERABLES RESOURCE REQUIREMENTSTARGET/INDICATOR ACTIVITIES YEAR 1 YEAR 2 YEAR 3 YEAR 4 TIME (COMPLETED BY) HUMAN RESOURCES FINANCIAL RESOURCES ROLES AND RESPONSIBILITIES
Implementation of the Integrated Implement and monitor progress Implement and monitor progress Implement and monitor progress Implement and monitor progress 2014 DAFFNational Fisheries Development Plans
Finalisation and implementation of Enhancement of partnership with Enhancement of partnership Enhancement of partnership Enhancement of partnership 2014 R100 Million p/a DAFFIntegrated Fisheries Security Strategy law enforcement agencies, with law enforcement agencies, with law enforcement agencies, with law enforcement agencies,
40% of all landings 40% of all landings monitored; 40% of all landings monitored; 40% of all landings monitored; monitored; 10% of rights 10% of rights holders investigated; 10% of rights holders 10% of rights holders holders investigated; 15% of 15% of vessels inspected in these investigated; 15% of vessels investigated; 15% of vessels vessels inspected in these fisheries sectors inspected in these inspected in these fisheries sectorsfisheries sectors fisheries sectors
Conduct surveys and stock Implement and monitor progress Implement and monitor progress Implement and monitor Implement and monitor progress On-going DAFF, DEA, DSTassessment progress
Provision of scientific information Conduct annual stocks surveys Conduct annual stocks surveys Conduct annual stocks Less than 3% offshore 2014 R16 million per annum DAFF, DEA, DSTand data in identification and catch monitoring, data catch monitoring, data surveys catch monitoring, (excluding ship costsmonitoring of protection areas collection in 22 fishing sectors collection in 22 fishing sectors data collection in 22
fishing sectors
Marine Living Resources (MLR) Implement and monitor progress Implement and monitor progress Implement and monitor Implement and monitor progress 2014 DAFF, DEA, DOJ&CDAct compliance and enforcement progress
Development of a science and Plan completed Implement research programmes Implement research Implement research programmes 2014 DSTtechnology plan to support the programmesrecovery of key fisheries
5 wetlands per year of Criteria for listing of wetlands Assessment of priority wetlands Assessment of priority wetlands Develop and implement 3/1/14 Scientists, planners, Funded SANBI 1 x wetlands Conservation Authorities DEA, SANBI development of criteria national and international developed against criteria developed against criteria developed management plans conservation manager planner (level 10) — implement plans and draft lists, Working for Wetlandsimportance with management plans in place
Management plans for wetlands of Management plans for five (5) Management plans for five (5) Management plans for five Management plans for five (5) Mar-14 Wetlands Specialists R400 000 per annum DEA, Conservation Authoritiesinternational importance developed RAMSAR sites developed RAMSAR sites developed (5) RAMSAR sites developed RAMSAR sites developed
Management plans for five Management plans for five Management plans for five Assessment of priority Develop and implement 3/1/14 Funded Management authorities — develop & RAMSAR sites developed RAMSAR sites developed RAMSAR sites develop wetlands against management plans implement plans, DEA — oversight
criteria developed
Minimum 20% of estuaries with full Priority estuaries identified and Priority estuaries identified Priority setting funded SANBI identification of priorities, DEA, protection/partial protection by 2015 declared in terms of NEMPA through the National DAFF, DWA, Provincial conservation
Biodiversity Assessment authorities and Local Government
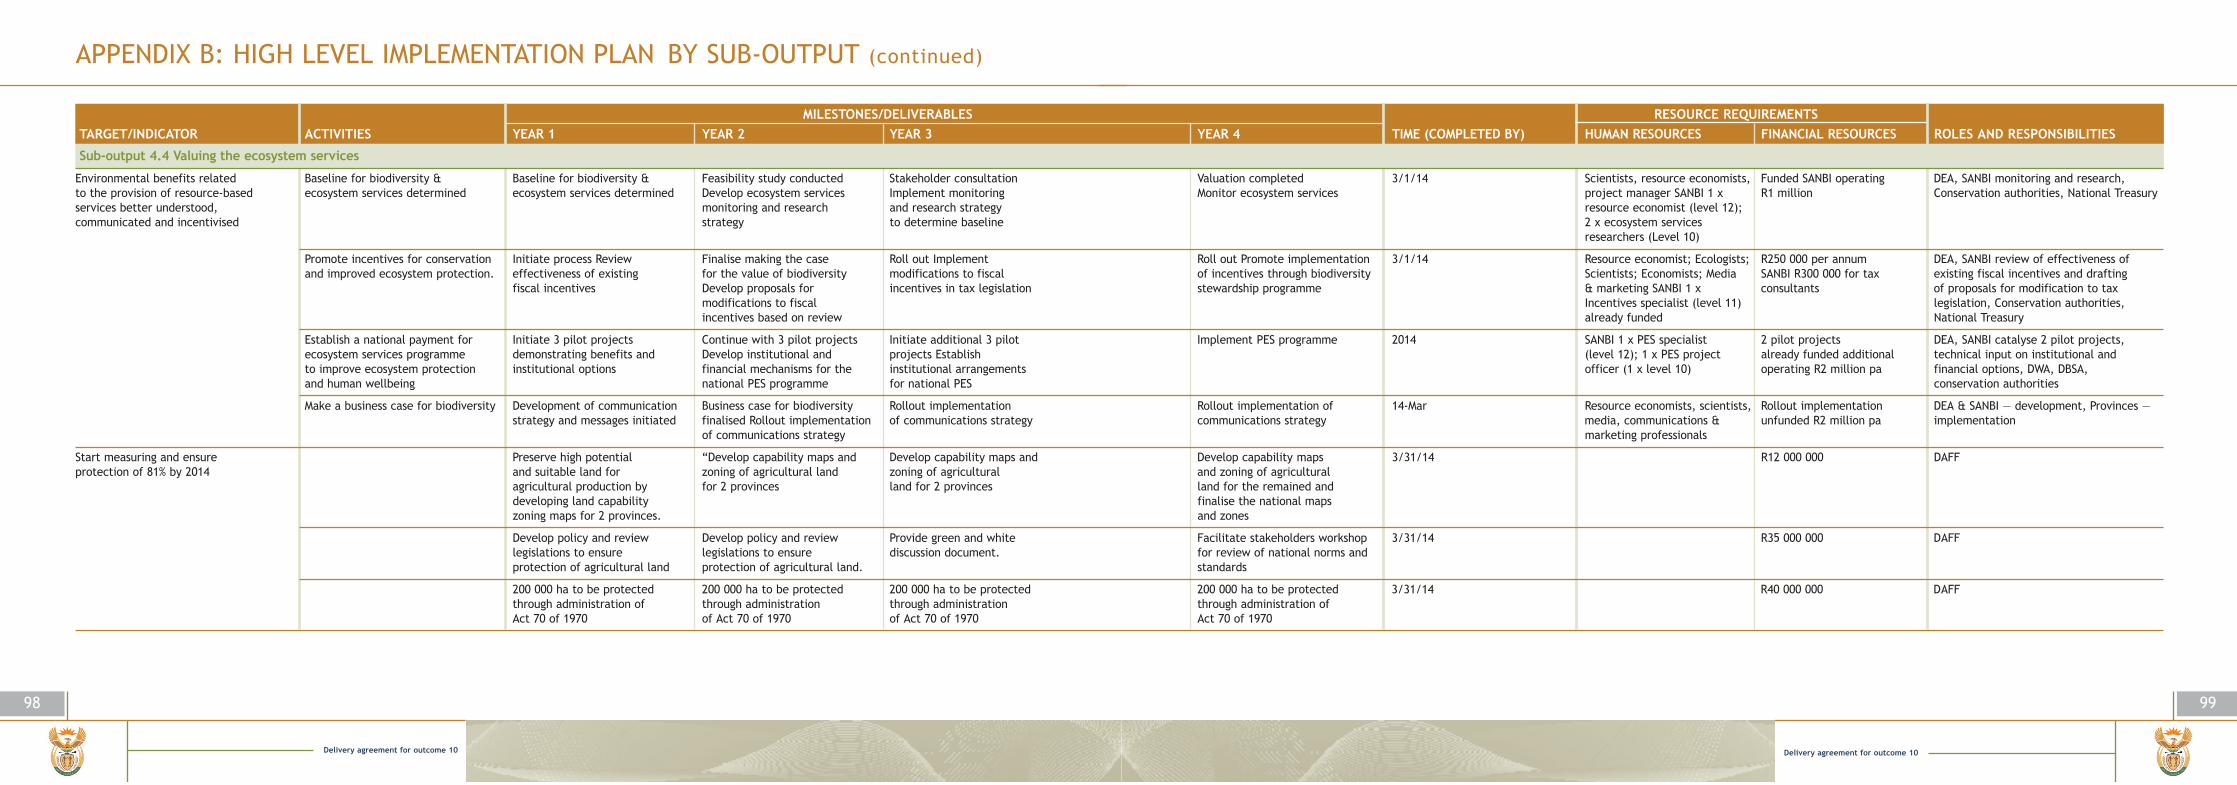
Delivery agreement for outcome 10
99
APPENDIX B: HIGH LEVEL IMPLEMENTATION PLAN BY SUB-OUTPUT (continued)
98
Delivery agreement for outcome 10
MILESTONES/DELIVERABLES RESOURCE REQUIREMENTSTARGET/INDICATOR ACTIVITIES YEAR 1 YEAR 2 YEAR 3 YEAR 4 TIME (COMPLETED BY) HUMAN RESOURCES FINANCIAL RESOURCES ROLES AND RESPONSIBILITIES
Sub-output 4.4 Valuing the ecosystem services
Environmental benefits related Baseline for biodiversity & Baseline for biodiversity & Feasibility study conducted Stakeholder consultation Valuation completed 3/1/14 Scientists, resource economists, Funded SANBI operating DEA, SANBI monitoring and research, to the provision of resource-based ecosystem services determined ecosystem services determined Develop ecosystem services Implement monitoring Monitor ecosystem services project manager SANBI 1 x R1 million Conservation authorities, National Treasuryservices better understood, monitoring and research and research strategy resource economist (level 12);communicated and incentivised strategy to determine baseline 2 x ecosystem services
researchers (Level 10)
Promote incentives for conservation Initiate process Review Finalise making the case Roll out Implement Roll out Promote implementation 3/1/14 Resource economist; Ecologists; R250 000 per annum DEA, SANBI review of effectiveness of and improved ecosystem protection. effectiveness of existing for the value of biodiversity modifications to fiscal of incentives through biodiversity Scientists; Economists; Media SANBI R300 000 for tax existing fiscal incentives and drafting
fiscal incentives Develop proposals for incentives in tax legislation stewardship programme & marketing SANBI 1 x consultants of proposals for modification to tax modifications to fiscal Incentives specialist (level 11) legislation, Conservation authorities, incentives based on review already funded National Treasury
Establish a national payment for Initiate 3 pilot projects Continue with 3 pilot projects Initiate additional 3 pilot Implement PES programme 2014 SANBI 1 x PES specialist 2 pilot projects DEA, SANBI catalyse 2 pilot projects, ecosystem services programme demonstrating benefits and Develop institutional and projects Establish (level 12); 1 x PES project already funded additional technical input on institutional and to improve ecosystem protection institutional options financial mechanisms for the institutional arrangements officer (1 x level 10) operating R2 million pa financial options, DWA, DBSA, and human wellbeing national PES programme for national PES conservation authorities
Make a business case for biodiversity Development of communication Business case for biodiversity Rollout implementation Rollout implementation of 14-Mar Resource economists, scientists, Rollout implementation DEA & SANBI — development, Provinces — strategy and messages initiated finalised Rollout implementation of communications strategy communications strategy media, communications & unfunded R2 million pa implementation
of communications strategy marketing professionals
Start measuring and ensure Preserve high potential “Develop capability maps and Develop capability maps and Develop capability maps 3/31/14 R12 000 000 DAFFprotection of 81% by 2014 and suitable land for zoning of agricultural land zoning of agricultural and zoning of agricultural
agricultural production by for 2 provinces land for 2 provinces land for the remained and developing land capability finalise the national maps zoning maps for 2 provinces. and zones
Develop policy and review Develop policy and review Provide green and white Facilitate stakeholders workshop 3/31/14 R35 000 000 DAFFlegislations to ensure legislations to ensure discussion document. for review of national norms and protection of agricultural land protection of agricultural land. standards
200 000 ha to be protected 200 000 ha to be protected 200 000 ha to be protected 200 000 ha to be protected 3/31/14 R40 000 000 DAFFthrough administration of through administration through administration through administration of Act 70 of 1970 of Act 70 of 1970 of Act 70 of 1970 Act 70 of 1970
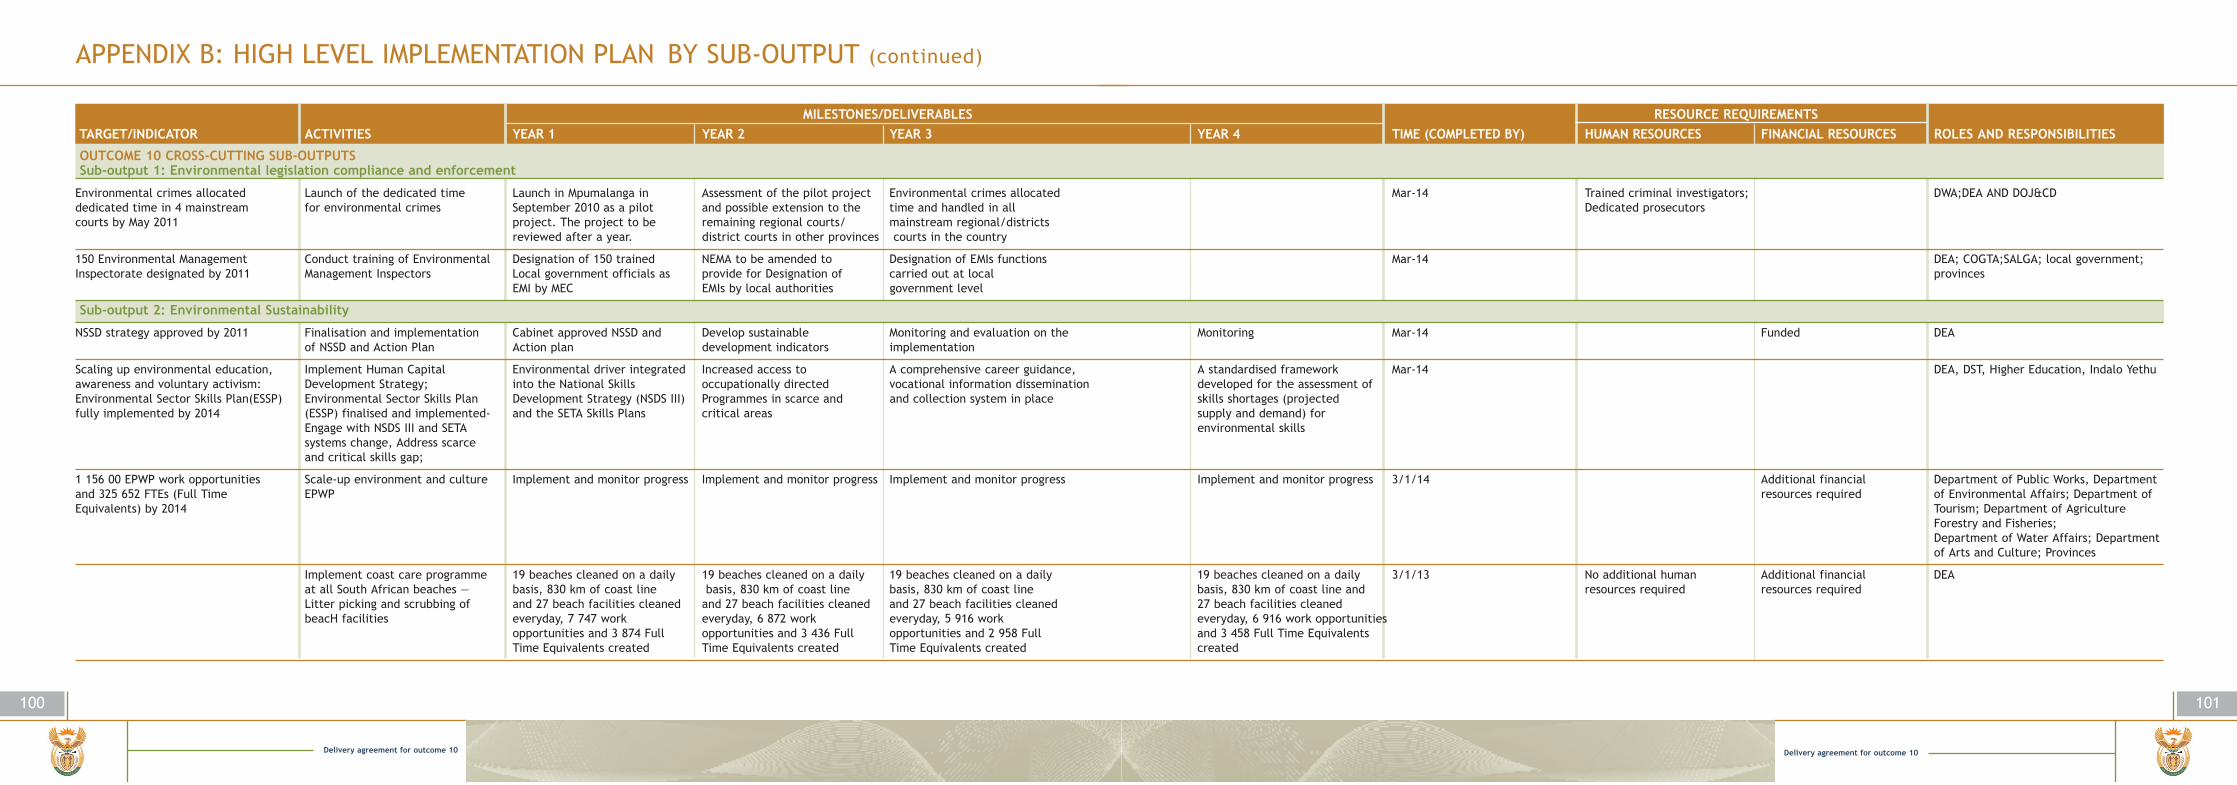
Delivery agreement for outcome 10
101
APPENDIX B: HIGH LEVEL IMPLEMENTATION PLAN BY SUB-OUTPUT (continued)
100
Delivery agreement for outcome 10
MILESTONES/DELIVERABLES RESOURCE REQUIREMENTSTARGET/INDICATOR ACTIVITIES YEAR 1 YEAR 2 YEAR 3 YEAR 4 TIME (COMPLETED BY) HUMAN RESOURCES FINANCIAL RESOURCES ROLES AND RESPONSIBILITIES
OUTCOME 10 CROSS-CUTTING SUB-OUTPUTSSub-output 1: Environmental legislation compliance and enforcement
Environmental crimes allocated Launch of the dedicated time Launch in Mpumalanga in Assessment of the pilot project Environmental crimes allocated Mar-14 Trained criminal investigators; DWA;DEA AND DOJ&CDdedicated time in 4 mainstream for environmental crimes September 2010 as a pilot and possible extension to the time and handled in all Dedicated prosecutorscourts by May 2011 project. The project to be remaining regional courts/ mainstream regional/districts
reviewed after a year. district courts in other provinces courts in the country
150 Environmental Management Conduct training of Environmental Designation of 150 trained NEMA to be amended to Designation of EMIs functions Mar-14 DEA; COGTA;SALGA; local government;Inspectorate designated by 2011 Management Inspectors Local government officials as provide for Designation of carried out at local provinces
EMI by MEC EMIs by local authorities government level
Sub-output 2: Environmental Sustainability
NSSD strategy approved by 2011 Finalisation and implementation Cabinet approved NSSD and Develop sustainable Monitoring and evaluation on the Monitoring Mar-14 Funded DEAof NSSD and Action Plan Action plan development indicators implementation
Scaling up environmental education, Implement Human Capital Environmental driver integrated Increased access to A comprehensive career guidance, A standardised framework Mar-14 DEA, DST, Higher Education, Indalo Yethuawareness and voluntary activism: Development Strategy; into the National Skills occupationally directed vocational information dissemination developed for the assessment of Environmental Sector Skills Plan(ESSP) Environmental Sector Skills Plan Development Strategy (NSDS III) Programmes in scarce and and collection system in place skills shortages (projected fully implemented by 2014 (ESSP) finalised and implemented- and the SETA Skills Plans critical areas supply and demand) for
Engage with NSDS III and SETA environmental skills systems change, Address scarce and critical skills gap;
1 156 00 EPWP work opportunities Scale-up environment and culture Implement and monitor progress Implement and monitor progress Implement and monitor progress Implement and monitor progress 3/1/14 Additional financial Department of Public Works, Departmentand 325 652 FTEs (Full Time EPWP resources required of Environmental Affairs; Department of Equivalents) by 2014 Tourism; Department of Agriculture
Forestry and Fisheries;Department of Water Affairs; Department of Arts and Culture; Provinces
Implement coast care programme 19 beaches cleaned on a daily 19 beaches cleaned on a daily 19 beaches cleaned on a daily 19 beaches cleaned on a daily 3/1/13 No additional human Additional financial DEAat all South African beaches — basis, 830 km of coast line basis, 830 km of coast line basis, 830 km of coast line basis, 830 km of coast line and resources required resources requiredLitter picking and scrubbing of and 27 beach facilities cleaned and 27 beach facilities cleaned and 27 beach facilities cleaned 27 beach facilities cleaned beacH facilities everyday, 7 747 work everyday, 6 872 work everyday, 5 916 work everyday, 6 916 work opportunities
opportunities and 3 874 Full opportunities and 3 436 Full opportunities and 2 958 Full and 3 458 Full Time Equivalents Time Equivalents created Time Equivalents created Time Equivalents created created
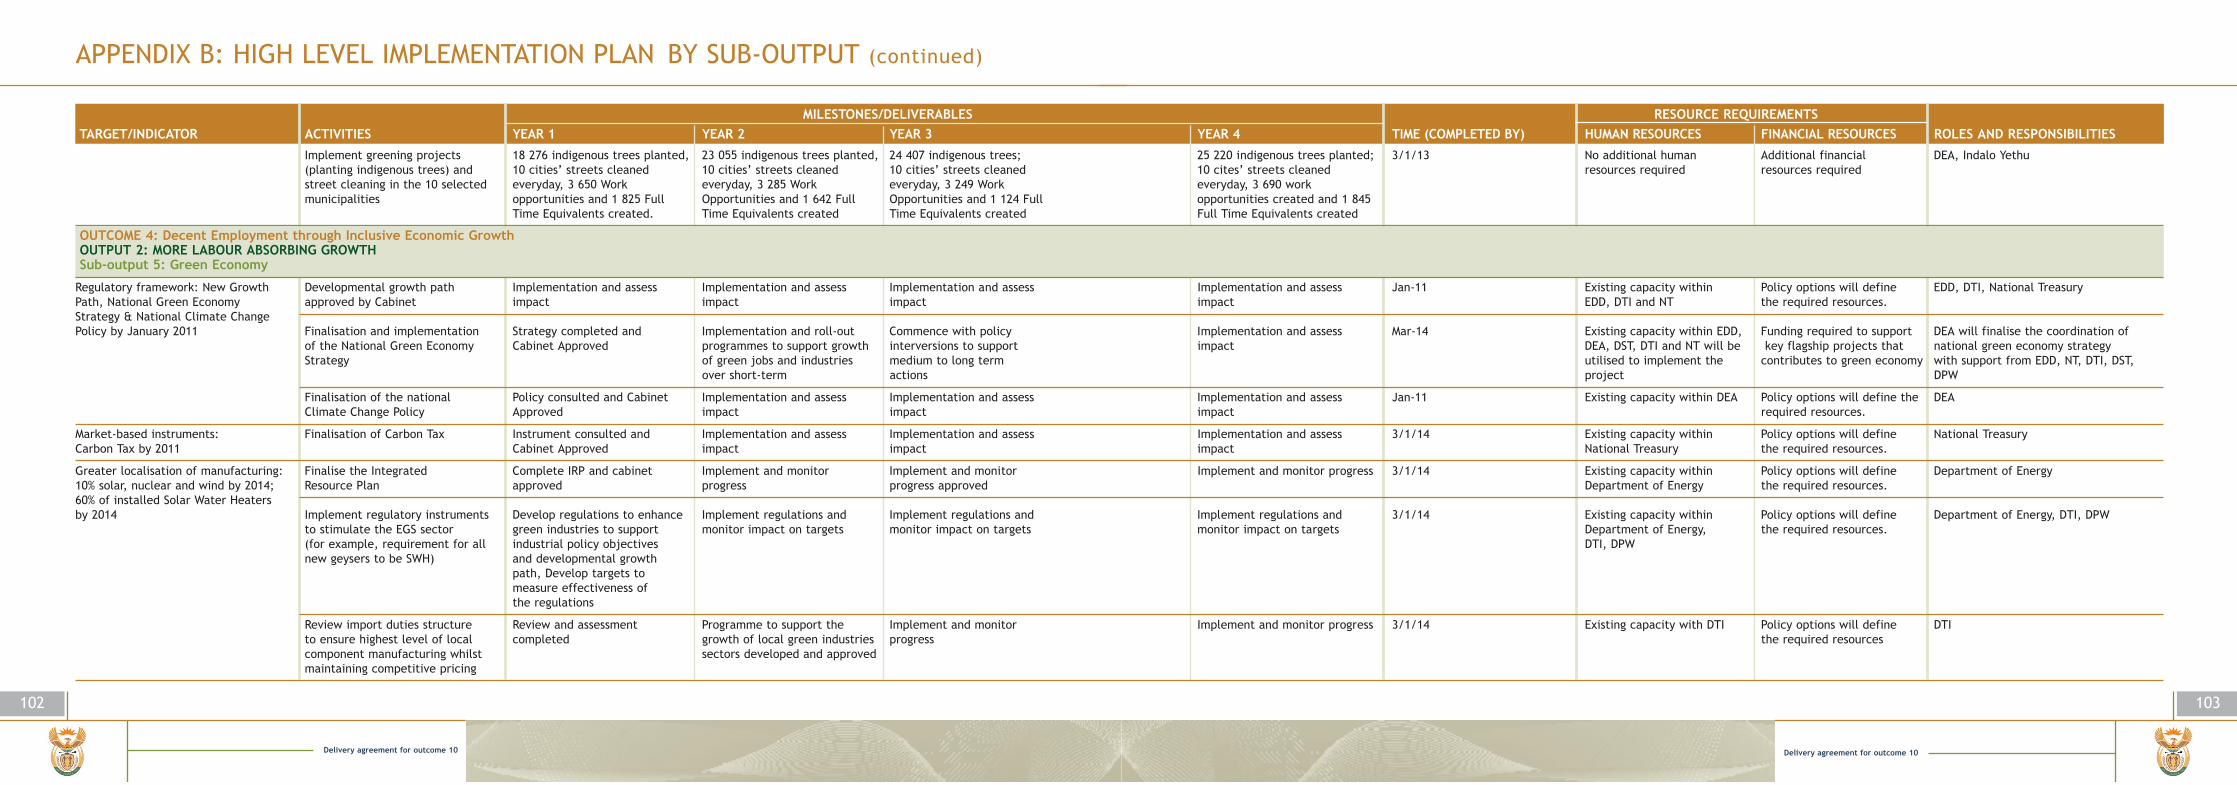
Delivery agreement for outcome 10
103
APPENDIX B: HIGH LEVEL IMPLEMENTATION PLAN BY SUB-OUTPUT (continued)
102
Delivery agreement for outcome 10
MILESTONES/DELIVERABLES RESOURCE REQUIREMENTSTARGET/INDICATOR ACTIVITIES YEAR 1 YEAR 2 YEAR 3 YEAR 4 TIME (COMPLETED BY) HUMAN RESOURCES FINANCIAL RESOURCES ROLES AND RESPONSIBILITIES
Implement greening projects 18 276 indigenous trees planted, 23 055 indigenous trees planted, 24 407 indigenous trees; 25 220 indigenous trees planted; 3/1/13 No additional human Additional financial DEA, Indalo Yethu(planting indigenous trees) and 10 cities’ streets cleaned 10 cities’ streets cleaned 10 cities’ streets cleaned 10 cites’ streets cleaned resources required resources requiredstreet cleaning in the 10 selected everyday, 3 650 Work everyday, 3 285 Work everyday, 3 249 Work everyday, 3 690 work municipalities opportunities and 1 825 Full Opportunities and 1 642 Full Opportunities and 1 124 Full opportunities created and 1 845
Time Equivalents created. Time Equivalents created Time Equivalents created Full Time Equivalents created
OUTCOME 4: Decent Employment through Inclusive Economic GrowthOUTPUT 2: MORE LABOUR ABSORBING GROWTH Sub-output 5: Green Economy
Regulatory framework: New Growth Developmental growth path Implementation and assess Implementation and assess Implementation and assess Implementation and assess Jan-11 Existing capacity within Policy options will define EDD, DTI, National TreasuryPath, National Green Economy approved by Cabinet impact impact impact impact EDD, DTI and NT the required resources. Strategy & National Climate Change Policy by January 2011 Finalisation and implementation Strategy completed and Implementation and roll-out Commence with policy Implementation and assess Mar-14 Existing capacity within EDD, Funding required to support DEA will finalise the coordination of
of the National Green Economy Cabinet Approved programmes to support growth interversions to support impact DEA, DST, DTI and NT will be key flagship projects that national green economy strategy Strategy of green jobs and industries medium to long term utilised to implement the contributes to green economy with support from EDD, NT, DTI, DST,
over short-term actions project DPW
Finalisation of the national Policy consulted and Cabinet Implementation and assess Implementation and assess Implementation and assess Jan-11 Existing capacity within DEA Policy options will define the DEAClimate Change Policy Approved impact impact impact required resources.
Market-based instruments: Finalisation of Carbon Tax Instrument consulted and Implementation and assess Implementation and assess Implementation and assess 3/1/14 Existing capacity within Policy options will define National TreasuryCarbon Tax by 2011 Cabinet Approved impact impact impact National Treasury the required resources.
Greater localisation of manufacturing: Finalise the Integrated Complete IRP and cabinet Implement and monitor Implement and monitor Implement and monitor progress 3/1/14 Existing capacity within Policy options will define Department of Energy10% solar, nuclear and wind by 2014; Resource Plan approved progress progress approved Department of Energy the required resources. 60% of installed Solar Water Heaters by 2014 Implement regulatory instruments Develop regulations to enhance Implement regulations and Implement regulations and Implement regulations and 3/1/14 Existing capacity within Policy options will define Department of Energy, DTI, DPW
to stimulate the EGS sector green industries to support monitor impact on targets monitor impact on targets monitor impact on targets Department of Energy, the required resources.(for example, requirement for all industrial policy objectives DTI, DPWnew geysers to be SWH) and developmental growth
path, Develop targets to measure effectiveness of the regulations
Review import duties structure Review and assessment Programme to support the Implement and monitor Implement and monitor progress 3/1/14 Existing capacity with DTI Policy options will define DTIto ensure highest level of local completed growth of local green industries progress the required resourcescomponent manufacturing whilst sectors developed and approvedmaintaining competitive pricing
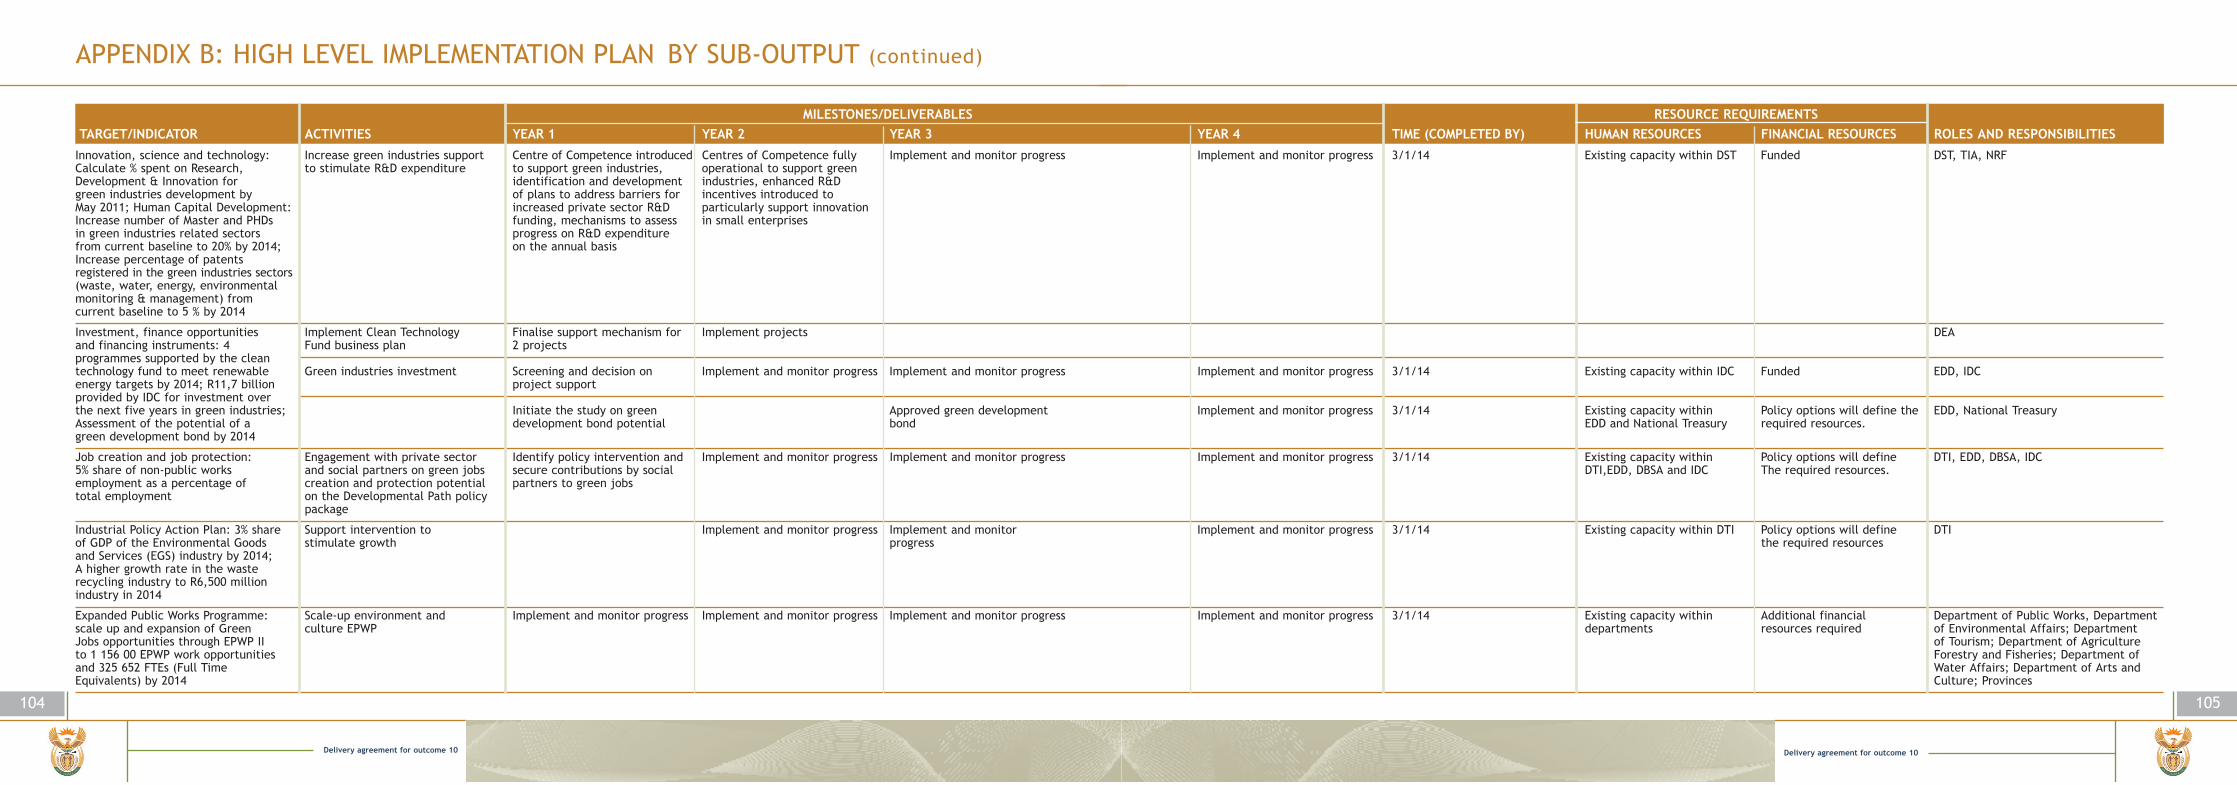
Delivery agreement for outcome 10
105
APPENDIX B: HIGH LEVEL IMPLEMENTATION PLAN BY SUB-OUTPUT (continued)
104
Delivery agreement for outcome 10
Innovation, science and technology: Increase green industries support Centre of Competence introduced Centres of Competence fully Implement and monitor progress Implement and monitor progress 3/1/14 Existing capacity within DST Funded DST, TIA, NRFCalculate % spent on Research, to stimulate R&D expenditure to support green industries, operational to support greenDevelopment & Innovation for identification and development industries, enhanced R&D green industries development by of plans to address barriers for incentives introduced to May 2011; Human Capital Development: increased private sector R&D particularly support innovation Increase number of Master and PHDs funding, mechanisms to assess in small enterprisesin green industries related sectors progress on R&D expenditure from current baseline to 20% by 2014; on the annual basisIncrease percentage of patents registered in the green industries sectors (waste, water, energy, environmental monitoring & management) from current baseline to 5 % by 2014
Investment, finance opportunities Implement Clean Technology Finalise support mechanism for Implement projects DEAand financing instruments: 4 Fund business plan 2 projectsprogrammes supported by the clean technology fund to meet renewable Green industries investment Screening and decision on Implement and monitor progress Implement and monitor progress Implement and monitor progress 3/1/14 Existing capacity within IDC Funded EDD, IDCenergy targets by 2014; R11,7 billion project supportprovided by IDC for investment over the next five years in green industries; Initiate the study on green Approved green development Implement and monitor progress 3/1/14 Existing capacity within Policy options will define the EDD, National TreasuryAssessment of the potential of a development bond potential bond EDD and National Treasury required resources. green development bond by 2014
Job creation and job protection: Engagement with private sector Identify policy intervention and Implement and monitor progress Implement and monitor progress Implement and monitor progress 3/1/14 Existing capacity within Policy options will define DTI, EDD, DBSA, IDC5% share of non-public works and social partners on green jobs secure contributions by social DTI,EDD, DBSA and IDC The required resources. employment as a percentage of creation and protection potential partners to green jobs total employment on the Developmental Path policy
package
Industrial Policy Action Plan: 3% share Support intervention to Implement and monitor progress Implement and monitor Implement and monitor progress 3/1/14 Existing capacity within DTI Policy options will define DTIof GDP of the Environmental Goods stimulate growth progress the required resourcesand Services (EGS) industry by 2014; A higher growth rate in the waste recycling industry to R6,500 million industry in 2014
Expanded Public Works Programme: Scale-up environment and Implement and monitor progress Implement and monitor progress Implement and monitor progress Implement and monitor progress 3/1/14 Existing capacity within Additional financial Department of Public Works, Department scale up and expansion of Green culture EPWP departments resources required of Environmental Affairs; DepartmentJobs opportunities through EPWP II of Tourism; Department of Agriculture to 1 156 00 EPWP work opportunities Forestry and Fisheries; Department of and 325 652 FTEs (Full Time Water Affairs; Department of Arts and Equivalents) by 2014 Culture; Provinces
MILESTONES/DELIVERABLES RESOURCE REQUIREMENTSTARGET/INDICATOR ACTIVITIES YEAR 1 YEAR 2 YEAR 3 YEAR 4 TIME (COMPLETED BY) HUMAN RESOURCES FINANCIAL RESOURCES ROLES AND RESPONSIBILITIES

Delivery agreement for outcome 10
107
APPENDIX C: PROVINCIAL DELIVERABLES
106
Delivery agreement for outcome 10
MILESTONES/DELIVERABLES RESOURCE REQUIREMENTSTARGET/INDICATOR ACTIVITIES YEAR 1 YEAR 2 YEAR 3 YEAR 4 TIME (COMPLETED BY) HUMAN RESOURCES FINANCIAL RESOURCES ROLES AND RESPONSIBILITIES
OUTCOME 10: PROTECTED AND ENHANCED ENVIRONMENTAL ASSETS AND NATURAL RESOURCES – KWAZULU-NATAL DEA RD OUTPUT 1: QUALITY AND QUANTITY OF WATER RESOURCES ENHANCEDSub-output 1.1: Water demandSub-output 1.2: Water resource protection
# wetlands under formal protection Identify wetlands of national 50 50 50 50 3/1/14 KZN DAERD, water affairs, (4 by 2014) Importance and develop COGTA, DEA and EKZNW Conservation
management plan Authorities — implement plans
Management plans for wetlands of Management plans for Management plans for Assessment of priority wetlands Develop and implement 3/1/14 Managers, Field Rangers R400 000/plan DEA, Provincesinternational importance developed five RAMSAR sites develop five RAMSAR sites developed against criteria developed management plans and General assistants
OUTPUT 2: REDUCED GREENHOUSE GAS EMISSIONS, CLIMATE CHANGE & IMPROVED AIR/ATMOSPHERIC QUALITYSub-output 2.1: Reduced CO2 emmission
Reduced total emmissions of CO2 by GHGs identified as “Priority Mar-14 KZN DEARD, DEA,Provinces, Local 34% reduction of “Business As Usual” Pollutants” in terms of the Air Government, Water Affairs, by 2020 and 42% by 2025; 80% of Quality Act and mitigation plans National centre for carbon capture,government owned monitoring stations submitted by end 2013; National Energy Efficiency Agencyreporting to SAAQIS
Sub-output 2.2: Atmospheric pollutants
100% country-wide compliance Atmospheric pollutants reduced 100% compliance with ambient 100% compliance with 100% compliance with ambient 100% compliance with ambient Mar-14 KZN DEARD, DEA,Provinces, Local with national Ambient Air Quality air quality standards ambient air quality standards air quality standards air quality standards Government, Mineral resources, COGTA, Standards by 2020 Public Works, DST, SALGA
Sub-output 2.4 Identified climate change and adaptation framework
Climate change impacts identified Climate change adaptation plans 10 sectors by 2012 Mar-14 DEA, KZN DEARD, Provinces, and adaptation frameworks integrated rolled out to provincial and Local Government, Water Affairs, into 12 national sectoral plans by 2012 municipal sphere of government; National centre for carbon capture,
National Energy Efficiency Agency
OUTPUT 3: SUSTAINABLE ENVIRONMENTAL MANAGEMENTSub-output 3.1 Degraded ecosystems rehabilitated & restored
3.2 mha by 2014 of land rehabilitated Degraded ecosystems rehabilitated 100 000 ha 100 000 ha 100 000 ha 100 000 ha Mar-14 DAERDand 160 rural development sites by 2014 & restored
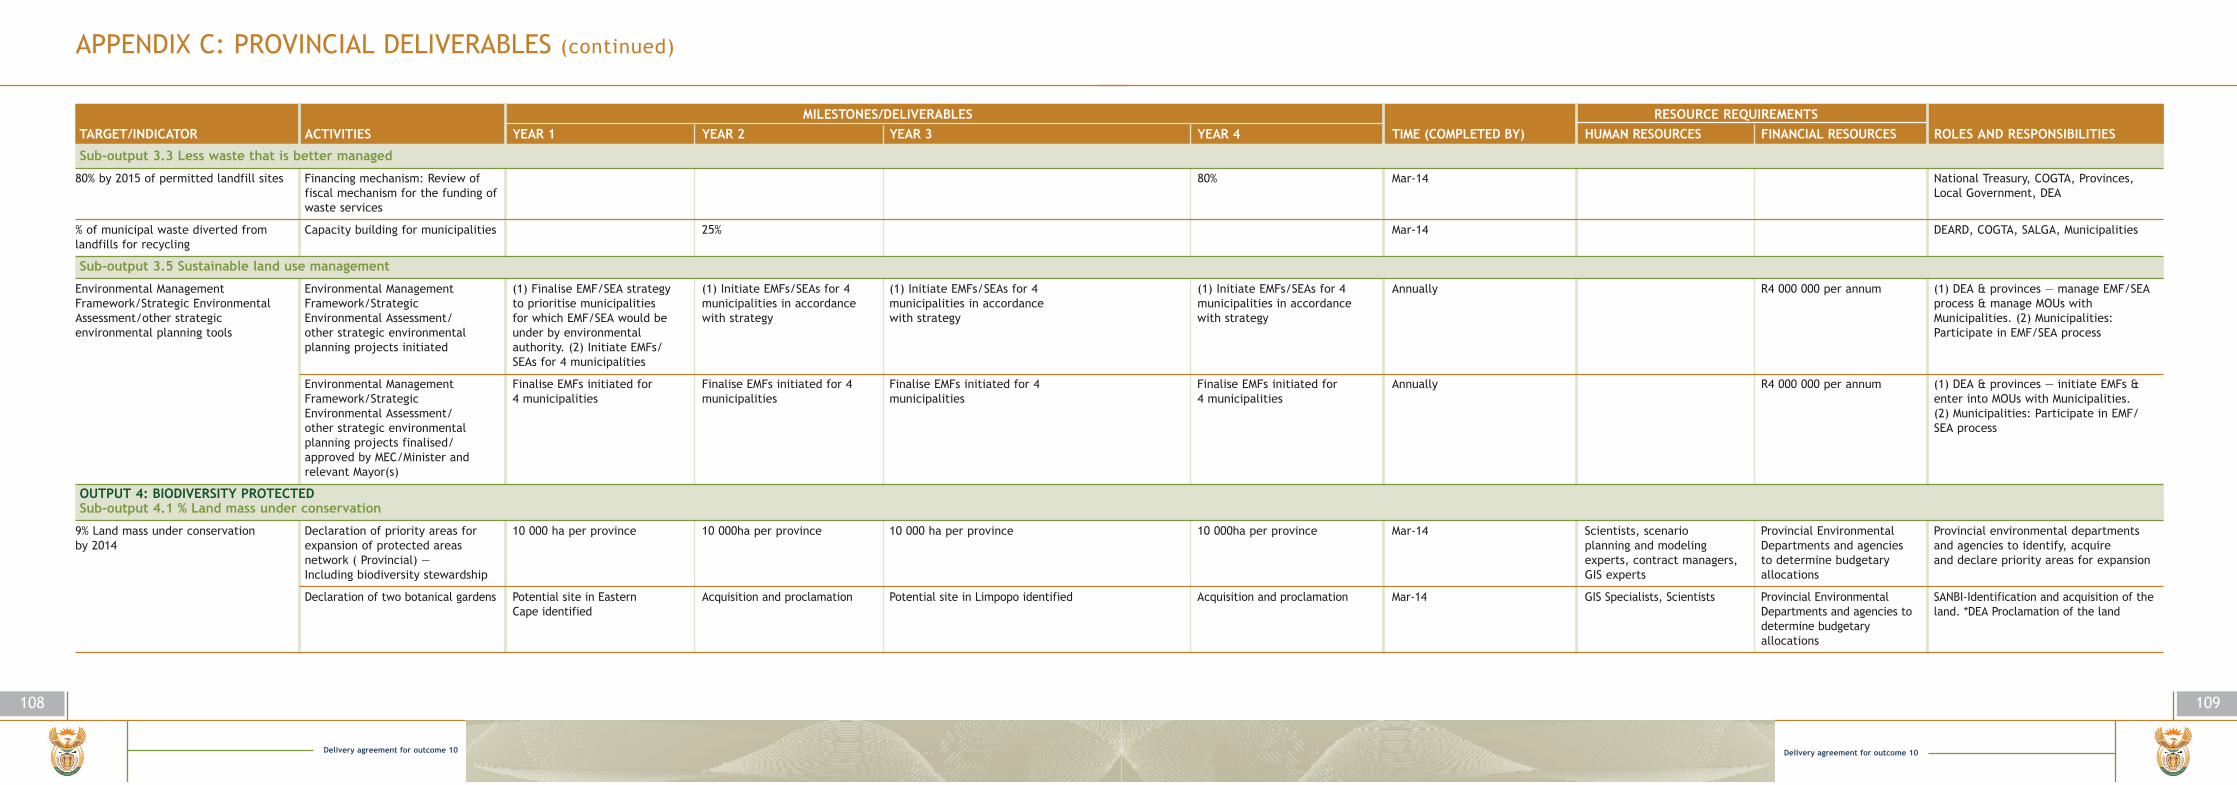
Delivery agreement for outcome 10
109
APPENDIX C: PROVINCIAL DELIVERABLES (continued)
108
Delivery agreement for outcome 10
MILESTONES/DELIVERABLES RESOURCE REQUIREMENTSTARGET/INDICATOR ACTIVITIES YEAR 1 YEAR 2 YEAR 3 YEAR 4 TIME (COMPLETED BY) HUMAN RESOURCES FINANCIAL RESOURCES ROLES AND RESPONSIBILITIES
Sub-output 3.3 Less waste that is better managed
80% by 2015 of permitted landfill sites Financing mechanism: Review of 80% Mar-14 National Treasury, COGTA, Provinces, fiscal mechanism for the funding of Local Government, DEAwaste services
% of municipal waste diverted from Capacity building for municipalities 25% Mar-14 DEARD, COGTA, SALGA, Municipalitieslandfills for recycling
Sub-output 3.5 Sustainable land use management
Environmental Management Environmental Management (1) Finalise EMF/SEA strategy (1) Initiate EMFs/SEAs for 4 (1) Initiate EMFs/SEAs for 4 (1) Initiate EMFs/SEAs for 4 Annually R4 000 000 per annum (1) DEA & provinces — manage EMF/SEA Framework/Strategic Environmental Framework/Strategic to prioritise municipalities municipalities in accordance municipalities in accordance municipalities in accordance process & manage MOUs with Assessment/other strategic Environmental Assessment/ for which EMF/SEA would be with strategy with strategy with strategy Municipalities. (2) Municipalities: environmental planning tools other strategic environmental under by environmental Participate in EMF/SEA process
planning projects initiated authority. (2) Initiate EMFs/SEAs for 4 municipalities
Environmental Management Finalise EMFs initiated for Finalise EMFs initiated for 4 Finalise EMFs initiated for 4 Finalise EMFs initiated for Annually R4 000 000 per annum (1) DEA & provinces — initiate EMFs & Framework/Strategic 4 municipalities municipalities municipalities 4 municipalities enter into MOUs with Municipalities. Environmental Assessment/ (2) Municipalities: Participate in EMF/other strategic environmental SEA processplanning projects finalised/approved by MEC/Minister and relevant Mayor(s)
OUTPUT 4: BIODIVERSITY PROTECTED Sub-output 4.1 % Land mass under conservation
9% Land mass under conservation Declaration of priority areas for 10 000 ha per province 10 000ha per province 10 000 ha per province 10 000ha per province Mar-14 Scientists, scenario Provincial Environmental Provincial environmental departments by 2014 expansion of protected areas planning and modeling Departments and agencies and agencies to identify, acquire
network ( Provincial) — experts, contract managers, to determine budgetary and declare priority areas for expansion Including biodiversity stewardship GIS experts allocations
Declaration of two botanical gardens Potential site in Eastern Acquisition and proclamation Potential site in Limpopo identified Acquisition and proclamation Mar-14 GIS Specialists, Scientists Provincial Environmental SANBI-Identification and acquisition of theCape identified Departments and agencies to land. *DEA Proclamation of the land
determine budgetary allocations
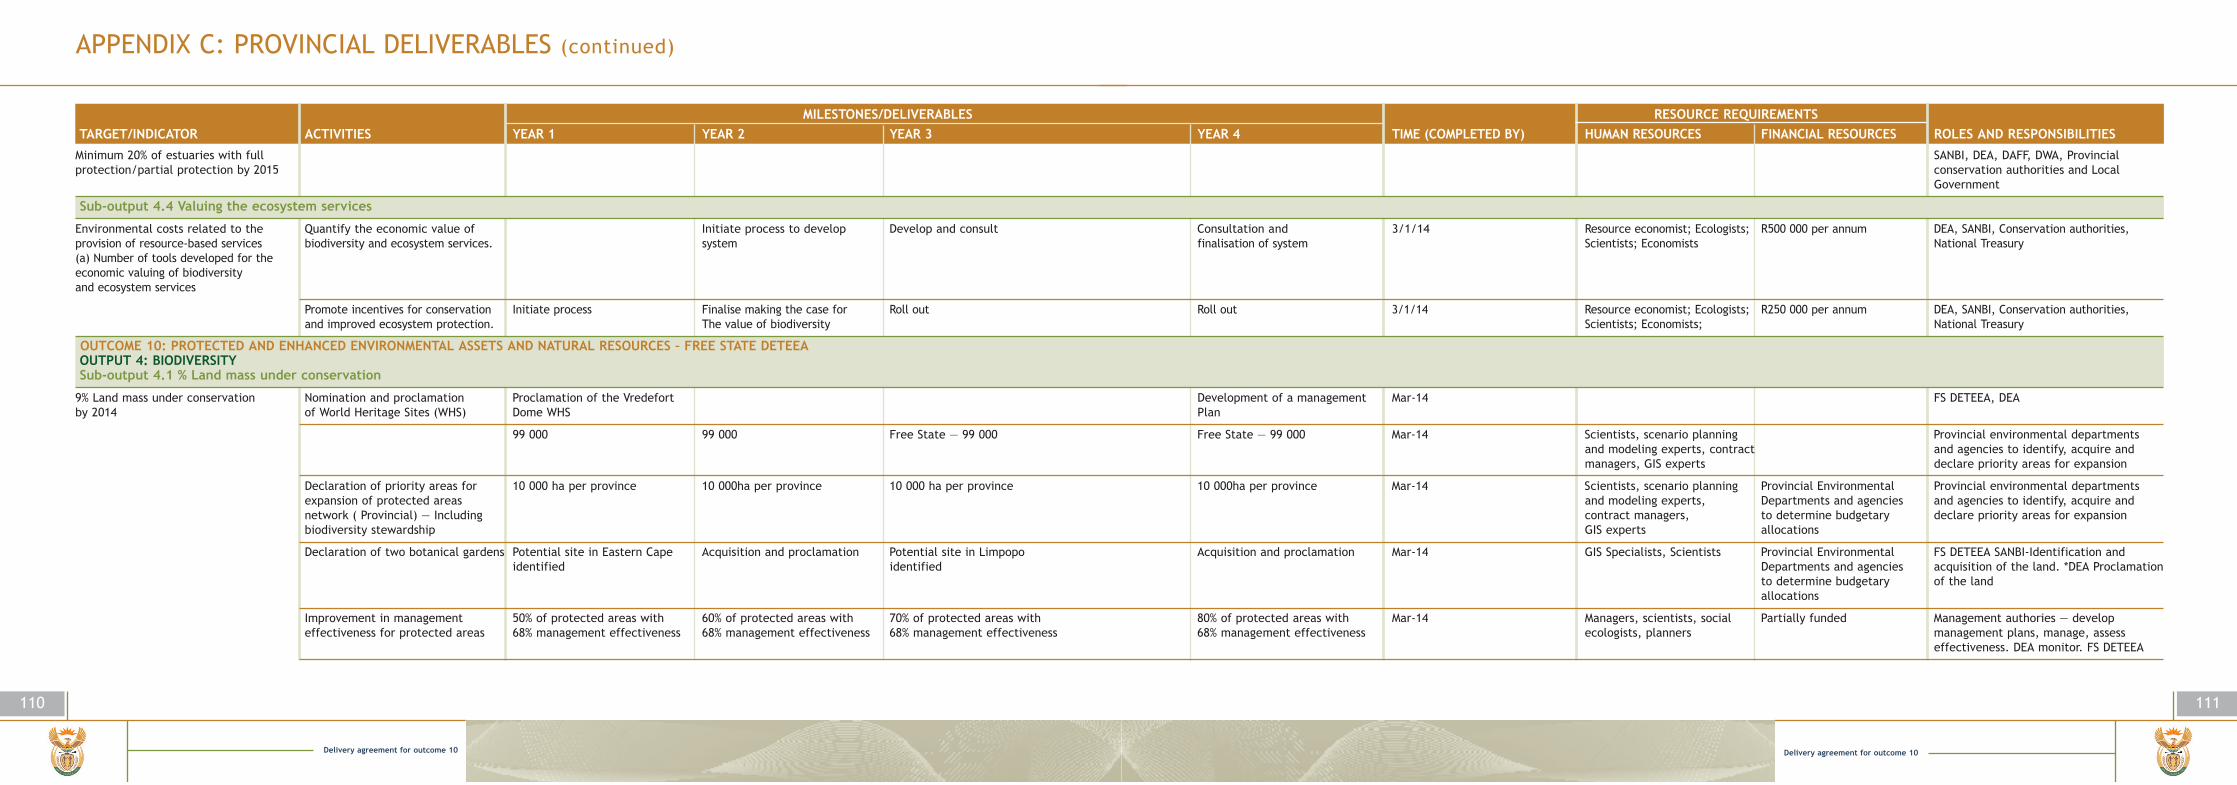
Delivery agreement for outcome 10
111
APPENDIX C: PROVINCIAL DELIVERABLES (continued)
110
Delivery agreement for outcome 10
MILESTONES/DELIVERABLES RESOURCE REQUIREMENTSTARGET/INDICATOR ACTIVITIES YEAR 1 YEAR 2 YEAR 3 YEAR 4 TIME (COMPLETED BY) HUMAN RESOURCES FINANCIAL RESOURCES ROLES AND RESPONSIBILITIES
Minimum 20% of estuaries with full SANBI, DEA, DAFF, DWA, Provincial protection/partial protection by 2015 conservation authorities and Local
Government
Sub-output 4.4 Valuing the ecosystem services
Environmental costs related to the Quantify the economic value of Initiate process to develop Develop and consult Consultation and 3/1/14 Resource economist; Ecologists; R500 000 per annum DEA, SANBI, Conservation authorities, provision of resource-based services biodiversity and ecosystem services. system finalisation of system Scientists; Economists National Treasury(a) Number of tools developed for theeconomic valuing of biodiversity and ecosystem services
Promote incentives for conservation Initiate process Finalise making the case for Roll out Roll out 3/1/14 Resource economist; Ecologists; R250 000 per annum DEA, SANBI, Conservation authorities, and improved ecosystem protection. The value of biodiversity Scientists; Economists; National Treasury
OUTCOME 10: PROTECTED AND ENHANCED ENVIRONMENTAL ASSETS AND NATURAL RESOURCES – FREE STATE DETEEAOUTPUT 4: BIODIVERSITYSub-output 4.1 % Land mass under conservation
9% Land mass under conservation Nomination and proclamation Proclamation of the Vredefort Development of a management Mar-14 FS DETEEA, DEAby 2014 of World Heritage Sites (WHS) Dome WHS Plan
99 000 99 000 Free State — 99 000 Free State — 99 000 Mar-14 Scientists, scenario planning Provincial environmental departments and modeling experts, contract and agencies to identify, acquire and managers, GIS experts declare priority areas for expansion
Declaration of priority areas for 10 000 ha per province 10 000ha per province 10 000 ha per province 10 000ha per province Mar-14 Scientists, scenario planning Provincial Environmental Provincial environmental departments expansion of protected areas and modeling experts, Departments and agencies and agencies to identify, acquire and network ( Provincial) — Including contract managers, to determine budgetary declare priority areas for expansion biodiversity stewardship GIS experts allocations
Declaration of two botanical gardens Potential site in Eastern Cape Acquisition and proclamation Potential site in Limpopo Acquisition and proclamation Mar-14 GIS Specialists, Scientists Provincial Environmental FS DETEEA SANBI-Identification and identified identified Departments and agencies acquisition of the land. *DEA Proclamation
to determine budgetary of the landallocations
Improvement in management 50% of protected areas with 60% of protected areas with 70% of protected areas with 80% of protected areas with Mar-14 Managers, scientists, social Partially funded Management authories — develop effectiveness for protected areas 68% management effectiveness 68% management effectiveness 68% management effectiveness 68% management effectiveness ecologists, planners management plans, manage, assess
effectiveness. DEA monitor. FS DETEEA

Delivery agreement for outcome 10
113
APPENDIX C: PROVINCIAL DELIVERABLES (continued)
112
Delivery agreement for outcome 10
MILESTONES/DELIVERABLES RESOURCE REQUIREMENTSTARGET/INDICATOR ACTIVITIES YEAR 1 YEAR 2 YEAR 3 YEAR 4 TIME (COMPLETED BY) HUMAN RESOURCES FINANCIAL RESOURCES ROLES AND RESPONSIBILITIES
Implement the Biodiversity Stewardship Programme to contribute to the land mass under conservation in the form of Nature reserves and Protected Environment
Sub-output 4.2 Reduced climate change impacts on biodiversity
9 major biomes climate change Identification of climate change Framework document for Vulnerability assessment for Response measures for the Climate change adaptation plans March 2014 Scientists, scenario planning DEAadaptation frameworks developed impacts on marine and terrestrial biodiversity and climate the nine biomes completed nine biomes identified. for nine biomes completed and modeling
biodiversity and development of change completedadaptation plans
Framework for biodiversity and Vulnerability assessment for Response measures for Climate change adaptation 14-Mar Scientist, scenario planners & Unfunded SANBI — scientific inputs, Provinces — climate change response completed the 9 biomes completed 9 biomes identified plans for 9 biomes completed modelling and conservation implementation, DEA — co-ordination
experts
Sub-output 4.3 Protected ecosystems and species
Increasing number of species under Developing Biodiversity 2 species management 2 species management plans 2 species management 2 species management plans Mar-14 Species specialists Funded DEA — evaluation & approval, SANBI — formal protection management plans for species plans developed developed plans developed developed scientific authority
Amending TOPS lists based on Criteria for listing developed Draft list compiled and List finalised and published Amend Regulations to ensure Mar-14 Species specialists; Scientists; Funded DEA — Development of lists & regulations,specific criteria published for public comment protection of listed species Taxonomists; Conservation SANBI — scientific criteria & listing,
specialists; ecologist Provinces — implementation
Develop and implement regulations Alien and Invasive Species Alien and Invasive Species Draft national Strategy and National Strategy and Action Plan Mar-14 AIS specialists; Risk Current funding for DEA — Development of strategy & and tools to prevent, control or regulations finalised Risk Assessment Framework Action Plan for alien and invasive for alien and invasive species assessment specialists; EMIs implementation inadequate regulations, SANBI — scientific criteria &eradicate Alien and Invasive Species finalised; Draft Guidelines for species published for public finalised and approved; listing, DWA DAFF & Provinces —
the preparation of monitoring participation; Guidelines for Development of monitoring and implementationand control plan for alien and the preparation of monitoring and control plans by organs of state invasive species control plans implemented initiated; Development of species
management programmes initiated
Habitat loss reduced through Criteria for listing of aquatic List of threatened or protected Threatening processes/ Enforcement of NEMA 3/1/14 Ecosystem specialists — Funded SANBI — scientific authority, DEA& protection of threatened or ecosystems developed ecosystems activities in ecosystems identified especially in terms of the Provinces — implementation & NEMA protected ecosystems and regulated in terms of NEMA functioning of ecosystems enforcement
(dynamics of ecosystems) and threatening processes

Delivery agreement for outcome 10
115
APPENDIX C: PROVINCIAL DELIVERABLES (continued)
114
Delivery agreement for outcome 10
MILESTONES/DELIVERABLES RESOURCE REQUIREMENTSTARGET/INDICATOR ACTIVITIES YEAR 1 YEAR 2 YEAR 3 YEAR 4 TIME (COMPLETED BY) HUMAN RESOURCES FINANCIAL RESOURCES ROLES AND RESPONSIBILITIES
5 wetlands per year of national and Criteria for listing of wetlands Assessment of priority wetlands Assessment of priority Develop and implement 3/1/14 Scientists, planners, Funded DEA, SANBI, Working for Wetlands, FS international importance with developed against criteria developed wetlands against criteria management plans conservation manager DETEEA, Conservation Authorities — management plans in place developed implement plans
Management plans for wetlands of Management plans for five (5) Management plans for five Management plans for five (5) Management plans for five (5) Mar-14 Wetlands Specialists R400 000 per annum DEA, Conservation Authoritiesinternational importance developed RAMSAR sites developed (5) RAMSAR sites developed RAMSAR sites developed RAMSAR sites developed
Management plans for five Management plans for five Management plans for five Assessment of priority wetlands Develop and implement 3/1/14 Funded Management authorities — develop & RAMSAR sites developed RAMSAR sites developed RAMSAR sites develop against criteria developed management plans implement plans, DEA — oversight
Minimum 20% of estuaries with full SANBI, DEA, DAFF, DWA, Provincial protection/partial protection by 2015 conservation authorities and Local
Government
Sub-output 4.4 Valuing the ecosystem services
Environmental costs related to the Baseline for biodiversity & Feasibility study conducted Stakeholder consultation Valuation completed 3/1/14 Scientists, resource economists, Funded DEA & SANBI — DEA, SANBI, Conservation authorities, provision of resource-based services ecosystem services determined project manager conduct valuation National Treasury(a)Number of tools developed for theeconomic valuing of biodiversity Promote incentives for Initiate process Finalise making the case for Roll out Roll out 3/1/14 Resource economist; Ecologists; R250 000 per annum DEA, SANBI, Conservation authorities,and ecosystem services conservation and improved the value of biodiversity Scientists; Economists; National Treasury
ecosystem protection Media & marketing
Make a business case for biodiversity Development of communication Business case for biodiversity Rollout implementation Rollout implementation 14-Mar Resource economists, Rollout Implementation DEA & SANBI — development, Provinces — strategy and messages initiated finalised scientists, media & unfunded implementation
marketing professionals
OUTCOME 10: PROTECTED AND ENHANCED ENVIRONMENTAL ASSETS AND NATURAL RESOURCES – WESTERN CAPE DEADPOUTPUT 1.:QUALITY AND QUANTITY OF WATER RESOURCES ENHANCEDSub-output 1.2 Water resource protection
# wetlands under formal protection Management plans for wetlands Management plans for one Management plans for one Management plans for one 3/31/14 Funded Funded CapeNature (Western Cape); Sanbi to of international importance RAMSAR sites developed. RAMSAR sites developed. RAMSAR sites developed. implement wetland rehabilitation developed projects

Delivery agreement for outcome 10
117
APPENDIX C: PROVINCIAL DELIVERABLES (continued)
116
Delivery agreement for outcome 10
MILESTONES/DELIVERABLES RESOURCE REQUIREMENTSTARGET/INDICATOR ACTIVITIES YEAR 1 YEAR 2 YEAR 3 YEAR 4 TIME (COMPLETED BY) HUMAN RESOURCES FINANCIAL RESOURCES ROLES AND RESPONSIBILITIES
OUTPUT 2: REDUCED GREENHOUSE GAS EMISSIONS, CLIMATE CHANGE & IMPROVED AIR/ATMOSPHERIC QUALITYSub-output 2.1: Reduced CO2 emmission
Reduced total emmissions of CO2 by The South African Air Quality Report all ambient air Report all ambient air Report all ambient air quality Report all ambient air quality Monday, March 31, 2014 CEO Grade B x 1 Admin No cost DEA&DP Western Cape (Dir. Pollution 34% reduction of “Business As Usual Information System (SAAQIS) phase quality data to SAAQIS quality data to SAAQIS data to SAAQIS data to SAAQIS Officer x 1 Management)by 2020 and 42% by 2025; 80% of II completed by mid-2012;government owned monitoring stations reporting to SAAQIS GHGs identified as “Priority Initiate development of Complete the development of Maintain GHG inventory Maintain GHG inventory Monday, March 31, 2014 CEO Grade B x 1 750 000 DEA&DP Western Cape (Dir. Pollution
Pollutants” in terms of the Air GHG inventory GHG inventory CEO Grade A x 3 Management)Quality Act and mitigation plans CEO Grade A-C x 3submitted by end 2013;
Sub-output 2.2: Atmospheric pollutants
100% country-wide compliance with Develop publish and distribute Develop publish and distribute Develop publish and distribute Develop publish and distribute Monday, March 31, 2014 Director X1 1 850 000 DEA&DP Western Cape (Dir. Pollution national Ambient Air Quality Standards report on State of Air Quality report on State of Air Quality report on State of Air report on State of Air Quality CEO Grade B x 1 Management)by 2020 in the Western Cape in the Western Cape Quality in the Western Cape in the Western Cape CEO Grade A x 3
Investigate, identify and investigate, identify and CEO Grade A-C x 3implement alternative forms of implement alternative forms Service providerheating and cooking for of heating and cooking for informal areas, pending donor informal areas, pending donor funding arrangements funding arrangements.
The development and rollout Investigate and report on a Publicise and facilitate Implement Strategy 2012/2013 Internal staff Budgeted funding per year DEA&DP Western Cape (Dir. Climate of a strategy to address air strategy to facilitate mass strategy on mass roll-out of Change)pollution in dense, low-income role-out of solar geysers in the solar water heater systems.communities, including air Western Cape.pollution from the burning ofdirty fuels (eg coal, paraffin and wood)
The review, revision and develop a methodology vehicle develop a metholody on Monday, March 31, 2014 CEO Grade B x 2 620 000 DEA&DP Western Cape (Dir. Pollution implementation of the National emission testing at roadsides and vehicle emission testing at CEO Grade A x 2 Management)Vehicle Emission Control Strategy weighbridges initiate the process roadsides and weighbridge EO Grade A-C x 3
of setting standards and developing continue with the process of Service providerregulations and methodologies setting standards and developingfor emissions testing of all other regulations and methodologies modes of transport for emissions testing of all other
modes of transport
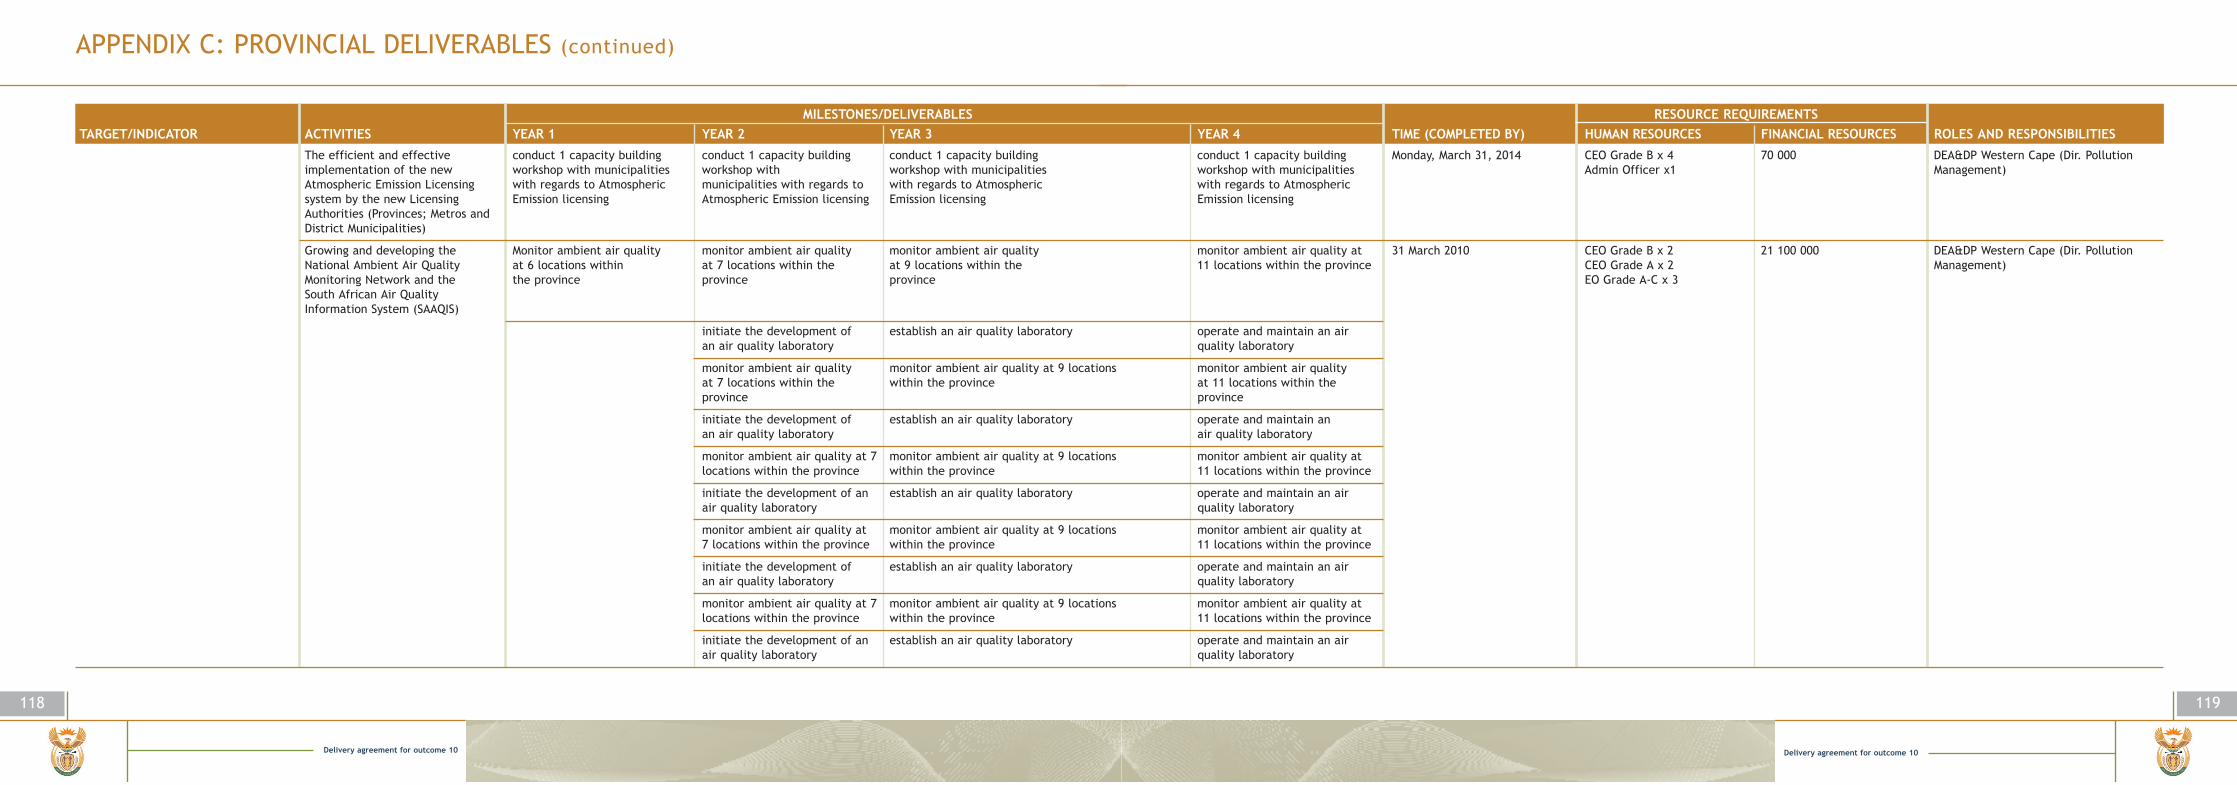
Delivery agreement for outcome 10
119
APPENDIX C: PROVINCIAL DELIVERABLES (continued)
118
Delivery agreement for outcome 10
MILESTONES/DELIVERABLES RESOURCE REQUIREMENTSTARGET/INDICATOR ACTIVITIES YEAR 1 YEAR 2 YEAR 3 YEAR 4 TIME (COMPLETED BY) HUMAN RESOURCES FINANCIAL RESOURCES ROLES AND RESPONSIBILITIES
The efficient and effective conduct 1 capacity building conduct 1 capacity building conduct 1 capacity building conduct 1 capacity building Monday, March 31, 2014 CEO Grade B x 4 70 000 DEA&DP Western Cape (Dir. Pollution implementation of the new workshop with municipalities workshop with workshop with municipalities workshop with municipalities Admin Officer x1 Management)Atmospheric Emission Licensing with regards to Atmospheric municipalities with regards to with regards to Atmospheric with regards to Atmosphericsystem by the new Licensing Emission licensing Atmospheric Emission licensing Emission licensing Emission licensingAuthorities (Provinces; Metros andDistrict Municipalities)
Growing and developing the Monitor ambient air quality monitor ambient air quality monitor ambient air quality monitor ambient air quality at 31 March 2010 CEO Grade B x 2 21 100 000 DEA&DP Western Cape (Dir. Pollution National Ambient Air Quality at 6 locations within at 7 locations within the at 9 locations within the 11 locations within the province CEO Grade A x 2 Management)Monitoring Network and the the province province province EO Grade A-C x 3South African Air Quality Information System (SAAQIS)
initiate the development of establish an air quality laboratory operate and maintain an air an air quality laboratory quality laboratory
monitor ambient air quality monitor ambient air quality at 9 locations monitor ambient air quality at 7 locations within the within the province at 11 locations within the province province
initiate the development of establish an air quality laboratory operate and maintain an an air quality laboratory air quality laboratory
monitor ambient air quality at 7 monitor ambient air quality at 9 locations monitor ambient air quality at locations within the province within the province 11 locations within the province
initiate the development of an establish an air quality laboratory operate and maintain an air air quality laboratory quality laboratory
monitor ambient air quality at monitor ambient air quality at 9 locations monitor ambient air quality at 7 locations within the province within the province 11 locations within the province
initiate the development of establish an air quality laboratory operate and maintain an air an air quality laboratory quality laboratory
monitor ambient air quality at 7 monitor ambient air quality at 9 locations monitor ambient air quality at locations within the province within the province 11 locations within the province
initiate the development of an establish an air quality laboratory operate and maintain an air air quality laboratory quality laboratory

Delivery agreement for outcome 10
121
APPENDIX C: PROVINCIAL DELIVERABLES (continued)
120
Delivery agreement for outcome 10
MILESTONES/DELIVERABLES RESOURCE REQUIREMENTSTARGET/INDICATOR ACTIVITIES YEAR 1 YEAR 2 YEAR 3 YEAR 4 TIME (COMPLETED BY) HUMAN RESOURCES FINANCIAL RESOURCES ROLES AND RESPONSIBILITIES
Growing and developing the Monitor ambient air quality at monitor ambient air quality at 7 monitor ambient air quality monitor ambient air quality at 31 March 2010 CEO Grade B x 2 21 100 000 DEA&DP Western Cape (Dir. Pollution National Ambient Air Quality 6 locations within the province locations within the province at 9 locations within the province 11 locations within the province CEO Grade A x 2 Management)Monitoring Network and the South EO Grade A-C x 3African Air Quality Information initiate the development of an establish an air quality laboratory operate and maintain an air System (SAAQIS) air quality laboratory quality laboratory
The development and rollout of develop, publish and distribute develop, publish and develop, publish and distribute Monday, March 31, 2014 CEO Grade B x 1 150 000 DEA&DP Western Cape (Dir. Pollution strategies and action plans to education and awareness distribute education education and awareness CEO Grade A x 3 Management)address air pollution from non- material with regards to the and awareness material with material with regards to the EO Grade A-C x 3industrial and/or non-point sources management of air pollution regards to the management management of air pollution (eg veld fires, construction from non industrial sources of air pollution from non from non industrial sourcesactivities, un-surfaced haul industrial sourcesroads, etc.)
2.4 Identified climate change and adapation framework
Climate change impacts identified Climate change adaptation plans Further roll out of Explore climate change Explore climate change co- Monday, March 31, 2014 Director x 1 CEO Grade B x 2 4 800 000 DEA&DP Western Cape (Dir. Pollution and adaptation frameworks integrated rolled out to provincial and “2Precious2Pollute” programme: co-benefits in Air Quality benefits in Air Quality CEO Grade A x 3 Management)into 12 national sectoral plans by 2012 municipal sphere of government; Reduce ozone depleting Management Further roll out of Management Further roll out EO Grade A-C x 3
substances, greenhouse gases “2Precious2Pollute” programme: of “2Precious2Pollute” and its associated impacts Reduce ozone depleting substances, programme: Reduce ozone
greenhouse gases and its depleting substances, associated impacts greenhouse gases
and its associated impacts
Undertake annual monitoring Undertake annual monitoring Internal staff Budgeted funding per year DEA&DP Western Cape (Dir. Climate of climate change response of climate change response Change)and refine climate change M&E systems.
Sea level rise scenario project Sea level rise scenario project Sea level rise scenario project for Sea level rise scenario project for West Coast District Coast for Agulhas Coast West Coast District Coast for Agulhas Coast
Climate change awareness Climate change awareness and and education education

Delivery agreement for outcome 10
123
APPENDIX C: PROVINCIAL DELIVERABLES (continued)
122
Delivery agreement for outcome 10
MILESTONES/DELIVERABLES RESOURCE REQUIREMENTSTARGET/INDICATOR ACTIVITIES YEAR 1 YEAR 2 YEAR 3 YEAR 4 TIME (COMPLETED BY) HUMAN RESOURCES FINANCIAL RESOURCES ROLES AND RESPONSIBILITIES
OUTPUT 3: SUSTAINABLE ENVIRONMENTAL MANAGEMENTSub-output 3.1 Degraded ecosystems rehabilitated & restored
3.2 mha by 2014 of land rehabilitated Number of hectares cleared of Initial cleared: 40 000 hectares Initial cleared: 40 000 hectares Initial cleared: 40 000 hectares Initial cleared: 40 000 hectares 31/03/2014 Programme Manager, Small DWA — Working for Water DWA — Working for Water — CapeNature and 160 rural development sites by 2014 invasive alien vegetation according Follow-up cleared: 98 000 Follow-up cleared: 98 000 Follow-up cleared: Follow-up cleared: 98 000 Business Development, funds R20M annually. (Western Cape) implementing Agent
to approved Working for Water hectares hectares 98 000 hectares hectares Manager Project Managers Annual Plan of Operations. and Quality Controllers.
Sub-output 3.2 Deforestation & improved forest management
Net deforestation not by more Develop plan to ensure Develop credible Spatial Develop credible Spatial Develop credible Spatial Develop credible Spatial Continuous Internal staff Budgeted funding per year DEA&DP WC — Dir. Spatial Development than 5 woodlands by 2020 environmental issues are integrated Development Frameworks (SDFs). Development Frameworks (SDFs). Development Frameworks (SDFs). Development Frameworks (SDFs).
into land use planning and incorporated into national, Evaluation of IDP’s of Evaluation of IDP’s of Evaluation of IDP’s of Evaluation of IDP’s of Evaluation of IDP’s of DEA&DP Western Cape (Dir. Climate provincial and municipal plans. municipalities. municipalities. municipalities municipalities municipalities. Change)
Sub-output 3.3 Less waste that is better managed
75% house holds with basic waste Full cost accounting by Facilitate Municipal IWMPs Assess 2nd generation municipal Assessment reports — 3 staff members in Waste Compensation of 3 COGTA, Local government & DEA&DP collection by 2014 municipalities IWMPs that includes Solid Waste March 2013 Management Planning staff members Western Cape (Dir. Waste Management)
Management budgets component of D: Waste Management
80% by 2015 of permitted landfill sites Financing mechanism: Review Licensing Plan developed for DEA&DP Western Cape (Dir. Waste of fiscal mechanism for the Waste Management Sites Management)funding of waste services
25% by 2012 municipal waste Analysis of institutional within Assess and draft assessment Assess and draft assessment Compile Monitoring & Evaluation Assessment reports — March 3 staff members in Waste Compensation of 3 staff COGTA, Local government & DEA&DP diverted from landfills for recycling local governments report on 2nd generation report on 2nd generation (M&E)/Annual Performance 2013; M&E (Annual Performance) Management Planning members Cape (Dir. Waste Management)
municipal IWMPs municipal IWMPs report on implementation of Report — June 2013 component in D: Waste2nd generation IWMPs Management
Capacity building for municipalities Capacity building sessions: Capacity building sessions: Capacity Building sessions: Annually W. Cape DEA&DP Directorate As per MTEF DEA&DP Western Cape (Dir. Waste 4 x Integrated Waste 2 IWMP Workshops; 4 x I WMFs; 4 x IWMF; 1 x Licensing Waste Management Management)Management Forums (IWMF) 1 x Landfill Airspace with municipalities; 3 x Landfill Assessment Training; 1 x HealthOperators Training Workshops; Care Waste Management3 x Monitoring & Evaluation (HCWM) TrainingTraining; 1 x Waste

Delivery agreement for outcome 10
125
APPENDIX C: PROVINCIAL DELIVERABLES (continued)
124
Delivery agreement for outcome 10
MILESTONES/DELIVERABLES RESOURCE REQUIREMENTSTARGET/INDICATOR ACTIVITIES YEAR 1 YEAR 2 YEAR 3 YEAR 4 TIME (COMPLETED BY) HUMAN RESOURCES FINANCIAL RESOURCES ROLES AND RESPONSIBILITIES
Targets for waste minimisation Capacity building sessions: 4 Capacity building sessions: Capacity Building sessions: Annually W. Cape DEA&DP Directorate As per MTEF DEA DEA&DP Western Cape (Dir. Waste and standards set by end 2010 x Integrated Waste Management 2 IWMP Workshops; 4 x IWMFs; 4 x IWMF; 1 x Licensing Waste Management Management)
Forums (IWMF) with 1 x Landfill Airspace Assessmentmunicipalities; 3 x Landfill Training; 1 x Health Care Waste Operators Training Workshops; Management (HCWM) Training3 x Monitoring & Evaluation Training; 1 x Waste InformationTraining; 4 x Waste Act Training
Enhance energy potential of waste Without the necessary funding to conduct feasibility studies, DEA&DP cannot contribute DEA&DP Western Cape (Dir. Waste by harnessing gasses from landfill towards this indicator. DEA&DP can however report on the total license applications received Management)sites for energy generation
OUTPUT 4: BIODIVERSITY PROTECTED Sub-output 4.1 % Land mass under conservation
9% Land mass under conservation Declaration of priority areas The maintenance of current 57 The maintenance of current 71 The maintenance of current 85 The maintenance of current 85 3/31/14 The Biodiversity Stewardship These are the Salaries and CapeNature (Western Cape)by 2014 for expansion of protected areas conservation stewardship sites conservation stewardship conservation stewardship sites. conservation stewardship sites. Programme Manager and part. Operational funding of the
network (Provincial) — Including (Contract Nature Reserves and sites and 14 new stewardship time secretary and the a Biodiveristy Stewardship and biodiversity stewardship Biodiversity Agreements) and sites. portion of the time of the partly the Corridor
14 new stewardship sites. Corridor Programme manager Programmes. To continue contribute towards the Human negotiating new Stewardship Resources. Operational staff sites beyond 2012 involved in Biodiverity — CapeNature needs R16 000 000 Stewardship in CapeNature for additional negotiating (excluding the law and and maintenance staff. scientific support staff) All of this is outlined in the amount to four staff members CapeNature Protected Area as full-time Stewardship Expansion Strategy.negotiators, two contractual negotiators and another ten working on Stewardship in varying percentages of their full-time positions

Delivery agreement for outcome 10
127
APPENDIX C: PROVINCIAL DELIVERABLES (continued)
126
Delivery agreement for outcome 10
MILESTONES/DELIVERABLES RESOURCE REQUIREMENTSTARGET/INDICATOR ACTIVITIES YEAR 1 YEAR 2 YEAR 3 YEAR 4 TIME (COMPLETED BY) HUMAN RESOURCES FINANCIAL RESOURCES ROLES AND RESPONSIBILITIES
5 wetlands per year of national Management plans for wetlands of Management plans for one Management plans for one Management plans for one RAMSAR 3/31/14 Funded Funded CapeNature (Western Cape)and international importance with international importance developed. RAMSAR sites developed. RAMSAR sites developed. sites developed.management plans in place
CROSS-CUTTING SUB-OUTPUTSSub-output 1: Environmental legislation compliance and enforcement
150 Environmental Management Conduct training of Ten registered Environmental Ten registered Environmental Ten registered Environmental Ten registered Environmental 3/31/14 R20 000 per participant CapeNature does Inspectorate designated by 2011 Environmental Management Management Inspectors in Management Inspectors in Management Inspectors in Management Inspectors in not currently have funding available.
Inspectors CapeNature. CapeNature. CapeNature. CapeNature.
Sub-output 2: Environmental Sustainability
1 156 00 EPWP work opportunities Number of person days A total of 262 500 person A total of 200 000 person days A total of 200 000 person A total of 200 000 person 3/31/14 Internal Staff DWA, SANBI, DEADP and 325 652 FTEs (Full Time work created through a days work created per year. work created per year. days work created per year. days work created per year.Equivalents) by 2014 range of projects (n)
OUTCOME 4: DECENT EMPLOYMENT THROUGH INCLUSIVE ECONOMIC GROWTHOUTPUT 2 : MORE LABOUR ABSORBING GROWTHSub-output 5: GREEN ECONOMY
Expanded Public Works Programme: Implement environment sector Participate in National programmes to implement EPWP. DEA&DP (WC)scale up and expansion of Green programmes in Outcome 10: Jobs opportunities through EPWP II to output 1, output 2, output 3, 1 156 00 EPWP work opportunities output 4 and cross-cuttingand 325 652 FTEs (Full Time Equivalents) by 2014
OUTCOME 10: PROTECTED AND ENHANCED ENVIRONMENTAL ASSETS AND NATURAL RESOURCES – MPUMALANGA ARD&LAOUTPUT 1: QUALITY AND QUANTITY OF WATER RESOURCES ENHANCEDSub-output 1.2 Water resource protection
# number of wetlands rehabilitated Implementation of working for 75 wetlands rehabilitated 85 wetlands rehabilitated 100 wetlands rehabilitated 120 wetlands rehabilitated Mar-14 Rehabilitation teams in Estimated R70million per SANBI, DEA AND LOCAL MUNICIPALITIESper year (100 per year) wetlands programme through provinces, scientists and annum
the rehabilitation of priority Project Managerswetlands, development of rehabilitation plans
# wetlands under formal protection Identify wetlands of national Criteria for listing of wetlands Assessment of priority Assessment of priority wetlands Develop and implement 3/1/14 Scientists, planners, R500 000/a Conservation Authorities — implement (4 by 2014) importance and develop developed wetlands against criteria against criteria developed management plans conservation manager plans
management plan developed

Delivery agreement for outcome 10
129
APPENDIX C: PROVINCIAL DELIVERABLES (continued)
128
Delivery agreement for outcome 10
MILESTONES/DELIVERABLES RESOURCE REQUIREMENTSTARGET/INDICATOR ACTIVITIES YEAR 1 YEAR 2 YEAR 3 YEAR 4 TIME (COMPLETED BY) HUMAN RESOURCES FINANCIAL RESOURCES ROLES AND RESPONSIBILITIES
Management plans for wetlands Management plans for five Management plans for five Assessment of priority wetlands Develop and implement 3/1/14 R400 000/plan DEA, Provincesof international importance RAMSAR sites developed RAMSAR sites develop against criteria developed management plansdeveloped
Construction of gabions to control 2 Wetlands rehabilitated, 2 2 Wetlands rehabilitated. 1 wetland rehabilitated 2 wetlands rehabilitated, 9/1/13 No additional human resources Additional financial DEA to appoint project implementers andwater flow flow and soil erosion dongas prevented from 2 dongas prevented from required resources required monitor their performance
expanding, expanding,
16 major rivers with healthy Eco-classification of water 1 major river system meeting 1 major river system 1 major river system meeting 1 major river system 3/1/14 DWA, DEAecosysytem by 2014 resource systems resource quality objectives meeting resource quality resource quality objectives meeting resource quality
objectives objectives
OUTPUT 2: REDUCED GREENHOUSE GAS EMISSIONS, CLIMATE CHANGE & IMPROVED AIR/ATMOSPHERIC QUALITYSub-output 2.1: Reduced CO2 emmission
Reduction of pollutants The South African Air Quality 20%of government owned ` 60% of government owned 80% of government owned Mar-14 As per proposed structure Funding of proposed DEA, MPDEDETInformation System (SAAQIS) monitoring stations reporting monitoring stations reporting to monitoring stations reporting (MPDEDET: Environmental structurephase II completed by mid-2012; to SAAQIS by 2014 SAAQIS by 2014 to SAAQIS by 2014 Services)
The efficient and effective 1 Highveld Priority AQMP Highveld Priority AQMP’s Provincial AQMP Developed 1 Provincial AQMP 3/1/14 As per proposed structure Funding of proposed DEA, MPDEDETidentification, development and developed implemented Implemented (MPDEDET: Environmental structureimplementation of Air Quality Services)Management Plans for National Priority Areas (Highveld ).
Sub-output 2.4 Identified climate change and adaptation framework
Climate change impacts identified and *Climate adaptation sectors plans Draft Discussion document on climate change mitigation Climate Change Response Strategy Climate Change Response Mar-14 As per proposed structure Additional financial DEA, MPDEDETadaptation frameworks integrated into in place by 2012; Climate Change Response strategy developed Strategy Implemented (MPDEDET: Environmental resources required12 national sectoral plans by 2012 Climate change adaptation plans Strategy compiled Services)
rolled out to municipal sphere of government;
Sub-output 3.3 Less waste that is better managed
80% by 2014 of permitted landfill sites Capacity building for 20% by 2011 of permitted 40% by 2011 of permitted 60% by 2011 of permitted 80% by 2011 of permitted landfill Mar-14 As per proposed structure Funding of proposed National Treasury, COGTA, Provinces, municipalities. landfill sites landfill sites landfill sites sites (MPDEDET: Environmental structure Local Government, DEA
Services)

Delivery agreement for outcome 10
131
APPENDIX C: PROVINCIAL DELIVERABLES (continued)
130
Delivery agreement for outcome 10
MILESTONES/DELIVERABLES RESOURCE REQUIREMENTSTARGET/INDICATOR ACTIVITIES YEAR 1 YEAR 2 YEAR 3 YEAR 4 TIME (COMPLETED BY) HUMAN RESOURCES FINANCIAL RESOURCES ROLES AND RESPONSIBILITIES
25% by 2012 municipal waste Targets for waste minimisation 5% 5% 5% 5% Mar-14 As per proposed structure Funding of proposed COGTA, Local governmentdiverted from landfills for recycling and standards set by end 2012 (MPDEDET: Environmental structure
Enhance energy potential of Services)waste by harnessing gasses from landfill sites for energy generation
Sub-output 3.5 Sustainable land use management
Land use management is guided by Strengthen sustainability principles 300 EIAs Evaluated and 600 EIAs Evaluated and 900 EIAs Evaluated and 1200 EIAs Evaluated and Mar-14 As per proposed structure Funding of proposed DRDLR and Relevant ProvincesEIAs, EMFs and SDF In land-use planning and growth Authorised Authorised Authorised Authorised (MPDEDET: Environmental structure
as well as development plans at Services)all levels
Environmental Management 2 EMFs Developed: 4 EMFs Developed: 6 EMFs Developed: 8 EMFs Developed: Mar-14 As per proposed structure Funding of proposed (1) DEA & provinces — manage EMF/SEA Framework/Strategic (MPDEDET: Environmental structure process & manage MOUs with Environmental Assessment/ Services) Municipalities. (2) Municipalities: other strategic environmental Participate in EMF/SEA processplanning projects initiated
Sub-output 4.1 % Land mass under conservation
9% Land mass under conservation Declaration of priority areas for 10 000 ha per province 10 000ha per province 10 000 ha per province 10 000ha per province Mar-14 Scientists, scenario Provincial Environmental Provincial environmental departments by 2014 expansion of protected areas planning and modeling Departments and agencies and agencies to identify, acquire and
network (Provincial) — Including experts, contract managers, to determine budgetary declare priority areas for expansionbiodiversity stewardship GIS experts (Human resources allocations (Partly funded.
current within Mpu comprises Additional finances required 2 posts and requires six posts over Years 1 to 4: over four years (therefore R 40 000 000 (for land only 33% of HR resources met)) purchase 20% of four year
target and biodiversity stewardship 80% of four year target)
Declaration of two botanical Potential site in Eastern Acquisition and proclamation Potential site in Limpopo Acquisition and proclamation Mar-14 GIS Specialists, Scientists Provincial Environmental SANBI-Identification and acquisition of gardens Cape identified identified Departments and agencies to the land. *DEA Proclamation of the land
determine budgetary allocations
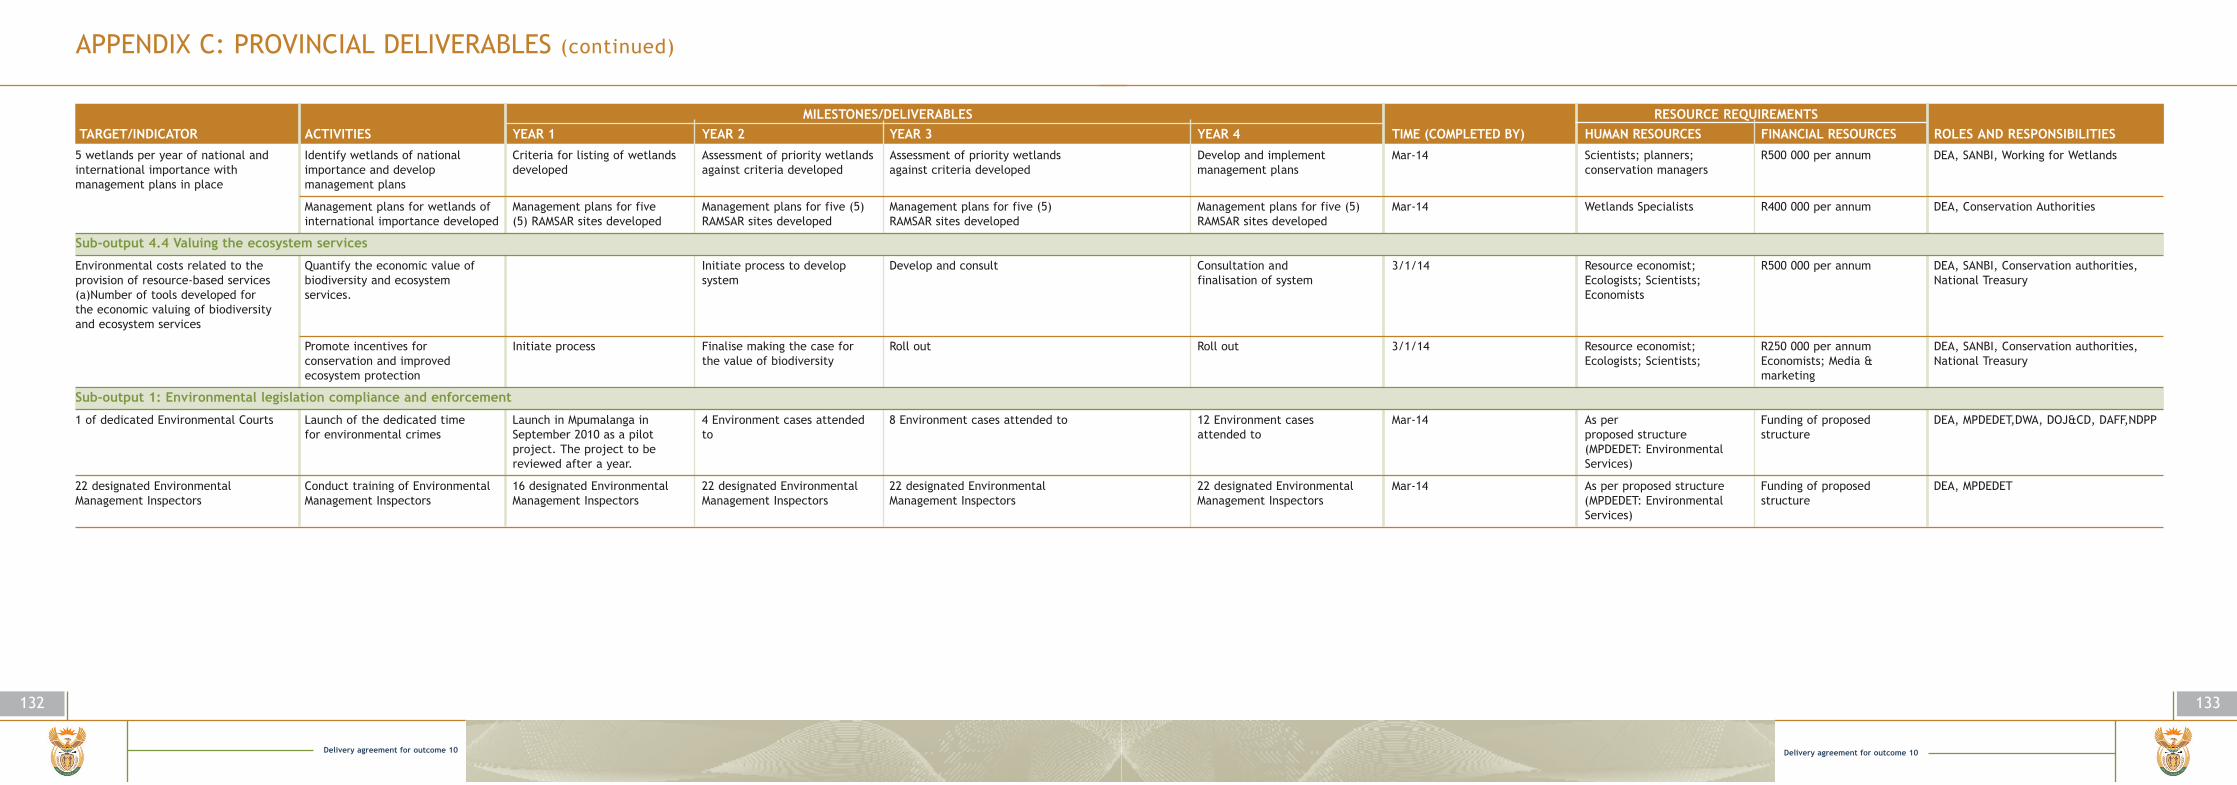
Delivery agreement for outcome 10
133
APPENDIX C: PROVINCIAL DELIVERABLES (continued)
132
Delivery agreement for outcome 10
MILESTONES/DELIVERABLES RESOURCE REQUIREMENTSTARGET/INDICATOR ACTIVITIES YEAR 1 YEAR 2 YEAR 3 YEAR 4 TIME (COMPLETED BY) HUMAN RESOURCES FINANCIAL RESOURCES ROLES AND RESPONSIBILITIES
5 wetlands per year of national and Identify wetlands of national Criteria for listing of wetlands Assessment of priority wetlands Assessment of priority wetlands Develop and implement Mar-14 Scientists; planners; R500 000 per annum DEA, SANBI, Working for Wetlandsinternational importance with importance and develop developed against criteria developed against criteria developed management plans conservation managersmanagement plans in place management plans
Management plans for wetlands of Management plans for five Management plans for five (5) Management plans for five (5) Management plans for five (5) Mar-14 Wetlands Specialists R400 000 per annum DEA, Conservation Authoritiesinternational importance developed (5) RAMSAR sites developed RAMSAR sites developed RAMSAR sites developed RAMSAR sites developed
Sub-output 4.4 Valuing the ecosystem services
Environmental costs related to the Quantify the economic value of Initiate process to develop Develop and consult Consultation and 3/1/14 Resource economist; R500 000 per annum DEA, SANBI, Conservation authorities, provision of resource-based services biodiversity and ecosystem system finalisation of system Ecologists; Scientists; National Treasury(a)Number of tools developed for services. Economiststhe economic valuing of biodiversity and ecosystem services
Promote incentives for Initiate process Finalise making the case for Roll out Roll out 3/1/14 Resource economist; R250 000 per annum DEA, SANBI, Conservation authorities, conservation and improved the value of biodiversity Ecologists; Scientists; Economists; Media & National Treasuryecosystem protection marketing
Sub-output 1: Environmental legislation compliance and enforcement
1 of dedicated Environmental Courts Launch of the dedicated time Launch in Mpumalanga in 4 Environment cases attended 8 Environment cases attended to 12 Environment cases Mar-14 As per Funding of proposed DEA, MPDEDET,DWA, DOJ&CD, DAFF,NDPPfor environmental crimes September 2010 as a pilot to attended to proposed structure structure
project. The project to be (MPDEDET: Environmental reviewed after a year. Services)
22 designated Environmental Conduct training of Environmental 16 designated Environmental 22 designated Environmental 22 designated Environmental 22 designated Environmental Mar-14 As per proposed structure Funding of proposed DEA, MPDEDETManagement Inspectors Management Inspectors Management Inspectors Management Inspectors Management Inspectors Management Inspectors (MPDEDET: Environmental structure
Services)

Delivery agreement for outcome 10
135
APPENDIX C: PROVINCIAL DELIVERABLES (continued)
134
Delivery agreement for outcome 10
MILESTONES/DELIVERABLES RESOURCE REQUIREMENTSTARGET/INDICATOR ACTIVITIES YEAR 1 YEAR 2 YEAR 3 YEAR 4 TIME (COMPLETED BY) HUMAN RESOURCES FINANCIAL RESOURCES ROLES AND RESPONSIBILITIES
Sub-output 2: Environmental Sustainability
Scaling up environmental education, Climate change Awareness programme, 7 Environmental awareness and 7 Environmental awareness 7 Environmental awareness 7 Environmental awareness and Mar-14 As per proposed structure Funding of proposed DEA, DST, Higher education, awareness and voluntary activism Tree planting Programme, education programmes and and education programmes and education programmes and education programmes and (MPDEDET: Environmental structure
Greenest Municipality, Pre school projects annually and projects annually projects annually projects annually Services)water programme, environmental commemorative programme, Adopt a school yard programme, Adopt a Spot programme
Implement and review annual Implement Waste, Water, Implement and review Waste, Implement and review Waste, Implement and review Waste, Mar-14 As per proposed structure Funding of proposed DEAProvincial targets and Greening targets annually: Water, and Greening targets Water, and Greening targets Water, and Greening targets (MPDEDET: Environmental structure
Decade of Education for annually: Decade of Education annually: Decade of Education annually: Decade of Education Services)Sustainable Development for Sustainable Development for Sustainable Development for Sustainable Development (DESD) Provincial forum DESD) Provincial forum (DESD) Provincial forum (DESD) Provincial forum
OUTCOME 10: PROTECTED AND ENHANCED ENVIRONMENTAL ASSETS AND NATURAL RESOURCES - NORTHERN CAPE DE&NCOUTPUT 1: QUALITY AND QUANTITY OF WATER RESOURCES ENHANCEDSub-output 1.1: Water demand
DWA
Sub-output 1.2 Water resource protection
# wetlands under formal protection Identify wetlands of national Criteria for listing of Assessment of priority wetlands Assessment of priority wetlands Develop and implement 3/1/14 Scientists, planners, R500 000/a Conservation Authorities — implement (4 by 2014) importance and develop wetlands developed against criteria developed against criteria developed management plans conservation manager plans
management plan
Management plans for wetlands Management plans for five Management plans for five Assessment of priority wetlands Develop and implement 3/1/14 Managers, Field Rangers R400 000/plan DEA, Provincesof international importance RAMSAR sites developed RAMSAR sites develop against criteria developed management plans and General assistantsdeveloped
OUTPUT 2: REDUCED GREENHOUSE GAS EMISSIONS, CLIMATE CHANGE & IMPROVED AIR/ATMOSPHERIC QUALITY
Reduced total emmissions of CO2 by GHGs identified as “Priority Mar-14 R800 000 — R900 000 per DEA, Provinces, Local Government34% reduction of “Business As Usual” Pollutants” in terms of the Air annum from year 4 by 2020 and 42% by 2025; 80% of Quality Act and mitigation plans (Northern Cape)government owned monitoring stations submitted by end 2013;reporting to SAAQIS

Delivery agreement for outcome 10
137
APPENDIX C: PROVINCIAL DELIVERABLES (continued)
136
Delivery agreement for outcome 10
MILESTONES/DELIVERABLES RESOURCE REQUIREMENTSTARGET/INDICATOR ACTIVITIES YEAR 1 YEAR 2 YEAR 3 YEAR 4 TIME (COMPLETED BY) HUMAN RESOURCES FINANCIAL RESOURCES ROLES AND RESPONSIBILITIES
Sub-output 2.2: Atmospheric pollutants
100% country-wide compliance with The efficient and effective (i) Vaal Triangle Air-shed Priority (i) Progress and review report (i) Vaal Triangle Air-shed Priority Environmental officers R800 000 — R900 000 per Provincesnational Ambient Air Quality identification, development Area Air Quality Management compiled and published for the Area Air Quality management annum from year 4 Standards by 2020 and implementation of Air Quality Plan under full implementation, Vaal Triangle Air-shed Priority Plan updated, (ii) Highveld Priority (Northern Cape)
Management Plans for National (ii) draft plan for the Highveld Area, (ii) Highveld Priority Area Area Air Quality Management Plan Priority Areas (Vaal Triangle Air- Priority Area developed and Air Quality Management Plan under full implementation and shed, Highveld and Waterberg) published for public comment promulgated and (iii) Waterberg (iii) Waterberg Priority Area Air
and (iii) Minister’s intention Priority Area problem analysis Quality Management Plan to declare the Waterberg completed published for public commentPriority Area published
The review, revision and implementation Environmental officers DEA, Provinces, Local Governmentof the National Vehicle Emission Control Strategy
Growing and developing the National Environmental officers DEA, Provinces, Local GovernmentAmbient Air Quality Monitoring Network and the South African Air Quality Information System (SAAQIS)
Sub-output 2.3 Renewable energy deployed
10 000 Gw/hours renewable energy Implementation of Industrial Policy Adoption of the green economy Feasibility to be completed Additional financial Provincesproduction by 2014 Action Plan and green economy strategy resources required (DENC
plan and strategy development Northern Cape)
Sub-output 2.4 Identified climate change and adaptation framework
Climate change impacts identified and Climate change adaptation plans Socio-economists, natural Additional financial Provinces, Local Governmentadaptation frameworks integrated rolled out to provincial and municipal resource scientists resources requiredinto 12 national sectoral plans by 2012 sphere of government;
OUTPUT 3: SUSTAINABLE ENVIRONMENTAL MANAGEMENTSub-output 3.1 Degraded ecosystems rehabilitated & restored
3.2 mha by 2014 of land rehabilitated x number of ha including x number including rehabilitation x number Including rehabilitation x number Including rehabilitation 31/03/2010 HR Capacity already exist All member departments of DRDLR, Relevant Provincial and 160 rural development sites rehabilitation on 25 CRDP Sites on 37 CRDP Sites (wards) on 44 CRDP Sites (wards) on 33 CRDP Sites (wards) the CRDP Council of Governmentby 2014 (wards) Stakeholders to commit funds
towards the rehabilitation of land in rural areas
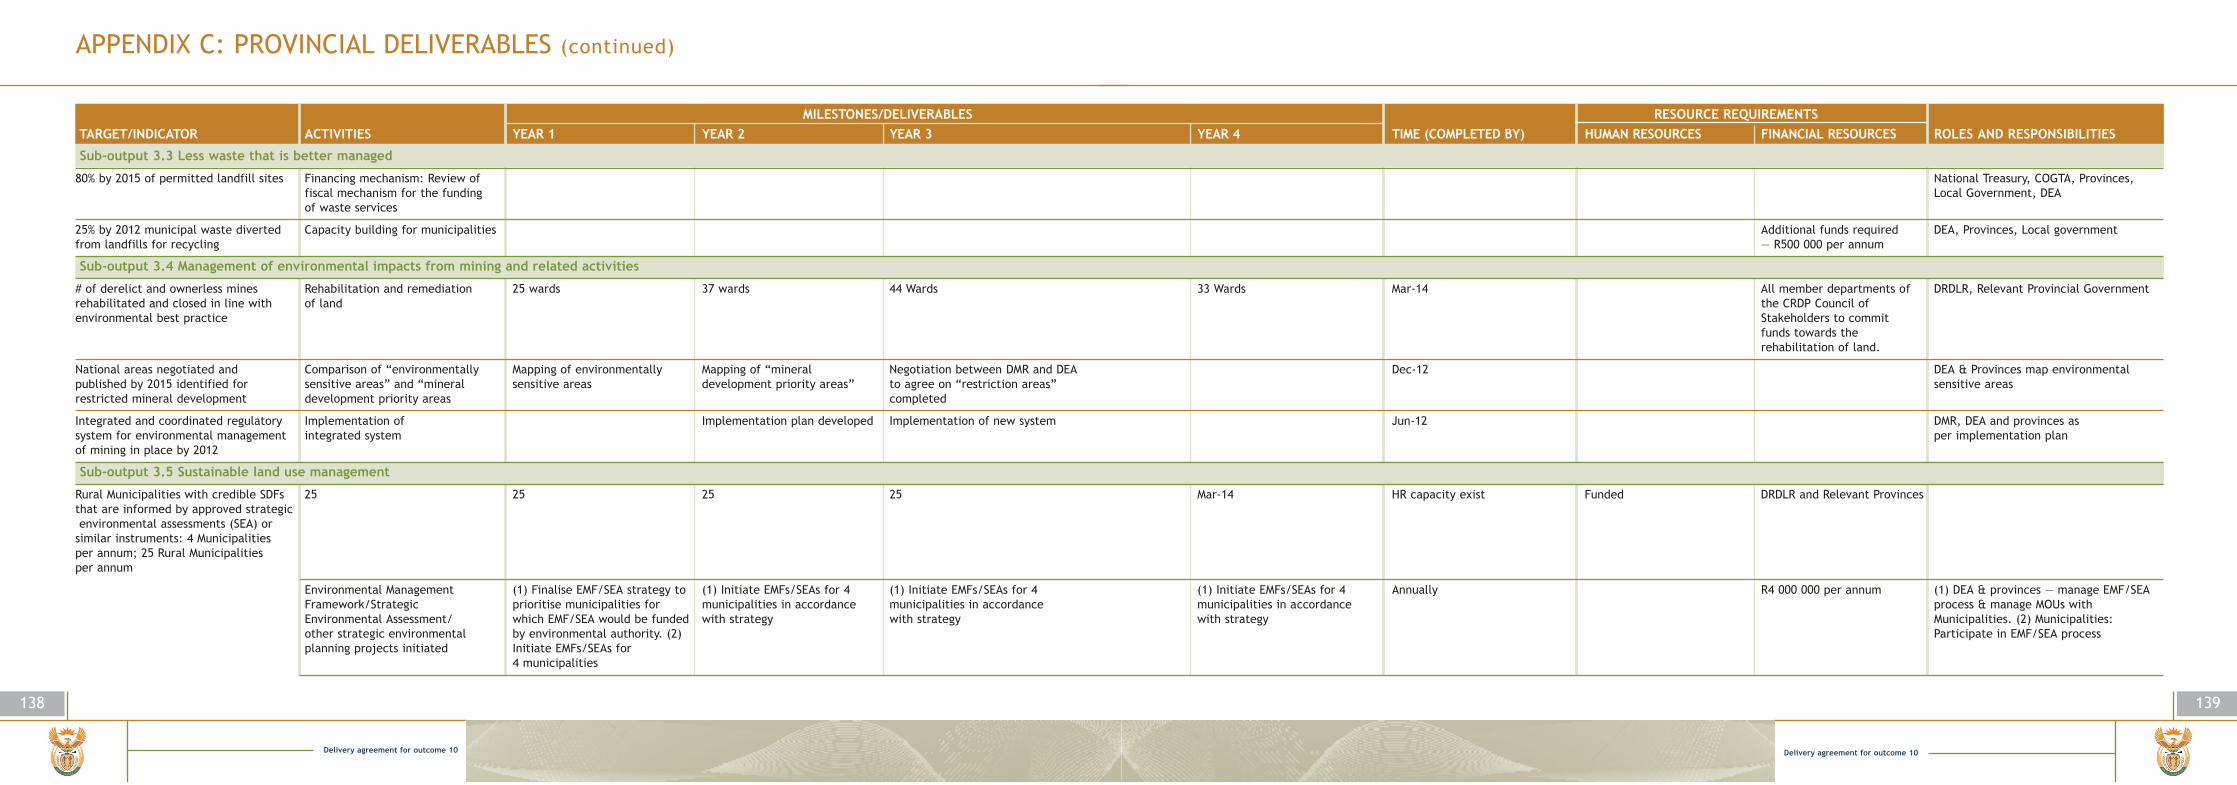
Delivery agreement for outcome 10
139
APPENDIX C: PROVINCIAL DELIVERABLES (continued)
138
Delivery agreement for outcome 10
MILESTONES/DELIVERABLES RESOURCE REQUIREMENTSTARGET/INDICATOR ACTIVITIES YEAR 1 YEAR 2 YEAR 3 YEAR 4 TIME (COMPLETED BY) HUMAN RESOURCES FINANCIAL RESOURCES ROLES AND RESPONSIBILITIES
Sub-output 3.3 Less waste that is better managed
80% by 2015 of permitted landfill sites Financing mechanism: Review of National Treasury, COGTA, Provinces, fiscal mechanism for the funding Local Government, DEAof waste services
25% by 2012 municipal waste diverted Capacity building for municipalities Additional funds required DEA, Provinces, Local governmentfrom landfills for recycling — R500 000 per annum
Sub-output 3.4 Management of environmental impacts from mining and related activities
# of derelict and ownerless mines Rehabilitation and remediation 25 wards 37 wards 44 Wards 33 Wards Mar-14 All member departments of DRDLR, Relevant Provincial Governmentrehabilitated and closed in line with of land the CRDP Council of environmental best practice Stakeholders to commit
funds towards the rehabilitation of land.
National areas negotiated and Comparison of “environmentally Mapping of environmentally Mapping of “mineral Negotiation between DMR and DEA Dec-12 DEA & Provinces map environmental published by 2015 identified for sensitive areas” and “mineral sensitive areas development priority areas” to agree on “restriction areas” sensitive areasrestricted mineral development development priority areas completed
Integrated and coordinated regulatory Implementation of Implementation plan developed Implementation of new system Jun-12 DMR, DEA and provinces as system for environmental management integrated system per implementation planof mining in place by 2012
Sub-output 3.5 Sustainable land use management
Rural Municipalities with credible SDFs 25 25 25 25 Mar-14 HR capacity exist Funded DRDLR and Relevant Provincesthat are informed by approved strategicenvironmental assessments (SEA) or
similar instruments: 4 Municipalities per annum; 25 Rural Municipalities per annum
Environmental Management (1) Finalise EMF/SEA strategy to (1) Initiate EMFs/SEAs for 4 (1) Initiate EMFs/SEAs for 4 (1) Initiate EMFs/SEAs for 4 Annually R4 000 000 per annum (1) DEA & provinces — manage EMF/SEA Framework/Strategic prioritise municipalities for municipalities in accordance municipalities in accordance municipalities in accordance process & manage MOUs with Environmental Assessment/ which EMF/SEA would be funded with strategy with strategy with strategy Municipalities. (2) Municipalities: other strategic environmental by environmental authority. (2) Participate in EMF/SEA processplanning projects initiated Initiate EMFs/SEAs for
4 municipalities

Delivery agreement for outcome 10
141
APPENDIX C: PROVINCIAL DELIVERABLES (continued)
140
Delivery agreement for outcome 10
MILESTONES/DELIVERABLES RESOURCE REQUIREMENTSTARGET/INDICATOR ACTIVITIES YEAR 1 YEAR 2 YEAR 3 YEAR 4 TIME (COMPLETED BY) HUMAN RESOURCES FINANCIAL RESOURCES ROLES AND RESPONSIBILITIES
Environmental Management Finalise EMFs initiated for 4 Finalise EMFs initiated for 4 Finalise EMFs initiated for 4 Finalise EMFs initiated for Annually R4,000,000 per annum (1) DEA & provinces — initiate EMFs & Framework/Strategic municipalities municipalities municipalities 4 municipalities enter into MOUs with Municipalities. Environmental Assessment/other (2) Municipalities: Participate in strategic environmental planning EMF/SEA processprojects finalised/approved by MEC/Minister and relevant Mayor(s)
OUTPUT 4: BIODIVERSITY PROTECTED Sub-output 4.1 % Land mass under conservation
9% Land mass under conservation Declaration of priority areas for 10 000 ha per province 10 000ha per province 10 000 ha per province 10 000ha per province Mar-14 Scientists, scenario planning Provincial Environmental Provincial environmental departments andby 2014 expansion of protected areas and modeling experts, contract Departments and agencies agencies to identify, acquire and
network ( Provincial) — Including managers, GIS experts to determine budgetary declare priority areas for expansion biodiversity stewardship (Human resources current allocations (Partly funded.
within Mpu comprises 2 posts Additional finances required and requires six posts over over Years 1 to 4:
four years (therefore only R 40 000 000 (for land 33% of HR resources met) purchase 20% of four year
target and biodiversity stewardship 80% of four year target)
Declaration of two botanical Potential site in Eastern Acquisition and proclamation Potential site in Limpopo Acquisition and proclamation Mar-14 GIS Specialists, Scientists Provincial Environmental SANBI-Identification and acquisition of the gardens Cape identified identified Departments and agencies land. *DEA Proclamation of the land
to determine budgetary allocations
Minimum 20% of estuaries with full SANBI, DEA, DAFF, DWA, Provincial protection/partial protection by 2015 conservation authorities and
Local Government
Sub-output 4.4 Valuing the ecosystem services
Environmental costs related to the Quantify the economic value of Initiate process to develop Develop and consult Consultation and 3/1/14 Resource economist; R500 000 per annum DEA, SANBI, Conservation authorities, provision of resource-based services biodiversity and ecosystem services. system finalisation of system Ecologists; Scientists; National Treasury(a)Number of tools developed for Economiststhe economic valuing of biodiversity and ecosystem services

Delivery agreement for outcome 10
143
APPENDIX C: PROVINCIAL DELIVERABLES (continued)
142
Delivery agreement for outcome 10
MILESTONES/DELIVERABLES RESOURCE REQUIREMENTSTARGET/INDICATOR ACTIVITIES YEAR 1 YEAR 2 YEAR 3 YEAR 4 TIME (COMPLETED BY) HUMAN RESOURCES FINANCIAL RESOURCES ROLES AND RESPONSIBILITIES
Promote incentives for conservation Initiate process Finalise making the case for Roll out Roll out 3/1/14 Resource economist; Ecologists; R250 000 per annum DEA, SANBI, Conservation authorities, and improved ecosystem protection the value of biodiversity Scientists; Economists; National Treasury
Media & marketing
OUTCOME 10 CROSS-CUTTING SUB-OUTPUTSSub-output 1: Environmental legislation compliance and enforcement
150 Environmental Management Conduct training of Environmental Designation of 150 trained NEMA to be amended to provide Designation of EMIs functions carried DEA; COGTA;SALGA; local government; Inspectorate designated by 2011 Management Inspectors Local government officials as for Designation of EMIs by out at local government level provinces
EMI by MEC local authorities
Sub-output 2: Environmental Sustainability
1,156,00 EPWP work opportunities and Provinces325 652 FTEs (Full Time Equivalents) by 2014
OUTCOME 4: Decent Employment through Inclusive Economic GrowthOUTPUT:2 : MORE LABOUR ABSORBING GROWTH- SUBOUTPUT 5: GREEN ECONOMY
Expanded Public Works Programme: Financial resources required Provincesscale up and expansion of Green (R1 000 000 — DENC Jobs opportunities through EPWP II Northern Capeto 1 156 00 EPWP work opportunities and 325 652 FTEs (Full Time Equivalents) by 2014
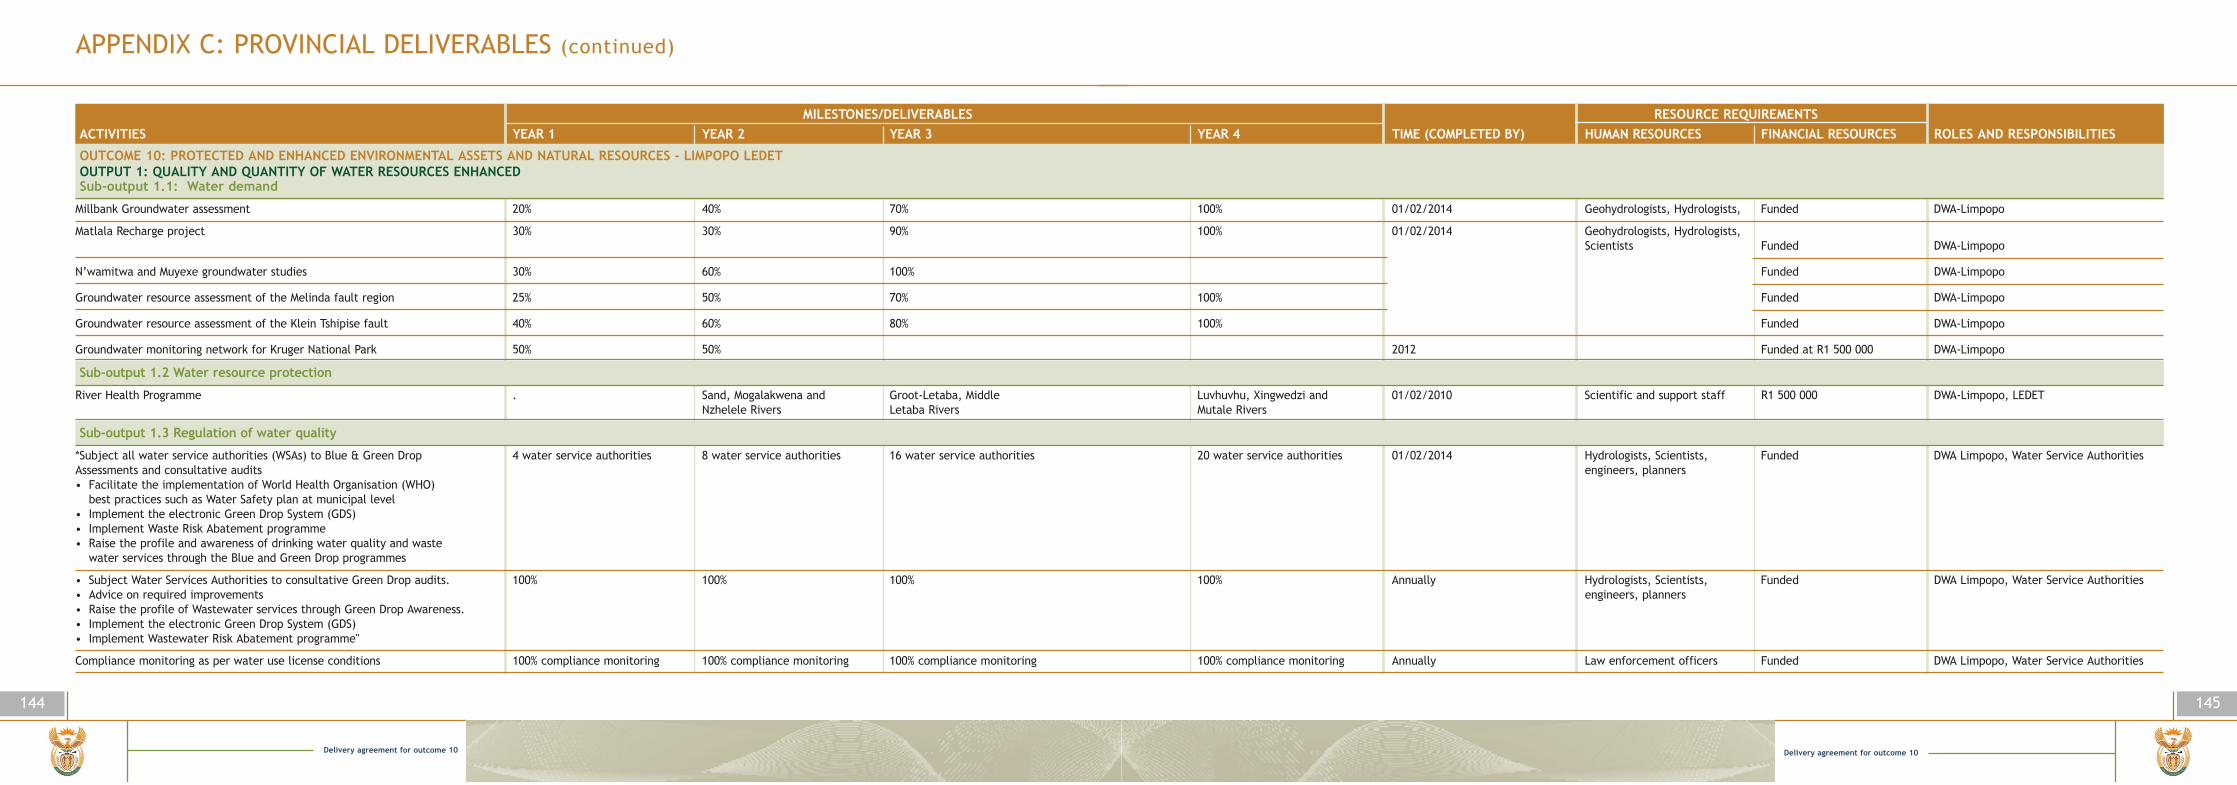
Delivery agreement for outcome 10
145
APPENDIX C: PROVINCIAL DELIVERABLES (continued)
144
Delivery agreement for outcome 10
MILESTONES/DELIVERABLES RESOURCE REQUIREMENTSACTIVITIES YEAR 1 YEAR 2 YEAR 3 YEAR 4 TIME (COMPLETED BY) HUMAN RESOURCES FINANCIAL RESOURCES ROLES AND RESPONSIBILITIES
OUTCOME 10: PROTECTED AND ENHANCED ENVIRONMENTAL ASSETS AND NATURAL RESOURCES - LIMPOPO LEDETOUTPUT 1: QUALITY AND QUANTITY OF WATER RESOURCES ENHANCEDSub-output 1.1: Water demand
Millbank Groundwater assessment 20% 40% 70% 100% 01/02/2014 Geohydrologists, Hydrologists, Funded DWA-Limpopo
Matlala Recharge project 30% 30% 90% 100% 01/02/2014 Geohydrologists, Hydrologists, Scientists Funded DWA-Limpopo
N’wamitwa and Muyexe groundwater studies 30% 60% 100% Funded DWA-Limpopo
Groundwater resource assessment of the Melinda fault region 25% 50% 70% 100% Funded DWA-Limpopo
Groundwater resource assessment of the Klein Tshipise fault 40% 60% 80% 100% Funded DWA-Limpopo
Groundwater monitoring network for Kruger National Park 50% 50% 2012 Funded at R1 500 000 DWA-Limpopo
Sub-output 1.2 Water resource protection
River Health Programme . Sand, Mogalakwena and Groot-Letaba, Middle Luvhuvhu, Xingwedzi and 01/02/2010 Scientific and support staff R1 500 000 DWA-Limpopo, LEDETNzhelele Rivers Letaba Rivers Mutale Rivers
Sub-output 1.3 Regulation of water quality
*Subject all water service authorities (WSAs) to Blue & Green Drop 4 water service authorities 8 water service authorities 16 water service authorities 20 water service authorities 01/02/2014 Hydrologists, Scientists, Funded DWA Limpopo, Water Service AuthoritiesAssessments and consultative audits engineers, planners• Facilitate the implementation of World Health Organisation (WHO)
best practices such as Water Safety plan at municipal level • Implement the electronic Green Drop System (GDS)• Implement Waste Risk Abatement programme• Raise the profile and awareness of drinking water quality and waste
water services through the Blue and Green Drop programmes
• Subject Water Services Authorities to consultative Green Drop audits. 100% 100% 100% 100% Annually Hydrologists, Scientists, Funded DWA Limpopo, Water Service Authorities• Advice on required improvements engineers, planners• Raise the profile of Wastewater services through Green Drop Awareness.• Implement the electronic Green Drop System (GDS)• Implement Wastewater Risk Abatement programme"
Compliance monitoring as per water use license conditions 100% compliance monitoring 100% compliance monitoring 100% compliance monitoring 100% compliance monitoring Annually Law enforcement officers Funded DWA Limpopo, Water Service Authorities
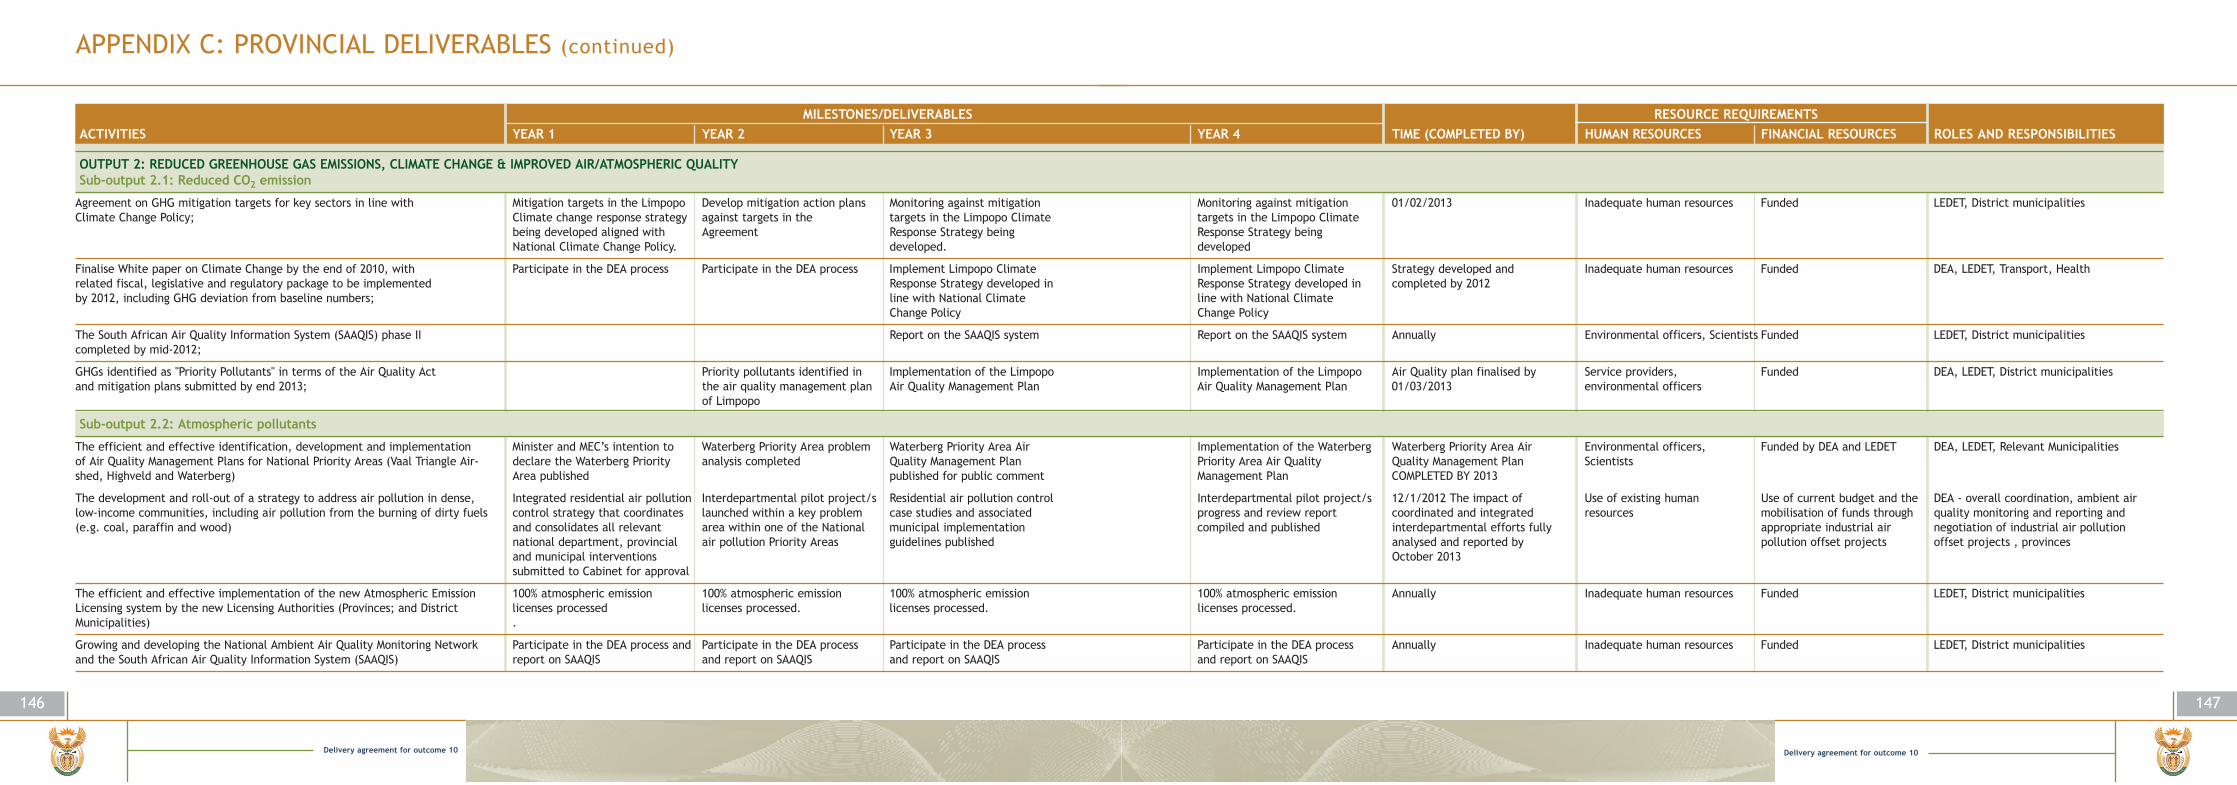
Delivery agreement for outcome 10
147
APPENDIX C: PROVINCIAL DELIVERABLES (continued)
146
Delivery agreement for outcome 10
MILESTONES/DELIVERABLES RESOURCE REQUIREMENTSACTIVITIES YEAR 1 YEAR 2 YEAR 3 YEAR 4 TIME (COMPLETED BY) HUMAN RESOURCES FINANCIAL RESOURCES ROLES AND RESPONSIBILITIES
OUTPUT 2: REDUCED GREENHOUSE GAS EMISSIONS, CLIMATE CHANGE & IMPROVED AIR/ATMOSPHERIC QUALITYSub-output 2.1: Reduced CO2 emission
Agreement on GHG mitigation targets for key sectors in line with Mitigation targets in the Limpopo Develop mitigation action plans Monitoring against mitigation Monitoring against mitigation 01/02/2013 Inadequate human resources Funded LEDET, District municipalitiesClimate Change Policy; Climate change response strategy against targets in the targets in the Limpopo Climate targets in the Limpopo Climate
being developed aligned with Agreement Response Strategy being Response Strategy beingNational Climate Change Policy. developed. developed
Finalise White paper on Climate Change by the end of 2010, with Participate in the DEA process Participate in the DEA process Implement Limpopo Climate Implement Limpopo Climate Strategy developed and Inadequate human resources Funded DEA, LEDET, Transport, Healthrelated fiscal, legislative and regulatory package to be implemented Response Strategy developed in Response Strategy developed in completed by 2012by 2012, including GHG deviation from baseline numbers; line with National Climate line with National Climate
Change Policy Change Policy
The South African Air Quality Information System (SAAQIS) phase II Report on the SAAQIS system Report on the SAAQIS system Annually Environmental officers, Scientists Funded LEDET, District municipalitiescompleted by mid-2012;
GHGs identified as "Priority Pollutants" in terms of the Air Quality Act Priority pollutants identified in Implementation of the Limpopo Implementation of the Limpopo Air Quality plan finalised by Service providers, Funded DEA, LEDET, District municipalitiesand mitigation plans submitted by end 2013; the air quality management plan Air Quality Management Plan Air Quality Management Plan 01/03/2013 environmental officers
of Limpopo
Sub-output 2.2: Atmospheric pollutants
The efficient and effective identification, development and implementation Minister and MEC’s intention to Waterberg Priority Area problem Waterberg Priority Area Air Implementation of the Waterberg Waterberg Priority Area Air Environmental officers, Funded by DEA and LEDET DEA, LEDET, Relevant Municipalitiesof Air Quality Management Plans for National Priority Areas (Vaal Triangle Air- declare the Waterberg Priority analysis completed Quality Management Plan Priority Area Air Quality Quality Management Plan Scientistsshed, Highveld and Waterberg) Area published published for public comment Management Plan COMPLETED BY 2013
The development and roll-out of a strategy to address air pollution in dense, Integrated residential air pollution Interdepartmental pilot project/s Residential air pollution control Interdepartmental pilot project/s 12/1/2012 The impact of Use of existing human Use of current budget and the DEA - overall coordination, ambient airlow-income communities, including air pollution from the burning of dirty fuels control strategy that coordinates launched within a key problem case studies and associated progress and review report coordinated and integrated resources mobilisation of funds through quality monitoring and reporting and(e.g. coal, paraffin and wood) and consolidates all relevant area within one of the National municipal implementation compiled and published interdepartmental efforts fully appropriate industrial air negotiation of industrial air pollution
national department, provincial air pollution Priority Areas guidelines published analysed and reported by pollution offset projects offset projects , provincesand municipal interventions October 2013submitted to Cabinet for approval
The efficient and effective implementation of the new Atmospheric Emission 100% atmospheric emission 100% atmospheric emission 100% atmospheric emission 100% atmospheric emission Annually Inadequate human resources Funded LEDET, District municipalitiesLicensing system by the new Licensing Authorities (Provinces; and District licenses processed licenses processed. licenses processed. licenses processed.Municipalities) .
Growing and developing the National Ambient Air Quality Monitoring Network Participate in the DEA process and Participate in the DEA process Participate in the DEA process Participate in the DEA process Annually Inadequate human resources Funded LEDET, District municipalitiesand the South African Air Quality Information System (SAAQIS) report on SAAQIS and report on SAAQIS and report on SAAQIS and report on SAAQIS
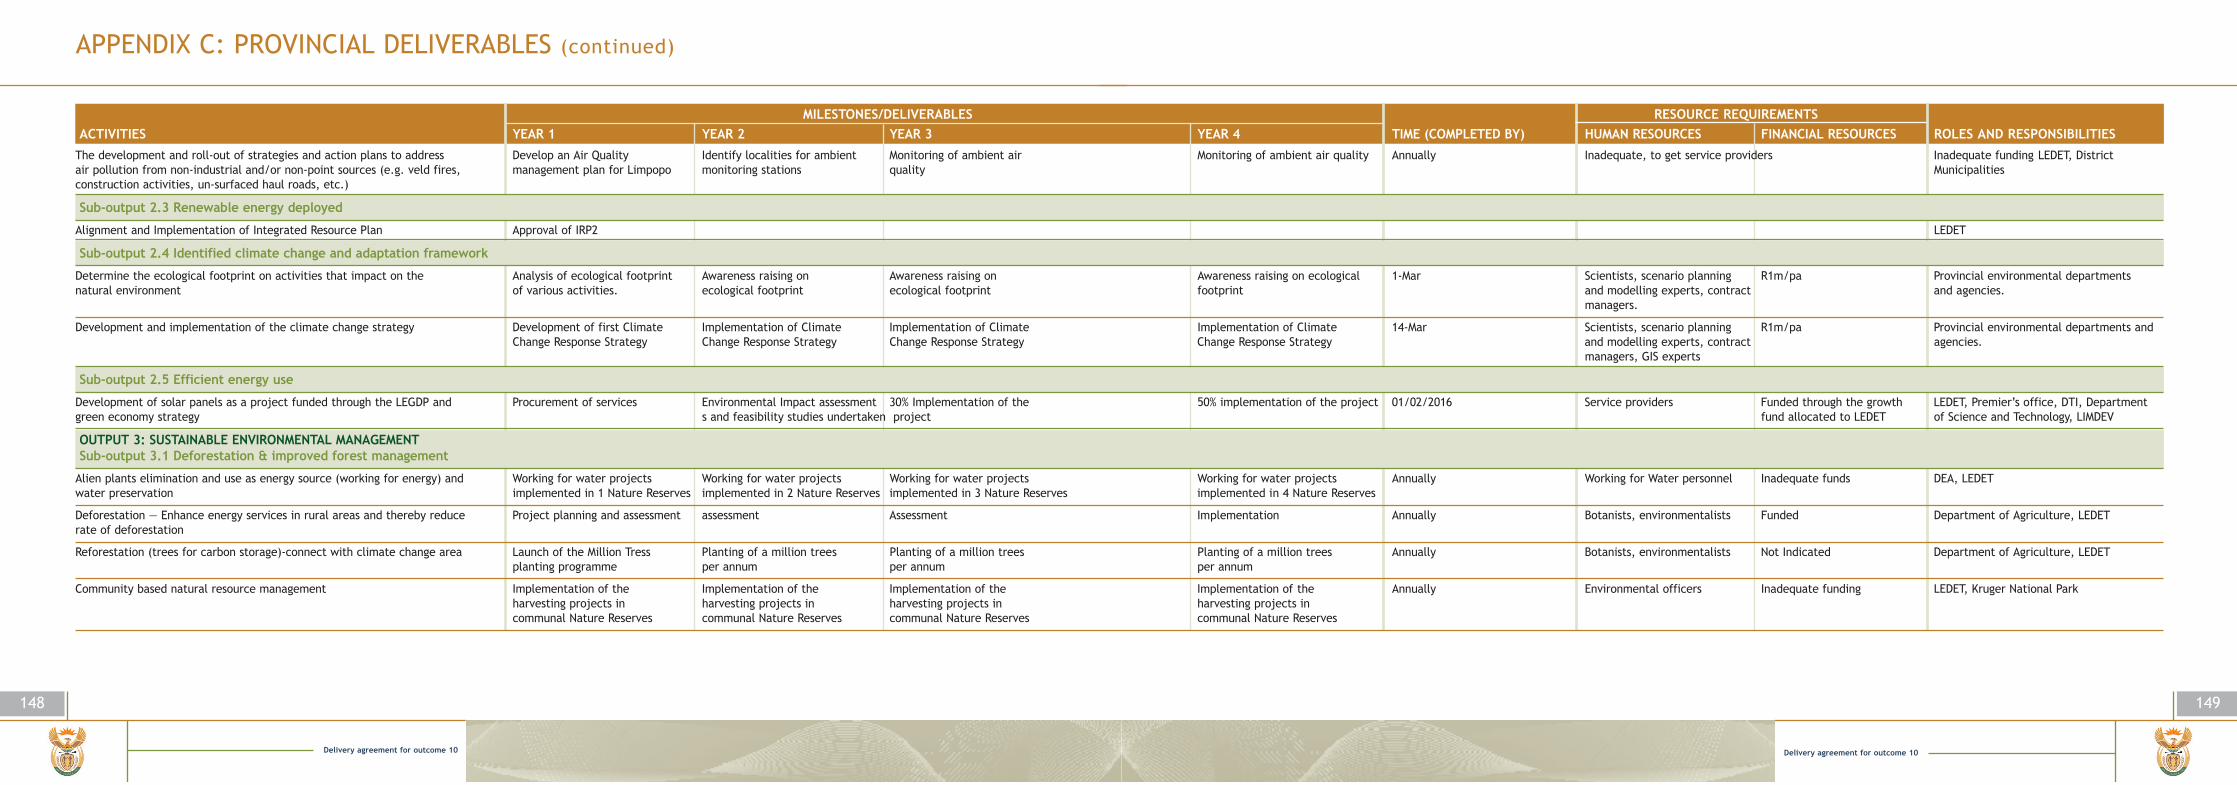
Delivery agreement for outcome 10
149
APPENDIX C: PROVINCIAL DELIVERABLES (continued)
148
Delivery agreement for outcome 10
MILESTONES/DELIVERABLES RESOURCE REQUIREMENTSACTIVITIES YEAR 1 YEAR 2 YEAR 3 YEAR 4 TIME (COMPLETED BY) HUMAN RESOURCES FINANCIAL RESOURCES ROLES AND RESPONSIBILITIES
The development and roll-out of strategies and action plans to address Develop an Air Quality Identify localities for ambient Monitoring of ambient air Monitoring of ambient air quality Annually Inadequate, to get service providers Inadequate funding LEDET, District air pollution from non-industrial and/or non-point sources (e.g. veld fires, management plan for Limpopo monitoring stations quality Municipalitiesconstruction activities, un-surfaced haul roads, etc.)
Sub-output 2.3 Renewable energy deployed
Alignment and Implementation of Integrated Resource Plan Approval of IRP2 LEDET
Sub-output 2.4 Identified climate change and adaptation framework
Determine the ecological footprint on activities that impact on the Analysis of ecological footprint Awareness raising on Awareness raising on Awareness raising on ecological 1-Mar Scientists, scenario planning R1m/pa Provincial environmental departments natural environment of various activities. ecological footprint ecological footprint footprint and modelling experts, contract and agencies.
managers.
Development and implementation of the climate change strategy Development of first Climate Implementation of Climate Implementation of Climate Implementation of Climate 14-Mar Scientists, scenario planning R1m/pa Provincial environmental departments andChange Response Strategy Change Response Strategy Change Response Strategy Change Response Strategy and modelling experts, contract agencies.
managers, GIS experts
Sub-output 2.5 Efficient energy use
Development of solar panels as a project funded through the LEGDP and Procurement of services Environmental Impact assessment 30% Implementation of the 50% implementation of the project 01/02/2016 Service providers Funded through the growth LEDET, Premier’s office, DTI, Department green economy strategy s and feasibility studies undertaken project fund allocated to LEDET of Science and Technology, LIMDEV
OUTPUT 3: SUSTAINABLE ENVIRONMENTAL MANAGEMENT Sub-output 3.1 Deforestation & improved forest management
Alien plants elimination and use as energy source (working for energy) and Working for water projects Working for water projects Working for water projects Working for water projects Annually Working for Water personnel Inadequate funds DEA, LEDETwater preservation implemented in 1 Nature Reserves implemented in 2 Nature Reserves implemented in 3 Nature Reserves implemented in 4 Nature Reserves
Deforestation — Enhance energy services in rural areas and thereby reduce Project planning and assessment assessment Assessment Implementation Annually Botanists, environmentalists Funded Department of Agriculture, LEDETrate of deforestation
Reforestation (trees for carbon storage)-connect with climate change area Launch of the Million Tress Planting of a million trees Planting of a million trees Planting of a million trees Annually Botanists, environmentalists Not Indicated Department of Agriculture, LEDETplanting programme per annum per annum per annum
Community based natural resource management Implementation of the Implementation of the Implementation of the Implementation of the Annually Environmental officers Inadequate funding LEDET, Kruger National Parkharvesting projects in harvesting projects in harvesting projects in harvesting projects incommunal Nature Reserves communal Nature Reserves communal Nature Reserves communal Nature Reserves

Delivery agreement for outcome 10
151
APPENDIX C: PROVINCIAL DELIVERABLES (continued)
150
Delivery agreement for outcome 10
MILESTONES/DELIVERABLES RESOURCE REQUIREMENTSACTIVITIES YEAR 1 YEAR 2 YEAR 3 YEAR 4 TIME (COMPLETED BY) HUMAN RESOURCES FINANCIAL RESOURCES ROLES AND RESPONSIBILITIES
Sub-output 3.2 Less waste that is better managed
Quantification and characterisation of waste from cradle to grave to initiate Development of terms of Data collection from all districts Completion of the quantisation, 1/03/2013 Waste management specialists, Funded LEDET, Local municipalitiesthe implementation of the waste information system. reference and initiation of in Limpopo characterisation and modelling scientists, planners
procurement for service providers.
Implementation of the Waste Information System Capacity building on population Establishment of a pilot project Full implementation and Full implementation and Annually Municipality environmental Inadequate funds LEDET, Local municipalitiesof the waste information system in Capricon on the population of population of the waste population of the waste health officers
the waste information system information system in all districts. information system in all districts.
Capacity building for municipalities on waste minimisation and recycling Development of a database on Awareness workshops and Development of Resource 50% entrenched of recycling 01/03/2015 Municipality environmental Funded DTI, Indalo Yethu. Local Government,recycling facilities in Limpopo supporting municipality with materials on recycling in the municipalities health officers Municipalities, LEDET
recycling. and distribution.
Support of municipalities through targeted waste projects. Implementation of the Implementation of the Makhado Facilitate municipal waste Annually Scientists, Municipality Inadequate funds LEDET, Municipalities, service providers.Makhuduthamaga waste waste collection project. quantification. environmental health officerscollection projects
Development of a government consumption strategy First Draft of the consumption Public participation and gazetting Implementation of the strategy Implementation of the strategy Annual implementation of the Waste management specialists, Funded LEDET, Local municipalities, Health, Public strategy developed of the strategy and action plan. and action plan. and action plan. strategy and action plan scientists, planners Works, Agriculture
Sub-output 3.3 Management of environmental impacts from mining and related activities
Environmental Management Programmes (EMPs) approved 100% of the received EMPs 100% of the received EMPs 100% of the received EMPs 100% of the received EMPs Annually Scientists, planners, Funded DMR and LEDETapproved approved approved approved environmental officers,
GIS specialists
Mining inspections conducted 200 mining inspection conducted 200 mining inspection conducted 200 mining inspection conducted 200 mining inspection conducted Annually Scientists, planners, Funded DMR and LEDETenvironmental officers, GIS specialists
Sub-output 3.4 Sustainable land use management
Development of SDF for Rural Municipalities 25 25 25 25 Funded DRDLR, COGTA and Planning commissiondevelop legislation, LEDET
Environmental Planning integrated into NEW Spatial Planning and Participation in law reform Participation in law reform Participation in law reform Participation in law reform 1/1/12 Not funded by LEDET DRDLR, COGTA and Planning commissionLand Use Management Act process process/effect agreed process/effect agreed process/effect agreed develop legislation, LEDET
amendments to environmental amendments to environmental amendments to environmental legislation legislation legislation

Delivery agreement for outcome 10
153
APPENDIX C: PROVINCIAL DELIVERABLES (continued)
152
Delivery agreement for outcome 10
MILESTONES/DELIVERABLES RESOURCE REQUIREMENTSACTIVITIES YEAR 1 YEAR 2 YEAR 3 YEAR 4 TIME (COMPLETED BY) HUMAN RESOURCES FINANCIAL RESOURCES ROLES AND RESPONSIBILITIES
Environmental Management Framework/Strategic Environmental Assessment/ EMF for Waterberg District EMF for Soutpansberg area EMF for Soutpansberg area EMF for Vhembe District Annually Scientists, planners, Funds not adequate. LEDET, DEA and affected local authoritiesother strategic environmental planning projects initiated finalises initiated completed & EMF for Vhembe completed environmental officers, Relying on DEA for cofunding.
District initiated GIS specialists R2 million per annum required.
EMF/SEA/Other integrated into Municipal SDF and SDF adopted by EMF for Olifants Letaba Rivers Integration of Olifants Letaba Integration of Waterberg EMF Integration of Soutpansberg into 30/02.2013 Scientists, planners, Not indicated LEDET and local authoritiesMinister/MEC distributed to relevant local Rivers EMF into municipal SDFs into municipal SDFs municipal SDFs environmental officers,
authorities GIS specialists
Applications for environmental impact assessment (EIA) processed. 100% of EIA applications 100% of EIA applications 100% of EIA applications 100% of EIA applications Annually 50% vacancy rate currently. R8,7 million per annum LEDET, DEA and affected local authoritiesprocessed. processed. processed. processed. 54 officials of Scientists and
planners
OUTPUT 4. BIODIVERSITY PROTECTED Sub-output 4.1 % Land mass under conservation
Evaluate management effectiveness of nature reserves in the province Evaluate management effectiveness Evaluate management Evaluate management effectiveness Evaluate management effectiveness 3/1/14 Scientists, scenario planning Funded - R300 000.00 LEDETof 12 nature reserves per year of 12 nature reserves per year effectiveness of 12 nature of 12 nature reserves per year and modelling experts, contract
reserves per year managers, GIS experts
Implementation of stewardship programme and expansion in order to Secure two stewardship sites per Secure two stewardship sites per Secure two stewardship sites per Secure two stewardship sites per 3/1/14 Scientist, lawyers, negotiators, Current funding us inadequate LEDETincrease the protected areas network year and implement projects in year and implement projects in year and implement projects in year and implement projects in scenario planning, development The following funds are
areas identified for expansion areas identified for expansion areas identified for expansion areas identified for expansion economists required 2010 — 11: R1 554; 2011 — R12,2 mil; 2012 — R2,5 mil; 2013: R3 mil; 2014: R4 mil for master plans and basic infrastructure.
Declaration of priority areas for expansion of protected areas network Declare three protected areas Declare three protected area Declare three protected area Declare three protected area 3/1/14 Scientists, scenario planning 2010 — 11: 250 000; 2011 — LEDET(Provincial) and modelling experts, contract 300 000; 2012 — 400 000;
managers, GIS experts 2013 — 500 000; 2014 for survey of protected areasand gazetting
Update the register by adding information of 20 privately owned Update the register by adding Update the register by adding Update the register by adding Update the register by adding 3/1/14 GIS Specialists, Scientists R200 000 per year for LEDETprotected areas information of 20 privately information of 20 privately information of 20 privately owned information of 20 privately owned transport
owned protected areas owned protected areas protected areas protected areas
Secure funding for expansion projects Secure funding for one expansion Secure funding for one expansion Secure funding for one expansion Secure funding for one expansion 3/1/14 Project Manager, negotiators, R250 000 per year for LEDETproject project project project extension staff, scientists, meetings, transport and
planners accommodation of officials
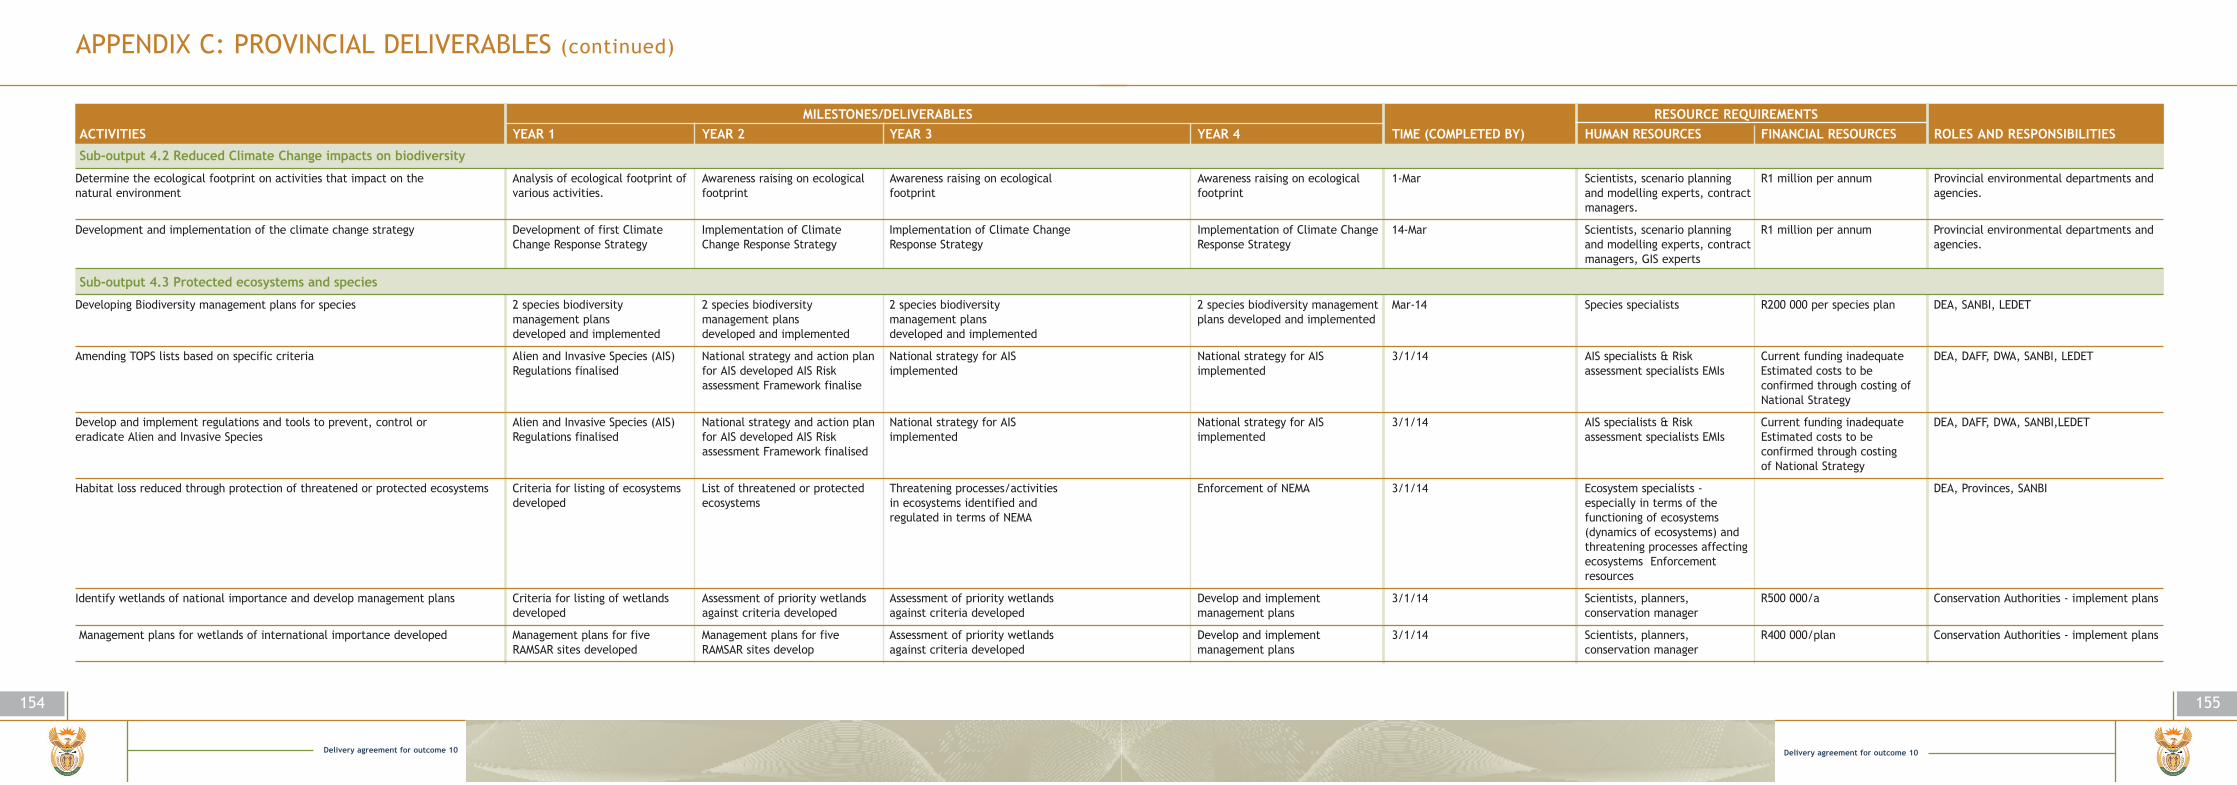
Delivery agreement for outcome 10
155
APPENDIX C: PROVINCIAL DELIVERABLES (continued)
154
Delivery agreement for outcome 10
MILESTONES/DELIVERABLES RESOURCE REQUIREMENTSACTIVITIES YEAR 1 YEAR 2 YEAR 3 YEAR 4 TIME (COMPLETED BY) HUMAN RESOURCES FINANCIAL RESOURCES ROLES AND RESPONSIBILITIES
Sub-output 4.2 Reduced Climate Change impacts on biodiversity
Determine the ecological footprint on activities that impact on the Analysis of ecological footprint of Awareness raising on ecological Awareness raising on ecological Awareness raising on ecological 1-Mar Scientists, scenario planning R1 million per annum Provincial environmental departments andnatural environment various activities. footprint footprint footprint and modelling experts, contract agencies.
managers.
Development and implementation of the climate change strategy Development of first Climate Implementation of Climate Implementation of Climate Change Implementation of Climate Change 14-Mar Scientists, scenario planning R1 million per annum Provincial environmental departments andChange Response Strategy Change Response Strategy Response Strategy Response Strategy and modelling experts, contract agencies.
managers, GIS experts
Sub-output 4.3 Protected ecosystems and species
Developing Biodiversity management plans for species 2 species biodiversity 2 species biodiversity 2 species biodiversity 2 species biodiversity management Mar-14 Species specialists R200 000 per species plan DEA, SANBI, LEDETmanagement plans management plans management plans plans developed and implementeddeveloped and implemented developed and implemented developed and implemented
Amending TOPS lists based on specific criteria Alien and Invasive Species (AIS) National strategy and action plan National strategy for AIS National strategy for AIS 3/1/14 AIS specialists & Risk Current funding inadequate DEA, DAFF, DWA, SANBI, LEDETRegulations finalised for AIS developed AIS Risk implemented implemented assessment specialists EMIs Estimated costs to be
assessment Framework finalise confirmed through costing of National Strategy
Develop and implement regulations and tools to prevent, control or Alien and Invasive Species (AIS) National strategy and action plan National strategy for AIS National strategy for AIS 3/1/14 AIS specialists & Risk Current funding inadequate DEA, DAFF, DWA, SANBI,LEDETeradicate Alien and Invasive Species Regulations finalised for AIS developed AIS Risk implemented implemented assessment specialists EMIs Estimated costs to be
assessment Framework finalised confirmed through costing of National Strategy
Habitat loss reduced through protection of threatened or protected ecosystems Criteria for listing of ecosystems List of threatened or protected Threatening processes/activities Enforcement of NEMA 3/1/14 Ecosystem specialists - DEA, Provinces, SANBIdeveloped ecosystems in ecosystems identified and especially in terms of the
regulated in terms of NEMA functioning of ecosystems (dynamics of ecosystems) and threatening processes affecting ecosystems Enforcement resources
Identify wetlands of national importance and develop management plans Criteria for listing of wetlands Assessment of priority wetlands Assessment of priority wetlands Develop and implement 3/1/14 Scientists, planners, R500 000/a Conservation Authorities - implement plansdeveloped against criteria developed against criteria developed management plans conservation manager
Management plans for wetlands of international importance developed Management plans for five Management plans for five Assessment of priority wetlands Develop and implement 3/1/14 Scientists, planners, R400 000/plan Conservation Authorities - implement plansRAMSAR sites developed RAMSAR sites develop against criteria developed management plans conservation manager
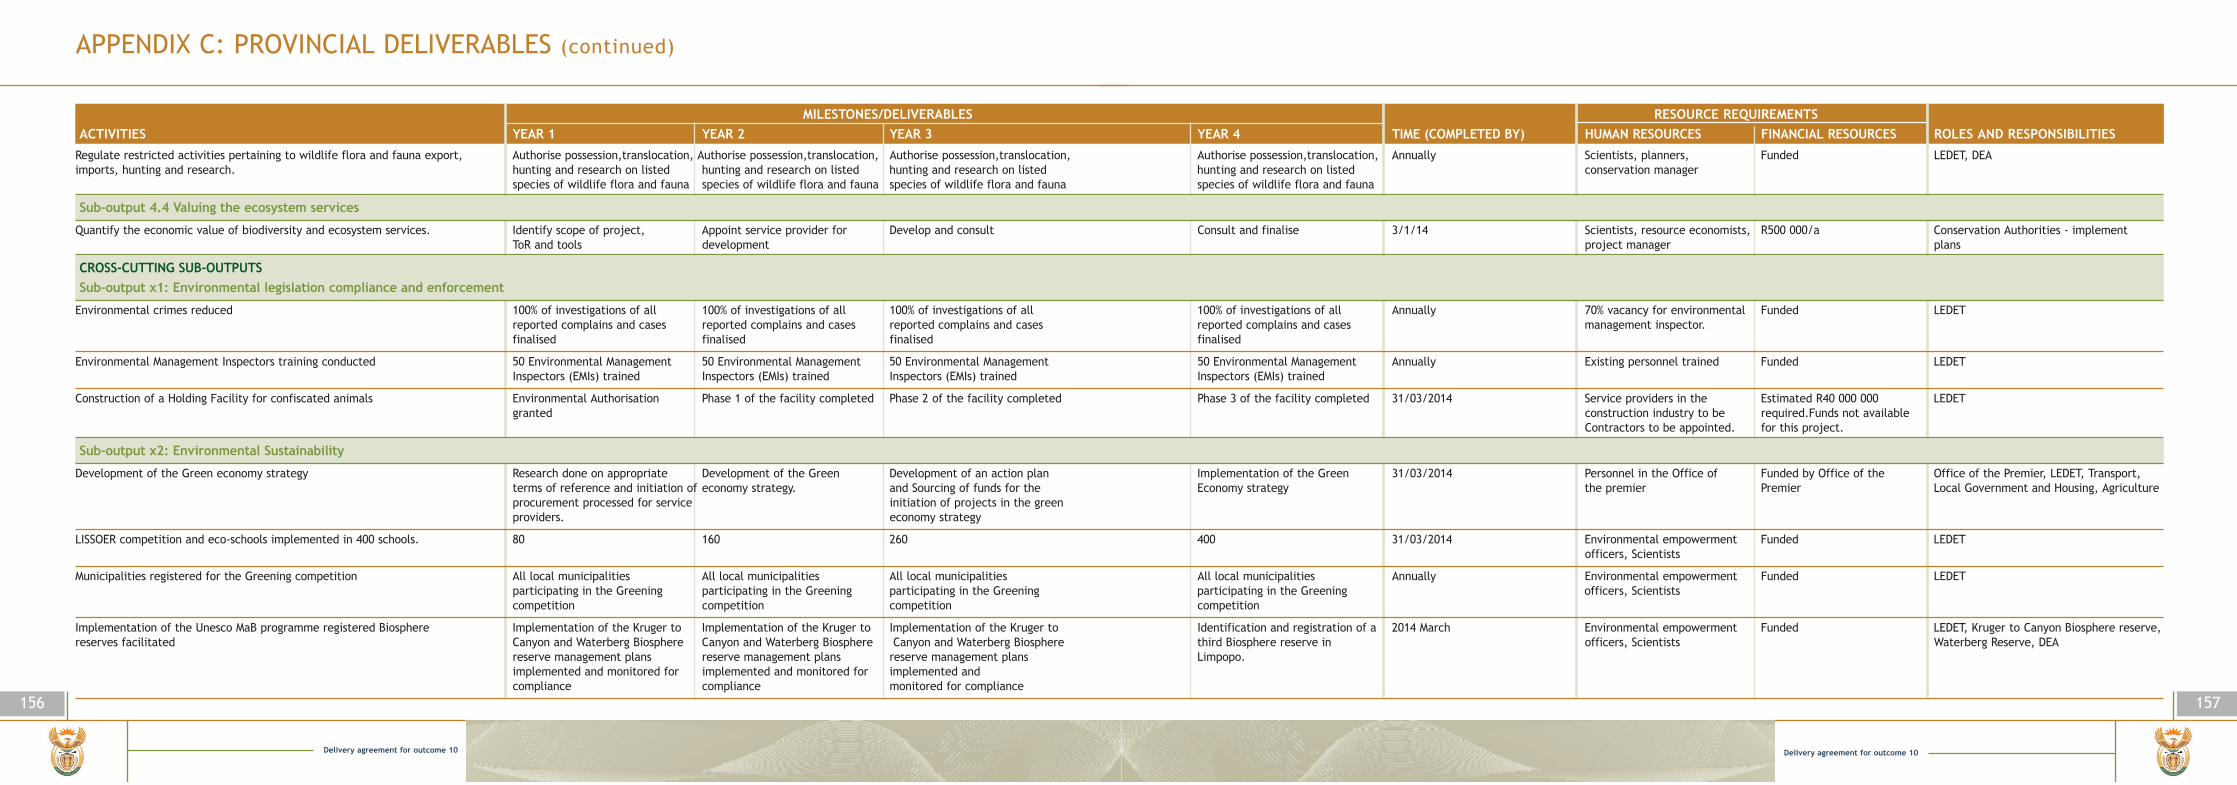
Delivery agreement for outcome 10
157
APPENDIX C: PROVINCIAL DELIVERABLES (continued)
156
Delivery agreement for outcome 10
MILESTONES/DELIVERABLES RESOURCE REQUIREMENTSACTIVITIES YEAR 1 YEAR 2 YEAR 3 YEAR 4 TIME (COMPLETED BY) HUMAN RESOURCES FINANCIAL RESOURCES ROLES AND RESPONSIBILITIES
Regulate restricted activities pertaining to wildlife flora and fauna export, Authorise possession,translocation, Authorise possession,translocation, Authorise possession,translocation, Authorise possession,translocation, Annually Scientists, planners, Funded LEDET, DEAimports, hunting and research. hunting and research on listed hunting and research on listed hunting and research on listed hunting and research on listed conservation manager
species of wildlife flora and fauna species of wildlife flora and fauna species of wildlife flora and fauna species of wildlife flora and fauna
Sub-output 4.4 Valuing the ecosystem services
Quantify the economic value of biodiversity and ecosystem services. Identify scope of project, Appoint service provider for Develop and consult Consult and finalise 3/1/14 Scientists, resource economists, R500 000/a Conservation Authorities - implement ToR and tools development project manager plans
CROSS-CUTTING SUB-OUTPUTSSub-output x1: Environmental legislation compliance and enforcement
Environmental crimes reduced 100% of investigations of all 100% of investigations of all 100% of investigations of all 100% of investigations of all Annually 70% vacancy for environmental Funded LEDETreported complains and cases reported complains and cases reported complains and cases reported complains and cases management inspector.finalised finalised finalised finalised
Environmental Management Inspectors training conducted 50 Environmental Management 50 Environmental Management 50 Environmental Management 50 Environmental Management Annually Existing personnel trained Funded LEDETInspectors (EMIs) trained Inspectors (EMIs) trained Inspectors (EMIs) trained Inspectors (EMIs) trained
Construction of a Holding Facility for confiscated animals Environmental Authorisation Phase 1 of the facility completed Phase 2 of the facility completed Phase 3 of the facility completed 31/03/2014 Service providers in the Estimated R40 000 000 LEDETgranted construction industry to be required.Funds not available
Contractors to be appointed. for this project.
Sub-output x2: Environmental Sustainability
Development of the Green economy strategy Research done on appropriate Development of the Green Development of an action plan Implementation of the Green 31/03/2014 Personnel in the Office of Funded by Office of the Office of the Premier, LEDET, Transport, terms of reference and initiation of economy strategy. and Sourcing of funds for the Economy strategy the premier Premier Local Government and Housing, Agricultureprocurement processed for service initiation of projects in the green providers. economy strategy
LISSOER competition and eco-schools implemented in 400 schools. 80 160 260 400 31/03/2014 Environmental empowerment Funded LEDETofficers, Scientists
Municipalities registered for the Greening competition All local municipalities All local municipalities All local municipalities All local municipalities Annually Environmental empowerment Funded LEDETparticipating in the Greening participating in the Greening participating in the Greening participating in the Greening officers, Scientistscompetition competition competition competition
Implementation of the Unesco MaB programme registered Biosphere Implementation of the Kruger to Implementation of the Kruger to Implementation of the Kruger to Identification and registration of a 2014 March Environmental empowerment Funded LEDET, Kruger to Canyon Biosphere reserve,reserves facilitated Canyon and Waterberg Biosphere Canyon and Waterberg Biosphere Canyon and Waterberg Biosphere third Biosphere reserve in officers, Scientists Waterberg Reserve, DEA
reserve management plans reserve management plans reserve management plans Limpopo.implemented and monitored for implemented and monitored for implemented and compliance compliance monitored for compliance

Delivery agreement for outcome 10
159
APPENDIX C: PROVINCIAL DELIVERABLES (continued)
158
Delivery agreement for outcome 10
MILESTONES/DELIVERABLES RESOURCE REQUIREMENTSACTIVITIES YEAR 1 YEAR 2 YEAR 3 YEAR 4 TIME (COMPLETED BY) HUMAN RESOURCES FINANCIAL RESOURCES ROLES AND RESPONSIBILITIES
Environmental Calender Days implemented 5 Environmental calender days 5 Environmental calender days 5 Environmental calender days 5 Environmental calender days Annually Environmental empowerment Funded LEDET, Kruger to Canyon Biosphere reserve,implemented. implemented. implemented. implemented. officers, Scientists Waterberg Reserve, DEA
OUTCOME 10: PROTECTED AND ENHANCED ENVIRONMENTAL ASSETS AND NATURAL RESOURCES - NORTH WEST DACERDOUTPUT 3: SUSTAINABLE ENVIRONMENTAL MANAGEMENT Sub-output 3.5 Sustainable land use management
EMF/SEA/Other integrated into Municipal SDF and SDF adopted by Minister/MEC Integration of the following EMFs Finalise 4 SDF integration Finalise 4 SDF integration Finalise 4 SDF integration Annually COGTA/DRDLR facilitate integrationin municipal SDFs (Rustenburg, process; municipalities adopt EMFs, Tlokwe, Siyanda, Emakhazeni, Minister/MEC environment adopt SDF asNelson Mandela Bay) development "environmentally informed spatialof SDF guidelines. instrument"
OUTCOME 4: DECENT EMPLOYMENT THROUGH INCLUSIVE ECONOMIC GROWTHOUTPUT:2 : MORE LABOUR ABSORBING GROWTH- SUB-OUTPUT 5: GREEN ECONOMYSub-output X 2 Environmental sustainability
Scaling up expansion and implementation of environmental sector EPWP Kwarriekraal Kwarriekraal Kwarriekraal R 500 000 (30 Jobs) NW DACERD(land care, working for water, working for wetlands, working on fire, working on waste, working on energy, working for fisheries, working for woodlands)
Kaakdoringlaagte Kaakdoringlaagte Kaakdoringlaagte R200 000 (30 Jobs) NW DACERD
Uitlanderskraal Chemical Bush Uitlanderskraal Chemical Bush Uitlanderskraal Chemical Bush R800 000 (11 Jobs) NW DACERDControl Control Control
Tseoge Morafe Range Bush Control Tseoge Morafe Range Bush Control Tseoge Morafe Range Bush Control R1 250 000 (50 Jobs)
Tshidilamolomo-Logageng Weeds Tshidilamolomo-Logageng Weeds Tshidilamolomo-Logageng Weeds R650 000 (61 Jobs)and Alien Invasive Plants Control and Alien Invasive Plants Control and Alien Invasive Plants ControlProject Project Project
Driehoek Landcare Project Driehoek Landcare Project Driehoek Landcare Project R600 000 (20 Jobs) NW DACERD
Barokologadi CPA Barokologadi CPA Barokologadi CPA R1 282 750 (30 Jobs) NW DACERD
Seleke Vegetables Seleke Vegetables Seleke Vegetables R450 000 (20 Jobs) NW DACERD
Bojanala Mechanisation Bojanala Mechanisation Bojanala Mechanisation R500 000 (120 Jobs) NW DACERD
Cokonyane Veld Improvement Cokonyane Veld Improvement Cokonyane Veld Improvement R1 959 048(30 Jobs) NW DACERD
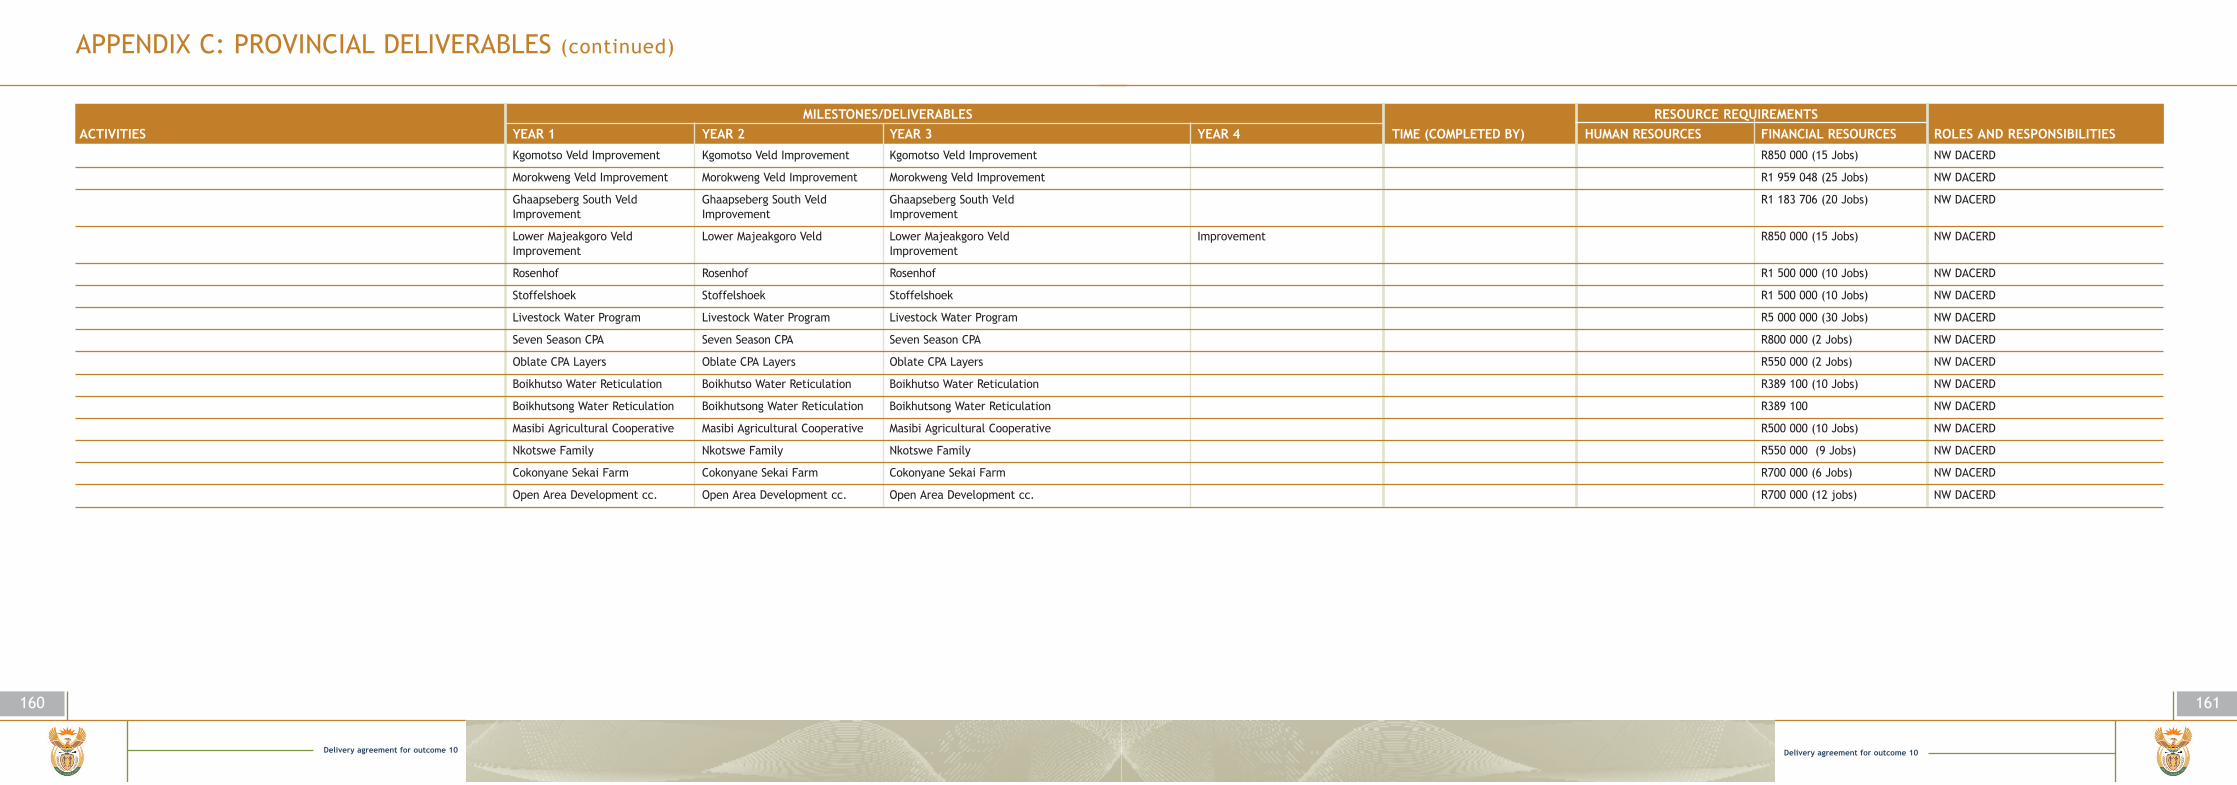
Delivery agreement for outcome 10
161
APPENDIX C: PROVINCIAL DELIVERABLES (continued)
160
Delivery agreement for outcome 10
Kgomotso Veld Improvement Kgomotso Veld Improvement Kgomotso Veld Improvement R850 000 (15 Jobs) NW DACERD
Morokweng Veld Improvement Morokweng Veld Improvement Morokweng Veld Improvement R1 959 048 (25 Jobs) NW DACERD
Ghaapseberg South Veld Ghaapseberg South Veld Ghaapseberg South Veld R1 183 706 (20 Jobs) NW DACERDImprovement Improvement Improvement
Lower Majeakgoro Veld Lower Majeakgoro Veld Lower Majeakgoro Veld Improvement R850 000 (15 Jobs) NW DACERDImprovement Improvement
Rosenhof Rosenhof Rosenhof R1 500 000 (10 Jobs) NW DACERD
Stoffelshoek Stoffelshoek Stoffelshoek R1 500 000 (10 Jobs) NW DACERD
Livestock Water Program Livestock Water Program Livestock Water Program R5 000 000 (30 Jobs) NW DACERD
Seven Season CPA Seven Season CPA Seven Season CPA R800 000 (2 Jobs) NW DACERD
Oblate CPA Layers Oblate CPA Layers Oblate CPA Layers R550 000 (2 Jobs) NW DACERD
Boikhutso Water Reticulation Boikhutso Water Reticulation Boikhutso Water Reticulation R389 100 (10 Jobs) NW DACERD
Boikhutsong Water Reticulation Boikhutsong Water Reticulation Boikhutsong Water Reticulation R389 100 NW DACERD
Masibi Agricultural Cooperative Masibi Agricultural Cooperative Masibi Agricultural Cooperative R500 000 (10 Jobs) NW DACERD
Nkotswe Family Nkotswe Family Nkotswe Family R550 000 (9 Jobs) NW DACERD
Cokonyane Sekai Farm Cokonyane Sekai Farm Cokonyane Sekai Farm R700 000 (6 Jobs) NW DACERD
Open Area Development cc. Open Area Development cc. Open Area Development cc. R700 000 (12 jobs) NW DACERD
MILESTONES/DELIVERABLES RESOURCE REQUIREMENTSACTIVITIES YEAR 1 YEAR 2 YEAR 3 YEAR 4 TIME (COMPLETED BY) HUMAN RESOURCES FINANCIAL RESOURCES ROLES AND RESPONSIBILITIES