Embed Size (px)
Citation preview
Nathaniel Smith, MD, MPH, Director and State Health Officer
Outbreak Response/Epidemiology
Influenza Weekly Report
Arkansas 2017-2018
Week Ending Saturday 01/27/2018
Dirk Haselow, MD, PhD
State Epidemiologist, Medical Director, Outbreak Response
Shirley Louie, MS, CIH
Deputy State Epidemiologist, Director, Center for Public Health Practice
Prepared by:
Haytham Safi, MD, MPH
Influenza Surveillance Coordinator
501-661-2920
Quinyatta Mumford, MPH, CHES
Mike Cima, PhD
Public Health Preparedness Epidemiologists
January 30, 2018
1
During the flu season the Arkansas Department of Health (ADH) produces a Weekly Influenza Report for
clinicians. The report provides information on flu activity in the state. The report also compares influenza like
illness (ILI) in Arkansas to activity in the U.S. ADH receives reports of only a fraction of flu cases. Therefore,
it is important to understand that the information in the weekly update is representative of the timing and
location of activity, but it does not reflect the overall burden of disease. It is presumed that there are many more
people actually affected than the report shows. Clinicians and policy makers may find the report helpful in
terms of communicating to colleagues and patients about the current status of the flu season.
Report Key Points:
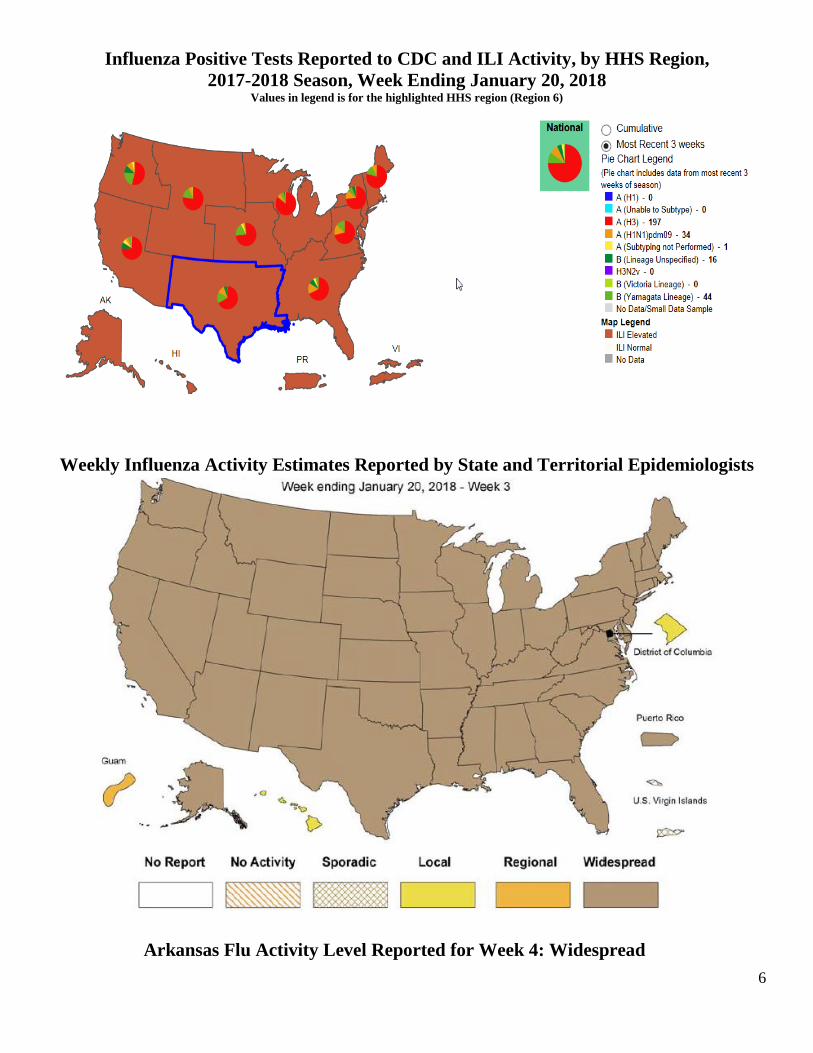
For Week 4, Arkansas reported “Widespread” activity to the Centers for Disease Control and Prevention
(CDC) for geographic spread of influenza, and “High” or 10/10 for ILI intensity.
Since October 1, 2017, over 32,000 positive influenza tests have been reported to the ADH online database
by health care providers. In Week 4, 71 counties reported influenza cases. The majority of reports came
from Benton, Pulaski, Faulkner, Washington, Sebastian, Craighead, Garland, Independence, White,
Randolph, and Saline.
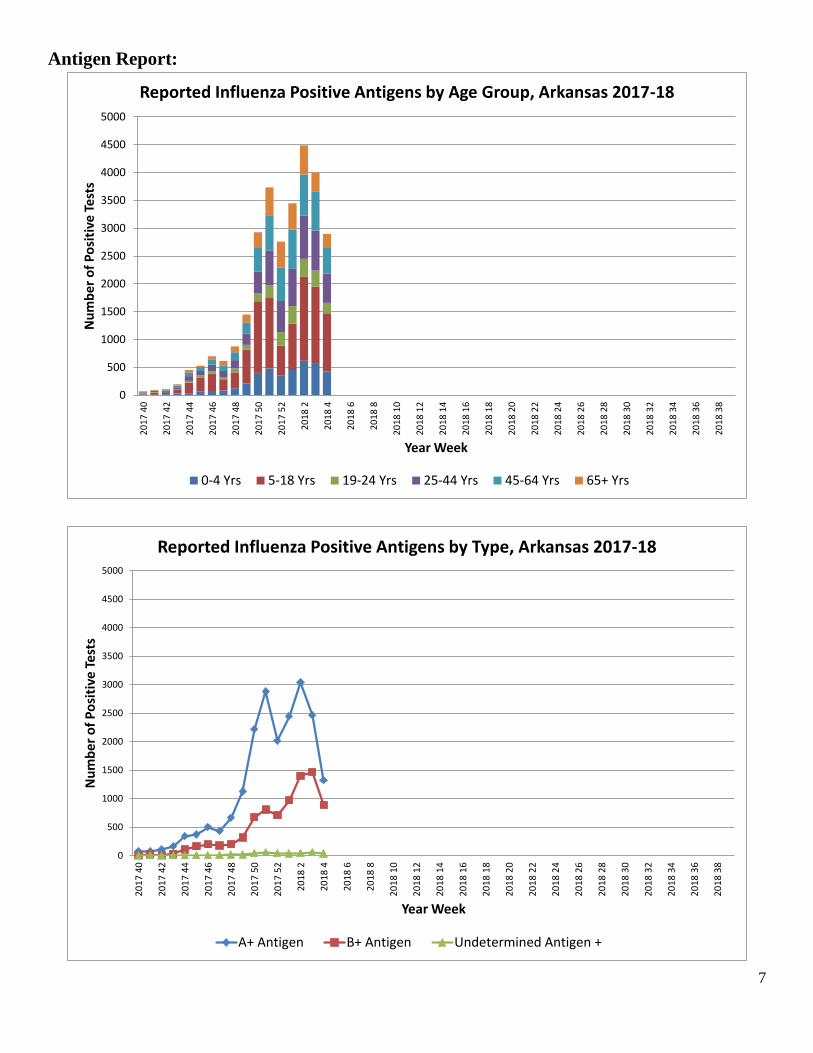
Among flu antigen tests that can distinguish between influenza A and B virus types, 71 percent were
influenza A, and 29 percent were influenza B.
There were 320 positive PCR flu tests last week from private labs: 156 influenza A, and 163 influenza B; 1
positive influenza A subtype H3N2. At the ADH lab, there were 5 positive influenza A subtype H3N2, 1
positive influenza A subtype H1N1, 1 positive influenza B subtype Yamagata; 4 samples tested negative
this week.
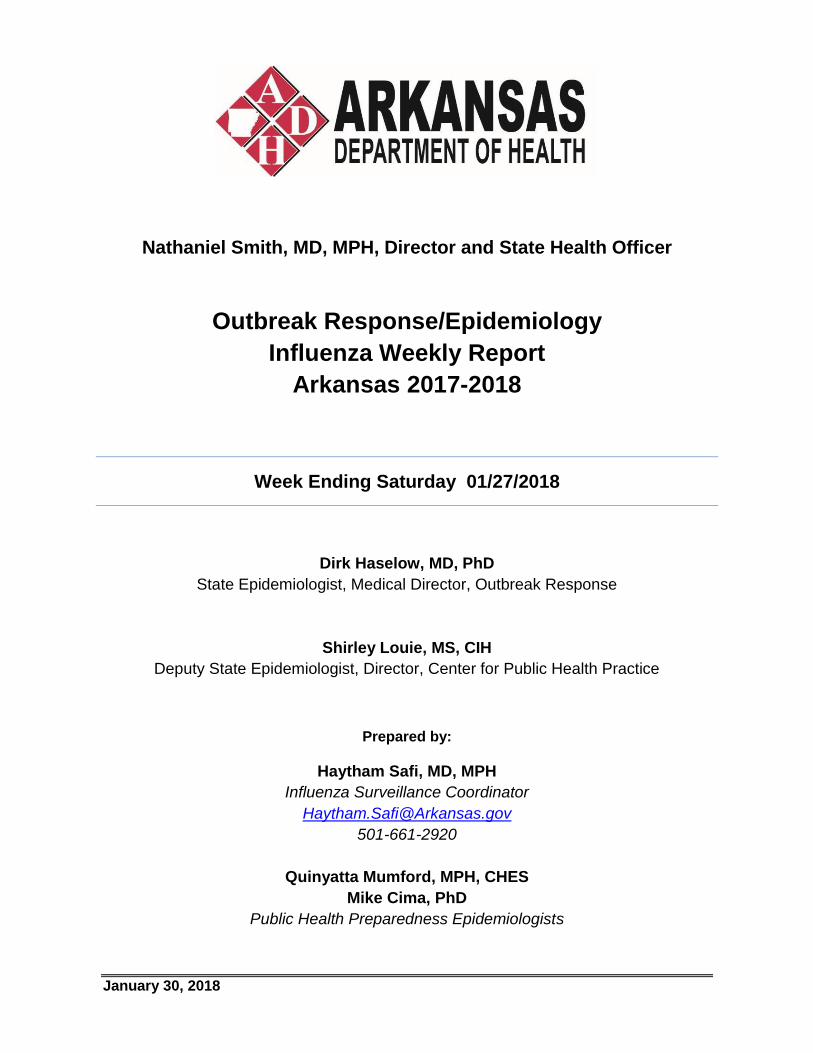
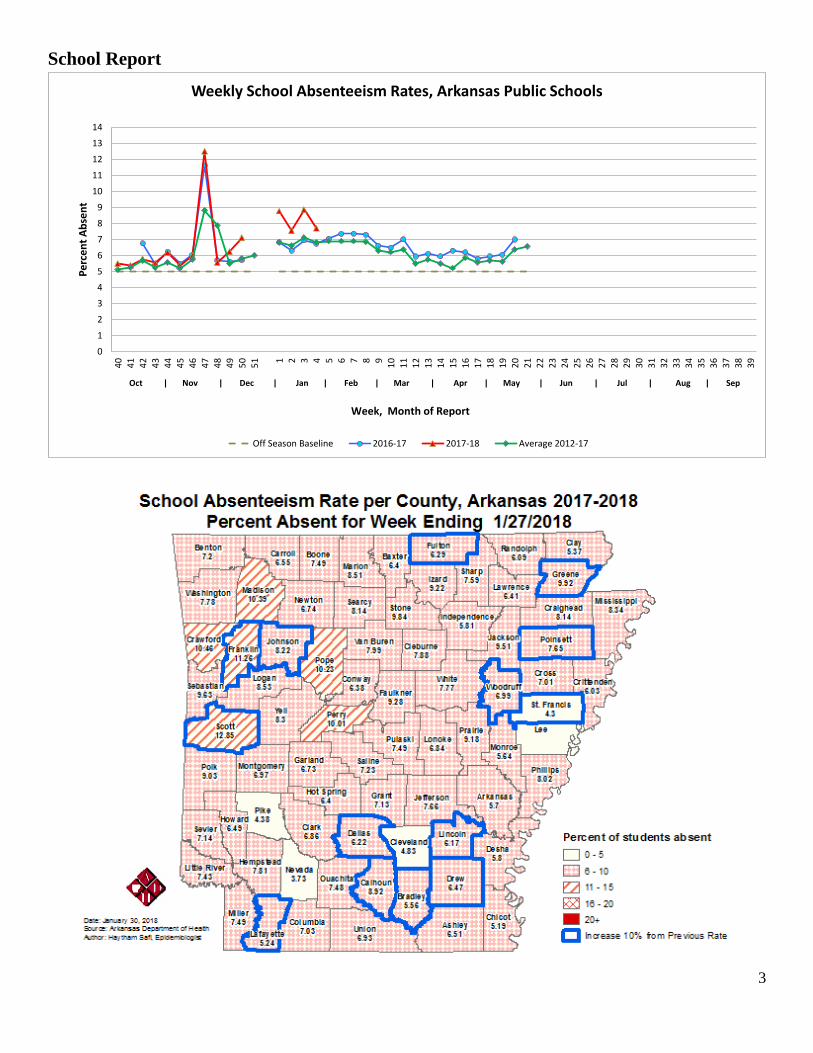
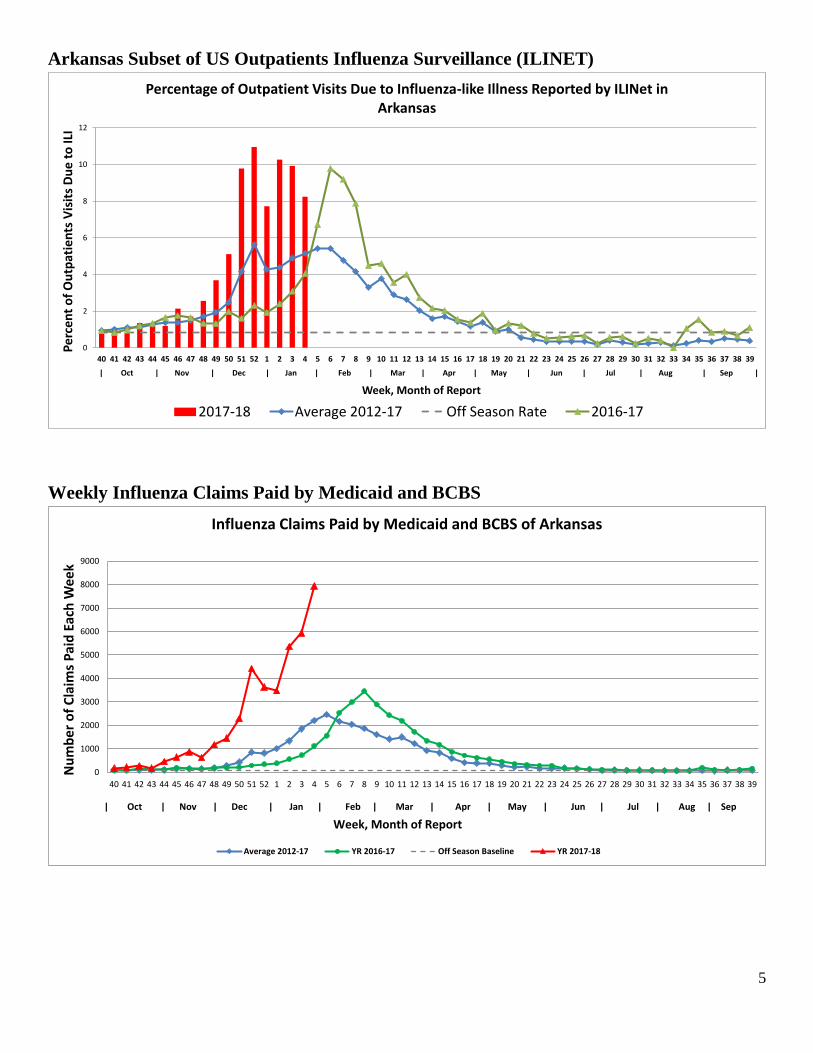
About 7.9 percent of patients visiting emergency rooms last week were there for ILI. About 8.2 percent of
outpatient visits were for ILI.
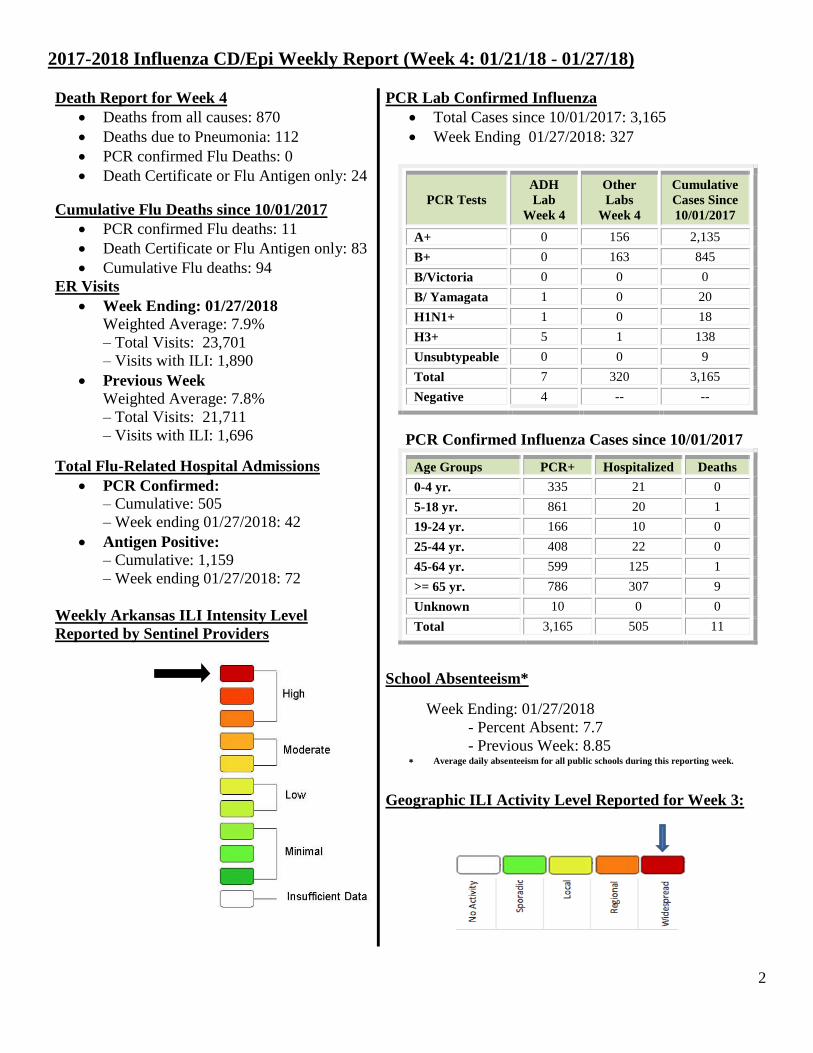
The average school absenteeism rate last week was 7.7 percent among public schools.
To date, 94 influenza-related deaths have been reported in Arkansas this flu season, 92 among adult persons
and 2 pediatric deaths.
Since October 1, 2017, 44 facilities including 34 nursing homes have reported influenza outbreaks.
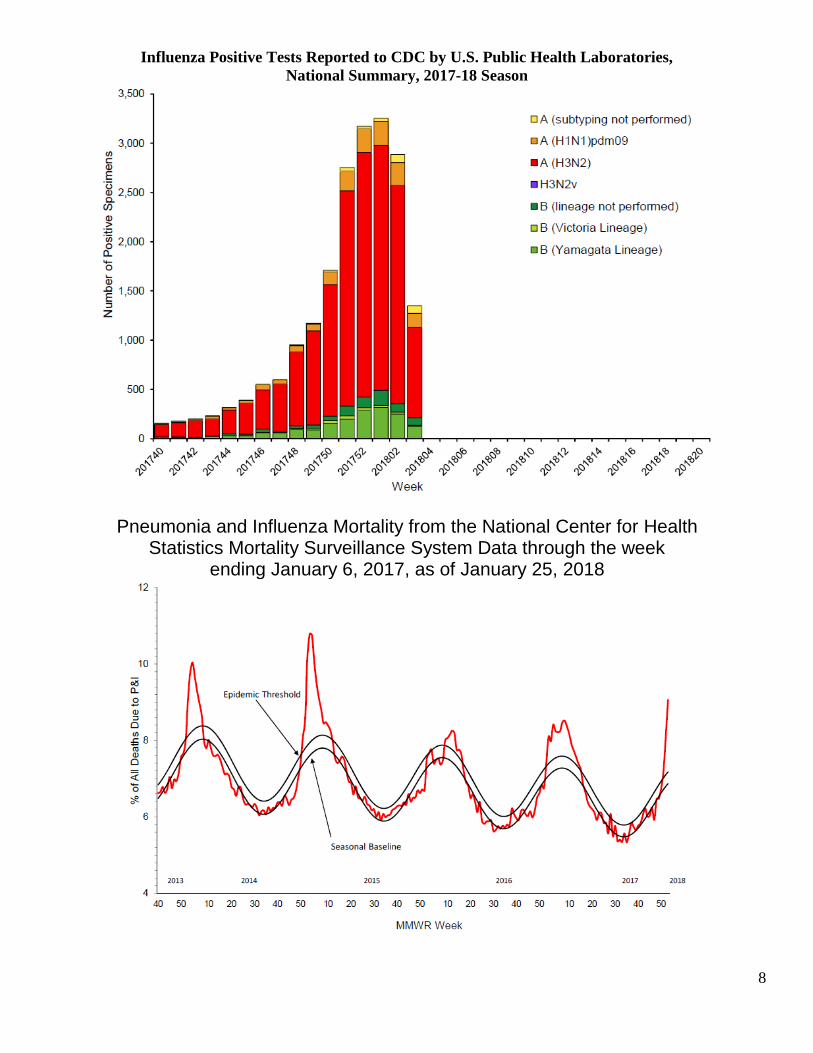
The proportion of deaths reported to the National Center for Health Statistics attributed to pneumonia and
influenza (P&I) was above the system-specific epidemic threshold.
For Week 3, the geographic spread of influenza was reported as widespread in Puerto Rico and 49 states,
Guam reported regional activity, the District of Columbia and 1 state reported local activity, the U.S. Virgin
Islands reported sporadic activities.
You can report flu year-round and view the weekly influenza report during the influenza season at:
http://www.healthy.arkansas.gov/programs-services/topics/influenza.
You can also access the reporting website directly at: https://FluReport.ADH.Arkansas.gov
For Additional National and International Influenza Surveillance Information:
World Health Organization (WHO): http://www.who.int/influenza/gisrs_laboratory/flunet/en/index.html. CDC - Seasonal Influenza (Flu) - Weekly Report: http://www.cdc.gov/flu/weekly/
2
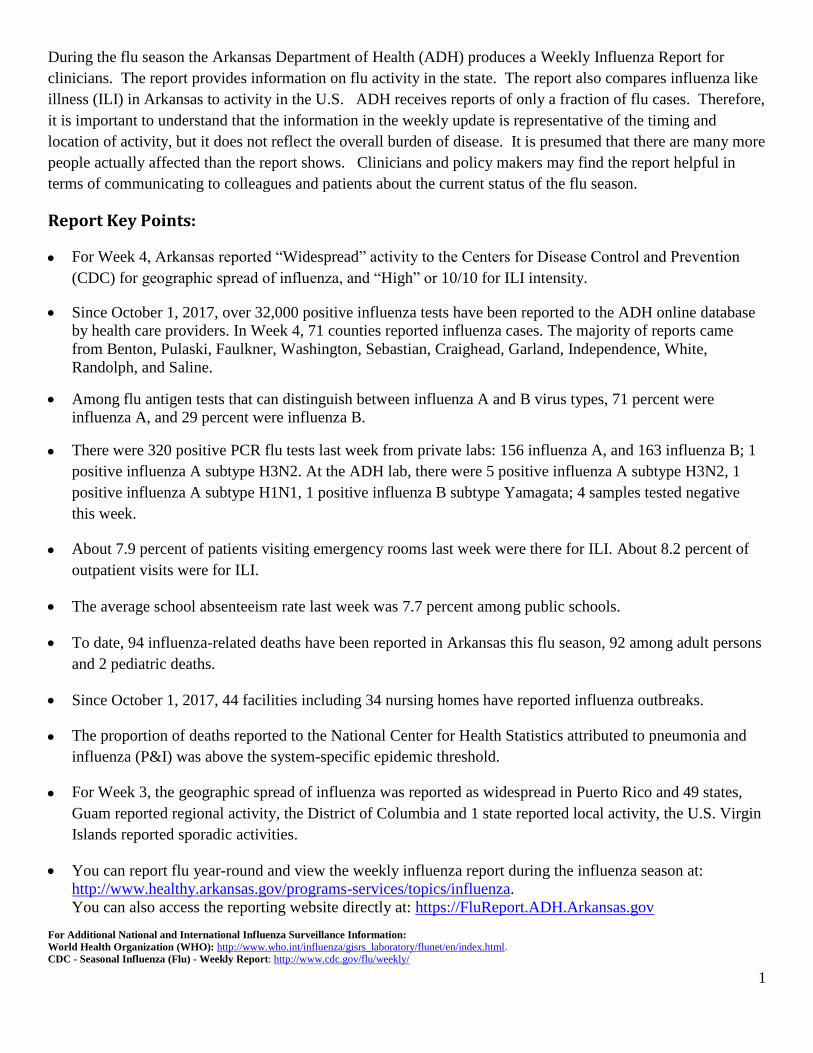
2017-2018 Influenza CD/Epi Weekly Report (Week 4: 01/21/18 - 01/27/18)
Death Report for Week 4
Deaths from all causes: 870
Deaths due to Pneumonia: 112
PCR confirmed Flu Deaths: 0
Death Certificate or Flu Antigen only: 24
Cumulative Flu Deaths since 10/01/2017
PCR confirmed Flu deaths: 11
Death Certificate or Flu Antigen only: 83
Cumulative Flu deaths: 94
ER Visits
Week Ending: 01/27/2018
Weighted Average: 7.9%
– Total Visits: 23,701
– Visits with ILI: 1,890
Previous Week Weighted Average: 7.8%
– Total Visits: 21,711
– Visits with ILI: 1,696
Total Flu-Related Hospital Admissions
PCR Confirmed:
– Cumulative: 505
– Week ending 01/27/2018: 42
Antigen Positive:
– Cumulative: 1,159
– Week ending 01/27/2018: 72
Weekly Arkansas ILI Intensity Level
Reported by Sentinel Providers
PCR Lab Confirmed Influenza
Total Cases since 10/01/2017: 3,165
Week Ending 01/27/2018: 327
PCR Tests
ADH
Lab
Week 4
Other
Labs
Week 4
Cumulative
Cases Since
10/01/2017
A+ 0 156 2,135
B+ 0 163 845
B/Victoria 0 0 0
B/ Yamagata 1 0 20
H1N1+ 1 0 18
H3+ 5 1 138
Unsubtypeable 0 0 9
Total 7 320 3,165
Negative 4 -- --
PCR Confirmed Influenza Cases since 10/01/2017
Age Groups PCR+ Hospitalized Deaths
0-4 yr. 335 21 0
5-18 yr. 861 20 1
19-24 yr. 166 10 0
25-44 yr. 408 22 0
45-64 yr. 599 125 1
>= 65 yr. 786 307 9
Unknown 10 0 0
Total 3,165 505 11
School Absenteeism*
Week Ending: 01/27/2018
- Percent Absent: 7.7
- Previous Week: 8.85
Average daily absenteeism for all public schools during this reporting week.
Geographic ILI Activity Level Reported for Week 3:
3
School Report
0
1
2
3
4
5
6
7
8
9
10
11
12
13
144
04
14
24
34
44
54
64
74
84
95
05
1 1 2 3 4 5 6 7 8 91
01
11
21
31
41
51
61
71
81
92
02
12
22
32
42
52
62
72
82
93
03
13
23
33
43
53
63
73
83
9
Pe
rce
nt
Ab
sen
tWeekly School Absenteeism Rates, Arkansas Public Schools
Off Season Baseline 2016-17 2017-18 Average 2012-17
Oct | Nov | Dec | Jan | Feb | Mar | Apr | May | Jun | Jul | Aug | Sep
Week, Month of Report
4
Hospital Report – Downloaded from ESSENCE (Syndromic Surveillance)
Percent ER Visits with ILI
2 3 11 1 1 2 3 13 1 3 21 1
21 1 2 1 1
7
2
614
3
2 11 14
2 14
1
34
2 1
8
33
15
2
11 12
28
2
30
1011 5
29
2
8
74
42
2588
13
51
79
0
20
40
60
80
100
120
Influenza Mortality by Age Group, Arkansas 2000-2017 (Provisional) Report Updated: 01/27/2018
65+ Yrs
45-64 Yrs
25-44 Yrs
19-24 Yrs
5-18 Yrs
0- 4 Yrs
* All seasons range from week 40 to week 39 except 2009-2010 started week 36Source: ADH Immunization Section, Center for Health Statistics
Nu
mb
er o
f D
eath
s
Flu Season *
5
Arkansas Subset of US Outpatients Influenza Surveillance (ILINET)
Weekly Influenza Claims Paid by Medicaid and BCBS
0
2
4
6
8
10
12
40 41 42 43 44 45 46 47 48 49 50 51 52 1 2 3 4 5 6 7 8 9 10 11 12 13 14 15 16 17 18 19 20 21 22 23 24 25 26 27 28 29 30 31 32 33 34 35 36 37 38 39
Pe
rce
nt
of
Ou
tpat
ien
ts V
isit
s D
ue
to
ILI
Week, Month of Report
Percentage of Outpatient Visits Due to Influenza-like Illness Reported by ILINet in Arkansas
2017-18 Average 2012-17 Off Season Rate 2016-17
| Oct | Nov | Dec | Jan | Feb | Mar | Apr | May | Jun | Jul | Aug | Sep |
0
1000
2000
3000
4000
5000
6000
7000
8000
9000
40 41 42 43 44 45 46 47 48 49 50 51 52 1 2 3 4 5 6 7 8 9 10 11 12 13 14 15 16 17 18 19 20 21 22 23 24 25 26 27 28 29 30 31 32 33 34 35 36 37 38 39
Nu
mb
er
of
Cla
ims
Pai
d E
ach
We
ek
Influenza Claims Paid by Medicaid and BCBS of Arkansas
Average 2012-17 YR 2016-17 Off Season Baseline YR 2017-18
| Oct | Nov | Dec | Jan | Feb | Mar | Apr | May | Jun | Jul | Aug | Sep
Week, Month of Report
6
Influenza Positive Tests Reported to CDC and ILI Activity, by HHS Region,
2017-2018 Season, Week Ending January 20, 2018 Values in legend is for the highlighted HHS region (Region 6)
Weekly Influenza Activity Estimates Reported by State and Territorial Epidemiologists
Arkansas Flu Activity Level Reported for Week 4: Widespread
7
Antigen Report:
0
500
1000
1500
2000
2500
3000
3500
4000
4500
5000
20
17
40
20
17
42
20
17
44
20
17
46
20
17
48
20
17
50
20
17
52
20
18
2
20
18
4
20
18
6
20
18
8
20
18
10
20
18
12
20
18
14
20
18
16
20
18
18
20
18
20
20
18
22
20
18
24
20
18
26
20
18
28
20
18
30
20
18
32
20
18
34
20
18
36
20
18
38
Nu
mb
er
of
Po
siti
ve T
est
s
Year Week
Reported Influenza Positive Antigens by Age Group, Arkansas 2017-18
0-4 Yrs 5-18 Yrs 19-24 Yrs 25-44 Yrs 45-64 Yrs 65+ Yrs
0
500
1000
1500
2000
2500
3000
3500
4000
4500
5000
20
17
40
20
17
42
20
17
44
20
17
46
20
17
48
20
17
50
20
17
52
20
18
2
20
18
4
20
18
6
20
18
8
20
18
10
20
18
12
20
18
14
20
18
16
20
18
18
20
18
20
20
18
22
20
18
24
20
18
26
20
18
28
20
18
30
20
18
32
20
18
34
20
18
36
20
18
38
Nu
mb
er
of
Po
siti
ve T
est
s
Year Week
Reported Influenza Positive Antigens by Type, Arkansas 2017-18
A+ Antigen B+ Antigen Undetermined Antigen +
8
Influenza Positive Tests Reported to CDC by U.S. Public Health Laboratories,
National Summary, 2017-18 Season
Pneumonia and Influenza Mortality from the National Center for Health Statistics Mortality Surveillance System Data through the week
ending January 6, 2017, as of January 25, 2018