Embed Size (px)
Citation preview

This PDF document was made available
from www.rand.org as a public service of
the RAND Corporation.
6Jump down to document
Visit RAND at www.rand.org
Explore RAND-Initiated Research
View document details
This document and trademark(s) contained herein are protected by law as indicated in a notice appearing later in this work. This electronic representation of RAND intellectual property is provided for non-commercial use only. Permission is required from RAND to reproduce, or reuse in another form, any of our research documents.
Limited Electronic Distribution Rights
For More Information
CHILD POLICY
CIVIL JUSTICE
EDUCATION
ENERGY AND ENVIRONMENT
HEALTH AND HEALTH CARE
INTERNATIONAL AFFAIRS
NATIONAL SECURITY
POPULATION AND AGING
PUBLIC SAFETY
SCIENCE AND TECHNOLOGY
SUBSTANCE ABUSE
TERRORISM AND HOMELAND SECURITY
TRANSPORTATION ANDINFRASTRUCTURE
The RAND Corporation is a nonprofit research organization providing objective analysis and effective solutions that address the challenges facing the public and private sectors around the world.
RAND-INITIATED RESEARCH
Purchase this document
Browse Books & Publications
Make a charitable contribution
Support RAND

This product is part of the RAND Corporation monograph series.
RAND monographs present major research findings that address the
challenges facing the public and private sectors. All RAND mono-
graphs undergo rigorous peer review to ensure high standards for
research quality and objectivity.

Approved for public release, distribution unlimited
JOHN HOLLYWOOD, DIANE SNYDER,
KENNETH McKAY, JOHN BOON
Out of the OrdinaryFinding Hidden Threats by Analyzing Unusual Behavior

The RAND Corporation is a nonprofit research organization providingobjective analysis and effective solutions that address the challengesfacing the public and private sectors around the world. RAND’spublications do not necessarily reflect the opinions of its research clientsand sponsors.
R® is a registered trademark.
© Copyright 2004 RAND Corporation
All rights reserved. No part of this book may be reproduced in any formby any electronic or mechanical means (including photocopying,recording, or information storage and retrieval) without permission inwriting from RAND.
Published 2004 by the RAND Corporation1700 Main Street, P.O. Box 2138, Santa Monica, CA 90407-2138
1200 South Hayes Street, Arlington, VA 22202-5050201 North Craig Street, Suite 202, Pittsburgh, PA 15213-1516
RAND URL: http://www.rand.org/To order RAND documents or to obtain additional information, contact
Distribution Services: Telephone: (310) 451-7002; Fax: (310) 451-6915; Email: [email protected]
This research in the public interest was supported by RAND, usingdiscretionary funds made possible by the generosity of RAND's donors,the fees earned on client-funded research, and independent research anddevelopment (IR&D) funds provided by the Department of Defense.
Library of Congress Cataloging-in-Publication Data
Out of the ordinary : finding hidden threats by analyzing unusual behavior / John Hollywood ... [et al.].
p. cm.“MG-126.”Includes bibliographical references.ISBN 0-8330-3520-7 (pbk. : alk. paper)1. Criminal behavior, Prediction of—United States. 2. Crime forecasting—
United States. 3. Criminal methods—United States. 4. Terrorism—Forecasting. 5. Terrorism—Psychological aspects. 6. Intelligence service—United States. 7. National security—United States. I. Hollywood, John S., 1973– II. Rand Corporation.
HV6080.O97 2004363.32—dc22
2003023703
Cover photograph by Kenneth N. McKay. The photograph is of the "Warabe-Jizo" statue in the Yusei-in Garden of the Sanzen-in Temple in Ohara, Japan.The statue is of a child bodhisattva-kshitigarbha. He is a figure from both the
Hindu and Buddhist religions. Derived from the Mother Earth, he appeared inthe world to help people.

iii
Preface
This monograph presents a unique approach to “connecting the dots”in intelligence—selecting and assembling disparate pieces of informa-tion to produce a general understanding of a threat. Modeled afterkey thought processes used by successful and proactive problemsolvers to identify potential threats, the schema described in thisdocument identifies out-of-the-ordinary, atypical behavior that is po-tentially related to terror activity; seeks to understand the behavior byputting it into context; generates and tests hypotheses about what theatypical behavior might mean; and prioritizes the results, focusinganalysts’ attention on the most significant atypical findings. In addi-tion to discussing the schema, this document describes a supportingconceptual architecture that dynamically tailors the analysis in re-sponse to discoveries about the observed behavior and presents spe-cific techniques for identifying and analyzing out-of-the-ordinary in-formation.
We believe the monograph would be of greatest interest to peo-ple in the homeland security community who are interested in con-necting the dots across disparate analysis groups and databases todetect and prevent terror attacks. However, it should also interestanyone who needs to monitor large and disparate data streams look-ing for uncertain and unclear indicators that, taken together, repre-sent potential risks. Thus, we can see the schema and architecturedescribed in this paper having an application in computing security(which involves recognizing indicators of an impending cyber attack)

iv Out of the Ordinary
or in public health (which involves recognizing indicators of an im-pending disease outbreak), for example.
This monograph results from the RAND Corporation’s con-tinuing program of self-sponsored independent research. Support forsuch research is provided, in part, by donors and by the independentresearch and development provisions of RAND’s contracts for theoperation of its U.S. Department of Defense federally funded re-search and development centers. This research was overseen by theRAND National Security Research Division (NSRD). NSRD con-ducts research and analysis for the Office of the Secretary of Defense,the Joint Staff, the Unified Commands, the defense agencies, the De-partment of the Navy, the U.S. intelligence community, allied for-eign governments, and foundations.

v
The RAND Corporation Quality Assurance Process
Peer review is an integral part of all RAND research projects.Prior to publication, this document, as with all documents in theRAND monograph series, was subject to a quality assurance processto ensure that the research meets several standards, including the fol-lowing: The problem is well formulated; the research approach is welldesigned and well executed; the data and assumptions are sound; thefindings are useful and advance knowledge; the implications and rec-ommendations follow logically from the findings and are explainedthoroughly; the documentation is accurate, understandable, cogent,and temperate in tone; the research demonstrates understanding ofrelated previous studies; and the research is relevant, objective, inde-pendent, and balanced. Peer review is conducted by research profes-sionals who were not members of the project team.
RAND routinely reviews and refines its quality assurance proc-ess and also conducts periodic external and internal reviews of thequality of its body of work. For additional details regarding theRAND quality assurance process, visit http://www.rand.org/standards/.


vii
Contents
Preface............................................... iiiThe RAND Corporation Quality Assurance Process................vFigures .............................................. xiTables .............................................. xiiiSummary.............................................xvAcknowledgments..................................... xxviiAcronyms ...........................................xxix
CHAPTER ONE
Introduction ...........................................1Prologue: Something Bad Happened on November 9th .............1The Problem of Connecting the Dots in Intelligence ...............3Cognitive Processes for Connecting the Dots.....................6A Solution for Connecting the Dots—The Atypical Signal Analysis
and Processing Schema ...............................12Key Attributes of ASAP.................................16Near-Term Implementation of ASAP.......................18An Evolutionary Path for ASAP ...........................23Summary of the Schema ................................23
Outline of the Monograph.................................24
CHAPTER TWO
Data Analyzed in the ASAP Schema .........................27Types of Data .........................................27Sources of Data ........................................29

viii Out of the Ordinary
Intelligence Networks ..................................29Information Reported as Out of the Ordinary .................30Information on Critical Industries .........................30Open-Source Information ...............................31Commercial Databases .................................32Partitioning Intelligence and Domestic Investigative Data.........32
CHAPTER THREE
The Atypical Signal Analysis and Processing Architecture ..........35The Scope of an ASAP System..............................35Levels of Analysis in the ASAP Architecture.....................37Major Functional Components Within the Architecture............39
Data Interception, Storage, and Distribution..................39Finding Dots ........................................40
Linking Dots ..........................................43Generating and Testing Hypotheses ..........................44Control of the ASAP Architecture ...........................48
Principles and Structures of Control ........................48Control at the Operations Level ...........................53Control at the Tactical Level .............................57Learning and Adaptation................................58
Roles of Human Analysts and Automated Agents.................62
CHAPTER FOUR
Finding the Dots .......................................65Finding Dots with Rules ..................................65Representing Context ....................................67Dimensions of Context ...................................68
Times, Events, and Behavioral Life Cycles....................68Structures of Tactical Behavior............................69Structures of Strategic and Organizational Behavior .............71Structures of the Status Quo .............................71Structures That Disrupt: Dot Noise and Intentional Denial and
Deception ........................................72High-Dimensionality Detection Agents .......................75

Contents ix
CHAPTER FIVE
Connecting the Dots ....................................77Similarity Connections ...................................77Complementary Connections...............................80
CHAPTER SIX
Understanding the Dots: Generating and Testing Hypotheses.......83Generating Hypotheses ...................................83
A First Pattern-Characterizing Dimension: Indicative andNon-Indicative Patterns ..............................85
A Second Pattern-Characterizing Dimension: Tests on Data,Metadata, and Reports ...............................88
Representation of Patterns...............................92High-Dimensionality Pattern Analysis ......................93
Testing Hypotheses......................................94
CHAPTER SEVEN
Conclusion ...........................................97Summary.............................................97A Research Plan ........................................98Conclusion: Recommendations for Action ....................100
APPENDIX
A. Case Study: “The November 9th Incident” ................103B. Systems Related to the ASAP Architecture..................139
Bibliography .........................................151


xi
Figures
S.1. The Atypical Signal Analysis and Processing (ASAP)Schema .......................................xviii
1.1. How Proactive Problem Solvers Connect the Dots...........91.2. The Atypical Signal Analysis and Processing Schema ........132.1. Watched Entities and Intercepted Information ............283.1. Intercepting Data .................................403.2. Data Sorting, Distribution, and Storage .................413.3. Two Approaches to Detecting Dots ....................433.4. Finding Data Related to Dots ........................453.5. Using Dots to Generate a Hypothesis ...................473.6. Diagram of an End-to-End, Generic ASAP Process .........493.7. Operational Control in the ASAP Schema................533.8. Tactical Control in the ASAP Schema...................584.1. Identification and Initial Processing of the Dots............664.2. Levels of Activity During the Life Cycle of a Terror Attack ....695.1. Finding Relationships Between the Dots.................785.2. An Example Similarity Relationship ....................785.3. An Example Complementary Relationship ...............806.1. Generating and Testing Hypotheses About the Dots ........846.2. An Indicative Pattern and a Corresponding Instance.........866.3. A Non-Indicative Pattern and a Corresponding Instance......876.4. An Instance of Two Agencies Analyzing the Same Data ......906.5. An Instance of an Agency Making Out-of-the-Ordinary
Data Requests ...................................916.6. Validating a Hypothesis.............................96


xiii
Tables
S.1. The ASAP Schema ...............................xxiv1.1. The ASAP Schema ................................243.1. Example Performance Metrics for an ASAP System .........504.1. Contextual Rules Corresponding to Activity Life-Cycle
Phases.........................................70


xv
Summary
The problem of “connecting the dots” in intelligence—selecting andassembling disparate pieces of information to produce a general un-derstanding of a threat—has been given great priority since the Sep-tember 11, 2001, terrorist attacks.1 This monograph summarizes aRAND internal research and development project on developingunique approaches to assist in connecting the dots.
Synthesizing disparate pieces of information to understandthreats is an extremely difficult challenge. The analysis process re-quires searching through enormous volumes of data, and analysts’attention must be directed to the most important findings. There are,however, few direct clues as to which data are important and how tolink the data together. The most obvious approach to prioritizingdata—looking for patterns similar to those of previous attacks—caneasily lead to missing the signals indicating the next, different attack.When analyzing uncertain and messy (i.e., real-world) data, time andsituational pressures often force the analyst into making conclusions,despite great uncertainty as to whether the conclusions are true. Ex- 1 As one example of the high priority placed on this topic, the Congressional Joint Inquiryinto September 11 writes, in its “Conclusion—Factual Findings” section: “No one will everknow what might have happened had more connections been drawn between these disparatepieces of information. We will never definitively know to what extent the Community wouldhave been able and willing to exploit fully all the opportunities that may have emerged. Theimportant point is that the Intelligence Community, for a variety of reasons, did not bringtogether and fully appreciate a range of information that could have greatly enhanced itschances of uncovering and preventing Usama Bin Laden’s plan to attack these United Stateson September 11th, 2001.”
xvi Out of the Ordinary
isting legal, technological, procedural, and cultural barriers to sharingand linking information further complicate these challenges.
A Schema for Connecting the Dots
Historically, however, many people have surmounted the barriers toconnecting the dots, albeit with significantly smaller amounts of datathan the homeland security community faces. These successful prob-lem solvers have tended to follow similar cognitive processes. First,the problem solver establishes expectations for what the environmentwill be like if everything is “normal”—in effect, defining a status quo.This formulation is employed because it is often impossible to predicteverything that is abnormal; instead, it is much easier to describe thestatus quo as the starting point and add to this description what isknown about how the status quo might change. The problem solvernext identifies a set of metrics (both quantitative and qualitative) withwhich to observe the environment, especially in regard to whether theactual environment is consistent with expectations. Third, the prob-lem solver observes streams of measurement data about the environ-ment. Generally, the solver does not examine every observation care-fully but instead scans for out-of-the-ordinary or atypical signals thatsignificantly deviate from the expected status quo. These signals rangefrom defined precursors of a well-understood change in the environ-ment to an entirely novel phenomenon whose meaning is un-known—except that it is in some way relevant to the task at hand.2
All, however, deserve additional analysis: Because they are outside ofexpectations for what the current environment should exhibit, they 2 It is important to reiterate that the problem solver does not try to examine all atypical be-havior in the environment; doing so would lead to data overload. Instead, the solver paysattention to relevant behavior that can quickly be related to the task at hand. For example,suppose the problem solver is responsible for identifying potential threats to a theme park.Clearly, many attendees in the theme park will engage in “unusual” behavior. The problemsolver, however, will be interested strictly in behavior that can quickly be declared potentiallyrelevant to attacks on the theme park, such as a group of guests on a terror watch list, or agroup of guests who engage in behavior that strikes the park’s security guards as threatening(casing behavior, clandestine communications, etc.).

Summary xvii
may signal an impending change in the environment. Upon discov-ering out-of-the-ordinary behavior, the solver looks for supportingdata marking the observed signals as a true phenomenon and not justnoise. Should such supporting data be discovered, the problem solversearches for related information that helps explain the phenomenonand then develops and tests hypotheses as to what the phenomenonmeans. Finally, once the phenomenon is understood, and identifiedas indicating a risk, the problem solver uses heuristics to avoid ormitigate the risk. It should be noted that the process the problemsolver uses is not linear—the solver separates the noise from the trulysignificant through an iterative, multistage process of testing andlearning, with the steps used being dependent on what the solverlearns about the phenomenon at each stage (i.e., context-dependentanalysis).
We have developed the Atypical Signal Analysis and Processing(ASAP) schema to assist in connecting the dots by mirroring theproblem-solving process described above. An implementation of theschema will serve as an analyst’s “virtual extension,” applying theproblem-solving process to the volumes of data and numbers of di-mensions within the data that are far too large for analysts to workwith directly. Figure S.1 shows the schema.
The shortest, linear path through the schema has six major steps.The schema begins with the gathering of information from a set ofexternal databases. Most of the information pertains to watched enti-ties—people, places, things, and financial activities already suspectedas being relevant to a terror attack or activities within key infrastruc-ture and commercial processes already being monitored, such as in-ternational commerce, nuclear energy, hazardous materials, and airtransportation. Intelligence and government databases would be used,supplemented by open-source data, all in accordance with privacyregulations. This baseline information would be further supple-mented by precedent-setting phenomena—data, voluntarily submitted,that describes behavior the reporters find to be highly out of the or-dinary and suspicious with respect to asymmetric threats. (For ex-

xviii Out of the Ordinary
Figure S.1The Atypical Signal Analysis and Processing (ASAP) Schema
Externalnetworks
ASAPnetwork
Tactical networkcontrol
Informationpool gets
data, sends filter changes
Respond to findings and requests(direct tasks and changes to analysis parameters)
Analystsreview
Information pool sends data,receives initial and follow-up queries
Processor sends instructions, receives test results
Feedback (to all parts of network)
Processor sendsprioritized
results, receivesanalysts‘requests
Analysisresults
andanalysts‘requestsObservational data
Analysis histories
Informationpool
$
Gatherinformation
Process results
Find dots(unusual
data/datasets)
Link dotsand data
Generateand test
hypotheses
Informationon watched
entities
RANDMG126-S.1
ample, prior to the 9/11 attacks, FBI officials might have sub-mitted their suspicions about certain flight school students.) Theschema incorporates both direct observations of the watched entitiesand metadata on who is working with those observations and why.The resulting information goes into a structured information pool.
Second, within the pool, a number of automated detectionagents perpetually filter the information to look for out-of-the-ordinary signals.3 These signals might be single observations (e.g., a 3 Note that an ASAP network would not detect and process all atypical signals; instead, itwould process atypical signals that can be quickly classified as being potentially relevant to anattack or the operations of a terrorist organization. For the former, a network would seekatypical signals potentially related to attack preparations such as target casing, training, clan-destine communications, supply (smuggling), and weapons acquisition. For example, from atheme park, the network would be interested in hearing reports of people videotaping secu-

Summary xix
very large financial transfer) or a significant trend (e.g., a 75 percentincrease in fund transfers during the past month). The signals mightalso be a group studying information they do not normally review(e.g., an FBI field office requesting records of students at truck driv-ing schools funded by the aforementioned increase in funding trans-fers). Such signals become the “dots.” Note that ASAP will supportdetection filters ranging in sophistication from simple rules evaluatinga few data fields (usually generated by human analysts) to compli-cated algorithms evaluating tens of simultaneous data fields simulta-neously (usually generated by hybrid human-machine statisticaltraining techniques, such as neural networks).
Third, once the dots have been identified, the next step is tofind information related to the dots. The schema thus employs auto-mated relationship agents to look for relationships between new andexisting dots. It also uses agents to perform backsweeping—searchingfor previously unremarkable data that relate to the dots. These relateddata would come primarily from the information pool but also fromqueries in external (intelligence) databases and, in cases constitutingprobable cause, from commercial databases (for example, examiningthe credit transactions of a positively identified terror suspect).4 Theinformation discovered helps determine the extent of an out-of-the-ordinary phenomenon and provides a context to help explain it.
Fourth, once the dots have been linked, hypothesis agents canbe tasked to create possible interpretations for the linked dots and tocreate corresponding testing plans to determine whether the hypothe-ses are correct. The principal purpose of these agents is to assesswhich phenomena should be given priority for further investigation. rity checkpoints and support beams of major attractions; it would not be interested in hear-ing reports on generic disorderly conduct. For the latter, a network would seek atypical sig-nals such as sudden movements, changes in organizational structure, or changes in commu-nications networks. The issue of what constitutes “out of the ordinary” is discussed at lengthin Chapter Two.4 Backsweeping in probable-cause cases is the only time the ASAP schema would use generalcommercial databases. Thus, for example, the schema complies with the proposed Citizens’Protection in Federal Databases Act, which would prohibit accessing databases “based solelyon a hypothetical scenario or hypothetical supposition of who may commit a crime or pose athreat to national security.”

xx Out of the Ordinary
Consequently, the “hypotheses” very often do not pertain to a specificinference but instead simply note that a phenomenon is so unusual(and perhaps has particularly suspicious characteristics) that it isworth investigating further. Correspondingly, the testing agentsmonitor whether further investigations raise or lower concern aboutthe phenomenon.
Fifth, the results of these processes are strictly prioritized, andhigh-priority results are forwarded to analysts. This prioritizationfunction is one of the most important of the schema, as it reducespotentially large volumes of out-of-the ordinary discoveries, so thatanalysts can restrict their attention to only the most relevant and sig-nificant discoveries.
Finally, the schema facilitates the collaboration of analystsworking on related observations. It notifies different analysts thatthey are looking at the same pieces of information and providescommunications channels between them. In the ASAP schema, ana-lysts have primary responsibility for actions to be taken in response tounusual phenomena that are brought to their attention because theyhave insights (knowledge of human behavior, for instance) thatautomated systems do not have.
As with human problem solvers, the schema permits iterative,dynamically tailored analysis in which the actual sequences of testingactivities are dependent on what has been learned to date about theobserved phenomena. To allow for such context-dependent process-ing, the complete schema is governed by a two-stage control system.At the lower, operational level, processor agents direct data throughthe schema. These agents use sets of control rules to interpret the re-sults from the detection, relationship, and hypothesis agents, and de-termine what to do next with a particular dataset (or test results onthe dataset). Thus, for example, a processor agent might direct anewly detected dot to a relationship agent and forward results fromhypothesis testing to analysts. This structure allows for flows throughASAP to be both dynamic and iterative. Thus, analysis results guidewhat happens next, so that, for example, analyzing one initial signalleads to the discovery of related phenomena, which are then furtheranalyzed, leading to yet more contextual information, and so on, po-

Summary xxi
tentially allowing an initially mysterious phenomenon to be illumi-nated fully. Processor agents are guided both by automated logic anddirections from analysts. Analysts have the ability to request any typeof follow-up test or analysis of the ASAP agents, with the processoragents executing these requests.
At the second, tactical level, the ASAP is subject to open-loopcontrol: Analysts may change any of the software agents and agents’parameters, or make any specific analysis requests, in response to theanalysis results. The tactical level also supports automated controlagents that modify software agents and parameters based on interpre-tation of finding, relating, and testing dots (these software controlagents are also subject to analysts’ direction).
We have developed an architectural design that applies theschema; description of the design makes up the bulk of this paper.The design has several key attributes worth mentioning here.
First, in its initial stages the architecture focuses on informationalready suspected of being of interest, as opposed to performing un-guided data mining of large databases and collecting data about ge-neric transactions. This focus helps prevent analytic overload. At thesame time, the architecture has the flexibility both to receive reportsof highly atypical behavior from all sources and to cull databases forparticular pieces of information should the need arise (for example,searching for data about a highly suspicious person’s travel plans).
Second, the architecture searches primarily for signals that areout of the ordinary as opposed to signals that fit predetermined pat-terns. This approach loses precision in meaning but gains in beingable to detect a wide range of threatening behavior that does not fitpreviously seen attack patterns. Searching for signals deviating from,rather than matching, existing patterns is uncommon in the pattern-matching and signal analysis fields.
Third, in finding dots, searching for related information, andgenerating hypotheses, the architecture employs contextual rules thatallow data to be analyzed in the context of existing knowledge. Con-textual rules are not commonly used in information analysis.
Fourth, the architecture explicitly deals with uncertainty by gen-erating and testing competing hypotheses for unusual signals. This

xxii Out of the Ordinary
approach helps defend against prematurely accepting an explanationfor a phenomenon.
Finally, the architecture enables the collaboration of personnelneeded to connect the dots, even if the personnel are distributedacross different groups and agencies. The architecture looks not justfor out-of-the-ordinary data, but for out-of-the-ordinary analyses of thedata. Flagging these analyses can bring together groups of people andautomated agents who can jointly characterize a previously mysteri-ous phenomenon.
Near-Term Implementation
Fully implementing the ASAP schema and its supporting architecturewould be a lengthy, multiyear process. However, several improve-ments could be implemented quickly, in effect allowing personalanalysis interactions to partially substitute for the automated agentsdescribed previously.
A major requirement for detecting out-of-the-ordinary phenom-ena is to understand what constitutes “ordinary” and what types ofbehaviors are significant deviations away from the ordinary that maybe relevant to a counterterrorism investigation. Thus, we recommendthat appropriate users throughout the homeland security (HLS)community create and distribute standardized profiles of organizedbehavior. These profiles would discuss both what threats (terror at-tacks, terror support activities, etc.) commonly look like and whatstatus-quo conditions look like in such “watched” fields as interna-tional commerce, transportation, and demolition. Note that thesebrief profiles are in no way intended to be comprehensive; their pur-pose is merely to help analysts and field professionals in one area edu-cate analysts and field professionals in other areas—in a more inten-tional and systematic way than at present—on what types of behaviorto look out for.
The next step would be to establish electronic posting boardswhere those in the field can report unusual phenomena and seewhether others have been observing similar or related occur-

Summary xxiii
rences—in effect, helping each other serve as detection and linkingagents. Personnel would post to unmoderated electronic bulletinboards, and there would be no approval process for phenomenaposted. Trained reviewers would routinely review the boards, select-ing especially unusual and significant reports to post to filtered boardsthat would be widely read by analysts.
The third step would be to develop semiautomated tools to helpHLS personnel identify posts relevant to what they have been ob-serving. One might first implement organizational tools that dividethe posts into threads dedicated to particular occurrences and createindices of those threads. Particularly important threads would be as-sociated with journals or diaries summarizing key developments andcurrent hypotheses. The next step would to be create Google-likesearch engines for posts that match the results of search queries. Fi-nally, simple heuristics could be developed that look for connectionsand patterns across the threads of posted messages.
Summarizing the Schema
Table S.1 summarizes differences between the proposed schema andtraditional methods of intelligence analysis. The table also compares anear-term, manual implementation of ASAP with a full implementa-tion.
A Research Plan
At the same time as the short-term improvements are being imple-mented, research can begin on the automated portions of the ASAParchitecture. This portion will be needed to assist analysts in identi-fying out-of-the-ordinary signals in the enormous volume of datagenerated by intelligence and infrastructure collection and monitor-ing systems every day.

xxiv Out of the Ordinary
Table S.1The ASAP Schema
Traditional Analysis ASAP AdvantagesASAP Near-TermImplementation
Full ASAP SystemImplementation
Focuses on previouspatterns
Searches for out-of-the-ordinarybehavior, allowingfor detection ofpreviously unseenthreats
Core or pilotgroup
New communitiesadded to elec-tronic boards
Time pressure drivestoward prematureclosure
Allows memory ofhypotheses anddata rejected byanalysts
Drafting shortprofiles of exist-ing asymmetricthreats—e.g.,suicide bombing
Incorporates en-tire homelandsecuritycommunity
Analysts mostlyoperate on basis ofown experience andbiases
Leaves keyanalytic choiceswith analysts
Drafting shortprofiles of statusquo in suchwatched domainsas internationalcommerce
Detailed architec-ture for out-of-the-ordinaryanalysis
Search tools mostlyweed out whatdoesn’t fit pattern
Notices whatanalysts arewatching andasking
Users post onunmoderatedelectronic boards
Formal specifica-tions for detec-tion, linking, andhypothesis agents
Analysts are isolatedwithin own groupsand agencies
Facilitates collabo-ration betweenanalysts studyingthe samephenomena
Moderators con-nect across ana-lysts and, whenpossible,organizations
Analysis processesintegrated acrossorganizations
The first stage of research should develop a detailed architecturalplan for the ASAP system and its constituent control and analysisagents. The architecture would specifically describe detection, link-ing, and hypothesis agents in such key areas as direct threat detection,international shipping, and air transportation. The first stage shouldalso describe how the architecture would address a detailed terror-attack scenario.

Summary xxv
The second stage of research should create formal design specifi-cations for the agents and the software making up the ASAP back-bone. These specifications would define the objects, methods, andmajor algorithms employed by the agents and systems managementsoftware.
The third stage of research should create a prototype system thatwould include simple examples of the above agents. It would also in-clude the control components needed to achieve dynamic, feedback-based control. Once the prototype is completed and evaluated, con-struction and implementation of a real-world ASAP system couldcommence, moving the ASAP concept from research to reality.


xxvii
Acknowledgments
First and foremost, we thank the RAND Independent Research andDevelopment group for generously funding and supporting this re-search. The group includes James Thomson, Michael Rich, BrentBradley, Rachel Swanger, and C. Richard Neu. We also thank JeffIsaacson and Kevin O’Connell for their support of this project onbehalf of the National Security Research Division. We especially wantto thank Kevin O’Connell for his personal support of this project, aswell as for his very useful insights on ways to improve the research. Inaddition, we thank Greg Treverton, Robert Anderson, and WilliamMularie for their reviews of this monograph and for their useful rec-ommendations. We also thank RAND colleagues John Parachini,Paul Davis, Martin Libicki, and Shari Pfleeger for meeting with usand providing the research group with important insights.

xxix
Acronyms
AHEAD Analogical Hypothesis Elaborator for Activity
Detection
ARDA Advanced Research and Development Activity
ARG alternate reality game
ASAP Atypical Signal Analysis and Processing
CIA Central Intelligence Agency
CT counterterrorism
CTC Counter Terrorism Center (Central Intelligence
Agency)
DARPA Defense Advanced Research Projects Agency
DEA Drug Enforcement Agency
DEFT Data Extraction From Text
DI Directorate of Intelligence (Central Intelligence
Agency)
DHS Department of Homeland Security
DO Directorate of Operations (Central Intelligence
Agency)
EWR early warning and response
FBI Federal Bureau of Investigation
GISI Gateway Information Sharing Initiative
HAZMAT hazardous materials

xxx Out of the Ordinary
HLS homeland security
IC intelligence community
INS Immigration and Naturalization Service
INR Intelligence and Research (U.S. State Department)
NIMD Novel Intelligence from Massive Data
NORA Non-Obvious Relationship Awareness
NSA National Security Agency
SEAS Structured Evidential Argumentation System
SIAM Situational Influence Assessment Model
SIGINT signals intelligence
TIA Terrorism Information Awareness
XML extensible markup language
1
CHAPTER ONE
Introduction
“I think anything out of the ordinary routine of life well worthreporting.”
Sherlock Holmes, in Sir Arthur Conan Doyle’sThe Hound of the Baskervilles
Prologue: Something Bad Happened on November 9th
(A hypothetical but unfortunately realistic case study)
In conducting a post-mortem of the sad events of November 9th, it isimportant to consider the events and timelines leading up to the inci-dent. By mid-November, the media were clamoring for details onwho knew what, what was known when, how the “obvious” signalscould have been missed, and how the “dots” could have failed to havebeen “connected” . . . again. By the middle of December, investiga-tive reporters and official government investigators had disclosed thatthe following observations had existed in various government data-bases (federal and local) since the middle of October:
February 4• Two dozen tuna boats are ordered in Seattle for export to Singa-
pore under Panamanian ownership.

2 Out of the Ordinary
June 13• A city permit is issued for an Arab student forum to be held in
Hong Kong in mid-November.August 9
• Two dozen new tuna boats eventually arrive and register in Syd-ney’s harbor.
September 8• A Panamanian-registered company makes an application for
eighteen berths for tuna boats in Singapore.October 2
• At a reception at the British Embassy in Singapore, an Austra-lian diplomat reports hiring and work oddities in Sydney harborinvolving new tuna boats being repainted.
October 4• In Singapore, a new firm registered in Panama is reported as
trying to pressure local officials to approve special berthingprivileges on very short notice without the proper paperwork.
October 6–7• Over a hundred Arab students from ten countries book travel
for November 10 to Hong Kong through Singapore.October 10
• A wharf in Philadelphia is leased to a Panamanian firm.October 11
• A routine inspection at a wharf in Philadelphia identifies whatappear to be tuna boats off-loading heavy crates.
October 12• Two Arab students are detained for having false driver licenses
in Singapore.• Abandoned luggage is found at the Singapore airport and a re-
port is filed.
As the investigation continued, a few points became clear. Thefirst was that although some of the above data points (the “dots”)were clearly suspicious in retrospect, it would have been virtually im-possible to pick them out of the huge volume of noise inherent inmodern intelligence processing and analysis, even with standard fil-

Introduction 3
tering techniques. Similarly, although the connections between thedots were also obvious in retrospect, the intelligence community andhomeland security agencies simply were not designed to support thediscovery of such links or to perform the follow-on analysis needed todetermine what the connected dots might mean. New strategies wereclearly needed. . . .
(Appendix A presents the complete case study of the “November 9thaffair.”)
The Problem of Connecting the Dots in Intelligence
Too small. Too few. Too sparse. Too irregular. Too contextual. Thesecharacteristics of data about the “bad guys” are today’s challenges.Predicting how adversaries will act is easy to do in hindsight but hardto do in advance. If their behavior is regular, or if the challenge isbounded, analyses that identify systematic behavior can be and havebeen successful. However, with the current and growing asymmetricthreats, new tools are needed to exploit characteristics that are toosmall, too few, too sparse, too irregular, and too contextual.
Traditional approaches have assumed larger, more observable,less agile, and less creative adversaries. The new adversaries are far lesstangible and more elusive. The challenge is compounded by a grow-ing data glut, increasing noise in the environment and decreasingtime available to perform analysis. To complicate matters, we cannotassume that the adversary will attack the same way twice. Projectssuch as the Novel Intelligence from Massive Data (NIMD) program1
propose innovative ways to deal with some of these challenges andhave significant potential to help find entirely new and meaningfulrelationships in large-scale data sources. However, a key aspect notaddressed by the projects of which the authors are aware is how ana-lysts initially identify points of interest that do not meet narrowly de- 1 NIMD is sponsored by the Advanced Research and Development Activity (ARDA). Formore information, see http://www.ic-arda.org/Novel_Intelligence/.
4 Out of the Ordinary
fined criteria—in other words, the dots. The closest analogy to thiskey part of the process is that of astute problem solvers who, like thefictional Sherlock Holmes, track certain characteristics to recognizeout-of-the-ordinary situations that can yield clues about events andactivities. Something was supposed to be there but was not. Somethingwas there but it wasn’t supposed to be. The activities are unusual—oursuspects are acting differently. These out-of-the-ordinary observationsyield insights into what may happen in the future.
Another key aspect not commonly addressed is how to connectthe dots—to identify the context of the out-of-the-ordinary data andto generate and test hypotheses related to what the connected dotsmight mean. In the past, when the amount of available intelligenceinformation was comparatively limited, analysts could keep track of acomplete picture of a situation. For example, R. V. Jones (1978) ex-plicitly notes how having one analyst accessing the complete informa-tion stream and seeing the big picture was critical for many WorldWar II intelligence successes. However, in World War II, compara-tively all-seeing analysts were possible since data gathering was largelymanual and limited by scarce resources. The challenge today is muchgreater, given both the volumes of intelligence information availableand the numerous technical, organizational, and policy barriers tosynthesizing information from multiple sources.
The intelligence community (IC) today draws on a disparate,heterogeneous assortment of collection and analysis systems, many ofwhich were designed without any intention that their inputs andoutputs would ever be used in an integrated, cooperative fashion.Since the mid-1980s, the IC has focused on developing numerousanalysis support systems, knowing that it will need to draw on data inevery imaginable form. However, we are not even to the point ofhaving all necessary data in electronic form. Historically, both techni-cal and nontechnical barriers—such as organizational policies, cul-tures, and security—have limited the usefulness of analytic supporttools. Nonetheless, recent progress in integrating collection andautomated analysis systems and in organizational collaborationthrough task forces, interagency centers, and ad-hoc working groups
Introduction 5
has increased the prospect for dramatic improvements in data analy-sis.
To date, most analytical support tools have leveraged what thetools’ designers thought the technology could provide, coupled withtheir perceptions of analysts’ needs. Sadly, some systems were de-signed and delivered without close consultation with the end-user.Another consistent problem is that collection and analytical systemshave been designed and applied using conventional mindsets and ap-proaches. Research in how analysts do their work has repeatedlyshown that analysts become prisoners of their own experience, biases,and cognitive limitations (Heuer, 1999). Many analysts designedtheir strategy by looking for patterns related to “fighting the last war,”and the IC went on building software systems to accommodate ana-lysts doing just that. Other systems were designed to lighten the loadon the analyst, to shovel away 90 percent of the low-grade rock so theremaining 10 percent had the highest likelihood of containing therich ore that the analyst could profitably mine—but the “ore” wasdefined as information consistent with established patterns. Similarly,those who collected data were led to look specifically for the dataanalysts believed would fill the missing piece of an established or pre-dicted pattern. Thinking “outside the box” is not a natural behaviorfor intelligence analysts—or for the human brain. Nonetheless, asJones and others note, certain analysts have been very successful atdoing just that.
In this monograph, we describe a concept for an analysis toolthat is based on how the most-effective human analysts think “out-side the box” to detect threats—a tool that models how those expertswatch for and track the out-of-the-ordinary situations that yield criti-cal insights into an intelligence problem. The analysts’ experience andcognitive skills, combined with their intuition, allow them to gener-ate expectations about what they are watching. However, the currenthuman threat detection process suffers from an immense data load,disparate information flows, and time pressures. The proposed toolwill complement existing projects, such as NIMD, that augment thehuman analytic process. Using contextual models created by expertanalysts (including machine “analysts”), which describe both “nor-

6 Out of the Ordinary
mal” and “significantly atypical” expectations for what is watched andtracked, the tool can detect and track unusual and out-of-the-ordinary situations as they develop.
We propose a multitiered analysis and filtering system to assistanalysts: It would monitor what is watched over time, how they arewatched, and the results of the watching. What might start out as un-usual and mildly out of the ordinary may change in perspective asother out-of-the-ordinary observations are clustered and analyzed forinterdependencies of such factors as time, geography, and finances.The results can focus, guide, and concentrate specific and detailedinformation searches and analyses that use other analytical tools avail-able or under development.
When the proposed detector is coupled with tools for processingstructures and correlating data and activities, an integrated preemp-tive analysis system results. The Atypical Signal Analysis and Proc-essing (ASAP) system addresses the asymmetric threat from all in-formation fronts—what is out there, what is developing and gainingmomentum, and what other players are involved. We believe thatASAP would be an important tool for warning the United States ofdeveloping and impending asymmetric threats.
Cognitive Processes for Connecting the Dots
McKay has carried out an extended research agenda over the past 15years on problem solvers in dynamic situations.2 This research hasyielded insights into how humans proactively identify potential risksand their likely consequences; its results are the inspiration for theASAP system.
McKay shows that proactive problem solvers monitor popula-tions and key data streams, pick up the extraordinary signals thatcould indicate a potential risk, and then initiate additional informa-tion analyses as needed to illuminate the risk. Note that “could indi- 2 Described, for example, in McKay and Wiers (2003); McKay, Safayeni, and Buzacott(1995a); McKay (1992); and McKay, Buzacott, Charness, and Safayeni (1992).

Introduction 7
cate a potential risk” is an important distinction; the problem solverdoes not analyze all instances of atypical behavior but only thoseobservations that can quickly be declared “potentially relevant” to aparticular risk. Heuristics are then used to reduce or avoid the antici-pated problem. The study subjects watched both people and proc-esses and used intuitive models of the watched to pick out behaviorsand characteristics that were odd, unusual, or threatening. Theirmental models were based on expected behaviors—actions and activi-ties. Behaviors were watched over time and changes were tracked.Sudden changes, a series of changes, frequent changes, a high magni-tude of change, and changes that fit into potentially threatening con-texts all warranted raised eyebrows. If the situation was sufficientlydifferent from what it had been in the past, it was examined moreclosely. If the situation was assessed to be potentially important, theimmediate or short-term past was backswept to detect initially ignoredsignals that might be relevant to the situation. The analysts were alsoaware of clustering; if they made an increasing number of odd or in-teresting observations, their level of alertness and analysis rose signifi-cantly. The analysts would also look to see what was related to theunusual events, what the correlation was, and whether events wereconverging. Expert problem solvers, who have the job of foreseeingfuture difficulties and discounting them, go through this process con-tinually—often without conscious effort. To them, it is second natureto recognize the dots and connect them. The initial trigger is usually achange in the status quo.
Studied in isolation, a single or minor change might not benoteworthy, but when placed in context of what has happened in thepast and what else might be happening simultaneously, the changesuddenly becomes important. Experts have been observed exhibitingthis type of behavior in a routine and subconscious fashion. For ex-ample, consider an observation from McKay’s six-month study of oneindividual. The planner in a large factory being studied had an idea ofnormal email traffic between two of the factory’s organizations thathe was watching. Over two weeks, the amount of email traffic slowlyincreased. When it had increased to a level beyond what was consid-ered normal, the planner noted that the status quo had changed and

8 Out of the Ordinary
that certain events might happen in the future. He anticipated that ameeting would take place on a specific date and involve certain indi-viduals, notably including factory managers. As a result, he specifi-cally planned critical manufacturing events to take place before andafter the anticipated meeting—when the managers would be availablefor supervision and support. Figure 1.1 summarizes this example.
The planner was right in his prediction of the meeting. Further,during the research study, the planner detected over 75 percent of themajor perturbations to the factory and made appropriate corrections60 to 80 percent of the time—an impressive score.
As another example, intelligence analysts have been observed tohave an expectation about how certain materiel assets will be config-ured and deployed. A movement of the assets to a different re-gion—out of the normal area of operation—could indicate thatsomething unusual is going on. The movements of German radargroups were monitored in this way during World War II when intel-ligence was being sought for the test site of the V-2 rocket (describedin Jones, 1978). The email traffic and materiel examples are the typesof early warning indicators that lead to proactive intervention. Theseexamples are not particularly unusual and have been observed in anumber of cognitive studies of problem solvers. They have also beencommented upon by such experts as R. V. Jones and Allen Dulles intheir descriptions of the cat-and-mouse activities in scientific and op-erational intelligence during World War II (Jones, 1978; Dulles,1963).
The key is to watch, to have expectations about what is beingwatched, to identify out-of-the-ordinary happenings, and to be ableto correlate them with other interesting observations. Those findingsare then used to guide further analyses or actions. For example, con-sider unusual cash transactions combined with unusual travel patternsof members of an extremist party during a period just prior to theanniversary of a suicide bombing. They might not mean anything,but they are worth a second look.
It is important to note that the problem-solving processes de-scribed above are much less linear than they appear at first glance. A

Introduction 9
Figure 1.1How Proactive Problem Solvers Connect the Dots
RANDMG126-1.1
SOURCE: Ethnographic research by K. N. McKay.
Plant managers’email traffic
No
rmal
Plant managers’email traffic
No
rmal
1. Observe behavior, looking for status quo deviations
2. Big deviations (number or magnitude) are most significant
3. Search for related trends, info that helps explain deviations
4. Employ risk avoidance and mitigation heuristics
Fact: Email surge managers expected togo to a day-long meeting
Fact: Quality goesdown when managers are not supervising machines
Response: Don’t make any importantcomponents whilethe meeting is going on
problem solver will go through multiple iterations of finding out-of-the-ordinary phenomena, attempting to link them with other infor-mation, and generating and testing hypotheses about meaning, witheach step based on what the problem solver has learned to date. Wecall the ability to perform multiple steps in a nonlinear order, withthe next determined by what has been learned to date along withother environmental factors, context-dependent analysis.
So far, we have examined models and concepts of how skilled,individual analysts watch, collect dots, and subsequently connectthem. The models and concepts appear to be commonsense and ob-vious at one level, but how they actually work and function togetheris really rather sophisticated. They involve multiple levels of detec-tion, models of status-quo behavior, backsweeping (searching for pre-viously unnoticed data), and connecting possibly related facts. The
10 Out of the Ordinary
aggregate model is complicated but works fine when the problem issuitable for an individual to handle. It is possible to train certain peo-ple to develop models of the status quo, pick out the unusual as timeproceeds, and bring any unexpected changes to the attention of oth-ers. In one study (McKay, Buzacott, and Safayeni, 1995b), a junioranalyst was trained to recognize the normal from the abnor-mal—making routine decisions about the normal and seeking helpfor the remainder. The junior analyst was reportedly able to deal with80 percent of the decisions in this way. This was a conscious strategyon the part of the senior analyst and allowed him to concentrate onthe unusual and nonroutine. Clearly, this type of proactive thinkingand problem resolution is a mindset and a cognitive skill shared bygood puzzle solvers, game players, planners, and schedulers. For ex-ample, good factory planners analyze the situation, identify and con-nect the key dots, and plan accordingly to minimize the risks of notmeeting production quotas or causing quality problems. They antici-pate where slack resources should be intelligently placed and plan forneeded contingencies.
In small and constrained situations, a human analyst can keeptrack of watched entities and their associated condition. He can havea sufficiently full picture of those entities’ present condition. He canremember their past condition and predict their expected behaviorswhen necessary. In the field research conducted in the past decade,the problem solving that used proactive detection successfully wasnarrow, focused, and funneled through a single analyst.
Unfortunately, the single human analyst model does not workfor today’s intelligence problem. It worked well in World War II’slimited collection environment, as noted earlier, and it often workswell in factory management. It does not work when the informationstream is large, distributed through different agencies or individuals,or when the intelligence problem is so complex that no single personcan possibly understand all its nuances.
The challenge is to create assistance tools to help large-scale in-telligence processes function like a single brain or entity. The totalsystem needs to be able to detect the unusual and connect the dots asthe first order of business just as an expert analyst does. Does it make

Introduction 11
sense to consider an automated or hybrid detection aid for the intelli-gence process? That depends. If one is not watching, not collecting,and not speculating about what people are doing, the answer is no.One needs information in the stream, models of expected behavior,and models of relationships on which to apply the aid. However, itdoes make sense if one is watching and has some knowledge aboutthe status quo or normal behaviors of the watched. We believe thelatter is the case—the information about the status quo is “outthere”—waiting to be gathered.
The enemy, too, is out there—leaving information traces thatdescribe his behavior. In general, people need shelter, sustenance,transportation, communication, material items, and currency. Whenviewed in context, these behaviors can yield critical information.Note that we are not saying that everyone in society is worthy of suchsurveillance and monitoring. This would be impossible to do andwould likely yield few new insights. Rather, perceived and potentialenemies are already being monitored and watched. Further, enemieswho are not being watched frequently engage in highly atypical be-havior as part of their attack preparations; these behaviors stand outfrom the status-quo noise, leading to those enemies being watched aswell. This is the population of interest. We are not talking about de-tailed or specific data elements and their values. We are talking aboutmeta-patterns, types of data, types of activities, and general behaviors.People, objects, activities, and processes have naturally occurring lifecycles that can be exploited. Although it may make sense to mine thedata for any statistical relationship between details, the power of de-duction and detection resides at the higher level. For example, it doesnot matter what type of military vehicle is seen in a demilitarizedzone—any military vehicle would be odd. In a more recent example(the “Beltway Sniper” shootings), it did not matter if a white cubevan with ladder racks was detected across distributed road blocks setup in response to nearby shootings; it did matter if any vehicle wasdetected at multiple road blocks close to the scenes of the crimes.
The intelligence community collects a great deal of data onwatched entities and observes and documents many behaviors. Someof the behaviors are routine, but some may indicate a change in op-

12 Out of the Ordinary
erational status or the initiation of a threat. How do we detect thethreatening behavior, isolate it from the glut of information, andbring it to the attention of intelligence analysts in a timely fashion?How do we pick out the clues and make sense of them in large-scalesystems? These questions are the crux of the problem of connectingthe dots.
A Solution for Connecting the Dots—The Atypical SignalAnalysis and Processing Schema
The challenge, therefore, is to employ the expert problem solvers’thought processes in an environment that has too much informationand too many dimensions to employ the problem solvers directly. Weused the proactive problem solvers’ thought processes (discussedabove) to create the Atypical Signal Analysis and Processing (ASAP)schema.
Figure 1.2 presents the schema. The shortest, linear paththrough the schema has six major steps. The schema begins with thecollection and storage of information on watched entities; these enti-ties are already the subjects of government monitoring or have createdsignals unusual enough to be detected and submitted for furtheranalysis. As with the factory scheduler and the World War II analysts,the schema examines only certain key information streams. In therealm of asymmetric threat detection, these streams would include thefollowing:
• Intelligence streams on entities likely related to terror organiza-tions or showing some indication of being anomalous and worthfurther study.
• Regulation-enforcement streams on entities involved with suchcritical systems as international shipping (customs), hazardous

Introduction 13
Figure 1.2The Atypical Signal Analysis and Processing Schema
Externalnetworks
ASAPnetwork
Tactical networkcontrol
Informationpool gets
data, sends filter changes
Respond to findings and requests(direct tasks and changes to analysis parameters)
Analystsreview
Information pool sends data,receives initial and follow-up queries
Processor sends instructions, receives test results
Feedback (to all parts of network)
Processor sendsprioritized
results, receivesanalysts‘requests
Analysisresults
andanalysts‘requestsObservational data
Analysis histories
Informationpool
$
Gatherinformation
Process results
Find dots(unusual
data/datasets)
Link dotsand data
Generateand test
hypotheses
Informationon watched
entities
RANDMG126-1.2
materials production and transportation, and air transportation.The schema would receive data that either meets some criterionfor being anomalous or that meets a specific request for informa-tion about particular people or entities; most regulation-enforcement data would not enter an ASAP system
• Voluntary submissions from law-enforcement and security offi-cers, reporting observations they consider to be potentiallyworth further investigation. Again, the schema would not re-ceive routine law-enforcement or corporate security informationexcept in response to specific, authorized, information requests.3
3 Later in this chapter, we discuss near-term recommendations on gaining ASAP-like bene-fits, including how to work with law enforcement and security officers to collect neededinformation for ASAP systems.

14 Out of the Ordinary
The ASAP schema is intended to improve analysis of the datathe government already collects; it is not seen as a precursor to majorcollection increases.4 To help determine what data should be col-lected, the schema provides a set of interceptor agents that test data inexternal networks and gather suitable information into an informa-tion pool.
Second, from the pool, a series of automated detection agentsfilters the data, looking for pieces of information sufficiently unusualto be worth further study—the dots. The dots may be detected eitherbecause they match some special criteria related to known unusualactivities or because they violate criteria related to normal activities.The latter—the detection of truly out-of-the-ordinary informa-tion—is of particular interest. This primary detection process is simi-lar to what humans do when they discover information worthy ofgreater attention (such as when the factory scheduler noticed thesurge in email). The ASAP schema can flexibly support detection fil-ters ranging in sophistication from simple rules evaluating a few datafields (usually generated by human analysts) to complicated algo-rithms evaluating tens of simultaneous data fields simultaneously(usually generated by hybrid human-machine statistical trainingtechniques, such as neural networks).
Once the dots have been identified, the third step is to find in-formation related to them. The schema thus employs agents to lookfor relationships between new and existing dots. It also uses agents toperform backsweeping—searching for previously unremarkable datathat relate to the dots. These related data would come primarily fromthe information pool but also from queries in external (intelligence)databases and, in cases constituting probable cause, from commercialdatabases (examining the credit transactions of a positively identified 4 This focus on improving analysis of existing data distinguishes the ASAP schema fromother major threat detection proposals, notably DARPA’s Terrorism Information Awarenessprogram, which envisions the data mining of massive public databases for terrorism-relatedpatterns (see DARPA’s Terrorism Information Awareness web page, http://www.darpa.mil/iao/TIASystems.htm, accessed April 2003).

Introduction 15
terror suspect, for instance).5 The information discovered helps de-termine the extent of an out-of-the-ordinary phenomenon and pro-vides a context to help explain it.
Once the dots have been linked, the fourth step is to task hy-pothesis and testing agents to create possible interpretations for thelinked dots and to create testing plans to determine whether the hy-potheses are correct. The principal purpose of the hypothesis andtesting agents is to assess which phenomena should be given priorityfor further investigation. Consequently, the hypotheses often do notpertain to a specific inference but instead note simply that a phe-nomenon is so unusual (and perhaps has some characteristics noted asbeing particularly suspicious) that it is worth investigating further.Correspondingly, the testing agents monitor whether the further in-vestigations raise or lower concern about the phenomena.
Fifth, the results of finding dots, linking them, and generatingand testing hypotheses are prioritized, with the most significant re-sults being forwarded to analysts. Prioritization analysis, one of themost important functions of the schema, restricts analysts’ attentionto the most atypical and significant findings.
Finally, ASAP facilitates the collaboration of analysts workingon related observations. It notifies different analysts looking at thesame pieces of information and provides communications channelsbetween them. In the ASAP schema, analysts have the primary re-sponsibility for taking actions in response to unusual phenomena thatare drawn to their attention, because they have insights (knowledge ofhuman behavior, for instance) that automated systems do not have.
As with human problem solvers, the schema permits iterative,dynamically tailored analysis, in which the actual sequences of activi-ties depend on what has been learned to date about the observedphenomena. To allow for such context-dependent processing, thecomplete schema is governed by a two-stage control system. At the 5 Backsweeping in probable-cause cases is the only time the ASAP schema would use generalcommercial databases. Thus, for example, the schema complies with the proposed Citizens’Protection in Federal Databases Act, which would prohibit accessing databases “based solelyon a hypothetical scenario or hypothetical supposition of who may commit a crime or pose athreat to national security.”
16 Out of the Ordinary
lower, operational level, processor agents direct data through theschema. These agents use sets of control rules to interpret the resultsfrom the detection, relationship, and hypothesis agents and determinewhat to do next with a particular dataset (or test results on thedataset). For example, a processor agent might direct a newly detecteddot to a relationship agent and forward results from hypothesis test-ing to analysts. This structure allows for flows through ASAP to beboth dynamic and iterative. Thus, analysis results guide what happensnext. For example, analyzing an initial signal may lead to the discov-ery of related phenomena, which are then further analyzed, leading toyet more contextual information, and so on—potentially allowing aninitially mysterious phenomenon to be illuminated fully.
The schema also allows analysts to request any tests or analysesof the ASAP network. The processor agents execute the analysts’ re-quests.
At the second, tactical level, ASAP is subject to open-loop con-trol; analysts may change any of the agents and agents’ parameters, ormake specific analysis requests, in response to the analysis results. Thetactical level also supports automated control agents that modifyagents and parameters based on interpreting the results of finding,relating, and testing dots (these control agents are also subject toanalysts’ control).
Key Attributes of ASAP
We have developed an architectural design that applies the schema;the description of the design comprises the bulk of this paper. Thedesign has several key attributes that set it apart from other computersystems being developed to connect the dots within asymmetric-threat related information. (Appendix B discusses these other systemsin detail and how they might complement the ASAP schema or im-plement some of the schema’s components.)
First, the architecture focuses in its initial stages on informationalready suspected of being of interest, rather than performing un-guided data mining of large databases to collect data about generictransactions. This helps prevent analytic overload. This focus on up-stream analysis sets ASAP apart from programs like the Defense Ad-

Introduction 17
vanced Research Projects Agency’s (DARPA’s) Terrorist InformationAwareness (TIA) program, which is intended to operate on very largevolumes of generic information (see DARPA Information AwarenessOffice, 2003c), as well as other intelligence community systems forthe initial filtering and processing of very large data streams. We envi-sion an ASAP system’s databases containing millions of entities andtens of millions of links, as opposed to the much higher entity andlink counts for these other programs. At the same time, the architec-ture does have the flexibility both to receive reports of highly atypicalbehavior from all sources and to cull databases for particular pieces ofinformation should the need arise (for example, searching for dataabout a highly suspicious person’s travel plans).
Second, the architecture searches primarily for out-of-the-ordinary signals as opposed to signals fitting predetermined patterns.This makes ASAP fundamentally complementary to programs likeTIA’s Evidence Extraction and Link Discovery (EELD) program (seeDARPA Information Awareness Office, 2003a), the In-Q-Tel-sponsored Non-Obvious Relationship Awareness (NORA) program(see Systems Research and Development, 2002), and other programsdescribed in Appendix B, which focus on matching data to patternsthat signify specific illicit activities. ASAP’s approach loses precisionin meaning but gains in being able to detect a wide range of threat-ening behavior that does not fit previously seen attack patterns.Searching for signals deviating from, rather than matching, existingpatterns is uncommon in the pattern matching and signal analysisfields.
Third, in finding dots, searching for related information, andgenerating hypotheses, the architecture employs rules that allow datato be analyzed in the context of existing knowledge. Use of context tomodify analysis procedures is another area not commonly found ininformation analysis.
Fourth, the architecture explicitly deals with uncertainty by gen-erating and testing competing hypotheses for unusual signals. This

18 Out of the Ordinary
approach builds in a defense against prematurely accepting an expla-nation for a phenomenon.6
Finally, the architecture enables the collaboration of personnelneeded to connect the dots, even if the personnel are distributedacross different groups and agencies. The architecture looks not justfor out-of-the-ordinary data but also for out-of-the-ordinary analyses onthe data. Flagging these analyses can bring together groups of peoplewho jointly are able to characterize a previously mysterious phe-nomenon. To date, we are not aware of other systems that examineanalyses in this way.
Near-Term Implementation of ASAP
Fully implementing the ASAP architecture—especially with auto-mated analysis components—would be a lengthy, multiyear process.However, several ASAP activities could be implemented quickly andwould provide noticeable benefits. These would effectively allow hu-man analysts’ interactions to partially substitute for the automatedagents described previously.
Each organization would need to work within its own culturaland organizational norms, bearing in mind that collaboration yieldsthe greatest benefits for all. Not every recommendation we proposebelow would feel normal or natural to all participants. But we believethis is a feasible way to jump-start the ASAP analytical process.
We have emphasized the importance of detecting out-of-the-ordinary phenomena. A major requirement is understanding whatconstitutes “ordinary” and what types of behaviors are significant de-viations from the ordinary. To make that judgment, one must firstestablish a baseline of ordinary patterns and behavior—canonicalforms, as it were.
After identifying potential user communities for ASAP (intelli-gence, law enforcement, homeland security), we suggest, as a firststep, formation of a representative core or pilot group that would draft 6 DARPA’s Project Genoa II (see DARPA Information Awareness Office, 2003b) providestools to help analysts explicitly record, marshal evidence for, and test hypotheses; however,these tools do not appear to be explicitly linked to TIA’s data analysis activities.

Introduction 19
short (e.g., 2–4 page) example profiles for key behaviors and patterns.Some of these profiles would be for established asymmetric threats,such as suicide bombings; they would address the “life cycle“ of thebehavior or pattern discussed earlier as well as what threats commonlylook like (terror attacks, terror support activities, etc.). Another,equally important set of profiles would capture what the status-quoconditions look like in watched domains such as international com-merce, transportation, demolition, and infectious diseases; these pro-files would help security professionals identify what observed behav-ior is truly out of the ordinary. It is important to note that these briefprofiles are in no way intended to be comprehensive; they are merelymeant to help analysts and field professionals in one domain educatetheir counterparts in other domains, in a much more intentional andsystematic way than is done now, about what behavior to look outfor.
We assume that secure electronic collaboration will be availableto some degree. The second step would be to establish a set of elec-tronic posting boards, divided by subject domain, where people inthe field can report unusual phenomena and see whether anyone elsehas been observing similar or related occurrences—in effect, func-tioning as detection and linking agents for their analyst colleagues.Analysts “on the home front” would provide feedback on observa-tions and postings from those in the field, confirming or redirectingtheir observations. Moderators trained in the domain(s) would thenreview the posting boards, selecting especially curious and significantreports to post to filtered boards that would be widely read by ana-lysts. We recognize that potential organizational or cultural issuescould limit the effectiveness of such an arrangement, yet we believean open-minded, flexible approach will yield great dividends.
For such a system to be effective, users must be confident thatthey have something worthy of posting. It is common practice forfield elements to take their direction from headquarters units in termsof requirements; this practice effectively tasks those in the fieldconcerning collection requirements and is a well-oiled process withnecessary information distribution and feedback mechanisms. Afterinformation responsive to those requirements has been submitted, the

20 Out of the Ordinary
requirements are updated, modified or discarded. The same practicecould be used for disseminating descriptions of out-of-the-ordinarysignals that may be worthy of further investigation.
Personnel would initially post their informal analyses and ques-tions to the unmoderated boards. It is important that the posting bevoluntary yet be encouraged by colleagues and management. Pub-lishing the profiles, case studies of successes resulting from posting,and case studies of successes resulting from other collaborative com-munity efforts might encourage the shy and retiring to contrib-ute—and also persuade the skeptics. It is important to create an envi-ronment and culture in which contributors do not feel vulnerable andexposed by posting what seems, from their perspective, to be out ofthe ordinary. Traditionally, intelligence and law enforcement profes-sionals have been loath to share their information and insights giventhe risks of leaks, compromise, exposure, and failure. The unmoder-ated posting should be hosted in a secure environment and be benign,nonthreatening, and, if necessary, anonymous. Currently, some ana-lysts, not wanting to show their hand, wait until they believe theyhave every last tidbit of information before laying their cards on thetable. ASAP posting boards would discourage hoarding and encour-age the posting of information that may not seem complete to ananalyst but that could be valuable because it confirms data known toother analysts or colleagues in the field. It is important to generate anatmosphere of support among peers instead of competition or para-noia; messages sent by management to encourage posting would rein-force that sense of mutual support. We assume that all appropriatesecurity and privacy policies would be strictly enforced in these fo-rums. Between the profile-generation and iterative requirementsprocess, field and other professionals should feel confident to submittheir interpretations of out-of-the-ordinary events.
The goal of these boards is to develop a “virtual community” ofintelligence, law enforcement, and homeland security professionals.Perhaps the most apt example of the community we would like toestablish can be found in the online gaming world. We refer, par-ticularly, to what are known as cooperative alternate reality games(cooperative ARGs). In these games, large groups of people—in some

Introduction 21
cases, thousands—become participants in an ongoing story. Advanc-ing the story requires jointly collaborating to solve a sequence of puz-zles that, when solved, reveal something that furthers the narrative (aweb page, email address, phone number to call, etc.) Importantly,solving the puzzles requires a number of different skills.
In perhaps the most notable example to date, “The Beast” (de-veloped by Microsoft to promote the movie A.I.; the plot had to dowith solving a murder),7 the puzzles ranged from interpreting lutemusic to building clay models of an island chain to decryptingENIGMA-encoded messages. The largest group working on “TheBeast,” named “Cloudmakers,” had over seven thousand members.To coordinate its members, Cloudmakers maintained a number oftools, accessible via its home page at http://www.cloudmakers.org:
• A generic posting board that allowed members to post any in-formation related to the puzzles as well as clearly marked“speculations” on how a puzzle might be solved or where thenarrative was leading.
• A moderated posting board that contained reprints of general-board posts felt to be of particular significance.
• An “official” posting board that contained only the most signifi-cant posts (announcements of group meetings in different cities,major game developments, etc.)
• A “game trail” that listed every puzzle discovered in the game,along with major developments used to solve the puzzle andevery solution.
• A “guide” document that described, in narrative form, the proc-ess of solving the puzzles and walking through the story.
An important note is that all of the above tools containedhyperlinks as needed, to particular puzzle or solution pages, particularnotes, sets of observed pages leading to solutions, and so on. The re- 7 See, for example, Farhad Manjoo, “AI: Unraveling the Mysteries,” Wired News, June 28,2001, and Daniel Sieberg, “Reality Blurs, Hype Builds with Web ‘A.I.’ Game,” CNN.com,June 13, 2001.

22 Out of the Ordinary
sult was a dynamic network of information, not a static chat room. Asimilar tool, the weblog (not used by Cloudmakers but in widespreaduse today) could be used in the ASAP schema to report on the mostsignificant observations, and speculations on observations, in reversechronological order.8
All these tools could be appropriated for intelligence or securityapplications, with open boards, moderated boards, trails, and guidesestablished to look at particular terrorist organizations or potentialthreats. An additional complication is that, since there would likelybe multiple virtual communities (not just a single game to monitor),the moderators would need to monitor multiple boards and makeappropriate cross-posts between boards. The moderators would alsohave to be well versed in the legal and policy aspects of the informa-tion that shows up on the various boards.
The third step would be to develop tools that help personnel toidentify posts relevant to what they have been observing. One mightfirst implement organizational tools, beyond those discussed above,that would divide the posts into threads dedicated to particular occur-rences and create indices of those threads. Particularly importantthreads would be associated with tailored journals summarizing keydevelopments and current hypotheses; these journals could be regu-larly posted across threads and boards. The next step would to be cre-ate Google-like search engines for posts related to particular Booleanexpressions. The final step would be the development of simple heu-ristics that look for connections and patterns across the threads ofposted messages. Previously, we discussed agents that scanned ana-lysts’ reports for key phrases; something similar could be done to re-view message posts.
An Evolutionary Path for ASAP
We envision an organic growth pattern for ASAP systems. The firststep in development would be to implement the above short-termrecommendations. The next step would be to develop initial proto- 8 For an introduction to weblogs, and a history, see Dave Winer, “The History of Weblogs,”at http://newhome.weblogs.com/historyOfWeblogs.

Introduction 23
types of the automated portions of ASAP. (Chapter Seven contains aresearch plan to develop these prototypes.)
Whether ASAP is initially implemented via the mostly manualboards-and-journals route or with automatic assistance, ASAP sys-tems will begin small. They will start as pilot projects, probably in asingle community of interest within an agency. From there, we envi-sion adding new communities of interest in an organic (or geometric)growth pattern—adding a few additional communities at first, thenmore at increasing rates, until, eventually, large portions of thehomeland security community use some ASAP functionalities.
The functionality of ASAP systems will increase over time. Theabove description of short-term improvements describes a multiphaseprocess—starting with the creation of behavioral profiles and eventu-ally leading to simple agents scanning analysts’ posts. In the longerterm, automated agents would be developed in multiple generations,starting with simple, rules-based agents and trend detection agentsthat are strictly manually controlled. The second step would be tocreate elementary processor agents and linking agents. From there,developers would create more sophisticated detection, processor, andlinking agents and would start to create the simple, pattern-matching(and pattern-deviation) agents used to generate and test simple hy-potheses. Eventually, ASAP systems would incorporate advancedagents that used detailed statistical models to extract meaning fromsets of out-of-the-ordinary behavior.
Summary of the Schema
Table 1.1 summarizes differences between the proposed schema andtraditional methods of intelligence analysis. The table also compares anear-term, manual implementation of ASAP with a full implemen-tation.

24 Out of the Ordinary
Table 1.1The ASAP Schema
Traditional Analysis ASAP AdvantagesASAP Near-TermImplementation
Full ASAP SystemImplementation
Focuses on previouspatterns
Searches for out-of-the-ordinarybehavior, allowingfor detection ofpreviously unseenthreats
Core or pilotgroup
New communitiesadded to elec-tronic boards
Time pressure drivestoward prematureclosure
Allows memory ofhypotheses anddata rejected byanalysts
Drafting shortprofiles of exist-ing asymmetricthreats—e.g.,suicide bombing
Incorporates en-tire homelandsecurity com-munity
Analysts mostlyoperate on basis ofown experience andbiases
Leaves key ana-lytic choices withanalysts
Drafting shortprofiles of statusquo in such“watched” do-mains as interna-tional commerce
Detailed architec-ture for out-of-the-ordinaryanalysis
Search tools mostlyweed out whatdoesn’t fit pattern
Notices what ana-lysts are watchingand asking
Users post onunmoderatedelectronic boards
Formal specifica-tions for detec-tion, linking, andhypothesis agents
Analysts are isolatedwithin own groupsand agencies
Facilitates collabo-ration betweenanalysts studyingthe samephenomena
Moderators con-nect across ana-lysts and, whenpossible, organi-zations
Analysis processesintegrated acrossorganizations
Outline of the Monograph
The bulk of this document describes an architectural design thatwould implement the ASAP schema with the assistance of automatedagents and analysis support tools.

Introduction 25
• Chapter Two describes the types of data an ASAP system wouldcollect and discusses potential sources of data.
• Chapter Three provides an overview of the ASAP architecture,focusing on the overall control of the system. In particular, it de-scribes how the system identifies which out-of-the-ordinaryfindings are truly worth further investigation. It also discussesthe roles of analysts and automated agents in an ASAP system.
• Chapter Four describes how the dots would be detected throughthe use of contextual rules that identify out-of-the-ordinary data.
• Chapter Five describes various methods for finding relationshipsbetween data elements and connecting the dots.
• Chapter Six describes techniques for generating hypothesesabout the meaning of the data and testing those hypotheses.
• Chapter Seven summarizes the ASAP architecture and presents aresearch plan and recommendations for action.
• Appendix A presents the full case study of the “November 9thincident” that began the paper. It presents, in narrative form, allthe key events and interactions that occurred before the inci-dent. It also describes how an ASAP system might have im-proved the analysis of those key events, through both automatedanalysis and support for human analysis and interactions.
• Finally, Appendix B reviews existing systems and analytic toolsthat might either complement the ASAP architecture or helpimplement an ASAP system’s components.

27
CHAPTER TWO
Data Analyzed in the ASAP Schema
This chapter discusses the types and sources of data likely to be ana-lyzed in an ASAP system. It also discusses what types of data andanalysis findings should be declared significant (“truly out of the or-dinary”) and worth further investigation.
Figure 2.1 shows the areas of the ASAP schema on which thechapter focuses—what information about watched entities is consid-ered to be of interest and how that information is captured and repre-sented within ASAP-system databases.
Types of Data
We have identified seven major types of data entities as havingmeaning for threat assessment:1
• People. Everyone who might be involved in an attack, from ter-rorist group leaders to assistants to those directly involved in car-rying out an attack.
• Money. All accounts and funding streams that could enable anattack.
1 These categories are based on the authors’ experiences and are intended solely for explana-tory purposes. They are not an official list and are not to be considered either exhaustive ordrawn from an intelligence agency’s official list.

28 Out of the Ordinary
Figure 2.1Watched Entities and Intercepted Information
Externalnetworks
ASAPnetwork
Tactical networkcontrol
Informationpool gets
data, sends filter changes
Respond to findings and requests(direct tasks and changes to analysis parameters)
Analystsreview
Information pool sends data,receives initial and follow-up queries
Processor sends instructions, receives test results
Feedback (to all parts of network)
Processor sendsprioritized
results, receivesanalysts‘requests
Analysisresults
andanalysts‘requestsObservational data
Analysis histories
Informationpool
$
Gatherinformation
Process results
Find dots(unusual
data/datasets)
Link dotsand data
Generateand test
hypotheses
Informationon watched
entities
RANDMG126-2.1
• Materiel. All weapons, explosives, and other equipment thatmight be used to prepare or execute an attack.
• Transportation. All vehicles that could be used to move peopleand materiel and all vehicles used directly in an attack.
• Accommodations. All lodgings (apartments, hotels, etc.) used bypeople who might be involved in an attack.
• Sustenance. All consumable supplies, notably food and medicine,used by people who might be involved in an attack.
• Communications. All channels used by people involved in an at-tack to exchange information. We include in the definition ofchannels both the people who are communicating with eachother and what modes they are using (phone, email, personalmeetings).
Data Analyzed in the ASAP Schema 29
A set of attributes is tracked for each of these core entities. Forexample, a person would be associated with an identity, current loca-tion, movement history, and activity history. Entities can also be asso-ciated or linked with each other; for instance, a person could be asso-ciated with a funding source and a means of transportation.
Sources of Data
The sources of information the ASAP system incorporates is a matterof policy debate. Substantial deliberations will be needed to balanceeffectiveness with security and privacy concerns. We have identifiedseveral major categories of sources.
Intelligence Networks
The core data-source category comprises existing intelligence streamsidentified as potentially having relevance to asymmetric threat as-sessment. As discussed earlier, however, receiving information frommultiple intelligence sources (especially across agencies) involvescrossing a number of technical, organizational, and procedural barri-ers, as well as ensuring that security and privacy regulations are up-held.
We envision first installing the ASAP system within a single in-telligence agency, in which case the system would be presumed tohave access to data on most agency networks. Multiagency ASAP sys-tems would follow later. The latter systems would allow for the great-est analytic breakthroughs in connecting the dots because they wouldpermit cross-agency data connections that are currently impossible.The legal and information security issues, however, would be muchmore complex.
From a technical perspective, the ASAP system would begranted access to particular intelligence networks by the network ad-ministrators, who would install interceptor agents within their sys-tems and adjust the interception criteria in accordance with deter-mined policy issues. Further, the ASAP interceptors could supportmuch-finer-grained security provisions than simple access or non-

30 Out of the Ordinary
access to networks. Administrators would be able to customize theinformation about particular data files that may be intercepted (forinstance, only content, only metadata, only the fact the file exists), aswell as to categorize the files that may be intercepted (by source, byregion or intelligence topic, by processing thread, etc.).
Information Reported as Out of the Ordinary
Chapter One discussed how ASAP-like benefits could be obtained inthe near term through the use of electronic bulletin boards allowinghomeland security professionals to post out-of-the-ordinary informa-tion. Reports to these boards would be a key source of informationfor ASAP, especially with respect to domestic information.
Board reports would be an especially important source of be-havioral information. In a number of places in future chapters, we ref-erence particular types of observed behavior as being important indi-cators of asymmetric threats. As examples, we note how repeatedvideotaping of buildings at a level of detail virtually never done bytourists may indicate that people are casing those buildings. Similarly,we describe how people carrying around large numbers of cell phonesand pagers outside of the buildings (so they can use each phone orpager only once, then discard it) may be members of terror groupsplanning an attack against the buildings. Such observations wouldenter ASAP through board posts from alert police and securityguards; ASAP would not analyze hundreds of millions of cell-phonepurchase records.
Applying automated agents to free-text reports of out-of-the-ordinary behavior will require those reports to be converted to sets ofmachine-interpretable data elements, using natural language processingtechniques. A number of companies and organizations are buildingprograms to do just that; Appendix B describes some of these pro-grams.
Information on Critical Industries
We expect that a limited number of industries would be monitored aswatched entities because of the nature of those industries. For exam-ple, hazardous materials (HAZMAT) production, handling, and

Data Analyzed in the ASAP Schema 31
transportation would be monitored to some extent, as would certaintypes of international commerce (already monitored by the U.S. Cus-toms Service) and immigration patterns (already monitored by theImmigration and Naturalization Service). Similarly, certain types oflaw enforcement data might also enter ASAP, if law enforcement per-sonnel could certify that the data warranted further investigation withrespect to asymmetric attacks.
The types of data diverted to ASAP from these systems wouldobviously be a matter for significant policy debate. It would be con-sistent with existing security and privacy laws and regulations. Animportant note here is that diverted data would be on an “exceptiononly” basis—only data meeting defined criteria for “warranting fur-ther analysis” would be reported. ASAP would not receive genericdata streams from these systems. Not only will exception-only diver-sion policies provide inherently strong privacy and security protec-tions, they will also help prevent ASAP systems from being over-loaded.
Open-Source Information
Finally, we expect the previous information to be augmented withopen-source information culled from the Internet. In general, giventhe privacy issues involved as well as the sheer volume of data on theInternet, we expect the roles of open-source data to be largely limitedto the following:
• Review of media articles related to possible asymmetric attackplots (to identify people recently arrested, natures of plots dis-covered, etc.)
• Review of media articles pertaining to security issues related topotential targets for attack (for example, articles related to theHAZMAT industry, air transportation, bridge construction andmaintenance)
• Review of posting boards and chat rooms frequently visited byterror group sympathizers (to identify social networks of poten-

32 Out of the Ordinary
tial sympathizers and to gauge the extent and nature of potentialterror activity)
• Searches for open-source data to augment what is known abouta particular entity (person, company, place, etc.) that has beenflagged as being part of out-of-the-ordinary phenomena.
Commercial Databases
Commercial databases have a limited but important role in the ASAParchitecture—they are used in the schema’s backsweeping function,in which investigators seek information about particular people as-sessed as being suspects in a plotted asymmetric attack. The purposeof such backsweeping is to identify entities of interest (such as resi-dences, vehicles, travel, close associates) related to the asymmetric at-tack. Such information can be vitally important in assessing the na-ture of a plotted attack, and eventually preempting it.
Importantly, however, in the ASAP schema backsweeping ofcommercial databases is not performed without probable cause tosearch the target of the backsweeping. Thus, for example, the schemacomplies with the proposed Citizens’ Protection in Federal DatabasesAct, which would prohibit accessing databases “based solely on a hy-pothetical scenario or hypothetical supposition of who may commit acrime or pose a threat to national security.” Consequently, because itwould involve substantial human involvement (in the form of a courtorder), backsweeping of commercial databases would not be per-formed automatically.
Partitioning Intelligence and Domestic Investigative Data
Federal law requires that intelligence information be kept separatefrom law enforcement information, except in particular situations inwhich intelligence information is used as the basis for a criminal in-vestigation. This partition will be maintained in the databases withinan ASAP system. We envision having two major databases. The firstwould collect intelligence information and perform analysis on it. En-tities of interest resulting from intelligence analysis would be passed(in accordance with applicable laws) to the second database, which

Data Analyzed in the ASAP Schema 33
collects and analyzes domestic information for the purpose of pre-empting domestic attacks.


35
CHAPTER THREE
The Atypical Signal Analysis and ProcessingArchitecture
In this chapter, we provide an overview of an architectural design toimplement the ASAP schema. We discuss the control structure of thearchitecture and describe the multiple layers of control that seek toensure operational performance and, more broadly, allow the archi-tecture to adapt over time. Finally, we compare the roles of analystsand automated software agents within the architecture. Successivechapters examine specific functional components within the architec-ture.
The Scope of an ASAP System
As with all major information analysis systems, the scope and com-plexity of an ASAP system is a vital issue. The size of the system—interms of both the amount of data in the system and the number andcomplexity of the software agents working on the data—must bemanageable.
With regard to the amount of data, the advantage of ASAP sys-tems is that they work on data specifically diverted to the system be-cause they meet specified filtering criteria; the ASAP architecture doesnot support the general copying of source databases into an ASAP

36 Out of the Ordinary
system. Thus, we envision ASAP systems working with data volumeson the scales of millions of records with hundreds of millions of links;this range is well within existing database system capabilities. Thesituation is different for ASAP interceptor agents, which would haveto filter very large streams of data or search very large databases forrecords matching particular criteria. The key for these interceptoragents is simplicity. Most of the interceptor agents, for example,would work by matching individual data with filter parameters ratherthan performing complex analyses.
It is important to control the number of system software agents,for several reasons. One reason is the sheer challenge of creating andmaintaining the array of agents. Another is that, as the number ofagents—and their interactions—increases, the analysis processes be-come so complicated that they are unpredictable and untraceable.Therefore, we envision controlling the complexity of the softwareagents in several ways. First, especially in early ASAP systems, theagents themselves would be fairly simple, largely based on simple pa-rameter-matching and graph-algorithm heuristics. Second, the agentsthemselves would tend to follow common templates, with a few vari-ables for the specific data fields to be compared and the specific rulesgoverning the analysis. We envision at most a few tens of basic tem-plates and perhaps a few thousand distinct agents operating in thesystem at any time. These agents would be carefully organized andtailored to the functions they serve and the ranges of data on whichthey operate; as a result, any particular data object might be subject toat most a few tens of agents. Thus, the processor agents, which assignincoming data objects to the appropriate detection agents, would bean important part of the control system.1
1 Traditional descriptions of agent-based systems present “mobile” software agents “crawlingaround the network, searching for data to work on.” In practice, effective agent-based sys-tems do not work this way. COUGAAR, for instance (see Cougaar Group, 2002), employs asophisticated scheduling system to match software agents to data objects and to determineboth when those agents run and what data objects the agents work on.

The ASAP Architecture 37
Levels of Analysis in the ASAP Architecture
Two traditional methods are widely used in analyzing intelligencedata: data mining and pattern analysis. Data mining looks for statisti-cal relationships between data elements. Typically, these relationshipsare “discovered” entirely by data mining algorithms; previouslyknown relationships are not taken into account. Consequently, thealgorithms need large amounts of similar, complete data to find statis-tically significant relationships from scratch—which presents difficul-ties in the highly diverse and increasingly noisy world of asymmetricthreat information. Conversely, pattern analysis scans data for pre-established patterns indicative of known and meaningful relation-ships. With pattern recognition, one finds exactly the signals onesearches for. Unfortunately, many asymmetric threats do not obeystandard patterns closely enough to be detected until it is too late.
In their traditional form, these two techniques are very good fordetecting and isolating certain types of intelligence data. However,they have limits. Data mining is not well suited to events and datathat are spread in time and space and that are few in number.2 Pat-tern analysis is incapable of detecting either changes in patterns orpatterns that are dynamic and ill defined.3
It is important to note that both of these methods fail to exploitanalysts’ expectations about what might be (or might not be) ob-served and the meanings of the observations. Our architectural design 2 Traditionally, data mining algorithms seek to segment a large population into clusters,with some clusters having a greater likelihood of possessing a particular attribute. For exam-ple, one might attempt to identify people who will have a 2 percent chance of responding toa catalog mailing rather than a 0.1 percent chance. For a general introduction to data min-ing, the major techniques, and its uses, see the IBM International Technical Support Orga-nization book on the subject (Cabena et al., 1998). Although data mining algorithms are aboon in marketing, the clusters they find would likely be too weak for asymmetric threatassessment, which needs to identify particular people likely involved in planned attacks.
3 The books Artificial Intelligence (Rich, 1983) and Machine Learning (Carbonell, ed., 1990)discuss the difficulties of pattern-matching in such “routine” activities as text recognition(difficulties in telling whether a particular shape or sound is an “a” or an “o”, for instance)unless the inputs exactly match or do not match a specified pattern. It is a much greaterchallenge to determine whether incoming intelligence—data subject to great uncertaintiesand missing a great deal of context—is indicative of a threat.

38 Out of the Ordinary
explicitly monitors streams of data over time and compares those ob-servations with expected values. Importantly, our expected values ap-ply not only to known patterns of planned attacks but also corre-spond to normal routine behavior. The deviations from expected,status-quo behavior are the dots. They indicate initial clues that havelatent potential for guiding more-detailed analysis, for justifying fur-ther watching, or for authorizing intervention. Detecting the raw in-formational clues that arise from data streams on watched entitiesforms the first level or dimension of ASAP processing.
In addition to their study of observed data, the analysts’ actionscan yield important clues, and searching for these clues is the secondlevel of ASAP processing. What the analysts probe for, request infor-mation on, and when they do so can indicate a heightening level ofawareness and curiosity about something out of the ordinary. Sup-pose, for example, that an FBI field office suddenly begins searchingfor records on a truck-driving school—something the field office doesnot normally do. By flagging unusual “analysis behavior,” one mightfind that the FBI office was tracking a set of unusual students thatother agencies could connect with terrorist organizations.
Finally, conventional data-mining and pattern-matching ap-proaches fail to exploit key indications that come from analysts’ notesand reports. Analyzing these notes and reports is the third level ofASAP processing. Using the analysts’ written records, pieces can beput together across reports and across analysts. For example, onemight find the aforementioned FBI field office and a CIA counterterrorism group are both writing reports about members of the samefamily—a fact of significant importance in detecting and under-standing potential threats.4
4 Note that the ASAP architectural design does not depend heavily on being able to interpretanalysts’ notes. We recognize that parsing analysts’ reports is a major technical challenge.Nonetheless, we can envision simple algorithms, such as key-phrase search engines, that atleast determine if analysts are working on a particular topic.

The ASAP Architecture 39
Major Functional Components Within the Architecture
Data Interception, Storage, and Distribution
The three levels of processing imply that an ASAP system probes fordata at various points throughout intelligence collection and analysisprocesses. The ASAP system uses a series of interceptor agents to filterdata on the outside network and to divert relevant data for furtherreview. At the first level, the interceptors filter raw streams of incom-ing data, intercepting data found to be applicable to the watched enti-ties for further analysis. At the second level, the interceptors reviewdata on how intelligence systems are used—who requests what, whatprobes are set, when they are set, who gets the information, and soforth. Finally, at the third level, the interceptors filter the basic resultsof information processing, translation, and any generated reports andnotes based on the information. If the ASAP system is to detect theclues and perform a value-added task, it cannot have restricted visionof the types of information it reviews. The interceptors must be ableto review a complete range of information from intelligence net-works—including such metadata information as signal sources andthe envelope (header and related information), not just the contentsof the data, as well as system use and reports data. Figure 3.1 showsan ASAP interceptor diverting a variety of information for furtheranalysis.
The interceptors are the only elements of the ASAP detector thatsit on the information backbone. Analysis of data on the backbonemust be done in a nonobtrusive fashion and should degrade the per-formance of the backbone as little as possible. This decoupling addsstrength to the architecture because the backbone and detection sys-tem can evolve independently and be run separately as required.
Thorough and efficient data interception at various pointsthroughout the intelligence process is the necessary first step of ASAPanalysis. The intercepted data are tagged and assigned to their corre-sponding watched entities. Each data object must be associated withsome entity, and that entity has a life-cycle model and data reposi-

40 Out of the Ordinary
Figure 3.1
Intercepting Data
RANDMG126-3.1
Interceptor
Watched entities
Outsidenetwork
• Data (applies to watched entities)• Metadata (source, envelope, reason for collecting, etc.)• Usage histories (who is requesting what and why)• Analysis results (test results, reports, follow-up actions)
$
tory. (We have already discussed the types of entities supported bythe ASAP architecture in Chapter Two.) Figure 3.2 shows how theinterceptors feed data to distributor agents, which in turn forward thedata to appropriate databases of watched entities that associate the dataobjects with their corresponding entities.
The age of data objects would be noted, and the data automati-cally cleaned based on their temporal persistence. For example, mon-etary transactions for a specific organization may be tracked andcataloged for a rolling three-year period. The ASAP architecture em-phasizes maintaining historical data because these data provideinformation about norms and expectations and can be used to pickup changes to the status quo. The maintenance of historical data alsohelps protect against introducing biases concerning what sorts ofthreats can be detected by tightly limiting analysis to a small set ofprevious “findings.”
Finding Dots
One or more specialized detection agents then review the interceptedand stored data objects. These agents use data filter models to process

The ASAP Architecture 41
Figure 3.2Data Sorting, Distribution, and Storage
RANDMG126-3.2
Database ofwatched entities
Distributor
Interceptor
• What: funds transfer• Who: Don to Carol• Amount: $15,000 …
Example data object
Outsidenetwork
• Data (applies to watched entities)• Metadata (source, envelope, reason for collecting, etc.)• Usage histories (analysis requests’ who, what, when, etc.)• Analysis results (test results, reports, follow-up actions)
the incoming data. The purpose of these agents is to identify the out-of-the-ordinary data objects (and sets of data objects) that are worthfurther attention—the dots. The detection agents would be special-ized and tailored to process specific domains, such as transportation,financial transactions, and hazardous material.
Detection agents analyze data objects in two ways: reviewing theobject’s contents and its metadata. For example, the contents of anintercepted email transmission would be analyzed, as would the basicto-from and date information regarding the interaction that triggeredthe interception of the transmission.
In addition, detection agents analyze a data object’s data andmetadata with respect to life-cycle models. The data object pertains tosome entity being watched, and this entity is in a certain state withinits expected life cycle. For example, if a terrorist organization isknown to be in a training phase, certain expectations would be nor-mal for data traffic and personnel movement. These expectationswould be different once the organization disperses after training.(Chapter Four discusses life-cycle models in more detail.)

42 Out of the Ordinary
Detection agents fall into two classes: rules agents, which look atsingle data objects (or small sets of data objects), and trend agents,which look at time series of data objects. For example, consider theanalysis of funds transfers. A rules agent might search for single trans-actions associated with a particular entity that are more than $10,000,whereas a trend agent might determine whether the total level offunding has changed by more than 20 percent over the past twomonths.
Both types of agents employ contextual rules to test the data.Chapter Four discusses contextual rules in detail, but the key idea isthat contextual rules can change as knowledge of the environmentchanges. For example, suppose a system receives information that aplot is under way to launch an attack against a major port in thenortheastern United States; observations of unusual behavior in theseports would be treated with much greater scrutiny than they normallywould.
Much of the incoming information is not in a form directly ac-cessible by detection agents. Thus, preprocessor agents prepare the dataobjects to be analyzed by detector agents. For example, preprocessoragents compile data objects into time-series structures that can beanalyzed by trend agents. Preprocessor agents can also perform basiclinking of data objects—associating data objects with their entities,for example—so that rules agents can analyze the data objects prop-erly.
Figure 3.3 shows an example of detector and preprocessor agentsapplied to a data object (a $15,000 funds transaction). The rulesagent tests the object (on its own) to see whether it is more than somevariable x. Suppose x is $10,000; then the rule is satisfied, and theagent declares the object to be a dot. In addition, the preprocessoragent places the data object into a series tracking funding transfersover time, and the trend agent tests whether the volume of transfershas changed significantly over the past two weeks. If this condition issatisfied, the agent declares the series (including the $15,000 agent)to be a dot.

The ASAP Architecture 43
Figure 3.3Two Approaches to Detecting Dots
RANDMG126-3.3
Data object
• What: funds transfer
• Who: Don to Carol
• Amount: $15,000
…
Rules agent
Trend agent
Is transactiongreater than $x?
Has transfer volumechanged by +/– y%
in last z days?
Seriesis dot
Objectis dot
No dot
No dot
Preprocessor agent• Put data object into series
No
Yes
Yes
No
The ASAP architecture uses four major significance levels in as-sessing software agents’ test results: (1) below the threshold for fur-ther action (not a dot), (2) mildly unusual but not noteworthy in itsown right, (3) somewhat unusual and worthy of further analysis, and(4) highly unusual, with the dot being given a high priority settingand broadcast to analysts throughout the system as specified.
Linking Dots
As noted, linking agents are responsible for finding additional infor-mation related to dots. These agents are divided into two categories:

44 Out of the Ordinary
first-order and second-order. First-order agents search the database ofwatched entities for additional data directly linked to the data objectsmaking up the dot. Second-order agents search wider and deeper,looking for events, trends, or patterns of events similar to the dot.
Figure 3.4 shows an example of a processor agent calling forfirst- and second-order linking agents on a dot—namely, a $15,000funds transfer from Don to Carol. The first-order agent assemblesand links any data it can find on Don and Carol, such as associates,homes, vehicles, known organizational memberships, and travelmovements (and plans, if known). The emphasis here is on identify-ing information on Don and Carol that is in the database of watchedentities but that was previously excluded as being unimportant. Thesecond-order agent assembles and links any data it can find on largefunds transfers similar to the Don-to-Carol transaction. The results ofthe linking agents are sent back to the processor agent. In addition tocalling for follow-up studies (see next section), the processor agentforwards the results to a reporting agent, which transmits the resultsto analysts.
Suppose the dot being tested was not the Don-to-Carol transac-tion but a major increase in funds transfers over the past two weekswithin a particular region. In this case, a first-order agent would re-view trends in behavior within the region—whether people receivingthe funds transfers were suddenly making travel plans or takingtraining classes, for example. Second-order agents would search forchanges in funding transfers in other regions. Chapter Five discussesthe techniques involved in linking data objects in some detail.
Generating and Testing Hypotheses
Hypothesis agents examine linked sets of dots and determine whetherthe dots match a pattern that provides evidence for, or weakens, aparticular hypothesis. When analyzing a set of dots, the agents caneither create a new hypothesis or test the dots against existing hy-potheses. The primary role of the hypothesis and testing agents is to

The ASAP Architecture 45
Figure 3.4Finding Data Related to Dots
RANDMG126-3.4
Data object: dot
• What: funds transfer
• Who: Don to Carol
• Amount: $15,000
• Why dot: transaction greater than $10,000
…
Processoragent
calls otheragents
Processoragent
Linking agent(First order)Collects and organizes info on Don and Carol, such as their associates, homes, vehicles, and travel plans
Linking agent(Second order)Searches other big transactions for similarities with Don-to-Carol
Reporting agentProvides updates ondiscovered dots to analysts
Determinesnext steps totake with dot
assist analysts in determining what sets of atypical phenomena havethe greatest priority for further investigation.
The ASAP architecture supports two broad classes of hypothe-ses. The first is specific—whether the pattern formed by the dots hassome specific meaning for analysts, such as signals indicating a par-ticular type of event against a particular target. We discuss hypothesisagents in detail in Chapter Six, but, in general, agents determinewhether dots match specific templates to test specific hypotheses. Forplanned attacks, for example, hypothesis agents would look for dataobjects indicating particular targets combined with objects repre-senting particular people, means of attack, and sponsoring terror or-ganization.5
5 The ASAP architecture described here, especially the hypotheses-generating and-testing components, is similar to “blackboard” designs used in artificial intelligence (see PCAI Magazine, 2002). Such systems place various data and hypotheses into a common black-board database, to be interpreted and modified by rule-based agents. The structure can workextremely well in systems where the rule-based agents perform straightforward data-processing and analysis tasks. Note, for example, the success of the COUGAAR architecture,also a blackboard-based scheme, developed to generate detailed logistics plans (see CougaarGroup, 2002). In ASAP systems, processing would also be straightforward, even for hypothe-sis generation. Here, the primary role of the hypothesis agent would be to assess the “extent
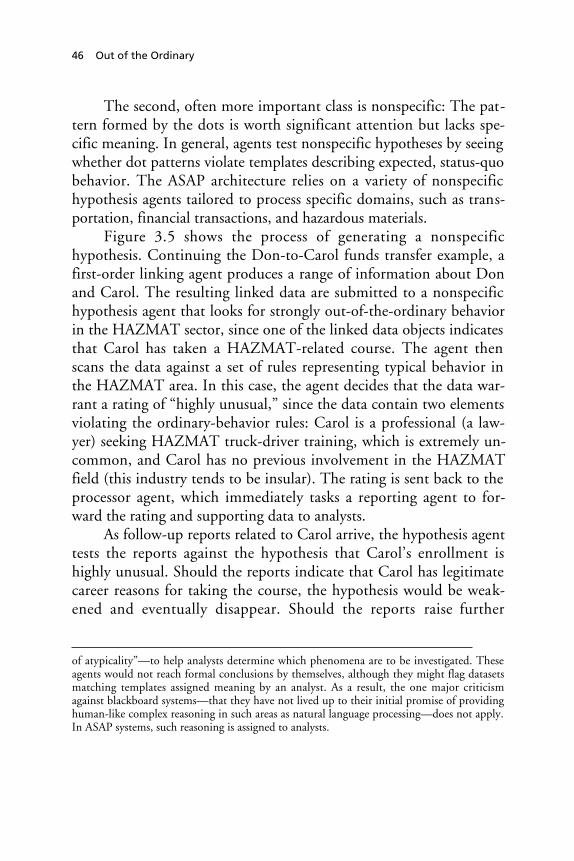
46 Out of the Ordinary
The second, often more important class is nonspecific: The pat-tern formed by the dots is worth significant attention but lacks spe-cific meaning. In general, agents test nonspecific hypotheses by seeingwhether dot patterns violate templates describing expected, status-quobehavior. The ASAP architecture relies on a variety of nonspecifichypothesis agents tailored to process specific domains, such as trans-portation, financial transactions, and hazardous materials.
Figure 3.5 shows the process of generating a nonspecifichypothesis. Continuing the Don-to-Carol funds transfer example, afirst-order linking agent produces a range of information about Donand Carol. The resulting linked data are submitted to a nonspecifichypothesis agent that looks for strongly out-of-the-ordinary behaviorin the HAZMAT sector, since one of the linked data objects indicatesthat Carol has taken a HAZMAT-related course. The agent thenscans the data against a set of rules representing typical behavior inthe HAZMAT area. In this case, the agent decides that the data war-rant a rating of “highly unusual,” since the data contain two elementsviolating the ordinary-behavior rules: Carol is a professional (a law-yer) seeking HAZMAT truck-driver training, which is extremely un-common, and Carol has no previous involvement in the HAZMATfield (this industry tends to be insular). The rating is sent back to theprocessor agent, which immediately tasks a reporting agent to for-ward the rating and supporting data to analysts.
As follow-up reports related to Carol arrive, the hypothesis agenttests the reports against the hypothesis that Carol’s enrollment ishighly unusual. Should the reports indicate that Carol has legitimatecareer reasons for taking the course, the hypothesis would be weak-ened and eventually disappear. Should the reports raise further
of atypicality”—to help analysts determine which phenomena are to be investigated. Theseagents would not reach formal conclusions by themselves, although they might flag datasetsmatching templates assigned meaning by an analyst. As a result, the one major criticismagainst blackboard systems—that they have not lived up to their initial promise of providinghuman-like complex reasoning in such areas as natural language processing—does not apply.In ASAP systems, such reasoning is assigned to analysts.

The ASAP Architecture 47
Figure 3.5Using Dots to Generate a Hypothesis
RANDMG126-3.5
Processoragent
Directs flow ofdata objects
between agents
Hypothesis agent(Monitoring of HAZMAT training)Evaluates linked information sets, predicting if subject seeking training is suspicious or almost certainly a threat
Analystreviews
Data object: linkedinformation• History: calling dot: Don-to-Carol transaction greater than $10,000• Who: Carol• Education: lawyer• Recent transactions: spent $5000 on a HAZMAT truck- driver course • Experience [… no truck driving, HAZMAT experience]
Data object: highly unusual information set• History: (1) Don-to-Carol transaction greater than $10,000, (2) Carol is taking HAZMAT truck-driving course
• Rating: highly suspicious/no definite threat link
• Reasons: (1) Person previously a professional (2) Person has no previous truck or HAZMAT experience
Linking agent(First order)Collects and organizes info on Don and Carol, such as their associates, homes, vehicles, and travel plans
suspicions, the hypothesis would be strengthened. Examples ofstrengthening behavior include Carol engaging in further unusualbehavior (posting to terror-related chat rooms, for instance) or multi-ple people engaging in behavior similar to Carol’s (multiple profes-sionals taking HAZMAT-related classes, for instance).

48 Out of the Ordinary
Control of the ASAP Architecture
Principles and Structures of Control
ASAP’s control structures allow for true context-dependent analysis,such that the activities used to analyze a set of data at any stage de-pend on what has been learned about the dataset to date, as well asother relevant environmental factors. ASAP networks would be con-trolled using principles and structures of mission management, whichis the systemic control of distributed information networks in orderto meet user and mission needs. Hollywood and McKay (forthcom-ing) have developed a detailed control framework for mission man-agement.
The framework (and thus the control of ASAP systems) is basedon four key principles of cybernetics, which is the formal study ofchange and control of change (see Ashby, 1956). The first principle isthat, to control the system, one must understand both a system’s in-dividual pieces and the coupling between the pieces. Thus, theframework identifies and controls the end-to-end processes producinginformation in an ASAP system, starting from the initial interceptionof information through the delivery of completed reports to the ana-lyst. Figure 3.6 shows an end-to-end, generic ASAP process. Notethat the process diagram includes both direct processing flows andcontrol and feedback flows.
The second cybernetics principle is that one cannot describe asystem’s evolution unless one has concepts—and variables or datastructures representing those concepts—that accurately represent thestate of the system. In the case of mission management, we require adata structure that reasonably represents the current status of the end-to-end information process, both for individual process activities andfor the process as a whole. We employ augmented process maps, whichassociate activities in the process diagram—and the overall process—with tailored sets of performance metrics. The metrics are both quan-

The ASAP Architecture 49
Figure 3.6Diagram of an End-to-End, Generic ASAP Process
RANDMG126-3.6
Generate/testhypotheses
Link dots(place incontext)
Identifydots
Analyzeresults
Datacollection
D1a:Intercept
data
D5:Reviewreports
C1a:Analyst
determinesrequestC5:
Changeinterception/
database rules
D2:Apply
contextualrules
C4:Change
contextualrules
C1b:Automated
agentdetermines
modifications
D1b:Add to
conceptualdatabase
D4a:Generate
hypotheses
C2:Change
hypothesisanalysis
D4b:Test
hypotheses
D3a:Apply
first orderagents
C3:Changelinkingrules
D3b:Apply
second orderagents
Box: Main process stage D: Direct data-processing activities C: Control/feedback activities
titative (numerical) and qualitative (including, for instance, anyknown reasons that might explain the numerical measurements).6
The augmented process map also describes any known relationshipsbetween measurements of process activity and the performance of theprocess as a whole.
Metrics within the mission management framework fall into fivemajor categories. Table 3.1 describes the categories and presents sam-
6 For example, a user satisfaction metric would provide a numerical indicator of a problem,the user’s description of what the problem was, and the description and result of steps takenby network administrators to solve the problem.

50 Out of the Ordinary
Table 3.1Example Performance Metrics for an ASAP System
Category of Metrics Example ASAP Metrics
Quality
Determines whether informationprovided is complete, relevant,accurate, and secure on a consistentbasis
The percentage of information that should havebeen flagged by ASAP agents that is indeedflagged (based on statistical testing)
The percentage of information flagged by ASAPagents that is found to be significant by ASAPanalysts
The percentage of information flagged by ASAPagents that was found to be insignificant(false positives)
The percentage of ASAP system informationaccurately maintained with respect to theinitially collected data
The security of ASAP data, as measured by resis-tance to designed “red team” attacks
Quantity
Determines whether the system canprovide volumes of informationwhen and where required
The percentage of intercepted information thatthe ASAP system is able to place in context andanalyze using varying levels of ASAP agents
Timeliness
Determines whether the end-to-end processing times meet users’due date requirements
The time from when a significant data elemententers the system to the time it is employed in areport to an analyst
Mix and Variety
Determine whether the networkcan quickly create or modifystreams of information in re-sponse to user requests or otherenvironmental changes
The range of requests for a new or modifiedstream that the system can accommodate
The time required to create a new or modifiedstream
Analysis and Collaboration Support
Determines whether users receiveinformation in employable formatsand whether the network providessufficient tools for the users tocollaborate
The percentage of information immediatelyemployable by ASAP analysts
The percentage of ASAP analysts reachable byany particular analyst

The ASAP Architecture 51
ple metrics for an ASAP system within each category. The actual met-rics used would depend on the particulars of the ASAP system.
The third cybernetics principle is that, while one needs to takeinto consideration all types of information transactions and transfor-mations inside a system to control the system, one does not need totake into account the specific media and physical processes used.Thus, for monitoring the inputs and outputs of agents in ASAP, werely on general metrics that do not depend on the technical details ofthe agents or the supporting physical network—as presented, for ex-ample, in Table 3.1. Similarly, control of ASAP agents and the mar-shaling of data objects are based on general rules that treat individualASAP agents and data objects as “black boxes.”
The fourth cybernetics principle is that, in order to control asystem, one needs to understand, collect data on, and have controlmechanisms for all of the degrees of freedom of that system. Since anASAP system is quite complex and must adapt to an ever-changinggeopolitical environment in ways difficult to predict, being able tocontrol all possible degrees of freedom is impossible. Thus, flexibilityand adaptability in control is paramount.
Combining the above four principles yields the overall structureof the ASAP control system. At any time, the system maintains aug-mented process maps of the information flows within the system andtracks performance metrics for each process activity (both automated-agent and manual). A hierarchy of control agents oversees the work-ings of the process, attempting to keep performance metrics withindesired parameters. We expect three types of electronic agents to beinvolved in the operational control 7 of ASAP systems: processingagents, which directly marshal sets of data objects in response to theobjects’ metadata and analysis results; automated control agents,which allocate resources and control processing flows in response todemands for particular types of information; and control assistanceagents, which assist ASAP network managers in modifying the system 7 The mission management framework developed by Hollywood and McKay also incorpo-rates control elements responsible for systems engineering and architectural decisionmaking;however, such higher-layer control elements are outside the scope of this document.

52 Out of the Ordinary
in response to issues outside the domain of the automated agents.(Control assistance agents notify managers of network problems, givecontext to the problems, and provide communications and controltools for helping the managers isolate and fix problems.)
All three types of agents employ a set of control logic rules tomake decisions. The rules operate using inputs from data objects orsystem messages requesting a control decision, system status informa-tion from the augmented process maps, and the internal state of thecontrol agent. The rule sets can resemble a classic stimulus-responsetable (“if X then Y”), a finite state diagram, or a complicated decisiontree, depending on what is appropriate for the control agent. It is im-portant to note that these rule sets may be modified dynamically inresponse to changing environmental situations simply by having acontrol agent execute a rule to change the control logic. For example,an automated control agent, when faced with a flood of incomingdata objects, can change the rules used to determine which level ofanalysis should be performed on a data object—in this case, reducingsensitivity to avoid overloading the system.
Note that the exact nature of the control structure used in anASAP system—the process maps and metrics employed, the types ofcontrol agents used, the structures of the control logic used, and theexact mechanics of carrying out the marshaling of data objects andthe modification of system elements and flows—would be a majorfocus of any future development of the ASAP concept.
Control of ASAP systems takes place at two fundamental levels:the operations level and the tactical level. The purpose of operations-level control is to guide data through the various analytic functions,ensuring that the data are properly characterized. The purpose of thetactical level is to ensure that the system as a whole can respond ap-propriately to environmental changes. Surrounding the direct controlof the ASAP system are learning processes, which help the systemadapt to improve performance over time.

The ASAP Architecture 53
Control at the Operations Level
Operations-level control in ASAP is the domain of the processoragent, as directed by analysts’ requests. Figure 3.7 highlights thesetwo segments of the ASAP schema.
General Principles. Operations-level control is rule-based andcontext-dependent. That is, decisions as to what tests to execute nextand how to interpret the results use the following types of informa-tion as input:
• information about the data being analyzed• information about the analyses previously performed and the re-
sults of those analyses
Figure 3.7Operational Control in the ASAP Schema
Externalnetworks
ASAPnetwork
Tactical networkcontrol
Informationpool gets
data, sends filter changes
Respond to findings and requests(direct tasks and changes to analysis parameters)
Analystsreview
Information pool sends data,receives initial and follow-up queries
Processor sends instructions, receives test results
Feedback (to all parts of network)
Processor sendsprioritized
results, receivesanalysts‘requests
Analysisresults
andanalysts‘requestsObservational data
Analysis histories
Informationpool
$
Gatherinformation
Process results
Find dots(unusual
data/datasets)
Link dotsand data
Generateand test
hypotheses
Informationon watched
entities
RANDMG126-3.7

54 Out of the Ordinary
• information about the hypotheses being tested against the dataand the current strengths of those hypotheses.
The above inputs are complemented by information about the“who, what, when, why, where, and how” of the information beinganalyzed, the mission or task associated with the analysis, and theanalysts requiring the analysis. These combined dimensions definethe control structures needed to make sense of what is ordinary andwhat is out of the ordinary.
The Processor Agent. The processor agent is the core instrumentof operations-level control. Data objects (and sets of data objects)triggering the mildly unusual, somewhat unusual, or highly unusualdetection—the dots—are transmitted to a processor agent. As thenerve center of the ASAP analysis process, the processor agent’s pur-pose is to determine what to do when it receives the dot. The proces-sor agent has two major responsibilities.
The first responsibility is to call agents to perform follow-uptests on the dot. The processor agent calls linking agents to search forinformation potentially related to the dot (in the backsweeping proc-ess). It also calls hypothesis agents to determine whether dots—andany related dots and data found via the linking agents—match pat-terns that strengthen or weaken particular hypotheses. Any connec-tions or matched hypotheses found would trigger additionalbacksweeping and hypothesis-testing. This processor agent–directedprocess is then iterated, with more and greater-priority resultstriggering more follow-on analysis.
The processor agent receives direction from two sources. Thefirst is automated logic; finding a dot above a certain significance levelmight automatically trigger a corresponding backsweeping, for exam-ple. The second is manual; analysts can order the processor agent tocall any ASAP query or test manually. At the operational level, ana-lysts act on the ASAP network through requests to the processoragent.
The second responsibility of the processor agent is to prioritizethe detected dots, reporting the higher-priority dots and analysis re-sults to analysts. Any highly unusual items or dot connections found

The ASAP Architecture 55
would trigger immediate notices to the appropriate analysts, inform-ing them of the status and what further analyses have been automati-cally launched. Lower-priority items of note would be transmitted ina daily communication. Other dots (and data items) would beignored. Factors considered in prioritizing dots are discussed below.
Note that while the processor agent calls linking, hypothesis,and reporting agents, the processor agent does not do any of the fol-low-up work itself. Instead, additional agents perform the specifiedfunctions with the processor agent in a controlling role. This divisionof tasks allows for modularity and flexibility in determining whatanalyses should be performed on data elements.
Prioritization. Any large analysis system is likely to generate avery large number of potential “hits” (dots, in our case). Most ofthem would be false positives and must be filtered out of the systemboth for sheer feasibility (the U.S. government has limited resourcesto investigate dots) and to protect the privacy of people falsely de-tected. The scalability problem is further complicated for ASAP be-cause of the architecture’s use of distributed, semi-independentautonomous agents working on subsets of conceptual graphs; withoutcareful attention, such approaches could lead to a combinatorial ex-plosion in the number of false positives and analysis requests created.
The main complexity-control approach that we have identifiedis to rank-order the detected dots using a multidimensional priorityscheme and allow low-priority hits to remain unanalyzed. From apractical perspective, we expect detected dots to fall into four catego-ries: investigated by a human, investigated in detail by automatedagents (multiple agents directly analyzing the single dot), indirectlyaddressed by automated agents (dot becomes a data point in trendagents), and not addressed at all (the bulk of the detections). Beloware some likely candidates for dimensions to determine the rankings.
Connectivity. This type of rule applies to links between observa-tions, especially potential dots. The more links there are to particularobservations, or to particular entities that are the subject of the obser-vations, the more significant the dot is likely to be. We can createsimilar rules for the number of agents declaring an observation (or setof observations) to be a dot. Here, the number of links can and

56 Out of the Ordinary
should be weighted by the importance of other dots linking to theobservation—for example, observations related to someone known tobe a high-ranking operative of a terror group would be ranked higherthan an observation related to someone only marginally and indi-rectly linked to the group. This approach is similar to how the Goo-gle search engine ranks pages: It counts the number of links to eachpage weighted by the predetermined importance of the linking page.8
Frequency. This type of rule applies to trends in observationsand is particularly relevant to second-order agents tracking similaritiesin phenomena. It simply states that the more prevalent a phenome-non is (in terms of observations reporting it), or the more rapidly itappears or spreads, the more significant it is. For example, in the casestudy in the appendix, the sudden arrival of high-speed tuna boats inmultiple harbors around the world is more significant than a surge intuna boats in a single harbor.
Coverage. This type of rule generates a small number of dots forfurther analysis that are related to every currently known terror orga-nization, geographic area, or watched process. The rule is designed todefend against the “fighting the last war” problem by ensuring that atleast some attention is paid to potential future threats.
Commitment. This rule characterizes observations that showsignificant work or commitment as more important than an observa-tion representing a discussion or note taken in passing. Example of acommitment rule would be to place observations demonstratingsignificant work in casing a target on a higher level than merely talk-ing about a target. For example, ABC News reported on the existenceof videotapes detailing al Qaeda operatives’ personal surveillance ofthe World Trade Center, the Sears Tower, Disneyland, UniversalStudios in Los Angeles, and the Golden Gate Bridge.9 The muchgreater commitment shown to these places would cause ASAP to de- 8 See Google’s own explanation of its page-ranking scheme at http://www.google.com/technology/.9 “Videotape Shows Preparation for US Attacks—ABC,” Reuters, March 4, 2003. See alsoAndy Soltis, “WTC Vid Declares Planning of Attack,” New York Post, March 4, 2003, whichalso mentions surveillance of the Brooklyn Bridge, Wall Street, and the Statue of Liberty.

The ASAP Architecture 57
clare them to be at much greater risk than other places merely men-tioned once or twice by al Qaeda operatives.
Oddness. For example, the managing director of Jane’s Informa-tion Group noted that Jane’s Intelligence Review (August 2001) re-marked that al Qaeda was training commercial pilots.10 ASAP wouldtreat this information as being of high priority simply because of itsstrangeness with respect to normal profiles of terror organizations ingeneral and al Qaeda in particular.
Context. Finally, this most important type of rule dynamicallyadjusts a dot’s generic prioritization rating based on current environ-mental knowledge. The previous section contained an example ofscrutinizing atypical behavior reports from HAZMAT truck-drivingtraining courses given information indicating that a lawyer with notrucking experience was attending such a course; this is an example ofa contextual prioritization rule.
Control at the Tactical Level
Tactical-level control concerns the modification of the ASAP agentsand overall network processes to adapt to environmental changes. AnASAP system will support tactical control by making all agents andprocesses fully customizable. Which agents are used, what the agents’internal logic is, and what workflow-governing rules are used are allsubject to change. The primary directors of an ASAP system are theanalysts; ASAP systems use a fully open-loop control model, so thatanalysts have full authority to task agents, set testing criteria, and setpriorities as they see fit. The analysts are assisted by automated con-trol agents, which can automatically implement well-understoodworkflow and analysis changes. Figure 3.8 highlights the componentsof the ASAP schema responsible for tactical-level control.
10 Alfred Rolington, “9/11: In Search of Context and Meaning,” Jane’s International SecurityNews, September 11, 2002.

58 Out of the Ordinary
Figure 3.8Tactical Control in the ASAP Schema
Externalnetworks
ASAPnetwork
Tactical networkcontrol
Informationpool gets
data, sends filter changes
Respond to findings and requests(direct tasks and changes to analysis parameters)
Analystsreview
Information pool sends data,receives initial and follow-up queries
Processor sends instructions, receives test results
Feedback (to all parts of network)
Processor sendsprioritized
results, receivesanalysts‘requests
Analysisresults
andanalysts‘requestsObservational data
Analysis histories
Informationpool
$
Gatherinformation
Process results
Find dots(unusual
data/datasets)
Link dotsand data
Generateand test
hypotheses
Informationon watched
entities
RANDMG126-3.8
Learning and Adaptation
An ASAP system must be able to learn and adapt over time if it is toreact to environmental changes—especially changes caused by adver-saries attempting to react to the system’s successes. Learning is alsoimportant simply to improve the system’s performance in detectingtruly anomalous information while ignoring routine information.Below, we present several strategies for learning and adaptation:automated learning, manual adaptation processes, and periodic envi-ronmental reviews.
Automated Learning. Implementation of the linking, hypothe-sis-generating, and hypothesis-testing agents will require the use of

The ASAP Architecture 59
data mining and pattern-recognition algorithms.11 Both of these typesof algorithms rely on statistical-training techniques. The details ofstatistical training are outside the scope of this document, but the ba-sic idea is that we present linked sets of data to an algorithm, alongwith a statement of the set’s significance. At base, significance is de-fined as whether or not the set is linked to threatening activity. Onecan also be more sophisticated, specifying whether the sets are linkedto specific activities. The algorithms use these sets to develop rulesestimating the probability that incoming datasets are significant ornot; significant is defined in terms of how the algorithm was trained(linked to terror, linked to specific attacks, etc.). The rules thus gen-erated are inserted into new agents to analyze incoming data.
Importantly—and here is where learning comes intoplay—statistical training also takes place using actual observationaldata, analysis histories, and analysts’ reports. Thus, as certain activi-ties are found to actually be related to planned attacks, data relatingto those activities are fed to the training algorithms as “significant.”Similarly, as certain unusual activities are found to be ordinary, re-lated data are fed to the training algorithms as “not significant.” Suchlearning can dramatically increase an ASAP system’s effectiveness overtime. Note, however, that automated learning largely refines existingdetection tests; it does not create entirely new ones.
Manual Adaptation Processes. Any analysis system faces theproblem of fighting the last war, in terms of what information isanalyzed and what assumptions are used in the analyses. In ASAP sys-tems, the problem is somewhat mitigated through the use of second- 11 Although the agents would employ data-mining algorithms to filter data and match themto patterns, we reiterate that ASAP systems would not perform unguided data mining in thetraditional sense. In conventional data mining, a set of dependent variables (in counterter-rorism, for example, entities that were, or were not, associated with planned attacks) and alarge set of independent variables (other characteristics about the entities) are fed into analgorithm, which must develop, with no further information, a set of rules that tend to associ-ate independent variables with the dependent variables (e.g., terrorists tend to have certaindemographics). ASAP, conversely, builds heavily on the existing knowledge of homelandsecurity-related communities to create and maintain the detectors, patterns and priority rules(especially to create representations of what typical and atypical behavior look like). ASAPsystems may support unguided data mining to discover rules that supplement the profiles,but such unguided data mining is strictly secondary.
60 Out of the Ordinary
order agents and other analysis tools that pick up truly odd behavior,even without a preexisting rule that the behavior constitutes a threat.ASAP’s allowance of multiple, potentially disagreeing filters, tests,and perspectives also helps limit the problem. Nonetheless, the ASAPsystem will still face the problem simply because it makes explicitchoices about what data to collect and what analyses to use.
Thus, it is important to allow those choices to adapt over time.As noted above, automated learning systems can refine the ASAP sys-tem’s operations but cannot truly modify them. Manual adaptationprocesses that incorporate human learning and insight have that ca-pability. A major feature of any ASAP implementation, then, is thatmodifying the system must be easy.
Two kinds of modification require system support. The first ismodification of the types of data collected by the system, which re-quires both technical and process flexibility. On the technical side,the virtual machine–distributed agent architecture presented in thisreport is intended to isolate and cushion an ASAP system’s function-ality from particular data sources and formats. This should aid in therapid introduction of new sources and data streams and should allowrapid redirection of data in a transparent fashion. On the process side,the organization that supports the ASAP system would need to haveprocedures in place to allow requests for new types and sources ofdata to be incorporated quickly. These procedures include
• a current and accessible catalog of the available major datasources and types. The catalog would include a contact list re-garding where data access and modification requests should besubmitted.
• standardized review and approval processes for data-additionand modification requests that would ensure that the request is(1) justified, (2) feasible, and (3) performed in compliance withsecurity and privacy requirements
• in-place procedures for auditing and filtering the data exchangedwith an ASAP system to ensure that it meets security and pri-vacy requirements. Such procedures are especially importantwhen sharing information outside of U.S. government sys-

The ASAP Architecture 61
tems—for example, exchanges between U.S. government andlocal authorities, foreign governments, and nongovernmentalorganizations.
The second class comprises changes to analysis tests performedwithin ASAP. Again, technical and process flexibility are required.On the process side, it needs to be easy for analysts to modify existingtest agents and code new ones. On the technical side, it needs to beeasy for administrators to review, validate, and approve proposedanalysis changes in a timely manner.
Periodic Environmental Reviews. Even manual adaptation proc-esses are insufficient defenses against the fighting-the-last-war prob-lem because the changes requested on an operational basis tend to benatural extensions of the data currently collected and the analyses cur-rently performed. To ensure “revolutionary” adaptations, an ASAPsystem would need processes to help identify those adaptations.
A periodic environmental review is one such process. In thesereviews, panels of analysts, system customers, field agents and otherinformation providers, and outside advisors (a security-cleared advi-sory group, for example) would be asked to
• scan the environment for major potential changes, with an em-phasis on potentially emerging threats (e.g., “what aren’t welooking at that might hurt us?”) and the types of indicative sig-nals those emerging threats might generate
• develop a list of information needs that would help monitor po-tential changes effectively
• evaluate how well those needs are being met with the currentportfolio of data sources and analyses
• identify and develop sources of information and analysis neededto meet the needs.
The schedule, composition, and exact policies used in the reviewprocess would depend on the specifics of the ASAP system and theinformation providers, analysts, and clients using the system. Beyondperiod review processes, it would also be important to have in place

62 Out of the Ordinary
some sort of standing review committee that could address proposalsfor major time-critical system changes.
Roles of Human Analysts and Automated Agents
As noted in the introduction, we envision the ASAP architecture asproviding a valuable tool to analysts. It should in no way be seen as asubstitute for human analysis. Instead, the automated components ofASAP would complement what humans do well and would provide aset of activities well suited to computers but poorly suited to humans:
• It would detect out-of-the-ordinary signals currently buried inthe mountains of intelligence information collected everyday—signals that human analysts cannot possibly review ontheir own.
• The system would find links between pieces of data in themountains of information, a task that is even more difficult thanreviewing each piece individually.
• By detecting significant trends over time, the system would helpmitigate the “boiled frog syndrome” (the urban legend that aslowly heated frog will allow itself to be boiled alive) in whichhumans ignore changes that happen slowly but become very im-portant over time.
• By detecting out-of-the-ordinary behavior that does not neces-sarily fit into patterns of previous attacks, the system can poten-tially detect entirely new threats. This helps avoid the fighting-the-last-war problem in which humans filter information spe-cifically for indicators of previous events, ignoring signals of newthreats.
• Finally, an ASAP system makes it much easier for analysts tofollow up on detected out-of-the-ordinary behavior. The systemautomatically provides the analysts with a complete historicaltrace of all the data leading to the detection. It also provideslinks to those who collected or analyzed the data, facilitatingcollaboration.

The ASAP Architecture 63
Although there is a great deal of automation and support for theanalyst, ASAP is just that: it is only a complement to the innate andintuitive skills the human analyst brings. Whether actively engaged inall aspects of ASAP or a casual user, the analyst would continue tohave the essential role in an ASAP system. The automated agents cantell an analyst what signals are out of the ordinary, but they cannotsay what the signals really mean. It is up to the analysts, with theirunquantifiable but critical knowledge (personalities, organizationaltraits, third- and fourth-order influences on how organizations work,etc.) and their analytic insights, to provide understanding. The ana-lysts would be the source of the definitions of what constitutes out-of-the-ordinary behavior to begin with. They would have the primaryresponsibility for determining the meaning of unusual phenomenaand what actions should be taken in response. Consequently, the en-tire process would be dynamically controlled based on analysts’ re-quests and commands.
No one would expect analysts to significantly change how theydo business just to adopt a new semiautomated tool. However, thereis bound to be an initial adjustment period for analysts as they useASAP—primarily in terms of the analytic processes underpinning thesystem. Analysts would first need to consciously apply the basic con-cepts of systematically searching for the out of the ordinary and thendetermine what the discovered unusual information means, ratherthan looking for data that fall into particular categories. The analogyhere is that ASAP systems analysts need to adopt the approach ofSherlock Holmes, who emphasized looking for “anything out of theordinary routine of life.”
Because ASAP supports collaborative work and its results are su-perior with collaboration, this process may introduce opportunitiesfor new business practices or workflows. For example, as analysts seekto understand the meaning of reported dots and search for relatedinformation, they may often need to work with their colleagues to getthe information and understanding they need.
Finally, the analytic organization would need to accept and re-ward risk-taking. Managers need to reward any significant contribu-

64 Out of the Ordinary
tions to the knowledge bases underlying the ASAP system, even if thecontributions represent “failures” (following up on dots that turn outto be routine). In many cases, ruling out dots can be just as importantas finding potential threats and can have added value if the reasonsfor dot exclusion are codified in the system. Thus, managers need tosupport a philosophy of “99 failures are acceptable as long as theyproduce one major success,” assuming that the analysts are makinggood, honest, and reasonable efforts.
It is also important to have processes in place for learning fromboth successes and failures in connecting the dots. In addition toimproving their system effectiveness in general, terrorist organizationshave frequently carried out denial and deception operations againstintelligence networks, and we can expect that they will attempt tomake their real operations look ordinary while planting false “dots.”However, both types of concealment require their own sets of out-of-the-ordinary activities. It is our belief that, through effective learningprocesses, ASAP can adapt to pick up unusual behavior indicatingdenial and deception.
65
CHAPTER FOUR
Finding the Dots
This chapter considers techniques for identifying which data objectsare dots worth further investigation. Figure 4.1 shows the area of theASAP schema on which the chapter focuses—the identification of thedots and the initial determination of what actions to take with thenewly discovered dots.
Finding Dots with Rules
In general, we identify out-of-the-ordinary activities—the dots—byseeing if they meet some set of criteria, or rules. The rules fall intoseveral categories.
• Single-point analysis. These rules apply to single data elements.For example, a rule might be to identify individual funds trans-actions greater than $10,000. (Continuing the discussion of datarepresentations from Chapter Three, a single transaction wouldbe an element of an object representing a general family oftransactions—“Funds from Don,” for example.)
• Trend analysis. These rules apply to a set of data elements track-ing a phenomenon over time, called a trace. For example, a rulemight be to detect changes in transfer volume greater than

66 Out of the Ordinary
Figure 4.1Identification and Initial Processing of the Dots
Externalnetworks
ASAPnetwork
Tactical networkcontrol
Informationpool gets
data, sends filter changes
Respond to findings and requests(direct tasks and changes to analysis parameters)
Analystsreview
Information pool sends data,receives initial and follow-up queries
Processor sends instructions, receives test results
Feedback (to all parts of network)
Processor sendsprioritized
results, receivesanalysts‘requests
Analysisresults
andanalysts‘requestsObservational data
Analysis histories
Informationpool
$
Gatherinformation
Process results
Find dots(unusual
data/datasets)
Link dotsand data
Generateand test
hypotheses
Informationon watched
entities
RANDMG126-4.1
50 percent. (Note that each trace has its own parent data ob-ject.)
• Multipoint analysis. These rules apply to a group of linked dataobjects and elements. For example, a rule might be to highlightrelationships in which more than three people receive fundsfrom the same person.
The sample rules above are static or generic rules—they applyequally to all data objects and elements in an ASAP system. However,such generic rules are of limited value. Given the huge amount of in-formation in intelligence networks, generic rules will likely eitherproduce huge numbers of false positives (if the rules are liberal) ormiss critical signals (if the rules are strict). Analysts will need to in-

Finding the Dots 67
crease the discrimination of dot-finding rules if they are to be effec-tive.
As Alfred Rolington, Managing Director of Jane’s InformationGroup, points out, the key to finding critical pieces of intelligenceinformation is to use the context of the information.1 We definecontext in accordance with Webster’s Collegiate Dictionary: “the inter-related conditions in which something exists or occurs; [its] environ-ment; setting.” More specifically for our purposes in improvingdot-finding rules, the context for a piece of information is a set ofcontextual relationships that link specifically to that datum. These rela-tionships jointly interact with the datum by changing the default ruleson how that entity should be regarded—making a seemingly routineobservation much more significant than it would normally be, forexample. Incorporating contextual relationships in dot-finding rulesyields contextual rules.
Representing Context
A contextual rule first determines whether a data element’s attributesmeet a special set of criteria; if so, the rule applies a special set of cri-teria to that observation. For example, suppose Alice attempts toboard a flight for nefarious purposes. She triggers some generic airlineprofiling rules, but weakly—buying a one-way ticket right before theflight, for example—but would likely board the flight successfully.However, suppose Alice was checked against an ASAP database sup-porting contextual rules and found to have asked questions in terror-ist-frequented chat rooms about how to make and conceal explosivesin clothing. Alice’s attempt to board becomes much more unusual,and she would likely be held for questioning.
Contextual information is a critical booster of the power ofthreat assessment networks. It serves as a signal booster, helping iden-tify people, places, and things that should be investigated, even if they 1 Alfred Rolington, “9/11: In Search of Context and Meaning,” Jane’s International SecurityNews, September 11, 2002.

68 Out of the Ordinary
do not register with the cruder, generic pattern testers. It also greatlyreduces the number of false positives.
It is important that the implementation of contextual rules bedynamic, allowing this signal boosting to occur as the environmentchanges or as we learn more about the environment. Thus, discoveryof one important dot triggers a cascade of other rules to find other,related dots. Implementing new rules is a primary mechanism for car-rying out backsweeping, as well as for changing the criteria for scan-ning incoming data. For example, suppose that Alice was searchedprior to boarding the plane and that her clothes were filled with ex-plosives after all. This discovery would establish a new set of contex-tual rules: Any data observation related to Alice has high priority.
Dimensions of Context
To build contextual rules, we need a basic grammar of types ofknowledge that will be put into the rules. We call these types ofknowledge dimensions of context. These dimensions include tacticalcomponents of a terror attack (as with Alice’s explosive clothing),strategic components of a terror attack or terror organization, andtimes and events that have meaning for a terrorist organization. Thedimensions also describe ordinary behavior in key areas such asHAZMAT handling and international shipping.
Times, Events, and Behavioral Life Cycles
Time is an important variable for finding special-case rules. For ex-ample, changes in time of year make certain types of targets more orless valuable; similarly, different organizations might prefer to strikeon particular dates or at particular events. Such knowledge makes ob-servations related to those times and events particularly important.
Beyond particular known times and events, organized behaviorsculminating in a major event (such as a terror attack) follow a fairlystandard life cycle having several distinct phases. Analysts can signifi-cantly refine their searches for dots by understanding where in the lifecycle a planned attack is and looking for data elements representative

Finding the Dots 69
of that life-cycle phase. Figure 4.2 shows a typical life cycle of a terrorattack, roughly graphing organizational activity by time.
Table 4.1 describes each of these phases and some correspondingcontextual rules in more detail.
Structures of Tactical Behavior
Terror attacks have common structures, depending on the type of theattack. These structures can be exploited, creating special-case rules todetermine whether observed behavior is consistent with attack prepa-rations. In particular, we can create profiles describing the activitiesneeded to carry out different types of attacks and when those activi-ties might occur (referenced by whether they are initial,developing, operating, or pre-event activities). The contextual ruleswould then search for people carrying out those activities,emphasizing groups of people carrying out multiple activities fittingthe profile.
Figure 4.2Levels of Activity During the Life Cycle of a Terror Attack
RANDMG126-4.2
Pre-eventOperatingDevelopingInitial Post-event
F (t )
t
Major impulse(e.g., terror
attack)

70 Out of the Ordinary
Table 4.1Contextual Rules Corresponding to Activity Life-Cycle Phases
Phase Example Contextual Rules
Initial: High-level planning ofterror attacks, usually at over-seas “summits”
Following meeting, people linked to terror groupmay suddenly move to a common destination;people are likely involved in a planned attack,and common destination is a likely target or stag-ing area.
Summit attendees likely have some involvementin terror attacks.
Developing: Establishing ofattack infrastructure, such asbasing attack leaders in theU.S., providing them withcovers, and setting up trainingand acquisition programs
New arrivals in U.S following an initial phase andthose who seek out-of-the-ordinary jobs (espe-cially related to attacks—HAZMAT, etc.) or whotry especially hard to hide their existence may beinvolved in a terror attack
Operating: Actual training,material gathering, and mate-rial preparation for a terrorattack
Same as above—continue monitoring people whoarrived following initial terror phase and theirjobs and training
Examine contacts of unusual persons, especiallynew arrivals
Search for persons casing targets or means ofattack (people making studies/videotapes ofbuildings, airports, and the people in them thatare more detailed than usual)
Look for behavior symbolizing concealment (e.g.,carrying around large numbers of cell phones andpagers, using cell phones exactly once beforediscarding them)
Pre-Event: Final preparationsfor terror attack
Look for major movements by suspected personsor anyone linked to a terror organization. Exam-ples include quitting jobs, moving out of apart-ments, and booking remote travel
Searches for casing behavior are particularlyrelevant
Post-Event: Terrorist organiza-tion repositions itself and itsmembers following attack(prepares for follow-up attacks,military confrontations, etc.)
Search for people congratulating each other onthe success of the attacks
Search for people suddenly moving following theattack

Finding the Dots 71
For example, consider a truck bombing. This form of attack re-quires acquiring explosive materials, a truck, a place to construct thebomb, and the training of people to construct the bomb and drive itto its target. It also requires casing a target to a high level of detail, sothat the driver knows exactly how to navigate any defenses. All ofthese activities are subject to detection.
Structures of Strategic and Organizational Behavior
The structure of terrorist organizational behavior and strategy canalso be exploited. In particular, terrorist organizations have internalsupport functions that have to be carried out—internal communica-tions, decisionmaking, recruiting, maintaining morale, and financing.Again, profiles describing the types of activities needed to carry out acommunications web or a financing web can be created and testedagainst system data. Further, these profiles can and should be updatedas more about a terrorist organization is learned. For example, theprofiles describing al Qaeda operations would be much more detailedfollowing months of interviewing detainees at Guantanamo Bay andelsewhere than they would have been initially.
Structures of the Status Quo
Perhaps the most important dimension of context is the status quo.Earlier, we described the use of non-indicative patterns; contextualrules are a primary way of implementing these out-of-the-ordinarypatterns. But we can also create profiles describing how people nor-mally behave in a variety of activities and search for people deviatingfrom those profiles. As noted earlier, of particular interest are groupsof people violating multiple status-quo relationships simultaneously.
As an example of a status-quo pattern, consider what factorsmight go into a status-quo pattern for ocean shipping (directly relatedto the scenario in the prologue):
72 Out of the Ordinary
• Any major increases or decreases in vessel traffic should dependon variances in demand for shipping or other known factors dic-tating large amounts of goods at particular times.
• Shipped items should pass what are known as continuitychecks—items registered for shipping at the point of embarka-tion should arrive at the point of disembarkation, and items ar-riving at the point of disembarkation should have been regis-tered at the point of disembarkation.
• Those organizations and persons most involved with ship-ping—the shipping companies, company executives, ship offi-cers, and even laborers—should have substantial or verifiablehistories with the industry.
Violations of the above factors are curious; multiple, relatedviolations of the above factors (as described in Appendix A for thetuna boats) are clearly worth further investigation. We can createsimilar status-quo profiles for other forms of shipping, as well as forother industries and public activities with a direct relationship to ter-ror attacks (HAZMAT, aircraft, tourism, etc.).
Structures That Disrupt: Dot Noise and Intentional Denialand Deception
We can expect, and have observed, terrorist organizations like alQaeda using denial and deception techniques to attempt to concealplanned terror attacks and other organizational activities. Denial anddeception, which can be thought of as intentionally filling datastreams with bad data and noise, are a serious challenge for any intel-ligence analysis system, including the ASAP architecture. Attentionmust also be paid to false results and noise resulting in dot relation-ships being triggered and transmitted to the human analysts. ASAPwould use the dot recognition and relationship capability in two waysin order to address intentional and unintentional noise.
For unintentional noise, the ASAP recognition and relationshiplogic could be applied to its own output in a second layer of analysis,seeking those dots and links that meet contextual rules for beingnoise. Dots indicated as noise would be filtered off the main ASAP
Finding the Dots 73
system and rerouted to a specific analyst who would be responsiblefor reviewing blocked results. This is a concept similar to email filters.
The intentional efforts at deception and denial could be ad-dressed partially by the ASAP contextual rules. Analysts could createand apply profiles for known techniques to employ denial and decep-tion. It is not possible to catch and detect all instances of denial anddeception, but it should be possible to identify and reduce theamount of noise passing through the system. As with detected dotnoise, any denial and deception items could be routed to a specificindividual (or group of analysts) for review. In terms of intentionaldenial and deception, detected efforts could even strengthen knowl-edge about suspected terror threats.
Consider some examples of what might go into denial and de-tection profiles:
• One might expect false attacks to be talked about loosely(“bragged about”) over channels recognized as being monitoredor when suspects are first interrogated. Conversely, informationabout real attacks, to the extent they must go over insecurechannels, would be talked about very obliquely. For example,suppose a terrorist chat room contains much discussion of theimpending doom to the West brought about by Albert and hiscohorts, with one small side thread talking about Don’s “soccergame.” Clearly, Don and his associates should receive far moreattention.
• Sudden changes in behavior by Don may symbolize a denialeffort. For example, if Don had previously discussed his hatredfor Western civilization frequently in terrorist chat rooms andthen disappeared from the chat room, Don’s disappearancewould qualify as unusual behavior worth investigating.
• Much has been made of terrorist organizations’ use of extrememeasures to avoid electronic communications that can be di-rectly detected or traced by signals intelligence agencies. How-ever, these extreme measures themselves usually create signalsthat can be detected. For example, al Qaeda has routinely beencited as using cell phones and email devices only briefly before

74 Out of the Ordinary
discarding them; detectors can be set to look for people who areroutinely purchasing and discarding expensive cell phones andpagers, or who are carrying large numbers of electronic devices.2
Prior to the hotel bombing in Kenya, for instance, observers sawan SUV with ten cell phones and pagers attached to the dash-board—highly unusual behavior that should have been pickedup.3 Similarly, al Qaeda has been cited as using donkeys andmotorcycles to carry messages between leaders;4 detectors can beset to look for people known to have access to expensive vehicles(SUVs, expensive cars) who are suddenly riding donkeys or mo-torcycles.
Thus, the intentional denial and deception profiles can be usedin two ways. The first is to lower the significance of information thatwould ordinarily be thought of as important but can be put into con-text of being part of a deception effort. As noted above, informationmarked as being “deceptive” would be collected separately and re-viewed by agents and analysts to look for trends in deception efforts(as well as checked to make sure the information really is deceptiverather than genuine), but it would avoid bogging down the mainanalytic processes. The second is to raise the significance of informa-tion that would ordinarily be ignored but that can be put into contextas part of a denial effort to “hide something.” Information marked as“indicating denial” would be treated as worth further investigation. 2 See, for example, “One Year On: The Hunt for al-Qaida,” The Guardian, September 5,2002, p. 6; and John Diamond, “Terror Group’s Messengers Steer Clear of NSA Ears,” USAToday, October 18, 2002, p. A12.3 See, for example, Laurie Goering, “I Shook Hands With Fire: Kenyan Farmer Talked toBomber Minutes Before They Blew Up Hotel,” Chicago Tribune, December 2, 2002, p. 1.4 See, for example, Michael Elliot, “How Al-Qaeda Got Back on the Attack,” Time, October20, 2002.

Finding the Dots 75
High-Dimensionality Detection Agents
The detection agents considered up to now have all been fairly sim-ple, rule-following algorithms. It would be desirable to supplementthese agents with sophisticated statistical algorithms that find investi-gation-worthy datasets based on simultaneously considering a largenumber of fields about those datasets. These algorithms generally in-volve training a complex classifier (such as a neural network) on in-stances of investigation-worthy behavior and instances of normal be-havior, including observations that initially seemed suspicious butended up being routine. The result could be a classifier that can de-tect truly out-of-the-ordinary datasets using rules based on combiningcomplex interactions among data fields—interactions too compli-cated for a human analyst to develop.5 (One complication with thesealgorithms, however, is how we can make their rules context-dependent when they cannot be understood easily. One approachmight be to dynamically retrain the algorithms as new data come in,emphasizing the importance of contextually important informationwhile reducing the importance of older observations.) We believe thatboth these complex algorithms and the simpler, rule-based algorithmshave a valuable place in ASAP. 5 DARPA’s Wargaming the Asymmetric Environment (WAE) program, for example, is de-veloping complex models to predict the behavior of terrorist groups and individual terrorists.See DARPA Information Awareness Office (2003d).


77
CHAPTER FIVE
Connecting the Dots
This chapter considers techniques for identifying links between thedots and other, related data previously overlooked. Figure 5.1 showsthe area of the ASAP schema on which the chapter focuses—the dis-covery of relationships that provide additional context to the dots.
Connecting the dots is the purview of linking agents in the ASAParchitecture. The linking agents would find two types of connections:similarity connections and complementary connections.
Similarity Connections
Similarity connections link information elements that describe mul-tiple occurrences of identical (or nearly identical) phenomena. InFigure 5.2, the fact that the three people are each helping to plan thesame attack is an example of a similarity relationship.
In the prologue, the appearance of new tuna boats in severalharbors is another example of a similarity relationship. In threatanalysis, similarity connections are primarily signal boosters indicat-ing that certain information (i.e., the tuna boats) should take onmore importance to analysts. They tend to be particularly relevant tonon-indicative patterns because duplication of the same out-of-the-ordinary event implies that those events are not random occurrences.

78 Out of the Ordinary
Figure 5.1Finding Relationships Between the Dots
Externalnetworks
ASAPnetwork
Tactical networkcontrol
Informationpool gets
data, sends filter changes
Respond to findings and requests(direct tasks and changes to analysis parameters)
Analystsreview
Information pool sends data,receives initial and follow-up queries
Processor sends instructions, receives test results
Feedback (to all parts of network)
Processor sendsprioritized
results, receivesanalysts‘requests
Analysisresults
andanalysts‘requestsObservational data
Analysis histories
Informationpool
$
Gatherinformation
Process results
Find dots(unusual
data/datasets)
Link dotsand data
Generateand test
hypotheses
Informationon watched
entities
RANDMG126-5.1
Figure 5.2An Example Similarity Relationship
RANDMG126-5.2
Person:Alice
Person:Carol
Person:Bob
Planned attack
Planners
1 32

Connecting the Dots 79
To search for similarity connections, one looks for observationshaving features similar to those of an out-of-the-ordinary event. Inthe tuna scenario in Appendix A, an analyst might note that the sud-den surge of tuna boat activity—without a commensurate increase indemand for tuna—is outside standard behavior. A second-order rela-tionship agent (initially described in Chapter Three) would searchother databases for similar observations pertaining to unexplainedsurges in any of the following:
• business activities claiming to be related to tuna catching, proc-essing, or shipping
• tuna boat traffic• shipping traffic seemingly unrelated to demand• creation of port-side commercial organizations whose purpose is
different from businesses typically found in the harbor, espe-cially if the businesses seem unrelated to any demand in the area.
The technical aspects of searching are straightforward; decidingwhat constitutes “similar” often is not. Analysts will need to be crea-tive in deriving similarity relationships. In the above example, we cre-ated similarity relationships by looking at both the topic of the un-usual behavior (tuna, and more generally, international shipping) andthe nature of the unusual behavior (significant commercial activitylacking any demand justification).
For finer-grain behavior, one can look for repeated trends in ob-servations. A common example from the intelligence community isthat major increases in chatter (number of communications sessions)between different groups of a terrorist organization presage a majorattack.1 Here, a second-order relationship agent would search forsimilar increases in chatter in other parts of the world. 1 See, for example, Dan Eggen and Glenn Kessler, “Signs of Terror Said to Increase; Offi-cials Say Tape, ‘Chatter’ Indicate Plans for Attacks,” Washington Post, November 14, 2002,p. A1. The sudden drop-off of chatter can also indicate a pending attack. See, for example,James Risen, “US Increased Alert on Evidence Qaeda Was Planning Two Attacks,” NewYork Times, February 14, 2003.

80 Out of the Ordinary
Complementary Connections
Complementary connections link information elements that describedifferent aspects of a single, larger phenomenon (or potential phe-nomenon). In Figure 5.3, two of the “attack participants” have beenlinked with owning a weapon—in this case, a car bomb. The linkingof people with an attack mechanism is an example of a complemen-tary connection.
In the scenario in the prologue (see also Appendix A), we dis-cover that some of the tuna boat captains were linked to countrieswith terrorist enclaves; this is an example of a complementary rela-tionship, as is the discovery that the tuna boat captains’ corporate re-lationships have nothing to do with fishing, forestry, or furnituremanufacturing.
Figure 5.3An Example Complementary Relationship
RANDMG126-5.3
Person:Alice
Person:Carol
Person:Bob
Planned attack
Planners
Weapon:Car bomb
Owners
1 32
1 2

Connecting the Dots 81
In threat analysis, complementary connections primarily provide de-tail—fleshing out the importance of information previously flaggedas significant. Similarity connections help indicate which “who, what,when, and where” are significant; the complementary connectionshelp provide the “why and how” of their significance, as well as howthe “who, what, when, and where” fit together into a coherent story.
First-order complementary connections, in which one entity is di-rectly linked to another entity through a single piece of data (e.g.,Alice owning a particular car) are comparatively easy to find. As anobservation enters the network a tracking tool might scan the obser-vation’s fields, looking for anything matching fields already associatedwith data objects. For example, suppose Alice’s car is input to the sys-tem as being an “unusual vehicle”; scanning the car’s registrationwould create a link from the unusual vehicle observation to both Al-ice and her car.
Indeed, besides identifying relationships between dots, first-order relationship agents have a more fundamental role in the ASAParchitecture. They link incoming observations to all applicable enti-ties (and their data objects), which allows the application of the con-textual rules described in Chapter Four.
To make more-sophisticated inferences, one needs to identifysecond-order complementary connections. These connections describehow a sequence of links identifies a previously hidden relationshipbetween two entities. For example, one might identify the fact thatDon funds Bob’s terror-related activities by tracking Don leavingfunds in a particular bank account, the bank account being accessedby Alice and funds being transferred to a second savings account(Carol’s), which in turn makes payments to a corporation known tobe a shell company for Bob’s activities.
We expect that recognizing second-order connections would bea result of automated and human analysis, with computers siftinglarge databases to create the simpler connections and people piecingtogether more-detailed relationships when given a set of linked dataresulting from their queries. The key for system designers would be to

82 Out of the Ordinary
assign relationship-building tasks that leverage people and machinesappropriately, playing to their unique strengths.

83
CHAPTER SIX
Understanding the Dots: Generating and TestingHypotheses
This chapter considers techniques for understanding the significanceof the connected dots by generating and testing hypotheses aboutthem. Figure 6.1 shows the area of the ASAP schema on which thechapter focuses—the discovery of relationships that provide addi-tional context to the dots.
Generating Hypotheses
Once dots have been identified and linked, the next step is to comeup with some indication of the significance of the linked dots. Thiswould be done via hypothesis agents that match the dots to patterns;dots matching the pattern are a pattern instance. In the context of thismonograph, we define pattern and pattern instance as follows:
A pattern is a test to determine whether a linked dataset meetscertain criteria; datasets meeting the criteria are pattern instancesand are labeled as having a certain meaning for analysts. In par-ticular, the existence of a pattern instance gives rise either toan indication of potential behavior (increase in certainty) or tothe discounting of previously hypothesized behavior (increase inuncertainty).
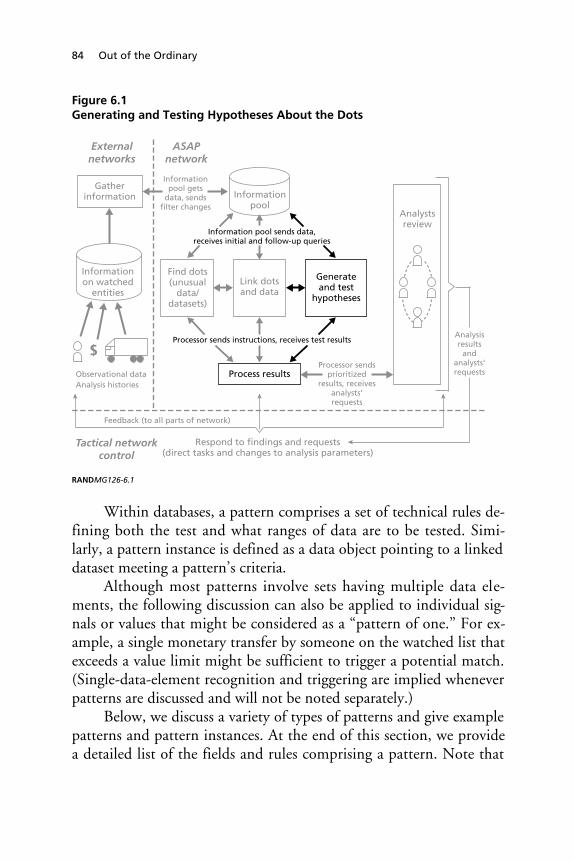
84 Out of the Ordinary
Figure 6.1Generating and Testing Hypotheses About the Dots
Externalnetworks
ASAPnetwork
Tactical networkcontrol
Informationpool gets
data, sends filter changes
Respond to findings and requests(direct tasks and changes to analysis parameters)
Analystsreview
Information pool sends data,receives initial and follow-up queries
Processor sends instructions, receives test results
Feedback (to all parts of network)
Processor sendsprioritized
results, receivesanalysts‘requests
Analysisresults
andanalysts‘requestsObservational data
Analysis histories
Informationpool
$
Gatherinformation
Process results
Find dots(unusual
data/datasets)
Link dotsand data
Generateand test
hypotheses
Informationon watched
entities
RANDMG126-6.1
Within databases, a pattern comprises a set of technical rules de-fining both the test and what ranges of data are to be tested. Simi-larly, a pattern instance is defined as a data object pointing to a linkeddataset meeting a pattern’s criteria.
Although most patterns involve sets having multiple data ele-ments, the following discussion can also be applied to individual sig-nals or values that might be considered as a “pattern of one.” For ex-ample, a single monetary transfer by someone on the watched list thatexceeds a value limit might be sufficient to trigger a potential match.(Single-data-element recognition and triggering are implied wheneverpatterns are discussed and will not be noted separately.)
Below, we discuss a variety of types of patterns and give examplepatterns and pattern instances. At the end of this section, we providea detailed list of the fields and rules comprising a pattern. Note that
Understanding the Dots: Generating and Testing Hypotheses 85
the examples below are somewhat simplistic and for the most partshow straightforward pattern matches. In practice, pattern matchingis a complex and active field of research, especially on the messy, in-complete, and uncertain data that would face real-world ASAP sys-tems. In particular, although it might be easy to declare a straightfor-ward “match” in theory, in reality one must make do with partialmatches. How to calculate partial matches and what levels of partialwarrant analysts’ attention in different situations are important ques-tions for research.
A First Pattern-Characterizing Dimension: Indicative andNon-Indicative Patterns
Patterns can be characterized along several different dimensions. Thefirst is whether they are indicative or non-indicative.
Indicative Patterns. An indicative pattern is associated with adeterminate hypothesis of current or future behavior. Such a patternis found by finding data that meet a set of criteria. Figure 6.2 shows ageneral pattern designed to identify people potentially planning anexplosives attack on behalf of a terror organization. Here, the patterncontains a general template describing certain types of data elementsand links between those elements, the ranges of data to be tested foreach element, and a rule determining what datasets meet the template“sufficiently.” The figure also shows a specific instance of data flaggedas meeting the pattern; in this case, the key criterion is having a datapath that connects a terror organization to an explosives precursorpurchase.
Similarly, in the post-9/11 context, we might expect that a pat-tern indicating a potential aviation-related attack might be “people onany watch list without any previous airline experience attending flightschools to learn how to pilot passenger jets,” or even a more general“people on a terrorist watch list attending flight schools.”
Indicative patterns offer the power of specificity because theyindicate detailed behavior. However, as noted in our earlier discus-sions of pattern-matching, their specificity is also a weakness. For ex-ample, heuristics agents for patterns similar to the 9/11 pattern would

86 Out of the Ordinary
Figure 6.2An Indicative Pattern and a Corresponding Instance
Pattern Pattern instance
RANDMG126-6.2
Pattern-matching rule:One path of connected data from Terror organization to Purchasing of explosives precursors is present
Purchasing of explosives precursors[Records of purchases showing
purchaser and bank account/credit card]
Purchasing of explosives precursors:ZCDFE used to purchase 5 tons of
ammonium nitrate
Suspect person[List of people
affiliated with terrororganizations, with
their aliases]
Suspect account[List of accounts
associated with terrororganizations plus
individual members]
Suspect person:Alice is
memberof CCOU$
Suspect account:Alice hasaccountZCDFE
Terror organization[List of terror organizations]
Terror organization:Committee to Cash Out the U.$.
fail to detect people engaged in the majority of other types of terroristattacks that might involve any large transportation vehicle (air-,ground-, or water-based).
Non-Indicative Patterns. Conversely, a non-indicative pattern isassociated with an indeterminate hypothesis of “this behavior is worthinvestigating further, with some degree of priority.” Associated withthe negation of previous expectations of behavior, these patterns char-acterize just how unusual the out-of-the-ordinary dots are. Whilethese patterns, by definition, provide much weaker hypotheses thanindicative patterns, they do apply to a much wider range of potentialthreats than indicative patterns do.
Non-indicative pattern instances are found by searching for dataviolating a set of criteria, where the criteria normally represent a spe-cific status quo in a certain area. Figure 6.3 shows a non-indicativepattern searching for people highly unlikely to be pursuing training asHAZMAT truck drivers; in addition to specifying a match for un-usual data, the pattern’s rules also define how unusual the data are

Understanding the Dots: Generating and Testing Hypotheses 87
(here, based on the number of “unlikely” people applying for aHAZMAT training class). The figure also describes a “highly un-usual” corresponding instance.
The degree to which such violating data are considered signifi-cant depends on how much the data violate the status-quo criteria,with the goal of separating statistical noise from true outliers. Thus,we would be sensitive to multiple entities making the same status-quoviolation, for example. The data in Figure 6.3 might be consideredespecially significant because multiple people from a variety of back-grounds are suddenly taking different jobs.
We would also be sensitive to the same entities engaged in mul-tiple violations of status-quo behavior. In Figure 6.3, should Aliceand Bob suddenly close out their bank accounts and book one-wayoverseas travel to a country recognized as being “unsafe” by the U.S.
Figure 6.3A Non-Indicative Pattern and a Corresponding Instance
Pattern Pattern instance
HAZMATtrucking applicants—
previous training
[1. List of typical training—related to trucking and/or HAZMAT]
[2. General training fields considered unrelated]
HAZMAT trucking applicants [list ofschool applicants]
HAZMAT trucking training:Central HAZ School
HAZMAT truckingtraining [list of
training schools]
HAZMATapplicant:
Bob applies to Central
HAZMATapplicant:
Alice applies to Central
Previousexperience:
doctor
Previousexperience:
civil engineer
Previoustraining:medicine
Previoustraining: civilengineering
RANDMG126-6.3
Pattern-matching rule:• Unusual if one applicant has no typical previous employment or training
• Highly unusual if multiple applications have no typical employment of training plus unrelated career/training
HAZMAT trucking applicants—previous experience
[1. List of typical previous jobs— related to trucking and/or HAZMAT]
[2. General career fields considered unrelated]

88 Out of the Ordinary
State Department, the relative significance of the data would increaseeven more.
In Chapter Four, we mentioned the development of profiles de-scribing status-quo behavior, actions, and status in different areas.More precisely, hypothesis agents would compare incoming dots withdigital representations of the profiles, analyzing deviations to findnon-indicative instances.
In general, the analyst would be interested—through additionaldata collection and analysis—in determining the meaning (thespecific indicated behavior) of what is initially a non-indicative pat-tern instance. As noted, reaching detailed conclusions about what adataset means is the responsibility of the analyst. However, in somecases, it is possible to discover a great deal of meaning through auto-mated techniques. The most common way of doing this is to link anentity in a non-indicative instance to another entity that strongly in-dicates a particular type of attack. The data in Figure 6.3, for exam-ple, contain an initial hint at meaning—HAZMAT operations aredirectly related to a variety of terrorist attacks. Should Alice be linkeddirectly to a terrorist organization or be overheard describing a truckbombing, the meaning of the data in the figure would be refined fur-ther. An ASAP system, then, would have indicative and non-indicative hypothesis agents working in concert; non-indicativeagents would flag “worth investigating” datasets, and indicative agentswould scour those datasets for potential matches with indicative pat-terns.
A Second Pattern-Characterizing Dimension: Tests on Data,Metadata, and Reports
At the beginning of Chapter Three, we noted that the ASAP architec-ture works at three separate levels: review of observational data, re-view of analysts’ behavior with respect to the observational data (whatdata are queried, what tests are performed, etc.), and review of ana-lysts’ reports about the data. Patterns can next be characterized withregard to these levels. Consequently, we have data patterns, metadatapatterns, and report patterns.
Understanding the Dots: Generating and Testing Hypotheses 89
Data Patterns. These patterns are tested directly against the col-lected, elemental data traces. The indicative and non-indicative pat-terns in the previous section were all data patterns.
Metadata Patterns. These patterns are tested against the meta-data, or data about data, of the collected data. Metadata patterns in-corporate information on which agency organizations are collectingor analyzing certain types of data, when, and why. The same dichot-omy of indicative and non-indicative patterns that applies for regulardata also applies for metadata.
Indicative Metadata Patterns. In terms of metadata, an indica-tive pattern usually seeks to identify two or more groups that areanalyzing the same data, or similar sets of data.1 The fact that two ormore groups are looking at similar data implies that the same datahave significance on multiple but related fronts, and that by collabo-rating, the groups looking at the same data will add to their under-standing of the data. In terms of the types of agents, we usually relyon relationship agents to detect the similar analyses (since the analysesare “connected” by their similar attributes).
Figure 6.4, for example, shows a pattern instance of two or moreagencies studying the same phenomena. Here, Agency 1 and Agency2 both find out that they have been investigating Alice, but for differ-ent reasons; by collaborating, both would discover that Alice has at-tended a terror group summit (reason for Agency 1’s interest in Alice)and is learning HAZMAT trucking (reason for Agency 2’s interest inAlice). Such a discovery has great meaning in terms of whether Aliceand her associates are planning an attack and what type of attack theymight be planning.
Non-Indicative Metadata Patterns. Non-indicative patternsidentify sudden changes in the types of information an agency oragency group is studying. A sudden change in analysis patterns
1 Entities are similar if they share a subset of identical attributes. In the tuna boat example,the various boat captains are similar since they are all piloting tuna boats that do not carrytuna.

90 Out of the Ordinary
Figure 6.4An Instance of Two Agencies Analyzing the Same Data
RANDMG126-6.4
Terror meetingattendees
HAZMAT truckingstudents
Alice
Agency 1
Agency 2
implies that the agency has learned something or has found some-thing sufficiently unusual to be worth sharing with the widerantiterrorism community.
In Figure 6.5, for example, Agency 1 has suddenly begun ex-amining records of people who have recently taken HAZMATtrucking courses; on further investigation, Agency 1 would reveal thatit had the Alice-Bob dataset shown previously.
As another example, in the post 9/11 context, the FBI usuallydoes not examine students at flight schools and passenger-jet trainingcenters; it might have been useful if the fact that FBI field offices wereexamining such students had been reported to the antiterrorismcommunity.
Finally, metadata used in analysis would not be restricted to thetypes of data in the above examples. Metadata could also be related tothe same analyst and how he is searching and probing; an analystspending a great deal of time trying to search for something or findinformation about someone can be a useful clue. Metadata can incor-porate the number of times a piece of information is used, not neces-sarily what it was used for. The analyst is frequently interested in the

Understanding the Dots: Generating and Testing Hypotheses 91
Figure 6.5An Instance of an Agency Making Out-of-the-Ordinary Data Requests
HAZMAT applicant:Alice applies to Central
Previous experience:doctor
Previous training:medicine
HAZMAT applicant:Bob applies to Central
Previous experience:civil engineer
Previous training:civil engineering
RANDMG126-6.5
Request reason
HAZMAT trucking student records?
HAZMAT trucking training:Central HAZ School
amount and destinations of email traffic out of a specific IP serverrather than the specifics of that traffic.
Report Patterns. These patterns are tested against analysts’ re-ports and notes about the data. These special types of patterns are de-signed to flag analysts’ reports that might otherwise go unnoticed be-cause of organizational and process issues restricting which reports aredistributed and acted upon. (This capability is especially importantgiven that, in this case, our description of analyst is very broad: Ana-lysts are homeland security professionals who write reports aboutwhat they are observing, whether they are official “counterterrorismanalysts” or agents doing investigations in the field.) The same di-chotomy of indicative and non-indicative patterns applies to data re-port patterns.
As discussed in Chapter Three, we do not assume that an ASAPsystem will have the ability to interpret the reports and notes of theanalysts. Thus, the patterns discussed below are based primarily onidentifying key words and phrases within the reviewed reports.

92 Out of the Ordinary
Indicative Report Patterns. For report patterns, indicative pat-terns look for key words that indicate an analyst has discovered a sig-nal that directly suggests a particular type of planned attack or otherterrorist activity. For example, suppose U.S. Customs agents discoveran out-of-the-ordinary shipment of chemicals and write a report iden-tifying the chemicals discovered. An indicative data report agentmight scan that report, looking to see if any of those chemicals wereexplosives or chemical weapons precursors. Other agents might lookfor reports of discovered guns or knives, and so on.
Non-Indicative Report Patterns. For report patterns, non-indicative results patterns look for key words that indicate that theanalyst believes something is out of the ordinary and should be inves-tigated further. For example, one might look for key phrases such as“very unusual,” “don’t like this at all,” “three alarm fire,” “disasterwaiting to happen.” Similarly, we can also look for key phrases thatindicate something is probably ordinary and should not be pursuedfurther, such as “a waste of time” or “why are we still doing this.”
For both types of patterns, one can analyze trends in the reportsas well as individual messages. For example, increases in particulartypes of key phrases might indicate a general state of heightened sus-picions (for non-indicative patterns) or increasing suspicions con-cerning a particular means of attack (for indicative patterns).
Representation of Patterns
To a computer, patterns of all types and categories share certain keyfields and functions. These include
• pattern label/identification• general type of pattern from which the particular pattern is de-
rived• a set of sub-elements, with each element representing a life-cycle
phase of the pattern• mathematical rules to determine whether a dataset and its con-
stituent data elements match or violate the particular sub-elements of the pattern

Understanding the Dots: Generating and Testing Hypotheses 93
• mathematical rules to assess the results of data analyses, to de-termine whether to strengthen or weaken belief in the pattern asa whole
• mathematical rules to assess the results of data analyses, to de-termine when to support transitioning from the current patternphase to a new phase
• links to all data associated with the pattern (including metadata),plus a history of all analyses performed using the pattern.
The representation of a tested pattern to a human would includeall of the above fields and rules (although perhaps not mathematicallydetailed), plus a set of annotations for each field describing the“story” behind the pattern. The story—written in narrative form—isespecially important to human analysts, to help them make sense ofthe current situation, in terms of what the purpose of the tested pat-tern is and what they should be doing in response.
High-Dimensionality Pattern Analysis
The patterns considered above are all fairly simple, human-interpretable templates. Much as we augmented the rule-based detec-tion agents with complex statistical detection agents, it would be de-sirable to supplement these simple patterns with classifiers resultingfrom sophisticated statistical analysis (again, likely a neural network).These classifiers would result from training on datasets associated notjust with “worth investigation” or “not worth investigation” but withcharacteristics describing different kind of asymmetric attacks or ter-rorist operations. The result could be a classifier capable of generatingvalid hypotheses from data whose meaning is unclear to human ana-lysts. We believe that both these complex classifiers and the simpler,human-interpretable templates have an important place in ASAP.
Testing Hypotheses
Pattern instances—and the hypotheses we associate with them—aresubject to great uncertainty, which must be recognized and addressed

94 Out of the Ordinary
explicitly. The costs of not doing so can be quite high. Consider, forinstance, the “Beltway sniper” case. Until the day the shooting sus-pects were caught, authorities and the media were searching for awhite commercial vehicle—either a white box truck, a white van withladder racks, or a white minivan with ladder racks. This led to wide-spread dragnets of white commercial vehicles, all of which failed toproduce arrests. Still, the hypothesis that the snipers were driving awhite commercial vehicle was treated as fact. The suspects were fi-nally apprehended driving a dark blue Chevrolet Caprice—on thebasis of information entirely unrelated to witness vehicle reports.2
It would have been more productive to treat the white commer-cial vehicle hypothesis explicitly as a hypothesis. In doing so, analystswould have stated the hypothesis, as well as the evidence for it (eye-witness reports from a distance; vehicle drivers at shooting scenesusually did not come forward to dispute claims that they were thesnipers) and evidence against it (no eyewitness saw shooters in thevehicle; white commercial vehicles are more noticeable than cars, sothe possibility for mistaking where a shot came from is pronounced,especially after people started looking for white vehicles; eyewitnessesreported multiple kinds of white vehicles). Analysts would also havedeveloped tests that would help confirm or disconfirm the hypothesis(continued failure to find suspects in a white vehicle should havehelped disconfirm the hypothesis). Finally, they would have identi-fied alternative hypotheses (in this case, a dark-colored Chevrolet Ca-price was an alternative hypothesis because one had been reportedleaving a D.C. shooting scene3). A similar set of tests could have beenapplied to each alternative hypothesis as well (the Chevrolet Caprice’slicense plate was scanned ten times during the shooting spree; al-though details of where the Caprice was scanned have not been made 2 See, for example, Meserve et al., “Two Arrested in Sniper Case,” CNN.com, October 24,2002.3 Ibid.

Understanding the Dots: Generating and Testing Hypotheses 95
public, repeated scannings at checkpoints near crime scenes shouldhave raised suspicions4).
From the above discussion, we can generalize about how tohandle uncertainty in hypotheses associated with pattern instances.We explicitly declare the hypothesis associated with each instance(“people in this group are worth further investigation” for non-indicative instances, for example) and some overall rating of the like-lihood of the hypothesis. This rating does not need to be quantitative;one can use, for example, Neustadt and May’s classic framework(1988) of classifying hypotheses as Known, Presumed, and Un-known. The hypothesis is then associated with evidence for andagainst it, as well as a list of tests that will confirm or disconfirm it.Once these tests have been identified, the ASAP system is modified tolook for observations required by the tests (using contextual rules).Then, as observations are found, the system explicitly revises its like-lihood for the hypothesis based on confirming or disconfirming in-formation. Finally, the hypothesis is associated with alternative hy-potheses, so that as information comes in, the alternatives are propor-tionately strengthened or weakened.
Expected-Results Patterns. The tests identified above areimplemented with the assistance of expected-results patterns. Thisclass of patterns applies to the results of data analyses, metadata analy-ses, and reports analyses over time. They test whether, over time, ob-servations of entities classified as being part of a pattern instance con-firm or disconfirm the hypotheses associated with that instance. Forexample, we might expect that people identified as high risk for par-ticipating in terrorist activities will participate in those activities (or atleast activities that raise additional suspicion). In Figure 6.6, Alice,who has been classified as high risk because she attended a terroristgroup meeting and is learning HAZMAT trucking, validates this hy-pothesis by buying black market plastic explosives.
4 See, for example, Stephen Braun and Mark Fineman, “Sniper Suspects Slipped PastAuthorities Time and Again,” Los Angeles Times, p. A1, November 30, 2002.

96 Out of the Ordinary
Figure 6.6Validating a Hypothesis
RANDMG126-6.6
Terror meetingattendees
HAZMAT truckingstudents
Purchase black-marketplastic explosives
• High-risk activity
Future ”high risk”activities?
Alice
This methodology would have been of use in the Beltway snipercase. It would have noted the stream of negative findings resultingfrom days of searching for white commercial vehicles, and weakenedthe corresponding hypothesis considerably. This weakening wouldhave allowed alternate hypotheses (in the case of the sniper, reports ofa dark-colored Chevrolet Caprice with lights turned off) to emerge.
In terms of types of agents, we use heuristics rule agents to de-tect whether small sets of data elements confirm or disconfirm hy-potheses. For large streams of data, trend agents are appropriate.
Beyond strengthening or weakening particular hypotheses, thegoal of using expected-results analyses is to improve the range andaccuracy of threat assessment over time. We use indicative expected-results patterns to determine whether people and activities classified asbeing high risk really are high risk. Conversely, we use non-indicativeexpected-results patterns to determine whether people and activitiescharacterized as status quo remain “ordinary.”

97
CHAPTER SEVEN
Conclusion
Summary
In this monograph, we have specified a conceptual architecture thatidentifies, links, and attempts to make useful sense from out-of-the-ordinary information potentially related to terrorist activities. Wehave specified the major elements and processes of the architectureand discussed the major techniques that would be used to carry outits functions. We believe several features of this architecture make it aunique contribution toward improving the analysis of intelligenceinformation:
• The overall structure of the architecture specifically models em-pirical research into how proactive and successful problemsolvers connect the dots to detect and mitigate potential threats.
• Much of the architecture focuses on detecting behavior that isout of the ordinary from known status-quo behavior and at-tempting to place that behavior into a threatening context,rather than the detection of behavior fitting particular pre-determined patterns indicating known threats. This results in ahybrid structure in which analysts are largely left to determinethe deep meaning of such out-of-the-ordinary behavior. Thepower of the proposed hybrid structure, however, is that it can detectthreatening activities that are obscured to humans because of large

98 Out of the Ordinary
volumes of data, large dimensionality within the data, and/or de-fining characteristics that have not been seen before.
• The architecture effectively uses context (in the form of contex-tual rules) to account for what is already known about particularthreats or about particular cases of ordinary behavior.
• Even more broadly, the architecture allows for context-dependent analysis processes, in which the analysis activities per-formed at each step depend on what has been learned to date.
In this concluding chapter, we present a research plan to furtherdevelop the framework. We also present a series of recommendationsfor action to bring the architecture from concept to reality.
A Research Plan
In Chapter One, we listed a number of near-term improvements thatwould bring about ASAP architecture–like improvements withoutimplementing the architecture’s automated components. As theshort-term improvements are implemented, research can begin on theautomated portion of ASAP. This portion will be of particular valuein assisting analysts in identifying out-of-the-ordinary signals in theenormous volumes of data generated by intelligence and conventionalcollection systems every day.
There is a growing plethora of smart analytic support tools,many of which could be complementary to ASAP (see Appendix B).Because this is a dynamic tool set, the ASAP development teamwould have to keep track of ongoing and future developments inrelevant technologies, including establishing relationships with poten-tial partners at later stages if warranted.
Specifically, in terms of ASAP development itself, we envision athree-phase effort. The first phase would be to develop a detailed ar-chitectural plan for the ASAP system and its constituent control andanalysis agents. In this phase, architecture-testing scenarios would bedeveloped. The initial architecture would include the detection andconnection logic, as well as virtual machine flow architecture and

Conclusion 99
control logic. The architecture would also provide high-level descrip-tions of detection, linking, and hypothesis agents in such key areas asdirect threat detection, international shipping, and air transportation.The first phase would culminate with a description of how the archi-tecture would address a detailed terror-attack scenario. During thisphase and the subsequent one, ASAP team members would evaluateand establish a baseline for the state of the art in technologies—suchas those described in Chapter Three—that could be used to comple-ment ASAP or implement parts of it. They would also update andmaintain their cognizance over those technologies, adjusting architec-ture designs accordingly. On the nontechnical side, the ASAP teamwould describe managerial and organizational guidelines to help in-corporate ASAP into the work environment. To ensure the accep-tance and success of ASAP, it will be essential to work closely withpotential end-users—the analysts, field professionals (as available),and others who would interact with the system.
In the second phase, formal design specifications for the agents(detector, processing, linking, and hypothesis) would be created.These specifications would define the objects, methods, and majoralgorithms employed by the agents. The duration and effort requiredto execute this phase would depend on the final architecture andagent design.
In the third phase, a prototype system would be developed thatwould include simple examples of the above agents. The prototypewould demonstrate intercepting data, using contextual rules to detectdots. It would use relationship agents to link the dots and use patternmatching/deviation algorithms to generate and test hypotheses. Theprototype would also include the control components needed toachieve dynamic, feedback-based control. This phase would also in-clude the design of test methodologies to validate ASAP’s perform-ance based on known scenarios, “before and after” methodologies,and other appropriate case studies. Once the prototype is complete,construction and implementation of a real-world ASAP system couldcommence, moving the ASAP concept from research to reality. Thescale of the third phase would depend on the results of the earlierphases.

100 Out of the Ordinary
Conclusion: Recommendations for Action
Our recommendations for action effectively summarize the near-termimprovements and research plan we discussed above. We begin withour near-term recommendations. Note that these recommendationsneed very low levels of investment—nothing beyond a few engineers,communications monitors, and a commitment to sharing informa-tion by the initial users. Those providing support functions should beversed in the domain.
We assume that the organization adopting ASAP would deter-mine the necessary level of organizational support and cooperativemechanisms required to implement any or all of the following rec-ommendations for jump-starting ASAP.
• Identify people who understand status-quo activities, and builda library of standardized, brief descriptions of what the statusquo looks like for both watched (potentially threatening) andordinary activities.
• Distribute the status-quo profiles throughout the relevanthomeland security communities of interest.
• Establish online virtual communities allowing intelligence, lawenforcement, and homeland security professionals to share in-sights, using the open and moderated electronic posting boardsand organizational tools discussed in Chapter One.
• Begin efforts to create search engines and simple detectionagents within those virtual communities. These would be linkedwith the early stages of agent and algorithm development pro-jects within the research plan, as discussed below.
• Begin efforts to create automated agents employing sophisticatedstatistical models capable of finding the truly threatening atypi-cal behavior in large volumes of high-dimensionality data.Our longer-term recommendations relate to the development of
the automated portions of the ASAP architecture and correspond tothe implementation of the research plan described above.
Once these projects have been launched, planning for an ASAPsystem implementation project would begin. As discussed in Chapter

Conclusion 101
One, we suggest beginning with a simple system, using first-generation algorithms, within a pilot community within a particularagency. The system would then grow organically over time—addingadditional communities and more powerful agents, algorithms, andtools and capitalizing on the real-world experiences of earlier ASAPsystems.


103
APPENDIX A
Case Study: “The November 9th Incident”
“Round up the Unusual Suspects”(not) Claude Rains, Casablanca
This appendix presents a scenario describing the unfortunateNovember 9th incident. The information flow and actions in thescenario are designed to represent what might actually happen, usingthe current intelligence community as a base.
The first three parts of the appendix describe the lead-up to thesad affair. The first part presents a series of vignettes describing whosees what, who knows what, when they know it, and what they dowith the information in the days before the incident. The second partof the appendix presents a “cleaned-up” version of the events leadingup to the incident. The third part describes a hypothetical media andgovernment post-mortem of the incident, which provides detailedlistings of who knew what pieces of information when, as well as thekey findings of a congressional committee report on the sad affair.
The fourth and fifth parts of this appendix describe how anASAP system might have helped connect the dots prior to November9th. The fourth part describes the information ASAP agents wouldhave detected and flagged as being out of the ordinary; the fifth partdescribes how analysts would have interacted with the system.

104 Out of the Ordinary
Version 1—Initial Case Study of the November 9thIncident
[October 12, 2002] As soon as he heard the news about the bombingin Bali, the Singapore desk analyst at CIA Headquarters near Wash-ington, D.C., Fred “Woody” Johnson, was shocked—it was practi-cally in his backyard (analytically speaking). Given that, he put him-self and colleagues on “heightened alert” for any behaviors, events, oractivities that would fit “classic” terrorist patterns now identified afterSeptember 11, 2001. He also set his current suite of analytical toolsto comb more finely through the data he received, looking for indica-tors of potential terrorist activity (transportation of chemicals or ex-plosives, sightings of known or suspected terrorist individuals, etc.)
In the course of reviewing every piece of official, special, andopen-source reporting from the region since the event, Johnsonfound nothing more interesting beyond reports of two Arabs hauledin for false driver’s licenses and an unattended duffel bag containinghockey equipment and a strange odor at the airport. Nothing highlyunusual came across his “radar screen,” and Johnson soon convincedhimself that everything was “business as usual” on his watch.
The two unrelated driver’s license incidents were reported in aweekly “incident summary” (week of Sept. 23–29) that the local U.S.Embassy got from local police. The students involved had beenpulled over at the Singapore International Airport for driving tooslowly in front of the Saudi Air terminal but never stopping—justcontinually driving past. This was unusual, but the officer figuredthey just didn’t understand how the airport was laid out and weretrying to meet someone. These reports actually predated the Balibombing by two weeks, having taken their sweet time to filter theirway through the “ROUTINE” cable channels and make it to John-son’s inbox. The day following the bombing, the airport securitysweep team had seen the large, heavy, awkward, unmarked duffel bagin the passenger waiting lounge of the Saudi Air terminal andbrought in their K-9 unit. Dutifully doing their job, the dogs whinedat the bag but did not indicate that it contained any explosives ordrugs. Johnson noted the incident and smiled when he thought about

Case Study: “The November 9th Incident” 105
the dogs finding smelly gym socks. Since it came from an interna-tional travel alert for government officials, at least this report hadmade it to his desk less than 24 hours after the incident occurred.
In early August, the Tuna Daily in Seattle announced that itsmain advertising sponsor, the Seattle Flying Fish Shipbuilders, haddelivered the last of a record order for 24 high-speed tuna boats. Theyhad been ordered in February and the customer was rumored to beinterested in another large order. Talk at Hal’s Burger ‘N Beer Barnfocused on who would have placed such an order because the localsknew that none of the Seattle fishing operations had done so—norcould even afford to. The paper said only that the boats had been or-dered by a “wealthy shipping concern registered out of Panama.” Thefishermen were bent out of shape at the potential competition. Tunafishing was a low-margin operation. Their only hope was that U.S.health experts would keep publishing how healthy it was to eat tunaand encourage U.S. and other Western populations to do so.
Since June, an international group of Arab students had beenplanning the fall Arab Student League Forum for students studyingin southwest Asia. These events took place semiannually for Arabstudents to compare notes on experiences adjusting to living as Arabsin Asian cultures. The event, scheduled for November 11, was to behosted by the Arab Student League delegation in Hong Kong. Nowwith the bombing, the group wondered if it was ever going to hap-pen. The planning committee had encountered what it thought wereroadblocks from the local Hong Kong authorities every step of theway. Was this discrimination or merely Chinese socialism and bu-reaucracy at their finest?
In planning the program, the group handed out a survey—withpredictable responses. While racial profiling was nowhere near thehot topic it would have been in Western countries, the students allmentioned an uneasy feeling of “awareness” and many commentedthey were singled out for things such as extra questioning, ID checks,and approvals for routine student activities. During the planning ses-sion on October 20, Harim Mujen, the delegate from Kuala Lumpur,even commented, “Yeah, my parents can’t stand the way I’m singledout here. They think it’s because they’re so wealthy and I might be a

106 Out of the Ordinary
target for kidnapping. I think it’s just the opposite. I’m starting to getfed up with this place. I want to be somewhere where I really belongand can make a difference for something I believe in—like backhome in Syria.” The group came to no consensus, per se, but therewas an unmistakable empathy and bond that grew stronger amongthem. They all agreed to stay in touch regularly by email.
At their monthly International Business Symposium on Friday,October 18, U.S. and British Embassy officials were talking with lo-cal executives from one of the large commercial shipping firms in theSingapore harbor. One executive commented to host State Depart-ment colleague Karen Scott, “I can’t understand why this new com-pany moved in and immediately placed an order for slips for 18 tuna-fishing boats. These guys should understand there isn’t much marketfor tuna processing here. We run a high-class harbour and space is atan incredible premium. Besides, they’re going to totally disrupt ourwell-managed schedule by adding all these new departures and arri-vals. I hope they won’t last long. These guys think since they haveconnections, they can do anything.” Scott noted this would fill outthe remainder of her weekly report and went from the meeting to a“wine and dine” weekend event with her beau. Early the followingweek she sent a ROUTINE cable from her desk back at the Com-merce Section to law enforcement, drug enforcement, maritime, andintelligence agencies. She included State Department Headquarters aswell as field offices on the distribution.
Later that week, on October 22, a small advertisement in theclassified section of the Singapore Times offered: “Union wages, over-time, full benefits, and immediate employment. Paid in cash daily,”for the first 100 laborers to apply for loading and unloading ships inthe harbor. The economics officer at the embassy in Singapore notedthe ad because there had been growing unemployment among blue-collar workers in the city and crime had been rising. He hoped thismight be the indicator that things were turning around economicallyfor this important port city. After sending an email to Scott, thecommercial attaché, he fired off a “Good news on the employmentfront” cable to the State Department and Department of Commerceback in D.C. Many of the workers applying for these jobs were not

Case Study: “The November 9th Incident” 107
Singapore citizens, so he sent copies to appropriate desk officers inthe State Department for the countries that had the highest popula-tion of migrant workers in Singapore—mainly Malaysia and otherPacific Rim countries. He sent a ROUTINE copy to members of theintelligence community with branches concerned with employment,migration, and population trends, including Intelligence and Re-search at the State Department. Since 9/11, he had been told to beextra diligent in reporting any hiring oddities, but he figured no onewould ever see the cable anyway. If every other officer was doing whathe was doing, there must be a big pile of cables back home. At leasthe did what he was supposed to do, so he was covered.
It was October 4 before the local magistrate, Mr. Peekuj, gotaround to reviewing the last month’s [September’s] applications forlocal permits, licenses, and other official approvals. Peekuj was frus-trated by a new tuna importer’s “RUSH-Priority” application for li-censes for 18 tuna boats, as well as for immediate approval to exceednormal weight and cargo limits. It appeared that the applications hadbeen filed in early September—almost a month ago. He’d neverheard of the company making the request, but then he tried not topay a lot of attention to maritime matters. The boats were registeredin Panama. Well, nothing terribly unusual about that. Everyone knewhow easy ship registry was there—and cheap too.
Peekuj was so irritated by this request that he stuffed it into thebottom of his inbox and told his deputy, Mr. Nawram, “Go find outwho these guys are.” Nawram, who was also a recruited asset of thelocal CIA station, called his case officer, Randy May, to explain hecould not make a routine meeting “because I’ve gotta go find outwhat these idiots are doing with 18 tuna boats in our high-classcommercial harbour and why they’re already fussing they don’t havearrangements for immediate docking and sailing. These clowns don’thave any of the appropriate paperwork on file.” The CIA officernoted the peculiarity and included it in his weekly report to head-quarters, including the specific Singapore desk officers at CIA(Woody Johnson), State, and DEA, among others. At least he hadsomething to cable back this week.

108 Out of the Ordinary
At the end of September, the prominent Mujen family of Da-mascus announced they would be closing their business and taking anextended holiday in the Far East to visit family abroad, review somerecent investments, and look for other acquisition opportunities. InKuala Lumpur, Harim Mujen was delighted to learn that his familywould be arriving within ten days to see him. He couldn’t wait to tellthem what life was like as an Arab student in the Far East. Their telexsaid they’d be visiting Singapore and Thailand en route as well. Whatdid he care; he just wanted them to take him home. This was hischance to make his case for returning to “his part of the world.” Per-haps he could convince them to let him finish his studies in SaudiArabia.
The week of October 28 was one of the high points of the yearfor various U.S., British, and other Western diplomats as official rep-resentatives met for a regional conference in Sydney hosted by thedirector of the Australian diplomatic corps, Timothy Smythe. Therespective intelligence and law enforcement services from the regionwere invited as appropriate. Most viewed these events either as a greatexcuse to get out of the office and have some R&R or as a colossalwaste of time, filled with useless meetings and not enough real workdone to take advantage of having such a group assembled. However,this week’s meeting included the American holiday Halloween andeveryone was looking forward to the various high jinks. You neverknew who was joking and who was serious, even among close friends.
During the opening cocktail hour, Smythe commented toTynes, Lupin, and Arden, who was just finishing a round-the-worldtour of new FBI stations overseas, “You guys sure have it easy, I justgot stuck down here trying to figure out why the number of tunaboats coming in and out of here has doubled in August and none ap-pears to be permanently based here. Twenty-four of them. Seemsmost of them showed up over two weeks in mid-to-late August.That’s a large fleet. They look new, but almost every one is requestingcomplete paint jobs and won’t let local contractors do the work.They’re using immigrant labor only. We just wish they’d quit tyingup the slips and bring some long-term business to the area. Theydon’t even seem to have much fishing gear on board. What are these

Case Study: “The November 9th Incident” 109
guys, fools? Not clear if they know tuna from sardines. Gossip is thata spoiled rich kid with oil money is backing it and has some familyconnections in other shipping concerns. Hope they give him somepointers.” The CIA chief of station, Mark Lupin, commented,“Gosh, one of my officers mentioned some hassle with a tuna opera-tion back in Singapore. I thought he was just complaining as usual.”Lupin decided to send a report noting this coincidence when he re-turned to the office on November 4.
Given the recent anniversary of September 11 and vague threatsreported by the FBI and CIA, the Coast Guard had been maintaininga heightened vigilance with respect to ports along the east coast of theUnited States, especially those doing large commercial shipping.During their weekly review with the Maryland Port Authority andrelated services on October 14, the Department of Commerce repre-sentative commented, “This October 1st request bothers me. Whyare we getting Panamanian tuna boats requesting docks and berths inBaltimore, and didn’t a tuna boat company just lease a wharf inPhiladelphia? Normally they go farther south. We haven’t seen anyincreased orders from tuna processors locally and no one seems to beforecasting an increase on such short notice—just the opposite. Theboats seem to be coming from southwest Asia or the Pacific Rim, butwe’re not sure. When we talked to some of the captains on the 11th,the only story we could get from them was that they were using tunaboats to carry teak wood to furniture builders in North Carolina andup the coast. They said they had railroad connections from here onsouth.” A few lines about this were included in the weekly summarythat was submitted October 16.
The October 23 DEA staff meeting at least had some life in itsagenda. DEA officials in Florida noted the October 16 report withinterest at their regular staff meeting because the last two raids theyhad conducted on suspected drug runners resulted in capturing modi-fied tuna boats. But, upon further inspection, DEA had to release theboats that had requested berths in Baltimore because nothing morethan heavy, odd-shaped containers and funny smells could be foundon the boats. The captains, who spoke little English, were clearly an-noyed and got on their radios quickly to others in their fleet.

110 Out of the Ordinary
The next morning, anxious to make a good impression anddemonstrate her irreplaceable value, Susan Mandetti woke the DEAchief of operations at the Key West base before his first cup of coffee.She’d just received her CIA copy of Karen Scott’s report from theembassy in Singapore and could barely sit still: Could there be a con-nection between these two sets of east coast tuna boats and the onesin Scott’s report? Being a CIA officer on detail to another agency surehad its advantages. Maybe her quick eye and quick thinking wouldget her promoted.
Back at CIA Headquarters, Woody Johnson called an October25 meeting with his regional specialist colleagues from around theBeltway. His opening comment to this interagency task force was, “Isure thought we’d see a lot more unusual activity in the region afterthe Bali bombing. I’m worried we’re missing something. There are somany vulnerable targets. I did see several cables about a new ‘Arab-American Friendship League’ starting, as well as a new mosqueopening later this fall. I wonder if these are not fronts for other activi-ties and why is the mosque advertising so many social events foryoung people?” Two colleagues agreed with him and also added,“We’ve noticed an increase in Arab graduate students leaving theiruniversities early and returning home. That seems odd because theseare usually wealthy families with no financial worries about educationand the tradition is to return with a completed graduate degree andbecome a valuable member of a profession. Let’s get INS involvedand see if anything similar is happening in the U.S.”
Several phone calls and emails later, the counterterrorism repre-sentative for INS, Sam Trowl, said he had a few minutes for his col-leagues’ “concerns.” He invited his protégé, Bill Sands, to join himfor the conference call. After hearing their observation and “suspi-cions” he sheepishly replied, “We still don’t know who is actually inthe country studying or if they are at the university they said theywere attending when their visa was granted, so unless it’s avisa/immigration violation, we’re not getting involved.” Bill was notcompletely satisfied with this but didn’t want to say anything in frontof his boss, so he politely said, “I’ll get back to you guys if I see any-thing that will help you.”

Case Study: “The November 9th Incident” 111
In the Friday Business Section of the Seattle Daily Post, theChamber of Commerce announced it would be holding a special re-ception for the new Syrian owner of the Seattle Flying Fish Ship-builders, who was arriving the following Tuesday, November 5, fromKuala Lumpur. From an economic point of view, the Panamaniantuna boat order earlier in the year had helped make a dent in unem-ployment locally, so the chamber wanted to congratulate the Mujenfamily on the growth in their business. Of course, the chamber hopedthis wealthy Syrian family would be a source of other investments inthe Seattle maritime industry.
Although the embassy in Singapore was the scene of “childishinfighting” and the usual Monday-morning quarterbacking—not allthat uncommon in U.S. diplomatic facilities abroad—this was ri-diculous. During a “staff meeting,” Karen Scott had seen the Cham-ber of Commerce announcement while scanning Seattle news head-lines online and said, “Hmmm. There can’t be too many new tunaboats being built at any one point in time. I wonder if the new tunafishing boats in our harbor were built in Seattle? That would beodd—most local boats are built in Korea or Taiwan.”
At that point, Randy May interrupted and said, “Since when areyou interested in the local tuna trade? I wish somebody had told meabout this, I have some ‘inside’ reporting that might be related. Whyam I always out of the loop?” Not wanting any more turf battles andwanting to “cooperate and coordinate” appropriately, Tynes lookedat Lupin and said “Mark, get these kids playing nicely in the sandbox,OK? I don’t want to hear any more of this crap,” and walked outpuffing on his pipe. Lupin glared at Scott and May. The two of themunderstood very clearly they should be coordinating closely on thisFriday’s “joint” report. Maybe Karen had more on the ball than Maysuspected and wasn’t just a socialite. He’d pay closer attention to herin the future as well. She might know some interesting and usefulfolks. He still sent out his own private CIA channel cable that after-noon.
By early November, the U.S. Coast Guard and Maryland PortAuthority had decided they were tired of these rogue tuna boat cap-tains’ behavior. Doing a little homework, they checked to see if there

112 Out of the Ordinary
had been a dramatic increase in local buyers’ demand for tuna, ifpermits had been granted to import teak from new sources—the FarEast in particular—and looked under as many rocks as they couldthink of, but they found only worms for their week’s work. They didtheir best to interview the few captains who would spend five minuteswith them and gave the captains’ names to the FBI, DEA, and INS.
As usual, they sorted through the common “John Smith”–typeArabic names, such as Mustaffah, Amdu, and Mujen, including thoseon various watch lists. While none of the captains specifically raisedany eyebrows, Mujen certainly got around. Further background in-vestigation did show that several of the captains had family connec-tions in Qatar, Yemen, and Syria: None of them were fishing, furni-ture or forestry related. Two captains’ names did match those offoremen working for a firm in Seattle some six months ago—makingboats.
. . . On November 9th something very bad happened . . .
Version 2—Structured in Chronological Order withBackground Information Added, Noise Removed
In June, the Arab Student League in Hong Kong started planning fora conference of Arab students studying in southwest Asia, to be heldon November 11. Well over a hundred participants were expected.These events take place semiannually and allow the students to dis-cuss issues arising from living as Arabs in Asian cultures. The groupencountered some delays in obtaining a city permit for the confer-ence. Harim Mujen was a member of the social committee.
In early August, the Tuna Daily in Seattle announced that Seat-tle Flying Fish Shipbuilders had delivered the last of 24 high-speedtuna boats to a Panamanian customer. They had been ordered inFebruary and were to be ultimately delivered to Singapore.
At the end of September, the prominent Mujen family in Syriaannounced in the society column of the Damascus paper that theywould be taking an extended holiday in the Far East, including Sin-
Case Study: “The November 9th Incident” 113
gapore, to visit family before reviewing their recently acquired in-vestments in Seattle and Los Angeles. Harim Mujen made a note tobook his travel to Hong Kong via Singapore before October 6 to getthe four-week advance booking rate for the conference.
On October 4, the local Singapore magistrate reviewed the Sep-tember 8 rush application by a Panamanian firm to berth 18 vesselsin the harbor. Via an agent, the local CIA officer noted the particularsand included the incident in his weekly report to Headquarters, in-cluding the specific Singapore desk officers at CIA, State Depart-ment, and DEA. When he heard about the October 12 bombing inBali, the Singapore desk analyst at CIA Headquarters, Fred “Woody”Johnson, put himself and colleagues on heightened alert for any be-havior, event, or activity that would fit classic terrorist patterns nowidentified after 9/11. In his weekly report, he noted an older report oftwo Arabs with false driver’s licenses and an abandoned bag at theairport.
During an October 14 meeting with State Department and lawenforcement agencies, the Coast Guard and others discussed an Oc-tober 1 request by a Panamanian tuna boat firm for docks and berthsin Baltimore and how a dock had recently been leased to a tuna boatcompany in Philadelphia. The boats were reported to be comingfrom southwest Asia or the Pacific Rim. The captains claimed thatthey were using tuna boats to carry teak wood to furniture builders inNorth Carolina and up the coast. A few lines about this were in-cluded in the weekly summary that was submitted on October 16.
At the meeting of international businesses in Singapore on Oc-tober 18, Karen Scott of the State Department learned about the oddbehavior of a tuna boat company in the Singapore harbor. Early thefollowing week, she sent a routine cable from her desk at the Com-merce Section to law enforcement, drug enforcement, maritime, andintelligence agencies. On the distribution list, she included main StateDepartment and CIA Headquarters, as well as field offices.
Later that week, on October 23, the economics officer at theSingapore embassy noted hiring increases in the harbor, and, aftersending an email to Scott on the Commerce Desk, he fired off a“Good news on the employment front” cable to the State Depart-

114 Out of the Ordinary
ment and Department of Commerce back in Washington. He alsosent copies to appropriate desk officers in the State Department forthe countries that had the highest population of migrant workers inSingapore: Malaysia and other Pacific Rim countries. He sent a low-priority paper copy to members of the intelligence community withbranches concerned with employment, migration, and populationtrends.
On October 24, Miami DEA officials noted the October 16summary report through Susan Mandetti, a CIA officer on detail tothe Miami office, who reported to the DEA chief of operations inKey West about the possible relationship to activities in Baltimoreand Philadelphia. The report was also sent to various intelligenceagencies.
On October 26, Woody Johnson noted to the interagency taskforce about lower-than-expected terrorist activity after the Balibombing and how he had seen cables about the start of a new “Arab-American Friendship League” starting and a new mosque openinglater that fall. Others also noted an increase in Arab graduate studentsleaving their universities early and returning to the Middle East. Thestudent movement was odd and the Singapore CIA Desk decided toinvolve the INS to see if something similar was happening in theUnited States.
The counterterrorism representative for INS, Sam Trowl, hadnot noticed anything odd but was probably too buried under his ownpaperwork to notice.
The week of October 28 marked a yearly regional conferenceheld in Sydney, hosted by the Australian diplomatic corps. The Aus-tralian host commented to the U.S. State Department, CIA, and FBIrepresentatives about problems with 24 tuna boats. The CIA chief ofstation, Mark Lupin, noted that one of his officers had mentionedsome hassle with a tuna operation back in Singapore and includedthis in his November 4 report.
On November 1, the Chamber of Commerce in Seattle, Wash-ington, announced it would have a special reception for the Syrianowner of the Seattle Flying Fish Shipbuilders, who was arriving onNovember 5 from Kuala Lumpur.

Case Study: “The November 9th Incident” 115
On November 4, Randy May, CIA officer at the U.S. Embassyin Singapore, discovered that Karen Scott had also noted tuna boatactivity in Singapore and in the Seattle paper. He noted this in hisFriday report.
By November 5, the U.S. Coast Guard and Maryland PortAuthority had given the names of the tuna boat captains to the CIA,FBI, DEA, and INS. The FBI, DEA, and INS did not find anythingunusual about the tuna boat captains in the first search. None of thecaptains specifically raised any eyebrows and there was nothing onthem directly in the system. Further background investigation didshow several of the captains with family connections in Qatar,Yemen, and Syria: None of the families had any connection to fish-ing, furniture, or forestry. Two of the captains had worked recentlyfor the same firm in Seattle—a boatbuilding concern.
. . . On November 9th something very bad happened . . .
Post-Mortem Analysis
In conducting a post-mortem of this sad event, it is important to lookat the evidence and review the processes. First, what facts were knownand when were they known? We use two sources: overt and investiga-tive reporting and the government’s internal review.
By mid-November, the reporters were clamoring for details onwho knew what, what was known when, and how the obvious signalscould have been missed . . . again. Some investigative reporters hadstarted documenting the events and the timelines before 11/9.
The following information elements existed in the commercial,city, state, and federal records and were disclosed on the evening newsby the reporters on November 19. It still wasn’t known for sure whowas behind the event, but the reporters were sniffing out anythingthat might be related:
February 4 Twenty-four tuna boats are ordered in Seattle for ex-port to Australia under the Panamanian flag; exportpapers are filed.

116 Out of the Ordinary
June 13 A Hong Kong city permit is issued for an Arab stu-dent conference in November.
August 6 A Seattle paper announces completion of an order for24 tuna boats to a Panamanian concern.
August 9 Twenty-four Panamanian tuna boats arrive in Sydney,are registered in the harbor.
September 8 An application is made for 18 tuna boat berths inSingapore’s harbor by a Panamanian firm.
September 29 The Mujen family announces in the Damascus paperits trip via the Far East to Seattle and Los Angeles tovisit recently acquired investments.
September 30 Two Arab students are detained for having falsedriver’s licenses at Singapore airport.
October 6–7 More than100 Arab students had booked travel toHong Kong for November 10.
October 1 A Panamanian firm requests off-loading privileges atBaltimore public wharf.
October 10 A wharf in Philadelphia is leased to a Panamanianfirm.
October 12 A bombing in Bali is reported on all of the news wiresand governmental services.
October 13 Abandoned luggage is found at the Singapore airport,Saudi Air Terminal.
October 23 Classified ads for high-paying, cash work on the docksappear in Singapore paper.
November 1 Seattle paper reports Chamber of Commerce recep-tion for Mujen family from Syria.
The following information elements were generated by the in-telligence process itself and were part of the official record that wasuncovered during the internal review after 11/9:

Case Study: “The November 9th Incident” 117
October 4 CIA officer in Singapore reports tuna boats causingproblems in the harbor.
October 14 Singapore Desk at CIA Headquarters reviews reportsof two Arab students detained September 30 andabandoned luggage found at the Singapore airport.
October 16 Maryland Coast Guard reports Panama-flagged boatsacting unconventionally and being uncooperative inBaltimore and possible relationship to tuna boat ac-tivity at Philadelphia.
October 21 Commerce Section of U.S. Embassy in Singapore re-ports notable commercial activity by tuna boat com-pany.
October 23 Economics officer at U.S. Embassy in Singapore notesnonroutine hiring practices at the harbor, new tunaboat activity, and potential for economic recovery.
October 24 Miami DEA reports possible relationship betweenlocal intercepted tuna boats and activity in Baltimoreand Philadelphia.
October 28 Singapore Desk at CIA Headquarters learns of un-usual number of Arab students returning home.
November 4 CIA Chief of Station in Singapore reports coincidenceof problems with tuna boats in Sydney and Singapore.
November 5 Maryland Coast Guard reports the names of five ofthe tuna boat captains.
November 7 INS, FBI, DEA request reports on background in-formation regarding tuna boat captains.
November 8 CIA officer in Singapore reports commercial, eco-nomic, and personal information that the tuna storyand the Seattle news article are possibly correlated.
These eleven reports were then distributed as follows:

118 Out of the Ordinary
October 4 CIA officer in Singapore reports fishing firm with 18tuna boats causing administrative problems in theharbor. Distributed to CIA Headquarters Asia Desk,Singapore Desk, Main State Department, DEA.
October 14 Desk Officer at CIA Station, Singapore reports twoArab students detained September 30 and abandonedluggage found in Saudi Air Terminal at the Singaporeairport. Distributed to CIA Headquarters Asia Desk,Singapore Section.
October 16 Maryland Coast Guard reports Panama-flagged boatsacting unusual in Baltimore and possible relationshipto tuna boat activity at Philadelphia. Distributed toCIA Headquarters Counter Terrorism Center, FBI,Coast Guard.
October 21 Commerce Section at U.S. Embassy in Singapore re-ports anomalous commercial activity by tuna boatcompany. Distributed to CIA Headquarters AsiaDesk, Singapore Section, FBI, DEA, Coast Guard.
October 23 Economics officer at U.S. Embassy in Singapore re-ports unusual hiring practice at the harbor, new tunaboat activity, and potential for economic recovery.Distributed to Main State Department, CommerceDesk at U.S. Embassy in Singapore, D.C. Dept. ofCommerce. Routine priority copies to CIA Head-quarters Asia Desk, FBI, DEA, Coast Guard, INS.
October 24 Miami DEA reports possible relationship betweenintercepted tuna boats and Baltimore–Philadelphiaactivity. Distributed to CIA Headquarters Counter-terrorism Center, FBI, DEA, Coast Guard.
October 28 Singapore Desk at CIA Headquarters hears of unusualnumber of Arab students returning home. Distributedto INS.

Case Study: “The November 9th Incident” 119
November 4 CIA Chief in Singapore reports coincidence of tunaboat problems and oddities in Sydney and Singapore.Distributed to CIA Headquarters Asia Desk, Singa-pore Desk, CIA Singapore Station.
November 5 Maryland Coast Guard reports the names of five ofthe tuna boat captains. Distributed to CIA Head-quarters Counter Terrorism Center, FBI, DEA, INS.
November 7 INS, FBI, DEA request reports on background in-formation regarding tuna boat captains. Distributedto CIA Headquarters Counter Terrorism Center,Coast Guard.
November 8 CIA officer in Singapore reports commercial, eco-nomic, and personal information that the tuna boatsand the Seattle news article are possibly correlated.Distributed to CIA Headquarters Asia Desk, Singa-pore Desk, CIA Counter Terrorism Center, MainState Department, DEA Headquarters, and field of-fices.
Interviews with the various agencies and representatives showedthat the intelligence community had, through overt means, collectedthe following information that was also eventually disclosed by thepress:
August 9 Twenty-four Panamanian tuna boats arrive in Sydney,are registered in the harbor . Reported November 4 byCIA Chief of Station in Singapore.
September 8 An application is made for 18 berths in Singapore’sharbor by a Panamanian firm. Reported October 4 byCIA Officer Randy May in Singapore.
September 30 Two Arab students are detained for having falsedriver’s licenses at Singapore airport. Reported Octo-ber 14 by CIA Headquarters, Singapore Desk.

120 Out of the Ordinary
October 10 A wharf in Philadelphia is leased to a Panamanianfirm. Reported October 14 by U.S. Dept. of Com-merce, Coast Guard, Maryland Port Authority.
October 10 A Panamanian firm requests off-loading privileges atBaltimore public wharf. Reported October 14 by U.S.Dept. of Commerce, Coast Guard, Maryland PortAuthority.
October 12 Bombing in Bali is reported on all of the news wiresand governmental services. Reported October 12 byall agencies.
October 13 Abandoned luggage is found at the Singapore airport,Saudi Air Terminal. Reported October 14 by CIAStation, Singapore Desk Officer.
October 23 Classified ads in Singapore paper for high-paying,cash work on the docks. Reported October 23 byEconomics officer at U.S. Embassy, Singapore.
November 1 Seattle paper reports Chamber of Commerce recep-tion for Mujen family from Syria. Reported Novem-ber 5 by Commerce Desk at U.S. Embassy, Singa-pore.
So, who knew what, when?
In Singapore
CIA Station
October 4 Since mid-September, a firm owning 18 tuna boatshad been causing problems in the harbor.
October 12 The bombing in Bali was reported on all of the newswires and governmental services.
November 4 Coincidence of problems with tuna boats and odditiesin Sydney and Singapore; reported by CIA Chiefof Station in Singapore.
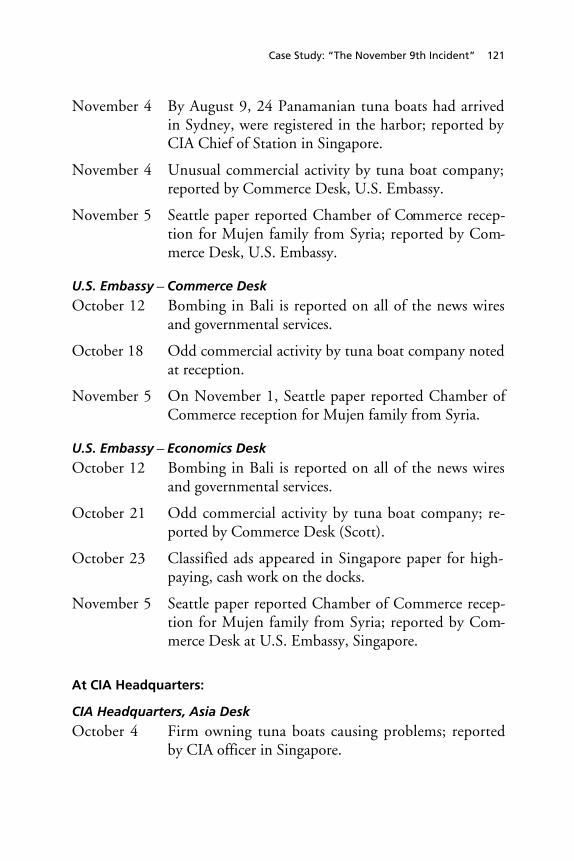
Case Study: “The November 9th Incident” 121
November 4 By August 9, 24 Panamanian tuna boats had arrivedin Sydney, were registered in the harbor; reported byCIA Chief of Station in Singapore.
November 4 Unusual commercial activity by tuna boat company;reported by Commerce Desk, U.S. Embassy.
November 5 Seattle paper reported Chamber of Commerce recep-tion for Mujen family from Syria; reported by Com-merce Desk, U.S. Embassy.
U.S. Embassy—Commerce Desk
October 12 Bombing in Bali is reported on all of the news wiresand governmental services.
October 18 Odd commercial activity by tuna boat company notedat reception.
November 5 On November 1, Seattle paper reported Chamber ofCommerce reception for Mujen family from Syria.
U.S. Embassy—Economics Desk
October 12 Bombing in Bali is reported on all of the news wiresand governmental services.
October 21 Odd commercial activity by tuna boat company; re-ported by Commerce Desk (Scott).
October 23 Classified ads appeared in Singapore paper for high-paying, cash work on the docks.
November 5 Seattle paper reported Chamber of Commerce recep-tion for Mujen family from Syria; reported by Com-merce Desk at U.S. Embassy, Singapore.
At CIA Headquarters:
CIA Headquarters, Asia Desk
October 4 Firm owning tuna boats causing problems; reportedby CIA officer in Singapore.

122 Out of the Ordinary
October 12 Bombing in Bali is reported on all of the news wiresand governmental services.
October 14 Reports of two Arab students detained September 30and abandoned luggage found at the Singapore air-port; received by Singapore Desk at CIA Headquar-ters.
October 21 Odd commercial activity by tuna boat company; re-ported by Commerce Section in Singapore.
November 1 Odd hiring practice at the Singapore harbor, newtuna boat activity, and potential for economic recov-ery; October 23 report from Economics officer inSingapore.
November 4 Coincidence of tuna boat problems and oddities inSydney and Singapore; reported by CIA Chief inSingapore.
November 8 Commercial, economic, personal information on thetuna boats and the Seattle news article as being possi-bly correlated; from CIA officer in Singapore.
CIA Headquarters Counter Terrorism Center
October 12 Bombing in Bali is reported on all of the news wiresand governmental services.
October 16 Panama-flagged boats acting strangely in Baltimoreand possible relationship to tuna boat activity atPhiladelphia; reported by Maryland Coast Guard.
October 24 Possible relationship between intercepted tuna boatsand Baltimore–Philadelphia activity; reported by Mi-ami DEA.
November 5 The names of five of the tuna boat captains; reportedby Maryland Coast Guard.
November 7 Background checks done on the five tuna boat cap-tains.

Case Study: “The November 9th Incident” 123
November 8 Commercial, economic, and officer’s own informa-tion on the tuna boats and the Seattle news article asbeing possibly correlated; report from CIA officer inSingapore.
CIA Headquarters Singapore Desk
October 4 Firm owning tuna boats causing problems; from CIAofficer in Singapore
October 12 Bombing in Bali is reported on all of the news wiresand governmental services
October 14 On October 13, abandoned luggage was found at theSingapore Saudi Air Terminal
October 14 On September 30, two Arab students were detainedfor having false driver’s licenses at Singapore airport.
October 28 Hears of unusual number of Arab students returninghome.
November 4 Coincidence of tuna boat headaches and oddities inSydney and Singapore; from CIA Chief in Singapore.
November 8 Commercial, economic, and personal information onthe tuna boats and the Seattle news article are possi-bly correlated; from CIA officer in Singapore.
At Departments of State and Commerce:
Department of State
October 4 Tuna boats causing problems in the harbor; fromCIA officer in Singapore.
October 12 Bombing in Bali is reported on all of the news wiresand governmental services.
October 23 Odd hiring practice at the Singapore harbor, newtuna boat activity, and potential for economic recov-

124 Out of the Ordinary
ery; reported by Economics officer at U.S. Embassyin Singapore.
November 8 Commercial, economic, and personal information onthe tuna boats and the Seattle news article are possi-bly correlated; reported by CIA officer in Singapore.
Department of Commerce
October 12 Bombing in Bali is reported on all of the news wiresand governmental services.
October 14 On October 10, a wharf in Philadelphia was leased toa Panamanian firm.
October 14 On October 10, a Panamanian firm requested off-loading privileges at Baltimore public wharf.
October 23 Odd hiring practice at the Singapore harbor, newtuna boat activity, and potential for economic recov-ery; reported by Economics officer at U.S. Embassyin Singapore.
At the Coast Guard:
Maryland Coast Guard
October 14 On October 10, a wharf in Philadelphia was leasedto a Panamanian firm.
October 14 On October 10, a Panamanian firm requested off-loading privileges at Baltimore public wharf.
October 12 Bombing in Bali is reported on all of the news wiresand governmental services.
October 16–31 Names of five of the tuna boat captains.
October 21 Odd commercial activity by tuna boat company; re-ported by Commerce Section, U.S. Embassy in Sin-gapore.

Case Study: “The November 9th Incident” 125
October 24 Possible relationship between intercepted tuna boatsand Baltimore–Philadelphia activity; reported by Mi-ami DEA.
November 1 Odd hiring practice at the Singapore harbor, newtuna boat activity, and potential for economic recov-ery; October 23 report from U.S. Embassy in Singa-pore.
Florida Coast Guard/DEA Joint Task Force
October 12 Bombing in Bali is reported on all of the news wiresand governmental services.
October 16 Panama flagged boats acting strangely in Baltimoreand possible relationship to tuna boat activity atPhiladelphia; from Maryland Coast Guard.
October 21 Odd commercial activity by boat company; reportedby Commerce Section at U.S. Embassy in Singapore.
October 24 Possible relationship between intercepted tuna boatsand Baltimore–Philadelphia activity; from MiamiDEA.
November 1 Odd hiring practice at the Singapore harbor, newtuna boat activity and potential for economic recov-ery; October 23 report from U.S. Embassy in Singa-pore.
Coast Guard Headquarters
October 12 Bombing in Bali is reported on all of the news wiresand governmental services.
October 16 Panama-flagged boats acting uncooperatively in Bal-timore and possible relationship to tuna boat activityat Philadelphia; from Maryland Coast Guard.
October 21 Odd commercial activity by tuna boat company;from Commerce Section in Singapore.
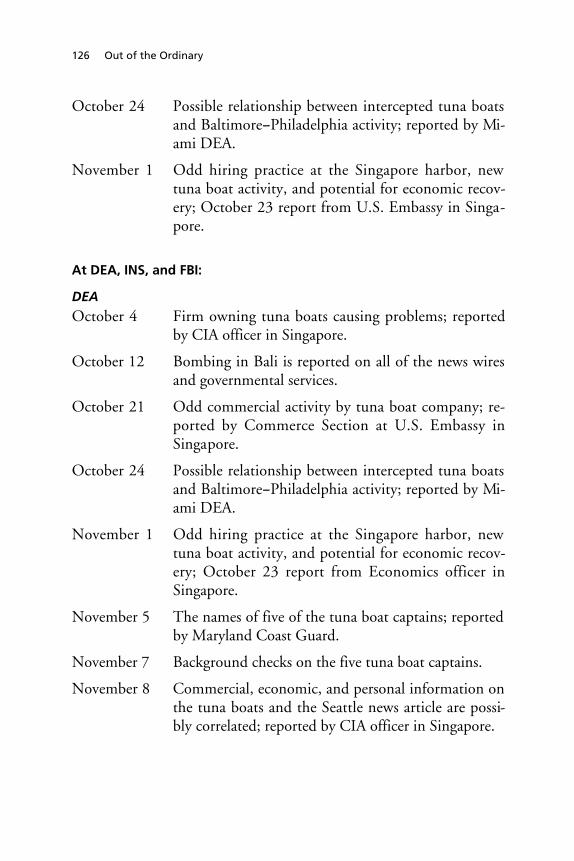
126 Out of the Ordinary
October 24 Possible relationship between intercepted tuna boatsand Baltimore–Philadelphia activity; reported by Mi-ami DEA.
November 1 Odd hiring practice at the Singapore harbor, newtuna boat activity, and potential for economic recov-ery; October 23 report from U.S. Embassy in Singa-pore.
At DEA, INS, and FBI:
DEA
October 4 Firm owning tuna boats causing problems; reportedby CIA officer in Singapore.
October 12 Bombing in Bali is reported on all of the news wiresand governmental services.
October 21 Odd commercial activity by tuna boat company; re-ported by Commerce Section at U.S. Embassy inSingapore.
October 24 Possible relationship between intercepted tuna boatsand Baltimore–Philadelphia activity; reported by Mi-ami DEA.
November 1 Odd hiring practice at the Singapore harbor, newtuna boat activity, and potential for economic recov-ery; October 23 report from Economics officer inSingapore.
November 5 The names of five of the tuna boat captains; reportedby Maryland Coast Guard.
November 7 Background checks on the five tuna boat captains.
November 8 Commercial, economic, and personal information onthe tuna boats and the Seattle news article are possi-bly correlated; reported by CIA officer in Singapore.
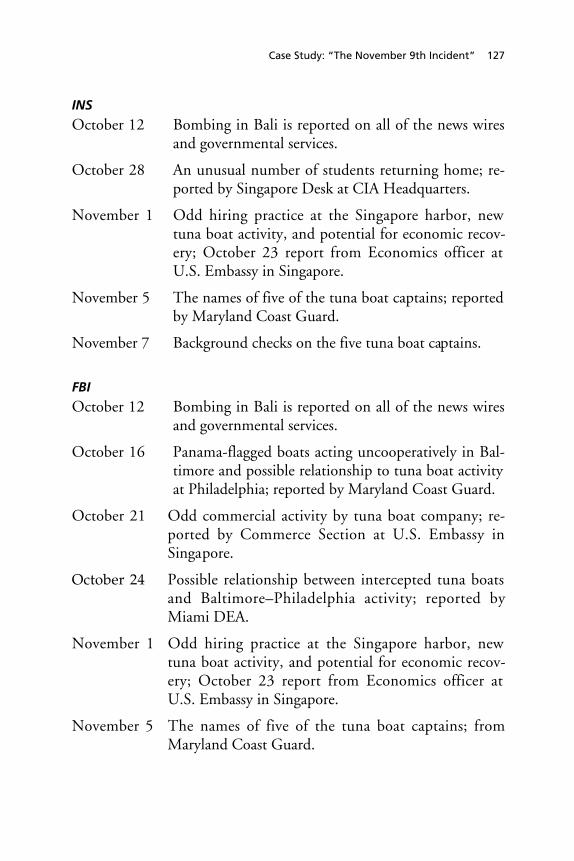
Case Study: “The November 9th Incident” 127
INS
October 12 Bombing in Bali is reported on all of the news wiresand governmental services.
October 28 An unusual number of students returning home; re-ported by Singapore Desk at CIA Headquarters.
November 1 Odd hiring practice at the Singapore harbor, newtuna boat activity, and potential for economic recov-ery; October 23 report from Economics officer atU.S. Embassy in Singapore.
November 5 The names of five of the tuna boat captains; reportedby Maryland Coast Guard.
November 7 Background checks on the five tuna boat captains.
FBI
October 12 Bombing in Bali is reported on all of the news wiresand governmental services.
October 16 Panama-flagged boats acting uncooperatively in Bal-timore and possible relationship to tuna boat activityat Philadelphia; reported by Maryland Coast Guard.
October 21 Odd commercial activity by tuna boat company; re-ported by Commerce Section at U.S. Embassy inSingapore.
October 24 Possible relationship between intercepted tuna boatsand Baltimore–Philadelphia activity; reported byMiami DEA.
November 1 Odd hiring practice at the Singapore harbor, newtuna boat activity, and potential for economic recov-ery; October 23 report from Economics officer atU.S. Embassy in Singapore.
November 5 The names of five of the tuna boat captains; fromMaryland Coast Guard.

128 Out of the Ordinary
November 7 Background checks on the five tuna boat captains.
The analysis . . .
It is clear in hindsight that there were many clues and signals floatingin the system and that much of the information was sitting on thedesks. For example, by November 8, the collective knowledge was:
October 4 Since mid-September, owners of 18 tuna boats hadbeen drawing attention to themselves.
October 12 Bombing in Bali was reported on all of the newswires and governmental services.
October 14 On October 13, abandoned luggage was found at theSingapore airport, Saudi Air terminal.
October 14 On September 30, two Arab students were detainedfor having false driver’s licenses at Singapore airport.
October 14 On October 10, a wharf in Philadelphia was leased toa Panamanian firm.
October 14 On October 10, a Panamanian firm requested off-loading privileges in Baltimore.
October 16 Panama-flagged boats acting uncooperatively in Bal-timore; possible relationship to tuna boat activity atPhiladelphia.
October 16–31 Names of five of the tuna boat captains known.
October 18 Odd commercial activity by tuna boat company.
October 23 Classified ads in Singapore paper for high-paying,cash work on the docks for new Panamanian fishingcompany.
October 24 Possible relationship between intercepted tuna boatsand Baltimore–Philadelphia activity.

Case Study: “The November 9th Incident” 129
October 28 Unusual number of Arab students returning home.
November 4 By August 9, 24 Panamanian tuna boats had arrivedin Sydney Harbour.
November 4 Odd commercial activity by tuna boat company.
November 5 On November 1, Seattle reception for Mujen familyfrom Syria.
November 4 Coincidence of tuna boat problems and oddities inSydney and Singapore.
November 5 Background check on five of the tuna boat captains.
November 8 Commercial, economic, and personal informationthat the tuna boats and the Seattle news article arepossibly correlated.
While other information in the public domain was not caught,there was adequate information in the system—why were the dotsnot connected in time? Some relationships were picked up by some ofthe intelligence network, but the big picture eluded everyone. All theagencies and individuals did their job and forwarded information as itwas warranted. If everyone did his job, what went wrong? The con-gressional committee made the following observations:
1. The student forum was not picked up since information flows didnot exist with China. Thus, the primary information was unavail-able and secondary information traces at the individual level withcorrelations did not exist. The intelligence system did not pick upthe student travel.
2. Delays with the overt and public information resulted in certaininformation being missed when it could have been helpful. Theexporting of ships from Seattle and the harbor information inSydney were vital.
3. Twenty-four boats were built, but only eighteen were accountedfor in Singapore where they were all supposed to be shipped. The

130 Out of the Ordinary
geographic dispersion and secondary companies used to distributethe vessels was not caught. Six boats were unaccounted for.
4. Multiple agencies were processing and analyzing related informa-tion but were unaware of others doing similar tasks.
5. The information flows were directed by where people thoughtinformation should go, not by what people were looking for orwhere related activities might be.
6. Delays existed for information some sources thought was low-priority when in fact it was significant and high-priority.
7. Analysts within the same agencies were often sitting on the sameor related information without being aware of it.
8. It was more by accident than by design that the tuna boat con-struction in Seattle was linked into the limited picture that gov-ernment agencies had prior to 11/9. If the Chamber of Com-merce had not announced the reception, the link would neverhave been made.
Application of the ASAP Architecture
A fully functional ASAP system would have a large number of differ-ent status-quo agents watching entities, looking for what was out-of-the-ordinary, and setting and testing hypotheses. There would beagents for “interesting” events such as financial transactions, move-ment of people, and data communication. In this section we will giveseveral examples of possible status-quo agents and explain how suchagents would have operated in the above scenario.
First, consider an import/export agent. Things imported comefrom somewhere, leave at a specific time, and have characteristicssuch as importer, exporter, shipper, owner, weight, volume, andquantities. Things exported are supposed to go somewhere, arrive atsome time, and have a number of characteristics as well. A status-quoexpectation would be that what is exported in one jurisdiction is im-

Case Study: “The November 9th Incident” 131
ported by another with the various characteristics largely intact.Similarly, if something is imported, there should have been exportrecords, and—if the goods come from a friendly nation—the infor-mation should be available. If something is exported to a friendly na-tion, eventually there should be matching import records. Thewatching import/export agent would monitor these types of charac-teristics and note deviations from the expectation. A holistic approachwould be used to identify similar or “close enough” matches to catchthe cases where certain information is changed en route. If somethinghas been changed, a flag would be raised at the expected arrival time(within a threshold) when the matching import records are not gen-erated for the expected items.
It is reasonable to expect that, given the systems and projectsunder way today, this type of information should be available foranalysis. What would this information have meant in the tuna boatscenario? When the export records were filed for the 24 tuna boats,an entry would have been made to watch for the corresponding lifecycle of the transaction. A timer would have been set to catch thenonclosure, and pattern-matching would have been performed on thevarious characteristics to catch one or more of the attributes beingchanged en route. The export information would also contain theshipping and sailing manifest and planned ports of call. In duecourse:
1. The arrival of 24 tuna boats in Australia instead of Singaporewould have been noted as possibly unusual and flagged for anysecondary processing to pick up relationships.
2. The arrival of 18 boats in Singapore instead of 24 would havebeen noted. This would have been related to the fact of the differ-ent export location, and the information would have been for-warded to various agencies.
3. Assuming some delays in paperwork and associated processing, thedestination mismatch should have been noted by mid-August andthe quantity mismatch by mid-September. The first report wouldnot likely trigger a great deal of interest, but when significant as-

132 Out of the Ordinary
sets go missing combined with irregularities in transit behavior, afocused analysis by the intelligence community to probe furtherwould likely have been launched.
4. If Sydney had been listed as a planned port of call, the first trapwould have been missed, but the change in quantity would havebeen caught. Transit is a more fluid characteristic and some flexi-bility exists in that dimension. However, a change in a physicalcharacteristic is of more interest. If the travel itinerary or routechange had included hostile or questionable ports of call, thiswould have been added to the analysis with a corresponding risein priority or interest.
5. The dot connector algorithm would have correlated the Seattle,Australia, and Singapore information by mid-September andhighlighted this coincidence to the appropriate analysts and agen-cies.
In this scenario, the information would have been brought tothe intelligence agencies approximately four to six weeks earlier. Fur-thermore, the information would have been brought forward withoutrelying on Scott’s reading of the Seattle newspaper and the informalintelligence gathering that occurred at the embassy. The import andexport information is factual, quantifiable, and can be captured andcomputerized. Since assets are often moved from point A to point Bacross national borders with expected behaviors, an import/exportanalyzer will be an important part of the ASAP detector.
Second, consider a commerce analyzer. Not all aspects of com-merce are interesting. For example, a new dry cleaner or corner vari-ety store is not normally of note. However, commerce that involvesmovement of goods in and out of harbors and airfields would be, aswould transportation patterns across borders. Commerce that in-volves modes of transportation and shipment would also be interest-ing. Because there are expected trends and behaviors of commerce, itis possible to construct commerce watchers. For example, considerthe tuna boat story again. When a business requests a license to oper-ate in the transport or goods movement sector, or to operate a proc-

Case Study: “The November 9th Incident” 133
essing facility at (or close to) an entry or exit point, the business canundergo a status-quo check. Existing business databases can bechecked for the region and patterns analyzed. Possible patterns to re-view are the following: any existing or similar firms (if none, why anew entrant?), percentage of change in capacity (if a small incrementin base, it’s probably okay, but a significant increase would be odd),business trend data (if decreasing sector, why a new entrant?), and soforth. Standard codes exist for industry sector, type of business, andso on, and these can be exploited when searching for business pat-terns. Historical data can be used to identify the patterns for new en-trants and the normal size of players in the sector in terms of capacity.These are “expected behaviors” and any significant deviation may benoteworthy. Each noteworthy observation is a dot.
1. In the tuna boat story, we might have caught an unusual increasein tuna boats being built and an odd fleet renewal pattern, or anunusual number of tuna boats operating in Singapore, or theoddity of the existence and operation of tuna boats in the Mary-land jurisdiction.
2. There were three possible commerce-oriented dots by mid-October. The dot connector agent would have added this informa-tion to the other tuna boat information and widened itsbacksweep and possible relationship searches—owners, operators,ports of call, cargo, and crew.
The result from this agent, which highlighted the commercedots, might have been the possible connection of the Mujen nameand firms somewhat related to unusual activities in different parts ofthe world at the same time. The Coast Guard and Maryland PortAuthority would probably have noted the odd port behavior just asquickly, but this would not have been so easily correlated with theFar East activities without a dot connector.
As a third and last example, consider a student association watcherthat tracks and watches for status-quo behavior of students on thewatch list. In this case, the watcher would pick up the sudden book-

134 Out of the Ordinary
ing of trips and traffic through Singapore. This would be an unusualvolume and geographical convergence. The cause—the conference inHong Kong—would be hidden, and in one sense the dot would be ared herring and would make unwanted noise. There was good reasonfor the travel and the gathering. However, when the dot was identi-fied, a relationship search was launched for any connections to anyother dots or curiosity items. A search would have been done on themembership, attendees, and organizing committee. This might havehighlighted the Mujen connection as a possible dot connection andbrought it to an analyst’s attention for further consideration. Thispossible relationship would have come to light in mid-October whenthe travel booking started.
The above three example detector agents are reasonable and fea-sible to create for asymmetric threats. Agents like these could be cre-ated for attributes and characteristics that are considered relevant andthat have life cycles and expected behaviors or values. The focuswould need to be at the detailed and aggregate levels—for instance,foreign registration versus a specific Panamanian company name. Ahuman could conceivably have seen and recognized the informationpicked up by the ASAP detector agents. In hindsight, the dots are ob-vious and should have been connected before 11/9.
The detectors will not catch everything, and they will identifyrelationships that are red herrings. But over time, the detectors couldgrow in sophistication as analysts add more rules and items to watchfor. Initially, the detectors would be rather coarse and would be lim-ited to picking up changes in status, convergence of assets, continuityfailures, and so forth. There are two critical conditions for the ASAPdetector—access and availability of data and expectation models. Theabove example detectors illustrate the type of information that is orshould be available and the types of expectations that can be repre-sented in software systems. The expectations and information mustbe quantitative and cannot be vague or ambiguous—such as “toomany” or “too often.” The expectations must be based on historicalor expected values with normal variability noted.

Case Study: “The November 9th Incident” 135
The Hybrid Element—People in the ASAP Architecture
We have described how several simple information detectors mighthave operated under the ASAP framework and how this might haveaffected the tuna boat scenario. However, that is only part of the so-lution and operational profile. The system does not exist in a vac-uum, and it cannot exist outside the current operational fabric of in-telligence processing. Human beings are also involved, and they bringstrengths and weaknesses to the situation, creating a hybrid structure.Any computer system will undoubtedly raise false signals and misssome obvious ones. Those weaknesses can never be eliminated, butthey can be minimized.
The filters described as part of the framework will assist with re-ducing some of the noise, but noise will certainly exist. In the finalanalysis, the human element will be critical for deciding what is a dotand whether the dot connection is worthy of further effort. If some-thing is noted by a human as being noise, it will still be kept on fileand used for secondary analysis purposes, but unless something elsehappens that strengthens the signal or the relationship, the noise willbe kept in the background. This type of logic helps with the problemof the human dismissing something as noise when it is not. The sys-tem will keep an eye on it, just in case. The human can also createspecific noise filters to identify and block certain types of known de-ception and other sources of background noise. This can be done fortime windows, targets, or detected dots matching certain criteria.(These filters would be subject to periodic review, to ensure thatmeaningful data are not being removed accidentally.)
Along with the information (dots and relationships) rising to thetop, the analyst will be integrating other information from systemdatabases and from personal knowledge about the situation. Perhaps adot is a bit “off,” but it tweaks something in the analyst’s recentmemory and the analyst can issue a further ASAP or data mining di-rective. Perhaps the analyst sees an interesting piece of data otherwiseburied and proceeds to call a colleague at another agency. Whateveranalysts do will be driven by what they see, what they know, theirtraining, and their personalities. People will vet and judge informa-

136 Out of the Ordinary
tion based on assumptions and hypotheses about the sources andother disparate data. For example, what is not said might be ampli-fied by the analyst, or what is seen might be discounted or attenuated.This is part of the process. Consider the personalities involved withthe tuna vignette:
• Harold R. Tynes: U.S. Ambassador to Singapore. Career For-eign Service officer with a disdain for the intelligence business.Subscribes to the 1940s belief “Gentlemen don’t read other gen-tlemen’s mail.”
• Mark L. Lupin: CIA Chief of Station, Singapore. Ambitious Di-rectorate of Operations (DO) officer, finally landed a big as-signment. Has little time for “coordination.” Hot shot with hiseyes on bigger fish.
• Randy G. May: CIA “general purpose” case officer, Singapore.Can’t seem to get promoted beyond GS-12 and not an over-achiever by any means, but somehow gets the jobdone—eventually.
• Karen P. Scott: State Dept. Commercial Attaché, Singapore.Wanted to see the world after Wharton, so Daddy got her this“broadening” experience. Undergraduate work in fine arts andFrench. Has a budding romance with the local SingaporeanDirector of Fine Arts.
• Timothy M. Smythe: Australian liaison partner forTynes/Lupin. Finds intelligence a rotten business, but hatesthose “dirty bastards” and is willing to roll up his sleeves. Hasbeen known to bend the rules a bit too; but only Lupin knowsthis.
• Fred “Woody” Johnson: Singapore Desk Analyst at the CIA’sDirectorate of Intelligence (DI). Serious regional specialist whothinks he’s tuned into the new world order, but longs for “tradi-tional” threats and analyses and the chance to draft a multiyearNational Intelligence Estimate.

Case Study: “The November 9th Incident” 137
• Michael Scott “Mack” McDermott: Coast Guard Officer incharge of Border Security for Port of Baltimore. Has just learnedhe is being transferred to the new Department of Homeland Se-curity (DHS) and is ready to “kick some butt.”
• Kevin N. Moore: Deputy Director for Asymmetric Threats, CIACounter Terrorism Center (CTC). Moore has a 20-year opera-tions background and came into this post soon after 9/11.Moore believes the CTC can make a difference but has nevermanaged an organization with 500+ people from so many di-verse government organizations. Paperwork frustrates him as do“meetings for the sake of meetings.” He is known to walk out ofthem if he doesn’t feel they are productive.
• Susan B. Mandetti: CIA representative to DEA. Susan, a coun-terterrorism graduate and GS-14 from the DI, has been offeredseveral rotational assignments and jumped at the chance to mixit up with the tough boys in Florida and see how it’s really done.She’s enthusiastic, supportive, and goes beyond the call of dutyin representing CIA with DEA; really trying to give them theanalytical perspective. The problem is, the DEA guys aren’t asenthusiastic about Susan as she is about them.
• Sam R. Trowl: Immigration and Naturalization Service (INS)bureaucrat. Been there 29 years, can’t wait to retire, but mustfirst survive the transfer to DHS. He’s over his head but puts ona good front and tries to help.
• In the background, Trowl’s protégé, William D. Sands, is an ea-ger, up-and-coming kid with a bright future who can’t seem todo it “the way we’ve always done it.” Seems he’s more interestedin creativity than conventionality. A bit of a geek.
• Francis Xavier Arden (“Big Frank”): Tough FBI chief of coun-terintelligence for the Mid-Atlantic region based in Philadel-phia. He don’t want no spies, thugs, or “rag head” terrorists onhis turf. Has embraced the new DHS and recently participatedin several CIA, FBI, NSA “counterterrorism coordination” off-

138 Out of the Ordinary
site meetings. His little brother was gravely wounded early inthe war in Afghanistan.
• Roger T. Anderson: Career SIGINT officer from NSA withoverseas field experience as an Arabic linguist. Recently assignedas operations “referent” to ARDA to support their developmentof technology to help analysts find the needle in the haystackand identify potential terrorist activity.
These individuals can be considered to be example stereotypes ofpeople involved in the intelligence process. There are many more pos-sible personality-driven profiles, and in any situation, none, some, ormany of these types of people can be observed. Each brings strengthsand weaknesses to the table. For example, some of the individualswould never use or trust a computerized detection mechanism or takethe time to create filters or sniffers. Some will delay information whilegaining greater confidence while others may pull the trigger tooquickly and transmit information full of noise and misleading innu-endos. However, some will be proactive and willingly participate inelectronic chat rooms, actively set filters, and look at the hit lists cre-ated by the tool. People comfortable with online sharing of ideas andthoughts will most likely embrace a tool that enables and facilitatestheir discussions with trusted colleagues—bouncing ideas, suspicions,and the like.
The ASAP architecture would give the latter types of analysts atool that complements the basic nature of analysis—thinking aboutwhat makes sense (building models of the status quo), watching foranomalies in the situation (the detectors), and drawing hypothesesabout anything that draws their attention (the relationship engines).The ASAP tool will not replace these key activities of the humananalyst. However, it will be able to watch more data, process it morequickly, and look for possible relationships within the data universe.
139
APPENDIX B
Systems Related to the ASAP Architecture
Systems Complementary to the ASAP Architecture
ASAP systems will fit into existing and future intelligence analysisand production “supply chains” well. Below, we describe several ma-jor intelligence support systems, both extant and under development,that would provide strong, complementary environments that ASAPcould leverage (and that in turn could leverage ASAP).
A key feature of ASAP is that it is a hybrid system, dividinganalysis labor between humans and automated agents. The idea of adivision of labor between man and machine to support intelligenceanalysis is not new in intelligence analysis. For example, machine (as-sisted) translation tools are inadequate to produce final products butare good enough to do that “first cut,” leaving enough good materialfor an analyst to work with or enough to be sent to a human, profes-sional translator for final editing. Similarly, the CIA Counter-Terrorism Center’s (CTC’s) DEFT1 (Data Extraction From Text)worked in a manner complementary to analysts both by looking forpatterns, such as known terrorists, weapons, aliases, and transactions,and by automatically populating the CTC’s (and therefore the intelli-gence community’s) Counter Terrorism Database. However, the sys-tem was never on “autopilot.” Once DEFT had done what it could 1 DEFT was the first artificial intelligence system deployed to an intelligence productionenvironment. One of the authors of this monograph (Snyder) conceived, designed, andmanaged the system in 1988 while working at the CIA.

140 Out of the Ordinary
do first—plough through megabytes and megabytes (this was the1980s) of unformatted text and populate more than 90 percent of thedatabase, the analysts did what they did best—resolved ambiguityand exercised human judgment and intuition before the final ele-ments were frozen in the database. This may sound like a technicalexercise, but bear in mind that it was designed based on how analystsworked at the time: looking for known patterns; looking for “more ofthe same.” Many programs and tools, such as DARPA’s TIPSTERprogram,2 have given analysts the horsepower to find the relevantdocuments and query large collections of data for information theyfelt they needed. ASAP systems will leverage these search-and-querytools to help locate data for further analysis.
The intelligence community now has a number of systems thatidentify incoming data, mainly textual, including transcripts of com-munications, reports from imagery analysts, and intelligence fromother sources, and triage the data into the right domain ”bin.” Oncebinned, analysts ”mine” the bins and use pattern-matching or pat-tern-generating tools based on their own strategies and tactics. Con-sistent with the literature, analysts lay out multiple sets of data asvarious patterns or pictures emerge. They are not building a collec-tion of piece-parts to yield one grand mosaic (as is commonly de-scribed); rather, they are leveraging broad datasets to “see” variouspictures take shape (see Heuer, 19993). The niche we see ASAP filling 2 Described at http://www.itl.nist.gov/iad/894.02/related_projects/tipster/overv.htm.3 Heuer strongly criticizes the common “mosaic” perspective of analysis in the Psychology ofIntelligence Analysis:
Understanding of the analytic process has been distorted by the mosaic metaphor com-monly used to describe it. According to the mosaic theory of intelligence, small pieces ofinformation are collected that, when put together like a mosaic or jigsaw puzzle, eventu-ally enable analysts to perceive a clear picture of reality. The analogy suggests that accu-rate estimates depend primarily upon having all the pieces—that is, upon accurate andrelatively complete information. It is important to collect and store the small pieces of in-formation, as these are the raw material from which the picture is made; one never knowswhen it will be possible for an astute analyst to fit a piece into the puzzle. Part of the ra-tionale for large technical intelligence collection system is rooted in this mosaic theory.
Insights from cognitive psychology suggest that intelligence analysts do not work thisway and that the most difficult analytical tasks cannot be approached in this manner.Analysts commonly find pieces that appear to fit many different pictures. Instead of a

Systems Related to the ASAP Architecture 141
is providing the pieces that are related to a picture (established pat-tern) but that do not fit into it nicely. There has to be some reasonwhy a piece of the story that used to make so much sense now “justdoesn’t add up.” Since the piece doesn’t fit the story anymore (that is,it deviates from the established pattern), ASAP will put it, along withrelated data and possible explanations, in front of the analyst to con-sider.
Beginning with the fundamental data, the FBI’s Gateway In-formation Sharing Initiative (GISI) can search the full text of investi-gative records, use natural language-processing algorithms to identifykey elements within those records (names, addresses, phone numbers,etc.), and graphically depict relationships between these elements.Such basic information elements as addresses and phone numbers andother raw data generated by text recognition would feed into ASAP.We see GISI as one of the primary systems accessed by the ASAP ar-chitecture’s interceptor agents. In addition to linked law enforcementrecords, GISI would provide ASAP systems with other basic elements,such as chronologies, analytical reviews, time lines, charts, andgraphs, as well as access to myriad law enforcement and commercialdatabases. Legal and policy issues would need to be reviewed before aprimarily foreign intelligence system would be allowed to sharecountless law enforcement and domestic databases.
In addition to collecting observational data, ASAP would alsoneed to collect data on what analysts are doing and what their reportscontain. The Novel Intelligence from Massive Data (NIMD)4 pro-
picture emerging from putting all the pieces together, analysts typically form a picturefirst and then select the pieces to fit. Accurate estimates depend at least as much upon themental model used in forming the picture as upon the number of pieces of the puzzlethat have been collected. (Heuer, 1999, pp. 61–62)
4 Described at http://www.ic-arda.org/Novel_Intelligence/. NIMD describes one of its ownvalue-added functions as follows: “We believe that novel intelligence is likely to result fromrecognizing the assumptions, biases, and hypotheses that drive an analysis and systematicallyhelping analysts challenge or extend them. For example, if a key assumption is negated, thenit is reasonable that a different outcome might be expected—potentially a strategic surprise.Ultimately, we believe that the most powerful analytic environment will be one in whichinformation about analysts is not only induced from their activities (as captured throughNIMD’s Glass Box Analyst), but in which they also have an active hand in explicitly con-structing and manipulating representations or models of the analytic targets that contain and

142 Out of the Ordinary
gram would provide ASAP access to analysts’ models and behavior inunique ways. NIMD is aimed at focusing analytic attention on themost critical information found within massive amounts ofdata—information that indicates the potential for strategic surprise.We see two key aspects of NIMD that would complement ASAP.
First, NIMD claims to be developing tools and techniques thatcapture the synergy forged and developed between analysts and in-formation, so that intelligence analysis may
• be guided by analysts’ evolving mental creations, understanding,and knowledge throughout a tightly coupled interactive and spi-raling process whose virtual result may be likened to an effectivedevil’s advocate
• reveal new indicators, issues, and/or threats that would not oth-erwise have been found because of the great mass of data.
The output of NIMD here would help keep ASAP’s agents up-dated with respect to the types of data that NIMD-assisted analystsare finding to be worth further analysis—especially those types thatdid not fit into previous patterns and mindsets. Similarly, NIMDoutputs would update ASAP hypothesis agents when particular as-sumptions or expectations are found to have been invalidated.
Second, using NIMD’s Glass Box Analyst environment, ASAPwould be able to “look over an analyst’s shoulder” as the analyst bothinteracts with the data and personally tweaks the models and assump-tions that the system uses. The resulting behavioral data woulddirectly feed ASAP agents that work on analyst-related information.
Work at DARPA, in particular the Evidence Extractionand Link Discovery Program (EELD),5 currently managed by TedSenator, also complements ASAP’s functionality and goals. Althoughboth systems incorporate context, ASAP works with dynamic contex- make explicit their knowledge, interests, hypotheses and biases, and other traits of their ana-lytic state.”5 Described in a DARPA Tech 2000 presentation given by Senator, available athttp://www.darpa.mil/DARPATech2002/presentations/iao_pdf/speeches/SENATOR.pdf.

Systems Related to the ASAP Architecture 143
tual rules, whereas EELD works with the individual elements of con-text in the data and information sense. In particular, EELD scanslarge amounts of data (usually gleaned from text) to derive “factualrelationships” between different entities (EELD is similar to GISI andthe ASAP architecture’s first-order relationship agents in this respect).The factual relationships are filed in a large “evidence database,” andthe contents of the database becomes the “context.” Then, as newdata are scanned by the system, EELD attempts to link the new datato existing facts and analyzes the resulting structures of links to de-termine whether they match patterns representing potentially unusualbehavior. EELD will also attempt to use new learning methodologiesto recognize previously unknown patterns of interest. Senator de-scribes EELD’s use of context as follows:
Activities such as getting a pilot’s license, or purchasing airlinetickets with cash at the last minute, or overstaying a visa, are notby themselves indicators of terrorist behavior. In fact, the mostdangerous adversaries will be the ones who most successfully dis-guise their individual transactions to appear normal, reasonable,and legitimate. It is only when they are combined in a particularway, or, in other words, they occur in a particular context, thatthey become highly unusual.6
We envision information exchanges between ASAP and EELDrunning in both directions. Linked datasets discovered by EELD andmatching ASAP interceptor criteria or ASAP relationship agents’ que-ries can be used as inputs to ASAP’s dot-finding, linking, andhypothesis-generating agents. Conversely, ASAP’s pattern templates(agents for data interception, hypothesis generating, and hypothesistesting) can be used to create and dynamically update pattern-testingagents within EELD. 6 Quote from Senator’s DARPA Tech 2002 presentation, available at http://www.darpa.mil/DARPATech2002/presentations/iao_pdf/speeches/SENATOR.pdf.
144 Out of the Ordinary
Systems and Analytic Tools That Might HelpImplement the Framework
A number of government and commercial off-the-shelf systems havecomponents that might be used to implement parts of a real-worldASAP system. In this section, we consider existing technologies andsystems that might be used as infrastructure and architecture compo-nents, analysis agents, and/or tools to assist analysts.
Architecture and Infrastructure Platforms
The ASAP architecture depends on the successful interaction andcontrol of a large number of distributed agents and data storagenodes. A natural software platform for implementing ASAP systemscould be the Cognitive Agent Architecture (COUGAAR), a DARPA-developed open-source architecture for large-scale multiagent systems.It is based on a cognitive model of human thinking and interaction,which “attempts to emulate the mental processes of perception,memory, judgment, reasoning and decision making. The architectureutilizes a hybrid task and data representation of cognition to representcomplex, dynamic plans. This architecture also supports fine-grainedinformation management, dynamic task allocation, data fusion, andexecution based replanning and assessment.”7
Similarly, Intelliseek is creating an open architecture, based onextensible markup language (XML) transactions, which allows theintegration of disjoint information search and analysis tools into thesame overall system.8 This architecture might allow the incorporationof existing software products into ASAP without requiring significantrecoding of the software products. 7 COUGAAR’s home page, which provides summary documentation, full technical refer-ences, and development software, is http://www.cougaar.org. The quote is from project con-tractor BBN’s web page on COUGAAR, http://www.bbn.com/abs/caa.html.8 Described in the March 2003 Technology Review article “Can Sensemaking Keep Us Safe?”(Waldrop, 2003).
Systems Related to the ASAP Architecture 145
Implementations of ASAP Agents
A number of organizations are working on tools that might becomecomponents of some of the agents in the ASAP architecture. First,IBM is developing technologies supporting the creation of “feder-ated” information systems. A federated information system consists ofmultiple, disjoint databases in which each database has a “wrapper”that converts a standard query language into commands for that par-ticular database. The wrapper also converts the database’s responseinto standard formats. In addition, the wrapper can be used to setsecurity and privacy restrictions—providing statistical measures with-out providing actual records, for example. Such “wrapper” objectsmight be used for the parts of ASAP interceptor agents that physicallywork with external databases.9
Systems Research and Development’s NORA (Non-ObviousRelationship Awareness) software shows promise for implementingportions of the interceptor and first-order relationship agents. Part ofthe NORA software takes incoming data from various data feeds andconverts it into XML in a common format, which is one of the im-portant tasks of an interceptor agent. Another part of the NORAsoftware attempts to link the incoming records with other recordscurrently in the NORA database. The NORA software employs fuzzylogic algorithms to detect links obscured by data errors or intentionaldeception. For example, suppose Alice attempts and is denied a U.S.entry visa but decides to apply for another one using a different iden-tity, in which the new identity has reversed digits for the birth dateand the same U.S. phone number and address; NORA would identifythe two visa applications as both being for Alice. In one implementa-tion, NORA software addresses nine million transactions per daycoming from over four thousand data feeds.10
In an ASAP system, NORA might be augmented by Attensity’sEarly Warning and Response (EWR) system. EWR scans free-form 9 Described in Waldrop (2003). For technical information, see Jhingran, Mattos, and Pira-hesh (2002) and Roth et al. (2002).10 NORA’s home page, which provides briefings describing the system, is http://www.srdnet.com/prod_nora.html.
146 Out of the Ordinary
text documents to extract pieces of information, then puts the infor-mation into “normalized, analysis-ready, tabular data.” For example,an EWR system applied to a company’s customer comments and re-pair forms would identify the parts causing the most problems andthe most frequently stated reasons for customer dissatisfaction. InASAP, EWR might be used for interceptor agents that want to extractdata objects from free-form text files.11
Stratify’s Discovery System shows potential for implementingother portions of the dot-finding and first-order relationship agents.The Discovery System scans textual documents and extracts their un-derlying concepts (similar to EWR), then sorts the documents using ataxonomy of concepts and groups the documents into clusters byconceptual similarity. The taxonomy used can either be an externalinput or can be generated automatically from the Discovery System’sanalysis of the documents. This system might be valuable in detectingtext file dots based on their content, as well as finding first-order linksbetween text files. The system might even have some use in imple-menting second-order agents in terms of tracking whether there aresurges in the numbers of documents containing particular records.12
Mohomine’s MohoClassifier also scans text files to place theminto categories within a taxonomy and is worthy of evaluation for usewithin an ASAP system. This system does not use concepts, however;it uses pattern recognition algorithms to place text files within catego-ries given sets of documents provided to the system as exemplars ofthe categories. Like Stratify’s Discovery System, this system mightalso have use in detecting text file dots based on their content.13
11 Attensity’s home page is http://www.attensity.com. EWR is also described on the In-Q-Tel home page, http://www.in-q-tel.com. In-Q-Tel is a private, nonprofit venture capitalagency funded and managed by the Central Intelligence Agency.12 Stratify’s home page is http://www.stratify.com; also described in Waldrop (2003).13 Mohomine’s home page is http://www.mohomine.com; it is also described on the In-Q-Tel home page, http://www.in-q-tel.com. Note that Mohomine is developing a product forextracting pieces of information from free-form text files that can then be placed in a data-base, similar to Attensity and Stratify. One of Mohomine’s primary applications of thisproduct is to convert resumes into a set of standard employment fields.

Systems Related to the ASAP Architecture 147
Recall that the ASAP architecture includes agents that examinewhat analysts are doing and what their outputs are in addition toagents that examine observational data. Tacit Knowledge System’sActivenet might provide an important base for such agents. Activenetmaintains a database of profiles on people within an organization andprovides a list of key topics for each individual pertaining to his orher work. The profiles are updated dynamically as people work onnew projects or put out reports in particular areas. Employees canthen search the database to find people whose work relates to theircurrent projects and initiate communications with those people. (Thespecific results that any employee is allowed to see are restricted by asecurity system.) Such a system might be very useful in searching foranalysts who are looking at particular types of information or who areputting out reports on particular topics.14
Implementation of Tools to Assist Analysts
An important issue in creating an effective machine-human analystrelationship in ASAP is to provide human-understandable justifica-tions for the datasets found to be “worth further analysis.” Severaltools provide such justifications; the first of these is the EELD sub-sidiary program AHEAD (Analogical Hypothesis Elaborator for Ac-tivity Detection—see Murdock, Aha, and Breslow, 2002). When adataset is found to meet criteria that make it worth further investiga-tion (in the case of AHEAD, the criterion is matching a pattern indi-cating a possible asymmetric threat), AHEAD generates a human-readable report giving a list of reasons why the dataset is worth fur-ther investigation, as well as a list of reasons why the dataset mightsimply be noise. This tool could be directly employed as part of thehypothesis-generating and -reporting functionalities of ASAP.
Analyst’s Notebook, by the Cambridge, England, company i2, isa set of data visualization tools that graphically show the links be-tween entities (the software provides time lines, geographic maps, andtransaction analysis charts for displaying the links). Each link in the 14 Tacit Knowledge Systems is described on the In-Q-Tel home page, http://www.in-q-tel.com. The company’s home page, which features Activenet, is http://www.tacit.com.

148 Out of the Ordinary
chart connects to the evidence for that link (the specific data objectsimplying the link). All charts are dynamically updatable; a new dataobject or a data object found to be false generates or deletes links ac-cordingly.15
MetaCarta’s Geographic Text Search Appliance is a combina-tion search-and-visualization tool that associates documents with geo-graphic locations. The tool allows analysts to search for documents byspecific location and to display sets of documents related to particularlocations on a map. The company maintains a large, regularly up-dated database of maps and geographic locations to support thesearch-and-display features.16
SRI International’s Structured Evidential Argumentation System(SEAS), part of DARPA’s Project Genoa, structures evidence for andagainst a particular hypothesis by creating trees of yes-no questions inwhich the likely answer to a question depends on the answer tolower-level questions. The resulting tree guides analysts in gettingfrom low-level observational data (the evidence) to a logical guess ofwhether or not a particular hypothesis is true (the root question inthe tree).17 Similar in character to SEAS are the SAIC products Situ-ational Influence Assessment Model tool (SIAM) and Causeway, bothof which support the creation of influence networks that describehow events and analysts’ beliefs eventually lead to an educated guessof the validity of a hypothesis.18
15 i2’s home page is http://www.i2.co.uk; Analysts’ Notebook is also described in Waldrop(2003). Note that i2 makes a database called iBase that is specifically designed to work withAnalyst’s Notebook and other visualization tools and a program called iBridge that allowsAnalyst’s Notebook to access data in other databases.16 MetaCarta’s home page is http://www.metacarta.com; also described on In-Q-Tel’s homepage, http://www.in-q-tel.com.17 SEAS’s home page is http://www.ai.sri.com/~seas/, also described in Waldrop (2003).Project Genoa’s home page is http://www.darpa.mil/iao/Genoa.htm (accessed April 2003).18 The home page for SIAM and Causeway is http://www.inet.saic.com/welcome_to_saic.htm; Rosen and Smith (2000) provide an introduction to the software and its appli-cations. These products employ Bayesian influence networks to calculate numerical estimatesthat a given hypothesis is true given estimates for other, influencing hypotheses; Rosen andSmith (1996) describe the technique.

Systems Related to the ASAP Architecture 149
From the above list, it is clear that many possible existing andemerging systems might be useful within an ASAP system. Further-more, over time some of the systems will evolve, possibly become ex-tinct, and be replaced with the next generation of analysis tool. ASAPmust be built with these characteristics in mind and should resemblea carpenter’s tool with interchangeable accessories. Toward that end,a virtual machine architecture19 would be designed for ASAP agentsand the data flows within and between ASAP components. The vir-tual machine layer would normalize the internal data flows using ob-ject-oriented techniques and would allow data definitions and func-tionality to be extended and changed over time. Normalization filterswould be the integration components for the various pieces of tech-nology used for specific tasks. A data flow and analysis system that isbased on the concepts of problem solving would be developed, with alanguage containing such concepts as suspicions, primary evidence,supporting evidence, and hypotheses. Such a system would allowvarious components to be swapped in and out of use without desta-bilizing the operational base. Similar approaches to isolating systemdependencies (e.g., IBM’s CP/67, VM/370) have been successfullyused in computer operating systems since the early 1970s. 19 We use the classic IBM definition for virtual machine architecture (compare TechTarget’sWhatis.com IT encyclopedia, http://www.whatis.com). In this definition, a virtual machinearchitecture supports multiple software applications simultaneously. It brokers shared net-work resources between the applications and provides inter-application communicationswhile giving each application the impression that it is running on an individual computerand has sole control of that computer’s resources.


151
Bibliography
Advanced Research and Development Activity (ARDA). 2002. “Novel In-telligence from Massive Data.” Available at http://www.ic-arda.org/Novel_Intelligence/index.html.
Attensity Corporation. 2002. “Attensity Corporation.” Available at http://www.attensity.com.
BBN Technologies. 2002. “What We Do: Agent-Based Systems: CognitiveAgent Architecture.” Available at http://www.bbn.com/abs/caa.html.
Braun, Stephen, and Mark Fineman. 2002. “Sniper Suspects Slipped PastAuthorities Time and Again.” Los Angeles Times, November 30, p. A1.
Cabena, Peter, et al. (IBM International Technical Support Organization).1998. Discovering Data Mining: From Concept to Implementation. UpperSaddle River, NJ: Prentice Hall PTR.
Carbonell, Jaime, ed. 1990. Machine Learning: Paradigms and Methods.Cambridge: MIT Press.
Cloudmakers. “Cloudmakers.org,” 2002. Available at http://www.cloudmakers.org.
Congressional Joint Inquiry into September 11th. 2002. Final Report of theCongressional Joint Inquiry into September 11th. December 11.
Cougaar Group. 2002. “Cougaar Home Page.” Available at http://www.cougaar.org, accessed May 2002.
DARPA Information Awareness Office. 2003a. “Evidence Extraction andLink Discovery (EELD).” http://www.darpa.mil/iao/EELD.htm, acessedApril 2003.
______. 2002. “Genoa.” http://www.darpa.mil/iao/Genoa.htm, accessedApril 2003.

152 Out of the Ordinary
______. 2003b. “Genoa II.” http://www.darpa.mil/iao/GenoaII.htm, ac-cessed April 2003.
______. “Terrorism Information Awareness (TIA) System,” 2003c.http://www.darpa.mil/iao/TIASystems.htm, accessed April 2003.
______. “Wargaming the Asymmetric Environment (WAE),” 2003d.http://www.darpa.mil/iao/WAE.html, accessed April 2003.
Delugach, Harry. 2003. “Conceptual Graphs Home Page,” Available athttp://www.cs.uah.edu/~delugach/CG/, accessed April 2003.
Department of Justice. 2002. “Attorney General John Ashcroft UnveilsGateway Information Sharing Pilot Project in St. Louis, Missouri.” De-partment of Justice Press Release AG 02-589, October 9, 2002. Availableat http:// www.usdoj.gov/opa/pr/2002/October/02_ag_589.htm.
Diamond, John. 2002. “Terror Group’s Messengers Steer Clear of NSAEars.” USA Today, October 18, p. A12.
Dulles, Allen. 1963. The Craft of Intelligence. New York: Harper & Row.Eggen, Dan, and Glenn Kessler. 2002. “Signs of Terror Said to Increase;
Officials Say Tape, ‘Chatter’ Indicate Plans for Attacks.” WashingtonPost, Nov 14, p. A1.
Elliot, Michael. 2002. “How Al-Qaeda Got Back on the Attack.” Time,October 20.
Goering, Laurie. 2002. “I Shook Hands With Fire: Kenyan Farmer Talkedto Bomber Minutes Before They Blew Up Hotel.” Chicago Tribune, De-cember 2, p. 1.
Google. 2003. “Google Technology.” Available at http://www.google.com/technology/.
Heuer, Richard J. 1999. Psychology of Intelligence Analysis, CIA Center forthe Study of Intelligence. Available at http://www.cia.gov/csi/books/19104/index.html.
Hollywood, John S., and Kenneth N. McKay. Forthcoming. Supplying In-formation: Managing Information Networks to Meet User and MissionNeeds. Santa Monica, CA: RAND Corporation, MR-1756-NSA.
i2 Ltd. 2002. “i2 Investigative Analysis Software.” Available at http:// www.i2.co.uk,
In-Q-Tel. 2002. “In-Q-Tel. ” Available at http://www.in-q-tel.com.Intelligence Community Advanced Research and Development Activity.
2002. “Novel Intelligence from Massive Data.” Available athttp://www.icarda.org/Novel_Intelligence/.

Bibliography 153
Jhingran, A. D., N. Mattos, and H. Pirahesh. 2002. “Information Integra-tion: A Research Agenda.” IBM Systems Journal, Vol. 41, No. 4. Avail-able at http://www.research.ibm.com/journal/sj41-4.html.
Jones, R. V., 1978. Most Secret War. London: Hamish Hamilton.Manjoo, Farhad, 2001. “AI: Unraveling the Mysteries.” Wired News, June
28.McKay, K. N. 1992. “Production Planning and Scheduling: A Model for
Manufacturing Decisions Requiring Judgement.” Ph.D. dissertation,Department of Management Sciences, University of Waterloo, Ontario.
McKay, K. N., J. A. Buzacott, N. Charness, and F. R. Safayeni. 1992. “TheScheduler’s Predictive Expertise: An Interdisciplinary Perspective,” in G.I. Doukidis and R. J. Paul (eds.), Artificial Intelligence in Operational Re-search—Journal of the Operational Research Society, London: MacmillanPress, pp. 139–150.
McKay K. N., F. R. Safayeni, and J. A. Buzacott. 1995a. “Schedulers &Planners: What and How Can We Learn From Them?” In D. E. Brownand W. T. Scherer (eds.), Intelligent Scheduling Systems, Boston: KluwerPublishers, pp. 41–62.
______. 1995b. “Common Sense Realities in Planning and SchedulingPrinted Circuit Board Production.” International Journal of ProductionResearch, Vol. 33, No. 6, pp. 1587–1603.
McKay, K. N., and V.C.S. Wiers. 2003. “Planning, Scheduling and Dis-patching Tasks in Production Control.” International Journal on Cogni-tion, Technology and Work, Vol. 5, No. 2, June, pp. 82–93.
Meserve, Jeanne, et al. 2002. “Two Arrested in Sniper Case.” CNN.com,October 24.
MetaCarta, Inc. 2003. “MetaCarta: The Geographic Text Search Com-pany.” Available at http://www.metacarta.com,
Mohomine, Inc. 2002. “Mohomine: Making Computers Understand Peo-ple.” Available at http://www.mohomine.com.
Murdock, William J., David W. Aha, and Leonard A. Breslow. 2002.“AHEAD: Case-Based Process Model Explanation of AsymmetricThreats.” Navy Center for Applied Research in Artificial IntelligenceTechnical Note AIC-02-203. Available at http://www.aic.nrl.navy.mil/~aha/papers/AIC-02-203.pdf, accessed October 2002.
National Institute of Standards and Technology Information Access Divi-sion. 2001. “TIPSTER Text Program.” Available at http://www.

154 Out of the Ordinary
itl.nist.gov/iad/894.02/related_projects/tipster/overv.htm, accessed Janu-ary 2001.
Neustadt, Richard E., and Ernest R. May. 1988. Thinking in Time: TheUses of History for Decision Makers. New York: Free Press.
“One Year On: The Hunt for al-Qaida.” 2002. The Guardian, September5, p. 6.
PC AI Magazine. 2002. “PC AI—Blackboard Technology.” Available athttp://www.pcai.com/web/ai_info/blackboard_technology.html.
Rich, Elaine. 1983. Artificial Intelligence. New York: McGraw-Hill.Risen, James. 2003. “US Increased Alert on Evidence Qaeda was Planning
Two Attacks.” New York Times, February 14.Rolington, Alfred. 2002. “9/11: In Search of Context and Meaning.” Jane’s
International Security News, September 11.Rosen, Julie A., and Wayne L. Smith. 1996. “Influence Net Modeling with
Causal Strengths: An Evolutionary Approach.” Proceedings of Commandand Control Research and Technology. Available at http://www.inet.saic.com/, accessed April 2003.
______, 2000. “Influence Net Modeling for Strategic Planning: A Struc-tured Approach to Information Operations.” Phalanx, Vol. 33, No. 4.Available at http://www.inet.saic.com/. Accessed April 2003.
Roth, M. A., D. C. Wolfson, J. C. Kleewein, and C. J. Nelin. 2002. “In-formation Integration: A New Generation of Information Technology.”IBM Systems Journal, Vol. 41, No. 4. Available at http://www.research.ibm.com/journal/sj41-4.html.
Sieberg, Daniel. 2001. “Reality Blurs, Hype Builds with Web ‘A.I.’ Game.”CNN.com, June 13.
Science Applications International Corporation. 2002. “Welcome to SAIC’sInfluence Net Web Site.” Available at http://www.inet.saic.com/welcome_to_saic.htm.
Senator, Ted. 2002. “Evidence Extraction and Link Discovery Program.”Presentation at DARPATech 2002 Symposium, August 2. Available athttp://www.darpa.mil/DARPATech2002/presentations/iao_pdf/speeches/SENATOR.pdf.
Soltis, Andy. 2003. “WTC Vid Declares Planning of Attack.” New YorkPost, March 4.
Sowa, John F. 1974. “Conceptual Graphs for a Database Interface,” IBMJournal of Research and Development. Volume 20, No. 4, pp. 336–357.

Bibliography 155
Sowa, John F. 2000. Knowledge Representation: Logical, Philosophical, andComputational Foundations. Pacific Grove, CA: Brooks Cole PublishingCo.
SRI International. 2000. “SEAS: A Corporate Memory of Analytic Prod-ucts and Methods.” Available at http://www.ai.sri.com/~seas/.
Stratify, Inc. 2003. “Stratify—Discover More.” Available at http://www.stratify.com/.
Systems Research and Development. 2002. “NORA: Non-Obvious Rela-tionship Awareness.” Available at http://www.srdnet.com/nora.htm.
Tacit Knowledge Systems, Inc. 2002. “Tacit: Enterprise CollaborationManagement.” Available at http://www.tacit.com.
TechTarget. 2003. “WhatIs.com.” Available at http://www.whatis.com.“Videotape Shows Preparation for US Attacks—ABC.” 2003. Reuters,
March 4.Waldrop, Mitchell. 2003. “Can Sensemaking Keep Us Safe?” Tech-
nology Review. Available at http://www.technologyreview.com/articles/waldrop0303.asp.
Winer, David. 2002. “The History of Weblogs.” Available athttp://newhome.weblogs.com/historyOfWeblogs. Accessed May 2002.


![State of the World 2015: Confronting Hidden Threats to Sustainability [Preview]](https://img.pdfslide.us/doc/110x75/579056041a28ab900c9768ca/state-of-the-world-2015-confronting-hidden-threats-to-sustainability-preview.jpg)