Embed Size (px)
Citation preview
Our Quality Journey using Lean Six Sigma and other
Quality Improvement tools
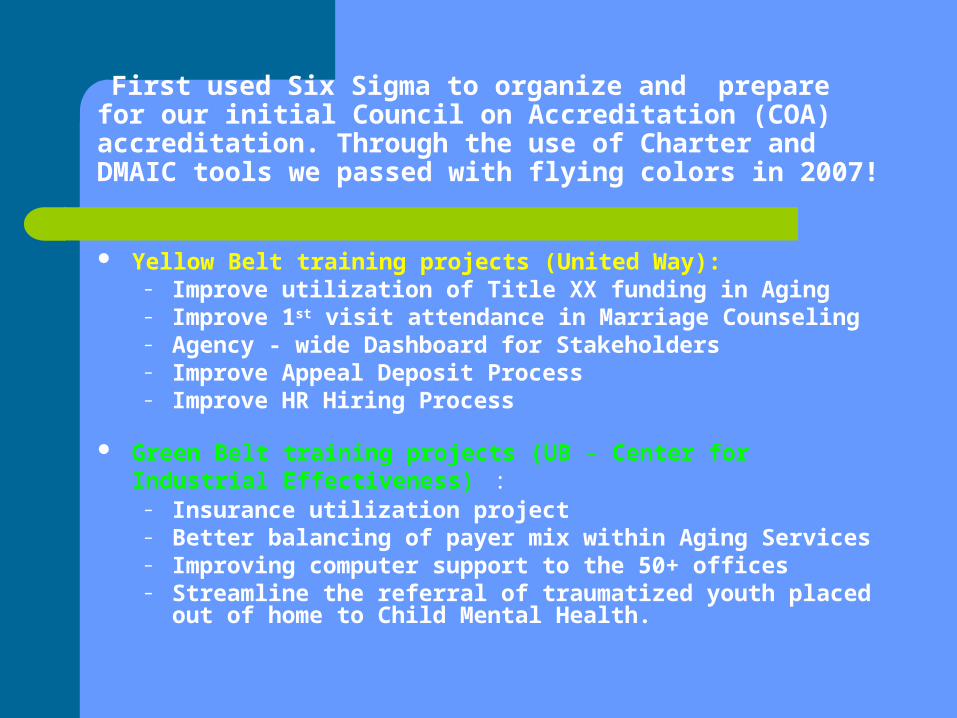
First used Six Sigma to organize and prepare for our initial Council on Accreditation (COA) accreditation. Through the use of Charter and DMAIC tools we passed with flying colors in 2007!
Yellow Belt training projects (United Way):– Improve utilization of Title XX funding in Aging– Improve 1st visit attendance in Marriage Counseling– Agency - wide Dashboard for Stakeholders– Improve Appeal Deposit Process– Improve HR Hiring Process
Green Belt training projects (UB - Center for Industrial Effectiveness) :
– Insurance utilization project– Better balancing of payer mix within Aging Services– Improving computer support to the 50+ offices– Streamline the referral of traumatized youth placed out of
home to Child Mental Health.
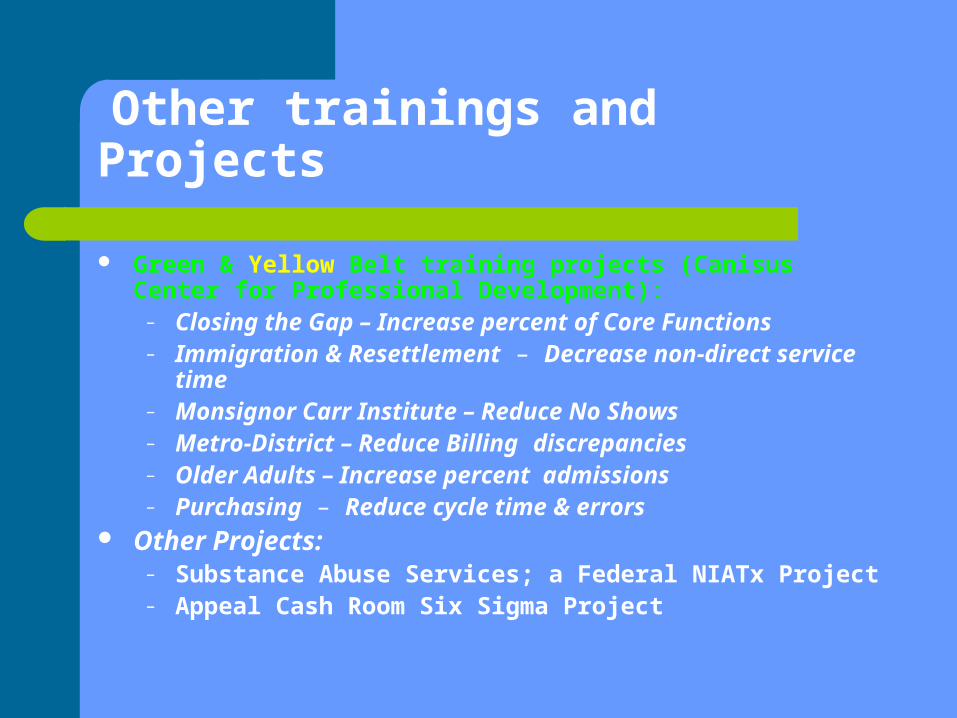
Other trainings and Projects
Green & Yellow Belt training projects (Canisus Center for Professional Development):
– Closing the Gap – Increase percent of Core Functions – Immigration & Resettlement – Decrease non-direct service
time– Monsignor Carr Institute – Reduce No Shows – Metro-District – Reduce Billing discrepancies – Older Adults – Increase percent admissions– Purchasing – Reduce cycle time & errors
Other Projects:– Substance Abuse Services; a Federal NIATx Project– Appeal Cash Room Six Sigma Project
Sample of Project Tools/ Products
Improved utilization of Federal funding in Aging programs – One of our first Yellow Belt training projects through the United Way trainers; William Hill PhD & Joe Rocasano
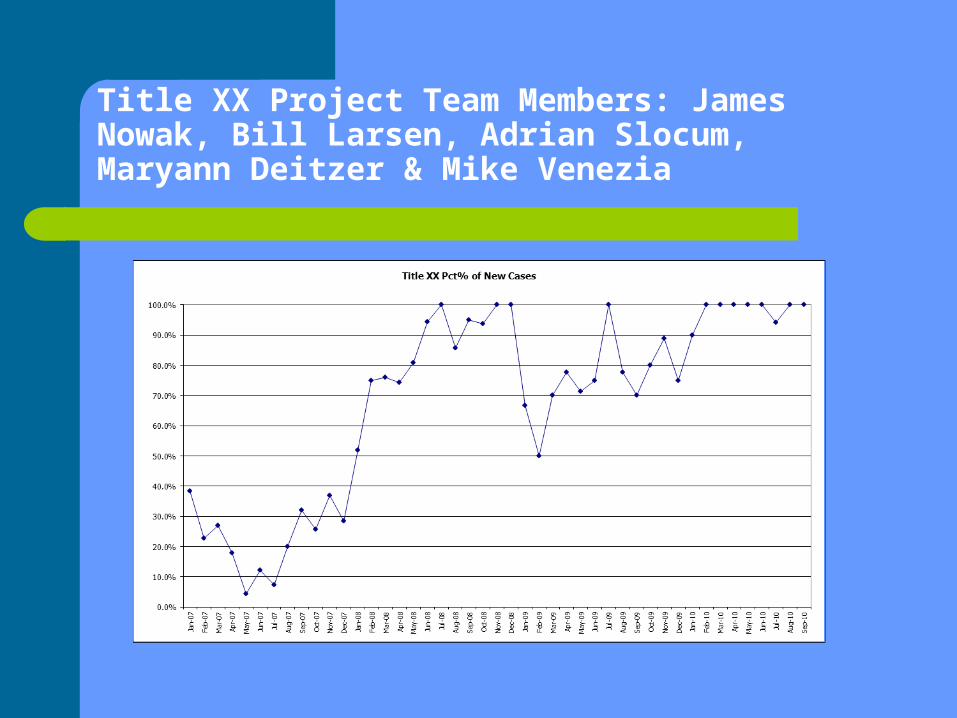
Title XX Project Team Members: James Nowak, Bill Larsen, Adrian Slocum, Maryann Deitzer & Mike Venezia
Client Engagement Project- Yellow Belt
Marriage Counseling Team Members: Arlene Kaukas, Jennifer
Przynosch & David Catalano Goals and impact:
– Focus on improving 1st appointment rate.– Streamlined intake method, – 6% increase in ‘show rate’.
Develop Agency-wide Dashboard- Yellow Belt
• Team Members: Andy Aprile, Jane Minichelli, Bill Sukaly, Erin Postulka, Barb Griesmann
- Went from a low level of performance reporting compliance to nearly all.
- Quality of outcome measures improved- Stronger commitment to use Dashboard/
Scoreboard tied to Strategic Plan
Appeal Deposit Process
Team Members:Therese D. Bianchi,T.J. Jakubowicz,Janet Kraus, Paul Seitz, Sr. Mary McCarrick OSF
Goal: Speed up reconciliation of deposits Results in days instead of months
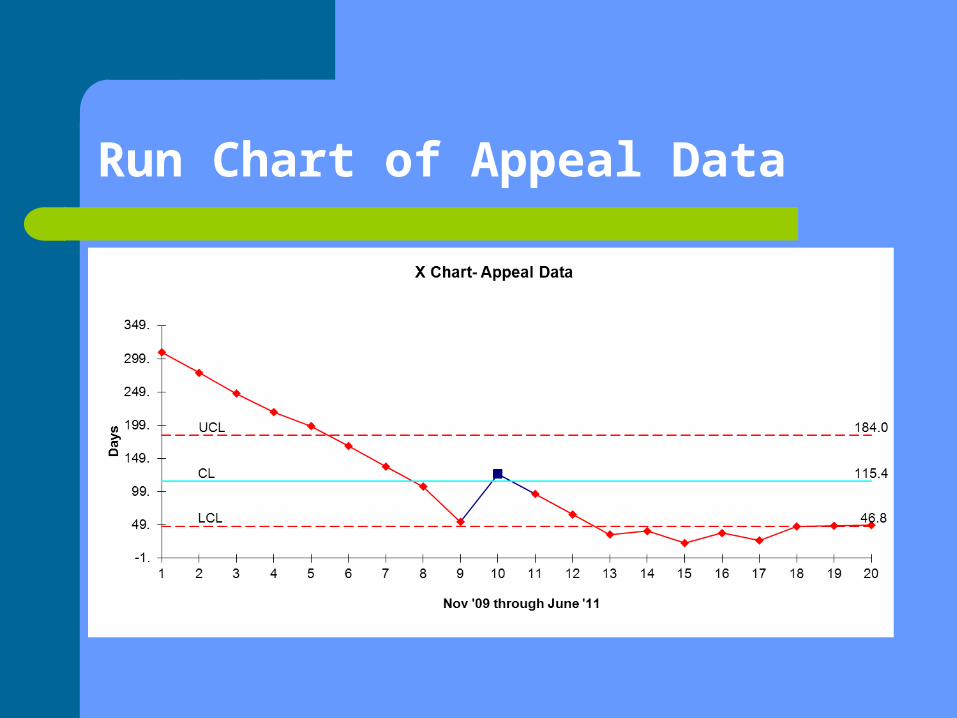
Run Chart of Appeal Data
Green Belt Projects via a Community Health Foundation Grant (UB – Center for Industrial Effectiveness)
Impact of counselor assignment re: revenue
Better balancing of payer mix within Aging Services
Improving computer support to the 50+ offices
Streamline the referral of traumatized youth placed out of home to Child Mental Health.
Insurance Utilization ProjectTeam Members: Tracey Miers, Lorraine Rinus, Meichle Latham, June Pamrow, Barb Griesmann, Beth Bishop, Dave Catalano
• Impact on lost revenue and improve the process-reduction in error rate from 25% to 17%.
This project prompted the agency to seek changes in the third party payer agreements as well as a rethinking about compensation of credentialed staff.
Credentialing of all eligible staff for insurance reimbursement Significantly increased revenue (estimated over $31,000 in just
one department) These actions will have a direct impact on the sustainability of
the system changes and ability to provide client care to a larger number of people.
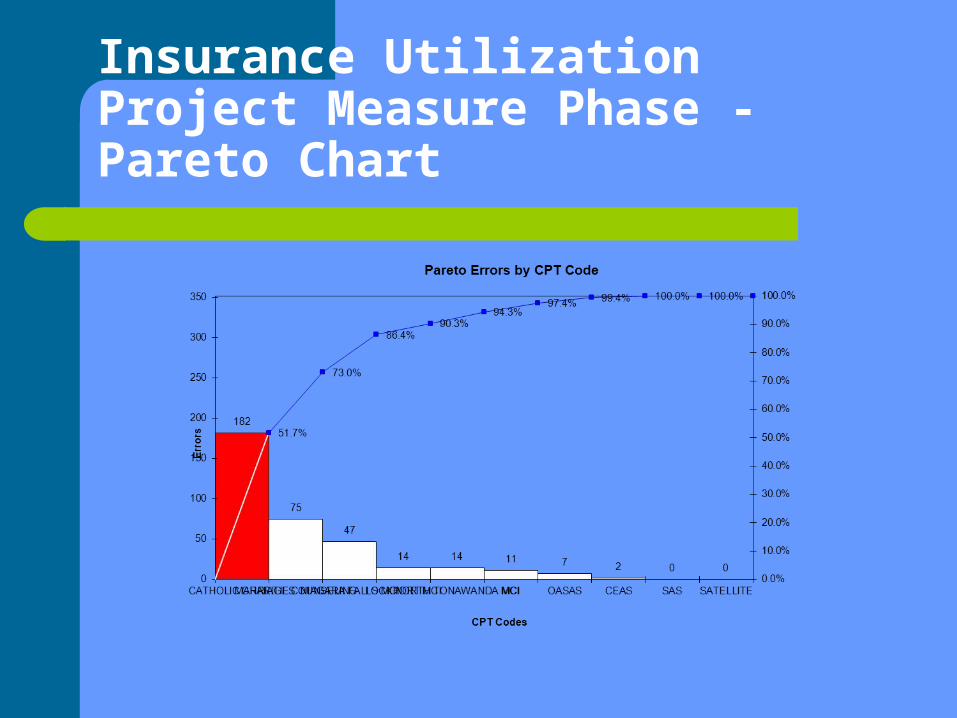
Insurance Utilization Project Measure Phase - Pareto Chart
Better balancing of payer mix within Aging Services
Team Members: Jim Nowak, Bill Larsen, Tony Szakacs, Susan Wollenberg, Mike Smith & Erin Pustulka
Balancing payer mix with in that Aging Services to be less dependent on declining Appeal funds.
The project did provide the data to negotiate a much higher reimbursement rate with hospital providers.
Improving computer support to the 50+ offices
Team Members: Andrew Aprile, Dave Wirtner, Mike Sobczak, Angel Feness, Kate Hacker & Jesse Zeiders
This project did identify new ways to monitor and improve internal IT services
The findings and operational recommendations were presented to leadership as improved procedures and methods to monitor IT and other internal support services.
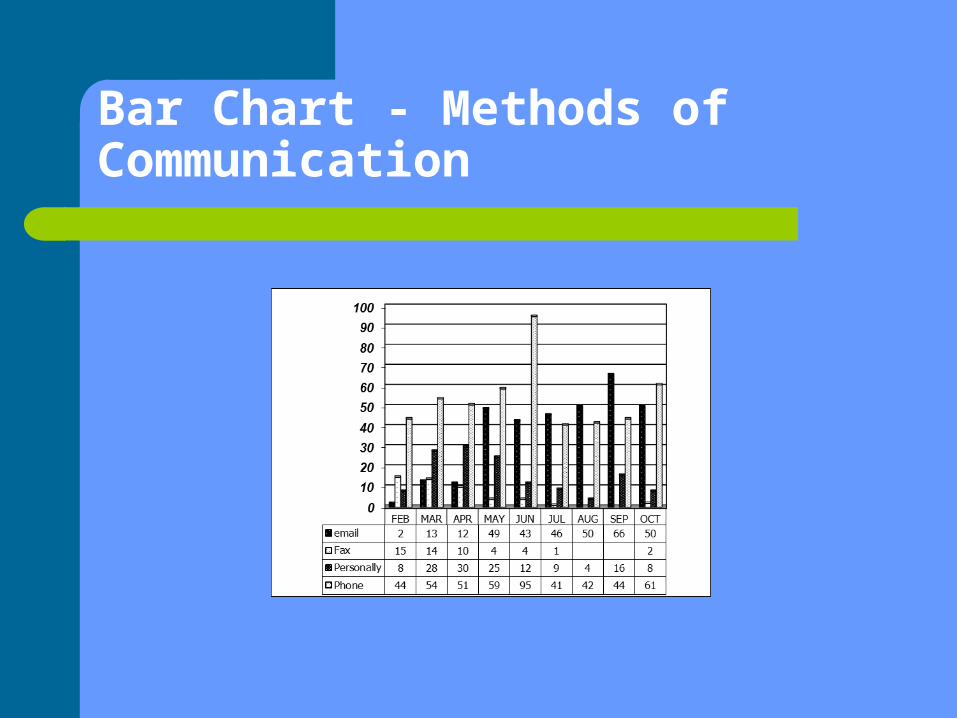
Bar Chart - Methods of Communication
Improve Mental Health services for traumatized youth placed out of home
Streamlining the referral of Foster Care and Adoption children to Monsignor Carr Institute which resulted in:
A dramatic reduction in wait time for children 33 to 11 days.
A greater satisfaction level of internal referral sources from 33% to 100% satisfaction.
This project was expanded to other populations within Catholic Charities
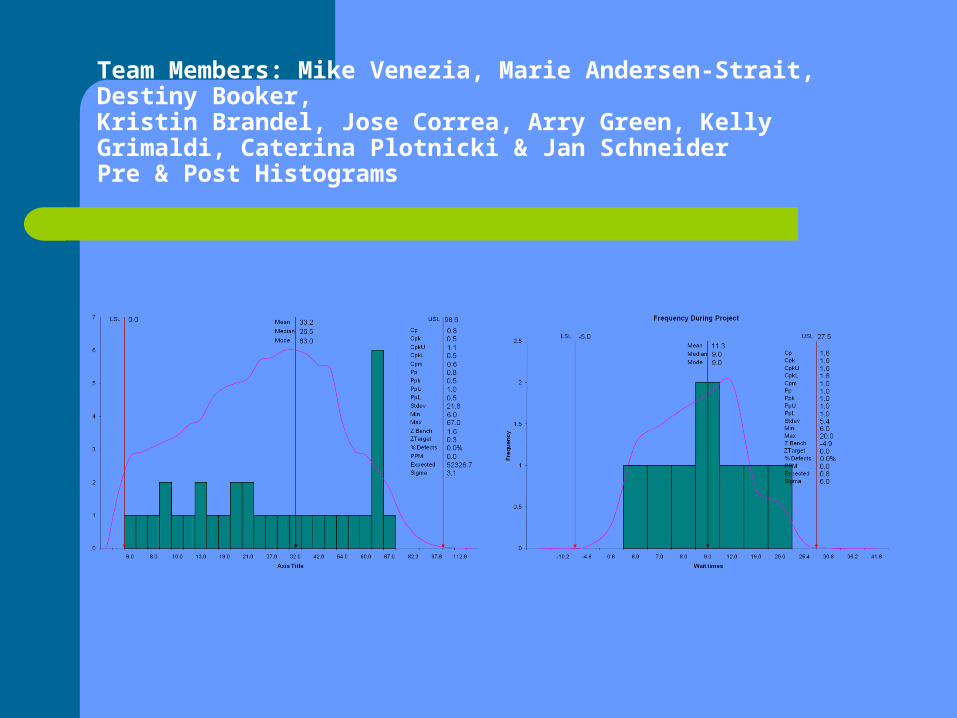
Team Members: Mike Venezia, Marie Andersen-Strait, Destiny Booker,Kristin Brandel, Jose Correa, Arry Green, Kelly Grimaldi, Caterina Plotnicki & Jan SchneiderPre & Post Histograms
Closing the Gap – Increase Percent Core Functions from 57% to 70%
Team Members: Andrea Meyers, Cheri Alvarez, Alisha Baggiano, Jillian Miller, Susan Seawood
The result of this intervention is astounding! Site Facilitators increased the amount of time they spend on 5 Key Functions to 88%!
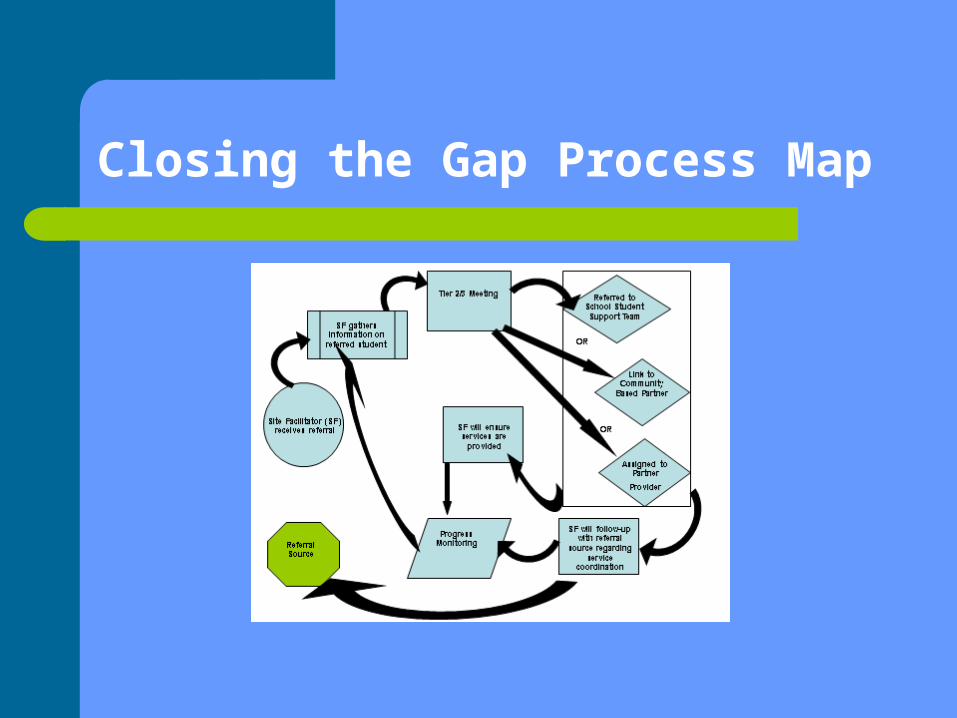
Closing the Gap Process Map
Immigration & Resettlement
Team Members: William Sukaly, Dennis Walczyk, Diana Nowak, Pat Zimmer, & Carolyn Kwiatkowski
Decrease non-direct service time
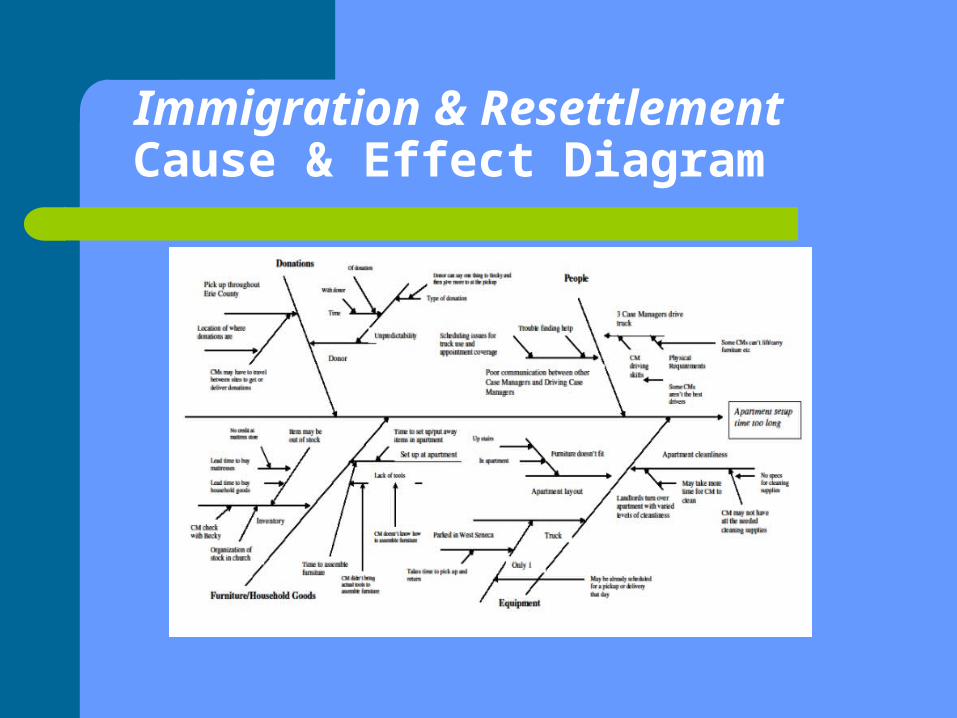
Immigration & Resettlement Cause & Effect Diagram
Monsignor Carr Institute
Team Members: Janice Schneider, Kristin Brandel, Bernie Arnesen & David Wirtner
Reduce No-Shows The number of No-Shows decreased by
2,077 visits which represents an increase in income of approximately $186,930 and resulted in an increase of 47% in productivity!
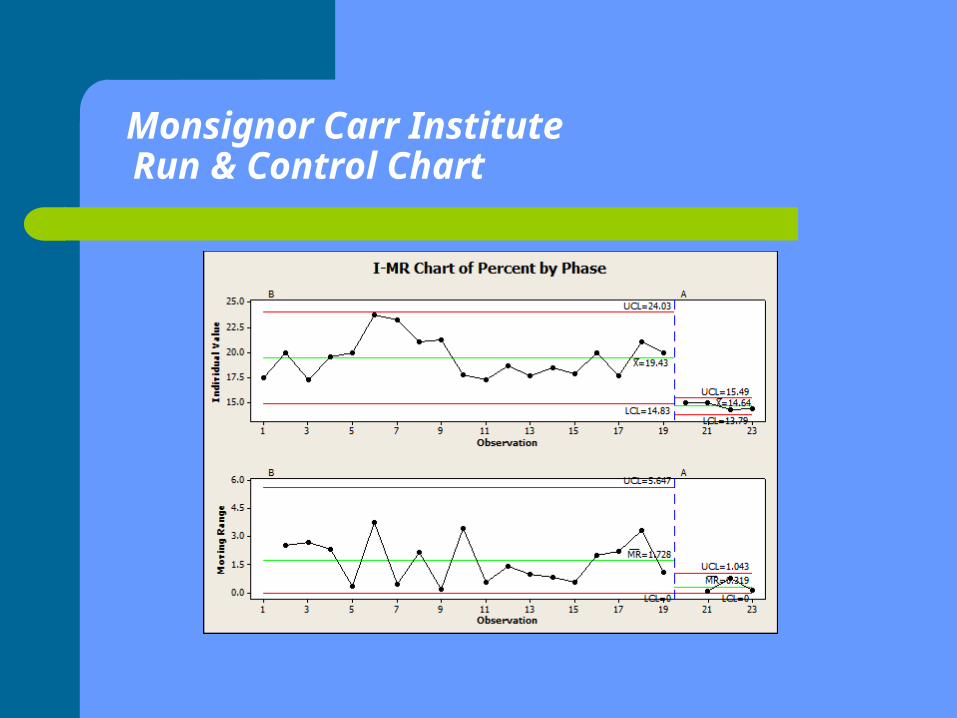
Monsignor Carr Institute Run & Control Chart
Family & Community Services Billing Process
Team Members: Marie Andersen-Strait, Jessica Schroff & Sandy Smith
$19,440 represents the potential of reduction in loss/ increased revenue by completing this improvement process
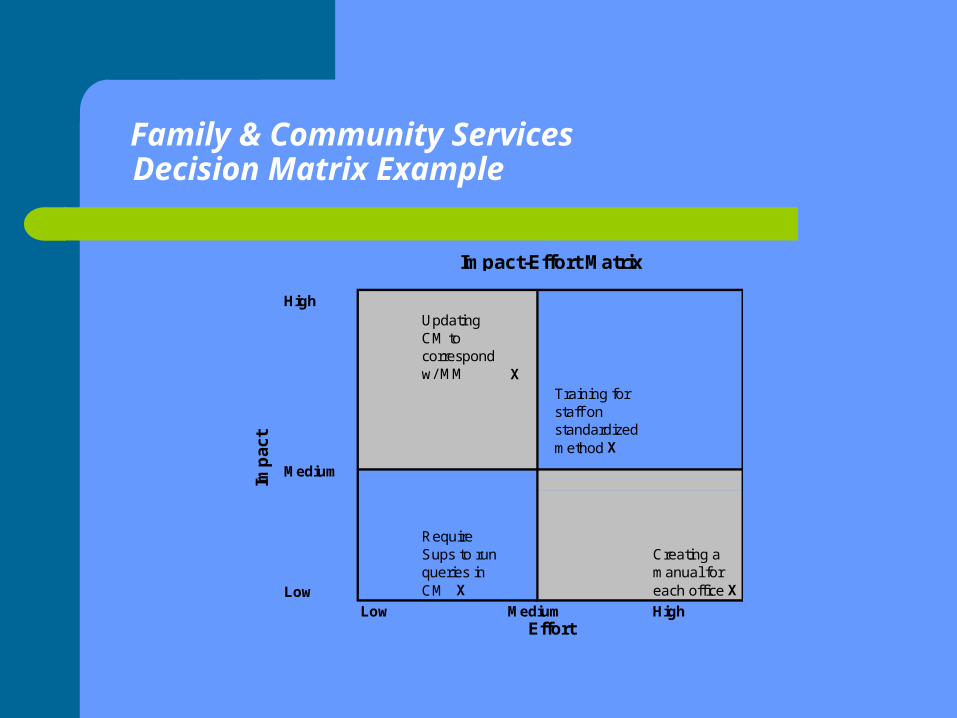
Family & Community ServicesDecision Matrix Example
HighUpdating CM to correspond w/ MM X
Training for staff on standardized method X
Low
Require Sups to run queries in CM X
Creating a manual for each office X
Low HighEffort
Imp
act
Impact-Effort Matrix
Medium
Medium
Older AdultsStandardizing the Intake Process
Team Members: Jim Nowak, Tara Pace, Erin Pustulka, Tony Szakacs & Beverly Eagan
Standardizing the Intake Process shifted overall conversion rate for Older Adult Services from 30% to 47%
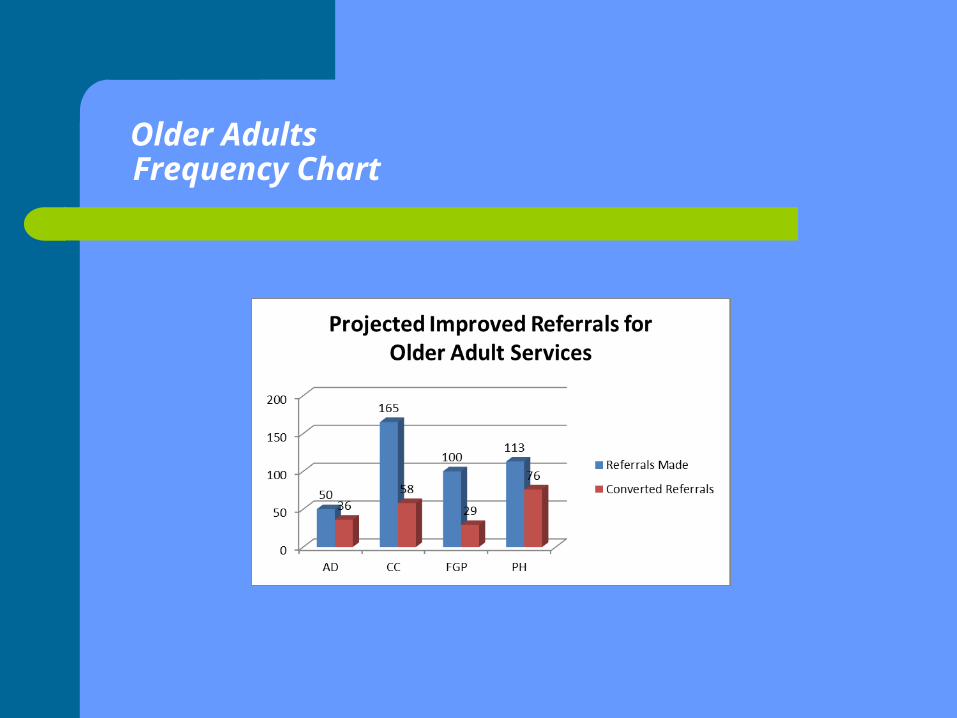
Older AdultsFrequency Chart
Purchasing
Team Members: Terry Bianchi, Elly Fialkowski, Angel Feness, Karen Metz & Pam Rich
Goal: reduce cycle time from 43 to 36 days Realized 20.9 days, a 50% reduction!
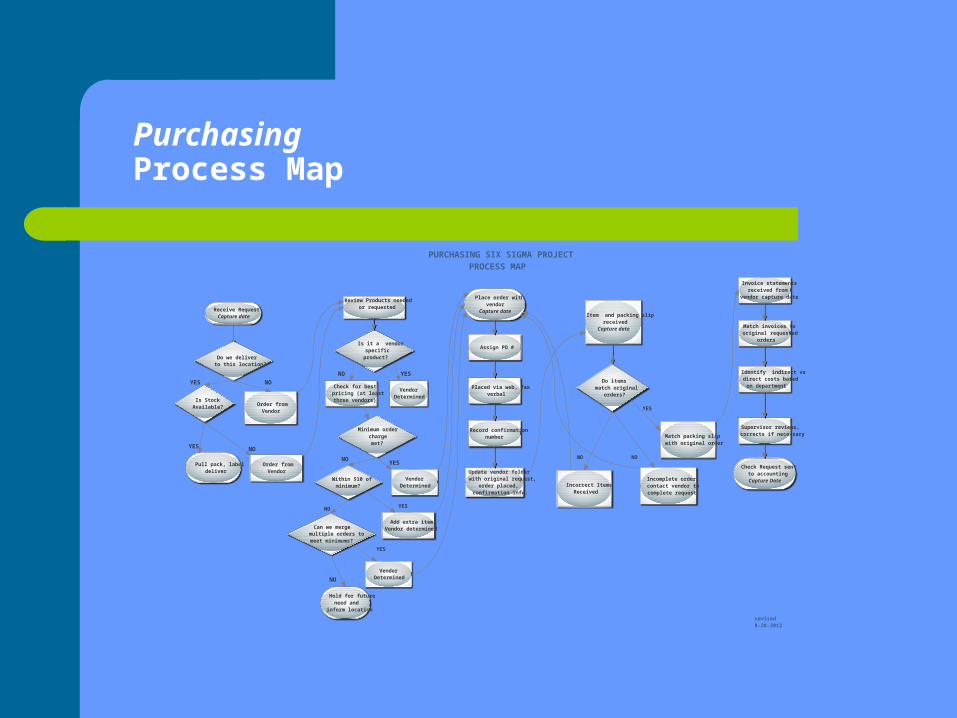
PurchasingProcess Map
Receive RequestCapture date
Do we deliverto this location?
Order fromVendor
Pull pack, labeldeliver
Order fromVendor
Review Products neededor requested
Is it a vendorspecificproduct?
VendorDetermined
Check for bestpricing (at leastthree vendors)
Minimum orderchargemet?
VendorDetermined
YES
Hold for futureneed and
inform location
Place order withvendor
Capture date
Assign PO #
Placed via web, faxverbal
Record confirmationnumber
Update vendor folderwith original request,
order placed,confirmation info.
Invoice statementsreceived from
vendor capture date
Match invoices tooriginal requested
orders
Identify indirect vsdirect costs basedon department
Supervisor reviews,corrects if necessary
Check Request sentto accountingCapture Date
YES NO
Is StockAvailable?
NO YES
NO
YES
NO
YES NO
Within $10 ofminimum?
Can we mergemultiple orders tomeet minimums?
NO
Add extra itemVendor determined
VendorDetermined
YES
Item and packing slipreceived
Capture date
Do itemsmatch original
orders?
Match packing slipwith original order
Incomplete order,contact vendor tocomplete request
NO
YES
revised8-28-2012
NO
Incorrect ItemsReceived
PURCHASING SIX SIGMA PROJECTPROCESS MAP
Substance Abuse Services; a Federal NIATx Project
Team Leader: Bernie Arnesen Used a rapid cycle PDSA improvement method Increased the average show rate for the second
clinical appointment from 33.3% to 77.7%. Using a welcome packet, we had a net increase of
112% in income for the second clinical visit. These percentages remained true six months after
adopting the new procedure
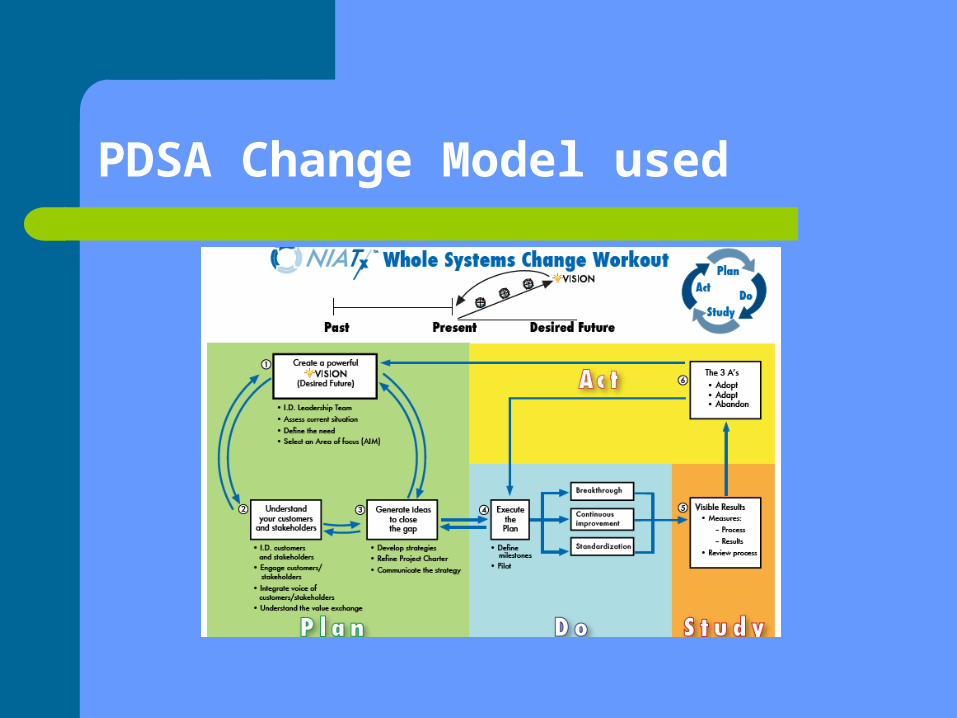
PDSA Change Model used
Six Sigma Cash Room Project
• Team Members: Chuck Marra, Terry Bianchi, Cindy Scibetta & Jim McNamara
• Through cash room re-design and scale improved work times and significantly reduced idle times
• Improved the average number of days and outliers from envelope receipt to deposit by 50%
– Average total work days – from 9 to 4.5– % of outliers (>20 days) from 6% to 3%
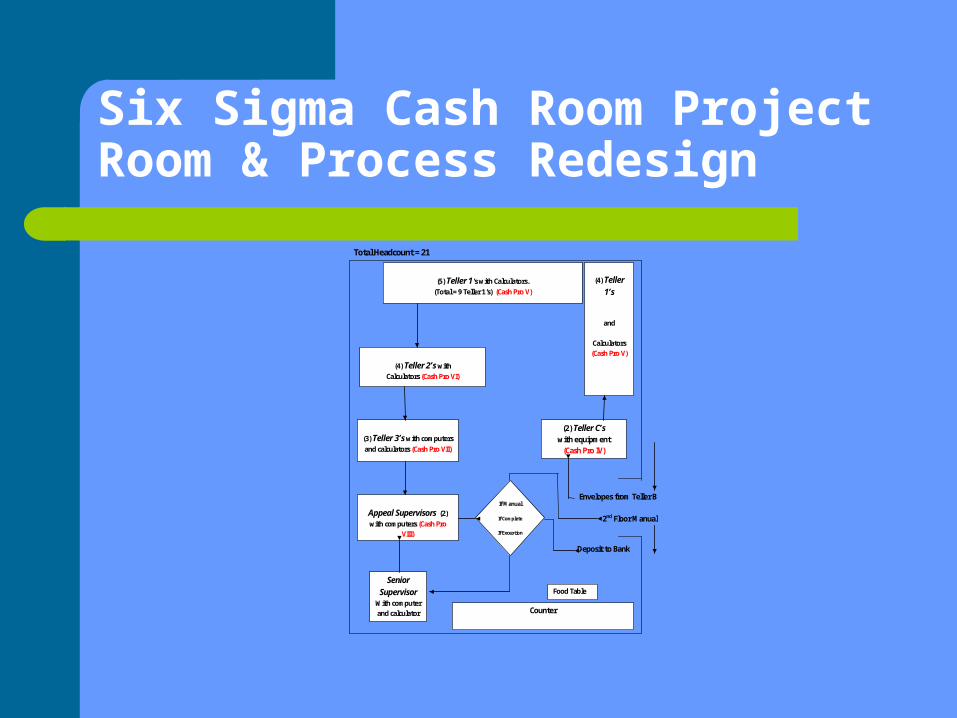
Six Sigma Cash Room ProjectRoom & Process Redesign
Total Headcount = 21
Envelopes from Teller B 2nd Floor Manual Deposit to Bank
(2) Teller C’s with equipment
(Cash Pro IV)
(4) Teller 1’s
and
Calculators (Cash Pro V)
(5) Teller 1’s with Calculators. (Total = 9 Teller 1’s) (Cash Pro V)
(4) Teller 2’s with Calculators (Cash Pro VI)
(3) Teller 3’s with computers and calculators (Cash Pro VII)
Appeal Supervisors (2) with computers (Cash Pro
VIII)
Senior Supervisor
With computer and calculator
Counter
If Manual
If Complete
If Exception
Food Table
Lessons Learned
Like learning to drive a stick shift – Challenge to learn
Need for Charter and well scoped out charge
Real problem may not be ‘the problem’
Data changes the conversation
Need Leadership support
It works better than ‘see what you can do’ or ‘try harder
Don’t need to shoot a fly with elephant gun
Great return on investment Shared vision & knowledge
– Take a learning stance Trust the process – It works!

For more information, contactMichael Venezia, LCSWR, ASQ-CQM, CLSSGBDirector of Quality Improvement (716) 218-1450 ext 2098 [email protected]