Embed Size (px)
Citation preview

PRELIMINARY DECISIONSA Power Networks
determination 2015−16 to 2019−20
OverviewApril 2015
0 Overview | SA Power Networks' determination 2015–20
© Commonwealth of Australia 2015
This work is copyright. In addition to any use permitted under the Copyright Act 1968, all material contained within this work is provided under a Creative Commons Attributions 3.0 Australia licence, with the exception of:
the Commonwealth Coat of Arms
the ACCC and AER logos
any illustration, diagram, photograph or graphic over which the Australian Competition and Consumer Commission does not hold copyright, but which may be part of or contained within this publication. The details of the relevant licence conditions are available on the Creative Commons website, as is the full legal code for the CC BY 3.0 AU licence.
Requests and inquiries concerning reproduction and rights should be addressed to the Director, Corporate Communications,Australian Competition and Consumer Commission, GPO Box 4141, Canberra ACT 2601or [email protected].
Inquiries about this publication should be addressed to:
Australian Energy RegulatorGPO Box 520Melbourne Vic 3001
Tel: (03) 9290 1444Fax: (03) 9290 1457
Email: [email protected]
1 Overview | SA Power Networks' determination 2015–20
NoteThis attachment forms part of the AER's preliminary decision on SA Power
Networks' 2015–20 distribution determination. It should be read with all other parts of the preliminary decision.
The preliminary decision includes the following documents:
Overview
Attachment 1 – Annual revenue requirement
Attachment 2 – Regulatory asset base
Attachment 3 – Rate of return
Attachment 4 – Value of imputation credits
Attachment 5 – Regulatory depreciation
Attachment 6 – Capital expenditure
Attachment 7 – Operating expenditure
Attachment 8 – Corporate income tax
Attachment 9 – Efficiency benefit sharing scheme
Attachment 10 – Capital expenditure sharing scheme
Attachment 11 – Service target performance incentive scheme
Attachment 12 – Demand management incentive scheme
Attachment 13 – Classification of services
Attachment 14 – Control mechanism
Attachment 15 – Pass through events
Attachment 16 – Alternative control services
Attachment 17 – Negotiated services framework and criteria
Attachment 18 – Connection policy
2 Overview | SA Power Networks' determination 2015–20
Contents
Note..................................................................................................................2
Contents...........................................................................................................3
Shortened forms..............................................................................................5
1 Our preliminary decision..........................................................................7
1.1 Decision and impact..........................................................................8
1.2 Contribution to the achievement of the NEO...................................9
1.2.1 Rate of return..................................................................................11
1.2.2 Depreciation—return of capital.......................................................13
1.2.3 Operating expenditure....................................................................13
1.2.4 Consumer engagement..................................................................15
1.3 Assessment of options under the NEO..........................................15
1.4 Structure of the overview................................................................16
2 Key elements of the building blocks.....................................................17
2.1 The building block approach..........................................................18
2.2 Regulatory asset base.....................................................................19
2.3 Rate of return (return on capital)....................................................21
Our approach.................................................................................................22
Return on debt...............................................................................................23
Return on equity............................................................................................24
2.4 Value of imputation credits (gamma).............................................26
2.5 Regulatory depreciation (return of capital)....................................27
2.6 Capital expenditure..........................................................................28
2.7 Operating expenditure.....................................................................31
2.8 Corporate income tax......................................................................33
3 Overview | SA Power Networks' determination 2015–20
3 Service classification, incentive schemes and other issues..............35
3.1 Service classification and control mechanism..............................35
3.2 Alternative control services............................................................36
3.3 Incentive schemes...........................................................................37
Efficiency benefit sharing scheme.................................................................37
Capital expenditure sharing scheme.............................................................38
Service target performance incentive scheme..............................................39
Demand management incentive scheme......................................................39
4 Regulatory framework............................................................................41
4.1 Understanding the NEO...................................................................43
4.2 The 2012 framework changes.........................................................44
4.2.1 Interrelationships............................................................................45
5 Process....................................................................................................47
5.1 Better Regulation program..............................................................47
5.2 Our engagement during the decision making process................47
5.2.1 Revocation and substitution of preliminary decision.......................49
6 Next steps................................................................................................50
A Constituent decisions.............................................................................51
B List of submissions................................................................................54
4 Overview | SA Power Networks' determination 2015–20

Shortened formsShortened form Extended form
AEMC Australian Energy Market Commission
AEMO Australian Energy Market Operator
AER Australian Energy Regulator
augex augmentation expenditure
capex capital expenditure
CCP Consumer Challenge Panel
CESS capital expenditure sharing scheme
CPI consumer price index
DRP debt risk premium
DMIA demand management innovation allowance
DMIS demand management incentive scheme
distributor distribution network service provider
DUoS distribution use of system
EBSS efficiency benefit sharing scheme
ERP equity risk premium
Expenditure Assessment GuidelineExpenditure Forecast Assessment Guideline for Electricity Distribution
F&A framework and approach
MRP market risk premium
NEL national electricity law
NEM national electricity market
NEO national electricity objective
NER national electricity rules
NSP network service provider
opex operating expenditure
PPI partial performance indicators
PTRM post-tax revenue model
5 Overview | SA Power Networks' determination 2015–20
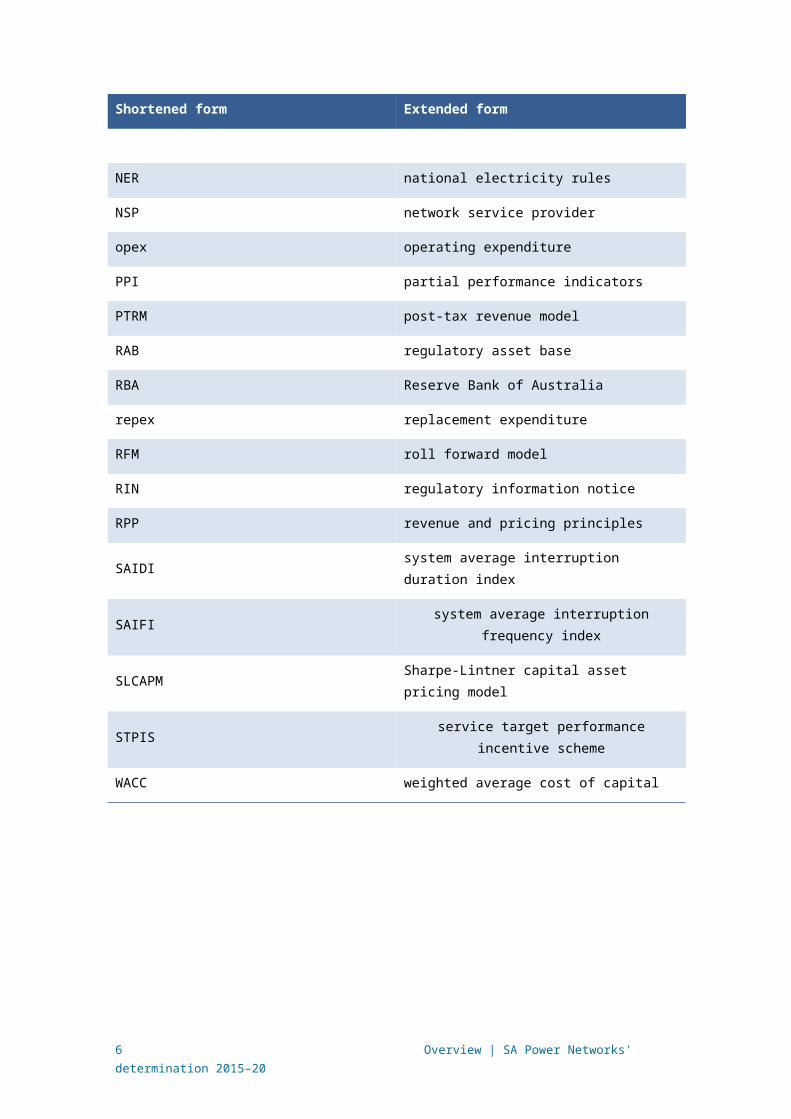
Shortened form Extended form
RAB regulatory asset base
RBA Reserve Bank of Australia
repex replacement expenditure
RFM roll forward model
RIN regulatory information notice
RPP revenue and pricing principles
SAIDI system average interruption duration index
SAIFI system average interruption frequency index
SLCAPM Sharpe-Lintner capital asset pricing model
STPIS service target performance incentive scheme
WACC weighted average cost of capital
6 Overview | SA Power Networks' determination 2015–20

1 Our preliminary decisionThe Australian Energy Regulator (AER) is responsible for the economic regulation of electricity transmission and distribution systems in all states and territories except Western Australian and the Northern Territory. SA Power Networks is the Distribution Network Service Provider (distributor) responsible for providing electricity distribution services in South Australia. We regulate the revenue SA Power Networks can recover from its customers.
The National Electricity Law (NEL) and National Electricity Rules (NER) provide the regulatory framework under which we operate. Most relevantly, they set out how we must assess a regulatory proposal and make our decision.
The National Electricity Objective (NEO) sits at the centre of the NEL and NER. The NEO is to promote efficient investment in, and efficient operation and use of, electricity services for the long term interests of consumers of electricity with respect to─
price, quality, safety, reliability and security of supply of electricity; and
the reliability, safety and security of the national electricity system.1
Under the NER, SA Power Networks must submit a regulatory proposal to us for approval.2 The central component of a regulatory proposal is the amount of revenue SA Power Networks proposes to recover from consumers over the 2015−20 regulatory control period.3 We must assess SA Power Networks' proposal, using the NER's detailed rules about constituent components of a regulatory proposal. We must decide whether to accept SA Power Networks' proposal. If we do not accept that SA Power Networks' proposal complies with the requirements of the NER, we must substitute an alternative amount of revenue that we are satisfied does comply. We must undertake this assessment and make this decision in a manner that will or is likely to contribute to the achievement of the NEO to the greatest degree.
We regulate SA Power Networks' revenue, not its costs. SA Power Networks must then decide how best to use this revenue in providing distribution services and fulfilling its obligations. This provides incentives for distributors, such as SA Power Networks, to operate their businesses efficiently and, in the long run, at least cost to consumers. It also provides incentives for distributors to innovate and invest in response to changes in consumer needs and productive opportunities.4 This is consistent with economic efficiency principles. It also means that the person who is best able to manage a risk, generally carries that risk.
SA Power Networks submitted a regulatory proposal in October 2014. We also received submissions, from various stakeholders, for our consideration with most received by the closing date for submissions of 31 January 2015.
1 NEL, s. 7.2 NER, cl. 6.8.2.3 NER, cll. 6.3.1 and 6.8.2.4 Hansard, SA House of Assembly, 9 February 2005 p. 1452.
7 Overview | SA Power Networks' determination 2015–20
This overview, together with its attachments, constitutes our preliminary decision on SA Power Networks' regulatory proposal. The overview sets out the issues we covered, the conclusions we made, and how those conclusions were reached. We also explain why we are satisfied our preliminary decision contributes to the achievement of the NEO to the greatest degree and why we do not consider that SA Power Networks' proposal contributes to the achievement of the NEO to a satisfactory degree.
In our attachments we set out detailed analysis of the constituent components that make up SA Power Networks' proposal and our decision on each of them. While each attachment relates to a specific topic or component, our decision should be read as a whole. This is because aspects of our preliminary decision interrelate and inform one another.
1.1 Decision and impactOur preliminary decision is that SA Power Networks can recover $3211.3 million ($ nominal) from consumers over the 2015–20 regulatory control period. Figure 1 below illustrates our overall decision.
Figure 1 SA Power Networks' total proposed revenue and AER preliminary decision ($million, 2014–15)
0
100
200
300
400
500
600
700
800
900
1000
Totalrevenue$m (real2014-15)
Actual Allowed Proposed (smoothed) AER preliminary (smoothed)
Source: AER analysis.
Distribution charges represent approximately 38 per cent, on average, of the annual electricity bill for SA Power Networks' customers. If the lower distribution charges flowing from our decision are passed through to customers, we would expect the average annual electricity bill for residential and small business customers to reduce in 2015−16 to 2016–17, and remain at approximately the same level in 2017–18 to 2019–20. However, other factors also affect a customer’s electricity bill, such as the wholesale price of electricity.
8 Overview | SA Power Networks' determination 2015–20

Table 1 shows the estimated impact of our preliminary decision on the average residential and small business customers' annual electricity bills in SA Power Networks' distribution area over the 2015–20 regulatory control period, compared with what was proposed by SA Power Networks.
Table 1 AER's estimated impact of its preliminary decision on the average residential and small business customers' electricity bills in SA Power Networks distribution area for the 2015−20 period ($ nominal)
2014−15 2015−16 2016−17 2017−18 2018−19 2019–20
SA Power Networks proposal
Residential annual billa 2 007 1 992 2 012 2 031 2 052 2 072
Annual change –14 (–0.7%) 19 (1%) 20 (1%) 20 (1%) 21 (1%)
Small business annual billb 3 867 3 840 3 877 3 915 3 954 3 994
Annual change –28 (–0.7%) 37 (1%) 38 (1%) 39 (1%) 40 (1%)
AER preliminary decision
Residential annual billa 2 007 1 809 1 765 1 765 1 765 1 773
Annual change –197 (–9.8%) –44 (–2.4%) 0 (0%) 0 (0%) 8 (0.5%)
Small business annual billb 3 867 3 487 3 402 3 402 3 401 3 417
Annual change –381 (–9.8%) –85 (–2.4%) 0 (0%) 0 (0%) 16 (0.5%)
Source: AER analysis; AER, Energy Made Easy; ESCoSA, South Australian Energy Retail Prices Ministerial Pricing
Report 2014, August 2014.
(a) Based on annual bill for typical consumption of 5000 kWh per year during the period 1 July 2014 to 30 June
2015. Sample postcode: 5015.
(b) Based on the annual bill sourced from Energy Made Easy for a typical consumption of 10000 kWh per year
during the period 1 July 2014 to 30 June 2015. Sample postcode: 5015.
1.2 Contribution to the achievement of the NEOWe are satisfied that the total revenue approved in our preliminary decision contributes to the achievement of the NEO to the greatest degree. This is because our total revenue reflects the efficient, sustainable costs of providing network services in SA Power Networks' operating environment and the key drivers of efficient costs facing SA Power Networks. Our preliminary decision will promote the efficient investment in, and efficient operation and use of, electricity services for the long term interests of consumers, as required by the NEO. The reasons for our decision are set out in the attachments.
The key drivers of costs facing a network service provider are:
its accumulated network investment (reflected in the size of its Regulatory Asset Base, or RAB)
9 Overview | SA Power Networks' determination 2015–20

its expected growth in network investment (reflected in its capital expenditure (capex) program net of capital returned to the shareholders through depreciation)
its financing costs (interest on borrowings and a return on equity to shareholders) and
its opex program (the cost of operating and maintaining its network)
its taxation cost (taxable income at the corporate tax rate adjusted for the value of imputation credits).
From one regulatory control period to the next, the pressures on each of these drivers may change. For example, in periods of high demand growth, a network service provider would expect to need a larger capex program. Similarly, during periods of high interest rates, a network service provider would expect to pay more in financing costs.
The most important factors we see impacting on SA Power Networks' costs in the 2015–20 regulatory control period are:
an improved investment environment compared to our 2010 decision, which translates to lower financing costs necessary to attract efficient investment
few changes to the operating environment facing SA Power Networks with respect to risk or regulatory obligations
forecast demand, which is expected to remain reasonably flat over the 2015–20 regulatory control period, which reduces the requirement for growth-related capex.
These factors are reflected throughout our final decision and influence different constituent components of our decision to varying degrees. At the total revenue level, they provide a consistent picture: SA Power Networks, operating prudently and efficiently, could provide distribution services with materially less revenue than it has proposed for the 2015–20 regulatory control period.
In our preliminary decision, we consider SA Power Networks' proposal does not reflect the factors impacting on its cost drivers to a satisfactory extent. As a consequence, we conclude that SA Power Networks has proposed to recover more revenue from its customers than is necessary for the safe and reliable operation of its network. It follows that we consider SA Power Networks' proposal does not reflect the factors impacting on its cost drivers to a satisfactory degree.
Historically, SA Power Networks has been a relatively efficient distributor, compared to some of its interstate peers. However, SA Power Networks proposed to significantly increase its expenditure compared to the current regulatory control period. If approved, we consider SA Power Networks' regulatory proposal would see it become less efficient than it has been.
Our preliminary decision does not accept a number of SA Power Networks' proposed step changes in regard to reliability and safety. Having carefully assessed SA Power Networks' proposal, we consider it has not provided evidence to adequately justify this additional expenditure. These expenditure proposals would have affected a number of the building blocks used to calculate SA Power Networks revenue requirement.
10 Overview | SA Power Networks' determination 2015–20

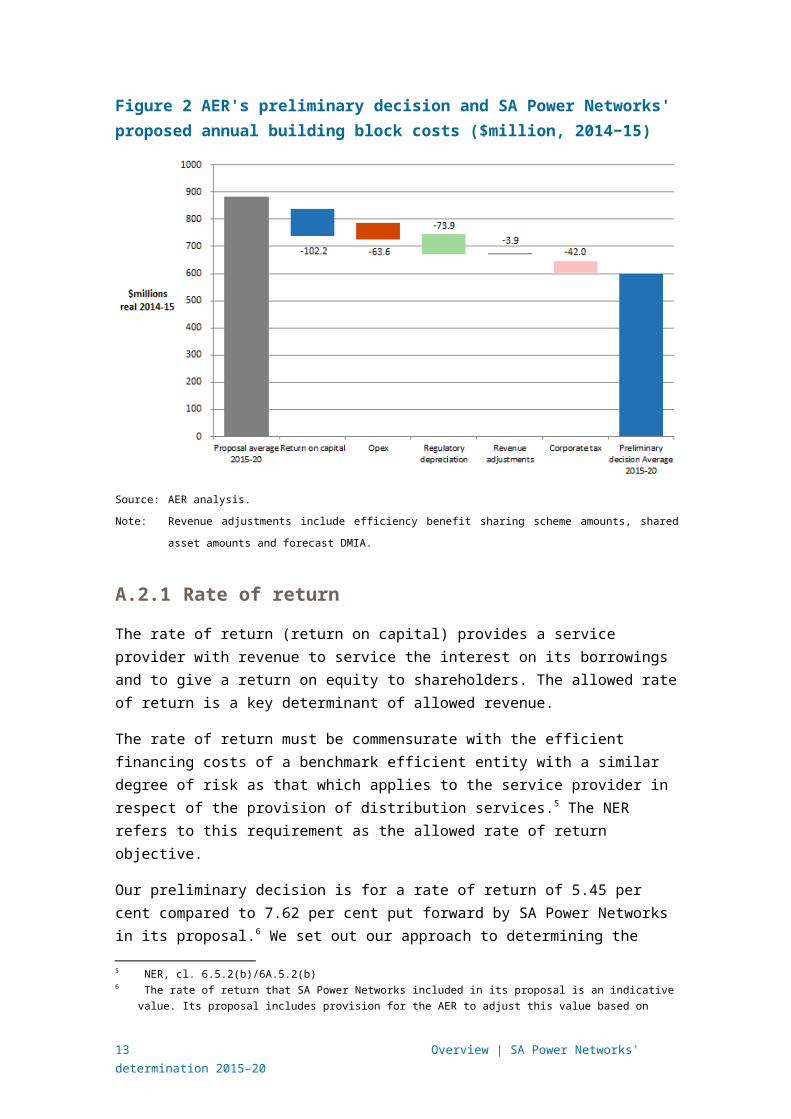
Three constituent components of our decision drive most of the difference between SA Power Networks' proposed revenue and our preliminary decision: rate of return (return on capital), operating expenditure (opex) and depreciation (return of capital). Figure 2 illustrates the constituent components of our decision (which the NER refers to as building blocks). These are discussed further in the sections below.
Figure 2 AER's preliminary decision and SA Power Networks' proposed annual building block costs ($million, 2014−15)
Source: AER analysis.
Note: Revenue adjustments include efficiency benefit sharing scheme amounts, shared asset amounts and
forecast DMIA.
1.2.1 Rate of return
The rate of return (return on capital) provides a service provider with revenue to service the interest on its borrowings and to give a return on equity to shareholders. The allowed rate of return is a key determinant of allowed revenue.
The rate of return must be commensurate with the efficient financing costs of a benchmark efficient entity with a similar degree of risk as that which applies to the service provider in respect of the provision of distribution services.5 The NER refers to this requirement as the allowed rate of return objective.
Our preliminary decision is for a rate of return of 5.45 per cent compared to 7.62 per cent put forward by SA Power Networks in its proposal.6 We set out our approach to determining the rate of return in the Rate of Return Guideline (Guideline) we published
5 NER, cl. 6.5.2(b)/6A.5.2(b)6 The rate of return that SA Power Networks included in its proposal is an indicative value. Its proposal includes
provision for the AER to adjust this value based on updated information that was not available when SA Power Networks submitted its proposal.
11 Overview | SA Power Networks' determination 2015–20
in December 2013.7 This Guideline is not binding. However, a service provider must provide reasons to justify any departure from the Guideline. SA Power Networks has proposed we depart from the Guideline. We are not satisfied that there are sufficient grounds for doing so.
Prevailing market conditions for debt and equity heavily influence the rate of return. Conditions have improved markedly since our 2010 final decision, resulting in a lower rate of return. Since SA Power Networks submitted its regulatory proposal in October 2014, interest rates have fallen further and financial conditions have continued to ease. This means that the cost of debt and the returns required to attract equity are lower than when SA Power Networks submitted its proposal. We consider this should be reflected in the rate of return.
On a more technical level, there are some key differences between our preliminary decision and SA Power Networks' proposal in relation to the rate of return. In particular, whether to give weight to other indicators of the return on equity that SA Power Networks considers to be informative but which we do not consider to be robust and which other regulators do not use.
The Guideline (and indeed this decision) marks a departure from our previous approach to estimating the return on debt and the return on equity. For the return on debt, we have used a gradual, forward looking transition. We set out this transition in the Guideline. Our approach to setting the return on debt received broad support from many stakeholders, including some service providers.8
In its regulatory proposal, SA Power Networks proposed our approach to transition from the on-the-day to trailing average approach. We accept SA Power Networks' regulatory proposal. However, in its submission on the current determination processes, SA Power Networks purported to depart from its proposal. It submitted that we should use a different transition approach. We do not agree with SA Power Networks' new position in its submission.
For the return on equity, the expert evidence before us indicates that, on balance, employing our approach is expected to lead to a rate of return that achieves the allowed rate of return objective.
To calculate the allowance for the return on capital, the rate of return is applied to SA Power Networks' RAB. Our preliminary decision to not accept certain aspects of SA Power Networks' proposed capex means its RAB will be smaller than if we had accepted its proposed capex. This will further contribute to a smaller allowance for return on capital than that proposed by SA Power Networks. Forecast capex is discussed in more detail in attachment 6.
1.2.2 Depreciation—return of capital
7 AER, Rate of Return Guideline, December 2013: http://www.aer.gov.au/node/18859 8 For example, TasNetworks, Regulatory Proposal, June 2014.
12 Overview | SA Power Networks' determination 2015–20
Depreciation is the allowance provided so capital investors recover their investment over the economic life of the asset (return of capital).9 The overall level of SA Power Networks' depreciation is determined by its levels of capital investment—more assets mean more depreciation, fewer assets mean less depreciation. The effect of changes in the rate of depreciation is to move forward or backward in time when SA Power Networks receives its depreciation allowance.
Our preliminary decision is to reduce SA Power Networks' proposed forecast regulatory depreciation allowance for the 2015–20 regulatory control period by $402.3 million (or 43.0 per cent) ($nominal) to $553.7 million ($nominal, unsmoothed). In reaching our preliminary decision, we accept SA Power Networks' proposed straight-line depreciation method for calculating the regulatory depreciation allowance. This is consistent with our revenue model. We also accept the majority of the standard asset lives proposed by SA Power Networks. However, we do not accept SA Power Networks' proposed average depreciation method to calculate the remaining asset lives at 1 July 2015.10 The difference in approach has a significant impact which is explained in attachment 5.
Our preliminary decision on SA Power Networks' depreciation allowance also reflects our determination on changing another component of SA Power Networks' regulatory proposal—the forecast capex (attachment 6). This affects the total value of SA Power Networks' assets, so have consequential impact on its depreciation allowance.
Our preliminary decision to not accept SA Power Networks' proposed additional capex means its RAB will be smaller than under SA Power Networks' proposal. Therefore, its return of capital will also be lower than it would be under SA Power Networks' proposal.
1.2.3 Operating expenditure
SA Power Networks proposed significant additional opex (and related capex), to enhance its network reliability and safety outcomes. We have considered these issues in arriving at our forecast of the efficient costs that a prudent operator of SA Power Networks' distribution system would require, consistent with SA Power Networks' current obligations. To the extent that SA Power Networks incurs costs above efficient levels they should be borne by SA Power Networks' shareholders and not its customers.
It is important to note that we accept SA Power Networks' proposed base opex. That is, we accept SA Power Networks' forecast opex costs as indicated by its actual costs from 2013-14, its 'base year' for forecasting. We consider SA Power Networks' proposed base opex is sufficient to maintain existing service levels, including safety and reliability. It is SA Power Network's proposed additional expenditure where we consider it does not require extra funding to undertake its proposed measures, or has taken an overly conservative approach to risk management.
9 NER, cl 6.12.1(8).10 This also includes a small correction to the allocation of the work in progress assets to relevant asset classes. See
response from SA Power Networks to AER information request, AER SAPN 041 - Modelling - Response, 27 March 2015.
13 Overview | SA Power Networks' determination 2015–20

We do not accept SA Power Networks' proposed opex step changes. We also do not accept a number of related capex proposals, justified by SA Power Networks as safety and reliability related, which we consider are equivalent to step changes. The overall level of additional expenditure proposed by SA Power Networks does not satisfy the NER's requirements for forecast expenditure. That is, it exceeds the efficient costs that a prudent operator of SA Power Networks' distribution system would require to maintain network quality, reliability, security and safety.
SA Power Networks proposed measures to improve management of network faults with new opex and capex programs. However, SA Power Networks did not demonstrate that its current network fault management activities are inadequate, or that its proposals are necessary to maintain appropriate levels of service.
SA Power Networks proposed opex step changes to improve its operational efficiency. However, existing mechanisms already provide incentives for SA Power Networks to achieve operational efficiencies. We consider customers should not be required to also fund such initiatives up front.
In respect of SA Power Networks' proposed bushfire risk mitigation programs, it did not demonstrate that its proposals comply with its current or expected future safety obligations related to bushfire risk. Nor did SA Power Networks demonstrate its proposed level of investment is prudent and efficient. SA Power Networks' proposed road safety capital investment programs also were not justified by evidence that these are consistent with its obligations under the NER. And we note that alternative funding sources are available for some of these measures.
While SA Power Networks referred to consumer engagement as providing support for some of its proposed expenditure measures, we note concerns expressed by consumer groups and consumer engagement experts about SA Power Networks' approach. We discuss these issues in the section below. Should SA Power Networks' safety obligations change during the regulatory period, it may apply to us for a cost pass through to meet its funding needs. Alternatively, SA Power Networks may be able to provide evidence, in its revised regulatory proposal, that its proposed additional opex and related capex measures are efficient and as would be incurred by a prudent network operator.
1.2.4 Consumer engagement
SA Power Networks undertook a consumer engagement program leading up to submitting its regulatory proposal. We consider the consumer engagement undertaken by SA Power Networks is a positive step. However, the Consumer Challenge Panel (CCP)11 and SACOSS12 questioned whether consumers involved in SA Power Networks' consultation activities had appropriate information about service and price alternatives. They also questioned SA Power Networks' use of consumer feedback to
11 CCP2, Submission by Consumer Challenge Panel 2 to the AER in response to SA Power Networks regulatory proposal for 2015–2020, section 5, January 2015.
12 South Australian Council of Social Services, SACOSS Submission to Australian Energy Regulator on SA Power Networks' 2015–2020 Regulatory Proposal, January 2015.
14 Overview | SA Power Networks' determination 2015–20
justify discretionary expenditure proposals, particularly because of the long term price impacts of asset investment to increase SA Power Networks' RAB.
To investigate the views expressed by these submissions, we engaged a specialist consultant, Oakley–Greenwood, to assess SA Power Networks' consumer engagement methodologies and reported results. In its report, Oakley–Greenwood noted the consumer engagement was relatively narrowly focussed.13 Also that some results seem counter–intuitive, such as finding even extreme hardship customers preferred safety expenditure on the highest possible number of road intersections.
On balance, we see SA Power Networks' consumer engagement as a work in progress. While we have taken into account the consumer engagement results reported by SA Power Networks, we have given these less weight than if the consumer engagement approach had been broadly supported in submissions to SA Power Network's regulatory proposal. We expect SA Power Networks will evolve its consumer engagement methods over time.
1.3 Assessment of options under the NEOThe NER recognises there may be several decisions that contribute to the achievement of the NEO. Our role is to make a decision that we are satisfied contributes to the achievement of the NEO to the greatest degree.14
For at least two reasons, we consider there will almost always be several potential decisions that contribute to the achievement of the NEO. First, the NER requires us to make forecasts, which are predictions about unknown future circumstances. As a result, there will likely always be more than one plausible forecast. Second, there is substantial debate amongst stakeholders about the costs we must forecast, with both sides often supported by expert opinion. As a result, for several components of our decision there may be several plausible answers or several point estimates within a range. This has the potential to create a multitude of potential overall decisions.
In this decision we have approached this from a practical perspective, accepting that it is not possible to consider every possible permutation specifically. Where there are several plausible answers, we have selected what we are satisfied is the best outcome under the NEL and NER.
In many cases, our approach results in an outcome towards the end of the range of options materially favourable to SA Power Networks (for example, our choice of equity beta). While it can be difficult to quantify the exact revenue impact of these individual decisions, we have identified where we have done so in our attachments. Some of these decisions include:
setting the return on debt by reference to data for a BBB broad band credit rating when the benchmark is BBB+
the cash flow timing assumptions in the post–tax revenue model
the point at which we have set the benchmark for opex.
13 Oakley–Greenwood, Peer review of willingness to pay research submitted by SAPN, April 2015.14 NEL, s. 16(1)(d)
15 Overview | SA Power Networks' determination 2015–20
We set out our detailed reasons in the attachments. They demonstrate that the constituent components of our decision comply with the NER's requirements. At an overall level our decision reflects the key reasons set out above which indicate that SA Power Networks should recover less revenue than it has proposed. Our decision reflects these at both the constituent component and overall revenue levels.
Given our approach, we are satisfied that our decision will or is likely to contribute to the NEO to the greatest degree.
1.4 Structure of the overviewThe remainder of this overview discusses the overarching issues in this decision, including those above in more detail. It is structured as follows:
Section 2 sets out the key constituent components making up our preliminary decision
Section 3 sets out our approach to service classification, incentive schemes and alternative control services
Section 4 explains our views on the regulatory framework
Section 5 outlines the process we undertook in reaching our preliminary decision.
16 Overview | SA Power Networks' determination 2015–20

2 Key elements of the building blocksThe constituent components of our preliminary decision include the building blocks we use to determine the revenue SA Power Networks may recover from its customers.
In setting our alternative overall revenue allowance for SA Power Networks of $3 211.3 million ($ nominal) for the 2015–20 regulatory control period, we:
Apply relevant tests under the NER, the assessment methods and tools developed as part of our Better Regulation Guidelines (see section 5.1). We also consider information provided by SA Power Networks, the CCP, consultants and stakeholder submissions.
Consider our total revenue allowance against section 16 of the NEL, including the constituent decisions and the interrelationships we discuss in sections 1 and 4.
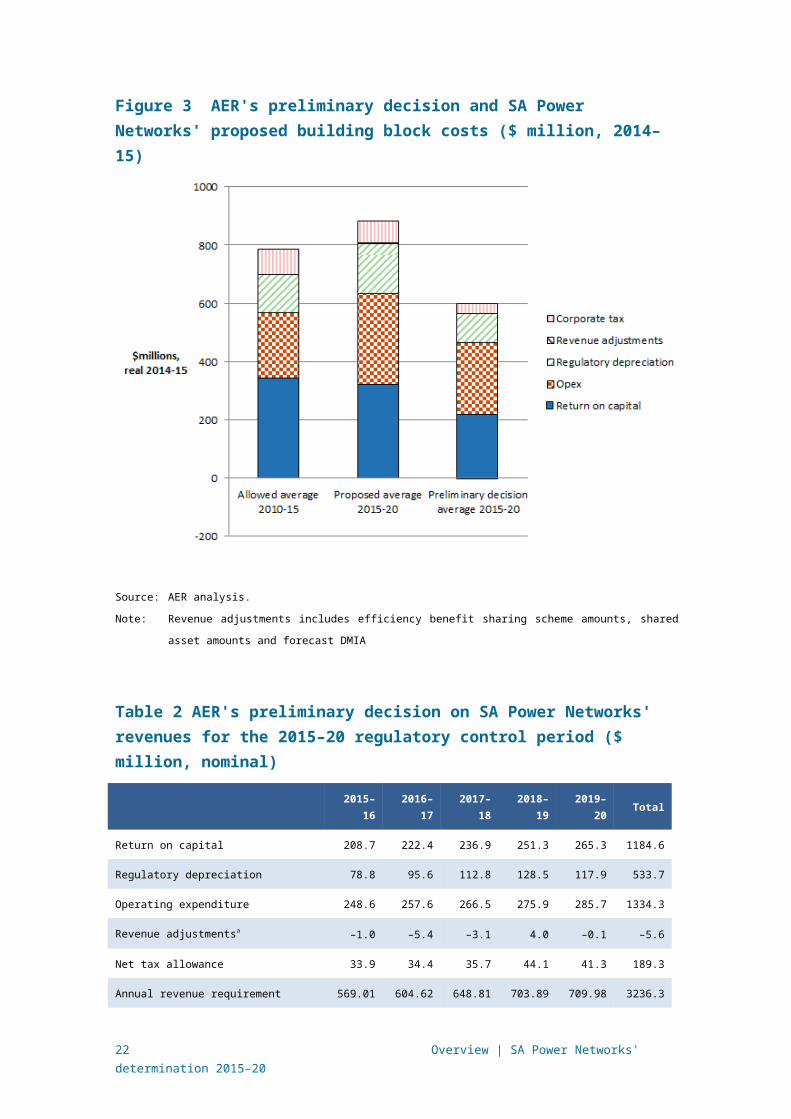
Figure 3 and table 2 show our preliminary decision on SA Power Networks' revenues and the contribution of each building block.
Figure 3 AER's preliminary decision and SA Power Networks' proposed building block costs ($ million, 2014–15)
Source: AER analysis.
Note: Revenue adjustments includes efficiency benefit sharing scheme amounts, shared asset amounts and
forecast DMIA
17 Overview | SA Power Networks' determination 2015–20

Table 2 AER's preliminary decision on SA Power Networks' revenues for the 2015–20 regulatory control period ($ million, nominal)
2015–16 2016–17 2017–18 2018–19 2019–20 Total
Return on capital 208.7 222.4 236.9 251.3 265.3 1184.6
Regulatory depreciation 78.8 95.6 112.8 128.5 117.9 533.7
Operating expenditure 248.6 257.6 266.5 275.9 285.7 1334.3
Revenue adjustmentsa –1.0 –5.4 –3.1 4.0 –0.1 –5.6
Net tax allowance 33.9 34.4 35.7 44.1 41.3 189.3
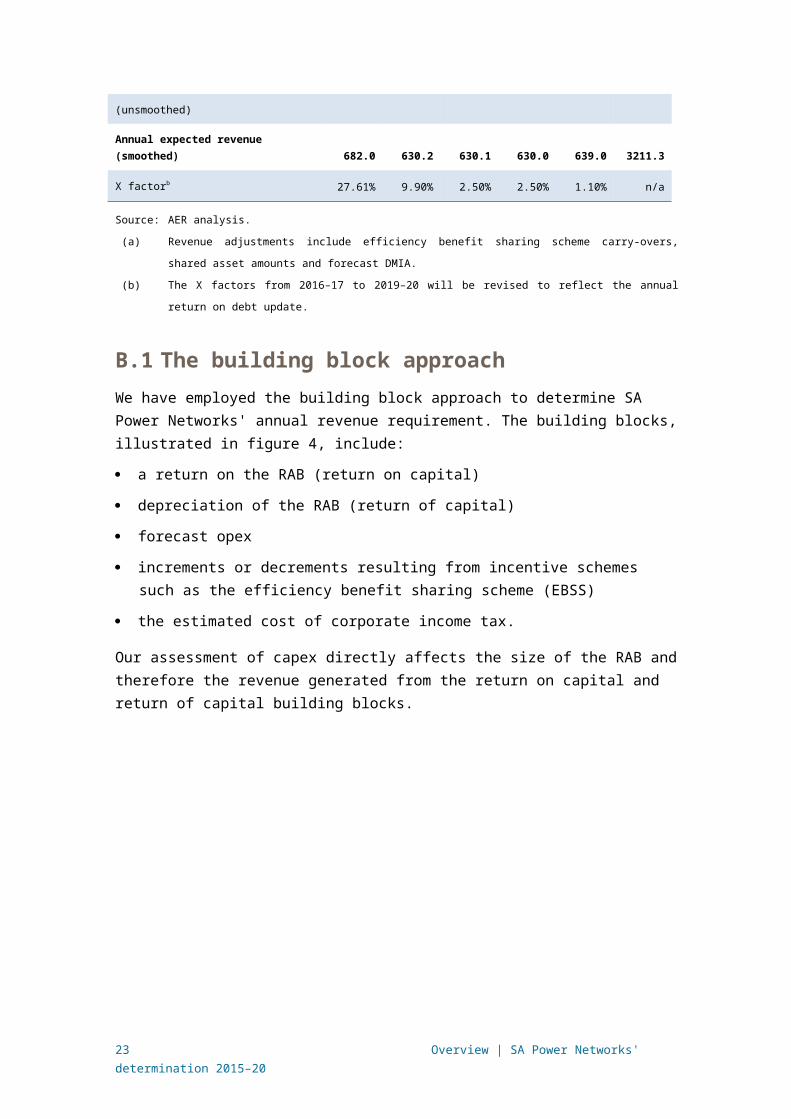
Annual revenue requirement (unsmoothed) 569.01 604.62 648.81 703.89 709.98 3236.3
Annual expected revenue (smoothed) 682.0 630.2 630.1 630.0 639.0 3211.3
X factorb 27.61% 9.90% 2.50% 2.50% 1.10% n/a
Source: AER analysis.
(a) Revenue adjustments include efficiency benefit sharing scheme carry-overs, shared asset amounts and
forecast DMIA.
(b) The X factors from 2016–17 to 2019–20 will be revised to reflect the annual return on debt update.
2.1 The building block approachWe have employed the building block approach to determine SA Power Networks'
annual revenue requirement. The building blocks, illustrated in figure 4, include:
a return on the RAB (return on capital)
depreciation of the RAB (return of capital)
forecast opex
increments or decrements resulting from incentive schemes such as the efficiency benefit sharing scheme (EBSS)
the estimated cost of corporate income tax.
Our assessment of capex directly affects the size of the RAB and therefore the revenue generated from the return on capital and return of capital building blocks.
18 Overview | SA Power Networks' determination 2015–20

Return on capital (forecast RAB × cost of capital)
Regulatory depreciation (depreciation net of indexation applied to RAB)
Corporate income tax (net of value of imputation credits)
Capital costs
Operating expenditure (opex)
Efficiency benefit sharing scheme (EBSS) (increment or decrement)
Total revenue
Figure 4 The building block approach for determining total revenue
The following section summarises our preliminary decision in relation to each building block and provides our high level reasons and analysis. The attachments provide a more detailed explanation of our analysis and findings.
2.2 Regulatory asset baseThe RAB is the value of SA Power Networks' assets used to provide distribution
network services. It is the value on which SA Power Networks earns a return on capital and a depreciation allowance (return of capital).
We are required to assess SA Power Networks' proposed opening value for the RAB for each year of the 2015–20 regulatory control period.
Our preliminary decision is to accept SA Power Networks' proposed opening RAB value of $3829.4 million ($ nominal) as at 1 July 2015. We forecast a closing RAB at 30 June 2020 of $5132.5 million for SA Power Networks.
The forecast depreciation approach will be used to establish SA Power Networks' opening RAB at the commencement of the following regulatory control period on 1 July 2020.
Table 3 sets out our preliminary decision on the roll forward of the RAB values for SA Power Networks during the 2010–15 regulatory control period.
19 Overview | SA Power Networks' determination 2015–20
Table 3 AER's preliminary decision on SA Power Networks' RAB for the 2010–15 regulatory control period ($ million, nominal)
2010–11 2011–12 2012–13 2013–14 2014–15a
Opening RAB 2900.0 3096.8 3287.9 3502.0 3674.4
Capital expenditureb 271.0 325.7 335.2 291.3 362.0
Inflation indexation on opening RAB 96.6 48.9 82.2 102.6 73.5
Less: straight-line depreciation 170.7 183.6 203.3 221.5 242.0
Closing RAB 3096.8 3287.9 3502.0 3674.4 3867.9
Difference between estimated and actual capex (1 July 2009 to 30 June 2010) –24.3
Return on difference for 2009–10 capex –14.3
Closing RAB as at 30 June 2015 3829.4
Source: AER analysis.
(a) Based on estimated capex. We will update the RAB roll forward in the substitute decision.
(b) Net of disposals and capital contributions, and adjusted for CPI.
Table 4 sets out our preliminary decision on the roll forward of SA Power Networks' forecast RAB for the 2015–20 regulatory control period.
Table 4 AER's preliminary decision on SA Power Networks' RAB for the 2015–20 regulatory control period ($ million, nominal)
2015–16 2016–17 2017–18 2018–19 2019–20
Opening RAB 3829.4 4080.2 4345.9 4611.4 4866.9
Capital expenditurea329.7 361.3 378.4 384.0 383.5
Inflation indexation on opening RAB 97.6 104.0 110.8 117.6 124.1
Less: Straight-line depreciation 176.4 199.7 223.7 246.1 242.0
Closing RAB 4080.2 4345.9 4611.4 4866.9 5132.5
Source: AER analysis.
(a) Net of forecast disposals and capital contributions.
Our assessment involved:
rolling forward the opening RAB at 1 July 2010 to determine the closing RAB as at 1 July 2015
20 Overview | SA Power Networks' determination 2015–20

using our final decision on forecasts of depreciation, capex, disposals and inflation for the 2015–20 period to roll forward SA Power Networks' forecast RAB for each year of that period.
As part of this preliminary decision we also forecast closing RAB values at 30 June 2020 for SA Power Networks. We forecast SA Power Networks' closing RAB to be $5132.5 ($ nominal). This is lower than forecast by SA Power Networks and reflects our adjustments to:
forecast capex (attachment 6)
forecast depreciation (attachment 5)
forecast inflation rate (attachment 3).
Details of our final decision on the value of the RAB are set out in attachment 2.
2.3 Rate of return (return on capital)The return on capital provides a distributor with revenue to service the interest on
its loans and give a return on equity to shareholders. The return on capital building block is calculated as a product of the rate of return and the value of the RAB.15
The NER set out that the allowed rate of return must be commensurate with the efficient financing costs of a benchmark efficient entity with a similar degree of risk as that which applies to the distributor in respect of the provision of distribution services. The NER refers to this requirement as the allowed rate of return objective.
We have determined an allowed rate of return of 5.45 per cent (nominal vanilla16). We have not accepted SA Power Networks' proposed 7.62 per cent return.17 In accordance with the Guideline, we will update the rate of return annually.18 Table 5 sets out the parameters we have used to determine the rate of return.
Table 5 AER's preliminary decision on SA Power Networks' rate of return (nominal)
AER decision
2010–15
SAPN's proposal(a)
2015–16
AER preliminary decision(b)
2015–20
15 NER, cl. 6.5.2(a).16 The nominal vanilla rate of return formula combines a post-tax return on equity and pre-tax return on debt, for
consistency with other building blocks.17 The rate of return that SA Power Networks included in its proposal is an indicative value. Its proposal includes
provision for the AER to adjust this value based on updated information that was not available when SA Power Networks submitted its proposal.
18 NER, cl. 6.5.2(i)(2).
21 Overview | SA Power Networks' determination 2015–20
Nominal risk free rate (return on equity)(c) 5.89% 3.43% 2.55%
Equity risk premium 5.20% 7.02% 4.55%
MRP 6.50% 7.72% 6.50%
Equity beta 0.8 0.91 0.7
Nominal post–tax return on equity 11.09% 10.45% 7.1%
Nominal pre–tax return on debt 8.87% 5.74% 4.35%
Gearing 60% 60% 60%
Nominal vanilla WACC 9.76% 7.62% 5.45%
Forecast inflation 2.52% 2.55% 2.55%
Source: AER analysis; SA Power Networks, Regulatory proposal 2015–20, October 2014; AER, Final decision:
South Australia distribution determination 2010–11 to 2014–15, May 2010.
(a) SA Power Networks used a multi-model approach to estimating return on equity. In applying this approach,
SA Power Networks used single, consistent estimates of risk free rate and market risk premium but not of
equity beta. However, an indicative equity beta estimate (for comparison purposes) can be calculated from
SA Power Networks' proposed equity risk premium and market risk premium.
(b) This rate of return estimate will be used to determine prices to apply in the 2015–16 regulatory year. The
rate of return, including the rate to apply to the 2015–16 regulatory year, will be updated in our subsequent
determination for SA Power Networks.
(c) SA Power Networks' risk free rate estimate was calculated using an averaging period of 20 business days
ending 29 August 2014. AER preliminary decision risk free rate estimate is based on a 20 business day
averaging period from 9 February to 6 March 2015.
(d) The allowed return on debt is to be updated annually and the nominal vanilla WACC will be updated
annually to reflect the allowed return on debt. The allowed return on debt for 2015–16 has already been
estimated. Return on debt allowances for subsequent years will be estimated based on the formula set out
in the Return on Debt Appendix to this attachment.
Our approach
All NER requirements relating to the rate of return are subject to the overall rate of return achieving the allowed rate of return objective.19 The NER recognises that there are several plausible answers that could achieve the allowed rate of return objective. We agree with stakeholders that predictability of outcomes in rate of return issues would materially benefit the long term interests of consumers.20
We developed our approach prior to the submission of this regulatory proposal. As required by the rate of return framework, in December 2013 we published the
19 NER, cl. 6.5.2(b).20 ENA, Response to the Draft Rate of Return Guideline of the AER, 11 October 2013, p. 1; AER, Better regulation:
Explanatory statement Rate of Return Guideline, Appendices, December 2013, Appendix I, Table I.4, pp. 185−186.
22 Overview | SA Power Networks' determination 2015–20
Guideline.21 The Guideline was designed through extensive consultation and involved effective and inclusive consumer participation.22
Return on debt
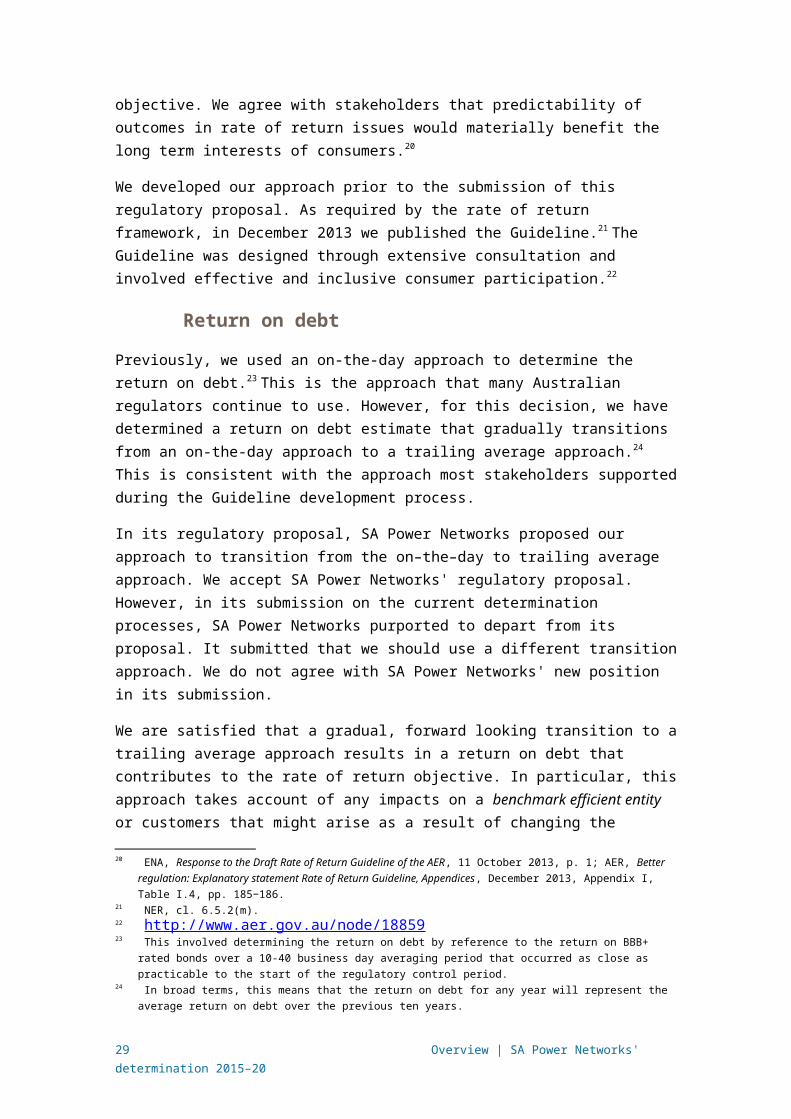
Previously, we used an on-the-day approach to determine the return on debt.23 This is the approach that many Australian regulators continue to use. However, for this decision, we have determined a return on debt estimate that gradually transitions from an on-the-day approach to a trailing average approach.24 This is consistent with the approach most stakeholders supported during the Guideline development process.
In its regulatory proposal, SA Power Networks proposed our approach to transition from the on–the–day to trailing average approach. We accept SA Power Networks' regulatory proposal. However, in its submission on the current determination processes, SA Power Networks purported to depart from its proposal. It submitted that we should use a different transition approach. We do not agree with SA Power Networks' new position in its submission.
We are satisfied that a gradual, forward looking transition to a trailing average approach results in a return on debt that contributes to the rate of return objective. In particular, this approach takes account of any impacts on a benchmark efficient entity or customers that might arise as a result of changing the methodology that is used to estimate the return on debt. This includes impacts that occur across regulatory control periods. In particular, a gradual, forward looking transition:
has regard to the impact on a benchmark efficient entity of changing the method for estimating the return on debt
promotes efficient financing practices consistent with the principles of incentive based regulation
provides a benchmark efficient entity with a reasonable opportunity to recover at least the efficient financing costs it incurs in financing its assets. And as a result it:
o promotes efficient investment, and
o promotes consumers not paying more than necessary for a safe and reliable network
avoids a potential bias in regulatory decision making that can arise from choosing an approach that uses historical data after the results of that historical data are already known
avoids practical problems with the use of historical data as estimating the return on debt during the global financial crisis is a difficult and contentious exercise.
Return on equity21 NER, cl. 6.5.2(m).22 http://www.aer.gov.au/node/1885923 This involved determining the return on debt by reference to the return on BBB+ rated bonds over a 10-40
business day averaging period that occurred as close as practicable to the start of the regulatory control period.24 In broad terms, this means that the return on debt for any year will represent the average return on debt over the
previous ten years.
23 Overview | SA Power Networks' determination 2015–20

Our approach to determining the return on equity involves considering all of the information before us, through a six step process as set out in the Guideline (foundation model approach). This includes detailed consideration of a number of financial models for determining the return on equity.25 Considering all of this material helps inform a return on equity estimate that contributes to the achievement of the allowed rate of return objective.
We consider that the Sharpe–Lintner capital asset pricing model (SLCAPM) is the superior financial model in terms of estimating expected equity returns. We have therefore adopted this model as our foundation model. The expert evidence before us also indicates that, on balance, employing our foundation model approach and using the SLCAPM as the foundation model is expected to lead to a rate of return that achieves the allowed rate of return objective.26
We also evaluated our point estimate from the SLCAPM against other information. The critical allowance for an equity investor in a benchmark efficient entity is the allowed equity risk premium (ERP) over and above the estimated risk free rate at any given time.27 Our estimate of the ERP for the benchmark efficient entity is 4.55 per cent which is within the range of other information available to inform the return on equity (see Figure 5). A detailed explanation of our findings on return on equity and this figure can be found attachment 3.
Figure 5 Other information comparisons with the AER allowed ERP
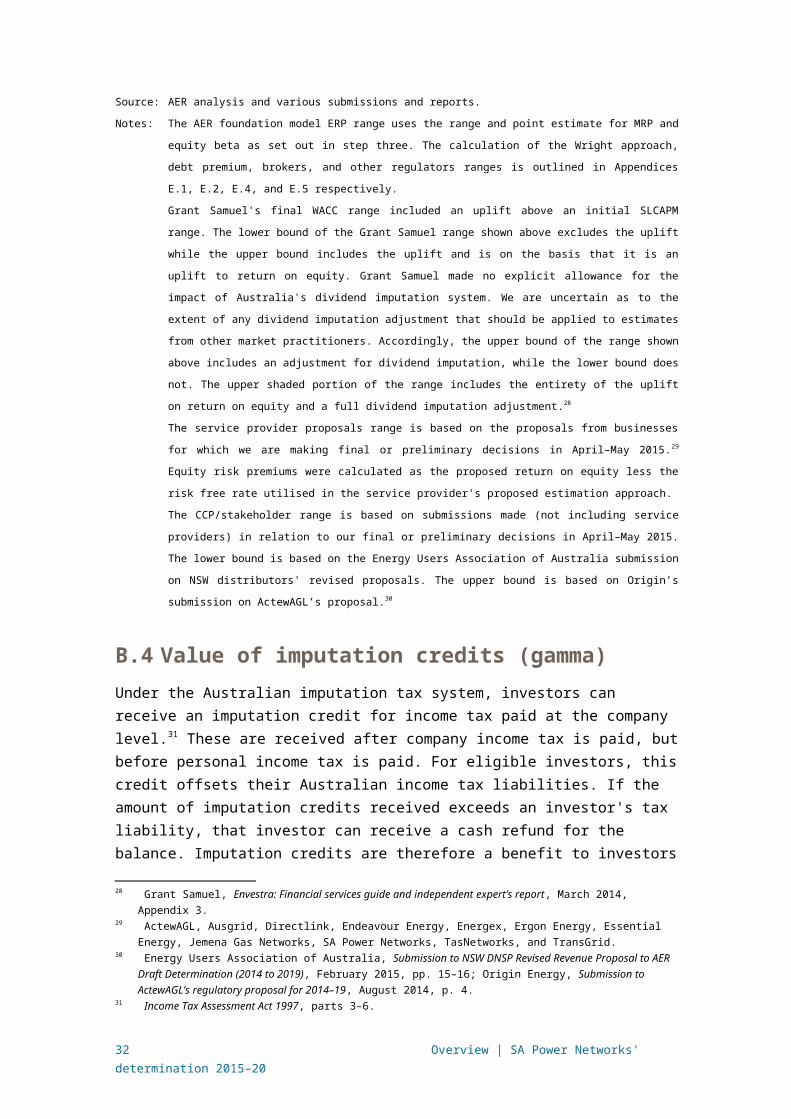
Source: AER analysis and various submissions and reports.
Notes: The AER foundation model ERP range uses the range and point estimate for MRP and equity beta as set
out in step three. The calculation of the Wright approach, debt premium, brokers, and other regulators
ranges is outlined in Appendices E.1, E.2, E.4, and E.5 respectively.
Grant Samuel's final WACC range included an uplift above an initial SLCAPM range. The lower bound of the
Grant Samuel range shown above excludes the uplift while the upper bound includes the uplift and is on the
basis that it is an uplift to return on equity. Grant Samuel made no explicit allowance for the impact of
Australia's dividend imputation system. We are uncertain as to the extent of any dividend imputation
adjustment that should be applied to estimates from other market practitioners. Accordingly, the upper
bound of the range shown above includes an adjustment for dividend imputation, while the lower bound
does not. The upper shaded portion of the range includes the entirety of the uplift on return on equity and a
full dividend imputation adjustment.28
The service provider proposals range is based on the proposals from businesses for which we are making
final or preliminary decisions in April–May 2015.29 Equity risk premiums were calculated as the proposed
return on equity less the risk free rate utilised in the service provider's proposed estimation approach.
The CCP/stakeholder range is based on submissions made (not including service providers) in relation to
our final or preliminary decisions in April–May 2015. The lower bound is based on the Energy Users
25 NER, cl.6.5.2(e)(1)26 McKenzie & Partington, Part A: Return on equity, Report to the AER, October 2014, p. 13; John Handley, Advice
on return on equity, Report prepared for the AER, October 2014, p. 3.27 Our task is to determine the efficient financing costs commensurate with the risk of providing regulated network
service by an efficient benchmark entity (allowed rate of return objective). Risks in this context are those which are compensated via the return on equity (systematic risks).
24 Overview | SA Power Networks' determination 2015–20

Association of Australia submission on NSW distributors' revised proposals. The upper bound is based on
Origin’s submission on ActewAGL’s proposal.30
2.4 Value of imputation credits (gamma)Under the Australian imputation tax system, investors can receive an imputation
credit for income tax paid at the company level.31 These are received after company income tax is paid, but before personal income tax is paid. For eligible investors, this credit offsets their Australian income tax liabilities. If the amount of imputation credits received exceeds an investor's tax liability, that investor can receive a cash refund for the balance. Imputation credits are therefore a benefit to investors in addition to any cash dividend or capital gains they receive from owning shares.
In determining a service provider's revenue allowance, the NER requires that the estimated cost of corporate income tax be estimated in accordance with a formula that reduces the estimated cost by the 'value of imputation credits'.32 That is, the revenue a service provider recovers from customers in respect of its expected tax liability must be reduced in a manner consistent with the value of imputation credits.
Our preliminary decision is to adopt a value of imputation credits of 0.4. This differs from SA Power Networks' proposed value of imputation credits of 0.25.
Although we have broadly maintained the approach to determining the value of imputation credits set out in the Rate of Return Guideline, we have re-examined the relevant evidence and estimates. This re-examination, and new evidence and advice considered for the first time since the Guideline, led us to depart from the value of 0.5 in the Guideline. Most notably, our updated consideration of the relevant advice and evidence led us to generally lower estimates of the ‘utilisation rate’ from the 0.7 estimate in the Guideline. Estimating the value of imputation credits is a complex and somewhat imprecise task. There is no consensus among experts on the appropriate value or estimation techniques to use.
Consistent with the relevant academic literature, we estimate the value of imputation credits as the product of the distribution rate and the utilisation rate. While there is a widely accepted approach to estimating the distribution rate, there is no single accepted approach to estimating the utilisation rate. There is a range of evidence relevant to the utilisation rate:
the proportion of Australian equity held by domestic investors (the 'equity ownership approach')
the reported value of credits utilised by investors in Australian Taxation Office (ATO) statistics ('tax statistics')
28 Grant Samuel, Envestra: Financial services guide and independent expert’s report, March 2014, Appendix 3.29 ActewAGL, Ausgrid, Directlink, Endeavour Energy, Energex, Ergon Energy, Essential Energy, Jemena Gas
Networks, SA Power Networks, TasNetworks, and TransGrid.30 Energy Users Association of Australia, Submission to NSW DNSP Revised Revenue Proposal to AER Draft
Determination (2014 to 2019), February 2015, pp. 15–16; Origin Energy, Submission to ActewAGL’s regulatory proposal for 2014–19, August 2014, p. 4.
31 Income Tax Assessment Act 1997, parts 3–6.32 NER, cls 6.4.3(a)(4), 6.4.3(b)(4), 6.5.3.
25 Overview | SA Power Networks' determination 2015–20

implied market value studies—there is no separate market in which imputation credits are traded, and therefore there is no observable market price for imputation credits.
In estimating the utilisation rate, we place:
significant reliance upon the equity ownership approach
some reliance upon tax statistics
less reliance upon implied market value studies.
Overall, the evidence on the distribution rate and the utilisation rate suggests that a reasonable estimate of the value of imputation credits is within the range of 0.3 to 0.5. From within this range, we choose a value of 0.4. This is because:
The equity ownership approach, on which we have placed the most reliance, suggests a value between 0.40 and 0.47 when applied to all equity and between 0.31 and 0.44 when applied to only listed equity. Therefore, the overlap of the evidence from the equity ownership approach suggests a value between 0.40 and 0.44.
The evidence from tax statistics suggests the value could be lower than 0.4. Therefore, with regard to this evidence and the less reliance we place on it, we choose a value at the lower end of the range suggested by the overlap of evidence from the equity ownership approach (that is, 0.4).
An estimate of 0.4 is reasonable in light of both higher and lower estimates from implied market value studies and the lesser degree of reliance we place on these studies. The service providers submitted evidence to support placing more reliance on SFG’s dividend drop off study relative to other implied market value studies. However, we consider that neither the difference from 0.4 of the estimate from this study (0.32) nor any increased reliance we might place on it relative to other implied market value studies are sufficient to warrant an estimate lower than 0.4.
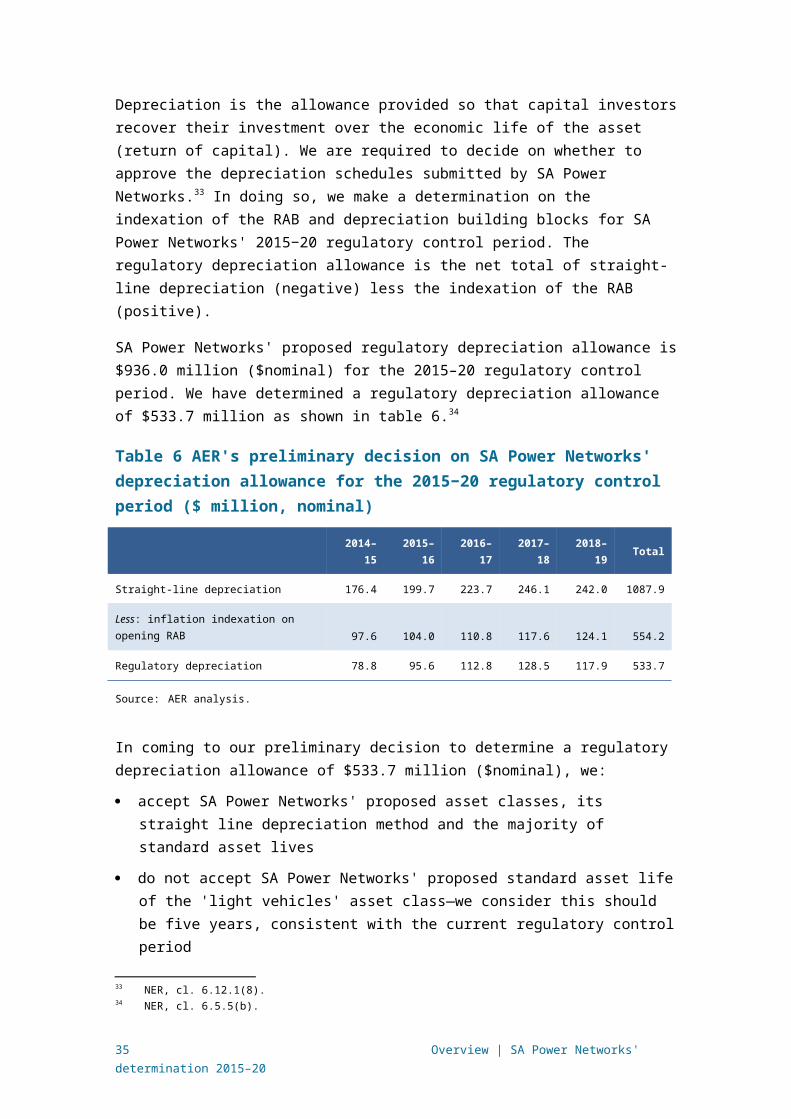
2.5 Regulatory depreciation (return of capital)Depreciation is the allowance provided so that capital investors recover their investment over the economic life of the asset (return of capital). We are required to decide on whether to approve the depreciation schedules submitted by SA Power Networks.33 In doing so, we make a determination on the indexation of the RAB and depreciation building blocks for SA Power Networks' 2015−20 regulatory control period. The regulatory depreciation allowance is the net total of straight-line depreciation (negative) less the indexation of the RAB (positive).
SA Power Networks' proposed regulatory depreciation allowance is $936.0 million ($nominal) for the 2015–20 regulatory control period. We have determined a regulatory depreciation allowance of $533.7 million as shown in table 6.34
33 NER, cl. 6.12.1(8).34 NER, cl. 6.5.5(b).
26 Overview | SA Power Networks' determination 2015–20

Table 6 AER's preliminary decision on SA Power Networks' depreciation allowance for the 2015−20 regulatory control period ($ million, nominal)
2014–15 2015–16 2016–17 2017–18 2018–19 Total
Straight-line depreciation 176.4 199.7 223.7 246.1 242.0 1087.9
Less: inflation indexation on opening RAB 97.6 104.0 110.8 117.6 124.1 554.2
Regulatory depreciation 78.8 95.6 112.8 128.5 117.9 533.7
Source: AER analysis.
In coming to our preliminary decision to determine a regulatory depreciation allowance of $533.7 million ($nominal), we:
accept SA Power Networks' proposed asset classes, its straight line depreciation method and the majority of standard asset lives
do not accept SA Power Networks' proposed standard asset life of the 'light vehicles' asset class—we consider this should be five years, consistent with the current regulatory control period
do not accept SA Power Networks' proposed average depreciation approach to calculate the remaining asset lives at 1 July 2015—we use a weighted average approach
incorporate the impact of our lower forecast capex than SA Power Networks proposed.
Details of our final decision on the regulatory depreciation allowance are set out in attachment 5.
2.6 Capital expenditureCapital expenditure (capex) refers to the capital expenses incurred in the provision of network services. The return on and of forecast capex for standard control services are two of the building blocks we use to determine a service provider's total revenue requirement.
Our preliminary decision is that we are not satisfied that SA Power Networks' proposed total capex forecast of $2 481.0 million ($2014–15) for the 2015–20 period reasonably reflects the capex criteria. Our substitute estimate of SA Power Networks' total forecast capex, that we are satisfied reasonably reflects the capex criteria, is $1 684.0 million ($2014–15). Table 7 outlines our preliminary decision compared to SA Power Networks' proposal.
Table 7 AER preliminary decision on SA Power Networks' total capex ($ million 2014–15)
2015–16 2016–17 2017–18 2018–19 2019–20 Total
27 Overview | SA Power Networks' determination 2015–20

SA Power Networks' proposal
459.1 508.3 510.4 517.8 485.4 2481.0
AER preliminary decision 311.2 341.7 348.3 345.0 337.8 1684.0
Difference -147.9 -166.6 -162.1 -172.8 -147.7 -797.0
% -32% -33% -32% -33% -30% -32%
Source: AER analysis.
Figure 6 shows the difference between SA Power Networks' proposal and our preliminary decision for the 2015–20 period, as well as the actual capex SA Power Networks' spent during the 2010–15 regulatory control period.
Figure 6 SA Power Networks' forecast capex, AER preliminary decision and actual capex
Attachment 6 sets out our detailed reasons for our preliminary decision on SA Power Networks' total forecast capex. The key areas of difference between our substitute estimate and SA Power Networks' capex proposal are:
SA Power Networks' forecasting methodology applies a bottom-up assessment and does not have sufficient regard to top-down efficiency tests or delivery strategies. We consider a top down assessment is critical in deriving a total forecast capex allowance that reasonably reflects the capex criteria. There is also evidence that SA Power Networks has been overly risk averse, particularly in relation to forecasting its safety and reliability expenditure.
We do not accept SA Power Networks’ proposed replacement capex (repex). We have instead included in our substitute estimate of overall total capex, an amount
28 Overview | SA Power Networks' determination 2015–20
of $609.5 million ($2014−15) for repex, excluding overheads. This is 19 per cent lower than SA Power Networks’ proposal. However, our substitute estimate represents an increase of approximately 65 per cent over SA Power Networks’ replacement expenditure in the 2010–15 regulatory control period. This amount reflects the outcomes of our predictive modelling and our view that SA Power Networks has not established that its asset risk will increase in the 2015–20 regulatory control period by the amount forecast by SA Power Networks. For example, we do not consider that SA Power Networks has justified the need for a near fourfold increase in its forecast pole replacements.
We do not accept SA Power Networks' proposed forecast of $839.4 million for augex, and have instead included an amount of $463.6 million ($2014−15) in our substitute estimate, a reduction of 45 per cent. SA Power Networks' augex proposal consists of a number of different programs to upgrade the network to comply with forecast demand, and quality, safety, reliability and security of supply requirements. In building our substitute augex estimate:
o We accept SA Power Networks' proposals to meet forecast demand growth, maintain network reliability and power quality, and increase the security of supply to Kangaroo Island.
o We do not accept SA Power Networks' proposals for bushfire mitigation and road safety capex because we are not satisfied these reflect a prudent operator's efficient costs.
o We also do not accept SA Power Networks' proposals to improve upon current reliability levels and invest in network monitoring, because SA Power Networks can effectively meets its service obligations without this additional capex.
We accept SA Power Networks' proposed customer connections capex as it is consistent with forecast construction activity in South Australia.
We do not accept SA Power Networks' proposed non-network capex of $637.7 million ($2014−15). We have instead included in our substitute estimate of overall total capex an amount of $417.4 million ($2014−15) for non-network capex. This reflects our conclusion that SA Power Networks' forecast capex for information technology (IT), buildings and property, and fleet assets does not reflect the efficient costs of a prudent operator.
We do not accept SA Power Networks' proposed capitalised overheads. We have instead included in our substitute estimate of overall total capex an amount of $84.5 million ($2014−15) for capitalised overheads. This reduction in forecast overheads reflects our direct capex forecast that is expected to attract overhead expenditure.
2.7 Operating expenditureOpex includes forecast operating, maintenance and other non-capital costs
incurred in the provision of transmission network services. It includes labour costs and other non-capital costs that SA Power Networks is likely to require during the 2015–20 regulatory control period for the efficient operation of its network.
29 Overview | SA Power Networks' determination 2015–20

Our preliminary decision is we are not satisfied SA Power Networks' forecast opex reasonably reflects the opex criteria. We therefore do not accept the forecast opex SA Power Networks included in its building block proposal. We compare our alternative estimate of SA Power Networks' opex for the 2015–20 period with SA Power Networks' proposal in table 8.35
Table 8 AER preliminary decision and SA Power Networks' proposed total opex ($million, 2014–15)
Year ending 30 June 2015–16 2016–17 2017–18 2018–19 2019–20 Total
SA Power Networks' proposal 280.9 293.8 310.5 318.8 323.1 1527.2
AER preliminary decision 241.9 244.5 246.6 248.8 251.2 1232.9
Difference -39.0 -49.4 -64.0 -70.0 -71.9 -294.2
Source: AER analysis.
Note: Includes debt raising costs.
Figure 7 shows our preliminary decision compared to SA Power Networks' proposal, its past allowances and past actual expenditure.
Figure 7 AER preliminary decision compared to SA Power Networks' past and proposed opex ($million 2014−15)
35 NER, clause 6.12.1(4)(ii).
30 Overview | SA Power Networks' determination 2015–20

Attachment 7 sets out our detailed reasons for our preliminary decision on SA Power Networks' total forecast opex. We accept SA Power Networks' proposed base opex. The difference between our forecast opex and SA Power Networks' proposal reflects our views about the efficiency of its proposed step changes.
SA Power Networks proposed a number of opex step changes where it considers the program or projects will generate operational efficiencies. We have not included these programs or projects in our alternative opex forecast. Customers should not be asked to fund efficiency investments—such initiatives should fund themselves. Under the incentive regime SA Power Networks subject to, it is rewarded for achieving efficiencies by retaining some of the value of those efficiencies. Over time, customers benefit through lower network charges.
SA Power Networks proposed opex step changes for regulatory and legal obligations of $105 million ($2014−15). SA Power Networks quoted a variety of regulations and laws in its proposal. However, we could find little evidence that the regulation or laws SA Power Networks faced had materially changed since 2013–14, the base year, or if they had, how this was likely to materially affect the cost of providing network services.
In supporting some step changes, SA Power Networks also considered that expectations of what a reasonable service provider would do in meeting its regulatory obligations or requirements may change over time. We do not dispute this as an overarching principle. However there was little evidence that these expectations had changed since 2013-14, the base year for SA Power Networks' opex forecast.
SA Power Networks also proposed step changes labelled as customer driven initiatives or changes in community expectations. We recognise that from time to time a service provider will need to change the way it provides services to meet customer or community needs. However, while customers may express a preference for certain services, it does not necessarily mean that an increase in total forecast opex is required. We do not consider SA Power Networks has demonstrated that its proposed step changes labelled as customer driven or for meeting community expectations warrant an increase in forecast opex. This is for a variety of reasons:
Many of the proposed programs are discretionary. We consider discretionary programs should be managed within SA Power Networks' existing opex.
There was little evidence about why SA Power Networks would need additional opex for these programs to maintain the reliability, safety and quality of supply of the service it provides.
SA Power Networks is seeking to undertake activities which could be funded by other sources or undertaken by other organisations.
2.8 Corporate income taxThe NER requires us to make a decision on the estimated cost of corporate income tax for SA Power Networks' 2015–20 regulatory control period. The estimated cost of corporate income tax contributes to our determination of the total revenue requirements for SA Power Networks over the 2015–20 regulatory control period. It
31 Overview | SA Power Networks' determination 2015–20
enables SA Power Networks to recover the costs associated with the estimated corporate income tax payable during that period.
Our preliminary decision is to determine a cost of corporate income tax of $189.3 million ($ nominal) for the 2015–20 period as shown in table 9. This is instead of SA Power Networks' proposed cost of corporate income tax allowance of $415.8 million ($ nominal). Our preliminary decision is 45.5 per cent of the amount SA Power Networks proposed.
Table 9 AER's preliminary decision on SA Power Networks' tax allowance for the 2015–20 regulatory control period ($ million, nominal)
2015–16 2016–17 2017–18 2018–19 2019–20 Total
Tax payable 56.5 57.3 59.4 73.5 68.8 315.5
Less: value of imputation credits 22.6 22.9 23.8 29.4 27.5 126.2
Corporate income tax allowance 33.9 34.4 35.7 44.1 41.3 189.3
Source: AER analysis.
Our preliminary decision reflects our amendment to some of SA Power Networks' proposed inputs for forecasting the cost of corporate income tax such as the remaining tax asset lives. It also reflects our preliminary decision on the value of imputation credits (gamma) as discussed in attachment 4. Our preliminary decision changes to other building block costs that affect revenues also impact the tax calculation.
Details of our preliminary decision on the corporate income tax allowance are set out in attachment 8.
32 Overview | SA Power Networks' determination 2015–20

3 Service classification, incentive schemes and other issues
A range of factors, in addition to the building blocks, affect SA Power Networks' revenues. These include service classification, the control mechanism, incentive schemes to promote efficiency, and our approach to services charged to individual consumers. This section sets out our approach to these issues.
3.1 Service classification and control mechanismService classification determines the nature of economic regulation, if any, applicable to specific distribution services. Classification is important to customers as it determines which network services are included in basic electricity charges, the basis on which additional services are sold, and those services we will not regulate. Our preliminary decision reflects our assessment of a number of factors, including existing and potential competition to supply these services.
Our preliminary decision is to retain the classification structure set out in our Framework and Approach (F&A),36 subject to a small number of changes. The changes we have made will facilitate competition in the provision of metering services.
Figure 8 shows our preliminary decision on service classifications for the 2015–20 regulatory control period.
36 AER, Final Framework and Approach for SA Power Networks, 2015–20, April 2014.
33 Overview | SA Power Networks' determination 2015–20

Figure 8 AER preliminary decision on 2015–20 service classifications for SA Power Networks
SA Power Networks’ distribution services preliminary decision classifications
Direct control (revenue/price regulated) Negotiated Unregulated
Standard control (general network
charges)
Alternative control (service specific
charges)
Network services Standard connection
services Type 7 metering
services
Type 5 and 6 metering services
Exceptional large customer metering services (types 1 to 4)
Unclassified services
Public lighting services Non-standard network
services Non-standard
connection services Type 1 to 4 metering
services Meter testing at the
customer’s request
Consistent with our F&A, SA Power Networks will be subject to a 'revenue cap' form of control for standard control services over the next regulatory control period.37 The control mechanism (which describes how the revenues will vary from year to year) is discussed in Attachment 14. The control mechanism for standard control services is described in mathematical terms and reflects all possible adjustments that might be made to the revenue cap.
3.2 Alternative control servicesAlternative control services do not form part of SA Power Networks' revenue cap. Rather, the prices of these services are set individually. Our preliminary decision is to maintain the approach adopted in our F&A, that the form of control mechanism to apply to SA Power Networks' alternative control services will be price caps.38 SA Power Networks must demonstrate compliance with the control mechanism through an annual pricing proposal.
We did not approve large upfront metering transfer or exit fees which would be a barrier to competitive entry. Instead, when a customer switches to a competitive metering provider, they will continue to pay a regulated annual charge that recovers the fixed capital costs associated with their past regulated type 5 or 6 metering service. By switching, customers may avoid the operating costs that would be charged by SA Power Networks for type 5 or 6 metering services.
37 The detailed prescription of how service charges are set is discussed in the control mechanisms attachment.38 AER, Final Framework and Approach for SA Power Networks, 2015–20, April 2014, pp.39−43.
34 Overview | SA Power Networks' determination 2015–20
On 26 March 2015, the AEMC made a draft determination and draft rule in relation to the provision of metering and related services in the NEM.39 The rule change proposes to expand competition in metering and related services and facilitate a market led roll out of advanced metering technology. We have sought to create a regulatory framework robust enough to handle the transition to competition once the rule change takes effect. This involves having transparent standalone prices for all new/upgraded meter connections and annual charges.
Our preliminary decision does not accept SA Power Networks' proposed:
annual metering service charge, because the forecast capital and labour costs do not reasonably reflect the efficient costs of a prudent operator
price caps for new and upgraded connections, for similar reasons
transfer or exit fee for switching customers to recover the residual meter or administrative costs
installation of 'smart ready' interval meters as the standard meter for new and replacement meters and associated move to monthly meter reading. We consider that this is not prudent or efficient expenditure for what is essentially an interim solution before advanced metering can be rolled out when competition commences in 2017.
3.3 Incentive schemesIncentive schemes are a component of incentive-based regulation and complement our approach to assessing efficient costs. The incentive schemes that will apply to SA Power Networks are:
The efficiency benefit sharing scheme (EBSS)
The capital expenditure sharing scheme (CESS)
The service target performance incentive scheme (STPIS)
The demand management incentive scheme (DMIS).
Efficiency benefit sharing scheme
The efficiency benefit sharing scheme (EBSS) provides an additional incentive for service providers to pursue efficiency improvements in opex.
As opex is largely recurrent and predictable, opex in one period is often a good indicator of opex in the next period (step changes provide for increases where this is not the case). Where a service provider is relatively efficient, we use the actual opex it incurred in a chosen base year of the regulatory control period to forecast opex for the next regulatory control period. We call this the 'revealed cost approach'.
To encourage a service provider to become more efficient during the regulatory control period it is allowed to keep any difference between its approved forecast and its
39 AEMC, Draft Rule Determination, National Electricity Amendment (Expanding competition in metering related services) Rule 2015, 26 March 2015.
35 Overview | SA Power Networks' determination 2015–20

actual opex during a regulatory control period. This is supplemented by the EBSS which allows the service provider to retain efficiency savings and efficiency losses for a longer period of time. In total these rewards and penalties work together to provide a continuous incentive for a service provider to pursue efficiency gains over the regulatory control period. The EBSS also discourages a service provider from incurring opex in the expected base year in order to receive a higher opex allowance in the following regulatory control period.
Our preliminary decision is to apply the EBSS to SA Power Networks in the 2015-–20 regulatory control period. Attachment 9 sets out details of our preliminary decision on the EBSS.
Capital expenditure sharing scheme
The CESS provides financial rewards for network service providers whose capex becomes more efficient throughout the regulatory period and financial penalties for those that become less efficient. Consumers benefit from improved efficiency through lower regulated prices.
As part of the Better Regulation Program we consulted on and published the Capital Expenditure Incentive Guideline, which sets out version 1 of the CESS. The CESS approximates efficiency gains and efficiency losses by calculating the difference between forecast and actual capex. It shares these gains or losses between service providers and consumers.
Under the CESS a service provider retains 30 per cent of the benefit or cost of an underspend or overspend, while consumers retain 70 per cent of the benefit or cost of an underspend or overspend. This means that for a one dollar saving in capex the service provider keeps 30 cents of the benefit while consumers keep 70 cents of the benefit. Conversely, in the case of an overspend, the service provider pays for 30 cents of the cost while consumers bear 70 cents of the cost.
We will apply the CESS as set out in version 1 of the Capital Expenditure Incentives Guideline to SA Power Networks in the 2015–20 regulatory control period.40 This is consistent with the proposed approach we set out in our F&A.41
Our preliminary decision is to apply the CESS to SA Power Networks during the 2015–20 regulatory period.42
Attachment 10 sets out our reasons for our preliminary decision on the CESS.
Service target performance incentive scheme
The national STPIS is intended to balance the incentives to reduce expenditure with the need to maintain or improve service quality. It achieves this by providing
40 AER, Capital Expenditure Incentive Guideline for Electricity Network Service Providers, November 2013, pp. 5–9.41 AER, Preliminary positions paper, Framework and approach for SA Power Networks, Regulatory control period
commencing 1 July 2015, December 2013, p. 59.42 See section 3 of this Overview for a description of the CESS. See attachment 10 of this preliminary decision for
more detail.
36 Overview | SA Power Networks' determination 2015–20

financial incentives to distributors to maintain and improve service.43 Conversely, the STPIS penalises distributors where they let reliability deteriorate. Importantly, the distributor will only receive a financial reward after actual improvements are delivered to the customers.
In setting the STPIS performance targets, we have considered both completed and planned reliability improvements expected to materially affect network reliability performance. By setting the performance targets in such a way, any incentive a distributor may have to reduce the opex and capex at the expense of target service levels should be curtailed by the STPIS financial penalties.
In its regulatory proposal, SA Power Networks supported our F&A proposal to apply the national STPIS for the 2015–20 regulatory control period. SA Power Networks is currently subject to a variant of the national STPIS scheme. SA Power Networks submitted a proposal to transition from its current application of the STPIS to the national STPIS. Our preliminary decision is to adopt SA Power Networks' proposed transition approach. For our reasons, see attachment 11.
Demand management incentive scheme
The demand management incentive scheme (DMIS) includes a demand management innovation allowance (DMIA). The DMIA is a capped allowance for distributors to investigate and conduct broad based and/or peak demand management projects. It contains two parts:
Part A provides for an innovation allowance to be incorporated into each distributor's revenue allowance for opex each year of the regulatory control period.
Part B compensates distributors for any foregone revenue demonstrated to have resulted from demand management initiatives approved under Part A.
SA Power Networks supported our proposed approach, as set out in the F&A, to continue applying Part A of the DMIA. Our preliminary decision is to continue Part A of the DMIA for SA Power Networks in the 2015–20 regulatory control period. We will not apply Part B of the DMIA to SA Power Networks for the 2015–2020 regulatory control period because we have decided to apply a revenue cap form of control. This is consistent with our proposed approach set out in our F&A.
SA Power Networks will continue to be able to recover an amount of $0.6 million ($2014–15) per annum in the 2015–20 regulatory control period.
Attachment 12 sets out our reasons.
43 AER, Electricity distribution network service providers—service target performance incentive scheme, 1 November 2009. (AER, Electricity distribution STPIS, Nov 2009
37 Overview | SA Power Networks' determination 2015–20

4 Regulatory frameworkThe NEL and the NER provide the regulatory framework under which we operate.
These set out how we must assess a regulatory proposal and make our decision. In this section we set out some key aspects of this framework.
The NEO is the central feature of the regulatory framework. The NEO is to promote efficient investment in, and efficient operation and use of, electricity services for the long term interests of consumers of electricity with respect to—
price, quality, safety, reliability and security of supply of electricity; and
the reliability, safety and security of the national electricity system.44
The NEL also includes the revenue and pricing principles (RPP), which support the NEO.45 As the NEL requires,46 we have taken the RPPs into account throughout our analysis. The RPPs are:
A regulated network service provider should be provided with a reasonable opportunity to recover at least the efficient costs the operator incurs in—
providing direct control network services; and
complying with a regulatory obligation or requirement or making a regulatory payment.
A regulated network service provider should be provided with effective incentives in order to promote economic efficiency with respect to direct control network services the operator provides. The economic efficiency that should be promoted includes—
efficient investment in a distribution system or transmission system with which the operator provides direct control network services; and
the efficient provision of electricity network services; and
the efficient use of the distribution system or transmission system with which the operator provides direct control network services.
Regard should be had to the regulatory asset base with respect to a distribution system or transmission system adopted—
in any previous—
as the case requires, distribution determination or transmission determination; or
determination or decision under the National Electricity Code or jurisdictional electricity legislation regulating the revenue earned, or prices charged, by a person providing services by means of that distribution system or transmission system; or
44 NEL, s. 7.45 NEL, s. 7A.46 NEL, s. 16(2).
38 Overview | SA Power Networks' determination 2015–20

in the Rules.
A price or charge for the provision of a direct control network service should allow for a return commensurate with the regulatory and commercial risks involved in providing the direct control network service to which that price or charge relates.
Regard should be had to the economic costs and risks of the potential for under and over investment by a regulated network service provider in, as the case requires, a distribution system or transmission system with which the operator provides direct control network services.
Regard should be had to the economic costs and risks of the potential for under and over utilisation of a distribution system or transmission system with which a regulated network service provider provides direct control network services.
We set the amount of revenue that service providers may recover from customers, and in so doing we balance all of the elements of the NEO and RPPs. Consistent with Energy Ministers' views, we consider each of the RPPs is equally relevant.47
Chapter 6 of the NER provides specifically for the economic regulation of distributors. It includes detailed rules about the constituent components of our decisions. These are intended to contribute to the achievement of the NEO.48 The AEMC has made clear that, in relation to key aspects of revenue, the rules guide the AER. These rules do not dictate any specific regulatory outcome.49 For example, the AEMC has said:
Some stakeholders appear to have understood the objectives as imposing on the regulator a requirement and that failure to comply with this would mean the regulator is in breach of the rules. This is not the case. Although the language of an obligation is used in some objectives, it is not necessarily expected that the substance of the objective will always be fully achieved, but rather the regulator should be striving to achieve the objective as fully as possible.
Given this framework, we consider the NEO and how to achieve it throughout our decision making processes.
4.1 Understanding the NEOEnergy Ministers have provided us with a substantial body of analysis and explanatory material that guides our understanding of the NEO.50 The long term interests of
47 Hansard, SA House of Assembly, 27 September 2007 pp. 965. Hansard, SA House of Assembly, 26 September 2013, p. 7173.
48 NEL, s. 88.AEMC, Rule Determination National Electricity Amendment (Economic Regulation of Network Service Providers) Rule 2012, National Gas Amendment (Price and Revenue Regulation of Gas Services) Rule 2012, p. 8.
49 AEMC, Rule Determination National Electricity Amendment (Economic Regulation of Transmission Services) Rule 2006 No. 18, p. 33-34; AEMC, Rule Determination National Electricity Amendment (Economic Regulation of Network Service Providers) Rule 2012, National Gas Amendment (Price and Revenue Regulation of Gas Services) Rule 2012, pp. 35-6.
50 Hansard, SA House of Assembly, 9 February 2005, pp. 1451–1460.
39 Overview | SA Power Networks' determination 2015–20

consumers are not delivered by any one of the NEO's factors in isolation, but rather by balancing them in reaching a regulatory decision.51
In general, we consider that we will achieve this balance and, therefore, contribute to the achievement of the NEO, where consumers are provided a reasonable level of service that they value at least cost in the long run.52 In most industries, competition creates this outcome. Competition drives suppliers to develop their offerings to attract customers. Where a supplier’s offering is not attractive it risks being displaced by other suppliers.
However, in the energy networks industry the usual competitive disciplines do not apply. Distributors are largely natural monopolies. In addition, many of the products they offer are essential services for most consumers. Consequently, in an uncompetitive environment, consumers have little choice but to accept the quality and price the distributors offer.
The NEL and NER aim to remedy the absence of competition by providing that we, as regulator, make decisions that are in the long term interests of consumers. In particular, we might need to require the distributors to offer their services at a different price than they would choose themselves. By its nature, this process will involve exercising regulatory judgement to balance the NEO's various factors.
It is important to recognise that there are a number of plausible outcomes that may contribute to the achievement of the NEO. The nature of decisions in the energy sector is such that there may be a range of economically efficient decisions, with different implications for the long term interests of consumers.53 At the same time, however, there are a range of outcomes that are unlikely to advance the NEO to a satisfactory extent. For example, we do not consider that the NEO would be advanced if allowed revenues encourage overinvestment and result in prices so high that consumers are unwilling or unable to efficiently use the network.54 This could have significant longer term pricing implications for those consumers who continue to use network services.
Equally, we do not consider the NEO would be advanced if allowed revenues result in prices so low that investors are unwilling to invest as required to adequately maintain the appropriate quality and level of service, and where customers are making more use of the network than is sustainable. This creates longer term problems in the network55 and can have adverse consequences for safety, security and reliability of the network.
The NEL also anticipates that there may be two or more possible overall outcomes that will or are likely to contribute to the achievement of the NEO. In those cases, we must
Hansard, SA House of Assembly, 27 September 2007, pp. 963–972. Hansard, SA House of Assembly, 26 September 2013, pp. 7171–7176.
51 Hansard, SA House of Assembly, 26 September 2013, p. 7173.52 Hansard, SA House of Assembly, 9 February 2005, p. 1452.53 Re Michael: Ex parte Epic Energy [2002] WASCA 231 at [143].
Energy Ministers also accept this view – see Hansard, SA House of Assembly, 26 September 2013 p. 7172.AEMC, Rule Determination National Electricity Amendment (Economic Regulation of Transmission Services) Rule 2006 No. 18, p. 50.
54 NEL, s. 7A(7).55 NEL, s. 7A(6).
40 Overview | SA Power Networks' determination 2015–20
make the decision we are satisfied will or is likely to contribute to the achievement of the NEO to the greatest degree.56
4.2 The 2012 framework changesThis is the first decision we have made for SA Power Networks following changes to the NEL and NER in 2012 and 2013. The NEL and NER were amended to provide greater emphasis on the NEO and greater discretion to us.57 The amended NER allows, and the AEMC has encouraged us, to approach decision making more holistically to meet overall objectives consistent with the NEO and RPPs.58 Also, one of the purposes of these changes was to give consumers a clearer and more prominent role in the decision making process.59
In 2013, the NEL was changed with similar aims in mind. The long term interests of consumers are a key focus of the changes.60 The changes also support analysis of the decision as a whole in light of the NEO.61
The NEL now requires us to specify how the constituent components of our decision relate to each other and how we have taken those interrelationships into account in making our decision.62 It also anticipates the possibility of two or more decisions that will or are likely to contribute to the achievement of the NEO. It requires that, in those cases, we must make the decision we are satisfied will or is likely to contribute to the achievement of the NEO to the greatest degree.63 The NER requires that we provide reasons for our decisions.
The NEL does not prescribe how we are to apply these overarching requirements and so in applying them, we have exercised our regulatory judgement. We have done so by determining revenue in accordance with the detailed provisions in the NER. This assessment is in each of our attachments. As part of that assessment, and in accordance with the NEL requirements, we identify and assess the interrelationships between the constituent components of our preliminary decision. In the following
56 NEL, s. 16(1)(d).57 NEL, ss. 16(1)(d) and 71P(2a)(c). AEMC, Rule Determination National Electricity Amendment (Economic
Regulation of Network Service Providers) Rule 2012, National Gas Amendment (Price and Revenue Regulation of Gas Services) Rule 2012, pp. i, iii, iv, vi, vii, 8, 24 32, 36, 38, 45, 49, 67, 68, 90, 96 106, 112 and 113.Hansard, SA House of Assembly, 26 September 2013 p. 7172.
58 For example, NER, cl. 6.5.2(b) and (c), 6.5.6(a) and 6.5.7(a).AEMC, Rule Determination National Electricity Amendment (Economic Regulation of Network Service Providers) Rule 2012, National Gas Amendment (Price and Revenue Regulation of Gas Services) Rule 2012, pp. xi, 10, 19, 32 and 35.
59 AEMC, Rule Determination National Electricity Amendment (Economic Regulation of Network Service Providers) Rule 2012, National Gas Amendment (Price and Revenue Regulation of Gas Services) Rule 2012, esp. pp. 166–170.
60 Hansard, SA House of Assembly, 26 September 2013 p. 7171.61 NEL, ss. 2, 16, 71A and 71P which focus the AER’s decision making and merits review at the overall decision,
rather than its constituent components.Hansard, SA House of Assembly, 26 September 2013, pp. 7171 and 7173; See also NEL, ss. 2, 16 and 71A which focus the AER’s decision making and merits review at the overall decision, rather than its constituent components.SCER, Regulation Impact Statement – Limited Merits Review of Decision-Making in the Electricity and Gas Regulatory Frameworks, 6 June 2013, pp. i, ii, 6–7, 10, 36, 41 and 76.
62 NEL, s. 16(c).63 NEL, s. 16(1)(d).
41 Overview | SA Power Networks' determination 2015–20
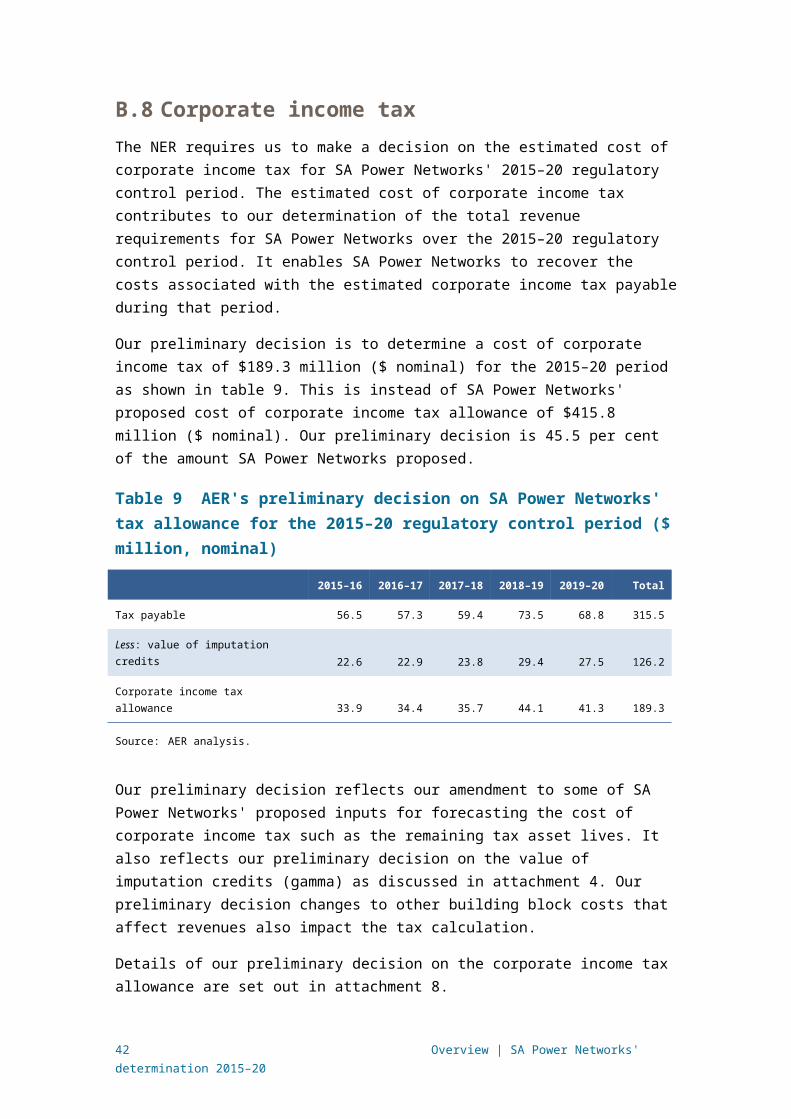
sections, we explain our approach to evaluating these interrelationships and then set out how we assessed what will contribute to the achievement of the NEO to the greatest degree. Section 1 of this overview demonstrates how we have applied these approaches for this decision.
This preliminary decision is made under transitional rules made to allow for revenue determinations to be made across the National Electricity Market that apply the changes to the NEL and the NER described above. For distributors in Queensland and South Australia, this has involved the making of a "preliminary" decision which is revoked and substituted with a final decision (see sections 5.2.1 and 6 below for more detail), in lieu of the usual process of making draft and final decisions.
Under the usual process, the AER's draft decision has no effect on revenues or prices. In contrast, this preliminary decision will be used to determine prices for the first year of the regulatory control period. Any difference between the preliminary and final decisions will be accounted for by way of an adjustment to revenues in the balance of the regulatory control period (see section 5.2.1).
4.2.1 Interrelationships
A distribution determination is a complex decision and must be considered as such. Examining constituent components in isolation ignores the importance of interrelationships between the components and would not contribute to the achievement of the NEO. As outlined by Energy Ministers, considering the elements in isolation resulted in regulatory failures in the past.64 Interrelationships can take various forms, including:
underlying drivers and context which are likely to affect many constituent components of our decision. For example, forecast demand affects the efficient levels of capex and opex in the regulatory control period and it also affects how overall revenue is translated into individual prices (see attachments 6 and 7).
direct mathematical links between different components of a decision. For example, the level of gamma has an impact on the appropriate tax allowance; the benchmark efficient entity's debt to equity ratio has a direct effect on the cost of equity, the cost of debt, and the overall vanilla rate of return (see attachments 3, 4 and 8).
trade-offs between different components of revenue. For example, undertaking a particular capex project may affect the need for opex and vice versa (see attachments 6 and 7).
trade-offs between forecast and actual regulatory measures. The reasons for one part of a proposal may have impacts on other parts of a proposal. For example, an increase in augmentation to the network means the distributor has more assets to maintain leading to higher opex requirements (see attachment 6 and 7).
the distributor's approach to managing its network. The distributor's governance arrangements and its approach to risk management will influence most aspects of the proposal, including capex/opex trade-offs (see attachment 6).
64 SCER, Regulation Impact Statement: Limited Merits Review of Decision-Making in the Electricity and Gas Regulatory Frameworks – Decision Paper, 6 June 2013, p. 6.
42 Overview | SA Power Networks' determination 2015–20
We have considered interrelationships in our analysis of the constituent components of our preliminary decision. These considerations are explored in the relevant attachments.
43 Overview | SA Power Networks' determination 2015–20
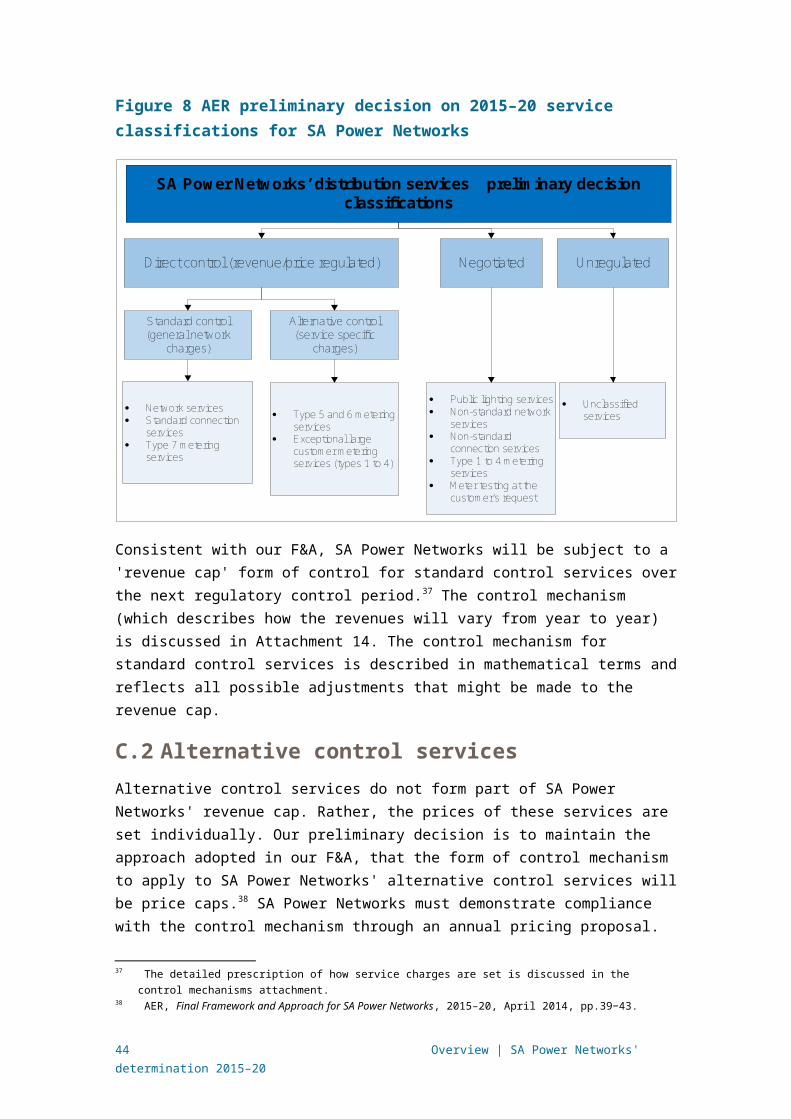
5 ProcessThe NEL requires us to inform stakeholders of the material issues we are considering and to give them a reasonable opportunity to make submissions in respect of this preliminary decision.65
Below we set out the process we have followed leading up to SA Power Networks' submission of its regulatory proposal, to ensure that we have fully taken into account all views.
5.1 Better Regulation programFollowing the 2012 changes to the NER, we spent much of 2013 consulting on and refining our assessment methods and approaches to decision making. We referred to this as our Better Regulation program. The objective of this program was to refine our approaches, with a greater emphasis on incentive regulation.66 The Better Regulation program was designed to be an inclusive process that provided an opportunity for all stakeholders to be engaged and provide their input.67
The resulting Guidelines support our decision making framework as set out in section 16 of the NEL. Our consultation and engagement gives us confidence the approaches set out in the guidelines, which we have applied in this decision, will result in decisions that will or are likely to contribute to the achievement of the NEO. Our Better Regulation guidelines are available on our website and include:68
Expenditure Forecast Assessment Guideline
Expenditure Incentives Guideline
Rate of Return Guideline
Consumer Engagement Guideline
Shared Assets Guideline
Confidentiality Guideline.
5.2 Our engagement during the decision making process
Effective consultation with stakeholders is essential to the performance of our regulatory functions. In summary, throughout the review process, we engaged with stakeholders by:
Holding monthly meetings with SA Power Networks to discuss issues relevant to this preliminary decision. These meetings commenced in August 2013 to discuss the framework and approach. The meetings continued throughout our decision making process.
65 NEL, s. 16(1)(b).66 AER, Overview of the Better Regulation reform package, April 2014, pp. 4 and 7–13.67 AER, Overview of the Better Regulation reform package, April 2014, pp. 4 and 7–13.68 http://www.aer.gov.au/Better-regulation-reform-program
44 Overview | SA Power Networks' determination 2015–20

Establishing the CCP to assist us to make better regulatory determinations by providing input on issues of importance to consumers.
Considering 31 submissions on SA Power Networks' regulatory proposal.
Publishing an issues paper on 5 December 2014 to help stakeholders engage with, and meaningfully respond to issues in SA Power Networks' regulatory proposal that we considered material to consumers.
Hosting a public forum in Adelaide on 10 December 2014 so stakeholders could question the AER, the CCP and SA Power Networks on its regulatory proposal.
Having SA Power Networks present its revenue proposal to the AER Board on 23 January 2015, so questions could be raised and key issues explained.
Having the CCP present its advice in response to SA Power Networks' regulatory proposal to the AER Board on 6 February 2015.
Convening monthly meetings between the CCP and AER staff to discuss key issues.
Ongoing formal and informal jurisdictional consumer forums from November 2013.
Consulting on benchmarking measures prepared by us and Economic Insights, jointly relevant to the preparation of the annual benchmarking report and our assessment of SA Power Networks' regulatory proposal.
Discussions with SA Power Networks about its regulatory proposal. In particular, our consultants and AER staff met with SA Power Networks to discuss expenditure proposals. During this process, AER staff considered over 40 responses to information requested from SA Power Networks.
Releasing a consultation paper on recovering the residual metering capital costs through an alternative control service charge and considering 19 submissions in response.
We investigated SA Power Networks' proposal by engaging with our consultants and SA Power Networks' staff involved in developing and managing the network, and tested material and information which underpins its revenue proposal.
A list of all submissions is at Appendix C.
5.2.1 Revocation and substitution of preliminary decision
45 Overview | SA Power Networks' determination 2015–20

In November 2012, the AEMC introduced major changes to the economic regulation of electricity distributors under chapter 6 of the NER.69
To allow consumers to receive the benefit of the new rules the AEMC made transitional rules under chapter 11 of the NER. The NER provide that we will:70
Make a preliminary determination for the 2015−20 regulatory control period by 30 April 2015.
Use the preliminary determination as a basis for approving prices for 1 July 2015 to 30 June 2016.
Revoke the preliminary determination and substitute with a final decision by 31 October 2015. The final decision will set prices for 1 July 2016 to 30 June 2020. It will also set out how we will apply a revenue adjustment that will "true up" SA Power Networks' revenue over the regulatory control period to account for any difference between the preliminary determination and the final decision affecting its revenue for the 2015-16 regulatory year.
The true-up will be calculated using forecasts as actual data for 2014−15 will not be available when the final decision is published in October 2015.
69 AEMC, Final Rule Determination, National Electricity Amendment (Economic Regulation of Network Service Providers) Rule 2012, 29 November 2012.
70 NER, cl. 11.60.4.
46 Overview | SA Power Networks' determination 2015–20

6 Next stepsAt time of publishing this preliminary decision, the NER requires us to invite written submissions on the revocation and substitution of our preliminary decision.71 This invitation is published on the AER website.
Any person may make a written submission to us on our preliminary decision including the revocation and substitution of our decision. The NER also allowed SA Power Networks to make a submission in the form of revisions to its regulatory proposal submitted in October 2014.72
After considering submissions, including revisions that SA Power Networks may submit we must revoke our preliminary decision and substitute it with a final decision by 31 October 2015.73 Key dates for our assessment process are set out in table 11 below.
Table 11 Key dates for our assessment process
Task Date
SA Power Networks' regulatory proposal submitted to AER 30 October 2014
Published SA Power Networks' regulatory proposal and supporting documents 19 November 2014
AER released Issues paper on SA Power Networks' regulatory proposal 5 December 2014
AER public forum 9 December 2014
Stakeholder submissions on regulatory proposal closed 30 January 2015
AER issues preliminary decision 30 April 2015
AER conference to explain preliminary decisions 12 May 2015
Stakeholder submissions on AER's preliminary decision close 3 July 2015
SA Power Networks' revised proposal due to AER 3 July 2015
Stakeholder submissions on SA Power Networks' revised proposal close* 24 July 2015
AER issues final decision 31 October 2015
* The NER, under transitional provisions, did not provide for consultation on SA Power Networks' revised
proposal however we have added it to provide stakeholders with an opportunity to comment.
71 NER, cll. 6.11.2 and 11.60.4(a).72 NER, cl. 11.60.4(b).73 NER, cl. 11.60.4(c).
47 Overview | SA Power Networks' determination 2015–20

A Constituent decisionsOur preliminary distribution determination is predicated on the following decisions
(constituent decision):74
Constituent decision
In accordance with clause 6.12.1(1) of the NER, the following classification of services will apply to SA Power Networks for the 2015–20 regulatory control period (listed by service group):
Standard control services include network services, standard connection services and type 7 metering services
Alternative control services include metering types 5 and 6 provision, maintenance, reading, data services and exceptional large customer metering services
Negotiated distribution services include public lighting, non–standard connection services, non–standard metering services, type 1 to 4 metering services and meter testing at a customer's request.
In accordance with clause 6.12.1(2)(i) of the NER, the AER does not approve the annual revenue requirement set out in SA Power Networks' building block proposal. Our preliminary decision on SA Power Networks' annual revenue requirement for each year of the 2015–20 period is set out in attachment 1 of the preliminary decision.
In accordance with clause 6.12.1(2)(ii) of the NER, the AER approves SA Power Networks' proposal that the regulatory control period will commence on 1 July 2015. Also in accordance with clause 6.12.1(2)(ii) of the NER, the AER approves SA Power Networks' proposal that the length of the regulatory control period will be five years from 1 July 2015 to 30 June 2020.
In accordance with clause 6.12.1(3)(ii) and acting in accordance with clause 6.5.7(c), the AER does not accept SA Power Networks' proposed total forecast capital expenditure of $2 481.0 million ($2014–15). Our substitute estimate of SA Power Networks' total forecast capex for the 2015–20 regulatory control period is $1 684.0 million ($2014–15). This is discussed in attachment 6 of the preliminary decision.
In accordance with clause 6.12.1(4)(ii) and acting in accordance with clause 6.5.6(d), the AER does not accept SA Power Networks' proposed total forecast operating expenditure inclusive of debt raising costs of $1554.1 million ($2014–15). Our substitute estimate of SA Power Networks' total forecast opex for the 2015–20 regulatory control period is $1235.9 million ($2014–15). This is discussed in attachment 7 of the preliminary decision.
In accordance with clause 6.12.1(4A)(i) the AER determines that there are no contingent projects for the purposes of the distribution determination.
SA Power Networks did not include any proposed contingent projects in its regulatory proposal for the 2015–20 regulatory control period. Therefore,
in accordance with clause 6.12.1(4A)(ii), the AER has not made an assessment of whether the capital expenditure proposed in the context of each contingent project reflects the capital expenditure criteria and factors
in accordance with clause 6.12.1(4A)(iii), the AER does not specify any trigger events in relation to contingent projects
in accordance with clause 6.12.1(4A)(iv), the AER does not determine that any proposed contingent project is not a contingent project.
In accordance with clause 6.12.1(5) the AER's decision on the allowed rate of return for the first regulatory year of the regulatory control period in accordance with clause 6.5.2 is not to accept SA Power Networks' proposal of 7.62 per cent. Our decision on the allowed rate of return for the first regulatory year of the regulatory control period is 5.45 per cent as set out in table 3.1 of attachment 3 of the preliminary decision. This rate of return will be updated annually because our decision is to apply a trailing average portfolio approach to estimating debt which incorporates annual updating of the allowed return on debt.
In accordance with clause 6.12.1(5A) the AER's decision is that the return on debt is to be estimated using a
74 NER, cl. 6.12.1.
48 Overview | SA Power Networks' determination 2015–20

Constituent decision
methodology referred to in clause 6.5.2(i)(2) which is set out in attachment 3 (appendix I) of the preliminary decision.
In accordance with clause 6.12.1(5B) the AER's decision on the value of imputation credits as referred to in clause 6.5.3 is to adopt a value of 0.4. This is set out in f attachment 4 of the preliminary decision.
In accordance with clause 6.12.1(6) the AER's decision on SA Power Networks' regulatory asset base as at 1 July 2015 in accordance with clause 6.5.1 and schedule 6.2 is $3 829.4 million . This is set out in attachment 2 of the preliminary decision.
In accordance with clause 6.12.1(7) the AER does not accept SA Power Networks' proposed corporate income tax of $415.8 million ($nominal). Our decision on SA Power Networks' corporate income tax is $189.3 million ($nominal). This is set out in attachment 8 of the preliminary decision.
In accordance with clause 6.12.1(8) the AER's decision is not to approve the depreciation schedules submitted by SA Power Networks. This is set out in attachment 5 of the preliminary decision.
In accordance with clause 6.12.1(9) the AER makes the following decisions on how any applicable efficiency benefit sharing scheme, capital expenditure sharing scheme, service target performance incentive scheme, demand management and embedded generation connection incentive scheme or small-scale incentive scheme is to apply:
In accordance with clause 6.12.1(9) of the NER, the AER’s preliminary decision is to apply version 2 of the EBSS to SA Power Networks in the 2015–20 regulatory control period. This is set out in attachment 9 of the preliminary decision.
In accordance with clause 6.12.1(9) of the NER, we will apply the CESS as set out in version 1 of the capital expenditure incentives guideline to SA Power Networks in the 2015–20 regulatory control period.
In accordance with clause 6.12.1(9) of the NER, we will apply our Service Target Performance Incentive Scheme (STPIS) to SA Power Networks for the 2015-20 regulatory control period.
o We will apply the System Average Interruption Duration Index (SAIDI) and System Average Interruption Frequency Index (SAIFI) reliability of supply parameters. We will also apply the customer service telephone answering parameter. We will not apply a guaranteed service level scheme as SA Power Networks must comply with its existing SA jurisdictional guaranteed service level scheme.
o A beta of 2.5 will be used to calculate the major event day boundary.
o Our decision on the SAIDI and SAIFI incentive rates and performance targets to apply to SA Power Networks for the 2015-20 regulatory control period are set out in tables 11-1 and 11-3 of attachment 11 of this preliminary decision.
o Our decision on the customer service incentive rate and performance target are set out in sections 11.1.2 and 11.1.3 of attachment 11 of this preliminary decision.
o The revenue at risk for SA Power Networks will be capped at ±5.0 per cent. Within this there will be a cap of ±0.5 per cent on the telephone answering parameter for performance.
Note: The meaning for year “t” under the price control formula for this determination is different to that in Appendix C of STPIS. Year “t+1” in Appendix C of STPIS is equivalent to year “t” in the price control formula of this decision.
The AER has determined to continue Part A of the Demand Management Innovation Allowance (DMIA) but will not apply either Part B of the DMIA or the D-factor scheme for SA Power Networks in the 2015–20 regulatory control period.
In accordance with clause 6.12.1(10) the AER's decision is that all appropriate amounts, values and inputs are as set out in this determination including attachments.
In accordance with clause 6.12.1(11) the AER's decision on the form of control mechanisms (including the X factor) for standard control services is a revenue cap. The revenue cap for SA Power Networks for any given regulatory year is the total annual revenue (TAR) calculated using the formula in section 14.5.3 plus any adjustment required to move the DUoS under/over account to zero. This is discussed at attachment 14.
In accordance with clause 6.12.1(12) the AER's decision on the form of the control mechanism for alternative control services is to apply price caps. This is discussed in attachment 16.
In accordance with clause 6.12.1(13), to demonstrate compliance with its distribution determination, the AER's decision
49 Overview | SA Power Networks' determination 2015–20
Constituent decision
is SA Power Networks must maintain a DUoS unders and overs account. It must provide information on this account to us in its annual pricing proposal. This is discussed in attachment 14.
In accordance with clause 6.12.1(14) the AER's decision on the additional pass through events that are to apply is to not to accept the nominated pass through events as drafted by SA Power Networks. The AER substitutes its own definitions for the following events:
liability above insurance cap event
insurer credit risk event
natural disaster event.
In accordance with clause 6.12.1(15) the AER's decision is to vary SA Power Networks' proposed negotiating framework for the 2015–20 regulatory control period.75 Specifically, our preliminary decision is to delete the word 'classification' at section 3 and schedule 1 of the negotiating framework and replace it with 'category'.
The negotiating framework that is to apply to SA Power Networks is set out at attachment 17 of the preliminary decision.
In accordance with clause 6.12.1(16) the AER's decision is to apply the negotiated distribution services criteria published in November 2014 to SA Power Networks. This is set out is at attachment 17of the preliminary decision.
In accordance with clause 6.12.1(17) the AER's decision on the procedures for assigning retail customers to tariff classes for SA Power Networks is set out at attachment 14 of the preliminary decision.
In accordance with clause 6.12.1(18) the AER's decision on regulatory depreciation is that the forecast depreciation approach is to be used to establish the RAB at the commencement of SA Power Networks regulatory control period (1 July 2020). This is discussed in attachment 2 of the preliminary decision.
In accordance with clause 6.12.1(19) the AER's decision on how SA Power Networks is to report to the AER on its recovery of designated pricing proposal charges is to set this out in its annual pricing proposal. The method to account for the under and over recovery of designated pricing proposal charges are discussed in attachment 14 of the preliminary decision.
In accordance with clause 6.12.1(20) the AER's decision is we require SA Power Networks to maintain a jurisdictional scheme unders and overs account. It must provide information on this account to us in its annual pricing proposal as set out in attachment 14 of the preliminary decision.
In accordance with clause 6.12.1(21) the AER approves a modified version of the connection policy proposed by SA Power Networks in its regulatory proposal. This is set out in attachment 18 of the preliminary decision.
75 NER, cl. 6.12.1(15).
50 Overview | SA Power Networks' determination 2015–20
B List of submissions We received 31 submissions in response to SA Power Networks' regulatory
proposal as listed below:
Submission from Date received
1 TreeNet 30/01/2015
2 The City of Unley 30/01/2015
3 Central Irrigation Trust (CIT) 30/01/2015
4 Riverland Energy Association 30/01/2015
5 South Australian Wine Industry Association 30/01/2015
6 Energy Retailers Association of Australia (ERAA) 30/01/2015
7 National Irrigators’ Council 30/01/2015
8 Vector Limited 30/01/2015
9 Simply Energy (confidential submission) 30/01/2015
10 Business SA 30/01/2015
11 Energy Users Association of Australia (EUAA) 30/01/2015
12 Total Environment Centre (TEC) 30/01/2015
13 Australian PV Institute 30/01/2015
14 SA Greens 30/01/2015
15 Macquarie Corporate and Asset Finance (CAF) 30/01/2015
16 SA Power Networks (submission 1) 30/01/2015
17 Mr John Herbst (individual) 30/01/2015
18 SA Power Networks (submission 2) 30/01/2015
19 Origin 30/01/2015
20 SA Financial Counsellors of Australia consortium 30/01/2015
21 Energy Consumers Coalition of SA (ECCSA) 30/01/2015
22 Consumer Challenge Panel Sub Panel 2 30/01/2015
23 COTA SA 30/01/2015
24Government of South Australia (Minister for Mineral Resources and Energy)
30/01/2015
25 AGL 30/01/2015
26 Renmark Irrigation Trust 31/01/2015
27 Metropolis Metering Services P/L 31/01/2015
28 South Australian Council of Social Service (SACOSS) 02/02/2015
51 Overview | SA Power Networks' determination 2015–20
Submission from Date received
29 Local Government Association of SA 05/02/2015
30 TransTasman Energy Group 06/02/2015
31 UnitingCare 13/03/2015
52 Overview | SA Power Networks' determination 2015–20