Embed Size (px)
Citation preview

Our Nutrient World The challenge to produce more food and energy with less pollution
Prepared by the Global Partnership on Nutrient Management in collaboration with the International Nitrogen InitiativeG
lob
al O
verv
iew
on
Nu
trie
nt
Man
agem
ent
Our Nutrient World_reflowed.indd 1 30/01/2013 10:26:10

Published by the Centre for Ecology and Hydrology (CEH), Edinburgh UK, on behalf of the Global Partnership on Nutrient Management (GPNM) and the International Nitrogen Initiative (INI).ISBN: 978-1-906698-40-9 © Centre for Ecology and Hydrology, 2013.This publication is in copyright. It may be quoted and graphics reproduced subject to appropriate citation.
Recommended citation: Sutton M.A., Bleeker A., Howard C.M., Bekunda M., Grizzetti B., de Vries W., van Grinsven H.J.M., Abrol Y.P., Adhya T.K., Billen G.,. Davidson E.A, Datta A., Diaz R., Erisman J.W., Liu X.J., Oenema O., Palm C., Raghuram N., Reis S., Scholz R.W., Sims T., Westhoek H. & Zhang F.S., with contributions from Ayyappan S., Bouwman A.F., Bustamante M., Fowler D., Galloway J.N., Gavito M.E., Garnier J., Greenwood S., Hellums D.T., Holland M., Hoysall C., Jaramillo V.J., Klimont Z., Ometto J.P., Pathak H., Plocq Fichelet V., Powlson D., Ramakrishna K., Roy A., Sanders K., Sharma C., Singh B., Singh U., Yan X.Y. & Zhang Y. (2013) Our Nutrient World: The challenge to produce more food and energy with less pollution. Global Overview of Nutrient Management. Centre for Ecology and Hydrology, Edinburgh on behalf of the Global Partnership on Nutrient Management and the International Nitrogen Initiative.
The report is available on-line at the following locations:www.unep.org www.gpa.unep.org/gpnm.html www.initrogen.org www.scopenvironment.org www.igbp.net/publications
Hard copies may be purchased on-line at www.earthprint.com/ For bulk orders contact [email protected]
About GPNM and INIThe Global Partnership on Nutrient Management (GPNM) is a multi-stakeholder partnership comprising of governments, private sector, scientific community, civil society organizations and UN agencies committed to promote effective nutrient management to achieve the twin goals of food security through increased productivity and conservation of natural resources and the environment. The United Nations Environment Programme (UNEP), through the Coordination of Office of the Global Programme of Action for the Protection of the Marine Environment from Land-based Activities (GPA), provides the Secretariat of GPNM.
The International Nitrogen Initiative (INI) is a scientific partnership that addresses the problems of too much nitrogen in some parts of the world and too little nitrogen in others. It is a joint project of the International Geosphere-Biosphere Programme (IGBP) and the Scientific Committee on Problems of the Environment (SCOPE).
This Global Overview has been prepared as a scientifically independent process. The views and conclusions expressed are those of the authors, and do not necessarily reflect policies of the contributing organizations. As an overview, this report does not attempt to reach consensus on all issues. Its purpose is to raise awareness of the challenges, pointing to possible options. It is hoped that the report will stimulate further collection of evidence and trans-disciplinary dialogue with all stakeholders as necessary future steps.
The report incorporates outcomes from several meetings, including: the Global Overview of Nutrient Management Preparatory Workshop (Paris, November 2011), the Global Conference on Land-Ocean Connections organised by UNEP (Manila, January 2012); the Third Inter-Governmental Review meeting of the GPA (Manila, January 2012), the side-event ‘Nutrients: for food or pollution? The choice is ours’ organized by the GPA Coordination Office and GPNM during the United Nations Conference on Sustainable Development (Rio+20, Rio de Janeiro, June 2012), the First Stakeholder Workshop toward Global Nitrogen Assessment (London, July 2012), and events at the 11th Conference of Parties of the Convention on Biological Diversity (Hyderabad, November 2012).
The authors gratefully acknowledge financial support for this process from the Government of Norway through UNEP, GPA Coordination Office, the European Commission support through the ÉCLAIRE project, the UK Natural Environment Research Council for National Capability Support to CEH and through the Macronutrients Cycles Programme (LTLS project), the Global Environment Facility (GEF) and other partners through the UNEP/GEF project ‘Global Foundations for Reducing Nutrient Enrichment and Oxygen Depletion from Land-based Pollution in Support of Global Nutrient Cycle’. The activity simultaneously represents a contribution in support of complementary global objectives (e.g. CBD Aichi Targets) and regional objectives (including the UNECE Transboundary Air and Water Conventions and the Regional Water Commissions), drawing on support from the UNECE Task Force on Reactive Nitrogen (TFRN) and the Global TraPs (Transdisciplinary processes for sustainanble phosphorus management). We gratefully acknowledge kind inputs and support from Agnieszka Becher, Kate Mason, Deborah Rayner, Deli Chen, Allison Leach, Mani Sachdev and Wilfried Winiwarter in preparing this report.
Our Nutrient World_reflowed.indd 2 30/01/2013 10:26:10

Our Nutrient WorldThe challenge to produce more food and energy
with less pollution
Prepared byM.A. Sutton, A. Bleeker, C.M. Howard, M. Bekunda, B. Grizzetti, W. de Vries,
H.J.M. van Grinsven, Y.P. Abrol, T.K. Adhya, G. Billen, E.A. Davidson, A. Datta, R. Diaz, J.W. Erisman, X.J. Liu, O. Oenema, C. Palm, N. Raghuram, S. Reis,
R.W. Scholz, T. Sims, H. Westhoek & F.S. Zhang
with contributions from S. Ayyappan, A.F. Bouwman, M. Bustamante, D. Fowler, J.N. Galloway,
M.E. Gavito, J. Garnier, S. Greenwood, D.T. Hellums, M. Holland, C. Hoysall, V.J. Jaramillo, Z. Klimont, J.P. Ometto, H. Pathak, V. Plocq Fichelet,
D. Powlson, K. Ramakrishna, A. Roy, K. Sanders, C. Sharma, B. Singh, U. Singh, X.Y. Yan & Y. Zhang
Our Nutrient World_reflowed.indd 3 30/01/2013 10:26:11

Our Nutrient World_reflowed.indd 4 30/01/2013 10:26:11

global overview on nutrient management v
Contents
Foreword vi
Executive Summary vii
1 Introduction 1
2 Trends in nutrient supply, their benefits and future availability 8
3 Global nitrogen and phosphorus pollution 19
4 Environmental threats of too little and too much nutrients 32
5 Weighing up the benefits and costs of nutrient management activities 52
6 Practical options to reduce adverse effects by improving nutrient use 58
7 Current policies and barriers to change 75
8 Future needs, targets and opportunities 95
Appendix: National Nitrogen Use Efficiency estimates and aspirational goals 108
Affiliations of contributors inside back cover
Our Nutrient World_reflowed.indd 5 30/01/2013 10:26:12

vi global overview on nutrient management
Foreword
Nutrients – such as nitrogen, phosphorus, potassium and micronutrients including calcium, sulphur, copper, zinc and others– are essential for plant growth, food produc-tion and ultimately adequate nutrition for humans.
Yet we live in a time of glaring contrasts – of excessive use of nutrients in some regions and insufficient use in others.
Many sub-Saharan African farmers struggle to access enough nutrients for quality crop production with knock on effects as more ecosystems are converted to cropland to try and maintain sufficient food supplies.
In the developed world and in several rapidly develop-ing regions of South and East Asia, there is the problem of excessive nutrient use which is triggering a web of unfore-seen consequences.
Excessive use of phosphorus is not only depleting fi-nite supplies, but triggering water pollution locally and beyond while excessive use of nitrogen and the produc-tion of nitrogen compounds is triggering threats not only to freshwaters but the air and soils with consequences for climate change and biodiversity.
The Global Overview on Nutrient Management ad-dresses the scientific complexity of how humanity can rise to these challenges and maximize the opportunities of improved nutrient management.
Its preparation has forged new links between commu-nities, gradually building a network of institutions and ac-tors for better scientific understanding to support future decision making in this field.
The work underpinning the report is an outcome from the Global Partnership on Nutrient Management (GPNM), which was launched during the 17th session of the UN Commission on Sustainable Development in 2009 as a global partnership of governments, poli-cy makers, industry, science community, civil society
organizations and UN agencies with UNEP providing the Secretariat.
By building the global partnership, in particular with engagement of governments, the International Nitrogen Initiative and other groups the GPNM is sharing and generating knowledge. Both will be essential if citizens, companies and governments are to take the transforma-tive actions needed.
The message of this overview is that everyone stands to benefit from nutrients and that everyone can make a contribution to promote sustainable production and use of nutrients. Whether we live in a part of the world with too much or too little nutrients, our daily decisions can make a difference.
Without swift and collective action, the next genera-tion will inherit a world where many millions may suffer from food insecurity caused by too few nutrients, where the nutrient pollution threats from too much will become more extreme, and where unsustainable use of nutrients will contribute even more to biodiversity loss and acceler-ating climate change.
Conversely with more sustainable management of nu-trients, economies can play a role in a transition to a Green Economy in the context of sustainable development and poverty eradication. The Global Overview develops these essential themes, to prepare societies to take the next steps.
Achim SteinerUnited Nations Under-Secretary General and Executive DirectorUnited Nations Environment Programme
Our Nutrient World_reflowed.indd 6 30/01/2013 10:26:23
global overview on nutrient management vii
Executive Summary
Key PointsNutrient Benefits and Threats
7 The sustainability of our world depends fundamentally on nutrients. In order to feed 7 billion people, humans have more than doubled global land-based cycling of nitrogen (N) and phosphorus (P).
7 The world’s N and P cycles are now out of balance, causing major environmental, health and economic prob-lems that have received far too little attention.
7 Insufficient access to nutrients still limits food production and contributes to land degradation in some parts of the world, while finite P reserves represent a potential risk for future global food security, pointing to the need for their prudent use.
7 Unless action is taken, increases in population and per capita consumption of energy and animal products will exacerbate nutrient losses, pollution levels and land degradation, further threatening the quality of our water, air and soils, affecting climate and biodiversity.
The Nutrient Challenge 7 A new global effort is needed to address ‘The Nutrient Nexus’, where reduced nutrient losses and improved nutri-
ent use efficiency across all sectors simultaneously provide the foundation for a Greener Economy to produce more food and energy while reducing environmental pollution.
7 The new effort must cross the boundaries between economic sectors and environmental media, be under-pinned by scientific and other evidence from a robust global assessment process, share best practices, and address the substantial cultural and economic barriers that currently limit adoption.
Actions and Outcomes 7 The global community of all relevant stakeholders now needs to agree which existing inter-governmental process
is best suited to take the lead in improving nutrient management for the 21st century, or whether a new policy process is needed.
7 One option is to strengthen the mandate of the ‘Global Programme of Action for the Protection of the Marine Environment from Land-based Activities’ (GPA) to address the inter-linkages between land, air and water, in relation to the global supply of all nutrient sources and Nutrient Use Efficiency (NUE) across the full chain, considering their regional variation.
7 Nutrient Use Efficiency represents a key indicator to assess progress towards better nutrient management. An aspirational goal for a 20% relative improvement in full-chain NUE by 2020 would lead to an annual saving of around 20 million tonnes of nitrogen (‘20:20 by 2020’), and equate to an initial estimate of improvement in human health, climate and biodiversity worth around $170 billion per year.
Developing the Mandate 7 A central objective of the new inter-governmental effort must be to show how improved management of N and
P at different scales over the whole cycle would simultaneously make quantified contributions toward meet-ing existing commitments for water, air, soil, climate and biodiversity, while underpinning improved food and energy security – with net social and economic benefits.
7 International consensus and authorization of the global nutrient focus is now essential, emphasizing the need for a mandate to assess the scientific evidence, share best practices, and work towards inter-governmental agreements that make quantifiable steps toward the sustainable development of Our Nutrient World.
Our Nutrient World_reflowed.indd 7 30/01/2013 10:26:23

viii global overview on nutrient management
Too much and too little nutrients
Nutrients feed the world1. The world needs nutrients, especially nitrogen (N)
and phosphorus (P), which are essential to raise crops and animals to feed an increasing world population (Chapters 1 and 2).
77 It is estimated that nitrogen and other mineral fertilizer is essential to feed around half of the world’s population, and will be fundamental to ensure global food security through the 21st century.
77 Natural nutrient sources and recycling have been insufficient for increasing human needs since the 19th century. The 18th-19th century agricultural and industrial revolutions laid the foundation for exploitation of mined sources of N and P, and for development of the Haber-Bosch process, where energy is used to convert otherwise unreactive atmospheric di-nitrogen (N2) into reactive nitro-gen (Nr) compounds.
77 The 20th century ‘green revolution’ has depended critically on these additional nutrient sources, while becoming the basis for an ongoing ‘live-stock revolution’, where relatively cheap grain and other produce (surplus to regional food re-quirements) are allowing intensification of live-stock farming, greatly increasing per-capita meat and dairy production.
77 While recent trends in nutrient consumption are relatively stable in developed countries, growing human population and rising per capita meat/dairy consumption as a result of increasing in-comes are together causing a rapid increase in nutrient consumption in transitional and de-veloping countries. It is anticipated that these countries may account for ¾ of global nutrient consumption by 2050.
77 Around 2% of world energy use is dedicated specifically to the industrial manufacture of Nr, mainly through the Haber-Bosch process, so that Nr prices are closely coupled to global energy prices.
77 Phosphorus is obtained from mining of finite phosphate rock deposits, with current world sup-plies coming from just a few key countries. This poses potential risks for future supply, given that there is no alternative to P as an essential plant nutrient. Parallel risks apply for other mined nutrients including potassium (K) and micronu-trients, especially zinc, for which the currently identified resources have a much shorter lifetime than for phosphorus and potassium.
Nutrient losses create a global web of pollution2. There are major problems associated with high levels
of nutrient use, especially in Europe, North America,
South and East Asia and Latin America (Chapters 3, 4 and 8).
77 The efficiency of nutrient use is very low: con-sidering the full chain, on average over 80% of N and 25-75% of P consumed (where not tem-porarily stored in agricultural soils) end up lost to the environment, wasting the energy used to prepare them, and causing pollution through emissions of the greenhouse gas nitrous oxide (N2O) and ammonia (NH3) to the atmosphere, plus losses of nitrate (NO3-), phosphate (PO43-) and organic N, P compounds to water.
77 Oversupply of nutrients, or imbalance between nutrients, reduces the efficiency of nutrient use. Efficiency is further reduced by including live-stock in the food chain, substantially increasing N and P pollution levels.
77 Burning fossil fuels produces a significant addi-tional Nr resource (~20% of human Nr produc-tion) part of which could be captured and used, but which is currently wasted as emissions of nitrogen oxide (NOx) to air, contributing to par-ticulate matter and ground-level (tropospheric) ozone, which adversely affect human health, ecosystems and food production systems.
77 Many thresholds for human and ecosystem health have been exceeded due to Nr pollution. Each of these environmental effects can be mag-nified by the ‘nitrogen cascade’, where a single atom of Nr can trigger a cascade of negative envi-ronmental impacts.
Insufficient nutrients exacerbate land degradation3. In Africa, Latin America and parts of Asia there are
still wide regions with too little nutrients. In particu-lar (Chapters 2 and 4):
77 Many farmers do not have access to affordable mineral fertilizers, where lack of local sources and poor supply infrastructure increases prices, limit-ing agricultural yields. Biological nitrogen fixa-tion and manure recycling are key local nutrient sources which are not always optimally exploited.
77 The inability to match crop harvests with a suf-ficient nutrient return leads to depletion of nutri-ents and organic matter, reducing soil quality and increasing the risk of land degradation through erosion and of agricultural incursion into virgin ecosystems.
77 Shortages of water and micronutrients (such as sulphur, zinc, selenium, etc.) can limit N and P use efficiency, preventing the best use being made of these major nutrients.
Key Nutrient Threats4. Five main threats of nitrogen pollution were high-
lighted by the European Nitrogen Assessment (Chapter 4). These are adapted here to reflect the
Our Nutrient World_reflowed.indd 8 30/01/2013 10:26:23

global overview on nutrient management ix
global environmental nutrient threats (Figure ES1), highlighting the complexity of nutrient interactions, while offering a short-list of the 5 key issues.
5. This short list of key environmental threats forms the WAGES of too much or too little nutrients:
77 Water quality – including coastal and fresh-water dead zones, hypoxia, fish kills, algal blooms, nitrate contaminated aquifers and impure drinking water, resulting from both Nr and P eutrophication.
77 Air quality – including shortening of human life through exposure to air pollutants includ-ing particulate matter formed from NOx and NH3 emissions, and from increased concentra-tions of nitrogen dioxide (NO2) and ground-level ozone (O3).
77 Greenhouse gas balance – including emis-sions of N2O plus interactions with other Nr forms, particulate matter and atmospheric Nr deposition, plus tropospheric O3. N2O is now also the main cause of stratospheric ozone de-pletion, increasing the risk of skin cancer from UV-B radiation.
77 Ecosystems and biodiversity – including the loss of species of high conservation value natu-rally adapted to few nutrients. Eutrophication from atmospheric Nr deposition is an insidious pressure that threatens the biodiversity of many ‘protected’ natural ecosystems.
77 Soil quality – over-fertilization and too much atmospheric Nr deposition acidify natural and agricultural soils, while a shortage of N and P nutrients leads to soil degradation, which can
be exacerbated by a shortage of micronutri-ents, leading to loss of fertility and erosion.
6. The increased release of N and P into our environ-ment can be seen in relation to present efforts to refine ‘Planetary Boundaries’ for key global threats. The huge extent to which Nr production and releases exceed the boundary has already been widely publi-cized. Efforts are now needed to improve the dose-re-sponse relationships and quantify regional variation. This will enable the fine tuning of response, while noting that sufficient evidence is already available to justify taking action to reduce these threats.
Nutrients are an increasing threat requiring urgent action7. Since the 1960s, human use of synthetic N fertilizers
has increased 9-fold globally, while P use has tripled (Chapter 2). Further substantial increase of around 40-50% is expected over the next 40 years (Figure ES2) in order to feed the growing world population and because of current trends in dietary lifestyles, with increasing consumption of animal products. These changes will exacerbate current environmen-tal problems unless urgent action is taken to improve the efficiency of N and P use, and to re-evaluate so-cietal ambitions for future per capita consumption patterns.
8. The consequences of not taking action include further global warming effects from increasing atmospheric N2O (a greenhouse gas which is 300 times more radi-atively reactive than CO2), continuing deterioration of water, air and soil quality, shortening human life, while threatening ecosystem services and biodiver-sity. The full damage cost has not yet been assessed, but annual global loss of ecosystem services including damage to fisheries from coastal N and P pollution-related hypoxia alone costs an estimated $170 billion
Figure ES1 The five key threats of too much or too little nutrients (Chapter 4).
Figure ES2 Trends in global mineral fertilizer consumption for nitrogen and phosphorus and projected possible futures. The amounts of N and P in 2050 will depend on present-day decisions (expressed as N and P2O5) (Chapter 2).
Our Nutrient World_reflowed.indd 9 30/01/2013 10:26:25

x global overview on nutrient management
(Chapter 5). Making better use of nutrients will re-duce these pollution threats, while improving food and energy production.
9. The possibility of P shortage in the future represents a major issue of recent contention (Chapter 2). Global supply security of P is a prerequisite for food security. While only 3 countries produce 66% of rock phos-phate, many countries do not have the physical re-serves or economic means to obtain them. There are few countries whose known reserves cover current P demand for a long period (e.g. Morocco, Algeria: >1000 years based on current use and reserve esti-mates), others for a shorter time (USA, China, Brazil: 50 years), while other countries have no notable reserves (e.g. Germany, Japan). Whether there are accessible global P reserves to feed humanity for de-cades or centuries, long-term access to P is a critical issue that calls for more efficient practices and con-sumption patterns that waste less nutrients and mini-mize environmental impacts.
10. The risk of future shortage of potassium, and of zinc and other essential micronutrients needs to be fur-ther investigated, especially as only 20 years of zinc reserve are currently identified (roughly maintaining this number since the 1980s, as new reserves have been identified) (Chapter 2).
Solutions must address N and P cycles on local to global scales11. Nitrogen and phosphorus cycles operate across mul-
tiple spatial scales, from the dynamics of a single field, through trans-boundary transport of air and water pollution, to the global increase in N2O concentra-tions. Such inter-connections require consensus on an international approach that takes account of local and
regional conditions, while addressing the necessary improvement in nutrient use efficiency at the global scale. The role of ‘barriers to change’ also necessitates a global approach. These include the global scale of trade in mineral fertilizers, food crops, animal feed and live-stock products, which can constrain the adoption of nutrient best practices (Chapters 7 and 8).
12. Major inequalities exist between those parts of the world using excess nutrients and those that do not have enough. The key regions where too much nu-trients are typically used include North America, Europe, and parts of South and South East Asia and Latin America. By contrast, many parts of Africa and Latin America have insufficient access to nutrients, leading to soil nutrient mining and limiting produc-tivity. The scale of the differences is illustrated for ma-jor river catchments in Figure ES3, with these being exacerbated by differences in nutrient use efficiency across the full chain.
Key actions to produce more food and energy with less pollution13. We identify ten key actions as being central to
improving nutrient use efficiency, thereby improving food and energy production, while reducing N and P losses that pollute our environment (Chapter 6).
Agriculture1. Improving nutrient use efficiency in crop
production,2. Improving nutrient use efficiency in animal
production,3. Increasing the fertilizer equivalence value of ani-
mal manure,
Figure ES3 Some regions use excess nutrients, with the waste causing environmental pollution, while other regions do not have enough. The map shows estimated net anthropogenic nitrogen inputs according to the world’s main river catchments (Chapter 3).
Our Nutrient World_reflowed.indd 10 30/01/2013 10:26:26

global overview on nutrient management xi
Transport and Industry4. Low-emission combustion and energy-efficient
systems, including renewable sources,5. Development of NOx capture and utilization
technology,
Waste and Recycling 6. Improving nutrient efficiency in fertilizer and
food supply and reducing food waste,7. Recycling nitrogen and phosphorus from waste
water systems, in cities, agriculture and industry,
Societal consumption patterns8. Energy and transport saving,9. Lowering personal consumption of animal pro-
tein among populations consuming high rates (avoiding excess and voluntary reduction),
Integration and optimization 10. Spatial and temporal optimization of nutrient
flows.
14. These actions must be seen in the context of the wider N and P cycles, considering acquisition, use and recy-cling. Efforts are needed to improve the nutrient use efficiency (NUE) of each stage, such as in crop and animal production. However, we emphasize the need to address the ‘full-chain NUE’, defined as the ratio of nu-trients in final products (e.g., human food consumed) to new nutrient inputs (e.g., Haber-Bosch Nr, biologi-cal N fixation, NOx formation, mined P and N).
15. As Figure ES4 illustrates, each of the component ef-ficiencies contribute to the full-chain NUE. Actions promoting the recycling of available Nr and P pools, such as effective recycling of animal manures, hu-man sewage and NOx capture and utilization (NCU) technology, all contribute to increasing full-chain NUE. The options include many technical mea-sures, such as improved placement and timing for mineral fertilizer and organic manures, the use of manure storage and spreading methods that reduce emissions, and the processing of manures into more efficient fertilizers.
16. Where we can, our choices as citizens make a big dif-ference. While some remain undernourished, people in many countries eat more animal products than is optimal for a healthy diet. Avoiding over-consump-tion of animal products (e.g., staying within World Health Organization guidelines for saturated fats) in-creases full-chain NUE, reducing N and P pollution, while benefiting our health. There are many opportu-nities for citizens of wealthy countries to show how consuming less animal products can lead the way to-ward future lifestyles where better dietary health and environmental quality go hand-in-hand.
17. The global economic benefits for the environment and human health by avoiding over-consumption of animal products still need to be quantified. However,
the central role of livestock in contributing to nu-trient pollution is well established. In the European Nitrogen Assessment, it was estimated that 85% of harvested Nr was used to feed livestock, with only 15% feeding people directly, while the average EU citizen consumed 70% more protein than needed for a healthy diet.
A new intergovernmental focus18. There is an urgent need to develop joined-up ap-
proaches that optimize the planet’s nutrient cycles for delivery of our food and energy needs, while reducing threats to social and economic well being, including threats to climate, ecosystem services and human health. This set of multiple connections may be termed ‘The Nutrient Nexus’, where good nutrient management can be seen as making a vital contribu-tion to all global change challenges (Chapter 7).
19. Nutrient management is currently addressed in part by divergent efforts on food, climate, water and air pollution, and biodiversity, but there is no interna-tional treaty that links the major nutrient benefits and threats (Chapters 7 and 8).
20. Existing N and P policies have been most successful in sectors consisting of few key actors (e.g. electricity generation, car manufacturing, water treatment), but have made less progress when engaging many diverse actors (e.g., citizens’ transport choices, farmer prac-tices). The challenge of diversity requires long-term dialogue, education and training, especially utilizing key actors in nutrient pathways.
21. One option to address the Nutrient Nexus would be to strengthen the mandate of the intergovernmental ‘Global Programme of Action for the Protection of the Marine Environment from Land-based Activities’ (GPA). Although GPA has a current focus on the ma-rine environment, it is already taking a lead in devel-oping a cross-sectoral approach through the Global Partnership on Nutrient Management (GPNM).
22. International consensus is now needed (Chapter 8)that mandates a strengthened GPA or other body to: 1. Establish a global assessment process for nitro-
gen, phosphorus and other nutrient interactions, between air, land, water, climate and biodiversity, considering the main driving forces, the interac-tions with food and energy security, the costs and benefits and the opportunities for the Green Economy,
2. Develop consensus on the operational indica-tors, with benchmarking to record progress on improving nutrient use efficiency and reducing the adverse environmental impacts,
3. Investigate options for improvement of nutrient use efficiency, demonstrating benefits for health, environment, and the supply of food and energy,
4. Address barriers to change, fostering education, multi-stakeholder discourse and public awareness,
Our Nutrient World_reflowed.indd 11 30/01/2013 10:26:27

xii global overview on nutrient management
5. Establish internationally agreed targets for im-proved Nr and P management at regional and planetary scales,
6. Quantify the multiple benefits of meeting the nutrient management targets for marine, fresh-water and terrestrial ecosystems, mitigation of greenhouse gases and other climate threats, and improvement of human health,
7. Develop and implement an approach for moni-toring time-bound achievement of the nutrient management targets, and for sharing and diffus-ing new technologies and practices that would help to achieve the targets.
23. An illustration of projected achievable gains is shown in Figure ES5. Globally, a target for 2020 to achieve a relative improvement in full-chain nutrient use ef-ficiency by 20% would deliver an estimated saving of 20 million tonnes of Nr. Based on initial estimates, this would equate to a global improvement in human health, climate and biodiversity of the order of $170 (50-400) billion per year (Chapter 8).
24. A 20% improvement in full-chain NUE while maintaining current levels of N input would give smaller net benefits 70 (15 – 165), with environ-mental benefits much larger than implementation cost, although this figure does not include the sub-stantial additional benefits of increased food and energy production.
Figure ES5 The benefits of improved Nutrient Use Efficiency (NUE). The map shows the Nr savings that would be made, per ha of agricultural land, from a 20% relative improvement in full-chain NUE (see Chapter 8).
Unintended N fixation in combustion
NOx capture & reuse
NUE combustion 5
Humans
Nr input by combustion
Energy Consumption & Transport
Choices
4
En
8
Full Chain NUEN,P Nutrient Resource
N&P Fertilizer
& Biological Nitrogen Fixation
Manure & sewage
fertilizer products
NUE sewage NUE sewage NUE manures es
3
7
Feeds harvest
Livestock production
Food harvest
NUE feed crop
NUE food crop
NUE animal
Food Consumption
& Diet Choices
NUE food supply
Humans
1
pr2
1
6 9
Con
HumansHumans
Crop NUEN,P
10
Spatial optimization & integration
Figure ES4 Nutrient flow can be seen as a cycle from resource through the stages of use (blue arrows) with recycling (green arrows). The system is driven by the ‘motors’ of human consumption. Numbered circles highlight the ten key actions to increase Nutrient Use Efficiency (NUE) (Chapter 6).
Our Nutrient World_reflowed.indd 12 30/01/2013 10:26:28

global overview on nutrient management 1
1 IntroductionNitrogen and phosphorus as emerging global challengesHumans have been altering the world’s biogeochemical cycles for many millennia. Perhaps the largest pre-histor-ical impacts were related to man’s discovery of fire, with wide-scale burning and clearance of natural land across substantial areas of the world. These early changes were particularly associated with increased pastoralism, fol-lowed by the development of arable agriculture and the rise of settled civilizations. Each of these activities further modified the world’s nutrient flows, altering the cycles of nitrogen (N), phosphorus (P), carbon (C), sulphur (S) and many other trace elements.
The scale of these changes has massively accelerated since the industrial revolution. As is well known from numerous publications related to climate change, rates of anthropogenic carbon dioxide (CO2) and other green-house gas emissions have increased substantially since 1750 (IPCC, 2007). The greenhouse gases include both methane (CH4), especially from fossil fuel sources and livestock agriculture, and nitrous oxide (N2O), which is particularly emitted from agricultural soils. The same has happened with other emissions to air, such as nitrogen ox-ides (NOx), being the sum of nitric oxide (NO) and nitro-gen dioxide (NO2), which are inadvertently produced by high-temperature combustion processes, and ammonia (NH3), which mainly arises by volatilization from agri-cultural activities, including both livestock and cropping practices. In parallel with the increase in emissions to air, a plethora of human disturbances has mobilized other ni-trogen compounds, such as nitrates (NO3-) and organic nitrogen species, as well as phosphorus compounds, espe-cially phosphates (PO43-), thereby increasing their trans-fer into water bodies around the world (Figure 1.1).
Together with emissions of other compounds, such as sulphur dioxide (SO2) from coal burning, these losses of N and P to air and water contribute to a web of interlinked environmental problems. These include climate change, acid rain, stratospheric ozone depletion, ground-level ozone, particulate matter in air, and nutrient enrichment (or ‘eutrophication’), threatening both human health and biodiversity.
While recent scientific and social debate about the environment has focused especially on CO2 in relation to climate change, we see that this is just one aspect of a much wider and even more complex set of changes occurring to the world’s biogeochemical cycles. In par-ticular, it becomes increasingly clear that alteration of the world’s nitrogen and phosphorus cycles represents a major emerging challenge that has received too little at-tention. While there is much scientific knowledge on N and P processes, the different parts of the system have not been sufficiently joined up. This is reflected in both the assessment of impacts and in the fragmentary nature of
the policies needed to manage them. Disturbance of the N and P cycles represents a major global challenge, which needs to be understood and quantified if society is to de-velop sustainable practices for the future.
Historical contextIt is important to emphasize that these threats to envi-ronmental quality were not the historical starting point. From the first man-made forest fires through to the earliest farming systems, human disturbance of nutri-ent cycles was motivated by the need to ensure food and energy security. Already in ancient times, there was a pretty good understanding of the importance of recycling animal manures. For example, the Roman agricultural writer Columella pointed out the benefit of ploughing-in manure immediately on the same day of its application, so to maximize its effectiveness in the soil, and he even compared the fertilizer value of different legume species (Ash, 1941). This relates to the presence of nitrogen-fixing bacteria associated with the roots of certain legumes and other plant species. Even though the Roman’s did not un-derstand the mechanisms, they were making choices re-lated to the good management of nutrient cycles.
The example of legumes highlights the need to clarify the different types of nitrogen present in the environment. All of the N forms mentioned so far, such as ammonia, nitrates and organic nitrogen compounds are naturally available in only limited amounts, yet it is these forms that are needed for the nutrition of most plants and ani-mals. At the same time, nitrogen is one of the most abun-dant elements, making up 78% of the Earth’s atmosphere in the form of di-nitrogen gas (N2). This N2 is, however, extremely stable and is not useable by most plants and animals. A distinction can therefore be drawn between unreactive N2 gas and the multiplicity of reactive nitro-gen (Nr) compounds that are more available biologically or play a role in the earth’s radiation balance. It is these same Nr compounds that also cause the different chemi-cal, physical and biological impacts on the environment (Galloway et al., 2003).
Only in the case of certain specialized bacteria, such as those in soils associated with the roots of particular le-gumes (Winogradsky, 1893; Hellriegel & Wilfarth, 1888), are biological systems able to use a part of the energy from photosynthesis to turn N2 into Nr compounds, a process known as biological nitrogen fixation (BNF). (See Box 1.1 for further definitions.)
While managing BNF as a means of enriching the soil thus represents more than 2000 years of human experi-ence, this has not been the only source of Nr nutrition in agriculture. With an increasing human population after the industrial revolution, and linked to the emerging sci-entific consensus of the role of nutrients for crop growth, there was a growing realization of the need for extra
Our Nutrient World_reflowed.indd 1 30/01/2013 10:26:28

2 global overview on nutrient management
nutrient sources (von Liebig, 1840; Boussingault, 1856; Lawes, 1861). Even with effective recycling of plant and animal manures, the contribution of legumes was con-cluded to be insufficient to meet increasing food needs.
The developing coal-based economy at that time pro-vided an additional source of ‘fossil nitrogen’ that could be used as fertilizer. The presence of Nr compounds in coal allowed the first large scale chemical fertilizer pro-duction, with ammonium sulphate produced as part of the coal tar industry (Clow and Clow 1952; Sutton et al., 2011a). Other fossil nitrogen sources included the mining
of Chile saltpetre (sodium nitrate) deposits, accumulated naturally from partial nitrate leaching over geological timescales. These mineral sources were supplemented by the harvesting of guano from Peruvian and other seabird colonies, rich in both N and P, where a lack of rain had again allowed a reserve to build up over millenia (Sutton et al., 2011a).
The additional Nr sources were not only needed for agriculture. The main explosives used for mining and in military conflict are Nr compounds, such as dynamite, nitro-glycerine and TNT (trinitrotoluene), which liberate
A
B
C
D
F
EE
Figure 1.1 Images of altered global nitrogen and phosphorus cycles. A. Electricity generation, releasing NOx to the air (Shutterstock.com); B. Motor vehicles, releasing NOx to the air (Chantal de Bruijne/Shutterstock.com); C. Food consumption associated with agricultural and waste losses of N and P (The food for one week of this US family is shown); D. Algal blooms associated with N and P pollution (An image from China prior to the Beijing Olympics 2008) http://daypic.ru/ekology/61520); E. Coastal ‘dead zones’, with lack of oxygen leading to fish kills as a result of N and P pollution (© daily news); F. Lack of adequate N and P through continued harvests with little nutrient replacement degrades agricultural land, reduces long term yields and can lead to land abandonment.
Our Nutrient World_reflowed.indd 2 30/01/2013 10:26:30

global overview on nutrient management 3
their stored energy on detonation as they convert back to unreactive N2 gas (Davis, 1941, 1943). Considering both these agricultural and military needs, the demands on BNF, manure recycling and fossil nitrogen deposits con-tinued to grow.
All these Nr sources turned out still to be insufficient. In his well-known presidential address to the British Association for the Advancement of Science in 1898, Sir William Crookes highlighted the emerging food security challenge (Crookes, 1898). The amounts of wheat needed to feed the population were steadily increasing, BNF was
considered insufficient, and the fossil nitrogen sources were becoming depleted. As he put it: ‘When we apply to the land nitrate of soda, sulphate of ammonia, or guano, we are drawing on the earth’s capital, and our drafts will not perpetually be honoured.’ Instead, there was another source we should be using: ‘The store of nitrogen in the at-mosphere is practically unlimited, but it is fixed and ren-dered assimilable by plants only by cosmic processes of extreme slowness. The nitrogen which with a light heart we liberate in a battleship broadside has taken millions of minute organisms patiently working for centuries to win
Box 1.1 Fertile words: definitions old and newWords like ‘fertile’, ‘fertilize’, ‘nutrient’ and ‘manure’ may seem very familiar, but they can often have specific mean-ings. The following explains how the words are used in this report.
Nutrient refers here to the elements needed to support plant and animal growth and develop-ment. The major nutrients or ‘macro-nutrients’, which are needed in greatest supply by plants are nitrogen (N), phosphorus (P) and potassium (K). Nutrients that are needed in only a small amount are called ‘micro-nutrients’; these include copper, zinc, molybdenum and many others. Elements like sulphur (S) are needed in larger supply than the micro-nutrients and are sometimes referred to as major nutrients.
Word Roots: The word nutrient comes from the Latin nutrire, which means ‘to suckle’. It is the same Latin root that allows us to be nourished with nutritious food.
Fertilize is taken here to mean ‘making fertile’, or more productive, in the sense of providing nu-trients to allow more plants and animals to grow and develop. It is potentially a confusing word, because of its other meaning, rarely used in this report, related to plant and animal reproduction. Land may be made more fertile by adding materials like manufactured fertilizers, animal manures, green manures and other organic inputs.
Word Roots: The word fertile comes from the Latin ferre, which means ‘to bear’, as in bearing fruit. Adding fertilizer makes agri-cultural land more productive. Deposition of Nr from the air can also increase soil fertility, but this can cause problems when the atmosphere ends up fertilizing non-agricultural land, freshwater and marine ecosystems.
Fertilizer here means ‘a substance that makes fertile’ because of its nutrient content. The word can cause confusion because both manures and manufactured compounds containing nutrients are used to make land more fertile. For many people, all man-made nutrient products are simply called fertilizers. To avoid misunderstand-ing, we therefore clarify as far as possible by referring to ‘manufactured’, ‘chemical’ or ‘mineral’ fertilizers, which all mean the same. The concepts of ‘mining nutrients’ and ‘mineral fertilizers’ apply to both P and N. In the case of Nr production, humans are ‘mining the atmosphere’.
Where humans depend on actually digging up Nr and P nutrient sources from the ground (such as the minerals apatite, saltpetre, coal and guano), we can refer to ‘fossil nitrogen’ and even a ‘fossil nutrient economy’: the Latin root of fossil simply means ‘dug up’.
Manure refers here to an organic (carbon-containing) nutrient source that can be applied to the land to grow crops and build soil quality. Specifically, we refer to recycled organic by-products, especially animal excreta (mix of feces, urine, and bedding materials) and human wastes (including sewage sludge or biosolids) either collected locally (e.g. ‘night-soil’) or produced at centralized sewage treatment facilities.
Agronomists often talk about increasing the ‘fertilizer equivalence value’ of organic manures, aiming to achieve the same efficiency of nutrient use as can be obtained from good practice when using mineral fertilizers. ‘Green manure’ refers to an organic input entirely based on plant material.
Word Roots: The word manure comes from the Middle English word manuren, meaning ‘to cultivate the land’. This word in turn originates from the Latin manuoperare, meaning ‘to work with the hands’.
Reactive Nitrogen (Nr) refers to all forms of N except for di-nitrogen gas (N2). The Earth’s atmo-sphere is made up of 78% N2: this gas is so stable that it is not usable by most organisms, which instead depend on small amounts of Nr entering the environment.
Our Nutrient World_reflowed.indd 3 30/01/2013 10:26:30

4 global overview on nutrient management
from the atmosphere.’ As he pointed out, the challenge was to find and develop new chemical processes which would convert N2 to Nr on an industrial scale.
Such processes were discovered and developed remark-ably quickly. In the arc process, N2 was oxidized to NOx, from which nitric acid (HNO3) was produced, by using an electric spark at high temperature, much in the same manner that NOx air pollution is formed inadvertently in the internal combustion engine. As a specific industrial process, however, it required very large amounts of energy per kg of Nr produced. It was therefore only cost effective with a cheap source of electricity, explaining the historical origins of a Norwegian hydroelectricity company (Norsk Hydro, now Yara) as a major fertilizer manufacturer. Another energy-intensive process using cyanamide was also operated for some years (Smil, 2001).
It was, however, the discovery in 1908 of a process to combine N2 and hydrogen (H2) directly, by Fritz Haber, which allowed the greatest reduction in energy costs, and was the basis for subsequent upscaling by the engi-neer Carl Bosch in the now famous Haber-Bosch process (Smil, 2001; Haber, 1920). In this process, combination of N2 with H2 (originally from coal gasification, and later from natural gas) allowed the large-scale production of NH3 that has since doubled total global circulation of Nr compounds (Galloway et al., 2008; Erisman et al., 2008; Fowler et al., 2013). The importance of the Haber-Bosch process cannot be emphasized enough: its application can be considered as the greatest single experiment in global geo-engineering ever made (Sutton et al., 2011a). By the 1930s, Haber-Bosch nitrogen exceeded the fossil nitrogen sources (Partington, 1925), with a massive expansion in global production after the 1950s.
Increased supply of Haber-Bosch nitrogen has allowed ready access to cheap Nr synthetic fertilizers, meeting and exceeding the food security needs of many parts of the world. This includes North America, Europe, and major parts of India, China and Latin America, where food and feed production rates have increased even faster than hu-man populations. This has permitted the development of both more-varied and richer diets, in particular with an increased fraction of meat and dairy products. The increased fertilizer supplies were effectively the founda-tion on which both the agricultural ‘green revolution’ and the ‘livestock revolution’ (see Chapter 2) were based, in-creasing high-volume, intensive production. These same increases in crop production have also allowed agricul-tural land to be set aside from food production, either as a means to avoid surplus production or, increasingly, for the growth of bioenergy and biofuel crops.
Emerging risksYet, while the food security concerns of Crookes have been more than fully addressed in many parts of the world, we have also inherited unforeseen consequenc-es. Each of the emissions of N2O, NOx and NH3 to air, and loss N and P compounds to water is a direct conse-quence of these changes, which have been exacerbated by
the parallel increase in NOx from fossil fuel combustion (Galloway et al., 2008; Sutton et al., 2011b; Bouwman et al., 2011; Fowler et al., 2013). The main components of this cascade of Nr forms are summarized in Figure 1.2, which also shows the major phosphorus flows.
By contrast to these regions rich in Nr, there are still major parts of the world where the original concerns of Crookes still apply. Across much of Africa and Latin America, as well in parts of Asia, there are still insufficient Nr supplies to meet our food needs. This limits dietary intake in some of the most poor countries of the world, while ongoing harvests remove more Nr from the soil than is added, drawing on the soil’s nitrogen capital. In these regions, there are major questions and challenges of how best to supply peoples’ nitrogen needs for achieving food security, and it becomes a contentious question to find the right balance between efforts to increase BNF and efforts to improve access to manufactured Nr fertilizers, considering all the socio-economic challenges, benefits and risks.
Crookes addressed nitrogen specifically because of the very high nitrogen needs of wheat, the main European food crop. But his points were also valid for phosphorus, potassium and many micronutrients in other crops. For each of these, annual harvests were drawing on the soil capital, and replacement nutrients would be needed.
In the case of phosphorus, there are only small amounts of P compounds in the air, and we therefore depend on re-cycled and mined sources. While global biogeochemical cycling of P has its special complexities, it is mainly con-cerned with this mobilization of P from geological depos-its, and then maintaining these in plant-available forms in agricultural soils, while, as far as possible, limiting P run-off to water bodies. The main P form available to plants is phosphate (PO43-), which is now largely supplied from fertilizers manufactured from mineral phosphate depos-its around the world. Water pollution problems related to phosphate have also been exacerbated by its use in deter-gents. At the same time, the increase in livestock numbers permitted by the ready availability of Haber-Bosch Nr, have led to substantial riverine inputs of P from manure run-off, which is typically even larger than from human sewage sources (Syers et al., 2011).
The central debate for phosphorus in recent years has been whether or not depletion of the world’s phosphate capital will provide a major risk to world food security in the 21st century (Cordell et al., 2009; Syers et al., 2011; van Vuuren et al., 2010; Scholz and Wellmer, 2013). This debate has focused on the magnitude and future acces-sibility of the mineral P reserves. Whether or not this risk is significant, society is faced with major threats. In the first scenario, insufficient P supplies would lead to higher food prices, with the food system vulnerable to shortages, especially in the light of the growing human population and growing per-capita demand for animal products. In the scenario that P reserves are not limiting, the continued relatively cheap price of P would provide only a weak motivation for many in wealthy countries
Our Nutrient World_reflowed.indd 4 30/01/2013 10:26:31

global overview on nutrient management 5
to avoid losses to the environment, with the result that freshwater and marine pollution problems become even worse, especially given the anticipated further increase in human and livestock populations. To these problems it should be added that, just as with nitrogen, there are still many parts of the world that already suffer from insufficient access to P fertilizer sources, limiting food production and compromising food security, such as in much of sub-Saharan Africa.
A brief comment should be added about potassium (or kalium, K) and the diverse range of micronutrients es-sential for plant growth. The word potassium originates from ‘potash’ – the ash left under the cooking pot after burning wood. Traditionally, wood ash was washed to extract the soluble potassium salts. Such practices point to a traditional recycling of K sources from biomass, al-though today (as with phosphorus), most of the K used in global agriculture derives from mined sources (Chapter 2). Unlike N and P, however, K does not lead to major pollution concerns. Potassium is not typically limiting in either freshwater or marine ecosystems, and is only a minor fraction of atmospheric particulate matter levels. Similarly, there has recently been less attention to future K supply given the availability of substantial mineral K reserves (although see Chapter 2; Scholz and Wellmer, 2013), while in regions like Africa limited availability
of N and P has been raised as a more pressing concern (Vitousek et al., 2009).
Plant and animal nutrition does, however, depend on a balanced nutrient supply, and this includes essential but small contributions from a wide range of trace elements, such as sulphur, zinc, molybdenum, iron, copper, sele-nium etc. Shortage of these elements is also relevant to the N and P cycles, as it can also limit the efficiency with which these other major nutrients are used.
Bringing together these different issues represents a major societal challenge that has hardly begun. At the hub are the biogeochemical cycles of key elements, such as N and P, which are needed for food and energy security, but also pollute our environment. It is obvious that there is a degree of coupling between the supply of N, P and other nutrients, especially as this links to food security.
However, there are also major differences between the issues relevant for N and P. Nitrogen represents an espe-cially complex challenge because of the way in which it ‘cascades’ between different Nr forms, such as NH3, NOx, NO3-, N2O, organic nitrogen, leading to a plethora of dif-ferent effects in the environment (Galloway et al., 2003). These include threats to water pollution, air quality, green-house gas balance and climate, ecosystems and biodiver-sity and soil quality (Sutton et al., 2011b). Scientific work linking between these different threats, and between these
Nitrogen oxides(NOx)
Nitrous Oxide(N2O)
Ammonia(NH3)
Nitrate leaching (NO3-),
Phosphorus run-off (PO43-)
plus Sewage N & P
Further Nr emissionas NOx & N2O
carrying on the cascade
Natural ecosystems
Ammonium nitrate in rain (NH4NO3)
High temperaturecombustion& industry
Livestock farmingManure
Eventual denitrification
of Nr to N2Terrestrial Eutrophication
Freshwater Eutrophication
Greenhouse gas balance
Particulate Matter
Tropospheric ozone formation
Stratospheric ozone loss
Soil acidification
Urban air quality
Marine Eutrophication
Fertilizermanufacture
Crops for animal feed,human food & energy
Crop biological nitrogen fixation
Unreactivedi-nitrogenin air (N2)
N2→Nr
N & P in streams, lakes & coastal seas
Fertilizermanufacture
Manufactured detergents &
other products
Unintended N & P flows
Environmental concern
Intended N & P flows
Key
Consumptionby humans
Food & materials
Mineral phosphate
(PO4)
Figure 1.2 Simplified overview of nitrogen (N) and phosphorus (P) flows highlighting major present-day anthropogenic sources, the cascade of reactive nitrogen (Nr) forms and the associated environmental concerns (modified here from Sutton et al., 2011b).
Our Nutrient World_reflowed.indd 5 30/01/2013 10:26:32

6 global overview on nutrient management
and the benefits of Nr use has typically been separated into different communities. This has limited the extent of holistic perspectives and the extent to which key synergies and antagonisms between policies have been addressed. Although there is a common need to improve N and P supply to nutrient-limited regions, overall, the issues for N are rather different to P; the latter focus on the future scale and accessibility of P reserves and the consequences of inefficient P use for water pollution.
Purpose of this documentThe purpose of this report is to provide a global overview of these issues, especially for nitrogen and phosphorus. As such, it provides a step in what needs to be a longer-term process of scientific integration and stakeholder en-gagement, as the basis for developing better policies and management practices from factories and the farmer’s field to the world’s oceans and atmosphere. As this is an area that is already rich in scientific studies, our focus is to see how the different parts fit together in relation to hu-man decision making. In particular, we address the nature and scope of current nutrient-related policies, and the ex-tent to which these are delivering the changes needed. A clear message emerges that current policies and practices do not go as far as they should if major threats are to be avoided (Oenema et al., 2011). We therefore reflect on the package of actions that could be taken, while considering the barriers to change.
The bottom line is that nutrients matter. They are criti-cal to world food security and their inadequate manage-ment is leading to land degradation, loss of biodiversity, climate change and adverse impacts on human health. There are major inequalities between regions, some with too much and others with too little nutrients. Whichever way we look at it, ‘Our Nutrient World’ presents a major scientific, social and political challenge: to produce more food and energy for a growing world population, while simultaneously reducing the pollution threats on environ-ment, climate and human health.
ReferencesAsh H.B. (1941) Rei Rusticae/On Agriculture by L.J.M.
Columella (Latin edition with an English translation), Vol. 1. Loeb Classical Library, Harvard University Press. (See Chapter II.5, 10-14; pp 137, 157-195.)
Boussingault J.B. (1856) Recherches sur la végétation. Troisième mémoire: de l’action du salpêtre sur le développe-ment des plantes. Annals. chim. phys. 46, 5-41.
Bouwman L. Goldewijk K.K., Van Der Hoek K.W., Beusen A.H.W., Van Vuuren D.P., Willems J., Rufino M.C. , Stehfest E. (2011) Exploring global changes in nitrogen and phos-phorus cycles in agriculture induced by livestock produc-tion over the 1900–2050 period. PNAS. www.pnas.org/cgi/doi/10.1073/pnas.1012878108
Clow A. & Clow N.L. (1952) The Chemical Revolution. A Contribution to Social Technology. Reprinted 1970. Books for Libraries Press, Freeport, New York.
Cordell D., Drangert J.O. & White S. (2009) The story of phos-phorus: Global food security and food for thought. Global Environmental Change 19, 292-305.
Crookes W. (1898) British Association for the Advancement of Science. Bristol 1898. Inaugural address of the president. Chemical News 78, 125-139.
Davis T.L (1941, 1943) The chemistry of powder and explosives. (2 vols.) Wiley, New York; Chapman & Hall, London.
Erisman J.W., Sutton M.A., Galloway J.N., Klimont Z. & Winiwarter W. (2008) How a century of ammonia synthesis changed the world. Nature Geoscience 1, 636-639,
Fowler D., Coyle M., Skiba U., Sutton M.A., Cape J.N., Reis S., Sheppard L.J., Jenkins A., Galloway J.N., Vitousek P., Leech A., Bouwman A.F., Butterbach-Bahl K., Dentener F., Stevenson D., Amann M. and Voss M. (2013) The global nitrogen cycle in the 21st century. Phil. Trans. Roy. Soc., Ser. B. (under review).
Galloway J.N., Townsend A.R., Erisman J.W., Bekunda M., Cai
Z., Freney J.R., Martinelli L.A., Seitzinger S.P. & Sutton M.A. (2008) Transformation of the Nitrogen Cycle: Recent Trends, Questions and Potential Solutions. Science, 320, 889-892.
Galloway J.N., Aber J.D., Erisman J.W., Seitzinger S.P., Howarth R.W., Cowling E.B. & Cosby B.J. (2003) The nitrogen cas-cade. Bioscience 53, 341-356.
Haber F. (1920) The synthesis of ammonia from its elements. Nobel Lecture (1920), available at www.nobelprize.org/no-bel_prizes/chemistry/laureates/1918/haber-lecture.pdf.
Hellriegel H. & Wilfarth H. (1888) Untersuchungen über die Stickstoffernahrung der Gramineen und Leguminosen. Beilageheft zu der Z. Verein. Rubenzucker-Ind. dtsch. Reichs.
IPCC (2007) Climate Change 2007: Synthesis Report. Contribution of Working Groups I, II and III to the Fourth Assessment Report of the Intergovernmental Panel on Climate Change [Core Writing Team, Pachauri, R.K and Reisinger, A. (eds.)]. IPCC, Geneva, Switzerland, 104 pp.
Lawes J.B., Gilbert J. & Pugh E. (1861) On the sources of nitrogen of vegetation; with special reference to the question whether plants assimilate free or uncombined nitrogen. Phil. Trans. Royal Soc. 151, 431-578.
Oenema O., Bleeker A., Braathen N.A., Budňáková M., Bull K., Čermák P., Geupel M., Hicks K., Hoft R., Kozlova N., Leip A., Spranger T., Valli L., Velthof G. & Winiwarter W. (2011) Nitrogen in current European policies. Chapter 4 in: The European Nitrogen Assessment (Eds. Sutton M.A., Howard C.M., Erisman J.W., Billen G., Bleeker A., Grennfelt P., van Grinsven H. & Grizzetti B.), pp. 62-81, Cambridge University Press.
Partington J.R. (1925) Textbook of inorganic chemistry (2nd Edition), MacMillan, London.
Scholz R. & Wellmer F.W. (2013) Approaching a dynamic view on the availability of mineral resources: what we may learn from the case of phosphorus? Global Environmental Change.–Human and Policy Dimensions (in press).
Smil V. (2001) Enriching the Earth: Fritz Haber, Carl Bosch, and the Transformation of World Food Production. MIT Press, Cambridge, MA.
Steinfeld H., Gerber P., Wassenaar T., Castel V., Rosales M. & de Haan C. (2006) Livestock’s Long Shadow. Environmental Issues and Options. UN Food and Agriculture Organization, Rome.
Our Nutrient World_reflowed.indd 6 30/01/2013 10:26:32

global overview on nutrient management 7
Sutton M.A., Howard C., Erisman J.W., Billen G., Bleeker A., Grennfelt P., van Grinsven H. & Grizzetti B. (2011a) Assessing our nitrogen inheritance. Chapter 1, in: The European Nitrogen Assessment (Eds. Sutton M.A., Howard C.M., Erisman J.W., Billen G., Bleeker A., Grennfelt P., van Grinsven H. & Grizzetti B.) pp 1-6, Cambridge University Press.
Sutton M.A., Billen G., Bleeker A., Erisman J.W., Grennfelt P., van Grinsven H., Grizzetti B., Howard C.M., and Leip A. (2011b) Technical Summary. In: The European Nitrogen Assessment (Eds. Sutton M.A., Howard C.M., Erisman J.W., Billen G., Bleeker A., Grennfelt P., van Grinsven H. and Grizzetti B.) pp xxxv-li, Cambridge University Press.
Syers K., Bekunda M., Cordell D., Corman J., Johnston J., Rosemarin A., Salcedo A. and Lougheed T. (2011) Phosphorus and food production. In: UNEP Yearbook 2011. pp 34-45. UNEP, Nairobi.
van Vuuren D.P., Bouwman A.F. & Beusen A.F. (2010) Phosphorus demand for the 1970-2100 period: A sce-nario analysis of resource depletion. Global Environmental Change–Human and Policy Dimensions 20, 428-439.
van Vuuren D.P., Bouwman A.F. & Beusen A.H.W. (2010) Phosphorus demand for the 1970-2100 period: A sce-nario analysis of resource depletion. Global Environmental Change–Human and Policy Dimensions 20, 428-439.
Vitousek P.M., Naylor R., Crews T., David M.B., Drinkwater L.E., Holland E., Johnes P.J., Katzenberger J., Martinelli L.A., Matson P.A., Nziguheba G., Ojima D., Palm C.A., Robertson G.P., Sanchez P.A., Townsend A.R. & Zhang F.S. (2009) Nutrient im-balances in agricultural development. Science 324, 1519-1520.
von Liebig J. (1840) Chemistry in its application to agriculture and physiology. (trans.) London.
Winogradsky S. (1893) Sur l’assimilation de l’azote de l’atmosphère par les microbes. Comptes rendus 116, 1385.
Our Nutrient World_reflowed.indd 7 30/01/2013 10:26:33

8 global overview on nutrient management
2 Trends in nutrient supply, their benefits and future availability Nutrients feed the world, but with inequalities and future risks
2.1 From food shortage to livestock revolutionIn considering the transition from pre-industrial to in-dustrial society, it is worth reflecting on the benefits and risks associated with increased nutrient use. As outlined in Chapter 1, the major change has been the shift from a predominant reliance on recycled and renewable nutri-ent pools (such as manures and sewage) to mined sourc-es, bringing previously unavailable nutrients into global
circulation. For phosphorus, potassium and trace nutri-ents, these represent actual mines, extracting geological deposits. Nitrogen represents a special case, where humans are effectively mining the atmosphere, applying tools such as nitrogen fixing crops and the Haber-Bosch process to bring previously unavailable N2 into circulation as Nr.
Although humans have been altering these nutri-ent cycles for millennia, the new feature is the increas-ing reliance on such mined sources, coupled to a massive
Summary 7 The world needs nutrients, especially nitrogen (N) and phosphorus (P), which are essential to raise crops and
animals to feed an increasing world population. It has been estimated that mineral fertilizer is essential to feed around half of the world’s population, and will be fundamental to ensure global food security over the 21st century.
7 Natural nutrient sources and recycling have been supplemented with additional fertilizer to support increas-ing human consumption since the 19th century. The 18th-19th century agricultural and industrial revolutions laid the foundation for exploitation of mined sources of N and P, and for development of the Haber-Bosch process, where energy is used to convert unreactive atmospheric di-nitrogen (N2) into reactive nitrogen (Nr) compounds.
7 Approximately 2% of world energy use is dedicated specifically to the industrial manufacture of Nr, mainly through the Haber-Bosch process, so that Nr prices are closely coupled to global energy prices.
7 Major inequalities exist between those parts of the world with too much nutrients and those that do not have enough. The key regions mobilizing excess nutrients include North America, Europe, and parts of South and South East Asia and Latin America. In Africa, Latin America and parts of Asia there are wide regions with too little nutrients to meet crop demand and food security needs.
7 The 20th century ‘green revolution’ has depended critically on these additional nutrient sources, while becom-ing the basis for an ongoing ‘livestock revolution’, where relatively cheap grain and other produce (which is surplus to regional food requirements) is allowing intensification of livestock farming, greatly increasing per-capita meat and dairy production.
7 While recent trends in nutrient consumption are relatively stable in developed countries, growing human population and per capita meat/dairy consumption are causing a rapid increase in nutrient consumption in developing countries. It is anticipated that these countries may account for ¾ of global nutrient consumption by 2050, contributing to a further increase in global nutrient production of 40% to 50%.
7 Phosphorus is still obtained from mining of finite deposits rich in phosphate, with current major world sup-plies coming from just a few key countries, posing potential risks for future supply.
7 The possibility of P shortage in the future represents a major issue of recent contention (Chapter 2). Global supply security of P is a prerequisite for food security. While only 3 countries produce 66% of rock phosphate, many countries do not have the physical reserves or economic means to obtain them.
7 There are few countries whose known reserves cover current P demand for a long period (e.g. Morocco, Algeria > 1000 years based on current use and reserve estimates), others for a shorter time (USA, China, Brazil: 50 years), while other countries have no notable reserves (e.g. Germany, Japan).
7 Whether there are accessible global P reserves to feed humanity for decades or centuries, long-term access to P is a critical issue that calls for more efficient practices and consumption patterns that waste less nutrients.
7 The risk of future shortage of potassium, and of zinc and other essential micronutrients needs to be further in-vestigated, especially as only 20 years of zinc reserve are currently identified (roughly maintaining this number since the 1980s, as new reserves have been identified).
Our Nutrient World_reflowed.indd 8 30/01/2013 10:26:33

9global overview on nutrient management
increase in the rates of extraction. Two stages of major change can be distinguished, which together represent a major revolution in nutrient use by humans.
Stage 1 of the Nutrient Revolution: Technological FoundationsThe first stage of change can be considered as being as-sociated with the industrial and agricultural revolutions from the late 18th century. In this case, the development of machinery and the utilization of power from coal, boosted agricultural and industrial productivity. The re-sulting rapid rise in human population and standard of living has increased total and per-person consumption of Nr- and P-containing products, feeding back to a larger demand for fossil N and P sources such as coal, Chile salt-petre and Peruvian guano. For example, before the col-lapse of the Peruvian guano industry shortly after 1870, guano exports reached 0.1 million tonnes (Mt = Tg) of N annually, while ammonium sulphate production and salt-petre exports each reached 0.3 Mt of N by 1915 (Clark & Sherman, 1946; Hollett, 2008; Smil, 2001).
As the agricultural and industrial revolutions were at first limited to Europe and North America, their im-pact on global nutrient cycles was initially rather mod-est. Among the first indicators was the local depletion of guano deposits. At this stage, manure recycling still domi-nated the main nutrient inputs in European farming. For example, it has been estimated that by 1900, manure con-tributed 6 Mt per year, crop biological nitrogen fixation (BNF) 4 Mt and manufactured fertilizers only 0.2 Mt to European agricultural soils (Sutton et al., 2011). Globally, the dominance of manure was even larger, accounting for an estimated 33 Mt, compared with less than half of this (14 Mt) from BNF (Bouwman et al., 2011).
Stage 2 of the Nutrient Revolution: Global ExtensionThe scene had nevertheless been set for increased impacts at a global scale, as the spread of the agricultural and in-dustrial revolutions across the world allowed the human population to grow, requiring even more nutrient resourc-es. Changes through the later 19th century and the first half of the 20th century, including development of the Haber-Bosch process, thus laid the foundation for the second major stage of change with the ‘green revolution’ from the 1950s.
This is the point at which production of Nr and P miner-al fertilizers increased rapidly on a global scale. The changes were much larger than previously, firstly because of the near global nature of the green revolution, especially through the introduction of high yielding wheat and rice varieties. In addition, technologies had advanced sufficiently to allow massive scaling up of access to nutrients, as required by the new varieties, both through application of the Haber-Bosch process and through the use of Nr-containing explosives and mechanization to allow nutrient mining on a huge scale. Between 1950 and 2000, estimated mineral fertilizer N use increased from 4 to 83 Mt per year, while P fertilizer use increased from 3 to 14 Mt. This massive change can be illustrated by the changing ratio of new Nr coming from
agricultural BNF to that from mineral fertilizers, which de-creased from 14:1 in 1900 to 6:1 in 1950, and to 0.5:1 by 2000 (Bouwman et al., 2011).
Just as the 18th century revolution included feedbacks between different aspects – such as the interplay between the agricultural and industrial revolutions – so there are also several consequences of the 20th century green revo-lution. Perhaps the most significant of these for nutrient cycling is what might be called the ‘livestock revolution’. This started in developed countries in the 1960s, but is still rapidly progressing on the global scale. The livestock revolution can be considered as representing the shift from traditional land-based livestock practices to the use of intensively-fertilized grass and grain production to feed large numbers of livestock in confined feeding operations. This has allowed a very rapid increase in livestock num-bers and in the human consumption of animal products (both total and per capita) linked to much cheaper meat and dairy products.
The livestock revolution can be considered as an indi-cator of great success in one of the central objectives of the green revolution: to increase crop production. The nu-trient inputs coupled with new crop varieties meant that grain and grass production increased even faster than the original needs of human consumption. This allowed an increasingly large amount of the extra produce to be used as animal feeds instead of human food, thereby support-ing rapid growth in the livestock sector.
Trends in nutrient production and consumptionThese changes are illustrated globally for nitrogen in Figure 2.1, where Erisman et al., have estimated the fea-sible influence of Haber-Bosch nitrogen on the global hu-man population. In the absence of Haber-Bosch nitrogen, only limited increases in agricultural productivity would have been possible and depended only on the estimated impact of technical measures to improve nitrogen use ef-ficiency. The increasing dependence of the human popu-lation on Haber-Bosch nitrogen is clear, especially after 1950. At the same time, this figure illustrates how nitrogen inputs have increased per hectare, while allowing a near doubling of per capita meat consumption since records of the UN Food and Agriculture Organization (FAO) started shortly after 1960. Figure 2.1 shows that around half the world population is now alive because of the increased supply of reactive nitrogen. Although such an estimate is necessarily approximate, it highlights the massive impact that N has had in meeting human food needs, thereby al-lowing the world population to expand rapidly while si-multaneously increasing per capita consumption.
The overall trends in global mineral N and P fertilizer consumption, including future projections to 2050 are shown in Figure 2.2. In both cases, a rapid increase can be seen since 1960: a nine-fold increase for N and a three-fold increase for P.
The future scenarios shown in Figure 2.2 should be taken as indicative of possible changes, and will depend on popu-lation expansion, human diets (including the proportion of
Our Nutrient World_reflowed.indd 9 30/01/2013 10:26:33

10 global overview on nutrient management
animal products), the possible expansion of biofuels, and the extent to which more efficient agricultural practices can be developed (Chapter 8). Similarly, the major increase in livestock numbers supported will propagate into larger availability of manure. As of 2000, annual manure use (92 Mt N) is already estimated to have increased by a factor of 3 since 1900, and is projected to increase by a further 50% (range: 40%-65% depending on the scenario) by 2050. Whichever way these issues are considered, it will be ex-tremely challenging for the world of 2050 to avoid substan-tial further increases in nutrient mobilization compared with the present (Bouwman et al., 2011).
It is worth noting that both Figures 2.1 and 2.2 show substantial short-term fluctuations in the overall trend of increasing Nr and P fertilizer use. In particular, there was a reduction in global consumption of manufactured fertil-izers after 1990. As can be seen from Figure 2.3, this was particularly related to the structural changes in the coun-tries of Eastern Europe after 1989. Rates of nutrient use in these countries are now only slowly increasing, and
Figure 2.1 Changes in world human population as compared with estimated changes in the absence of Haber-Bosch nitrogen, showing parallel changes in average mineral fertilizer input and per capita meat production (Erisman et al., 2008).
Regional fertilizer consumption
Global product production
Average productconsumption
Figure 2.2 Trends in global consumption of mineral fertilizer nitrogen and phosphorus (FAO, 2012) and projected possible futures, illustrating ranges from recently published scenarios. The amounts of N and P consumption in 2050 will depend on present-day decisions. Basis of projections for 2050: N mid: Davidson (2012); N high: Bodirsky et al. (2012) interpolated between their 2040 and 2100 estimates; N low: Bouwman et al. (2011); P mid: Bouwman et al. (2011); P high: Tenkorang and Lowenberg-DeBoer (2008) extrapolated from their 2030 estimate; P low: Sattari et al. (2012).
Figure 2.3 Time course in total mineral fertilizer consumption distinguishing different world regions (sum of nitrogen, phosphorus and potassium expressed as N, P2O5 and K2O, respectively) in comparison with global cereal and meat production, and per capita meat consumption (Original graphic derived from FAO data).
Our Nutrient World_reflowed.indd 10 30/01/2013 10:26:35

11global overview on nutrient management
projected to increase further in the short term (FAO, 2012). For developed countries, the highest mineral fertilizer in-puts occurred during the 1980s, with a reduction through the 1990s related to efficiency improvements, while the amounts have been relatively stable in the last decade.
A specific dip in 2008 was related to the increase in world energy price, which directly affected Nr prices, pro-duction and consumption rates. Although this is only a small feature compared with the overall global increase, it has provided important lessons related to the need to improve nutrient use efficiency (Chapter 8).
By far the largest contribution to the overall global in-crease in nutrient consumption is that originating from
developing countries. This can be seen by considering a major change in the main consumer regions over the past 30 years. In 1980, developed countries (including transi-tion economies) consumed around 70% of the global total. By 2010, the situation had reversed, with the developing economies consuming 70%. The bulk of the anticipated increase up to 2050 is also anticipated to be used in devel-oping countries. In the case of a global increase of 50% in use by developing economies up to 2050, these countries would become responsible for over 75% of world nutrient consumption.
The substantial differences in rates of nutrient con-sumption between world regions are shown even more
Figure 2.4 Total annual fertilizer consumption for different world regions, expressed per hectare of arable land (sum of nitrogen, phosphorus and potassium as kg N + P2O5 + K2O). IFDC Graphic derived from FAO data.
Figure 2.5 Trends in global intake of animal protein intake illustrating the regional differences (from PBL Netherlands Environmental Assessment Agency). The global prognosis for 2030 represents an increase of 44% in total protein consumption, due to a combination of population growth and increased per capita consumption (Westhoek et al., 2011).
Our Nutrient World_reflowed.indd 11 30/01/2013 10:26:36

12 global overview on nutrient management
clearly in Figure 2.4, which expresses the total input of mineral fertilizers per hectare of arable land. While rates have decreased by about 20% in developed countries since 1990, substantial increases are seen in Latin America, South Asia and especially East Asia. The contrast be-tween Sub-Saharan Africa, with annual inputs around 10 kg per hectare, and East Asia, with inputs at over 400 kg per hectare for 2010/11, highlights graphically the con-trast between areas of too little and too much N, P and K.
The importance of food choice in driving these changes can be illustrated by Figure 2.5, which shows estimated changes in the amounts of protein consumption projected to occur between 1970 and 2030. There are major regional differences reflecting richer diets in North America and Europe, although it can be seen that China and India have been fast catching up, with substantial further increases in per capita animal protein consumption estimated for 2030, as these countries increasingly aim towards western pat-terns of consumption. Considering both population growth and increasing per capita consumption, between 2007 and 2030 a 30% increase in global protein consumption can be expected. If the entire world population consumed the North American diet of 2007, this would result in a 320% increase in global consumption of animal protein. While such increases may represent a benefit for many citizens in the developing world, it represents a major challenge for global nutrient supply and losses as pollution.
One of the central problems to be faced is that increas-ing nutrient inputs to agriculture tends to greatly reduce nutrient use efficiency (NUE). This term is defined here
as the percentage of input N that reaches the intend-ed product, for nitrogen (NUEN) and for phosphorus (NUEP). The changes over time are illustrated in Figure 2.6, which compares the increase in mineral fertilizer use for rice crops in India with the crop NUEN and Partial Factor Productivity for nitrogen (PFPN), which is the ratio of harvested grain mass to the amount of N fertil-izer applied. From 1966 to 2008, through the period of the Green Revolution to near present, mineral fertilizer N use increased by more than a factor of 15, while PFPN decreased by around a factor of 6 and NUEN reduced by 60%. The reduction in NUEN, which in this case was also associated with imbalanced nutrient supply, means that a much larger fraction of the N applied is released to the en-vironment, as a combination of denitrification to N2 and N2O, volatilization of NH3 and leaching of nitrates and other Nr forms. While the green revolution has helped feed humans, it has thus substantially reduced NUE in much of the world, while greatly increasing pollution of the environment. It is important to point out that increas-ing mineral fertilizer or manure inputs in areas with too little N is essential for increasing cereal yields from 1 to 3 or more tonne per ha; in these situations the challenge is still to achieve high NUE with small N losses.
This pattern is even more strongly emphasized by the livestock revolution, with rapidly increasing livestock numbers and consumption of livestock products. By in-creasing the fraction of livestock in the food chain, overall nutrient use efficiency has decreased substantially, lead-ing to a further increase in pollution losses (Chapter 3).
0
1
2
3
4
5
6
7
0
10
20
30
40
50
60
70
80
90
100
1966 1968 1970 1972 1974 1976 1978 1980 1982 1984 1986 1988 1990 1992 1994 1996 1998 2000 2002 2004 2006 2008 2010
Fertilizer
use
in rice (in
Mt)
PFP N
(in k
g grain/kg
N)
NU
E N(in
%)
PFP-N
NUE-N
Fert. N
Figure 2.6 The case of N-use in rice in India: changes in partial factor productivity (PFPN, kg grain/kg N mineral fertilizer applied) and nitrogen use efficiency (NUEN, kg N in grain/ kg N mineral fertilizer applied) in comparison with the trend of N fertilizer application to rice. The figure shows how intensification of N inputs has substantially reduced PFPN and NUEN (Original graphic based on Adhya et al., 2010).
Our Nutrient World_reflowed.indd 12 30/01/2013 10:26:36

13global overview on nutrient management
2.2 Reactive nitrogen production from combustion sourcesAlthough the main global sources of terrestrial Nr are fertilizer manufacture and biological nitrogen fixation, a substantial additional amount of new Nr also enters the environment inadvertently through nitrogen oxide (NOx) emissions from combustion sources. Compared with global nitrogen fixation by the Haber-Bosch process at around 120 Mtonnes (Tg) annually, and agricultural biological nitrogen fixation of 33 Mtonnes, nitrogen ox-ides emissions add a further 40 Mtonnes (based on 2010; Fowler et al., 2013). Although the main focus of attention for these sources is their adverse effects on the environ-ment (Chapter 4), they do provide some benefits in the form of an additional fertilizer source, of which some use may be made in agriculture.
The problem with NOx as a useful Nr source is that these emissions are emitted directly to the air, so that only part of the atmospheric deposition is captured by agricul-tural land and production forests where the inputs can be used effectively. Similarly, much of the atmospheric Nr de-position from NOx occurs during seasons when it is not needed for plant growth, as well as to natural ecosystems where it can disrupt ecosystem functioning, encouraging Nr losses. The result is that the agricultural nitrogen use efficiency of NOx emissions is anticipated to be low com-pared with use of mineral fertilizers and organic manures.
Further analysis and technology development are needed to investigate how to improve the efficiency of N use produce by combustion processes as NOx (i.e. the capture of NOx nitrogen for targeted use into intended products). This may require further investment to devel-op cost-effective Nitrogen Oxides Capture and Utilization (NCU) technologies (Chapter 6).
2.3 Constraints on present and future nutrient useChallenges for world regions with not enough nutrientsMajor nutrient inequalities exist between different parts of the world (MacDonald et al., 2011). While some areas contribute to global environmental problems as a result of too much nutrients, in other areas shortage of nutrient availability severely constrains agricultural productivity. These nutrient-limited regions include much of Africa, as well large areas of Latin America and South East Asia (IAC, 2004; Sanchez, 2002; Stoorvogel et al., 1993). The low levels of available N, P and other nutrients limit food production and are a major cause of malnutrition in these areas. Moreover, the shortage of N, P and other nutrients in these regions leads to depletion of soil nutrient stocks, posing risks of land degradation, as discussed further in Chapter 4.
The central challenge for areas with too little nutrients is to improve access to affordable nutrient sources, while
maximizing the efficiency with which available nutri-ent pools are used. This points to the need for improved infrastructure and other measures to improve access to nutrients for agricultural areas often distant from fertil-izer production and distribution points. Input subsidies may also be considered as part of such a package of ac-tions (Denning et al., 2009). At the same time, efforts are needed to understand and manage the risks for long-term sustainability, considering the synergies between manure recycling, biological nitrogen fixation and imported min-eral fertilizer sources (Vanlauwe et al., 2011).
The question of how to increase nutrient supply in nutrient limited areas such as sub-Saharan Africa has proved to be highly contentious. Some have highlighted the risks of using mineral fertilizers, suggesting that these can have adverse effects on farmer economies by requir-ing a high-cost outlay, while leading to a reduced utiliza-tion of existing manure resources (NGO Working Group on Food & Hunger at the United Nations, 2011). For ex-ample, the suggestion to reduce synthetic fertilizer use has been made by the International Agricultural Assessment: ‘agroecosystems of even the poorest societies have the potential through ecological agriculture and integrated pest management to meet or significantly exceed yields produced by conventional methods, reduce the demand for land conversion for agriculture, restore ecosystem ser-vices (particularly water), reduce the use of and need for synthetic fertilizers derived from fossil fuels, and the use of harsh insecticides and herbicides’ (Heinemann et al., 2009).
Others have emphasized the view that sole dependence on local manure stocks and BNF is insufficient if farmers are to produce sufficient produce to feed growing popula-tions and break out of a cycle of poverty (Sanchez, 2010). In fact, all agree that the best use needs to be made of BNF and manure recycling. The central question is there-fore the extent to which manufactured Nr and P fertilizers should be an essential part of regional nutrient strate-gies in these countries. This issue is addressed further in Chapters 6 to 8.
The risk of future phosphorus shortageA further question that has been the subject of recent con-tention is whether there is a major risk to world food se-curity as a result of depletion of mined phosphate sources (e.g., Syers et al., 2011). Most global agricultural produc-tion depends on mined phosphate supplies. If these sup-plies were to become unavailable, global food production would decrease, leading to a major global food threat. It is therefore a key issue to assess the risk that phosphate reserves become substantially depleted or otherwise inaccessible.
The extent of the possible phosphorus risk has been particularly highlighted by Cordell et al. (2009). They identified a parallel between ‘peak oil’ and ‘peak phospho-rus’, with the risk that phosphate reserves become large-ly exhausted during the 21st century. This is illustrated by Figure 2.7, where Cordell et al. supposed a Gaussian
Our Nutrient World_reflowed.indd 13 30/01/2013 10:26:37

14 global overview on nutrient management
distribution of phosphate availability. According to their model, peak phosphorus supply would be estimated to occur around 2030, with subsequent decline to one third of this by 2100. If the future projection of Figure 2.7 were agreed to be realistic, then addressing future phosphorus supply should become one of the most urgent priorities for the future sustainability of humanity.
In fact, the analysis of Cordell et al. shown in Figure 2.7, has been strongly criticised, in that it substantially over-estimates the urgency of the phosphorus supply risk. Subsequent analyses by van Kauwenbergh (2010) and Scholz and Wellmer (2013) have emphasized how mineral reserves are a dynamically varying term, which are to a large extent demand driven, as market drivers lead to the development of further accessible reserves. Phosphorus is a clear example of this, as shown by the time trend of global reserves estimated by the US Geological Survey (USGS) since 1988 (Scholz and Wellmer, 2013; U.S. Geological Survey, 2012a). In this case, a substantial in-crease in reserves has been estimated since 2010. The current estimates of the USGS suggest that, rather than an estimated life-time of existing reserves of around 100 years, presently identified reserves would last around 370 years at current rates of exploitation (Figure 2.8). For the purpose of this graph, the estimated reserves expressed in years, is simply the ratio of currently estimated global reserves to the current annual mine production.
In this context, it is relevant to distinguish the terms used. The term ‘reserve’ represents the currently eco-nomic and accessible fraction of the total resources. By contrast, the term ‘resources’ refers to total estimated amounts, that are in-principle feasible for extraction ac-cording to current technology and concentrations. In the case of phosphate rock, world resources are estimated at 300 billion tons (U.S. Geological Survey, 2012a), approxi-mately 4 times the estimated reserves. Subject to future economics and accessibility, at present rates of produc-tion, the currently estimated global phosphate resource would have an estimated lifetime of around 1500 years. Further exploration in future, combined with improved and more cost-effective technologies, would be expected to increase both the estimated reserves and resources.
It is also important to consider phosphorus within the context of other mineral reserves. This is illustrated in Figure 2.9, which compares the global reserves of 17 different commodities, based on current rates of mine production, as estimated by the USGS in 2002/03 and 2010. The first point to note is that the estimates fluctu-ate between years, with both increases and decreases over the period shown. As with phosphorus, the estimated reserves of tantalum, silver and platinum group have all increased substantially, associated with the market fluctu-ations (more demand leading to increase in the identified reserve) as well as improved estimates. By contrast, the re-serve estimates of magnesium and cobalt (also important micronutrients for plant and animal nutrition) have de-creased substantially between the two years, either as a re-sult of improved estimates or market fluctuations. When
compared with these other commodities, it is clear that currently estimated phosphorus reserves (at 370 years) are projected to be available for a much longer duration. By comparison, currently estimated reserves of gold, anti-mony, crude oil and natural gas have a shorter lifetime (12 to 65 years) than phosphorus. However, as noted above, in all cases the reserve estimates, which respond dynami-cally to market drivers, need also to be related to the total estimated resources.
Relating phosphorus to risks for potash, zinc and other micronutrients In regards of plant nutrition, it is worth highlighting that the micronutrient zinc has only 20 years of identified re-serves currently estimated to available (Figure 2.9), being only 6% of the duration of estimated phosphate reserves. This highlights the need to further evaluate zinc reserves. Nevertheless, it should be noted that, while zinc produc-tion has increased from 7.2 Mt in 1900 to 12.4 Mt in 2011, the identified reserves have also increased in approximate proportion. This means that the lifetime of the estimated reserves has hardly changed, with a value of 20 years in 1990, and mean value since then of 21.5±2.8 years (1 stan-dard deviation) (including estimates from Jolly, 1991). Agriculture uses only approximately 2% of the total zinc production (the main uses being rubber and chemi-cal manufacture), with a wide range of other uses. For these reasons, it is anticipated that further reserves may be identified or become economical as future require-ments for zinc production continue to increase. Global zinc resources are currently estimated at 1900 Mt (U.S. Geological Survey, 2012b), equivalent to a total lifetime of 150 years, at present rates, subject to future economics and accessibility.
It is also worth noting that available potash (potas-sium) reserves are now estimated as being less than es-timated in 2002/03. At current rates of mine production (U.S. Geological Survey, 2012c), the identified reserves would have an estimated lifetime of 257 years, which is
0
5
10
15
20
25
30
35
1900 1920 1940 1960 1980 2000 2020 2040 2060 2080 2100
Phos
phor
us p
rodu
ction
(MT
P/yr
)
ActualModelled
Figure 2.7 Indicative ‘peak phosphorus’ curve based on Cordell et al. (2009). This figure is presented so that the reader can follow the nature of the ‘phosphorus debate’ of recent years. Current analysis does not support the model estimates shown in this graph, with estimated P reserves and resources being considered to be much larger and longer lasting (for details see main text).
Our Nutrient World_reflowed.indd 14 30/01/2013 10:26:37

15global overview on nutrient management
substantially less than the currently estimated lifetime of the identified phosphate reserves. However, it must be noted that global potash resources are estimated at 250 billion tonnes (U.S. Geological Survey, 2012c), equivalent to a lifetime of around 7000 years at current rates, should these resources be accessible and economically extract-able in the future.
In assessing the risks associated with future nutrient shortages it is also important to consider whether there are alternatives. In the case of crude oil and natural gas, while
these are of central importance to world economy, they are not the ultimate product needed by society. Where the main actual requirement is energy, renewable and other sources are currently being further developed. Similarly, where synthetic carbon-based products are the require-ment, these may also be further developed through coal and renewable biomass-based sources.
However, the nutrients P, K and Zn are essential bio-logical requirements; there are therefore no alternatives. In the case of future limited availability, the only option is to develop more-effective recycling of existing nutrient pools, such as with manures, or to improve access to existing soil stocks. This particularly applies to P, which rapidly be-comes less soluble in soils through geochemical processes (‘P sorption’) and is only remobilized for crop use at a slow rate. Given the lack of alternative sources, these therefore represent significant risks for future food security over tim-escales of decades (Zn) and centuries (P and K).
Risks associated with the distribution of phosphate and potash reservesAdditional risks for P and K may be associated with the distribution of the available reserves and their future ac-cessibility. As shown in Table 2.1, there are few countries
whose known reserves cover current P demand for a long period (e.g. Morocco, Algeria > 1000 years), others for a shorter time (USA, China, Brazil: 50 years) (Scholz and Wellmer, 2013; U.S. Geological Survey, 2012a), while other countries have no notable reserves (e.g. Germany, Japan). Long-term food security therefore depends on maintaining trade access to a small number of countries, such as Morocco, Iraq, China and Algeria, which hold the largest known reserves. In the case of potash, the main reserves are distributed across an even smaller number of countries, with 80% currently identified reserves be-ing in Canada and Russia. These regional differences may provide a motivation to develop additional new supplies from a wider diversity different locations. More detailed analyses in relation to phosphorus and other elements, in-cluding the concept of ‘criticality’ in relation to the inter-national distribution of reserves, are described by Scholz and Wellmer (2013) and Scholz et al. (2013).
While these timescales may seem like a long time relative to a human life span, P, K, Zn and other mineral resources are finite. Running out of economically extract-able reserves for these essential nutrients would be devas-tating for humans in future centuries. This would require them to obtain all their needs for these nutrients from re-trieving and recycling them from the dispersed deposits now accumulating in soils and sediments from our cur-rent uses.
0
50
100
150
200
250
300
350
400
0
50
100
150
200
250
300
1988 1993 1998 2003 2008
Estim
ated
res
earv
es (y
ears
)*
Ann
ual m
ine
prod
uctio
n (M
t)
annual mine productionannual mine production (excl. Morocco)estimated reservesestimated reserves (excl. Morocco)
Figure 2.8 Time course of global annual mine production of phosphate rock and estimated reserves at current rates of mine production, also showing the estimates without including Morocco. Based on Scholz and Wellmer (Scholz & Wellmer, 2013), from the series of USGS reports (e.g., U.S. Geological Survey, 2012a). The estimated reserves without Morocco are shown based on current total global production, assuming that this is market driven. * Calculated as the ratio of global estimated reserve to annual mine production.
10
100
1000
2000
Estim
ated
res
erve
s (y
ears
)*
Rare Earths
Magnesium
Phosphate
Platinum group
Potash
Tantallum
Hard coal
Titanium
Cobalt
Natural Gas
Nickel
Crude Oil
Silver
Zinc
Tin
Gold
Antimony
2006 2011
Figure 2.9 Putting phosphorus and potassium (potash) reserves into context: Changes in estimated reserves of different commodities as estimated in 2002/2003 and 2010 (Based on Scholz & Wellmer, 2013; U.S. Geological Survey, 2012a; U.S. Geological Survey, 2012c). * Ratio of estimated reserve to annual mine production.
Our Nutrient World_reflowed.indd 15 30/01/2013 10:26:37

16 global overview on nutrient management
Whether there are accessible global P, K and Zn re-serves to feed humanity for decades or centuries, long-term access to these nutrients is a critical issue that calls for more efficient practices and consumption patterns that waste less nutrients.
Future risks to reactive nitrogen availabilityIt is also essential to consider the implications of re-source scarcity on future Nr availability. In principle, the amount of N2 in the atmosphere is so large that it pro-vides a virtually unlimited reserve from which to manu-facture Nr. With approximately 3.9 ×10⁹ Mtonnes N in the
atmosphere, and current rates of the Haber-Bosch process at 120 Mtonnes per year, it would take around 800,000 years to reduce atmospheric N2 levels by 1%, from 78% to 77% if none was denitrified back to N2 during this time. By comparison, it has been estimated that total Chile saltpetre resources amount to 220-900 Mtonnes (Lamer, 1957), equivalent to 35-150 Mtonnes as N. If this were the only source to meet current rates of N mineral fertilizer use, the salpetre resource would be fully depleted within 3-15 months.
A much more pressing limitation is the high energy re-quirement of splitting the triple bond of the N2 molecule
Mine productionK2O (2011)
(Mtons)
Estimated Reserves
K2O(Mtons)
Estimated years of
K2O reserveat 2011 rates*
Mine productionP2O5 (2011)
(Mtons)
Estimated Reserves
P2O5(Mtons)
Estimated years of
P2O5 reserveat 2011 rates*
Algeria — — — 1.8 2,200 1222
Australia — — — 2.7 250 93
Belarus 5.5 750 136 — — —
Brazil 0.4 300 750 6.2 310 50
Canada 11.2 4,400 393 1.0 2 2
Chile 0.8 130 163 — — —
China 3.2 210 66 72.0 3,700 51
Germany 3.3 150 45 — — —
Egypt — — — 6.0 100 17
India — — — 1.3 6 5
Iraq — — — — 5,800 ??
Israel 2.0 40 20 3.2 180 56
Jordan 1.4 40 29 6.2 1,500 242
Mexico — — — 1.6 30 19
Morocco and Western Sahara
— — — 27.0 50,000 1852
Peru — — — 2.4 240 100
Russia 7.4 3,300 446 11.0 1,300 118
Senegal — — — 1.0 180 189
South Africa — — — 2.5 1,500 600
Spain 0.42 20 48 — — —
Syria — — — 3.1 1,800 581
Togo — — — 0.8 60 75
Tunisia — — — 5.0 100 20
United Kingdom
0.43 22 51 — — —
United States — — — 28.4 1,400 49
Other countries — 50 — 7.4 500 68
World total (rounded)
37.0 9,500 257 191.0 71,000 372
* Ratio of reserve to annual mine production
Table 2.1 Estimated reserves of potash (as K2O) and phosphate rock (as P2O5) based on current estimates. Note that estimated reserves are to a large extent market-driven, and are likely to increase if future markets expand (U.S. Geological Survey, 2012a; U.S. Geological Survey, 2012c).
Our Nutrient World_reflowed.indd 16 30/01/2013 10:26:38

17global overview on nutrient management
to form Nr compounds. At present, it is estimated that industrial N fixation uses around 2% of world energy supply. The sustainability of Nr industrial production is therefore closely linked to energy prices, as illustrated by the consequence of increased oil prices during 2008 on the prices of manufactured fertilizers. Technically, there is no requirement for fossil carbon sources to make in-dustrial Nr: the need is for energy that can also be pro-vided by other sources, including renewable or nuclear energy. However, as fossil fuel reserves begin to become less available, a smooth transition to such other sources will be needed if Nr manufacture is to continue meeting food demands.
In principle, future technologies may also be anticipat-ed that will allow cost-effective small-scale production of ammonia, which may also form part of a package to use ammonia as a chemical store to buffer intermittent sup-plies of electrical energy. With the potential availability of such small scale processes, it becomes feasible to envisage the integration of ammonia production and renewable energy generation, which could meet local needs for both fertilizer supply and energy storage (Section 6.6).
ReferencesAdhya T.K., Shukla A.K. & Panda, D. (2010) Nitrogen losses,
N-use efficiency and N management in rice and rice-based cropping system, 51p. In ING Bulletins on Regional Assessment of Reactive Nitrogen, Bulletin No. 10, (Ed. Bijay Singh), SCON-ING, New Delhi, pp i-iv & 1-51. See also FAI (2009) Fertilizer statistics 2008–09. Fertilizer Association of India, New Delhi.
Bodirsky B.L., Popp, A., Weindl, I, Dietrich, J.P., Rolinski, S., Scheiffele, L., Schmitz, C., Lotze-Campen, H. (2012) N2O emissions from the global agricultural nitrogen cycle–current state and future scenarios. Biogeosciences 9, 4169-4197.
Bouwman L., Goldewijk K.K., van der Hoek K.W., Beusen A.H.W., van Vuuren D.P. Willems J., Rufino M.C. & Stehfest E. (2011) Exploring global changes in nitrogen and phos-phorus cycles in agriculture induced by livestock production over the 1900–2050 period. Proc. Natl. Acad. Sci. US 109 (16), 6348-6353.
Clark K.G. & Sherman M.S. (1946) Pre-war world production and consumption of plant foods in fertilizers. Misc. Pub. 593, United States Department of Agriculture, Washington DC.
Cordell D., Drangert J.O. and White S. (2009) The story of phosphorus: Global food security and food for thought. Global Environmental Change 19, 292-305.
Davidson E. (2012) Representative concentration pathways and mitigation scenarios for nitrous oxide. Environ. Res. Lett. 7, 024005.
Denning G., Kabambe P., Sanchez P., Malik A., Flor R., Harawa R., Nkhoma P., Zamba C., Banda C., Magombo C., Keating M., Wangila J., Sachs J. (2009) Input Subsidies to Improve Smallholder Maize Productivity in Malawi: Toward an African Green Revolution. PLoS Biol 7:e1000023. DOI: 10.1371/journal.pbio.1000023.
Erisman J.W., Sutton M.A., Galloway J.N., Klimont Z. and Winiwarter W. (2008) How a century of ammonia synthesis changed the world. Nature Geoscience 1, 636-639.
FAO (2012) Database on Fertilizer consumption, Crops and Meat production and consumption. United Nations Food and Agriculture Organization. Data obtained via: http://faostat.fao.org.
Fowler D., Coyle M., Skiba U., Sutton M.A., Cape J.N., Reis S., Sheppard L.J., Jenkins A., Galloway J.N., Vitousek P., Leech A., Bouwman A.F., Butterbach-Bahl K., Dentener F., Stevenson D., Amann M. & Voss M. (2013) The global nitrogen cycle in the 21st century. Phil. Trans. Roy. Soc., Ser. B. (under review).
Heinemann J., Abate T., Hilbeck A. & Murray D. (2009) Biotechnology. p 43. In: Agriculture at a Crossroads. International Assessment of Agricultural Knowledge, Science and Technology for Development. Synthesis Report. (Eds. McIntyre B.D., Herren H.R., Wakhungu J. & Watson R.T.). Island Press, Washington DC.
Hollett D. (2008) More precious than gold: The story of the Peruvian guano trade. Associated University Presses, Cranbury, New Jersey.
IAC (2004) Realizing the Promise and Potential for African Agriculture InterAcademy Council, Amsterdam.
Jolly, J.H. (1991) Zinc, pp 1709-1743 in: Mineral yearbook 1991. (Volume 1). US Bureau of Mines. http://uwdc.library.wisc.edu/collections/EcoNatRes
Lamer M. (1957) The world fertilizer economy. Food Research Institute, Stanford University.
MacDonald G.K., Bennett E.M., Potter P.A., Ramankutty N. (2011) Agronomic phosphorus imbalances across the world’s croplands. Proc. Natl. Acad. Sci. US 108, 3086-3091.
NGO Working Group on Food & Hunger at the United Nations. Policy Statement to the UN General Assembly – September 2011. http://www.globalpolicy.org/images/pdfs/NGO_UN_Food_Statement.pdf
Sanchez P.A. (2002) Soil Fertility and Hunger in Africa. Science 295, 2019-2020.
Sanchez P.A. (2010) Tripling crop yields in tropical Africa. Nature Geoscience 3, 299-300.
Sattari S.Z., Bouwman A.F., Giller K.E. & Van Ittersum M.K. (2012) Residual soil phosphorus as the missing piece in the global phosphorus crisis puzzle PNAS 109, 6348-6353.
Scholz R. and Wellmer F.W. (2013) Approaching a dynamic view on the availability of mineral resources: what we may learn from the case of phosphorus? Global Environmental Change.–Human and Policy Dimensions (in press).
Scholz R.W., Roy A.H., Brand F.S., Hellums D.T., & Ulrich A. E. (2013). (Eds.) Sustainable phosphorus management: a global transdisciplinary roadmap. Berlin: Springer.
Smil V. (2001) Enriching the earth. MIT Press, Cambridge, Massachusetts.
Stoorvogel J.J., Smaling E.M.A. & Janssen B.H. (1993) Calculating soil nutrient balances in Africa at different scales I. Supra-national scale. Fertilizer Research 35, 227-235.
Sutton M.A., Billen G., Bleeker A., Erisman J.W., Grennfelt P., van Grinsven H., Grizzetti B., Howard C.M., and Leip A. (2011) Technical Summary. In: The European Nitrogen Assessment (Eds. Sutton M.A., Howard C.M., Erisman J.W., Billen G., Bleeker A., Grennfelt P., van Grinsven H. and Grizzetti B.) pp xxxv-li, Cambridge University Press.
Syers K., Bekunda M., Cordell D., Corman J., Johnston J., Rosemarin A., Salcedo A. & Lougheed T. (2011) Phosphorus and food production. In: UNEP Yearbook 2011. pp 34-45. UNEP, Nairobi.
Our Nutrient World_reflowed.indd 17 30/01/2013 10:26:38

18 global overview on nutrient management
Tenkorang F. & Lowenberg-De Boer J. (2009) Forecasting long term global fertilizer demands. Nutrient Cycling in Agroecosystems 83, pp 233-247.
U.S. Geological Survey (2012a). Mineral Commodity Summaries 2012, Phosphate Rock, pp 118-119. See also Appendix B, pp 192-195 for definitions of reserve, resource and related terms. see http://minerals.usgs.gov/minerals/pubs/commodity/phosphate_rock/
U.S. Geological Survey (2012b). Mineral Commodity Summaries 2012, Zinc, pp 188-189.
U.S. Geological Survey (2012c). Mineral Commodity Summaries 2012, Potash, pp 122-123.
Van Kauwenbergh S.J. (2010) World phosphate reserves and resources. IFDC. Muscle Shoals, AL. USA.
Vanlauwe B., Kihara J., Chivenge P., Pypers P., Coe R. & Six J. (2011) Agronomic use efficiency of N fertilizer in maize-based systems in sub-Saharan Africa within the context of integrated soil fertility management. Plant and Soil 339, 35-50.
Westhoek H., Rood T., Berg M.v.d., Janse J., Nijdam D., Reudink M.A., Stehfest E. (2011) The protein puzzle : the consumption and production of meat, dairy and fish in the European Union. PBL, The Hague / Bilthoven.
Our Nutrient World_reflowed.indd 18 30/01/2013 10:26:38

19global overview on nutrient management
3 Global nitrogen and phosphorus pollution A growing pollution web requiring urgent action
In this chapter we provide an overview on the present fluxes and levels of global nitrogen (N) and phosphorus (P) pollution. First we describe the fluxes in the global N and P cycles and then we discuss the current trends and some scenarios for future, underlining the key uncertain-ties and challenges. The effects of N and P enrichment in the environment are then consider in Chapter 4.
3.1 Global nitrogen and phosphorus cyclesWhen introduced into the environment reactive nitrogen (Nr) and phosphorus (P) can contribute to a number of environmental concerns, including water eutrophica-tion, air pollution, soil degradation, climate change and biodiversity loss (Fig.1.2 Chapter 1, Chapter 4). Since the 1960s, with the ‘nutrient revolution’ and the ‘livestock revolution’, the human use of synthetic nitrogen fertiliser has increased 9 fold globally and the use of phosphorus has tripled (Chapter 2). This consistent addition of Nr and
P by anthropogenic sources has altered the natural bio-geochemical cycle of these elements to such an extent that is difficult to quantify all of the consequences and result-ing interactions (Vitousek et al. 1997; Sutton et al., 2011a; van Vuuren et al. 2010).
In this section we describe the global N and P bio-geochemical cycles at the present time (year 2000-2010) quantifying the nutrient fluxes on the basis of recent stud-ies published in the literature. A diagram summarising all the fluxes is provided for N (Figure 3.1) and P (Figure 3.2), together with an accompanying table reporting the references for each flux (Table 3.1 and Table 3.2 for N and P respectively).
When assessing the global nutrient cycles two issues need to be taken into account. First, discrepancies among different studies exist in the quantification of nutrient fluxes due to several reasons. The biogeochemical cycles are complex and generally studies address only part of the cycle, focusing on some processes. Data at global scale are scarce, and except for the information that can be
SummaryThere are major problems associated with high levels of nutrient use, especially in Europe, North America, South and East Asia and Latin America.
7 The consistent addition of reactive nitrogen (Nr) and phosphorus (P) by anthropogenic sources has altered the natural biogeochemical cycles of these elements. Human activities have increased N emissions to the atmosphere and the N and P emissions to soils and waters (ground waters, rivers, and coastal waters). In addition, they have altered the natural balance between carbon, nitrogen, phosphorus and silica, especially in coastal waters.
7 The efficiency of nutrient use is very low: considering the full chain, on average over 80% of N and 25-75% of P consumed (where not temporarily stored in agricultural soils) end up lost to the environment. This wastes the energy used to obtain these nutrients, while causing pollution through emissions of the greenhouse gas nitrous oxide (N2O) and ammonia (NH3) to the atmosphere, plus losses of nitrates (NO3-), phosphate and organic N and P compounds to water.
7 The inclusion of livestock in the food chain substantially reduces overall nutrient use efficiency, leading to large pollution releases to the environment and requiring more N and P to sustain the human population than would be required by plant-based foods. Globally, the 80% of N and P in crop and grass harvests that feeds livestock ends up providing only around 20% (15-35%) of the N and P in human diets, which emphasizes these inefficiencies.
7 Burning fossil fuels produces a significant additional Nr resource (~20% of human Nr production) that could be captured and used, but which is currently wasted as emissions of nitrogen oxide (NOx) to air, contributing to particulate matter and ground-level (tropospheric) ozone that adversely affect human health, ecosystems and food production systems.
7 Since the 1960s, human use of synthetic N fertilizers has increased 9 fold globally, while P use has tripled. Further substantial increase of around 40-50% is expected over the next 50 years in order to feed the growing world popu-lation and because of current trends in dietary lifestyle, increasing consumption of animal products.
7 These changes are expected to increase N and P emissions to the environment, especially NH3 and N2O emis-sions to the atmosphere and N and P losses to fresh and coastal waters, exacerbating current environmental problems unless urgent action is taken to improve the efficiency of N and P use, and to re-evaluate societal ambitions for future per capita consumption patterns.
7 The consequences of not taking action include further warming effects from increasing atmospheric N2O, with other Nr and P forms leading to continuing deterioration of fresh water and coastal seas, air and soil quality, shortening human life, while threatening ecosystem services and biodiversity.
Our Nutrient World_reflowed.indd 19 30/01/2013 10:26:38

20 global overview on nutrient management
gathered by satellite images or global models, data cover-age is not homogeneous across the globe. Strong regional differences exist in terms of environmental conditions, climate, and anthropogenic pressures. Methodological approaches differ from study to study and might as well contribute to the discrepancies in the quantification of nutrient fluxes. All these aspects explain the differences in detail in the estimates for some fluxes, highlighting the need to recognize inherent uncertainty in the quantifica-tion of the fluxes.
The second issue is the influence of human activity on the natural cycling of N and P. Humans have created addi-tional fluxes (‘intended fluxes’), such as the fixation of N2 by synthetic fertilizers to produce more food, and boosted some natural fluxes (‘perturbed fluxes’), for example by increasing rates of biological nitrogen fixation, producing a general alteration of the natural, pre-anthropogenic, N and P cycles. At the same time, some additional fluxes, mainly harmful for human and ecosystem health have been produced (‘unintended fluxes’), such as the emis-sions of nitrogen oxides (NOx) from the combustion of fossil fuels. As a result, intended and unintended fluxes have been added to the natural ones, although most of the unintended fluxes are essentially natural fluxes that have been perturbed at different degree by the anthropogenic activity. In Figure 3.1 and Figure 3.2 the typology of fluxes are indicated by different colours to show the impact of the human activity on the nutrient cycle.
Global nitrogen cycleThe current nitrogen biogeochemical cycle is strongly af-fected by the agricultural system (Figure 3.1 and Table 3.1 for references). This is based on estimates for around the years 2000-2010. Globally humans introduce 120 Tg N per year of new N as synthetic fertiliser to sustain crop and grass production and as feedstock for many industrial processes (Galloway et al., 2008), in addition to 50-70 Tg N which is fixed biologically by the agricultural system (Herridge et al., 2008). Only 20-30% of the N originally introduced in agricultural soils ends up in food for hu-man consumption as cereals, vegetables and fruits, while the rest is used to sustain the livestock production (Billen et al., 2013). Similarly, only a small fraction of N input to the livestock system is then consumed by humans as meat, whereas a large part is lost or recycled by agricultural soils (Billen et al., 2013). Losses are represented mainly by am-monia (NH3) emissions from agricultural and livestock production systems (37 Tg N per year, Sutton et al., 2013), soil denitrification (25 Tg N, Billen et al., 2013), and N leaching and runoff (95 Tg N, Billen et al., 2013). Humans contribute to the loss of N in the environment also by food waste, which according to the FAO statistics repre-sents one third of the food produced globally (Gustavsson et al., 2011), and by sewage discharges, that are only par-tially treated. As a result, unintended emissions of N to soils, fresh waters and the atmosphere are produced.
Fresh waters receive around 39-95 Tg N per year from agricultural soils (Bouwman et al., 2011; Billen et al.,
2013). Part of this remains in superficial aquifers, part is lost to the atmosphere by denitrification, contributing to the emission of the strong greenhouse gas nitrous oxide (N2O), and part is discharged to coastal waters (40-66 Tg N per year, Voss et al., 2011; Seitzinger et al., 2005), where it fosters local water eutrophication and hypoxia.
Nitrogen fluxes within oceans are only partially known at global scale as many of the processes involved depend on microbial organisms and on the availability of the other nutrients, i.e. carbon (C), phosphorus (P) and silica (Si). However, it is clear that human activities have increased N inputs from rivers and atmospheric deposition, while they have altered the stoichiometry of C, N, P and Si, especially in coastal waters (Voss et al., 2013). Globally, ocean N fixation is estimated to be 140 Tg N per year (Deutsch et al., 2007), deposition 30-67 Tg N (Fowler et al., 2013; Duce et al., 2008) and deni-trification around 100-250 Tg N (Voss et al., 2013), con-tributing to the emission of 5.5 Tg N as N2O (Duce et al., 2008). Fish landing represents only 4 Tg N per year (Maranger et al., 2008).
The effects of human activity on the emissions of N in the atmosphere are much studied. Combustion is respon-sible of the emission of 30-40 Tg N per year as NOx (Fowler et al., 2013; Van Vuuren et al., 2011a), which is about five times the NOx naturally produced in the atmosphere by lightening (Fowler et al., 2013; Levy et al., 1996; Tie et al., 2002). Burning fossil fuels produces a significant addi-tional Nr resource (~20% of human Nr production) that could be captured and used, but which is currently wasted as emissions of nitrogen oxide (NOx) to air, contributing to particulate matter and ground-level (tropospheric) ozone that adversely affect human health, ecosystems and food production systems. Ammonia emissions from ag-ricultural systems are 37 Tg N per year with a further 15 Tg N from biomass burning, industrial and various waste sources, as compared to the 13 Tg N per year from natural systems and oceans, with a total annual emission of 65 Tg N (Sutton et al., 2013). Finally, N wet and dry deposition is also influenced by N emissions and is estimated to be around 70 Tg N on terrestrial ecosystems and 30 Tg N on oceans annually (Fowler et al., 2013).
In commenting on the major features of the global nitrogen cycle it is worth to note that, of 180 Tg N in-put through a combination of manufactured fertilizers and biological nitrogen fixation annually, only 28 Tg is available in food human consumption (i.e. 16%), with only 19 Tg (i.e. 11%) actually consumed, given levels of food waste prior to consumption. These startling esti-mates emphasize the inefficiency of the global system. A further 4 Tg N annually are consumed from the marine fish catch, though further work is required to put this in perspective with the contribution of aquaculture to global N fluxes.
It is relevant to compare the global budget with the sim-ilar one established by the European Nitrogen Assessment (Sutton et al., 2011b). In that study, 85% of the N from crop and grass production was consumed by livestock,
Our Nutrient World_reflowed.indd 20 30/01/2013 10:26:38

21global overview on nutrient management
with only 15% available for direct human consumption. According to Figure 3.1, the global fraction consumed by livestock is similar at 82% consumed by livestock, with 18% estimated to be available for direct consumption by humans. This emphasizes how, like the European cycle, the global nitrogen cycle is also dominated by humanity’s use of Nr to raise livestock.
Globally, a smaller fraction of the Nr in food comes from livestock than in Europe. In Europe, 53% of do-mestic Nr in food comes from livestock, while the global estimate (excluding marine fish) is only 27%. The ap-parent inconsistency with the previous figures relates to a lower estimated nutrient use efficiency for nitrogen (NUEN) for livestock on the global scale. For this pur-pose we here estimate several NUE terms, each of which is defined as the fraction of the input N that reaches the products at the scales defined. According to Figure 3.1, livestock NUEN indicates that only 6% of the Nr con-sumed by livestock globally reaches human food (prior to food waste), as compared with 19% in the European estimates. Such differences are reflected in the regional variation in full-chain NUE estimated in Chapter 8 and the Appendix of this report. Globally, 43% of the direct
Nr inputs to agricultural soils (manufactured fertilizer, biological N fixation, atmospheric deposition and here including livestock manure) reach harvests and biomass production for consumption (feed+food), according to the estimates in Figure 3.1, with the matching crop NUEN figure for Europe being 58%. These values are much higher than the global and European values given above for NUEN for animal production, emphasizing the critical role of livestock in the low overall values NUEN along the agri-food chain.
If we consider all sources of anthropogenic Nr produc-tion, including NOx emissions, fertilizer manufacture and agricultural biological nitrogen fixation (excluding natu-ral and marine fixation), then this amounts to 227 Tg N per year. This may be compared with 19 Tg N that is ac-tually consumed by people (accounting for food waste). Overall, this provides a full-chain NUEN from all anthro-pogenic sources of Nr at 8%, emphasizing the necessity for, and the huge potential of, different options to improve the efficiency of Nr use (Chapter 6)
Finally, it is worth to note that a substantial fraction (44%) of the Nr emitted to the atmosphere as NOx and NH3 (113 Tg N per year) is estimated to be recycled back
Atmospheric N2 pool
humannutrit.
390(36)
450-600 (37)
openocean
coastalocean
Fresh waters rivers
40-66(16)
burial
22 (35)
N2fixation
denitri-fication
25 (19)
agriculturalsoils
(semi)-naturalsoils
crop N2fixation
synthfertilizers
depo-sition
com-bustion
4 (11)
fishcatch
denitri-fication
5.5 (32)
N2O
NH3
100-250(33)
140(34)
N2O
NOx
95 (18)
10(21)
nat N2fix
58(24)
NH3emiss.
depo-sition
30(30)
22 (9)
120(1)
60(2)
70(29)
40(28)
7(23) 37 (8)
13(14)
6 (15)
leachleach
World, around 2000-2010, fluxes in TgN/yr
19(13)
6 (10)
waste
13(22)
NO
52(20)
Ocean
live-stock
Terrestrialecosystem
NH310 (27)
light-ning
crop & grassprod.
NH3
NH3emiss.
9 (31)
15(6)
22(7)
5 (25)
5 (26)
NH3emiss.
biomasburning
soils+wildanimals
120 (17)
13 (12)122(3)
100(4)
57(5)
19 (39) 50 (38)
Atmospheric NH3, NOx, N2O
Figure 3.1 Global nitrogen cycle around years 2000-2010. The arrows show the nitrogen fluxes across environmental pools and compartments (green: natural fluxes, blue: intended fluxes, orange: unintended fluxes or substantially perturbed fluxes, more explanation is provided in the text). The figures in black indicate the nitrogen fluxes in Tg N per year and the figures within brackets are the legend and refer to the accompanying table including the references for each flux (see Table 3.1). (The diagram is based mainly on the values reported by Fowler et al., 2013; Billen et al. 2013; Voss et al., 2013; and Sutton et al., 2013; and the references cited therein. Note that not all figures add exactly, due to the use of different data sources).
Our Nutrient World_reflowed.indd 21 30/01/2013 10:26:38

22 global overview on nutrient management
Legend Global Nitrogen Fluxes Tg N/yr References Cited reference and/or additional references
1 Fertiliser consumption 120 Fowler et al. (2013) Galloway et al. (2008), Bouwman et al. (2011)
2 N2 crop fixation 50-70 Fowler et al. (2013) Herridge et al. (2008)3 Crops & grass production 122 Billen et al. (2013) 4 Crops & grass for livestock production 100 Billen et al. (2013)5 N back to agricultural soils 57 Based on Billen et al. (2013) &
Sutton et al. (2013)6 NH3 emissions–agricultural system–from
crops & grass15 Sutton et al. (2013)
7 NH3 emissions–agricultural system–from livestock
22 Sutton et al. (2013)
8 NH3 emissions–agricultural system (total) 37 Sutton et al. (2013)9 Crops for human nutrition 22 Billen et al. (2013)
10 Livestock for human nutrition 6 Billen et al. (2013)11 Fish landing 3.7 Voss et al. (2013) Maranger et al. (2008)12 Food waste 13 Billen et al. (2013)13 Human excretion 19 Billen et al. (2013)14 Waste water treatment 13 Billen et al. (2013)15 Sewage 6 Billen et al. (2013)16 Riverine input to oceans 40-66 Voss et al. (2013) Voss et al. (2011) & Seitzinger et al.
(2005)17 Surplus in agricultural soils 120 Billen et al. (2013)18 Input from agricultural soils to aquifers and
rivers95 Billen et al. (2013)
19 Soil denitrification 25 Billen et al. (2013)20 Denitrification in aquatic systems 52 Billen et al. (2013)21 NO emissions from soils 10 Fowler et al. (2013)22 N2O emissions from soils 13 Fowler et al. (2013)23 Lightening 2-10 Fowler et al. (2013) Levy et al. (1996) & Tie et al. (2002)24 N2 natural fixation in terrestrial ecosystems 58 Fowler et al. (2013) Vitousek et al. (2013)25 NH3 emissions–biomas burning 5.5 Sutton et al. (2013)26 NH3 emissions–natural soils 4.9 Sutton et al. (2013)27 NH3 emissions–natural ecosystems 10.4 Sutton et al. (2013)28 Combustion 30-40 Fowler et al. (2013) Van Vuuren et al. (2011a)29 Wet and dry deposition on soils 70 Fowler et al. (2013) Dentener et al. (2006) & Duce et al.
(2008)30 Wet and dry deposition on oceans 30 Fowler et al. (2013) Dentener et al. (2006) & Duce et al.
(2008)31 NH3 emissions–oceans (and volcanoes) 8.6 Sutton et al. (2013)32 N2O emissions from the ocean 5.5 Voss et al. (2013) IPCC (2007) & Duce et al. (2008)33 Denitrification in oceans 100-250 Voss et al. (2013) Voss et al. (2011)34 N2 Fixation by oceans 140 Voss et al. (2013) Deutsch et al. (2007) & Duce et al.
(2008)35 Burial in oceans 22 Voss et al. (2013)36 Flux from coastal ocean to open ocean 390 Voss et al. (2013)37 Flux from open ocean to coastal ocean 450-600 Voss et al. (2013)38 Wet and dry deposition of NHx and NOy on
agricultural soils50 Based on Dentener et al. (2006) &
Duce et al. (2008)39 Wet and dry deposition of NHx and NOy on
natural soils19 Based on Dentener et al. (2006) &
Duce et al. (2008)
Table 3.1 Global nitrogen fluxes around year 2000-2010 reported in the literature. The Legend refers to the values reported in Figure 3.1.
Our Nutrient World_reflowed.indd 22 30/01/2013 10:26:39

23global overview on nutrient management
to agricultural cropland. While this provides a significant contribution to agricultural Nr inputs (22%) and produc-tivity, it must be recognized that direct fertilization at the right time is more efficient, while avoiding the multiplic-ity of adverse effects described in Chapter 4.
Global phosphorus cycleThe phosphorus biogeochemical cycle involves mainly terrestrial and aquatic ecosystems, while the interac-tions with the atmosphere are estimated to be small (Fig. 3.2 and Table 3.2). The estimates which follow are for around the years 2000-2010. The world’s annual rock phosphate mining in 2011 amounted to 191 Mt (Scholz and Wellmer, 2012), which corresponds to about 25 Tg P per year. Most of the P mined is added to agricultural soils as synthetic fertilisers (18 TgP for 2011, Heffer and Prud’Homme, 2012; and 14 Tg P in 2000, Bouwman et al., 2011), whereas a small quantity is used by indus-try especially for detergents and food additives. Once in agricultural soils, P moves through the agricultural and the livestock production system (Bouwman et al., 2009) and can build up in soils. Accumulation of P in
agricultural soils is estimated to be around 12 Tg P per year (Bouwman et al., 2009).
About 4-7 Tg P per year are embedded in food for hu-man consumption (estimates are based on FAO data and P average content in food items), part of which is lost with food waste (Gustavsson et al., 2011). Human excretion ac-counts for 3-5 Tg P annually (calculated from Van Drecht et al., 2009), and the quantity of P reaching the rivers by sewage systems is 1-3 Tg P, including detergents and re-duction by treatment where present (Van Drecht et al., 2009; Van Vuuren et al., 2010).
Weathering releases 15-20 Tg P per year (Bennett et al., 2001; and references herein) and annual soil erosion is estimated to be 15-26 Tg P (Quinton et al., 2010). A share of the P made available by weathering and erosion reach-es fresh waters by leaching and runoff (2-7 TgP per year, Bouwman et al., 2009, 2011; Van Vuuren et al., 2010). Once in surface continental waters, part of P is trapped in sediments in lakes and reservoirs and about 9 Tg P per year are delivered to coastal waters (Seitzinger et al., 2010; Beusen et al., 2005; Benitez-Nelson, 2000), where it can contribute to local eutrophication.
Atmosphere
openocean
coastalocean
Fresh waters
river delivery 9 (14)
burial
3-38 (22)
Atmoutput
(semi)-naturalsoils
0.2 (16)
fishcatch
0.6(11)
2-7 (8)
2.3-3.5 (18)
4.2(6)
1.3-3 (3)
erosion& leach
World, around 2000-2010, fluxes in TgP/yr
3-4.9(4)
waste
1.4(13)
Ocean
live-stock
Terrestrial ecosystem
crop & grassprod.
P in deterg.
erosionleaching
weathering
15-20(12)
0.6-2.4 (17)
0.5 (19)
humannutrit.
0.6 (5)
P dep.
Rockphosphatedeposits
agriculturalsoils
accumul.1-3 (15)
foodindustry
P mining25 (1)
synth.fertilizers
14-18(2)
16(7)
17(9)
23-26(20)
25(21)
accumul.12 (10)
Figure 3.2 Global phosphorus cycle around the years 2000-2010. The arrows show the phosphorus fluxes across environmental pools and compartments (green: natural fluxes, blue: intended fluxes, orange: unintended fluxes or substantially perturbed fluxes, more explanation is provided in the text). The figures in black indicate the phosphorus fluxes in Tg P per year and the figures within brackets are the legend and refer to the accompanying table including the references for each flux (see Table 3.2). Note that not all figures add exactly, due to the use of different data sources.
Our Nutrient World_reflowed.indd 23 30/01/2013 10:26:39

24 global overview on nutrient management
Studies on the P cycle in the ocean have addressed the quantification of P burial in sediments, which in geologi-cal timescales produces phosphate rocks. However, they mainly refer to pre-anthropogenic conditions (Slomp and Van Cappellen, 2007; Benitez-Nelson, 2000), while the effects of current P loads to coastal waters and nutrient circulation within the ocean have not been completely quantified. The available studies suggest that annual P burial in sediments could be between 3 and 38 Tg P (Slomp and Van Cappellen, 2007; Mackenzie et al., 2002; Benitez-Nelson, 2000).
Although the structure of the global P cycle is rather different to that for N, it is relevant to compare the two. With the main source of P being mined deposits, it can be seen that, of 25 Tg P mined annually, only 3-4.9 Tg is estimated to be consumed by humans (food waste not estimated here). This gives an estimated full-chain nutri-ent use efficiency for phosphorus (NUEP) of 12-20%. Of the rest, the major losses occur in the steps from mining to preparation of mineral fertilizer and other P products, and from mineral fertilizers to crop and livestock pro-duction. For crop NUEP, including inputs from both new mineral P fertilizers and recycled P in manures, Figure 3.1
implies an estimate of around 46-52%. This is similar to the value estimated above for Nr with crop NUEN at 43%. This value of crop NUEP should be seen in the context that there is also substantial net P accumulation in agri-cultural soils globally, representing the outcome of many areas with high levels of P accumulation, and other areas, such as sub-Saharan Africa with substantial P depletion.
It should, however, be noted that a much smaller fac-tion of the P in harvests is available for human consump-tion. Depending on the estimates used, only around 4% to 15% of the P consumed by livestock becomes available able for human consumption in livestock products. There is therefore substantial scope for improving the efficiency of P supply in the global system, especially considering reducing losses in mining and P supply, in crop produc-tion and in livestock production.
3.2 Trends and scenariosSince the 1960s, humans have drastically increased the use of synthetic nitrogen and phosphorus fertilisers (Chapter 2) altering the global cycle of the two elements. As a result, emissions to atmosphere and fresh and coastal waters have
Legend Global Phosphorus Fluxes Tg P/yr References1 Rock phosphate mining 25 Calculated from Scholz and Wellmer (2012) 2 Fertiliser consumption 14-18 Heffer and Prud’Homme (2012), Bouwman et al. (2011), Bouwman et al. (2009)3 Sewage 1.3-3 Van Vuuren et al. (2010), Van Drecht et al. (2009), Mackenzie et al. (2002)4 Human emissions 3-4.9 Calculated from Van Drecht et al. (2009), Cordell et al. (2009)5 Detergents 0.6 Calculated from Van Drecht et al. (2009)6 Waste water treatment 4.2 Calculated from Van Drecht et al. (2009)7 Harvest and grazing 16 Bouwman et al. (2009)8 Input to fresh waters 2-7 Bouwman et al. (2009), Van Vuuren et al. (2010), Bouwman et al. (2011)9 Input from manure 17 Bouwman et al., 2011; Bouwman et al. (2009)
10 Accumulation in soils 12 Bouwman et al., 2011; Bouwman et al. (2009), (see also Bennett et al. (2001) and references herein)
11 Deposition on ocean 0.6 Mahowald et al. (2008) (see also Kanakidou et al. (2012))12 Weathering 15-20 Bennett et al. (2001) and references herein13 Emission of atmospheric P 1.39 Mahowald et al. (2008) (see also Benitez-Nelson (2000), and references herein)14 Riverine input to oceans 9 Seitzinger et al. (2010), Beusen et al. (2005), (see also Mackenzie et al. (2002),
Bennett et al. (2001), Benitez-Nelson (2000), and references herein)15 Accumulation in fresh
waters1-3.1 Bennett et al. (2001) and references herein
16 P in food supply–Fish, Seafood
0.2 Estimated using FAOSTAT data
17 P in food supply–Meat, Milk and Eggs
0.6-2.4 Estimated using FAOSTAT data; Van Vuuren et al. (2010), Cordell et al. (2009)
18 P in food supply–Cereals, Fruits and Vegetables
2.3-3.5 Estimate using FAOSTAT data; Cordell et al. (2009) (see also Van Vuuren et al. (2010))
19 Added Food Phosphates 0.5 Estimated20 Flux from coastal ocean to
open ocean23-26 Calculated from Slomp and Van Cappellen (2007), Mackenzie et al. (2002)
21 Flux from open ocean to coastal ocean
25 Calculated from Slomp and Van Cappellen (2007)
22 Burial in ocean sediments 3-38 Calculated from Slomp and Van Cappellen (2007), Mackenzie et al. (2002), Benitez-Nelson (2000), and references herein
Table 3.2 Global phosphorus fluxes around year 2000-2010 reported in the literature. The Legend refers to the values reported in Figure 3.2. Some fluxes within the ocean refer to pre-anthropogenic values.
Our Nutrient World_reflowed.indd 24 30/01/2013 10:26:39

25global overview on nutrient management
increased, in addition to the alteration of nutrient pools in agricultural soils and water sediments. In the previous sec-tion we have provided an assessment of the current fluxes of nitrogen and phosphorus (Figure 3.1 and Figure 3.2); in this section we discuss the trends and some scenarios for the N emissions to the atmosphere and the associated N and P emissions to the water system, on the basis of the available global datasets and modelling activities.
Trends and scenarios for NOx and NH3 emissionsGlobal emissions of NOx and NH3 in the atmosphere have increased sharply in the second half of the 20th century (Figure 3.3, Lamarque et al., 2010). Between 1960 and 2000, global emissions more than doubled. This trend is expected to continue for NH3 emissions for the total pe-riod estimated (till 2050), while NOx emissions are pro-jected to decrease slightly by 2030 (about -5% compared to values of 2000) with the successful introduction of abatement devices.
As long as no more stringent emission reduction measures are taken beyond 2030, emissions will start to increase again to reach values similar to those of 2000 by 2050 (Figure 3.3, projections are based on the GAINS model, (Amann et al., 2011; IIASA, 2012a) for anthro-pogenic emissions supplemented by the RCP database (IIASA, 2012b) for global emissions of shipping, avia-tion, forest fires and savannah burning). In the case of NH3 it is also estimated that global climate change may increase emissions even more in the future, as these are mainly biogenic volatilization sources which are highly dependent on temperature. The climate feedback effect
has not been so far included in the RCP scenarios, though it has been estimated that it may increase global NH3 emissions by a further 42 (28-67)% by 2100 (Sutton et al., 2013).
Similar increasing trends of NOx emissions in the last de-cades are reported also by the EDGAR database (European Commission, 2011). With reference to this database, global NOx emissions have increased by approximately 50% in the period from 1970 to 2008 (European Commission, 2011). In the same period the world population has grown by about 82% (UN, 2012), suggesting a decoupling of popu-lation growth and NOx emissions (Figure 3.4). However, this global trend does not reveal regional differences in the development of emissions, which are relevant for project-ing into the future. In fact, stringent legislation and slow/no population growth has led to reductions of NOx emis-sions from the energy and transport sector predominantly in Europe, North America and most industrialised coun-tries (e.g. Japan, Korea). At the same time, growing energy demand for instance in China and India has produced sub-stantial increases in NOx emissions, due to the increase of coal fired power plants and because of the growth in car ownership and private transport in general.
Also in the case of NH3, the global trend of emis-sions masks regional differences. In fact NH3 emissions for the European Union are projected to decrease by 2% between 2010 and 2020, consistent with commitments in mitigation measures (Sutton et al., 2013), while in North America, India and China are expected a large increase in per capita production and consumption and a substantial increase in NH3 emissions (Reis et al., 2009).
Figure 3.3 Trends and future projections of global emissions of NOx (as NO2) and NH3. Based on data from 1850 to 2000 taken from Lamarque et al. (2010), with values from 2000 to 2050 based on the results of the EU FP7 project ECLIPSE, 2007-2013 modelling results, (version December 2012), which takes anthropogenic emissions from the GAINS model complemented for the sectors shipping, aviation, forest fires and savannah burning by global emission data from RCP 6.0 (Masui et al., 2011) as made available in the RCP database. The inconsistency at 2000 is due to the use of different published estimates for NH3. The projections shown illustrate feasible futures and do not include climate feedbacks, which are expected to increase NH3 emissions further (Sutton et al., 2013).
Our Nutrient World_reflowed.indd 25 30/01/2013 10:26:40

26 global overview on nutrient management
Trends and scenarios for N2O emissionsAtmospheric N2O has increased from pre-industrial con-centrations of 270 parts per billion (ppb) to 319 ppb in 2005, increasing linearly during the last few decades at a rate of about 0.26% per year (Forster et al., 2007). With an atmospheric lifetime of 114 years (Forster et al., 2007), the legacy of increasing N2O concentrations will remain long after mitigation strategies become effective. The dominant source of both anthropogenic and natural N2O is microbial production via nitrification and denitrification, which has been stimulated by the use of synthetic nitrogen fertilizers for food production, nitrogen fixation by crops, and pro-duction of manure from expanding livestock production (Mosier et al., 1998). The use of synthetic fertilizers is pro-jected to increase in response to growing human popula-tion, per-capita meat consumption, and crop-based biofuel production, which may accelerate the rate of increase of atmospheric N2O (Davidson, 2012; Reay et al., 2012).
Analysis of sources of anthropogenic N2O sources since 1860 demonstrated that emissions related to manure production in agriculture have been important through-out this period, whereas the mineral fertilizer, nylon, and transport sources became important only during the last half of the 20th century (Davidson, 2009). Based on esti-mates of growing demand for food, including meat and dairy, and emissions factors from manufactured fertil-izer use and manure production calibrated with historical data, N2O concentrations are projected to increase largely unabated unless major improvements in agricultural effi-ciencies and/or significant changes in dietary habits of the developed world are achieved (Davidson, 2012).
The IPCC AR5 has adopted a series of four representa-tive concentration pathways (RCPs) as examples of a range of scenarios of internally consistent future projections of
the major greenhouse gas emissions (van Vuuren et al., 2011b) (Figure 3.5). There are many combinations of cul-tural and technological scenarios that could be consis-tent with each of these RCPs. The RCP8.5 (Riahi et al., 2011), with a slight acceleration of the rate of increase in atmospheric N2O concentrations, is a representation of expected N2O concentrations with growing agricul-tural production to feed a growing and better nourished population, but without major new improvements in ag-ricultural efficiencies. The RCP6.0 (Masui et al., 2011) projects slower concentration growth rates but no level-ling off before 2100. The RCP4.5 (Thompson et al., 2011), with slower concentration growth rates resulting in some flattening of the N2O projected concentration curve. The RCP2.6 (van Vuuren et al., 2011c) projects stabilization of atmospheric N2O concentrations of about 345 ppb by 2050. Although radiative forcing of the RCP2.6 scenario is projected to decline to 2.6 W per m2 by 2100, this is due primarily to simulated declines in CO2 and CH4 and not N2O emissions beyond 2050 (van Vuuren et al., 2011c). Instead, this scenario projects continued elevated N2O production beyond 2050 due to continued high demand for food and biofuels. These analyses reinforce the diffi-culty we face to stabilize atmospheric N2O below 350 ppb, let alone contemplate reducing atmospheric N2O concen-trations as long as 9-10 billion people must be fed, and given current trends in dietary consumption patterns.
Davidson (2012) analyzed four additional scenarios shown in Figure 3.5. Mitigation similar to the RCP6.0 pro-jections could be achievable if the developed world cuts per capita meat consumption by about 50% from 1980 lev-els (scenario 2) or if major improvements in agricultural efficiencies on the order of 50% are realized (scenario 3). Projections similar to the RCP4.5 would be achievable if,
Figure 3.4 Trends of global NOx emissions according to EDGAR (based on European Commission, 2011) in relation to changes in world population (based on UN, 2011).
Our Nutrient World_reflowed.indd 26 30/01/2013 10:26:40

27global overview on nutrient management
in addition to the agricultural efficiency improvements, the emissions from transportation, energy, industrial, and biomass burning sectors are also decreased by about 50% (scenario 4). Only if all of these major changes in efficien-cies and diet are realized (scenario 5) could a projection similar to RCP2.6 be realized.
Trends and scenarios for N and P emissions to waterIn agricultural soils N and P applied as fertilisers can be washed off and reach surface waters by runoff or can move
into the aquifer through leaching, eventually arriving at surface waters. In developed countries and intensive agri-cultural regions this diffuse source of nutrients represents a major cause of water pollution. Regions using excessive nutrient input have higher diffuse water pollution (Billen et al., 2011, Grizzetti et al., 2011). Figure 3.6 shows the estimated net anthropogenic nitrogen input according to the world’s main river catchments (Billen et al., 2013). Values are based on the dataset of the project Global-NEWS. Figure 3.7 illustrates the estimated phosphorus
310
320
330
340
350
360
370
380
2000 2010 2020 2030 2040 2050 2060
Atm
osph
eric
N2O
(ppb
)
S1 FAO/BAU mitigationS2 Less MeatS3 Agric. EfficientS4 All EfficientS5 All MitigationsRCP8.5RCP6.0RCP4.5RCP3PD
Figure 3.5 Projected atmospheric N2O concentrations for the four IPCC-AR5 representative concentration pathways (RCPs) and the five scenarios from Davidson (2012): S1 = FAO population and dietary projections (FAO, 2006) with no new N2O mitigation efforts; S2 = same as S1 but also 50% reduction in mean per capita meat consumption in the developed world by 2030 relative to 1980 consumption; S3 = same as S1 but improvements in agricultural efficiencies that reduce N2O emissions factors for N mineral fertilizers and manure by 50% by 2050; S4 = same as S3 but also 50% emission reductions in industry and transportation sectors and by biomass burning; S5 = combination of S2 and S4.
Figure 3.6 Estimated net anthropogenic nitrogen inputs according to the world’s main river catchments (Billen et al., 2013).
Our Nutrient World_reflowed.indd 27 30/01/2013 10:26:42

28 global overview on nutrient management
surplus and deficit across the globe (Macdonald et al., 2011). Sewage discharges contribute as well to the river nutrient load, especially where the urban waste waters are not treated. Van Drecht et al. (2009) estimated that the annual global N and P emissions from sewage could in-crease from 6.4 Tg N and 1.3 Tg P in 2000 to 12-16 Tg N and 2.4-3.1 Tg P in 2050.
Part of the N and P that reaches fresh waters is then discharged to coastal waters, where it can contribute to local water eutrophication (Chapter 4). According to the estimates of the model Global-NEWS (Seitzinger et al., 2010) between 1970 and 2000 the total N export by river to coastal waters increased by almost 20% and the total P export increased by more than 10% (Table 3.3). Future scenarios indicate that by 2030 nutrient load to coastal waters could change between -5% and +5% for total N and between -2% and 0% for total P, compared to the val-ues of 2000 (Seitzinger et al., 2010), with an increasing risk of potential coastal eutrophication particularly in de-veloping countries (Garnier et al., 2010).
Besides nutrient loads and concentrations, the effects of Nr and P on the aquatic ecosystem strongly depend
on the relative availability of the two elements. In recent decades, human activities have altered the natural ratio between Nr and P (Penuelas et al., 2012) and also Nr and P ratio with respect to carbon and silica (Billen and Garnier, 2007). Even measures to reduce nutrient pollu-tion in water have resulted in affecting the ratio between the two elements (for example in Europe, Grizzetti et al., 2012).
3.3 Future challenges of global nutrient pollutionSince the 1960s, human use of synthetic N fertilizers has increased 9 fold globally and P use has tripled. The drastic increase in the use of synthetic N and P fertil-izers has perturbed the natural N and P cycles at global scale (Section 3.1, this Chapter) and altered the natural stoichiometry between N, P, C (and also Si in aquatic ecosystems). This poses threats for human health and ecosystems functioning, as the enrichment of Nr and P in the environment can contribute to water eutrophica-tion, air pollution, soil degradation, climate change and
Figure 3.7 Estimated global phosphorus surplus and deficit (MacDonald et al., 2011).
Year/Scenario Total N load (Tg N/yr) Total P load (Tg P/yr)
1970 36.7 7.62000 reference 43.2 8.62030 Global Orchestration 45.5 8.62030 Adapting Mosaic 41.1 8.42050 Global Orchestration 47.5 8.52050 Adapting Mosaic 42.0 8.6
Table 3.3 Past and projected global nitrogen (N) and phosphorus (P) export by rivers to coastal waters estimated by the model Global-NEWS. Results for two extreme Millenium Ecosystem Assessment scenarios ‘Global Orchestration’ (globalization and re-active environmental management) and ‘Adapting Mosaic’ (regionalization and pro-active environmental management). Adapted from Seitzinger et al. (2010).
Our Nutrient World_reflowed.indd 28 30/01/2013 10:26:42

29global overview on nutrient management
biodiversity loss. All these negative effects are discussed in Chapter 4.
Further substantial increase of around 40-50% of hu-man use of N and P synthetic fertilizers is expected over the next 50 years (Chapter 2) in order to feed the growing world population and because of current trends in dietary lifestyle, increasing the rates of consumption of animal products. As shown by scenarios studies (Section 3.2), this increase in mineral fertilizers use is expected to drive larger N and P emissions to the environment, especially NH3 and N2O emissions to the atmosphere and N and P losses to fresh and coastal waters. These changes in N and P emis-sions will exacerbate the current environmental problems unless urgent action is taken to improve the efficiency of N and P use, and to re-evaluate societal ambitions for fu-ture per capita consumption patterns (Section 3.2). The consequences of not taking action include further warm-ing effects from increasing atmospheric N2O, continuing deterioration of fresh water and coastal seas, air and soil quality, shortening human life, while threatening ecosys-tem services and biodiversity.
References Amann M., Bertok I., Borken-Kleefeld J., Cofala J., Heyes C.,
Höglund-Isaksson L., Klimont Z., Nguyen B., Posch M., Rafaj P., Sander R., Schöpp W., Wagner F. & Winiwarter W. (2011) Cost-effective control of air quality and greenhouse gases in Europe: modeling and policy applications. Environm. Modelling and Software 26, 1489-1501.
Benitez-Nelson C.R. (2000) The biogeochemical cycling of phosphorus in marine systems. Earth-Science Reviews 51, 109-135.
Bennett E.M., Carpenter S.R. & Caraco N.F. (2001) Human impact on erodable phosphorus and eutrophication: A global perspective. Bioscience 51, 227-234.
Beusen A.H.W., Dekkers A.L.M., Bouwman A.F., Ludwig W. & Harrison J. (2005) Estimation of global river transport of sediments and associated particulate C, N, and P. Global Biogeochemical Cycles 19, GB4S05. Gb4s05.
Billen G. & Garnier J. (2007) River basin nutrient delivery to the coastal sea: Assessing its potential to sustain new production of non-siliceous algae. Marine Chemistry 106, 148-160.
Billen G., Garnier J. & Lassaletta L. (2013) The nitrogen cascade from agricultural soils to the sea: Modelling N transfers at regional watershed and global scales. Philosophical Transactions of the Royal Society Ser. B. (in press).
Billen G., Silvestre M., Grizzetti B., Leip A., Garnier J., Voss M., Howarth R., Bouraoui F., Lepistö A., Kortelainen P., Johnes P., Curtis C., Humborg C., Smedberg E., Kaste Ø., Ganeshram R., Beusen A. & Lancelot C. (2011) Nitrogen flows from European regional watersheds to coastal marine waters. In: The European Nitrogen Assessment (eds. Sutton M.A., Howard C.M., Erisman J.W., Billen G., Bleeker A., Greenfelt P., Van Grinsven H., Grizzetti B.). Cambridge, Cambridge University Press.
Bouwman A.F., Beusen A.H.W. & Billen G. (2009) Human alteration of the global nitrogen and phosphorus soil balances for the period 1970-2050. Global Biogeochemical Cycles 23. Gb0a04.
Bouwman L., Goldewijk K.K., Van Der Hoek K.W., Beusen A.H.W., Van Vuuren D.P., Willems J., Rufino M.C. & Stehfest E. (2011) Exploring global changes in nitrogen and phosphorus cycles in agriculture induced by livestock production over the 1900–2050 period. Proceedings of the National Academy of Sciences 1-6. 10.1073/pnas.1012878108
Cordell D., Drangert J.O. & White S. (2009) The story of phosphorus: Global food security and food for thought. Global Environmental Change-Human and Policy Dimensions 19, 292-305.
Davidson E.A. (2009) The contribution of manure and fertilizer nitrogen to atmospheric nitrous oxide since 1860. Nature Geoscience 2, 659-662.
Davidson E.A. (2012) Representative concentration pathways and mitigation scenarios for nitrous oxide. Environmental Research Letters 7, 024005.
Dentener F., Drevet J., Lamarque J.F., Bey I., Eickhout B., Fiore A.M., Hauglustaine D., Horowitz L.W., Krol M., Kulshrestha U.C., Lawrence M., Galy-Lacaux C., Rast S., Shindell D., Stevenson D., Van Noije T., Atherton C., Bell N., Bergman D., Butler T., Cofala J., Collins B., Doherty R., Ellingsen K., Galloway J., Gauss M., Montanaro V., Muller J.F., Pitari G., Rodriguez J., Sanderson M., Solmon F., Strahan S., Schultz M., Sudo K., Szopa S. & Wild O. (2006) Nitrogen and sulfur deposition on regional and global scales: A multimodel evaluation. Global Biogeochemical Cycles 20. Gb4003.
Deutsch C., Sarmiento J.L., Sigman D.M., Gruber N. & Dunne J.P. (2007) Spatial coupling of nitrogen inputs and losses in the ocean. Nature 445, 163-167.
Duce R.A., LaRoche J., Altieri K., Arrigo K.R., Baker A.R., Capone D.G., Cornell S., Dentener F., Galloway J., Ganeshram R.S., Geider R.J., Jickells T., Kuypers M.M., Langlois R., Liss P.S., Liu S.M., Middelburg J.J., Moore C.M., Nickovic S., Oschlies A., Pedersen T., Prospero J., Schlitzer R., Seitzinger S., Sorensen L.L., Uematsu M., Ulloa O., Voss M., Ward B. & Zamora L. (2008) Impacts of atmospheric anthropogenic nitrogen on the open ocean. Science 320, 893-897.
European Commission (2011) Joint Research Centre (JRC)/Netherlands Environmental Assessment Agency (PBL). Emission Database for Global Atmospheric Research (EDGAR), release version 4.2. http://edgar.jrc.ec.europa.eu.
FAO (2006) World agriculture: towards 2030/2050 Interim report, Prospects for food, nutrition, agriculture and major commodity groups, (Rome: Global Perspective Studies Unit, Food and AgricultureOrganization of the United Nations)
Forster P., Ramaswamy V., Artaxo P., Berntsen T., Betts R., Fahey D.W., Haywood J., Lean J., Lowe D.C., Myhre G., Nganga J., Prinn R., Raga G., Schulz M. & Van Dorland R. (2007) Changes in Atmospheric Constituents and in Radiative Forcing. In: Climate Change 2007: The Physical Science Basis. Contribution of Working Group I to the Fourth Assessment Report of the Intergovernmental Panel on Climate Change. (eds. Solomon S., Qin D., Manning M., Chen Z., Marquis M., Averyt K.B., Tignor M., Miller H.L.). Cambridge, United Kingdom and New York, NY, USA, Cambridge University Press.
Fowler D., Coyle M., Skiba U., Sutton M., Cape N., Reis S., Sheppard L., Jenkins A., Galloway J., Vitousek P., Leech L., Bouwman L., Butterbach-Bahl K., Dentener F., Stevenson
Our Nutrient World_reflowed.indd 29 30/01/2013 10:26:43

30 global overview on nutrient management
D., Amann M. & Voss M. (2013) The Global Nitrogen Cycle in the 21st century. Philosophical Transactions of the Royal Society Ser. B. (in press)
Galloway J.N., Townsend A.R., Erisman J.W., Bekunda M., Cai Z.C., Freney J.R., Martinelli L.A., Seitzinger S.P. & Sutton M.A. (2008) Transformation of the nitrogen cycle: Recent trends, questions, and potential solutions. Science, 320, 889-892.
Garnier J., Beusen A., Thieu V., Billen G. & Bouwman L. (2010) N:P:Si nutrient export ratios and ecological consequences in coastal seas evaluated by the ICEP approach. Global Biogeochemical Cycles 24. Gb0a05.
Grizzetti B., Bouraoui F. & Aloe A. (2012) Changes of nitrogen and phosphorus loads to European seas. Global Change Biology 18, 769-782.
Grizzetti B., Bouraoui F., Billen G., van Grinsven H., Cardoso A.C., Thieu V., Garnier J., Curtis C., Howarth R. & Johnes P.J. (2011) Nitrogen as a threat to European water quality. In: The European Nitrogen Assessment (eds. Sutton M., Howard C., Erisman J.W., Billen G., Bleeker A., Greenfelt P., Van Grinsven H., Grizzetti B.). Cambridge, Cambridge University Press.
Gustavsson J., Cederberg C., Sonesson U., van Otterdijk R. & Meybeck A. (2011) Global Food Losses and Food Waste. FAO report.
Heffer P and Prud’homme M. (2012) Fertilizer Outlook 2012-2016. European Fertilizer Manufacturers Association, Paris.
Herridge D.F., Peoples M.B. & Boddey R.M. (2008) Global inputs of biological nitrogen fixation in agricultural systems. Plant and Soil 311, 1-18.
IIASA (2012a) Gains model, International Institute for Applied Systems Analysis at: http://gains.iiasa.ac.at
IIASA (2012) Database on Representative Concentration Pathways. International Institute for Applied Systems Analysis at: http://www.iiasa.ac.at/web-apps/tnt/RcpDb/dsd?Action=htmlpage&page=about
IPCC (2007) Climate Change 2007: The Physical Science Basis. Contribution of Working Group I to the Fourth Assessment Report of the Intergovernmental Panel 25 on Climate Change, Cambridge University Press.
Kanakidou M., Duce R.A., Prospero J.M., Baker A.R., Benitez-Nelson C., Dentener F.J., Hunter K.A., Liss P.S., Mahowald N., Okin G.S., Sarin M., Tsigaridis K., Uematsu M., Zamora L.M. & Zhu T. (2012) Atmospheric fluxes of organic N and P to the global ocean. Global Biogeochemical Cycles 26. Gb3026.
Lamarque J.F., Bond T.C., Eyring V., Granier C., Heil A., Klimont Z., Lee D., Liousse C., Mieville A., Owen B., Schultz M.G., Shindell D., Smith S.J., Stehfest E., Van Aardenne J., Cooper O.R., Kainuma M., Mahowald N., McConnell J.R., Naik V., Riahi K. & van Vuuren D.P. (2010) Historical (1850-2000) gridded anthropogenic and biomass burning emissions of reactive gases and aerosols: methodology and application. Atmospheric Chemistry and Physics 10, 7017-7039.
Levy H., Moxim W.J. & Kasibhatla P.S. (1996) A global three-dimensional time-dependent lightning source of tropospheric NOx. Journal of Geophysical Research-Atmospheres 101, 22911-22922.
MacDonald G.K., Bennett E.M., Potter P.A. & Ramankutty N. (2011) Agronomic phosphorus imbalances across the world’s croplands. Proceedings of the National Academy of Sciences 108, 3086-3091.
Mackenzie F.T., Vera L.M. & Lerman A. (2002) Century-scale nitrogen and phosphorus controls of the carbon cycle. Chemical Geology 190, 13-32.
Mahowald N., Jickells T.D., Baker A.R., Artaxo P., Benitez-Nelson C.R., Bergametti G., Bond T.C., Chen Y., Cohen D.D., Herut B., Kubilay N., Losno R., Luo C., Maenhaut W., McGee K.A., Okin G.S., Siefert R.L. & Tsukuda S. (2008) Global distribution of atmospheric phosphorus sources, concentrations and deposition rates, and anthropogenic impacts. Global Biogeochemical Cycles 22. Gb4026.
Maranger R., Caraco N., Duhamel J. & Amyot M. (2008) Nitrogen transfer from sea to land via commercial fisheries. Nature Geoscience 1, 111-113.
Masui T., Matsumoto K., Hijioka Y., Kinoshita T., Nozawa T., Ishiwatari S., Kato E., Shukla P.R., Yamagata Y. & Kainuma M. (2011) An emission pathway for stabilization at 6 Wm−2 radiative forcing. Climate Change 109, 59-76.
Mosier A., Kroeze, C., Nevison, C., Oenema, O., Seitzinger, S., & van Cleemput, O. (1998) Closing the global N2O budget: nitrous oxide emissions through the agricultural nitrogen cycle. Nutrient Cycling in Agroecosystems 52, 225-248.
Penuelas J., Sardans J., Rivas-Ubach A. & Janssens I.A. (2012) The human-induced imbalance between C, N and P in Earth’s life system. Global Change Biology 18, 3-6. 10.1111/j.1365-2486.2011.02568.x
Quinton J.N., Govers G., Van Oost K. & Bardgett R.D. (2010) The impact of agricultural soil erosion on biogeochemical cycling. Nature Geoscience 3, 311-314.
Reay D.S., Davidson E.A., Smith K.A., Smith P., Melillo J.M., Dentener F. & Crutzen P.J. (2012) Global agriculture and nitrous oxide emissions. Nature Climate Change 2, 410-416.
Reis S., Pinder R.W., Zhang M., Lijie G. & Sutton M.A. (2009) Reactive nitrogen in atmospheric emission inventories. Atmospheric Chemistry and Physics 9, 7657-7677.
Riahi K., Rao S., Krey V., Cho C.H., Chirkov V., Fischer G., Kindermann G., Nakicenovic N. & Rafaj P. (2011) RCP 8.5-A scenario of comparatively high greenhouse gas emissions. Climatic Change 109, 33-57.
Scholz R.W. & Wellmer F.-W. (2013) Approaching a dynamic view on the availability of mineral resources: what we may learn from the case of phosphorus? Global Environmental Change (in press)
Seitzinger S.P., Harrison J.A., Dumont E., Beusen A.H.W. & Bouwman A.F. (2005) Sources and delivery of carbon, nitrogen, and phosphorus to the coastal zone: An overview of Global Nutrient Export from Watersheds (NEWS) models and their application. Global Biogeochemical Cycles 19. Gb4s01.
Seitzinger S.P., Mayorga E., Bouwman A.F., Kroeze C., Beusen A.H.W., Billen G., Van Drecht G., Dumont E., Fekete B.M., Garnier J. & Harrison J.A. (2010) Global river nutrient export: A scenario analysis of past and future trends. Global Biogeochemical Cycles 24. Gb0a08.
Slomp C.P. & Van Cappellen P. (2007) The global marine phosphorus cycle: sensitivity to oceanic circulation. Biogeosciences 4, 155-171.
Sutton M.A., Howard C.M., Erisman J.W., Billen G., Bleeker A., Greenfelt P., van Grinsven H. & Grizzetti B. (2011a) (eds.)The European Nitrogen Assessment, Cambridge, Cambridge University Press.
Sutton M.A., Billen G., Bleeker A., Erisman J.W., Greenfelt P., van Grinsven H., Grizzetti B., Howard C. & Leip A. (2011b) Technical summary. In: The European Nitrogen Assessment.
Our Nutrient World_reflowed.indd 30 30/01/2013 10:26:43

31global overview on nutrient management
(eds. Sutton M.A., Howard C.M., Erisman J.W., Billen G., Bleeker A., Greenfelt P., Van Grinsven H., Grizzetti B.) xxxv-li. Cambridge, Cambridge University Press.
Sutton M.A., Reis S., Riddick S.N., Dragosits U., Nemitz E., Theobald M.R., Tang Y.S., Braban C.F., Vieno M., Dore A.J., Mitchell R.F., Wanless S., Daunt F., Fowler D., Blackall T.D., Milford C., Flechard C.R., Loubet B., Massad R., Cellier P., Coheur P.F., Lieven C., van Damme M., Ngadi Y., Clerbaux C., Skjøth C.A., Geels C., Hertel O., Kruit R.J.W., Pinder R.W., Bash J.O., Walker J.D., Simpson D., Horvath L., Misselbrook T.H., Bleeker A., Dentener F. & de Vries W. (2013) Toward a climate-dependent paradigm of ammonia emission & deposition. Philosophical Transactions of the Royal Society Ser. B, (in press)
Thomson A.M., Calvin K.V., Smith S.J., Kyle G.P., Volke A., Patel P., Delgado-Arias S., Bond-Lamberty B., Wise M.A., Clarke L.E. & Edmonds J.A. (2011) RCP4.5: a pathway for stabilization of radiative forcing by 2100. Climatic Change 109, 77-94.
Tie X.X., Zhang R.Y., Brasseur G. & Lei W.F. (2002) Global NOx production by lightning. Journal of Atmospheric Chemistry 43, 61-74.
UN (2011) World Population Prospects, the 2010 Revision, esa.un.org/wpp/Excel-Data/population.htm (Last access: 17/11/2012).
Van Drecht G., Bouwman A.F., Harrison J. & Knoop J.M. (2009) Global nitrogen and phosphate in urban wastewater for the period 1970 to 2050. Global Biogeochemical Cycles 23. Gb0a03.
Van Vuuren D.P., Bouwman A.F. & Beusen A.H.W. (2010) Phosphorus demand for the 1970-2100 period: A scenario analysis of resource depletion. Global Environmental Change-Human and Policy Dimensions 20, 428-439.
Van Vuuren D.P., Bouwman L.F., Smith S.J. & Dentener F. (2011a) Global projections for anthropogenic reactive nitrogen emissions to the atmosphere: an assessment of
scenarios in the scientific literature. Current Opinion in Environmental Sustainability 3, 359-369.
Van Vuuren D.P., Edmonds J., Kainuma M., Riahi K., Thomson A., Hibbard K., Hurtt G.C., Kram T., Krey V., Lamarque J.F., Masui T., Meinshausen M., Nakicenovic N., Smith S.J. & Rose S.K. (2011b) The representative concentration pathways: an overview. Climatic Change 109, 5-31.
Van Vuuren D.P., Stehfest E., den Elzen M.G.J., Kram T., van Vliet J., Deetman S., Isaac M., Goldewijk K.K., Hof A., Beltran A.M., Oostenrijk R. & van Ruijven B. (2011c) RCP2.6: exploring the possibility to keep global mean temperature increase below 2 degrees C. Climatic Change 109, 95-116.
Vitousek P.M., Aber J.D., Howarth R.W., Likens G.E., Matson P.A., Schindler D.W., Schlesinger W.H. & Tilman D. (1997) Human alteration of the global nitrogen cycle: Sources and consequences. Ecological Applications 7, 737-750.
Vitousek P.M., Menge D.N.L., Reed S.C. & Cleveland C.C. (2013) Biological nitrogen fixataion: Rates, patterns, and ecological controls in terrestrial ecosystems. Philosophical Transactions of the Royal Society Ser. B, (in press)
Voss M., Baker A., Bange H.W., Conley D., Cornell S., Deutsch B., Engel A., Ganeshram R., Garnier J., Heiskanen A.-S., Jickells T., Lancelot C., McQuatters-Gollop A., Middelburg J., Schiedek D. & Slomp C.P. (2011) Nitrogen processes in coastal and marine systems. In: The European Nitrogen Assessment (eds. Sutton M.A., Howard C.M., Erisman J.W., Billen G., Bleeker A., Greenfelt P., Van Grinsven H., Grizzetti B.). Cambridge, Cambridge University Press.
Voss M., Bange H.W., Dippner J.W., Middelburg J.J., Montoya J.P. & Ward B. (2013) The marine nitrogen cycle: recent discoveries, uncertainties and the potential relevance of climate change. Philosophical Transactions of the Royal Society Ser. B. (in press)
Our Nutrient World_reflowed.indd 31 30/01/2013 10:26:43

32 global overview on nutrient management
4 Environmental threats of too much and too little nutrients From pollution risks to land-degradation
Although the ability to use increasing amounts of min-eral fertilizer Nr and P has allowed a tremendous increase in world food production and many other benefits over the last 50 years, widespread changes to N and P cycles, with surpluses and deficits, have also adversely affected the environment and human health. In particular, Nr con-tributes to numerous environmental changes as it moves through the atmosphere, soils and waters (Erisman et al., 2012).
The main environmental and health threats from nu-trients can be summarized by extending the approach
developed by the European Nitrogen Assessment (Sutton et al., 2011a), to consider both N and P and situations of both too much and too little nutrients. In this approach, the issues are summarized according to five key threats, the initial letters forming the ‘WAGES’ of too much or too little nutrients, as illustrated in Figure 4.1:
7 Water quality: Release of too much Nr and P to the environment affects marine and freshwater ecosys-tems by eutrophication, leading to algal blooms, with dead zones and fish kills, while also polluting aquifers
SummaryFive main threats of nutrient pollution are highlighted, reflecting the current global problems of too much or too little nutrients. The threats can be summarized as affecting:
7 Water quality – too much Nr and P, causing coastal and freshwater dead zones, hypoxia, fish kills, algal blooms, nitrate contaminated aquifers and impure drinking water.
7 Air quality – too much Nr, increasing human morbidity and mortality by exposure to particulate matter formed from NOx and NH3 emissions, together with increased concentrations of nitrogen dioxide (NO2) and ground-level ozone (O3), which is produced by reaction of nitrogen oxides (NOx) with volatile organic compounds.
7 Greenhouse gas balance – too much Nr, causing emissions of N2O and other interactions with tropospheric O3 and CH4, particulate matter and alteration of CO2 exchange due to atmospheric Nr deposition. N2O is now also the main cause of stratospheric ozone depletion, increasing the risk of skin cancer from UV-B radiation.
7 Ecosystems and biodiversity – too much Nr and P, causing the loss of species of high conservation value which are naturally adapted to few nutrients, while too little nutrients increases the risk of land-use change associated with agricultural incursions into virgin ecosystems.
7 Soil quality – too much atmospheric Nr deposition acidifies natural and agricultural soils, while an inability to match crop harvests with sufficient nutrient return leads to depletion of nutrients and organic matter in agricultural soils, leading to land degradation and increasing the risk of erosion.
Key areas of too much nutrients are North America, Europe, South and East Asia, especially China. In Africa, Latin America and parts of Asia there are still wide regions with too little nutrients. In particular:
7 Many farmers do not have access to affordable mineral fertilizers, where lack of local supplies and poor in-frastructure increases already volatile prices, limiting agricultural yields. Biological nitrogen fixation, manure and sewage recycling are key local nutrient sources which are not always found in sufficient supply, are of low quality, and not optimally managed.
7 In some areas, extreme shortage of water and other nutrients (such as sulphur, zinc, selenium etc) can limit N and P use efficiency, preventing the best use being made of these major nutrients.
The increased loss of Nr and P into our environment can be seen in relation to present efforts to refine ‘Planetary Boundaries’ for key global threats. It has been suggested that reactive nitrogen production and losses substantially exceed this boundary. Efforts are now needed to improve our understanding of these dose-response relationships and quantify regional variations.
The basis used to set the original planetary boundaries for Nr and P was in both cases weak. Although there are already many N and P indicators available, it is a challenge to convert these to a single global standard, which might incorporate a wide range of component indicators while also accounting for the requirements to meet human food and energy needs. The contribution of Nr to multiple threats also highlights that disturbance of the Nr cycle can pro-vide an overarching indicator of environmental quality.
Our Nutrient World_reflowed.indd 32 30/01/2013 10:26:43

33global overview on nutrient management
and causing impure drinking water. Wide regions of most continents are affected (Reid et al., 2005), while it has been estimated that about 80% of large marine ecosystems are subject to significant eutrophication in coastal waters (Selman et al., 2008; Diaz et al., 2010). In freshwater ecosystems, generally concentrations of 1-2 mg Nr per litre (Camargo and Alonso, 2006; Grizzetti et al., 2011) and 0.1 mg P per litre or lower (van der Molen et al., 2012) are considered to cause eutrophica-tion, but specific concentrations depends on the local hydrological and climatic conditions (Poikane, 2009; van de Bund, 2009; Phillips et al., 2008).
7 Air quality: Reactive nitrogen contributes to several air pollution threats on human health, through emis-sions of nitrogen oxides (NOx) and ammonia (NH3), which lead to high concentrations of nitrogen diox-ide (NO2), particulate matter (PM) and ground-level (tropospheric) ozone (O3). It is estimated that 60% of the global population in urban areas is exposed to PM, NO2 and other toxic N substances at levels above thresholds for adverse effects, while 60% of the in-crease in tropospheric O3 since 1900 is due to NOx emissions, with tropospheric O3 also causing around 5% loss of agricultural crop productivity (WHO, 2006; Van Dingenen et al., 2009).
7 Greenhouse balance: Disruption of nutrient cycles has both climate warming and cooling effects. The greenhouse gas nitrous oxide (N2O) is the longest lasting warming component, while NOx contributes to tropospheric O3, which lead to further warming by reducing plant CO2 uptake. By contrast, atmospheric Nr deposition promotes plant growth and CO2 up-take, while Nr contributes to water soluble particulate matter (PM), both of which contribute cooling effects (Butterbach Bahl et al., 2011; Pinder et al., 2012). As a result of successful policies to reduce chlorofluoro-carbons (CFCs) and other ozone depleting substanc-es, N2O is now the main cause of stratospheric O3 depletion (Ravishankara et al., 2009), increasing the risk of skin cancer.
7 Ecosystems and biodiversity: Threats of too many nutrients include the loss of species of high conser-vation and food value which are naturally adapted to few nutrients and are threatened by eutrophica-tion. Atmospheric N deposition exceeds 5 kg per ha annually across halve of the CBD’s protected areas in ‘global biodiversity hotspots’ and G200 ecoregions (Bleeker et al., 2011), and is estimated to account for 5-15% of current global biodiversity loss (Sala et al., 2000; Dise et al., 2011). By con-trast, shortages of both N and P in agroecosystems limits productivity and can force farmers to seek additional agricultural land, leading to agricultural encroachment threatening virgin ecosystems.
7 Soil quality: Too much Nr input can lead to soil acidi-fication, both in semi-natural and forest ecosystems subject to high levels of atmospheric N deposition,
and in agricultural ecosystems with intense rates of fertilization (Guo et al., 2010). While this may be mit-igated by lime addition in agroecosystems, the effect tends to deplete essential soil bases in natural soils, while mobilizing toxic metals (De Vries et al., 2007), leading to further risks for forest health (De Wit et al., 2010) and freshwater fish populations (Hesthagen et al., 2011). Insufficient nutrient availability in agricul-ture leads to loss of soil fertility and can exacerbate erosion, while micronutrient shortages can also limit efficient use of available N and P resources.
Each of these threats is discussed in turn in the following sections.
4.1 Nutrients as a threat to water quality The enrichment of freshwater and coastal ecosystems with Nr and P causes an increase in the phytoplankton species that are able efficiently to assimilate these nu-trients, replacing species that are more limited by other factors (e.g. diatoms, requiring silica, or benthic primary producers, requiring light). Low-diversity algal or cya-nobacterial blooms can result, leading to surface water
Figure 4.1 The five key threats of too much or too little nutrients, as adapted from the European Nitrogen Assessment, based on the elements of classical philosophy (Sutton et al., 2011a). Most of these threats relate to excess nutrients leading to water, air and soil pollution, and threats to greenhouse balance, ecosystems and biodiversity. However, too little nutrients also causes a degradation of soil quality, with knock on effects for climate, food security and human health, ecosystems and biodiversity. While Nr is associated with all threats, problems of too much and too little phosphorus are especially associated with soil and water quality. Photo sources: Shutterstock.com and garysmithphotography.co.uk.
Our Nutrient World_reflowed.indd 33 30/01/2013 10:26:43

34 global overview on nutrient management
oxygen depletion (hypoxia) and the release of toxic compounds. This in turn impacts sensitive organisms at higher trophic levels, such as invertebrates and fish (e.g. Seitzinger et al., 2002; Diaz and Rosenberg, 2008; Rabalais, 2002a; Camargo and Alonso, 2006; Howarth et al., 2005; STAP, 2011). These pollution problems can be driven by high levels of either Nr or P, depending on which nutrient limits algal and cyanobacterial growth in different situations (See Box 4.1).
Sedimentation and decomposition of biomass from phytoplankton blooms can also deplete oxygen in bottom waters and surface sediments, especially in ecosystems with low rates of water turnover (e.g. Rabalais, 2002). This further shifts the benthic community toward a small-er number of tolerant species. Changes in the benthic
community alter nutrient cycling in the sediments and overlying water, feeding back to alter the rest of the aquat-ic ecosystem (Grizzetti et al., 2011).
Coastal eutrophication has recently emerged as a glob-al issue of serious concern, with a steady growth in the extent and persistence of eutrophic, hypoxic and anoxic coastal waters (Rabalais et al., 2002; Selman et al., 2008; STAP, 2011) and related incidences of toxic algal blooms such as ‘red tides’ (Rabalais, 2002). The increase in red tides has been linked to eutrophication. The expanding ef-fects of eutrophication are now recognized to be one of the important factors contributing to habitat change and to the geographical and temporal expansion of some harm-ful algal bloom (HAB) species (Smayda, 1990; Anderson et al., 2002; Glibert et al. 2005), (Figure 4.2).
Figure 4.2 Water pollution from too much nutrients. Left: The growth of algal blooms fostered by high nutrient availability initially increases oxygen supply through photosynthesis, but then leads to a high biological oxygen demand associated with algal death and decomposition. Together with reduced light penetration, which reduces photosynthesis deeper in the water, depleting dissolved oxygen levels, this can cause death of fish and other wildlife (Shutterstock). Right: This dramatic image of a ‘red tide’ is the result of a massive algal bloom, which can form in a matter of hours. The reddish color comes from the very high density of phytoplankton cells (Marufish, Flickr).
Box 4.1 When and why is nitrogen or phosphorus the main cause of water pollution?To sustain crop yields, many farmers apply nitrogen (N) and phosphorus (P) containing mineral fertilizers to the land, in addition to recycling manures and other organic wastes. Part of the N from these sources can be washed off reaching groundwater and impairing drinking water. Problems can also arise when excess N and P are washed off the land (runoff) into stream waters, finally ending up in coastal waters.
When N and P enter the sea they do the exact same thing they did on land, they fertilize the sea, and promote the production of algae and phytoplankton, which is extra organic matter to the ecosystem. The decomposition of this excess organic can drastically alter the way marine ecosystems function and often lead to hypoxia – a short-age of oxygen in the water – suffocating marine life. In addition, this extra N and P changes the natural balance between these nutrients, allowing harmful algal blooms to develop, threatening fisheries and human health.
The relative importance of N and P varies according to the issue being considered. In groundwater, the key problem is accumulation of nitrate. In freshwater systems, there is often a relative surplus of N compared with P, so the water body is said to be ‘phosphorus-limited’. This means that further P input becomes the most usual driver of algal blooms. By contrast, coastal marine ecosystems are more often considered to be ‘nitrogen-limit-ed’ so that additional Nr is more often the source of problems with algal blooms in these situations. The actual reasons for N-limitation in marine ecosytems are still debated and may include factors that limit the amount of biological N fixation. Results over recent years have also challenged this simple paradigm that contrasts N and P limitation in freshwater and marine ecosystems. Elser et al. (2007) found N and P limitation to be surprisingly similar, pointing to the importance of reducing release of both nutrients.
Our Nutrient World_reflowed.indd 34 30/01/2013 10:26:47

35global overview on nutrient management
About half of the world’s populations live within 200 ki-lometres of the coastline, and 14 of the world’s 17 largest cities are located along coasts (Creel, 2003). This leads to major eutrophication threats resulting from a combination of run-off from agricultural activities, municipal sewage and other waste-waters, and atmospheric Nr deposition.
Coral reefs, seagrass beds, wild or farmed fish, and shellfish can be particularly sensitive to eutrophication and oxygen depletion (Bouwman et al., 2011a). As with acidification (see Section 4.5), impacts on lower trophic levels can propagate up the food chain, with altered food supply affecting seabirds, mammals, and other marine animals. Diaz et al. (2010) identified over 770 eutrophic and hypoxic coastal systems worldwide, with about 220 areas of concern for developing hypoxia and 540 areas with documented hypoxia, of which 60 areas are in re-covery (Figure 4.3). These numbers are very likely un-der-estimates due to low data availability in many areas, particularly Asia, Africa, Latin America, the Indo-Pacific and the Caribbean.
Nitrate pollution of groundwater also poses a rec-ognized risk to human health. The WHO standard for drinking water is 50 mg NO3- per litre (which is equiva-lent to ~11 mg N per litre) for short-term exposure and 3 mg NO3- per litre for chronic effects (WHO, 2011). Agriculture places the largest pressure on both groundwa-ter and surface water pollution due to Nr (e.g. EEA, 2005; UNEP, 2007). In addition, atmospheric deposition of Nr can be a major diffuse source to some freshwater catch-ments and regional seas (Stacey et al., 2001).
Municipal and industrial waste waters contribute sub-stantial point sources of nutrient pollution, both into rivers
and through direct discharges to coastal areas, which is es-pecially related to a lack of appropriate sewage and other waste-water treatment. This is often limited by the major costs of installing or upgrading the infrastructure needed to treat wastewaters properly, including the maintenance of old or failing ‘septic’systems in local communities. In the case of P pollution, additional major local pollution sourc-es are associated with run off from phosphate rock mining and processing activities (Syers et al., 2011).
4.2 Nutrients as a threat to air qualityWhen released into the lower atmosphere, ammonia (NH3) and nitrogen oxides (NOx) can cause adverse effects on hu-man health through the formation of fine particulate mat-ter (PM) and photochemical smog, where NOx leads to high levels of tropospheric ozone (O3). NOx is a mixture of nitric oxide (NO) and nitrogen dioxide (NO2), with the second of these being an irritant gas that can cause severe damage to the lungs when inhaled. Together this cocktail of pollutants also reduces atmospheric visibility, providing a further threat to air quality (Figure 4.4).
High indoor NO2 levels can also induce a variety of re-spiratory illnesses, whereas continuous exposure to low concentrations of NO2 can cause a cough, headache, loss of appetite stomach problems, breathing diseases and reduced breathing efficiency (WHO, 2003). By contrast, while NH3 leads to health risks through its contribution to PM, direct adverse health effects of NH3 are restricted to confined environments where very high concentra-tions occur (ppm level) associated with the main emission
Figure 4.3 Eutrophic and hypoxic hotspot areas in the world (Diaz et al., 2010). Eutrophic areas are those with too much nutrients (orange dots), putting them at risk of adverse affects. Hypoxic areas are those where oxygen levels in the water are already depleted and adverse effects expected due to nutrient and or organic pollution (red dots). Blue dots are systems that were hypoxic at one time but now in recovery from management of nutrients and organic matter.
Our Nutrient World_reflowed.indd 35 30/01/2013 10:26:53

36 global overview on nutrient management
sources (e.g. for agriculture: animal housing units, ma-nure storage tanks, etc.).
The indirect impacts of Nr emissions through forma-tion of tropospheric O3 and particulate matter are the most important for human health. Adverse health im-pacts that can be initiated and exacerbated by O3 expo-sure include coughs and asthma, short-term reductions in lung function, and chronic respiratory disease (Von Mutius, 2000; WHO, 2003, 2008). A recent overview of health risks of tropospheric ozone by the World Health Organisation (WHO) indicates a clear increase in mor-tality and respiratory morbidity rates with increas-ing levels of ozone in the environment (WHO, 2008). Millions of people live in areas that do not meet health
standards for NOx and O3 (Ghose et al., 2005; Zhang et al., 2008). The contribution of nitrate (NO3-) and am-monium (NH4+) to aerosol particulate matter (PM) is an important effect, with PM being the largest estimat-ed contributor to adverse health effects of air pollution (WHO, 2006; 2011).
The WHO publishes assessments of health effects due to indoor and outdoor pollution (WHO, 2011). According to WHO, outdoor air pollution contributes to 5% of all cardiopulmonary deaths worldwide. In many countries approximately 20-40 deaths per 100,000 popu-lation are reported to be due to cardiopulmonary illness (WHO, 2011). In 2008, urban outdoor air pollution was responsible for an estimated 1.3 million annual deaths,
Figure: 4.4 Images of poor air quality. The pollution haze indicates high levels of particulate matter, much of which originates from N pollution, including particulate matter containing ammonium and nitrate, and high levels of nitrogen oxides (NOx). Left: Los Angeles, US (Photo: DAVID ILIFF. License: CC-BY-SA 3.0). Right: Santiago, Chile (Photo: Michael Ertel).
Figure 4.5 Deaths attributable annually to outdoor air pollution in 2008 (WHO, 2011), incorporating contributions from reactive N emissions (through effects on particulate matter, tropospheric ozone and nitrogen dioxide).
Our Nutrient World_reflowed.indd 36 30/01/2013 10:26:55

37global overview on nutrient management
representing 2.4% of the total deaths in the world (WHO, 2011) (Figure 4.5).
Worldwide, urban air pollution is estimated to cause about 9% of lung cancer deaths, 5% of cardiopulmonary deaths and about 1% of respiratory infection deaths (WHO, 2011). Nitrogen compounds contribute to a significant fraction of this burden. Indicatively, one can consider Nr pollution as contributing to 100% of the NOx threat, 60% to the tropospheric ozone threat (WHO, 2011), and 10-50%% to the mass of fine particulate matter (or around 50% of the inorganic PM fraction) (Figure 4.6).
Threats of Nr on air quality extend from the local to global scales. For example, on the local scale, in addition to health and visibility effects, activities associated with high Nr emissions lead to significant odour problems, with adverse effects on human wellbeing. This particularly applies to compounds emitted from livestock agriculture, sewage and landfill (especially associated with ammonia and organic nitrogen emissions), which can lead to sig-nificant local odour problems.
By contrast, the formation of tropospheric ozone (O3) is hemispheric in nature, due to the long residence time in the atmosphere of O3 and its precursors (NOx and VOCs). Human activities are leading to a significant increase in
these precursors, especially in the northern hemisphere, contributing to a increase background O3 by about 10%-15% between 1988 and 2005 (Fowler et al., 2008). This growing background is contributing to increased chronic effects of O3 on human health, as well as leading to sub-stantial reduction in crop production from O3 damage, estimated to be equivalent to 5% per year globally (van Dingenen et al., 2009; Shindell et al., 2012).
Airborne nitrogen compounds have been linked to respi-ratory ailments, cardiac disease and possibly several cancers (Townsend et al., 2003; Hatfield and Follett, 2008; Erisman et al., 2012), as well as to significant reductions in crop pro-duction, posing a risk to food security. Furthermore, excess Nr many increase allergenic pollen production, and the prevalence of several parasitic and infectious human and livestock diseases (Townsend et al., 2003).
4.3 Nutrients as a threat to Greenhouse Gas Balance The over and undersupply of nutrients has many po-tential effects on the global greenhouse balance. Until now, the regional and global climate effects of P surplus or deficiency have not been estimated, with most effort
Figure 4.6 Contribution of nitrogen compounds to fine particulate matter in different locations around the world. Results of measurements using aerosol mass spectrometry (less than 1 mm size, PM1), with the Nr fraction represented by nitrate (blue) and ammonium (orange) (Jimenez et al., 2009). The organic aerosol (OA), are distinguished into different fractions of hydrocarbon-like organic aerosol (HOA) and oxygenated organic aerosol (OOA), including low volatility (LV) and semi-volatile (SV) fractions.
Our Nutrient World_reflowed.indd 37 30/01/2013 10:26:56

38 global overview on nutrient management
focusing on quantifying the net effect of reactive nitrogen (e.g., Butterbach-Bahl et al., 2011, De Vries et al., 2011a, Erisman et al., 2011, IPCC, 2007, Pinder et al., 2012). In principle the surplus P may affect carbon balance through eutrophication, with P deficit reducing soil carbon stor-age, while encouraging land use change.
The existing studies have highlighted that losses of Nr to the environment have both warming and cooling ef-fects on climate. These include (Butterbach-Bahl et al., 2011):1. the warming effect of anthropogenic N2O emissions,
mainly arising from microbial processes in agricul-tural soils, as well as from Nr enriched semi-natural ecosystems, from manufactured fertilizers and com-bustion processes;
2. the warming effect of O3 formed in the troposphere as a result of NOx and volatile organic compound (VOC) emissions;
3. the warming effect of N fertilization and atmospheric N deposition which occurs by reducing the rate of at-mospheric CH4 absorption by soils;
4. the cooling effect of tropospheric O3 due to its reac-tion with methane (CH4), which reduces the lifetime of CH4 in the atmosphere;
5. the cooling effect of atmospheric Nr deposition through its effect in fertilizing plants, which increases the biospheric sink for carbon dioxide (CO2);
6. the cooling effect of water soluble (aerosol) particu-late matter, including direct effects of ammonium nitrate and ammonium sulphate aerosol on light scat-tering, as well as uncertain indirect effects from the consequences of these aerosol in acting as nuclei for cloud formation.
In making a first continental (European) estimate of the interaction of these effects, Butterbach-Bahl et al. (2011) considered each of these components, except for the con-tribution of Nr to the indirect aerosol effect, which was considered too uncertain to quantify.
Overall, the main warming components were esti-mated to be the effects of N2O and the contribution of tropospheric O3 in reducing CO2 removal by terrestrial ecosystems. By contrast, the main cooling components were estimated to be the fertilization effect of Nr deposi-tion to terrestrial ecosystems, the effect of O3 in decreasing the lifetime of CH4, and the direct effect of Nr containing aerosol. Overall, that study found that present-day warm-ing effects on current conditions were approximately bal-anced by cooling effects, within the range of uncertainties (-16 [-47 to +15] mW per m2) (Butterbach-Bahl et al., 2011) (Table 4.1). A similar picture emerges from upscal-ing this approach to a global scale, with net cooling effect of -240 [-500 to +200] W per m2 (Erisman et al., 2011).
It must be recognized that the different lifetime of these warming and cooling effects will significantly alter the long-term outlook. In particular, the major cooling effects are either very short term (e.g., the cooling effect of aerosol Nr) or medium term (e.g., the cooling effect of
Nr fertilization), while the latter has only a limited capac-ity for increased carbon storage, and may be expected to saturate within several decades. By contrast, the largest warming component, which is from N2O, is also that with the longest lifetime. This means that, while the instanta-neous effects of present day Nr emissions lead to a rough balance of warming and cooling components, the long term commitment to climate effects is dominated by the warming effect of N2O. The implication is that, if all Nr emissions were to cease immediately, we would still ex-pect several 100 years’ worth of warming effects from the existing burden of atmospheric N2O.
A similar analysis for the United States used global temperature potential (GTP) as the metric to compare warming and cooling effects at 20 and 100 year time scales (Pinder et al., 2012). For 20 years, the cooling effect of excess N in the US slightly outweighed the warming ef-fect, but the uncertainty estimate included zero net effect. For 100 years, the warming effect of N2O emissions out-weighed all cooling effects.
The total global emission of N2O is estimated at ap-proximately 18 Tg N per year (Syakila and Kroeze, 2011), with anthropogenic emissions accounting for about 45% of this total, and agriculture being responsible for about 60% of the anthropogenic sources (Crutzen et al., 2007; Davidson, 2009; Bouwman et al., 2011b; Syakila and Kroeze, 2011).
There has been much debate on the quantitative im-portance of the Nr deposition effect on carbon sequestra-tion. Models from the 1990s suggested that 20-80% of the terrestrial C sink, which is poorly constrained in carbon cycle budgets (0.5-2.0 Tg C per year), could be explained by enhanced growth due to Nr fertilisation of the terrestri-al biosphere (Holland et al., 1997). More recent estimates have revised the figure downward to below 0.5 Tg C per year (e.g. Nadelhoffer et al., 1999; Thornton et al., 2007, 2009; Churkina et al., 2009; Zaehle et al., 2011; Pinder et al., 2012). The values in Table 4.1 reflect these more mod-est estimated responses.
The complexity of these Nr relationships with climate requires a careful articulation of their policy implications. Firstly, although present Nr emissions may be having neu-tral or net cooling effects, the longer-term effects point toward a net warming effect dominated by N2O. Secondly, the component cooling effects, such as from particulate matter and from Nr deposition increasing CO2 uptake, need to be considered in the context of their other ad-verse effects on human health and ecosystems (Chapter 5). Overall, given the potential synergies and trade-offs between controls of different forms of Nr pollution, these relationships point to a need to improve overall nitrogen use efficiency, with an associated reduction of all Nr pol-lution losses including N2O (Chapter 7).
Key questions which have still to be comprehensively ad-dressed include:
7 How much does freshwater and marine eutrophica-tion from Nr and P alter global greenhouse balance?
Our Nutrient World_reflowed.indd 38 30/01/2013 10:26:56

39global overview on nutrient management
This could increase marine primary productivity, leading to higher rates of C sedimentation to the sea floor. The magnitude of this effect needs to be com-pared with terrestrial responses. Such an analysis should integrate the possible effects of aquaculture on N2O emissions.
7 How much does regional N, P and micronutrient shortage contribute to climate change, firstly, by en-hancing rates of soil degradation (reducing soil C stocks) and secondly by encouraging agricultural incursion into virgin ecosystems (reducing C stocks and increasing N2O emission)? The expectation is that the existing regional nutrient shortages exacer-bate other climate warming effects.
Nitrous oxide as a cause of stratospheric ozone depletionFinally, while considering N2O, it is important to note that this gas is now the largest contributor to stratospheric ozone depletion. Following the successful phasing-out since the 1990s of many chlorofluorocarbons (CFSs), hy-drochlorofluorocarbons (HCFCs) and other ozone deplet-ing substances (ODSs) under the Montreal Protocol, the net emission of ODSs has been substantially reduced. As N2O emissions have continued to grow over the same peri-od, the result is that N2O is now considered to be the main ODS (Ravishankara et al., 2009, Portmann et al., 2012).
These authors have estimated that N2O has an ozone depleting potential that is comparable to several HCFCs,
Pollutant Effect RF due to Nr (mW per m2)Europe World
CO2
Increase in terrestrial C sequestration due to atmospheric Nr deposition
-19 [-30 to -8] -200 a
Decrease in terrestrial C sequestration due to tropospheric O3 from NOx
+4.4 [+2.3 to +6.5] +130
CH4
Decrease in CH4 soil uptake due to atmospheric Nr deposition
+0.13 [+0.03 to +0.24] -
N2O Increase in atmospheric N2O concentration +17 [+14.8 to +19.1] +160Additional O3 effects Reduction in CH4 lifetime -4.6 [-6.7 to -2.4] - Tropospheric O3 production – radiative effect +2.9 [+0.3 to +5.5] -Aerosol direct effects (ammonium sulphate & nitrate) -16.5 [-27.5 to -5.5] -380Aerosol indirect effects (cloud albedo effect) ? ?Total -15.7
[-46.7 to +15.3]-290[-500 to + 200]
Note: a, for terrestrial ecosystems. An initial additional estimate of a further -200 mW per m2 was made for oceans.
Table 4.1 Estimates of average Nr impacts on present-day global radiative forcing (RF), due to European Nr emissions (based on Butterbach-Bahl et al. (2011) and, derived from this, values upscaled to the world (Erisman et al., 2011), in both cases focused on terrestrial sources and sinks. The European estimates are shown with uncertainty ranges.
Figure 4.7 Temporal trend in the global emission of ozone depleting substances, weighted by ozone depletion potential (ODP), including future scenarios from 2010 to 2100 (Ravishankara et al., 2009).
Our Nutrient World_reflowed.indd 39 30/01/2013 10:26:56

40 global overview on nutrient management
which becomes important because of the high concentra-tion of N2O relative to the other ODSs. Figure 4.7 shows how the relative contribution of N2O to ODSs has grown substantially since the 1990s and is projected to grow fur-ther through the 21st century under a range of scenarios. It should be noted that N2O is not considered to contrib-ute to the Antarctic ‘ozone hole’, but rather contributes to a global depletion in stratospheric ozone (Ravishankara et al., 2009).
The dual effect of N2O on stratospheric ozone deple-tion and climate forcing means that policies to control N2O help to reduce both these threats. In particular, it is now estimated that more could be achieved by reducing N2O emissions than by further policies to reduce CFCs
and HCFCs. The key challenge to achieve this concerns the larger barriers-to-change to reduce emissions from a diverse range of agricultural and other diffuse sources (for N2O) than from a small number of large industrial facili-ties (typical of the other ODSs) (Chapter 7).
4.4 Nutrients as a threat to ecosystems and biodiversityBoth too much and too little N and P can threaten to ecosystems and biodiversity. The consequences of excess nutrient leaching and run-off for freshwater and marine ecosystems have already been introduced (Section 4.1). In addition, atmospheric deposition of N compounds has
Figure 4.8 Illustration of atmospheric Nr deposition effects on peatland ecosystems. Sphagnum moss is an essential part of the biodiversity of peatlands, contributing to carbon storage and providing a habitat for many lower plants. Here, a healthy-looking specimen of Spagnum imbricatum (top) is compared with a specimen suffering from algal invasion (bottom), linked to high levels of atmospheric ammonia. The gelatinous layer of algae prevents photosynthesis, suffocating and eventually killing the Sphagnum plant. The specimens are from a peat bog experiencing 7-10 µg m-3 ammonia, near a poultry farm in Northern Ireland (Sutton et al., 2011b). Photos © Ian D. Leith, CEH.
Our Nutrient World_reflowed.indd 40 30/01/2013 10:26:57

41global overview on nutrient management
widespread and well characterized effects on terrestrial biodiversity. By contrast, emissions of P compounds to the atmosphere, such as phosphate (PO43-) in particulate matter and the gas phosphine (PH3) are thought to be much smaller than for Nr, and have been relatively little studied (Mahowald et al., 2008; GESAM, 2012; Camarero and Catalan, 2012). Finally, the depletion of nutrient stocks in agricultural soils (Section 4.5) in nutrient-poor parts the world poses a risk for ecosystems and biodiver-sity by encouraging agricultural incursion into previously
virgin ecosystems that contain nutrient stocks sufficient for crop growth.
At high concentrations, in the vicinity of direct sources such as intensive livestock production or industrial facilities, emissions of Nr as NH3 and NOx can cause extreme foliar damage, especially to lower plants, such as lichens and bryo-phytes. An example of such changes is illustrated in Figure 4.8, which shows how Sphagnum moss, which is important for peatland growth and carbon storage, can be suffocated by colonization of the surface with algae, representing a threat
603010 9 8 7 6 5 4 3 2 10.75 0.50.25 0.1 0
Figure 4.10 Distribution of Nr deposition classes and exceedance of deposition levels in the period 2000-2030 on Protected Areas (PAs) under the Convention on Biological Diversity (Bleeker et al., 2011; UNEP, 2012).
Figure 4.9 Hot spots of modelled atmospheric nitrogen deposition (Galloway et al. 2008), based on Dentener et al. (2006) (kg N per hectare per year). In North America, Europe, South and East Asia and parts of Latin America, the high values of Nr deposition are associated with fossil fuel combustion and intensive agricultural activity. In areas of Central Africa and Latin America with little N input, high levels of deposition are associated with biomass burning. Satellite data suggest that the modelled values are under-estimated in parts of central Asia (Clarisse et al., 2009).
Our Nutrient World_reflowed.indd 41 30/01/2013 10:26:59

42 global overview on nutrient management
to both biodiversity and eventual carbon stocks (another interaction relevant for Section 4.3). In particular, effects have particularly been associated with high concentrations of atmospheric ammonia, replacing local and regional lichen biodiversity with a few species able to profit from these con-ditions (van Herk et al. 2003; Wolseley et al., 2006). Although these effects are most pronounced within a few km of agri-cultural sources, many landscapes are composed of an inti-mate mix of agricultural and semi-natural elements, putting the semi-natural ecosystems at particular risk (Dragosits et al., 2002; Hicks et al., 2011).
Much broader scale changes to ecosystems often arise from chronically-elevated regional Nr deposition to ter-restrial and aquatic ecosystems, including a combination of dry deposition from gases (such as NH3, NOx), aerosols (ammonium nitrate and sulphates) and through wet de-position of these ions in precipitation. Over time, species composition changes, and diversity often declines, associ-ated with a combination of higher Nr supply and more acidic conditions.
In this way, species that are characteristic of naturally nutrient-poor (oligotrophic) or nutrient-moderate (me-sotrophic) and pH neutral habitats are out-competed by more nitrogen-loving (nitrophilic) or acid-tolerant plants. Chronically elevated Nr deposition can also enhance sus-ceptibility to stress such as frost damage, herbivory or dis-ease (Dise et al. 2011).
Exceedance of critical loads for nutrient N is linked to reduced plant species richness in a broad range of European ecosystems (Bobbink et al., 2010; Dise et al. 2011). An annual deposition of 5-10 kg N per ha has been used as a general threshold value for adverse effects (Phoenix et al., 2006; Bobbink et al., 2010), although such effects may also occur over the long-term at even lower levels (Clark and Tilman, 2008).
The global hotspots of estimated total Nr deposi-tion are illustrated in Figure 4.9 (Dentener et al., 2006; Galloway et al., 2008). This information has been com-bined with the spatial distribution of Protected Areas (PAs) and Biodiversity Hotspots under the Convention on Biological Diversity (CBD), where Bleeker et al. (2011) showed that 40% of all PAs (11% by area) are projected to receive annual N deposition higher than 10 kg N per ha by 2030 (Figure 4.10). Red PAs show an annual exceed-ance of 10 kg N per ha and deposition 2030 higher than 2000; Orange PAs show current exceedance, but deposi-tion in 2030 lower than 2000. Yellow PAs might be un-der threat in the near future since annual Nr deposition already exceeds 5 kg N per ha, but is increasing over the period 2000-2030.
In addition to the effects of Nr deposition arising from NOx and NH3 emissions, several other effects can be expected. Firstly, emissions of Nr may also occur in organic form, such as from amines, amino acids, urea and particles containing organic matter. Available data suggest that these organic N forms may contribute a fur-ther 10-40% to wet deposition of ammonium and nitrate (Cape et al. 2011, 2012, Cornell 2011). The sources of
these organic N compounds, their atmospheric behav-iour and the control options all need to be better un-derstood. Secondly, tropospheric ozone may also have significant effects on the biodiversity of natural ecosys-tems. While most study has focused on quantifying crop and forestry productivity losses due to tropospheric ozone, differences in species sensitivity may also affect ecosystem biodiversity (Wedlich et al., 2012). Further measurements of the significance of these possible inter-actions are needed.
While high levels of N deposition to terrestrial ecosys-tems have been recognized as a threat in Europe, the US and China, a shortage of nutrients is expected to contrib-ute to an even bigger threat on a global scale. Most global loss of biodiversity occurs as a result of land-use change (Alkemade et al., 2009), associated with habitat destruc-tion, where the land is cleared for agricultural or other uses. In many tropical and subtropical locations, with in-adequate nutrient supply and inappropriate management of agricultural soils (Section 4.5) soil productivity quickly diminishes and nutrient and organic matter rich topsoils are lost by erosion. This encourages further incursion by agriculture into natural ecosystems in a search for soils containing adequate nutrients to produce food. While this represents a complex set of social and economic interac-tions, the question arises as to whether more sustainable nutrient management practices of existing agricultural lands would, not only provide adequate food security, but also lead to reduced pressure to convert semi-natural eco-systems to agricultural use, thereby favouring biodiversity protection.
4.5 Nutrients as a threat to soil qualitySoil quality is both affected by nutrient availability and at the same time can affect the potential for nutrients to threaten the environment. Given that soils represent a major store of Nr, P and micronutrients, their sound man-agement is essential to address global food security chal-lenges and minimize nutrient losses to the environment that can pollute air and water. Such threats to soil quality include soil compaction, erosion, acidification, saliniza-tion, contamination, and organic matter decline, all of which can impact N and P losses to water and air (Velthof et al., 2011). These threats are relevant to both natural and agricultural soils.
Soils contain variable amounts of nutrient elements, which are needed by plants, animals and humans (Suttle, 2010). Almost all nutrients in plants are taken up by roots from soil. However, not all nutrient elements are available to biota, and although the biota has mechanisms to in-crease the availability of nutrients in soil (e.g., Marschner, 2012), primary production in many natural environments and traditional farming systems is strongly limited by nu-trient elements. This is especially the case in highly weath-ered and leached soils in the southern hemisphere, i.e., in large areas of Africa, Latin America and Australia (Palm
Our Nutrient World_reflowed.indd 42 30/01/2013 10:27:00

43global overview on nutrient management
et al., 2007), but also in various regions in the northern hemisphere. Shortage of nutrient elements in soils lead to low crop yields and also to low contents of nutrient ele-ments in the harvested crop. Low contents of nutrient ele-ments in plants may lead to malnutrition of animals and humans (Sanchez and Swaminathan, 2005).
The elements N and P are often the most crop yield-limiting nutrients in agricultural soils. The N and P con-tents are commonly in the range of 0.1 to 10 g per kg. However, most of the N is not directly available, but or-ganically bound, while most P is either organically bound or bound to iron and aluminium oxi-hydroxides. Soils require a certain minimum level of plant-available N and P to fulfil the soil functions of food, feed and fibre produc-tion, and that of ‘buffer and reactor’. However, a surplus supply of Nr and P threatens the quality of the soil and affect the emissions of N to air and of N and P emissions to water bodies and thereby contributes to eutrophica-tion of these water bodies (Velthof et al., 2011; Sims and Sharpley, 2005).
Surplus inputs of Nr and P affect the quality of soils under forests and natural vegetation far more than that of agricultural soils, for three reasons (Velthof et al., 2011). Firstly, withdrawal of N and P in harvested biomass is much smaller from forests and natural vegetation than agriculture. As a consequence, a relatively small input of Nr and P already leads to surpluses in forests and natural vegetation. Secondly, forests and natural soils are often situated on relatively poor, sandy soils, because the better soils were selected for agricultural production. As a con-sequence, soils under forest and natural vegetation tend to
be more sensitive for Nr and P surpluses than agricultural soils. Thirdly, agricultural soils are managed; disorders tend to be corrected through for example liming, soil cul-tivation, drainage, adjustment of crop rotation, etc, even if the corrections are not always cost effective, such as for farmers in developing countries. In contrast, forest and natural vegetation are usually little managed and disor-ders hit directly.
Surplus inputs of Nr, especially via reduced N (NH3, NH4+) has a range of effects and knock-on effects. Firstly, it leads to soil acidification and the associated liberation of free aluminium and heavy metals in the soil solution and the lowering of soil pH, which may lead to nutrient disorders and even toxic effects in plants. It may also af-fect the decomposition and mineralization of soil organic matter, and thereby soil organic matter quality. Secondly, it leads to increased leaching of nitrate and cations (e.g., cal-cium, magnesium) to groundwater, lakes and rivers, which affects the quality of these water bodies negatively (e.g. drinking water quality). In the subsoil, the leached nitrate may contribute to the oxidation of pyrite, which releases sulphate and various trace elements including nickel, arse-nic, cobalt, copper, lead, manganese and zinc (Huerta-Diaz and Morse, 1992; Larsen and Postma, 1997; Appelo and Postma, 1999). Thirdly, it negatively affects the biodiversity of aboveground vegetation and soil fauna and flora. The ef-fects on above-ground vegetation are huge and have been examined in detail, while the effects on soil fauna and flora are less clear, but are also less examined. Free-living fungi and N-fixing bacteria are also sensitive to Nr. Changes in the microbial community in turn impact soil processes
Box 4.2 Sub-Saharan Africa and other developing countries
The challenges of too little nutrients in soilThe occurrence of too little nutrients in agricultural soils of several developing countries is a result of two main factors. Firstly, increasing population pressures on agricultural land leads to a breakdown of traditional practices, resulting in much higher nutrient outflows. Secondly, there is a weak policy environment that does not give sufficient support for the smallholder farming sector to reverse this depletion. The consequences continue to be (Sanchez et al., 1997):
7 Decreased food and nutrition security through lower agricultural production, 7 Higher food prices and increased government expenditures on nutrition-related health illnesses, 7 Less fodder for cattle, less fuel wood for cooking, and less crop residues and cattle manure to recycle nutrients, 7 Increased runoff and erosion losses because there is less plant cover to protect the soils, 7 Sedimentation and siltation of reservoirs and coastal areas, and in some cases eutrophication of rivers and lakes, 7 Lower returns to agricultural investment, which reduces nonfarm incomes at the community level through
multiplier effects, 7 Reduced government revenue due to fewer taxes collected on agricultural goods, 7 Lower employment and increased poverty with consequent influx of rural migrants to urban areas which puts
greater strain on the limited urban physical and socio-economic infrastructure, 7 Additional CO2 emissions to the atmosphere from decreasing soil and plant C stocks associated with soil nutri-
ent depletion, 7 Decline of soil organic matter to a threshold below which crop response to other inputs is very poor, 7 Decreases in above- and below-ground biodiversity. This includes, increased encroachment of forests and wood-
lands in response to the need to clear additional land, which adversely affects wildlife biodiversity.
Our Nutrient World_reflowed.indd 43 30/01/2013 10:27:00

44 global overview on nutrient management
like organic matter mineralization and nutrient cycling (Velthof et al., 2011). Fourth, a low soil pH promotes the production of nitrous oxide (N2O) from nitrification and denitrification (Granli and Bøckman, 1994).
Dramatic effects of surplus inputs of Nr from atmo-spheric deposition have been reported in detail for soils under forests and natural vegetation as well as for lakes in Europe and North America, but the most extreme ef-fects have reduced following the implementation of policy measures to decrease Nr emissions into air. Dramatic soil acidification following large N mineral fertilizer applica-tion has been reported for China (Guo et al., 2010). Soil pH declined significantly from the 1980s to the 2000s in the major Chinese crop-production areas. Processes re-lated to N cycling released 20 to 221 kilomoles of hydro-gen ion (H+) per hectare per year, and base cations uptake contributed a further 15 to 20 kilomoles of H+ per hectare per year to soil acidification. In comparison, acid depo-sition (0.4 to 2.0 kilomoles of H+ per hectare per year) made a small contribution to the acidification of agricul-tural soils across China (Guo et al., 2010). Evidently, con-tinuing the unabated practices of large Nr inputs would be disastrous.
Surplus inputs of P leads to the build-up of soil P until the sorption capacity of the soil is ultimately ‘saturated’. The build-up of soil P has two major effects. Firstly, it leads to increased losses of P to surface waters through overland flow, erosion and subsurface leaching and drain-age (Sims and Sharpley, 2005). This leads to eutrophi-cation of surface waters and thereby to deterioration of water quality and ultimately to ‘dead water’. Secondly, it leads to a decline of biodiversity, especially aboveground biodiversity. Phosphorus-enriched soils do not support
endangered vegetation (Wassen et al., 2005); it has been recommended that the P-rich top-soils have to be re-moved to be able to re-establish a species-diverse vegeta-tion (Smolders et al., 2008).
4.6 Challenges to establish planetary boundaries for reactive nitrogen and phosphorusThe exponential growth of human activities in the last century has led to many pressures on the Earth System. In this context, the concept of ‘planetary boundary’ was introduced to consider an overarching framework of the many threats (Rockström et al. 2009a; Rockström et al. 2009b). Nine planetary boundaries were defined, name-ly, climate change, rate of biodiversity loss, interference with the N and P cycles, stratospheric ozone depletion, ocean acidification, global freshwater use, change in land use, chemical pollution and atmospheric aerosol loading. These planetary boundaries are considered as represent-ing limits for environmental sustainability, gauging cur-rent conditions against a global indicator in each case.
Many of these boundaries are related to changes in ag-ricultural production methods, specifically the increased use of Nr and P applied to cropland as both mineral fer-tilizers and organic by-products of agriculture and urban regions (animal manures, sewage sludges). Increasing population and changing consumption patterns are plac-ing unprecedented demands on agriculture.
Rockström et al. (2009a,b) defined a planetary bound-ary for Nr based on the annual amount of new Nr pro-duced from atmospheric di-nitrogen (N2) by humans.
Figure 4.11 Illustration of nutrient differences between sub-Saharan Africa, north China and the Midwest of the USA (Based on Vitousek et al., 2009). The major disparity shows much lower N and P in harvests in sub-Saharan Africa than in China and the USA. However, in addition, the N outputs in the Kenyan example are much larger than the inputs, leading to substantial soil-mining and long-term degradation of agricultural land [(see photo source - Shutterstock)]. By contrast, the extremely high nutrient inputs in China are not matched by equivalent harvests, pointing to a substantial problem with nutrient losses to the environment.
0
100
200
300
400
500
600
W. Kenya North China Midwest USA
Anni
al n
utrie
nt in
puts
& o
uput
s (k
g pe
r ha)
N inputs
N outputs
P inputs
P outputs
Our Nutrient World_reflowed.indd 44 30/01/2013 10:27:02
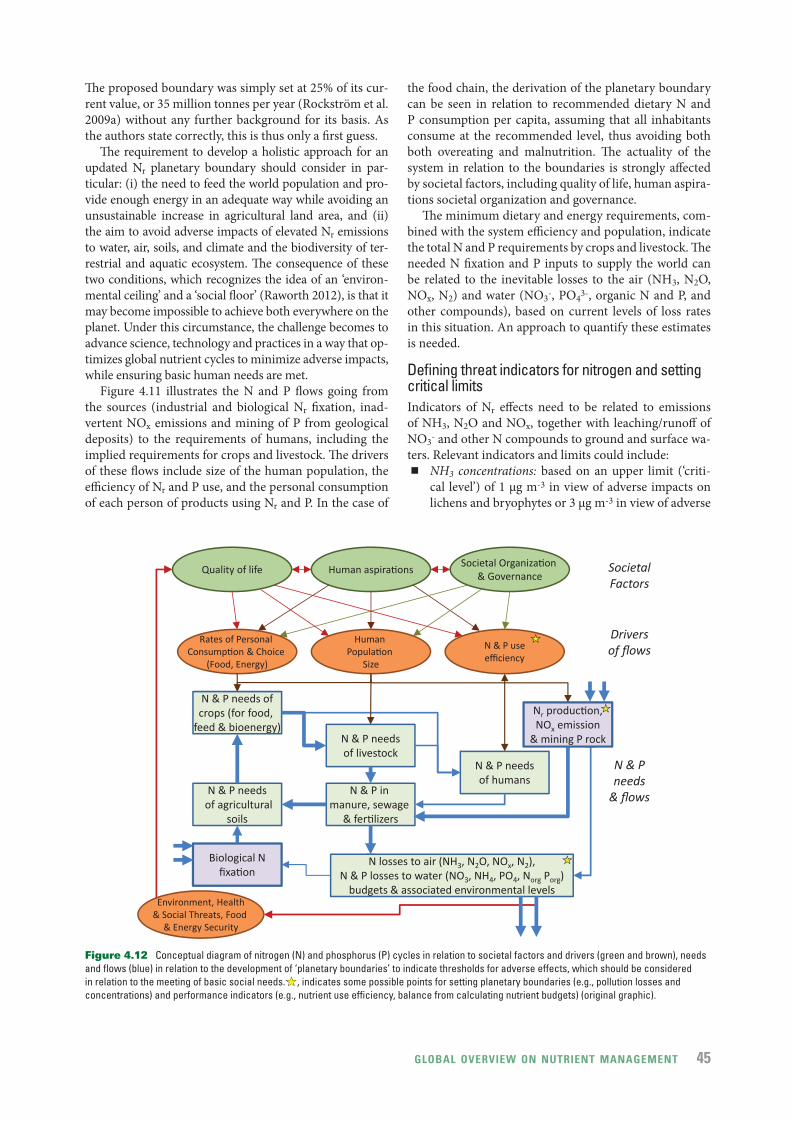
45global overview on nutrient management
The proposed boundary was simply set at 25% of its cur-rent value, or 35 million tonnes per year (Rockström et al. 2009a) without any further background for its basis. As the authors state correctly, this is thus only a first guess.
The requirement to develop a holistic approach for an updated Nr planetary boundary should consider in par-ticular: (i) the need to feed the world population and pro-vide enough energy in an adequate way while avoiding an unsustainable increase in agricultural land area, and (ii) the aim to avoid adverse impacts of elevated Nr emissions to water, air, soils, and climate and the biodiversity of ter-restrial and aquatic ecosystem. The consequence of these two conditions, which recognizes the idea of an ‘environ-mental ceiling’ and a ‘social floor’ (Raworth 2012), is that it may become impossible to achieve both everywhere on the planet. Under this circumstance, the challenge becomes to advance science, technology and practices in a way that op-timizes global nutrient cycles to minimize adverse impacts, while ensuring basic human needs are met.
Figure 4.11 illustrates the N and P flows going from the sources (industrial and biological Nr fixation, inad-vertent NOx emissions and mining of P from geological deposits) to the requirements of humans, including the implied requirements for crops and livestock. The drivers of these flows include size of the human population, the efficiency of Nr and P use, and the personal consumption of each person of products using Nr and P. In the case of
the food chain, the derivation of the planetary boundary can be seen in relation to recommended dietary N and P consumption per capita, assuming that all inhabitants consume at the recommended level, thus avoiding both both overeating and malnutrition. The actuality of the system in relation to the boundaries is strongly affected by societal factors, including quality of life, human aspira-tions societal organization and governance.
The minimum dietary and energy requirements, com-bined with the system efficiency and population, indicate the total N and P requirements by crops and livestock. The needed N fixation and P inputs to supply the world can be related to the inevitable losses to the air (NH3, N2O, NOx, N2) and water (NO3-, PO43-, organic N and P, and other compounds), based on current levels of loss rates in this situation. An approach to quantify these estimates is needed.
Defining threat indicators for nitrogen and setting critical limits Indicators of Nr effects need to be related to emissions of NH3, N2O and NOx, together with leaching/runoff of NO3- and other N compounds to ground and surface wa-ters. Relevant indicators and limits could include:
7 NH3 concentrations: based on an upper limit (‘criti-cal level’) of 1 µg m-3 in view of adverse impacts on lichens and bryophytes or 3 µg m-3 in view of adverse
N & P needsof livestock
N & P needs ofcrops (for food,
feed & bioenergy)
N & P needsof humans
Quality of lifeSocietal Organization
& GovernanceHuman aspirations
Rates of Personal Consumption & Choice
(Food, Energy)
N & P useefficiency
Human Population
Size
N & P needsof agricultural
soils
Biological N fixation
N & P in manure, sewage
& fertilizers
N losses to air (NH3, N2O, NOx, N2),N & P losses to water (NO3, NH4, PO4, Norg Porg)
budgets & associated environmental levels Environment, Health
& Social Threats, Food & Energy Security
Nr production, NOx emission
& mining P rock
SocietalFactors
Drivers of flows
N & P needs
& flows
Figure 4.12 Conceptual diagram of nitrogen (N) and phosphorus (P) cycles in relation to societal factors and drivers (green and brown), needs and flows (blue) in relation to the development of ‘planetary boundaries’ to indicate thresholds for adverse effects, which should be considered in relation to the meeting of basic social needs., indicates some possible points for setting planetary boundaries (e.g., pollution losses and concentrations) and performance indicators (e.g., nutrient use efficiency, balance from calculating nutrient budgets) (original graphic).
Our Nutrient World_reflowed.indd 45 30/01/2013 10:27:02

46 global overview on nutrient management
impacts on higher plants (Cape et al., 2009). While these values have been established for temperate conditions, it remains a future question to quantify thresholds for other climates. Smaller values may be expected in polar conditions, with larger values in tropical conditions. Critical levels for NO2 have also been estimated (UNECE, 2010).
7 Nitrogen deposition: existing estimates an upper limit (‘critical load’) for nitrogen deposition, below which affects are not observed, may be used. Here there is the problem of spatial variability according to soil and habitat type, and the contribution of NOx to N deposition (see below)
7 N2O emissions: A limit could be based on a radiative forcing (RF) boundary of 1 Wm-2 (Rockström et al. 2009a; Rockström et al. 2009b) or 2.6 Wm-2 accord-ing to RCP2.6 for greenhouse gases, aiming at a maxi-mum change of 2 ºC (Van Vuuren et al., 2011), while assigning the present GHG share to N2O
7 NO3- concentrations in ground water: The WHO drinking water limit of 50 mg NO3- per litre may be applied.
7 Total N concentrations in surface water: A limit of 0.5-1.5 mg N per litre may be applied to prevent aquatic ecosys-tems from developing eutrophication or acidification, based on reviews of the ecological and toxicological effects of inorganic N pollution in these ecosystems (Camargo and Alonso, 2006; Durand et al., 2011).
Based on the setting of such chemical and other indi-cators, it then becomes relevant to compare the perfor-mance of the different indicators. An example of such an approach is shown in Figure 4.12, which compares eight environmental effect indicators. For each issue, the per-centage exceedance of a given limit for an Nr indicator at which adverse effects occurs is presented in combination with the percentage contribution of Nr to the threat, in relation to other causes. It can be seen that while Nr may have a beneficial effect for climate, with an uncertain net cooling effect (see discussion in Section 4.3), for all of the other issues Nr is estimated to have substantial adverse effects.
Accounting for spatial variability and options for the futureGiven spatial variability, with some locations less than these boundaries and some areas exceeding these bound-aries, it may be viewed as unacceptable to derive planetary boundaries by filling the complete world up to the defined critical limit. For areas below these limits, the present conditions should be maintained. The exception would be for N2O emissions, which is a globally defined value.
It can be seen that substantial work would be needed to establish a rigorous basis to define a planetary boundary for Nr, and similar issues would apply for phosphorus. The key challenges that stand out are: i) the need to establish scientific and policy consensus on the setting of multiple
Figure 4.13 Comparison of exceedances of environmental threats related to Nr and the contribution of Nr to each of these threats compared with other drivers. While the approach recogizes that some effects are local and some global, vales represent global estimates (Erisman et al., 2013).
Our Nutrient World_reflowed.indd 46 30/01/2013 10:27:02

47global overview on nutrient management
component indicators (bearing in mind that many thresh-olds represent an approximation based on current data to what is in actuality a dose response relationship), ii) the need to handle the geographic variation in exceedance of these multiple indicators in establishing a single planetary value, and iii) the need to achieve consensus on the basis for the planetary value. In regard to the last point, for ex-ample, improving nutrient use efficiency could in theory allow a higher planetary boundary in global N fixation. For this reason, it may be preferable to consider the plan-etary boundary in terms of Nr loss to the environment rather than total N2 fixation.
The challenges of deriving a single planetary boundary to address the multiple threats of Nr point to the possibil-ity of looking at indicators from the opposite direction. Since Nr contributes to multiple threats, one may instead view overall disturbance of the N cycle as an overarch-ing indicator of environmental disturbance. In this way, an overarching Nr indicator represents the threat to each of water, air, greenhouse balance, ecosystems and biodi-versity, and soils. There is not, in principle, a policy need to integrate all into a single value for the world. Rather, indicators are needed that identify the regional, national and local performance to be assessed. For this purpose, overall national and regional nitrogen balances and full-chain nitrogen use efficiency (NUE) warrant further in-vestigation as high level operational indicators. While the first is especially related to minimizing adverse effects, the second is especially related to improving performance, meeting the needs of food and energy security, while re-ducing adverse effects. The application of these indicators is explored further in Chapter 8. Following this approach, further attention should be similarly given to harmoniz-ing estimates of phosphorus budgets and full chain phos-phorus use efficiency.
References Alkemade R., van Oorschot M., Miles L., Nellemann C.,
Bakkenes M. & ten Brink B. (2009) GLOBIO3: A framework to investigate options for reducing global terrestrial biodiversity loss. Ecosystems 12, 374-390.
Anderson D., Glibert P.M. & Burkholder J.M. (2002) Harmful algal blooms and eutrophication: Nutrient sources, composition, and consequences. Estuaries 25, 704-726.
Appelo C.A.J., & D. Postma (1999) Geochemistry, groundwater and Pollution, 2nd edition, Balkema Rotterdam.
Bleeker A., Hicks W.K., Dentener F., Galloway J. & Erisman J.W. (2011) N deposition as a threat to the World’s protected areas under the Convention on Biological Diversity. Environmental pollution 159, 2280-2288.
Bobbink R., Hicks K., Galloway J., Spranger T., Alkemade R., Ashmore M., Bustamante M., Cinderby S., Davidson E., Dentener F., Emmett B., Erisman J.W., Fenn M., Gilliam F., Nordin A., Pardo L. & de Vries W. (2010) Global assessment of nitrogen deposition effects on terrestrial plant diversity: a synthesis. Ecological Applications 20, 30-59.
Bouwman A.F., Pawłłowski M., Liu C., Beusen A.H.W., Shumway S.E., Glibert P.M. & Overbeek C.C. (2011a) Global Hindcasts and future projections of coastal nitrogen and
phosphorus loads due to shellfish and seaweed aquaculture. Reviews in Fisheries Science 19, 331-357.
Bouwman A F, Klein Goldewijk K., Van Der Hoek K.W., Beusen A.H.W., Van Vuuren D.P., Willems J, Rufino M.C., & E. Stehfest (2011b) Exploring global changes in nitrogen and phosphorus cycles in agriculture induced by livestock production over the 1900–2050 period. PNAS. www.pnas.org/cgi/doi/10.1073/pnas.1012878108.
Butterbach-Bahl K., Nemitz E., Zaehle S., Billen B., Boeckx P., Erisman J.W., Garnier J., Upstill-Goddard R., Kreuzer M., Oenema O., Reis S., Schaap M., Simpson D., de Vries W., Winiwarter W. and Sutton M.A. (2011) Effect of reactive nitrogen on the European greenhouse balance. Chapter 19 in: The European Nitrogen Assessment (Eds. Sutton M.A., Howard C.M., Erisman J.W., Billen G., Bleeker A., Grennfelt P., van Grinsven H. & Grizzetti B.) pp 434-462. Cambridge University Press.
Camarero L. & Catalan J. (2012) Atmospheric phosphorus deposition may cause lakes to revert from phosphorus limitation back to nitrogen limitation. Nature communications 3, 1118-1118.
Camargo J.A. & Alonso A. (2006) Ecological and toxicological effects of inorganic nitrogen pollution in aquatic ecosystems: A global assessment. Environment International 32, 831-849.
Cape J.N., Van der Eerden L.J., Sheppard L.J., Leith I.D. & Sutton M.A. (2009) Evidence for changing the critical level for ammonia. Environmental Pollution 157, 1033-1037.
Cape J.N., Cornell S., Jickells T., & Nemitz E. (2011), Organic nitrogen in the atmosphere–where does it come from?, Atmospheric Research, 102, 30-48.
Cape J.N., Tang Y.S., González Benítez J.M., Mitošinková M., Makkonen U., Jocher M., & Stolk A. (2012), Organic nitrogen in precipitation across Europe, Biogeosciences, 9 (11), 4401-4409.
Churkina G., Brovkin V., von Bloh W., Trusilova K., Jung M. & Dentener F. (2009) Synergy of rising nitrogen depositions and atmospheric CO2 on land carbon uptake moderately offsets global warming. Global Biogeochemical Cycles 23, GB4027, doi:10.1029/2008GB003291
Clarisse L., Clerbaux C. Dentener F., Hurtmans D. & Coheur, P.–F., 2009. Global ammonia distribution derived from infrared satellite observations. Nature geoscience. 2, 479-483.
Clark C.M. & Tilman D. (2008) Loss of plant species after chronic low-level nitrogen deposition to prairie grasslands. Nature 451, 712-715.
Cornell S. E. (2011), Atmospheric nitrogen deposition: Revisiting the question of the importance of the organic component, Environmental Pollution, 159(10), 2214-2222.
Creel L. (2003) Ripple Effects: Population and Coastal Regions. Washington, DC: Population Reference Bureau. Available at: www.prb.org/Publications/ PolicyBriefs/RippleEffectsPopulationandCoastalRegions.aspx (accessed January 5, 2012.
Crutzen P.J., Mosier A.R., Smith K.A. & Winiwarter W. (2007) N2O release from agro-biofuel production negates global warming reduction by replacing fossil fuels. Atmospheric Chemistry and Physics 8, 389-395.
Davidson E.A. (2009) The contribution of manure and fertiliser nitrogen to atmospheric nitrous oxide since 1860. Nature Geoscience 2, 659–662.
De Vries W., Kros J., Reinds G.J. & Butterbach-Bahl K. (2011) Quantifying impacts of nitrogen use in European
Our Nutrient World_reflowed.indd 47 30/01/2013 10:27:03

48 global overview on nutrient management
agriculture on global warming potential. Current Opinion in Environmental Sustainability 3, 291-302.
De Vries W., van der Salm C., Reinds G.J. & Erisman J.W. (2007) Element fluxes through intensively monitored forest ecosystems in Europe and their relationships with stand and site characteristics. Environmental Pollution 148, 501-513.
De Wit H. A., Eldhuset T. & Mulder J. (2010) Dissolved Al reduces Mg uptake in Norway spruce forest: Results from a long-term field manipulation experiment in Norway. Forest Ecology and Management 259, 2072-2082.
Dentener F., Drevet J., Lamarque J.F., Bey I., Eickhout B., Fiore A.M., Hauglustaine D., Horowitz L.W., Krol M., Kulshrestha U.C., Lawrence M., Galy-Lacaux C., Rast S., Shindell D., Stevenson D., Van Noije T., Atherton C., Bell N., Bergman D., Butlerv, Cofala J., Collins B., Doherty R., Ellingsen K., Galloway J., Gauss M., Montanaro V., Müller J.F., Pitari G., Rodriguez J., Sanderson M., Solmon F., Strahan S., Schultz M., Sudo K., Szopa S. & Wild O. (2006) Nitrogen and sulphur deposition on regional and global scales: A multimodel evaluation. Global biogeochemical cycles 20, GB4003, doi:10.1029/2005GB002672.
Diaz R., Selman M. & Chique C. (2010) Global Eutrophic and Hypoxic Coastal Systems. World Resources Institute. Eutrophication and Hypoxia: Nutrient Pollution in Coastal Waters. http://www.wri.org/project/eutrophication
Diaz R.J. & Rosenberg R. (1995) Marine benthic hypoxia: a review of its ecological effects and the behavioural responses of benthic macrofauna. Oceanography and Marine Biology: An Annual Review 33, 245-303.
Diaz R.J. & Rosenberg R. (2008) Spreading dead zones and consequences for marine ecosystems. Science 321, 926-928.
Dise N.B., Ashmore M., Belyazid S., Bleeker A., Bobbink R., de Vries W., Erisman J.W. van den Berg L., Spranger T. & Stevens C. (2011) Nitrogen as a threat to European terrestrial biodiversity. Chapter 20, in: The European Nitrogen Assessment (Eds. Sutton M.A., Howard C.M., Erisman J.W., Billen G., Bleeker A., Grennfelt P., van Grinsven H. & Grizzetti B.) pp. 463-494, Cambridge University Press.
Dragosits U., Theobald M.R., Place C.J., Lord E., Webb J., Hill J., ApSimon H.M. & Sutton M.A. (2002) Ammonia, emission, deposition and impact assessment at a field scale: a case study of sub-grid spatial variability. Environmental Pollution 117 (1) 147-158.
Durand P., Breuer, L., Johnes, P., Billen, G., Butturini, A., Pinay, G. & van Grinsven, H. (2011) Nitrogen processes in aquatic ecosystems. Chapter 2, in: The European Nitrogen Assessment (Eds. Sutton M.A., Howard C.M., Erisman J.W., Billen G., Bleeker A., Grennfelt P., van Grinsven H. and Grizzetti B.) pp 126-146, Cambridge University Press.
EEA (2005) The European environment – State and outlook 2005. European Environment Agency, Copenhagen. 576 pp.
Erisman J.W., Galloway J.N., Seitzinger S., Bleeker A., Dise N.B., Petrescu R., Leach A.M. & de Vries W. (2013) Consequences of human modification of the global nitrogen cycle. Phil. Trans. Roy. Soc. (Series B) (in press).
Erisman J.W., van Grinsven H., Grizzetti B., Bouraoui F., Powlson D., Sutton M.A., Bleeker A. & Reis S. (2011) The European nitrogen problem in a global perspective. Chapter 2, in: The European Nitrogen Assessment (Eds. Sutton M.A., Howard C.M., Erisman J.W., Billen G., Bleeker A., Grennfelt P., van Grinsven H. & Grizzetti B.) pp 9-31, Cambridge University Press.
Erisman J.W., Galloway J.N., Seitzinger S., Bleeker A. & Butterbach-Bahl K. (2011) Reactive nitrogen in the environment and its effect on climate change, Current Opinion in Environmental Sustainability 3, 281-290.
Fowler D., Amann M., Anderson R., Ashmore M., Cox P., Depledge M., Derwent D., Grennfelt P., Hewitt N., Hov O., Jenkin M., Kelly F., Liss P., Pilling M., Pyle J., Slingo J., Stevenson D., Garthwaite R., Newton R. & Darkin B. (2008) Ground-level ozone in the 21st century: future trends, impacts and policy implications. Science Policy Report 15/08, Royal Society, London. 132 pp.
Galloway J.N., Townsend A.R. Erisman J.W., Bekunda M., Cai Z., Freney J.R., Martinelli L.A., Seitzinger S.P. & Sutton M.A. (2008) Transformation of the nitrogen cycle: Recent trends, questions, and potential solutions. Science 320, 889-892
GESAMP (2012) The atmospheric input of chemicals to the ocean. (IMO, FAO, UNESCO-IOC, UNIDO, WMO, IAEA, UN, UNEP, UNDP Joint Group of Experts on the Scientific Aspects of of Marine Environmental Protection) GESAMP Report 84 / GAW Report 203. 69 pp.
Ghose M.K., Paul R. & Banerjee R.K. (2005) Assessment of the status of urban air pollution and its impact on human health in the city of Kolkata. Environmental Monitoring and Assessment 108, 151-167.
Glibert P.M., Seitzinger S., Heil C.A., Burkholder J.M., Parrow M.W., Codispoti L.A. & Kelly V. (2005) The role of eutrophication in the global proliferation of harmful algal blooms: new perspectives and new approaches Oceanography 18, 198-209.
Granli T. & Bøckman O.C. (1994). Nitrous oxide from agriculture. Norwegian Journal of Agricultural Sciences Supplement 12, 7-128.
Grizzetti B., Bouraoui F., Billen G., van Grinsven H., Cardoso A.C., Thieu V. & Garnier J. (2011) Nitrogen processes in aquatic ecosystems. Chapter 17, in: (Eds. Sutton, M.A., C.M. Howard, J.W. Erisman, G. Billen, A. Bleeker, P. Grennfelt, H. van Grinsven & B. Grizzetti). The European Nitrogen Assessment. pp. 379-404, Cambridge University Press, Cambridge, UK.
Guo J. H., Liu X.J., Zhang Y., Shen J.L., Han W.X., Zhang W.F., Christie P., Goulding K.W.T., Vitousek P.M. & Zhang F.S. (2010) Significant acidification in major cxhinese croplands. Science 327, 1008-1010.
Hatfield J.L. & Follett R.F. (2008) (Eds.) Nitrogen in the environment: sources, problems, and management. Elsevier, Amsterdam, 702 pp.
Hesthagen T., Fjellheim A., Schartau A.K., Wright, R.F., Saksgård R. & Rosseland B.O. (2011) Chemical and Biological Recovery of Lake Saudlandsvatn, a Formerly Highly Acidified Lake in Southernmost Norway, in Response to Decreased Acid Deposition. Sci. Tot. Environ. 409, 2908-2916.
Hicks W.K, Whitfield C.P., Bealey W.J., & Sutton M.A. (2011) Eds. Nitrogen Deposition and Natura 2000: Science & practice in determining environmental impacts (Findings of a European workshop linking scientists, environmental managers and policymakers, Brussels, 18th-20th May, 2009), COST Office, Brussels.
Holland E.A, Braswell B.H., Lamarque J.-F., Townsend A., Müller J.F., Dentener F., Brasseur G., Levy H., Penner J. E. & Roelofs, G.J. (1997) Variations in the predicted spatial distribution of atmospheric nitrogen deposition and their
Our Nutrient World_reflowed.indd 48 30/01/2013 10:27:03

49global overview on nutrient management
impact on carbon uptake by terrestrial ecosystems. Journal of Geophysical Research 102, 15,849-15,866.
Howarth R.W., Ramakrishna K., Choi E., Elmgren R., Martinelli L., Mendoza A., Moomaw W., Palm C., Boy R., Scholes M. & Zhu Z.-L. (2005) Nutrient Management, Responses Assessment. Chapter 9 in: Reid W.V., Mooney H.A., Cropper A., Capistrano D., Carpenter S.R., Chopra K., Dasgupta P., Dietz T., Duraiappah A.K. et al. Eds. Ecosystems and Human Well-being: Synthesis. pp 295-311. Island Press, Washington DC.
Huerta-Diaz M.A. & Morse J.W. (1992) Pyritization of trace metals in anoxic marine sediments. Geochimica et Cosmochimica Acta 56, 2681-2702.
IPCC (2007) Climate Change 2007: The Physical Science Basis. Contribution of Working Group I to the Fourth Assessment Report of the International Panel on Climate Change. Cambridge University Press.
Jimenez J.L., Canagaratna M.R., Donahue N.M., Prevot A.S.H., Zhang Q., Kroll J.H., DeCarlo P.F., Allan J.D., Coe H., Ng N.L., Aiken A.C., Docherty K.S., Ulbrich I.M., Grieshop A.P., Robinson A.L., Duplissy J., Smith J.D., Wilson K.R., Lanz V.A., Hueglin C., Sun Y.L., Tian J., Laaksonen A., Raatikainen T., Rautiainen J., Vaattovaara P., Ehn M., Kulmala M., Tomlinson J.M., Collins D.R., Cubison M.J., Dunlea E.J., Huffman J.A., Onasch T.B., Alfarra, M.R., Williams P.I., Bower K., Kondo Y., Schneider J., Drewnick F., Borrmann S., Weimer S., Demerjian K., Salcedo D., Cottrell L., Griffin R., Takami A., Miyoshi T., Hatakeyama S., Shimono A., Sun J.Y., Zhang Y.M., Dzepina K., Kimmel J.R., Sueper D., Jayne J.T., Herndon S.C., Trimborn A.M., Williams L.R., Wood E.C., Middlebrook A.M., Kolb C.E., Baltensperger U., & Worsnop D.R. (2009)Evolution of organic aerosols in the atmosphere. Science 326, 1525-1529.
Larsen F. & Postma D. (1997) Nickel mobilization in a groundwater well field: Release by pyrite oxidation and desorption from manganese oxides. Environmental science & technology 31, 2589-2595.
Mahowald N,. Jickells T.D., Baker A.R., Artaxo P., Benitez-Nelson C.R., Bergametti G., Tami T., Bond C., Chen Y., Cohen D.C., Herut B., Kubilay N., Losno R., Luo C., Maenhaut W. McGee K.A. Okin G.S, Siefert R.L. & Tsukuda S. (2008) Global distribution of atmospheric phosphorus sources, concentrations and deposition rates, and anthropogenic impacts. Global Biogeochem. Cycles 22, GB4026, doi:10.1029/2008GB003240
Marschner P. (2012) Marschner’s Mineral Nutrition of Higher Plants. (ed.) London: Academic Press, Elsevier. 700 pp.
Nadelhoffer K.J., Emmett B.A., Gundersen P., Kjønaas O.J., Koopmans C.J., Schleppi P., Tietema A. & Wright R.F. (1999) Nitrogen deposition makes a minor contribution to carbon sequestration in temperate forests. Nature 398, 145 -148.
Palm C.A., Sanchez P.A., Ahmed S. & Awiti A. (2007) Soils: A Contemporary Perspective. The Annual Review of Environment and Resources 32, 99-129.
Parry M.L. Canziani O.F., Palutikof J.P., van der Linden P.J. & Hanson C.E. (2007) Eds. Climate Change 2007: Impacts, Adaptation and Vulnerability. Contribution of Working Group II to the Fourth Assessment Report of the Intergovernmental Panel on Climate Change, Cambridge University Press, Cambridge, UK, 976pp.
Phillips G., Pietilainen O.P., Carvalho L., Solimini A., Solheim A.L. & Cardoso A.C. (2008) Chlorophyll-nutrient relationships of different lake types using a large European dataset. Aquatic Ecology 42, 213-226.
Phoenix G.K., Hicks W.K., Cinderby S., Kuylenstierna J.C.I., Stock W.D., Dentener F.J., Giller K.E., Austin A.T., Lefroy R.D.B., Gimeno B.S., Ashmore M.R. & Ineson P. (2006) Atmospheric nitrogen deposition in world biodiversity hotspots: the need for a greater global perspective in assessing N deposition impacts. Global Change Biology 12, 470-476.
Pinder R.W., Davidson E.A., Goodale C.L., Greaver T.L., Herrick J.D. & Liu L. (2012) Climate change impacts of US reactive nitrogen. Proceedings of the National Academy of Sciences 109,7671-7675.
Poikane S. (2009) (ed.) Water Framework Directive intercalibration; technical report Part 2: Lakes. JRC Scientific and Technical Reports, EUR 23838 EN/2.
Portmann R.W., Daniel J.S. & Ravishankara A.R. (2012) Ozone depletion due to N2O: influences of other gases. Phil. Trans. Royal Soc., B (Biology) (in press).
Rabalais N.N. (2002) Nitrogen in aquatic ecosystems. Ambio 31, 102-112.
Rabalais N.N., Turner R.E. & Scavia D. (2002) Beyond science into policy: Gulf of Mexico hypoxia and the Mississippi River. BioScience 52, 129–142.
Ravishankara A.R., Daniel J.S. & Portmann R.W. (2009) Nitrous Oxide (N2O): The dominant ozone-depleting substance emitted in the 21st Century. Science 326, 123-125.
Raworth K. (2012) A safe and just space for humanity. Can we live within the doughnut? Oxfam Discussion Paper February 2012. http://policy-practice.oxfam.org.uk/
Reid W.V., Mooney H.A., Cropper A., Capistrano D., Carpenter S.R., Chopra K., Dasgupta P., Dietz T., Duraiappah A.K., Hassan R., Kasperson R., Leemans R., May R.M., McMichael A.J., Pingali P., Samper C., Scholes R., Watson R.T., Zakri A.H., Zhao S., Ash N.J., Bennett E., Kumar P., Lee M.J., Raudsepp-Hearne C., Simons H., Thonell J. & Zurek M.B. (2005) Millennium Ecosystem Assessment: Ecosystems and Human Well-Being: Synthesis. Island Press, Washington, DC.
Rockström J., Steffen W., Noone K., Persson, Å., Chapin F.S. III., Lambin E., Lenton T.M., Scheffer M., Folke C., Schellnhuber H.J., Nykvist B., de Wit C.A., Hughes T., van der Leeuw S., Rodhe H., Sörlin S., Snyder P.K., Costanza R., Svedin U., Falkenmark M., Karlberg L., Corell R.W., Fabry V.J., Hansen J., Walker B., Liverman D., Richardson K., Crutzen P., & Foley J.A. (2009a) A safe operating space for humanity. Nature 461, 472-475.
Rockström J., Steffen W., Noone K., Persson, Å., Chapin F.S. III., Lambin E., Lenton T.M., Scheffer M., Folke C., Schellnhuber H.J., Nykvist B., de Wit C.A., Hughes T., van der Leeuw S., Rodhe H., Sörlin S., Snyder P.K., Costanza R., Svedin U., Falkenmark M., Karlberg L., Corell R.W., Fabry V.J., Hansen J., Walker B., Liverman D., Richardson K., Crutzen P., & Foley J.A. (2009b.) Planetary boundaries: exploring the safe operating space for humanity. Ecology and Society 14 (2), 32.
Sala O.E., Chapin F.S., III, Armesto J.J., Berlow E., Bloomfield J., Dirzo R., Huber-Sanwald E., Huenneke L.F., Jackson R.B., Kinzig A., Leemans R., Lodge D.M., Mooney H.A., Oesterheld M., LeRoy Poff N., Sykes M.T., Walker B.H., Walker M. & Wall, D.H. (2000) Global biodiversity scenarios for the year 2100. Science 287, 1770-1774.
Sanchez P.A., Shepherd K.D., Soule M.J., Place F.M., Buresh R.J., Izac A.N., Mokwunye U.A., Kwesiga F.R., Nderitu C.G. & Woomer P.L. (1997) Soil Fertility Replenishment in Africa:
Our Nutrient World_reflowed.indd 49 30/01/2013 10:27:03

50 global overview on nutrient management
An Investment in Natural Resource Capital. SSSA Special Publication Number 51, pp1-46.
Sanchez P.A. & Swaminathan M.S. (2005) Hunger in Africa: the link between unhealthy people and unhealthy soils. The Lancet 365, 442-444.
Shindell D., Kuylenstierna J.C.I., Vignati E., van Dingenen R., Amann M., Klimont Z., Anenberg S.C., Muller N., Janssens-Maenhout G., Raes F., Schwartz J., Faluvegi G., Pozzoli L., Kupiainen K., Höglund-Isaksson L., Emberson L., Streets D., Ramanathan V., Hicks K., Oanh N.T.K., Milly G., Williams M., Demkine V. & Fowler D. (2012) Simultaneously mitigating near-term climate change and improving human health and food security. Science 335, 183-189.
Seitzinger S.P., Kroeze C., Bouwman A. F., Caraco N., Dentener F. & Styles R.V. (2002) Global patterns of dissolved inorganic and particulate nitrogen inputs to coastal systems: recent conditions and future projections. Estuaries 25, 640-655.
Seitzinger S.P., Mayorga E., Bouwman A.F., Kroeze C., Beusen A.H.W., Billen G., Van Drecht G., Dumont E., Fekete B.M., Garnier J. & Harrison J.A. (2010) Global river nutrient export: A scenario analysis of past and future trends. Global Biogeochemical Cycles 24, GB0A08, doi:10.1029/2009GB003587.
Selman M., Sugg Z. Greenhalgh S. & Diaz R. (2008) Eutrophication and Hypoxia in Coastal Areas: A Global Assessment of the State of Knowledge, WRI Report, http://www.wri.org/publication/eutrophication-and-hypoxia-in-coastal-areas
Sims J.T. & Sharpley A.N. (2005). Phosphorus: Agriculture and the Environment. (eds.) Agron. Monogr. 46. ASA, CSSA, and SSSA, Madison, WI., 1121 pp.
Smayda T.J. (1990) Novel and nuisance phytoplankton blooms in the sea: Evidence for a global epidemic, In Toxic Marine Phytoplankton, (eds.: Granéli E., Sundström B., Edler L., & Anderson D.M.), Elsevier, New York, USA.
Smolders A.J.P., Lucassen E.C.H.E.T., van der Aalst M., Lamers, L.P.M. & Roelofs, J.G.M. (2008) Decreasing the abundance of Juncus effusus on former agricultural lands with noncalcareous sandy soils: possible effects of liming and soil removal. Restoration Ecology 16, 240-8
STAP (2011) Hypoxia and Nutrient Reduction in the Coastal Zone. Advice for Prevention, Remediation and Research. An Advisory Document of the Scientific and Technical Advisory Panel. Global Environment Facility, Washington, DC. http://www.thegef.org/gef/sites/thegef.org/files/publication/STAP_Hypoxia_low.pdf
Stacey P.E., Greening H.S., Kremer J.N., Peterson,D. & Tomasko D.A. (2001) Contributions of atmospheric nitrogen deposition to U.S. estuaries: Summary and conclusions. In: Nitrogen Loading in Coastal Water Bodies: An Atmospheric Perspective, American Geophysical Union Monograph 57, (R. Valigura, R. Alexander, M. Castro, T. Meyers, H. Paerl, P. Stacey & R. Eugene Turner (eds.), pp. 187-226
Suttle N. (2010) Mineral Nutrition of Livestock, 4th Edition, 650 pp. Sutton M.A., Howard C.M., Erisman J.W., Bealey W.J., Billen
G., Bleeker A., Bouwan A.F., Grennfelt P., van Grinsven H. and Grizzetti B. (2011a). The challenge to integrate nitrogen science and policies: the European Nitrogen Assessment approach. Chapter 5 in: The European Nitrogen Assessment (Eds. Sutton M.A., Howard C.M., Erisman J.W., Billen G., Bleeker A., Grennfelt P., van Grinsven H. and Grizzetti B.) Cambridge University Press pp 82-96.
Sutton M.A., Leith I.D., Bealey W.J., van Dijk N. & Tang Y.S. (2011b) Moninea Bog: A case study of atmospheric ammonia impacts on a Special Area of Conservation. In: Nitrogen Deposition and Natura 2000: Science & practice in determining environmental impacts (Eds: W.K. Hicks, C.P. Whitfield, W.J. Bealey, and M.A. Sutton), pp 59-71. COST Office, Brussels.
Syakila A. & Kroeze C. (2011) The global nitrous oxide budget revisited. Greenhouse Gas Measurement & Management 1, 17–26.
Syers K., Bekunda M., Cordell D., Corman J., Johnston J., Rosemarin A., Salcedo A. & Lougheed T. (2011) Phosphorus and food production. In: UNEP Year Book 2011. pp 34-45. UNEP, Nairobi.
Thornton P.E, Doney S.C, Lindsay K., Moore J.K., Mahowald N.R., Anderson J.T., Fung I., Lamarque J.-F., Feddema J.J. & Lee Y.-H. (2009) Carbon-nitrogen interactions regulate climate-carbon cycle feedbacks: results from an atmosphere-ocean general circulation model. Biogeosciences 6, 2099-2120,
Thornton P.E., Lamarque J.F., Rosenbloom N.A. & Mahowald N.M. (2007) Influence of carbon-nitrogen cycle coupling on land model response to CO2 fertilization and climate variability. Global Biogeochemical Cycles 21, GB4018, DOI: 10.1029/2006GB002868
Townsend A.R., Howarth R.W., Bazzaz F.A., Booth M.S., Cleveland C.C., Collinge S.K., Dobson A.P., Epstein P.R., Holland E.A., Keeney D.R., Mallin M.A., Rogers C.A., Wayne P. & Wolfe A.H. (2003) Human health effects of a changing global nitrogen cycle. Frontiers in Ecology & the Environment 1, 240-246.
UNECE (2010) Mapping Manual 2010 update. UNECE Convention on Long-range Transboundary Air Pollution, ICP Modelling and Mapping.
UNEP (2007) Global Environmental Outlook 4. (GEO-4) United Nations Environment Program, Nairobi, Kenya.
UNEP (2012) Global Environmental Outlook 5. (GEO-5) United Nations Environment Program, Nairobi, Kenya.
van de Bund W. (2009) (ed.) Water Framework Directive intercalibration technical report Part 1: Rivers. JRC Scientific and Technical Reports, EUR 23838 EN/1.
Van der Molen D.T., Pot R., Evers C.H.M. & van Nieuwerburgh L.L.J. (2012) (eds.) Referenties en maatlatten voor natuurlijke watertypen voor de kaderrichtlijn water 2015-2021, STOWA rapport 2012-31. (In Dutch).
Van Dingenen R., Dentener F.J., Raes F., Krol M.C., Emberson L. & Cofal J. (2009) The global impact of ozone on agricultural crop yields under current and future air quality legislation. Atmospheric Environment 43 (3), 604-618.
Van Herk C.M., Mathijssen-Spiekman, E.A.M. & de Zwart D. (2003) Long distance nitrogen air pollution effects on lichens in Europe. Lichenologist, 35, 347 –359.
Van Vuuren D.P., Edmonds J., Thomson A., Riahi K., Kainuma M., Matsui T., Hurtt G.C., Lamarque J.-F., Meinshausen M., Smith S., Granier C., Rose S.K. & Hibbard K.A. (2011b) Representative Concentration Pathways: An overview. Climatic Change 109, 5-31.
Velthof G.L., Barot S., Bloem J., Butterbach-Bahl K., de Vries W., Kros J., Lavelle P., Olesen J.E. & Oenema O. (2011) Nitrogen as a threat to European soil quality. Chapter 21 in: (Eds. Sutton, M.A., Howard C.M., Erisman J.W., Billen G., Bleeker A., Grennfelt P., van Grinsven H. & GrizzettiB.). The European Nitrogen Assessment. pp. 494-509. Cambridge University Press, Cambridge, UK.
Our Nutrient World_reflowed.indd 50 30/01/2013 10:27:03

51global overview on nutrient management
Velthof G.L., Beek C.G.E.M. & van Erp P.J. (1999) Leaching of calcium and magnesium (hardness) from arable land and maize land on non-calcareous sandy soils. Meststoffen 60-66.
Vitousek P.M., Naylor R., Crews T., David M.B., Drinkwater L.E., Holland E., Johnes P.J., Katzenberger J., Martinelli L.A., Matson P.A., Nziguheba G., Ojima D., Palm C.A., Robertson G.P., Sanchez P.A., Townsend A.R. & Zhang F.S. (2009) Nutrient imbalances in agricultural development. Science 324, 1519-1520.
Von Mutius E. (2000) The environmental predictors of allergic disease. J. Allergy & Clinical Immunology 105, 9-19.
Wassen M.J., Olde Venterink H., Lapshina E.D. & Tanneberger F. (2005) Endangered plants persist under phosphorus limitation. Nature 437, 547-550.
Wedlich K., Rintoul N., Peacock S., Cape J., Coyle M., Toet S., Barnes J. & Ashmore M. (2012) Effects of ozone on species composition in an upland grassland. Oecologia 168(4), 1137-1146.
WHO (2003) Health Aspects of Air Pollution with Particulate Matter, Ozone and Nitrogen Dioxide. Report on a WHO Working Group; Bonn, Germany; 13-15 January 2003. World Health Organization, Copenhagen.
WHO (2006) Air quality guidelines for particulate matter, ozone, nitrogen dioxide and sulphur dioxide, Global
update 2005: Summary of risk assessment. World Health Organization, Geneva.
WHO (2008) Health risks of ozone form long-range transboundary air pollution. World Health Organisation, Regional Office for Europe, Copenhagen, Denmark.
WHO (2011) Global Health Observatory Map Gallery: www.who.int, World Health Organization.
Wolseley P.A., James P. W., Theobald M. R. & Sutton M.A. (2006) Detecting changes in epiphytic lichen communities at sites affected by atmospheric ammonia from agricultural sources. The Lichenologist 38: 161-176.
Zaehle S., Ciais P., Friend A.D. & Prieur V. (2011) Carbon benefits of anthropogenic reactive nitrogen offset by nitrous oxide emissions. Nature Geoscience 4, 601-605.
Zhang X., Zhang P., Zhang Y. Li X. & Qiu H. (2008) The trend, spatial & temporal distribution and sources of tropospheric NO2 over China based on satellite measurement during 1997 to 2006. Proc. Dragon 1 Programme Final Results 2004–2007, Beijing, P.R. China, 21–25 April 2008 (ESA SP-655, April 2008)
Our Nutrient World_reflowed.indd 51 30/01/2013 10:27:03

52 global overview on nutrient management
5 Weighing up the benefits and costs of nutrient management activitiesEnvironmental costs of nutrient use are substantial
Theoretically, the effect of a change in nutrient manage-ment on human welfare can be determined by compar-ing the social costs and benefits. The social costs are the resources a society has to give up when changing nutri-ent management, e.g. the cost of an investment in sew-age treatment or the income lost in agriculture if mineral fertilizer use is limited. By contrast, the social benefits are all effects that contribute positively to human welfare, e.g. the protection of threatened species or avoiding negative health impacts of NOx emissions. A change in nutrient management will only lead to a net improvement in hu-man welfare if the sum of the social benefits exceeds the sum of the social costs.
For this reason, decision makers increasingly demand that decisions are informed by an assessment of the social costs and benefits of nutrient management and pollution mitigation options.
5.1 Estimating the health benefits compared with the abatement costs for air pollution scenarios.The use of cost-benefit assessment (CBA) is currently most prominent for decisions on air pollution policies in the US and the EU. In addition to pollution associ-ated with SO2 and black carbon emissions, the pollution
includes costs from NOx and NH3 emissions, given their contribution to NO2 concentrations, ground level O3 and particulate matter (Chapter 4). The estimated costs and benefits of different ambition levels for air pollution mitigation options in Europe are shown in Figure 5.1 (Holland et al., 2011). Although the benefits of several of the policy packages to meet health standards tend to outweigh mitigation cost by more than one order of mag-nitude, experience shows that policy makers are often still reluctant to impose restrictive air pollution regulation be-cause of concerns over competitiveness and employment (Birch et al., 2011; Reis et al., 2012). For example, the re-cent agreement to reduce European emissions under the Gothenburg Protocol for NH3 negotiated in May 2012 is much less than the reductions indicated as appropri-ate by CBA, and, for the EU, represents only 2% further reduction from the present emissions of 2010 (Sutton et al., 2013). For NOx the negotiated ceilings are more ambi-tious and in accordance with cost-benefit considerations, despite the marginal costs of NOx mitigation being higher compared with those for NH3.
Figure 5.1a shows the costs and benefits relative to the baseline pollution forecast for 2020 of four scenarios that were considered by policy makers. On the extreme right hand side the maximum feasible reduction (MFR) scenario shows results when all technical abatement
7 Efforts to estimate the full societal costs and benefits of nutrients and nutrient pollution are still in their infancy. Nevertheless, available studies show that nutrient pollution has major societal costs which can be com-parable with the direct economic benefits of nutrient use.
7 Detailed knowledge is available on the economics of particular sectors, such as agriculture and electricity generation, from which it is possible to estimate the private economic optima. By contrast, it is a challenge to incorporate (internalize) all relevant costs and benefits of such activities, especially the social costs of environ-mental nutrient pollution, so as to estimate the economic optima from the perspective of society.
7 Available studies show that environmental and health costs associated with nutrient pollution are often much larger than the cost of measures to abate these pollutants. This indicates substantial opportunities for efforts to reduce nutrient pollution while contributing to human welfare.
7 The costs of reactive nitrogen (Nr) air pollution have been estimated to be particularly large, accounting for over 50% of estimated social costs of Nr pollution in Europe, with the total costs estimated at 1-4% of gross domestic product, especially related to effects on human health and ecosystems, with smaller costs associated with Nr effects on climate, given the existence of both warming and cooling components.
7 The global social cost of nutrient pollution has not yet been assessed comprehensively, and will inevitably be subject to many uncertainties. Nevertheless, the annual global loss of ecosystem services, including damage to fisheries from coastal N and P pollution related hypoxia alone, has been estimated at 170 billion US dollars, while a preliminary global social cost for all forms of N pollution is here estimated at 200 to 2000 billion US dollars annually.
7 Making better use of nutrients, including the reduction of losses and waste, will reduce these pollution threats, while improving food and energy production and making a significant contribution to the development of ‘green economies’.
Our Nutrient World_reflowed.indd 52 30/01/2013 10:27:03

53global overview on nutrient management
measures treated in the modeling were applied. The Low, Mid and High scenarios show, respectively, the costs and benefits of ‘closing the gap’ for health impacts between the baseline and MFR scenarios by 25%, 50% and 75%. In all cases, total benefits are substantially higher than total costs. Figure 5.1b shows the same data, but highlights the change in costs and benefits from scenario to scenario in order to approximate a marginal analysis. The benefits for each scenario are similar in this case, reflecting the even steps (25%, 50%, 75% improvement in potential health outcome) towards MFR, whilst scenario costs increase as more expensive measures are brought in. This marginal analysis pinpoints more precisely the point at which costs start to exceed benefits: in this case, at a point around the High scenario. This is well beyond the emission ceilings agreed in the revision of the Gothenburg Protocol, which (depending on variation in the national interpretation of the baseline) can be considered as being closest to the original Low scenario.
5.2 Widening cost-benefit analyses for nutrient pollutionThe example of air pollution effects of Nr emissions il-lustrates some of the challenges in the application of CBA for nutrients. In theory, the socially optimal level of Nr use is found where the marginal social cost equals the marginal social benefits. In particular, such CBA for economic development, agricultural and environmental policies should also take into account the costs and ben-efits of all related effects, such as on ecology and climate. In view of the complexity of nutrient cycles, in practice it is a difficult task to determine all human welfare effects of changing nutrient management. The air pollution ex-ample above shows that it is not necessary to quantify all effects through to monetization in order to demon-strate that significant improvements in environmental quality reflect the interests of society. The challenge is therefore to identify and quantify the most significant components.
A CBA conducted for the Chesapeake Bay area of the eastern United States offers another example that consid-ers a somewhat wider range of cost items (Birch et al., 2011; Compton et al., 2011). In this case, both effects of atmospheric N emission/deposition and direct releases of Nr to terrestrial and aquatic ecosystems were considered. The total emission of NOx and NH3 to the Chesapeake watershed in 2005 was estimated at 280 and 110 kt N, re-spectively. The N load to Chesapeake Bay was estimated at 116 kt N, of which 92 kt came from atmospheric deposi-tion and 24 kt from run-off. The total cost of Nr pollution in 2005 was calculated at 9.3 billion US dollars per year, of which around 80% was related to health costs from air pollution and 20% from loss of marine recreation.
An economic impact assessment of policy measures to prevent and mitigate the harmful effects resulting from Nr use requires assessment of all the welfare effects of these measures. The most comprehensive CBA to date was car-ried out for the EU in the European Nitrogen Assessment, which estimated the total cost of N pollution for the year 2000 at 70-320 billion euro (Brink et al., 2011). Costs re-lated to loss of human health and premature deaths con-tributed 60%, ecosystem damage 35% and global warming 5%. An update of this CBA for 2008 also integrated both the climate warming and cooling effects of Nr and dam-age to marine ecosystems by N deposition (Grinsven et al., 2013). Although N emission in 2008 was about 15% lower than in 2000, the revised cost estimate was 75-485 billion euro and somewhat higher than for 2000 (Figure 5.2). This cost corresponds to an estimated welfare loss of 0.6-4 % of the gross domestic product (GDP). In the revised estimates, ecosystem damage is the dominant cost item, contributing 60% to the estimated total cost. Within the range of uncertainties, the present cooling benefits of NOx and NH3 roughly balance the warming costs of N2O.
The marginal costs of Nr for human health by NOx and NH3 in the European estimates (Brink et al., 2011; Grinsven et al., 2013) are comparable to those estimated for Chesapeake Bay (Birch et al., 2011). It may be noted that the European Nitrogen Assessment did not include
Figure 5.1 Cost and benefits for increasing levels of air pollution mitigation in Europe, including the European Union, Eastern European and other countries (Holland et al., 2011). (a) total costs and benefits relative to the baseline; (b) approximated marginal costs and benefits, calculated as the increment between scenarios.
a) b)
0
20,000
40,000
60,000
80,000
100,000
120,000
140,000
Low Mid High MFR
Ann
ual c
ost
or b
enefi
t (i
n m
illio
n €) Benefits
Costs
0
10,000
20,000
30,000
40,000
50,000
60,000
Low Mid High MFR
Ann
ual c
ost
or b
enefi
t (i
n m
illio
n €) Benefits
Costs
Our Nutrient World_reflowed.indd 53 30/01/2013 10:27:04

54 global overview on nutrient management
estimated welfare loss due to loss of recreational value (Birch et al., 2011; Pretty et al., 2003), but this turns out to be a minor cost item.
These comprehensive estimates contain quantified un-certainties that reflect both the dose response functions and the monetization procedures (Grinsven et al., 2013). However, even accounting for the uncertainty ranges shows that there are major benefits to be expected as a result of reducing Nr and P pollution. Since actions to re-duce losses of these pollutants also have significant value as a nutrient resource, it is clear that there are many op-portunities to explore approaches to reduce Nr and P pol-lution that are of net financial benefit for society, and in many cases also of private economic benefit to the pollut-ing source sectors.
The examples given so far focus on air and water pol-lution, especially in relation to nitrogen in Europe and North America. The challenges of valuation become even harder at global scale, and when considering the multiple nutrients. In the case of the global scale, methodologies such as the ‘willingness to pay’ approach become much harder to implement because of diverse economic and so-cial situations. Providing a comprehensive global analysis of nutrient costs and benefits must therefore be a chal-lenge for future work.
While recognizing the uncertainties and difficulty of assessing economic impacts, first attempts to value the damage caused by nutrient pollution in the worlds coastal zones based on impacts to fisheries, recreation and nutri-ent cycling have been done for hypoxia. Regionally, esti-mated losses to resources and to marine related industries can be sudden and costly. For example, in the summer of 1976 the first recorded hypoxia event occurred in the New York Bight over an area of about 1,000 km2. Mass mortal-ity of fisheries stocks occurred with losses estimated to be over 570 million US dollars (Figley et al., 1976). Factored by the area of hypoxia this one event cost about $580,000 per km2 for resources and fisheries related activities, at that time. This was a one-time event from which it took
at least five years for surf clam populations to recover, but annual hypoxia can lead to annual losses in fisher-ies. For example, Huang et al. (2010) found that hypoxia reduced annual harvest in the brown shrimp fisheries of North Carolina valued at about 1.2 million dollars annu-ally by 13%. Economic valuation of losses from hypoxia seem small relative to the total value of fisheries, but the key point is that losses from hypoxia are measureable in economic terms (Huang & Smith, 2011). Experience with other hypoxic zones around the globe shows that both ecological and fisheries effects become progressively more severe as nutrient additions increase and hypoxia worsens (Diaz, 1995; Caddy et al., 1993). This would lead one to believe that at some point economic losses will become more obvious and costly. If all the ecosystem services al-tered or lost to global nutrient pollution driven hypoxia are considered, for the marine environment alone the costs are estimated to be on the order of 170 billion US dollars per year, which amounts to about a 0.5% of the average of all global ecosystem services (Costanza et al., 1997; Diaz, 2013). Most of this loss is in the key ecosystem service of nutrient recycling in coastal waters. Overall, eu-trophication and hypoxia are just two of many stressors that are a looming ‘perfect storm’ threatening to serious-ly degrade ecosystem services we have come to depend upon.
5.3 Internalizing environmental costs in agricultureIt is useful to compare the environmental costs of nutri-ent pollution with the benefits, and this can be illustrated by the case of nitrogen use in agriculture. About half of the environmental damage cost of Nr in the EU is related to emissions from agricultural sources, particularly NH3 emissions from manures and nitrogen leaching from fer-tilized fields. Current cost estimates range between 35-230 billion Euro per year (based on 2008). These estimates exceed the direct estimated benefit of N fertilization of
Figure 5.2 Costs and benefits of emissions of nitrogen to the environment in the EU27 in 2008 (Grinsven et al., 2013).
Our Nutrient World_reflowed.indd 54 30/01/2013 10:27:04

55global overview on nutrient management
20-80 billion euro for the agricultural sector in the EU caused by increased primary production (Grinsven et al., 2013).
Incorporating (internalizing) the environmental costs of nitrogen fertilization would offset N recommenda-tions in intensively fertilized regions in Europe and North America by up to 50 kg per hectare below the economic optimum of the farm business (Brink et al., 2011; Grinsven et al., 2013; Blottnitz et al., 2006). In this way a distinc-tion can be seen between the ‘private economic optimum’ of a farm business (which receives income from produce produced, but only shares a small fraction of the environ-mental cost) and the ‘public economic optimum’ (which equally shares the benefit of the produce and all the en-vironmental costs). Legal enforcement of N fertilization below the private economic optimum towards the public economic optimum is still rarely applied. In Europe, only Denmark, the Netherlands and the Flemish region have implemented such N application standards for crop–soil combinations prone to nitrate leaching (Grinsven et al., 2012).
One of the largest opportunities to increase net societal welfare by Nr mitigation is estimated to be the reduction of NH3 volatilization from livestock operations, manure and mineral fertilizer application. This is illustrated by Figure 5.3, which compares the benefits and costs of N use in agriculture, considering the direct benefits of N use in European crops and livestock farming, as well as the esti-mated added value generated in the agro industry, with the environmental damage costs of NH3 and other agricultural Nr emissions (including N2O, NOx and Nr leaching). Even when taking into consideration the added-value generated in the livestock industry, the damage cost by Nr emissions constitutes a considerable welfare loss.
5.4 Challenges to estimate nitrogen damage costs globallyAs a first approach, the costing procedure used for the EU by the European Nitrogen Assessment could be used to
estimate the global cost of multiple forms of Nr pollution. Estimates of the effect causing N fluxes at the global scale (Galloway et al., 2004; Bouwman et al., 2011) indicate that global anthropogenic NOx and NHy emission are 4-5 times those in the EU, and emission to riverine systems 6-7 times those in the EU. If assumptions on dose response relations for N emissions to effects, and monetary value of effects in the EU would be globally applicable, a first esti-mate of the global cost of N pollution would be about 4-7 times that in the EU, and therefore 300-3000 billion euro. However, monetization in the EU analysis was based on willingness-to-pay of citizens to reduce health risks, to re-store damaged ecosystems and to reduce greenhouse gas emission. This willingness-to-pay for these goods depends on income, as was demonstrated in a cost benefit study for the Baltic sea (Söderqvist & Hasselström, 2008). The an-nual Gross National Income (GNI, corrected for purchase power) per capita for the countries surrounding the Baltic Sea ranges between 6,500 euro in Russia to 24,000 euro in Denmark. The GNI dependence is different per cost item, and less for health costs. However, also when looking at the total cost of N per EU member state, the dependence on GNI is maintained (Figure 5.4). Looking at the global scale, the GNI for the most populous countries India and China are respectively 3,000 and 6,000 international euro per year and compare to the countries with the lowest GNI in the EU (UNDP, 2013).
Taking into account the dependence of welfare loss due to N damage on GNI, the global cost of N damage would be around three times the cost in the EU, at 150 to 1500 billion euro per year (200 to 2000 billion US dollars). This cost would tend to increase in time as global GNI increases. Although this estimate appears to be broadly consistent with the independently estimated loss of coast-al fisheries and ecosystem services due to nutrient pol-lution driven hypoxia (about 170 billion US dollars per year; Diaz et al., 2013) it is evident that these preliminary numbers need to be followed up in much greater detail.
For comparison with these values, the economic value of food losses in affluent countries can be estimated at 0.5
Figure 5.3 Nitrogen costs caused by the European livestock sector in 2000 as compared to added value generated in the primary sector and the livestock processing industry (original graphic based on Grinsven et al., 2013).
Our Nutrient World_reflowed.indd 55 30/01/2013 10:27:04

56 global overview on nutrient management
to 1.0% of GDP. In the UK, for example food losses are estimated to be 12 billion GB pounds (Quested & Parry, 2011), to be compared with a GDP of 1747 billion euro, and therefore representing around 0.6% of GDP. For the US, food losses and waste have been estimated at 166 bil-lion US dollars per year, representing 1.1% of GDP. These studies include only losses at the retail and consumer level. According to Dutch figures, food losses at the con-sumption side equate to 2.4 billion euro per year, while losses in the food chain equate to a further 2 billion euro. In total, this would mean a loss of 0.7% of GDP. In addi-tion to the direct costs of food losses, the costs of waste disposal and environmental damage should be added. On a household base, typical figures range from 500 GB pounds per household per year to 390 dollars per person per year in the USA. At the global level, it is estimated that about one-third of all edible food produced for hu-man consumption is wasted per year (Buzby & Hyman, 2012; Gustavsson et al., 2011). Assuming that in many developing countries food forms 20-40% of the economy, this one-third loss would equate to 7-15% of GDP.
These estimates show a clear linkage with major eco-nomic costs associated with both environmental damage from nutrient pollution and loss and waste from nutrients and products in the food chain. While much more work is needed on linking the different aspects (water, air, climate, biodiversity, soil, fertilizer loss, food loss), it is clear that a more efficient management of global nutrient cycles has the potential contribute substantially to developing green economic prosperity.
References Birch M.B.L., Gramig B.M., Moomaw W.R., Doering III O.C.
& Reeling C.J. (2011) Why metrics matter: Evaluating policy choices for reactive nitrogen in the Chesapeake Bay water-shed. Environ. Sci. Technol. 45, 168-174.
Blottnitz H. von Rabl A., Boiadjiev D., Taylor T. & Arnold S. (2006) Damage costs of nitrogen fertilizer in Europe and their internalization. J. Environ. Plann. Manage., 49, 413-433.
Bouwman L., Goldewijk K.K., van der Hoek K.W., Beusen A.H.W., van Vuuren D.P. Willems J., Rufino M.C. & Stehfest E. (2011) Exploring global changes in nitrogen and phos-phorus cycles in agriculture induced by livestock production over the 1900–2050 period. Proc. Natl. Acad. Sci. US 109 (16), 6348-6353.
Brink C., van Grinsven H., Jacobsen B.H., Rabl A., Gren I.-M., Holland M., Klimont Z., Hicks K., Brouwer R., Dickens R., Willems J., Termansen M., Velthof G., Alkemade R., van Oorschot M. & Webb J. (2011) Costs and benefits of nitrogen in the environment,. In The European Nitrogen Assessment. (Eds. Sutton M.A., Howard C.M., Erisman J.W., Billen G., Bleeker A., Grennfelt P., van Grinsven H.J.M. & Grizzetti B.), pp 513-540. Cambridge University Press, Cambridge, U.K. and Supplementary material. http://www.nine-esf.org/sites/nine-esf.org/files/ena_doc/ENA_pdfs/ENA_c22.pdf and /ena_doc/ENA_supp/ENA_supp_c22.pdf
Buzby J.C. & Hyman J. (2012) Total and per capita value of food loss in the United States. Food Policy 37: 561-570. http://ucce.ucdavis.edu/files/datastore/234-2425.pdf
Caddy J.F. (1993) Towards a comparative evaluation of human impacts on fishery ecosystems of enclosed and semi-enclosed seas. Review of Fisheries Science 1, 57-95.
Compton J.E., Harrison J.A., Dennis R.L., Greaver T.L., Hill B.H., Jordan S.J., Walker H. & Campbell H.V. (2011) Ecosystem services altered by human changes in the nitrogen cycle: a new perspective for US decision making. Ecology Letters 14, 804–815.
Costanza R., d’Arge R., de Groot R., Farber S., Grasso M., Hannon B., Naeem S., Limburg K., Paruelo J., O’Neill R.V., Raskin R., Sutton P. & van den Belt M. (1997) The value of the world’s ecosystem services and natural capital. Nature 387, 253–260.
Diaz R.J., Hagg, H.E. & Rosenberg R. (2013) The importance of oxygen to the worth of our oceans (in press).
Diaz R.J. & Rosenberg R. (1995) Marine benthic hypoxia: a review of its ecological effects and the behavioural responses of beiithic macrofauna. Oceanography and Marine Biology 33, 245-303.
Figley W., Pyle B. & Halgren B. (1979) Socioeconomic impacts, in: R L. Swanson & C. J. Sindermann (Eds) Oxygen Depletion and Associated Benthic Moralities in New York Bight,
GNI2000 (keuro/cap in PPP (Purchasing Power Parity))
WTP
to
tal N
dam
age
(keu
ro/c
ap)
0 5 10 15 20 25 30
0.0
0.2
0.4
0.6
0.8
1.0
Figure 5.4 Relationship between willingness-to-pay (WTP) to prevent or restore nitrogen damage with Gross National Income for year 2000 (GNI 2000) for the EU27 (original graphic).
Our Nutrient World_reflowed.indd 56 30/01/2013 10:27:05

57global overview on nutrient management
1976. NOAA Professional Paper No. 11, pp. 315-322. US Government Printing Office, Washington, DC.
Galloway J.N., Dentener F.J., Capone D.G., Boyer E.W., Howarth R.W., Seitzinger S.P., Asner G.P., Cleveland C.C., Green P.A., Holland E.A., Karl D.M., Michaels A.F., Porter J.H., Townsend A.R. & C.J. Vörösmarty. (2004) Nitrogen cy-cles: past, present, and future. Biogeochemistry 70, 153–226.
Grinsven H.J.M. van, Jacobsen B.H., Holland M.A., Klimont Z., Sutton M.A. & Willems W.J. (2013) Costs and benefits of nitrogen for Europe and implications for mitigation. Environmental Science and Technology (under revision).
Grinsven H.J. M., van ten Berge H. F. M., Dalgaard T., Fraters B., Durand P., Hart A.; Hofman G., Jacobsen B. H., Lalor S. T. J., Lesschen J. P., Osterburg B., Richards K. G., Techen A.-K., Vertès F., Webb J. & Willems W. J. (2012) Management, regulation and environmental impacts of nitrogen fertiliza-tion in Northwestern Europe under the Nitrates Directive; a benchmark study. Biogeosciences Discuss. 9, 7353-7404.
Gustavsson J., Cederberg C., Sonesson U., van Otterdijk R. & Meybeck A. (2011) Global food losses and food waste. UN Food and Agriculture Organization. http://www.fao.org/docrep/014/mb060e/mb060e00.pdf
Holland M., Wagner, A., Hurley, F., Miller, B. and Hunt, A. (2011) Cost Benefit Analysis for the Revision of the National Emission Ceilings Directive: Policy Options for revisions to the Gothenburg Protocol to the UNECE Convention on Long-Range Transboundary Air Pollution. Report to the European Commission. http://ec.europa.eu/environment/air/pollutants/pdf/Gothenburg%20CBA1%20final%202011.pdf.
Huang L., Smith M.D. (2011) Management of an annual fishery in the presence of ecological stress: The case of shrimp and hypoxia. Ecological Economics 70, 688–697.
Huang L., Smith M.D. & Craig, J.K. (2010) Quantifying the economic effects of hypoxia on a fishery for brown shrimp Farfantepenaeus aztecus. Marine and Coastal Fisheries: Dynamics, Management, and Ecosystem Science 2, 232–248.
Pretty J.N., Mason C.F., Nedwell D.B., Hine R.E., Leaf S. & Dils R. (2003). Environmental costs of freshwater eutrophica-tion in England and Wales. Environ. Science & Technol., 37, 201-208.
Quested T. & Parry A. (2011) New estimates for house-hold food and drink waste in the UK. WRAP, Banbury, UK. http://www.wrap.org.uk/content/new-estimates-household-food-and-drink-waste-uk
Reis S., Grennfelt P., Klimont Z., Amann M., ApSimon H., Hettelingh J.P., Holland M., LeGall A.C., Maas R., Posch M., Spranger T., Sutton M.A. & Williams M. (2012) From Acid Rain to Climate Change. Science 338, 1153-54.
Söderqvist T. & Hasselström L. (2008) The economic value of ecosystem services provided by the Baltic Sea and Skagerrak. The Swedish Environmental Protection Agency, Stockholm, Sweden.
Sutton M.A., Reis R., Riddick S.N., Dragosits U., Nemitz E., Theobald, M.R. Tang Y.S., Braban C.F., Vieno M., Dore A.J., Mitchell R.F., Wanless S., Daunt F., Fowler D. Blackall T.D., Milford C. Flechard C.R., Loubet B., Massad R., Cellier P., Coheur P.F., Clarisse L., van Damme M., Ngadi Y., Clerbaux C., Skjøth C.A., Geels C., Hertel O., Wickink Kruit R., Pinder R.W., Bash J.O., Walker J.D., Simpson D., Horvath L., Misselbrook T.H., Bleeker A., Dentener F. & Wim de Vries (2013). Toward a climate-dependent paradigm of ammonia emission & deposition. Phil. Trans. Roy. Soc. London. B. (under review).
UNDP (2013) United Nations Development Program: http://hdr.undp.org/en/data/explorer/
Our Nutrient World_reflowed.indd 57 30/01/2013 10:27:05

58 global overview on nutrient management
6 Practical options to reduce adverse effects by improving nutrient use
6.1 IntroductionThe nutrient system and definitionsThere is a wide range of available options to improve our management of nutrients. Given the diversity of different nutrient sources which lose part of their Nr, P and other nutrients into the environment, and given the many stag-es of nutrient loss, it is important to recognize that there
is no single solution. A package of measures is therefore needed that addresses the different loss terms, together building up a comprehensive picture of the system as a whole.
Figure 6.1 provides one way to visualize this wider pic-ture, as it summarizes the main N and P flows in two main component pathways. These may be called the agri-food pathway and the energy-transport pathway. In both cases
We identify ten key actions as being central to improving nutrient use efficiency, thereby improving food and energy production, while reducing N and P losses that pollute our environment.
Agriculture1. Improving nutrient use efficiency in crop production,2. Improving nutrient use efficiency in animal production,3. Increasing the fertilizer equivalence value of animal manure,
Transport and Industry4. Low-emission combustion and energy-efficient systems, including renewable sources,5. Development of NOx capture and utilization technology,
Waste and Recycling 6. Improving nutrient efficiency in fertilizer and food supply and reducing food waste,7. Recycling nitrogen and phosphorus from waste water systems, in cities, agriculture and industry,
Societal consumption patterns8. Energy and transport saving,9. Lowering personal consumption of animal protein among populations consuming high rates
(avoiding excess and voluntary reduction),
Integration and optimization10. Spatial and temporal optimization of nutrient flows.
7 These actions must be seen in the context of the wider N and P cycles, considering acquisition, use and recycling. Efforts are needed to improve the nutrient use efficiency (NUE) of each stage, such as in crop and animal pro-duction. We emphasize especially the need to address the ‘full-chain NUE’ for Nr and P, defined as the ratio of nutrients in final products (e.g., human food consumed) to new nutrient inputs (e.g., Haber-Bosch Nr, biological N fixation, NOx formation, mined P and N)
7 Each of the component efficiencies contribute to the full-chain NUE. Actions promoting the recycling of avail-able Nr and P pools, such as effective recycling of animal manures, human sewage and NOx capture and utiliza-tion technology all contribute to increasing full-chain NUE. The options include many technical measures, such as improved placement and timing of mineral fertilizers and organic manures, the use of manure storage and spreading methods that reduce emissions, and the processing of manures into more efficient fertilizers.
7 Our choices as citizens make a big difference. While some remain undernourished, people in many countries eat more animal products than is optimal for a healthy diet. Avoiding over-consumption of animal products increases full-chain NUE, reducing N and P pollution, while benefiting our health.
7 The key actions highlighted here emphasize both the necessary technical measures and the consumption choices made by citizens, especially in high consumption regions of the world. However, if future economic growth and a sustainable environment are to be compatible, this will only be achieved by motivating a change in the core aspirations of these societies.
7 This will require a move away from aspirations for maximum consumption, towards patterns of optimized con-sumption; it is the challenge to transform from ‘Homo consumus’ to ‘Homo optimus’, with a demonstrated im-provement in health and quality of life, while meeting the needs of the world’s poorest.
Our Nutrient World_reflowed.indd 58 30/01/2013 10:27:05

59global overview on nutrient management
the loss of nutrients to the environment can be represent-ed as follows:
Nutrient pollution loss = per capita nutrient use7x popula-tion7x (1 – full-chain NUE)
where the last term is the Nutrient Use Efficiency of the full chain, being the fraction of nutrients reacting the in-tended products for human use as compared with the to-tal of all new nutrient inputs. In the case of Nr:
Full-chain NUEN = (N in food and durable products)/(Industrial N production + Biological N fixation + Combustion source NOx formation)
In practice, several variant definitions may be used in cal-culating full-chain NUE, for example based on availability of data to estimate food supply or actual food consumed. Since food is wasted between purchase and actual con-sumption, the two values will differ. The important thing to note, however, according to the definition given here, is that animal manures and atmospheric deposition are not considered explicitly as inputs. The reason for this is that these represent intermediate stages in the chain, neither being new Nr sources nor the ultimate intended product, but rather components of recycled Nr within the system. However, the efficiency by which manures and at-mospheric deposition is used still makes a difference to the estimated full-chain NUE. By improving the recycling of these nutrient sources, more of the ultimately intended products (food, fuel, materials for humans) are obtained from the same level of new nutrient inputs, thereby im-proving the efficiency of the whole system.
In the same way as for manures, total N in harvests is also not explicitly represented in the full-chain NUE ap-proach, since much of this does not directly represent the ultimate goal of feeding people, but instead is used to feed livestock. The inclusion of livestock in the system lengthens the nutrient chain considerably, increasing the opportunities for losses of nutrients from the intended pathway. Improving the efficiency of each of the compo-nent stages therefore contributes to improving the NUE of the full-chain.
It is important to recognize that the full system in-cludes both industrial Nr production for agriculture and other products (such as munitions and many other chem-ical products, including plastics), and the formation of NOx from combustion processes. The NOx produced in this way has an extremely low NUE across the full chain, as it is released directly into the air. Only part of this Nr is ultimately deposited to cropland, contributing addi-tional fertilizer equivalent (which must be off-set against the linked crop-loss from associated O3 pollution, Section 4.2). In this way, just a small fraction of the NOx emission to air finds its way into food, wood and bioenergy prod-ucts, with the coupled effects of O3 pollution cancelling out much of this benefit. Options that improve the recap-ture and recycling of NOx have the potential to improve
full chain NUE as part of package that considers all Nr sources. Full-chain NUE thus offers a paradigm where one term is used as a pointer to the system as a whole, maximizing flexibility and local choice within a wider strategic framework.
It is relevant to compare the full-chain NUE approach with the component parts of the system. A classical ap-proach to considering NUE in crop production is shown in Figure 2.6 (‘crop NUE’). Here the aim is to maximise the amount of nutrients reaching the harvests of arable and grass crops (including grazing systems) as compared with the nutrient inputs from all nutrient sources. A similar ap-proach can be considered for animal production, consid-ering the nutrients in animal products compared with the nutrients consumed. In each case, there are many options available to improve such these component NUE terms.
The use of both the full-chain and component NUE indicators serves complementary functions. Each of the component terms can be useful for setting efficiency and recycling objectives within different sectors, such as indus-try, transport, arable farming, livestock farming and waste water management. In this way benchmarking of perfor-mance can allow the comparison of systems and the ba-sis to consider targets for improvement. Complementing these component approaches, the full-chain NUE indi-cator is especially useful at national and regional scales, enabling decision makers to see the overall picture, and consider how different sectors can contribute to improv-ing NUE in an international context.
The green economy, consumption choices and future challengesIn considering the full system outlined above and in Figure 6.1, it may be noted that we have not directly pri-marily focused the options on reducing emissions. By em-phasizing nutrient use efficiency, we highlight that N, P and other nutrients are a valuable and extremely precious resource. Making better use of this resource with im-proved recycling provides many cost-saving opportuni-ties, such as reducing the outlay on purchased fertilizers, and developing markets for new fertilizer products (e.g. from recycled nutrient streams and capture of NOx from combustion sources). At the same, time, there are many other opportunities for developing the ‘nutrient green economy’, such as in upscaling the existing technologies, as well as developing new ones, that make better manage-ment of nutrient resources.
By focusing on NUE, our intention is therefore to foster an awareness of the economic opportunities for different economic sectors of improved nutrient management. At the same time, we are aware of the substantial economic implications of the nutrient losses themselves, for human health, environmental quality and climate, as outlined in Chapters 4 and 5. Because it becomes less clear who pays for the loss of ecosystem quality or adverse effects on human health that arise from nutrient pollution, these costs are often treated as ‘externalities’, meaning that they are not included as part of economic balance sheets. As
Our Nutrient World_reflowed.indd 59 30/01/2013 10:27:05

60 global overview on nutrient management
shown in Chapter 5, the huge magnitude of these adverse effects of nutrients on health, ecosystems and climate, provides a major additional incentive for good nutrient management. Even for those, not willing or able to in-clude these environmental costs in their balance sheets, the core message of improving NUE provides a basis from which all economic sectors can benefit.
There are nevertheless many situations where a certain measure to improve NUE is not yet financially attractive to an actor in the nutrient management chain. Even if they count the financial benefit of all the nutrients saved, and all the co-benefits for other issues (e.g. carbon, other products produced, benefits of a more efficient operation overall etc), as well as their private exposure to the adverse effects of nutrient pollution, some management options may still not be financially beneficial under current condi-tions. This is often expected, given the classical paradigm of the ‘tragedy of the commons’ (Hardin, 1968; Feeney et al., 1990), where an actor may receive all the benefits of his actions to utilize a given resource, while only suffer-ing a small fraction of the adverse effects of those actions, which are shared by society as a whole. Under this situ-ation, it becomes the responsibility of society as a whole (i.e., governments, civil society and multilateral forums) to balance the full set of costs and benefits. The options in
this situation include both regulatory and economic mea-sures (including financial support, levies and taxation). The status of current policies and barriers to change are considered in Chapter 7.
Ultimately, governments are to a large extent influ-enced by the views of individuals, from national leaders to the citizens of their countries. Decisions by governments related to nutrient management can in many cases only be made where there is sufficient popular support or where governments can see an economic advantage. This points to the critical importance of making citizens aware of the global nutrient challenge and of the importance of their own actions. While they can play a vital role in empow-ering their governments to take action through policies, citizens play an even more direct role in the nutrient chal-lenge through their everyday consumption choices.
The extent of these consumption choices by citizens varies widely across the world. For many, malnourish-ment and poverty limit their choices while their an-nual consumption of nutrients is very low. However, for many others, their daily lives produce and consume ex-tremely high amounts of nutrients which are lost to the environment.
The equation above and Figure 6.1 show how the glob-al system of nutrient supply is particularly driven by two
Unintended N fixation in combustion
NOx capture & reuse
NUE combustion 5
Humans
Nr input by combustion
Energy Consumption & Transport
Choices
4
En
8
Full Chain NUEN,P Nutrient Resource
N&P Fertilizer
& Biological Nitrogen Fixation
Manure & sewage
fertilizer products
NUE sewage NUE sewage NUE manures es
3
7
Feeds harvest
Livestock production
Food harvest
NUE feed crop
NUE food crop
NUE animal
Food Consumption
& Diet Choices
NUE food supply
Humans
1
pr2
1
6 9
Con
HumansHumans
Crop NUEN,P
10
Spatial optimization & integration
Figure 6.1 Nutrient flow can be seen as a cycle from resource through the stages of use (blue arrows) with recycling (green arrows). The system is driven by the ‘motors’ of human consumption. Numbered circles highlight ten Key Actions to increase Nutrient Use Efficiency (NUE) as described in this chapter (original graphic).
Our Nutrient World_reflowed.indd 60 30/01/2013 10:27:06

61global overview on nutrient management
motors: a) Food consumption and dietary choices and b) Energy consumption and transport choices. In the case of transport, measures to reduce NOx emissions per ve-hicle mile by use of ‘catalytic converters’ (which reduce NOx to N2) have been offset substantially by an ongoing increase in the miles travelled by vehicles each year: per-sonal consumption choices are in many cases outweigh-ing the benefits of technological improvement. The same is happening with dietary changes. As citizens in devel-oping countries increasingly adopt the diets characteristic of developed countries, per capita consumption of animal products is increasing. Combined with increases in popu-lation, this is in many cases outstripping the implementa-tion of more efficient N and P practices in the agri-food pathway.
To address both these issues, it is of fundamental im-portance that the options to improve global nutrient management include both the wide range of technical measures across source activities and industries, and op-tions to address behavioural change by citizens concern-ing their consumption choices.
In this discussion, it should be made clear that there can be no intention to reduce consumption rates by the poorest in society. Rather, this is a challenge that par-ticularly focuses on the leaders and high-rate consumers, whose lifestyles and consumption choices many in the world seek to emulate. The development of new attitudes is essential as future scenarios are contemplated, as these will depend especially on the extent to which the aspira-tions of many citizens for high consumption (transport, energy, high N food products) are able to be met under future economic development.
If it is agreed that that global economies should grow as a foundation for financial prosperity, then to avoid the en-vironmental, health and climate costs of associated with N and P pollution, it will become even more essential that the future trajectories of citizens’ personal nutrient con-sumption rates are considered.
Most fundamental of all, new ways will need to be found that point to a more sophisticated set of aspirations for the world’s citizens. While many citizens currently as-pire to patterns of very high levels of consumption, we note that this also links to adverse health effects, as well as to environmental degradation and climate change. A more sophisticated set of aspirations must therefore em-phasize how the lives of all can be enhanced by allowing the poorest to increase their food and other nutrient con-sumption, while the richest realise for themselves that it is not in their own interests to over-consume.
To do this, a much stronger emphasis of targets or ranges for optimal consumption will be needed – to help citizens to know where to aim. And with that comes an even bigger challenge – to find ways for citizens to find this ‘aiming for optimum’ to become exciting. For surely it is an incredibly exciting challenge if today’s ‘Homo consu-mus’ is eventually to evolve into ‘Homo optimus’.
In the following sections we consider further the op-tions, describing 10 Key Actions that can contribute to
better nutrient management with particular focus on the N and P cycles.
6.2 Key Actions for AgricultureKey Action 1: Improving nutrient use efficiency in crop productionImplementing a ‘Five-element strategy’Improving nutrient use efficiency in crop production is a ‘win-win’ strategy, as it aims at increasing crop production and optimizing the use of external resources. It thereby contributes to food security and to minimizing nutrient losses and eutrophication. Nutrient use efficiency (NUE) can be defined in various ways (e.g. IFA, 2007). Here we define crop NUE simply as ‘the ratio of nutrients in har-vested crop products to the total nutrients applied’ (on a weight for weight basis). Improving crop NUE requires a well-thought-out strategy with an integrated, site-specific set of actions, supported by education and training of farmers and advisors and targeted research.
Research organizations, advisors and the fertilizer in-dustry have gained a huge experience in strategies and practices to improve crop NUE during the last decades, summarized here in a ‘Five-element strategy’. The ele-ments include to:
7 Further develop and implement and the ‘4R Nutrient Management Stewardship developed by the fertilizer industry, i.e., the Right fertilizer, the Right amount, the Right time of application and the Right placement using low-emission application and precision place-ment methods. Implement 4R as function of site-specific conditions, and with full consideration of the available nutrients in soils, animal manures, crop residues and wastes.
7 Select the right crop cultivar, planted at right spacing and right time, within the right crop rotation.
7 Irrigate the crop whenever needed, using precision methods, such as drip irrigation, combined with soil water harvesting methods and soil conservation practices.
7 Implement integrated weed, pest and disease manage-ment measures to minimize yield losses while protect-ing the environment.
7 Reduce nutrient losses through site-specific mitiga-tion measures, including erosion control measures, cover crops, tillage management, best practices for fertilizer and manure applications, and buffer strips.
These actions are targeted to advisors and farmers, but must be supported by site-specific cultivars, tools, tech-nologies, and advice developed by the industry and re-search communities.
Monitoring programs have to be set-up using appro-priate indicators to assess the progress of the strategy tak-en. Nutrient budgeting, and yield, soil and water quality monitoring will be needed. Pointers of how to underpin the Five-element strategy are provided below.
Our Nutrient World_reflowed.indd 61 30/01/2013 10:27:06

62 global overview on nutrient management
Underpinning of the ‘Five-element strategy’Crop yields are determined by one or more critical growth factors that are in short supply. This is often illustrated with an old-fashioned water barrel, with staves of differ-ing length. The barrel’s capacity to hold water is then de-termined by the shortest stave. In a similar manner, crop yields are defined by (Van Ittersum and Rabbinge, 1997):1. crop yield determining factors (CO2 concentration,
temperature, genetic potential of the crop, planting density),
2. crop yield limiting factors (water and nutrient avail-ability), and
3. crop yield reducing factors (pests and diseases, weed infestations).
Potential yields are defined by the genetic potential of the crop, planting density, and the local CO2 concentra-tion and temperature. Near potential yields are only ob-tained when water and nutrients are sufficiently available throughout the growing season and when weed, pest and diseases are controlled (e.g., Denison, 2012).
Resource use efficiency of a factor is highest when all other limiting factors are near their optimum (De Wit, 1992). Hence, crop NUEN is highest when total N supply meets the N demand of a crop that is not limited by defi-ciencies of other essential nutrients and water, and where yield is not reduced by weed, pests and diseases (Mosier et al., 2004). The same holds for phosphorus use efficiency (NUEP): the highest values are obtained when all other growth factors are in the optimal range and the P supply just meets the demand of the crop. Hence, for high N and P use efficiency, all essential nutrient elements (N, P, K, Ca, Mg, S, Fe, Mn, Zn, Cu, B, Mo, Cl, and Ni (Na and Si have beneficial effects for some crops) need to be avail-able in adequate amounts during crop growth and devel-opment (Marschner, 2012).
Improving crop NUE therefore requires the optimiza-tion of all critical factors (IFA, 2007). For a given region, CO2 concentration, temperature and rainfall are defined, but selecting the appropriate cultivar and choosing the right planting density and time is of paramount impor-tance to be able to utilize the yield potential (e.g. Chen et al., 2011). Next, water and essential nutrients need to be supplied in adequate amounts, depending on the require-ments of the crop and the native supply from soil and atmosphere. Finally, appropriate crop husbandry with in-tegrated weed, pest and disease management can make a difference. Once critical factors are optimized, we must continue to improve the genetic potential of the crop, in-cluding physiological factors affecting NUE, through or-ganized, systematic plant breeding programs.
Experience shows that even technologically simple actions can make a key difference. For example, the lo-cal scale conversion of small urea granules or ‘prills’ into larger pellets (‘supergranules’) has been rolled out on a large scale in Bangladesh, where farmers apply the urea supergranules 5-7 cm below the soil surface by hand (or with a newly developed mechanical applicator) between
rice seedling. This ‘fertilizer deep placement’ approach increases incremental yield by 15-18 percent per ha over surface applied urea using approximately one-third less N (78 kg N/ha vs. 118 kg/ha). Recent results using fertil-izer deep placement of NPK briquettes has produced an additional 3-5 percent increase in incremental yield. This technology is estimated to reduce ammonia and other N losses substantially, significantly increasing nitrogen use efficiency (Savant and Stangel, 1990; IFDC 2012) (see Figure 6.2).
Nutrient use efficiency in practice is often low because of either shortages of one or more essential nutrients or oversupply of one or more nutrients. The first occurs too often in sub-Saharan Africa due to low soil fertility and lack of resources for buying fertilisers. Oversupply occurs too often in situations where fertilizers are subsidized, such as in China, and where livestock is kept in high den-sity, so that the animal manures produced cannot be uti-lized efficiently, such as in parts of Europe and the USA (see Key Action 10). The N and P ratio of animal manures is also different from that required by plants, often with excesses of P in these intensive livestock systems. NUE is also low when nutrient losses are high, for example due to inappropriate timing and methods of fertilizer and manure application. Approaches that reduce losses to the environment therefore can simultaneously contribute to improving crop NUE.
Key Action 2: Improving nutrient use efficiency in animal productionAnimal agriculture is a mainstay of the global economy, critical to food security, and expanding quickly in many countries with emerging economies, such as China, where consumption of meat and other animal products is grow-ing rapidly. The nature of animal agriculture, however, can vary widely as a function of national or regional eco-nomic conditions, climate, geography, cropping systems, tradition and cultural preferences.
Historically animal production was centered around homes and villages and was conducted at small scales, on family farms. However, as the demand for animal prod-ucts, such as eggs, milk, and meat has grown worldwide, animal and crop agriculture have gradually become more separate, and animal production has become more inten-sive, particularly in developed countries. This has led to geographic concentration of animal production systems to link the feed, production, processing, distribution and marketing components more closely, particularly for the production of poultry and swine. Consequently, animal numbers on farms have grown, farms have consolidated, and manure production has increased, often exceeding the capacity of nearby cropland to efficiently recycle ma-nure nutrients.
Nutrient surpluses, defined as nutrients applied exceed nutrients removed in crop harvest, are now common in many areas of the United States, Europe, China and India, where geographic concentration of animal agriculture has occurred (see Key Action 10). Subsequent over-application
Our Nutrient World_reflowed.indd 62 30/01/2013 10:27:06

63global overview on nutrient management
of manures to cropland, often without proper crediting of manure nutrient value, has, over the past few decades, exac-erbated problems with nitrate (NO3-) leaching to ground-water, ammonia (NH3) and nitrous oxide (N2O) emissions to air and the saturation of soils with P to the point that P losses in surface flow and leaching are serious concerns. The need to improve NUE in animal production has be-come an area of considerable interest and sparked a wide range of multi-disciplinary research between animal scien-tists, agronomists, economists, engineers, social scientists, and soil and environmental scientists.
Some approaches that have been implemented, or are in need of further development and implementation, to improve NUE in animal agriculture are as follows.
Animal breeding, housing, and healthAs with plant breeding, genetic advances through breed-ing have improved the overall productivity of most food animals, which has led to more efficient use of ingested feeds, better partitioning nutrients into animal prod-ucts as opposed to excreted wastes. At the same time, advances in veterinary medicine and improvements in animal housing have resulted in healthier environments that foster better use of feed nutrients and more efficient production of animal products (Angel and Powers, 2006). Further, the development of low-emission housing sys-tems have decreased the emissions of NH3 and which can also contribute to improving animal performance, if implemented.
Dietary management Proper approaches to managing animal diets are critical to avoid over-feeding of nutrients, unnecessarily enriching manures with valuable feed N and P. Managing animal diets by using easily digestible feeds, feeding to well-established nutritional requirements, and using additives that increase feed nutrient digestibility are key actions that can improve livestock NUE. For example, the US poultry industry has reduced P concentrations in diets and expanded the use of phytase enzymes in diets, which convert non-available phytate-P in feed grains to forms that are readily absorbed by poultry (Dou, 2003; Maguire et al, 2005). This change has particularly been motivated by national concerns about P pollution from land-applied poultry manures. Similarly, lowering the protein content of the animal feed, but in-creasing the content of critical amino acids via supplemen-tation may contribute to decreasing the N excretion and at the same time contribute to increasing the NUEN of the animals (UNECE, 2012).
Nutrient management planningFor the past 15 years, the USDA Natural Resources Conservation Service has advocated and provided fund-ing to support adoption of ‘Comprehensive Nutrient Management Planning’ (CNMP) for farms producing animals. A CNMP is a conservation plan for an animal feeding operation that must include: 1. Both the production area, including the animal con-
finement, feed and other raw materials storage areas,
Figure 6.2 Illustration of ‘supergranules’ now used widely for urea deep placement in Bangladesh. In this approach each supergranule is inserted below the soil surface, typically with one granule between four rice plants. This approach to precision agriculture has been estimated to reduce ammonia and other nitrogen losses substantially, increasing nitrogen use efficiency, while providing substantial fertilizer savings (photograph © International Fertilizer Development Center).
Our Nutrient World_reflowed.indd 63 30/01/2013 10:27:08
64 global overview on nutrient management
animal mortality facilities, and the manure handling containment or storage areas, and the land treat-ment area, including any land under control of the Animal Feeding Operation (AFO) owner or operator, whether it is owned, rented, or leased, and to which manure or process wastewater is, or might be, applied for crop, hay, pasture production, or other uses;
2. Meets criteria for Water Quality (nutrients, organics, and sediments in surface and groundwater) and Soil Erosion (sheet and rill, wind, ephemeral gully, classic gully, and irrigation induced natural resource concerns on the production area and land treatment area);
3. Mitigates, if feasible, any excessive air emissions and/or negative impacts to air quality resource con-cerns that may result from practices identified in the CNMP or from existing on-farm areas/activities;
4. Complies with Federal, State, tribal, and local laws, regulations, and permit requirements; and
5. Satisfies the owner/operator’s production objectives (USDA and USEPA, 1999 and USDA- NRCS, 2012).
More widespread adoption, on a global scale, of the CNMP concept should lead to improved NUE by animal agriculture.
Key Action 3: Increasing the fertilizer equivalence value of animal manureAnimal manures have been used effectively by farmers worldwide for many centuries to provide plant nutrients and build soil quality (Sims and Maguire, 2005). Until the late 19th century and particularly in the middle 20th cen-tury, inorganic fertilizers as we know them today were not widely available and manures (and/or human or other or-ganic wastes) were the primary means by which farmers produced food and maintained soil fertility.
Despite their value to agriculture, until very recently, when environmental concerns about manure impacts on air and water quality began to grow, there has been very lit-tle done to improve the fertilizer value of animal manures. Consequently, the percentages, chemical forms, and rela-tive amounts of N, P, and other plant nutrients (Ca, Mg, K, S, Cu, Zn, etc.) were mainly affected by animal physiology and the nature of the animal’s diet. As efforts are made to improve the fertilizer equivalence value of animal manures, these need to take account of such differences, including physical and chemical properties, and the interactions with other current and emerging practices.
The primary factors affecting manure nutrient content are animal diet and manure storage and handling practic-es. Animal diets mainly determine the amount of N and P present in manures (National Academy Press, 2012). As with fertilizers, manures should be applied in accordance with the basic principles of ‘4R Nutrient Stewardship’; that is, they should be analyzed to determine plant avail-able concentrations of N, P, and other nutrients, applied at the correct time, at rates that meet crop requirements for these nutrients, in a manner that minimizes losses from applied manures during and after application.
Improving fertilizer value by reducing lossesThe nutrient content and availability of manure can
be affected by storage, handling and spreading practices that favor N losses via ammonia volatilization, as well as denitrification losing N2O and N2. This reduces manure fertilizer value while negatively impacting air quality and contributing to greenhouse gas emissions. Approaches to reduce such N losses to air include (UNECE, 2012):
7 Minimizing emissions from animal housing Including use of chemical amendments that acidify manures, approaches to reduce the area of soils as well as the cleaning of air streams when using buildings with controlled ventilation to reduce NH3 emissions. In the case of poultry housing, drying manure substan-tially reduces emissions, while aluminum sulfate ad-ditions to bedding can reduce NH3 emissions during production and stabilize P in sparingly soluble forms that are less susceptible to following manure applica-tion to fields (Moore and Edwards, 2007).
7 Minimizing emissions from manure storage and han-dling Covering manure storage reduces NH3 emis-sion, while also preventing the entry of rainwater which would dilute manures. By contrast, open la-goons of liquid manure can be major point sources of NH3, substantially reducing manure fertilizer value. A substantial loss of Nr through denitrification to N2 and N2O can occur during long-term storage of solid manures, indicating the need to integrate measures with low NH3 practices, as well as with those that minimize methane (CH4) emissions.
7 Minimizing emissions from manure treatment During production and storage cycles there are opportunities to amend manures and effluents with chemicals and polymers that reduce the potential for nutrient loss once these materials are applied to land. Manures can be digested anaerobically to generate bio-gas (a mix-ture of mainly CH4 and CO2) that can be used for combustion processes, also allowing potential for re-covery of N and P fertilizer products. Slurries may be also separated in a fraction rich in N and potassium (K) and a solid fraction rich in carbon and P so as to better match the specific N, P and K demands by crops (Velthof et al., 2012; Oenema et al., 2012).
7 Minimizing emissions from land application of ma-nure Spreading of liquid manures in narrow bands, injection into the soil and immediate incorporation of manure into the soil can all reduce NH3 emissions sub-stantially (40-90% depending on the method, UNECE, 2012), while helping to prevent surface run and P loss (Rotz et al, 2011). Many options are available for low emission spreading of liquid manures, with these be-ing a regulatory requirement for the last 10-20 years in Netherlands and Denmark. In addition, recent advances now allow commercial injection of poultry litter into soils, which is important for pastures and no-till systems (Maguire, et al, 2011).
Through a combination of such techniques, the fertil-izer value of slurry can be increased to values as high
Our Nutrient World_reflowed.indd 64 30/01/2013 10:27:08

65global overview on nutrient management
as 60 to 90% (Velthof et al., 2012). While many such techniques are available, the present challenge is to en-courage their adoption in the field by a much wider range of farmers.
Enhancing manure fertilizer value also requires proper timing and methods of application, especially consider-ing the composition and nutrient availability of differ-ent manure types. Efficient manure application practices therefore, must take into consideration the timing of N release as a function of soil type, climate, and method of application (surface, incorporated, injected) in order to optimize the synchrony of manure N availability and crop N uptake patterns. Timing of manure applications is less important for P, as most manure P is a mixture of stable
organic forms (principally phytate P) and slowly soluble inorganic P species (e.g., calcium phosphates).
Improving fertilizer value by manure processingIn recent years interest has grown in new technologies to process manures into organic fertilizers that are easier to store, transport, handle, and apply. Examples include ma-nure processing plants that ‘pelletize’ drier manures (e.g., poultry) for direct use as organic fertilizers or that enrich manures by addition of inorganic fertilizer nutrients (for example, ‘P-enriched compost’) in order to create more balanced fertilizers.
A current example is a joint venture between the poultry industry in Delaware, USA and a pellet-making
Box 6.1 Case study: Examples of reducing Nr losses from North American agriculture Nebraska regulation and education: Groundwater contamination with nitrate has been a problem in Nebraska, where irrigated corn is grown. Beginning in 1987, a phased regulation and education program was carried out in the Central Platte Natural Resources District, demonstrating that increases in groundwater nitrate concentrations could be stopped, and in some areas reversed. Regulations focused on nitrogen fertilization amounts and timing (banning fall or winter applications, requiring spring split applications or use of a nitrification inhibitor), as well as accounting for all sources of nitrogen when calculating fertilizer amounts needed. Fertilizer nitrogen rates were unchanged, even as yields increased. Improved application timing accounted for an approximate 20% decline in groundwater nitrate, because more nitrogen was removed in the crop harvest. Conversion of furrow to sprinkler irrigation permitted wa-ter to be applied uniformly with better control over the nutrient levels. Cost-sharing was available to help producers buy the equipment. Changes in water application were responsible for about half the observed decline in groundwa-ter nitrate concentrations. However, based on the rates of decline in groundwater nitrate, it may be decades before concentrations fall below the 10 milligram nitrate-nitrogen per litre drinking water standard. More information on this case study is given by Exner et al. (2010).
Iowa case study: This is a hypothetical example of how several practices might be used to reduce nitrogen loads. The Cedar River watershed in eastern Iowa is cropped in mostly corn and soybeans, with tile drainage on about half the watershed. In 2006, the Iowa Department of Natural Resources called for a 35% reduction in the 25,910 metric tons of nitrogen per year load coming from the watershed. Figure 6.3 shows how this reduction could be achieved by adopting several currently available management practices, implemented over a 20-year period. The 20-year es-timated cost for achieving the reduction is $71 million per year, or $7.78 per kg nitrogen removed per year. For comparison, total spending of USDA’s Environmental Quality Incentives Program in Iowa in 2009 was $25 million; the cost for removing a kilogram of nitrogen at the Des Moines water works was about $10; and the price of nitrogen fertilizer was $0.72 per kilogram in 2010.
Figure 6.3 Several practices together could lead to a 35% reduction in nitrogen loads from the Cedar River watershed. In this analysis of costs, the width of each bar indicates the amount of nitrogen reduction that could be achieved by each mitigation practice and the height of the each bar indicates its cost per kilogram of nitrogen removed. The most cost-effective interventions are on the left and the most expensive ones on the right. Based on Davidson et al. (2012).
0
5
10
15
20
25
0 2 4 6 8 10
Cost
s ($
per
kg
N re
mov
ed)
Nitrogen Reduction (Millions of kg of N per year)
Drainage water management
20% N rate reduction on continuous crops
Constructed wetlands
20% N rate reduction oncorn-soybean rotation
Rye cover crops
No fall N application
Our Nutrient World_reflowed.indd 65 30/01/2013 10:27:08

66 global overview on nutrient management
factory to convert poultry litters into organic fertilizers (Agri-Recycle, 2012). Research on technologies to extract P and other nutrients from manures to make inorganic fertilizers is also underway (Fernandes et al., 2012; Szogi et al., 2010). These technologies are focused on areas with manure P surpluses, developing new fertilizer products that can be transported to arable regions where they can be used more effectively.
A concentrated solution of N and K (‘mineral con-centrate’) is one of the possible products resulting from manure processing. This concentrate is produced by re-verse osmosis of the liquid fraction of separated livestock slurry. On average 92% of the N in mineral concentrate is present as ammonium-N, the other 8% as organic N. The N fertilizer equivalence value of mineral concentrate compared to calcium ammonium nitrate may range from 76 – 97%, which can be increased further when injected into the soil (Velthof et al., 2012).
6.3 Key Actions for Transport and Industry
Key Action 4: Low-emission combustion and energy-efficient systems, including renewable sourcesA wide range of strategies are already available to reduce Nr emissions from transport and industry. By far the major Nr component from these sources is NOx emission, though smaller amounts of N2O and NH3 are also emitted from both transport and industrial sources. As phosphorus is an insignificant component of most fuels, it has received little attention as an air pollutant from these sources. The excep-tions are coal, which can have about 1/10th the amount of P compared with sulphur, and biomass burning (with ~7 times higher P content than coal)(Ryan and Khan, 1998), indicat-ing a risk of P emissions in PM (Mahowald et al., 2008), and a need for suitable reuse of P residues in coal ash.
While there may be opportunities for reducing fossil fuel P emissions and for improving P use from ash, this Key Action therefore focuses on approaches to reduce Nr emissions. These include:Appoach 1 Techniques that reduce the amount of NOx
and other Nr emission per unit of combustion. This includes primary measures (such as low-NOx burners reducing NOx formation) and secondary measures that de-nitrify the NOx and Nr compounds produced back to N2 prior to release to the environment. Both non-catalytic and catalytic reduction processes are applied, including the use of catalytic converters (most often referred to as three-way catalysts) in petrol (gasoline) fuelled vehicles..
Appoach 2 Techniques that improve fuel efficiency in the combustion process, thereby giving less NOx and other Nr emissions per unit of output, such as per ve-hicle miles driven, or per unit of heat produced.
Appoach 3 Techniques that reduce energy requirement for fuel use, such as better aerodynamic performance
of vehicles or improved insulation of buildings to re-duce heat loss and other energy efficiency standards (e.g. energy saving light bulbs).
Appoach 4 Techniques using renewable energy, espe-cially non-combustion sources that avoid emission of NOx and Nr compounds to the atmosphere, such as wind, solar, wave, tidal and geothermal energy.
The use of many of these techniques helps to meet both air quality and climate policies, reducing NOx and CO2 emis-sion simultaneously. While further improvements in all these approaches can be expected through future develop-ment, such as for renewable energy sources, in many cases existing implementations represent an advanced stage of development, with only modest capability for further reductions. An example of this is the EURO-6 standard for vehicles, entering into force in Europe by 2014, which has around 70% less NOx emissions per mile compared with pre-EURO standard technologies in the 1990s, but has struggled to reduce emissions substantially beyond the previous EURO-4 standard (20%) (European Union, 2012). Current technologies to achieve EURO 6 standards include advanced engine management and combustion efficiency measures for all vehicles and selective catalytic reduction (SCR) for heavy duty vehicles. Unit emission reductions per mile driven were confounded by a gen-eral increase in annual mileage in most parts of the world (both by increases for individual vehicles, and the growth of the vehicle fleet), thus contributing only to a slowing of emission growth rather than a global reduction similar to that observed for Europe or the US.
From a global perspective, a much larger contribution can therefore still be achieved by ensuring that existing low-NOx combustion technologies in stationary and mobile sources are more widely applied. In particular, there is a clear need for technology transfer to ensure that the latest techniques, such as those complying with the most stringent European or US vehicle emission standards, are implemented in the growing share of ve-hicles produced in China and India. The challenge is to globalise these technological developments, both to re-duce NOx emissions and to contribute to the reduction of greenhouse gases.
The application of best available technologies (BAT) in the energy sector could also reduce NOx emissions per unit of energy generated. However, current end-of-pipe technologies typically increase CO2 emissions and may cause additional emissions of NH3, pointing to the need for further technological refinement. The methods in-clude Selective Non-catalytic Reduction (SNCR), where ammonia or urea compounds are injected at high tem-perature to reduce NOx, with the product being N2, and Selective Catalytic Reduction, where a metal such as tita-nium oxide is included to promote the reduction process.
The wider use of renewable energy, in particular bio-mass combustion, needs to be critically evaluated with regard to NOx and particulate matter (PM) emissions, as small and residential combustion units are typically not as
Our Nutrient World_reflowed.indd 66 30/01/2013 10:27:08

67global overview on nutrient management
efficient as large-scale installations and control measures are less effective. The health implications of burning bio-mass in developing countries are thought to be substantial due to inefficient burning, while low-technology stoves can substantially improve fuel efficiency, also reducing PM emissions (Approach 2).
Since high-temperature combustion processes all have a general tendency to produce NOx from Nr, non-combustion-based energy and transport options provide a very promis-ing avenue to decrease NOx emissions (Approach 4). This is particularly valid when replacing conventional power plants with wind, solar or geothermal units etc, or increasing the share of hybrid or electric vehicles for private transport.
Any measures to reduce the emissions of Nr from energy on a global scale need to be geared towards a decrease of unit emissions (per unit of energy consump-tion as well as per capita), while avoiding a trade-off in increasing GHG emissions. Regionally, the focus needs to be on strongly growing economies (China, India, Brazil) with technology transfer ensuring a growth pathway that decouples economic development from energy consump-tion and Nr emissions.
Key Action 5: Development of NOx capture and utilization technologyIt should be noted that all the methods under Approach 1 currently focus on removing Nr by denitrification to N2, thereby wasting an available Nr resource. Globally, NOx emission to the atmosphere accounts for 40 Tg N (Chapter 3), which represents around 20% of the total anthropogenic fixation of N2 to Nr. In principle, this is NOx formation from combustion processes is therefore a major resource, some of which might be collected for fertilizer production and other uses. Such approaches re-call the original arc process, for production of Nr from N2 (Chapter 1, Smil, 2002). Although that became un-economic because of its large energy requirements com-pared with the Haber-Bosch process, the challenge here concerns finding economic ways to capture and reuse NOx that has already been produced in existing process-es. Making the parallel to Carbon Capture and Storage (CCS) technology, such an approach could be called NOx Capture and Utilization (NCU) technology.
The prime requirement for such NCU technology is that it focuses on removing extracting Nr from waste combustion streams rather than denitrifying (reducing) NOx to N2, as is currently done in current catalytic and non-catalytic processes (e.g. SCR, SNCR). Of the two components of NOx, nitric oxide (NO) is insoluble, while nitrogen dioxide (NO2) is more soluble. Therefore, suit-able processes may enhance the formation of NO2 which is then captured by dissolution in water. An example of this is the ThermaloNOxTM process, where a slurry of elemental phosphorus in water is injected into the flue gas stream. This produces ozone which oxidizes NO to NO2, which is then captured in a standard water scrubber, such as used to remove SO2. The approach was claimed to remove 80-90% of the NOx at a cost of 30-70% lower
than using SNCR or SCR (Climate Change Technologies, 2001). In this example, it seems that safety concerns over elemental P use and costs may explain why the approach has not yet developed on a large scale, highlighting the need for further development of economic and safe NCU approaches (e.g. Yasuda et al, 2011). In evaluating the net costs of NCU, it should be noted that the commercial val-ue of Nr products needs to be included.
6.4 Key Actions for Waste and Recycling
Key Action 6: Improving nutrient efficiency in fertil-izer and food supply and reducing food wasteThere are major opportunities to reduce waste through the chain from nutrient access to eventual use. The situ-ation in many cases overlaps for Nr and P, especially in relation to reducing waste during the food supply chain and in reducing food wastes. However, in the case of P, the waste during mineral extraction and processing op-erations is substantial and also needs to be addressed.
Reducing waste from phosphorus mining and processingPhosphorus fertilizers are manufactured from non-re-newable phosphate rock. It has been estimated that nearly 90% of global phosphate rock consumption is used to pro-duce food and animal feed (Prud’homme, 2010), while at the same time only one-fifth of the total mined rock P ends up being consumed by humans as food (Schröder et al., 2010). Issues associated with the extent of phosphorus reserves and resources are discussed in Chapter 2.
With a finite source of non-renewable phosphate rock, it is important to use it more sustainably (Heffer & Prud’homme, 2010). There are various options for enhanc-ing the efficiency along the whole value chain. This starts with improvements in mining the rock, but also in fertilizer production and in fertilizer use efficiency. Recycling phos-phorus from excreta or other organic wastes also presents an important opportunity to recover phosphate. Focusing on improving the sustainability of phosphorus mining, the main issues are the recycling of process water, reclaiming mines and treating waste streams. All of these actions help to increase the phosphorus recovery rate. Adequate infor-mation about the current recovery in mining is lacking, with reported rates ranging between 41 and 95 per cent (Prud’homme, 2010; Van Kauwenbergh, 2010).
Improving food supply efficiency and reducing food waste Currently, a large share of food is wasted during produc-tion, distribution, processing or consumption. A reduc-tion of each of these losses would improve efficiency of the overall food supply chain, with the result that fewer nutrients would be needed to produce the same amount of food consumed.
It has been estimated that roughly one-third of all ed-ible food produced for human consumption is wasted or
Our Nutrient World_reflowed.indd 67 30/01/2013 10:27:08

68 global overview on nutrient management
otherwise lost from food supply per year, which is equiva-lent to about 1.3 billion tonnes globally (Gustavsson et al., 2011). The estimated global losses are roughly 30% for ce-reals, 40-50% for root crops, fruits and vegetables, 20% for oilseeds, meat and dairy, and 30% for fish. As can be seen from Figure 6.4, the total losses from production to retail-ing are estimated to be larger than the those from the con-sumer, although the available volumes become less through the food supply chain. This means that it is important to reduce losses at all stages of the food chain. The opportuni-ties to do this vary regionally, as illustrated in Figure 6.4 for cereal and dairy produce, depending on different reasons for these losses (Gustavsson et al., 2011; Buzby and Hyman, 2012). In developing countries, poor storage facilities and lack of infrastructure lead to large losses following har-vest and during distribution and processing. In developed countries, post-harvest and distribution losses tend to be much less than in developing countries, but there is much more food waste by consumers. The differences can be il-lustrated between Europe and North-America, where per capita food waste by consumers is 95-115 kg/year, and Sub-Saharan Africa and South/Southeast Asia where consumers only waste 6-11 kg/year. (Gustavsson et al., 2011). Factors contributing to the large amount of consumer food waste in developed countries include low price of food (such as 2-for-1 deals) and fixed portion sizes, as well as many other dietary, health-related and psychological factors.
Organizations such as the FAO and the EU, but also many national governments, have already established programs to reduce food losses (Box 6.1). Actions are re-quired by governments (including streamlining regula-tions, stimulating cooperation and coordination in food
chains, supporting research, informing consumers, etc.), the different actors in the food chain and by consumers (Quested and Parry, 2011; Buzby and Hyman, 2012).
Not all food losses can be avoided, but even if certain losses occur, it is recommended to follow the ‘food recov-ery hierarchy’ with the following order of priority: feed hungry people (food banks, soup kitchens, and shelters), feed animals, industrial uses, composting (and recycle nutrients), and only as a last resort to send food waste to landfill or incineration.
The food supply chain is an area with significant po-tential to improve nutrient supply efficiency and reduce nutrient losses. This can be illustrated by envisioning the low percentage consumer waste of developing countries combined with the high food supply efficiency of devel-oped countries. Such improvements would propagate up the food chain. For example, a feasible aspirational goal to halve losses and waste in the food supply chain would equate to a global reduction in the nutrients needed for food production by around 15%.
Key Action 7: Recycling nitrogen and phosphorus from waste water systemsCurrent practices for waste water systems are extremely vari-able across the world and between different sectors. While in some developed areas of the world, most municipal waste water is treated through several stages of water treatment, in many other areas, a well-developed sewage treatment system is still missing. The same applies for the treatment of agri-cultural point sources, where manures may not be fully re-cycled, but enter into water courses, as well as for industrial effluents, with high loss rates to the environment.
Figure 6.4 Per capita food losses and waste at different stages of the food supply chain. Per capita losses and waste (A); Percentage of the initial production lost or wasted for cereals (B) and for milk and dairy produce (C). (based on Gustavsson, 2011)
Our Nutrient World_reflowed.indd 68 30/01/2013 10:27:09

69global overview on nutrient management
This diversity of conditions is matched by a plethora of water treatment options that are already available. One of the greatest challenges is therefore to implement exist-ing technologies, especially considering the infrastructure that may be needed, or the major challenge of redesign-ing and upgrading an existing sewage system. With large costs, this is often a matter for local, regional and national governments.
Developments in water treatment over the last decade point to new options which may be implemented when renewing existing sewage infrastructure or when design-ing a new systems. This includes new city development for growing urban populations, where eco-sanitation (EcoSan) approaches simultaneously offer substantial wa-ter saving and sanitation benefits (Magid et al. 2006; Moe and Rheingans, 2006).
Traditionally, water treatment has focused on three stages, although in many cases only the first these may be done (Tchobanoglous et al., 2003): Primary water treatment focuses on settling out part of the suspended solids and or-ganic matter; Secondary water treatment provides further removal of biodegradable solids and organic matter, re-ducing biological contaminants, such as harmful bacteria associated with faecal wastes; Tertiary water treatment pro-vides further removal of these components, with additional reduction of Nr and P levels. The reduction of N pollution is classically based on encouraging conditions that favour denitrification from Nr back to N2. Finally, a sewage sludge is left that is rich in P and organic N compounds, which may be recycled back to land as a fertilizer.
This chain imposes several constraints for nutrient management. Firstly, managing the process of denitri-fication takes substantial energy, of the same order of magnitude as that originally required to fix N2 into Nr. It is therefore attractive to develop strategies that focus on conserving the Nr in sewage and treating for use as a fertilizer source. Secondly, in some countries health regu-lations prevent the use of sewage-based nutrient sources being used for food crops, also due to associated risks with microbiological contamination and other contaminants. Suitable treatment of sewage to minimize these risks must therefore be addressed alongside with development of
more-sophisticated regulations, moving away from blan-ket prohibition to open up new green economic options for sewage recycling. A barrier to be addressed is the per-ception that sewage use in agriculture is a source of dis-ease, even if is appropriately treated.
It is important to count the economic benefits of re-cycling both N and P in the sewage resource, which may make the difference to ensuring economic viability of approaches developed. These add together with the co-benefits for water saving and sanitation of improved sys-tems. Practices for improved waste water management range from constructed wetlands to the restructuring of piped municipal sewage streams for centralized recycling. The former can have the advantage of low implementa-tion cost, allowing settling with denitrification to N2, and subsequent collection of P and N residues (Kivaisi, 2001; Vymazal, 2011). The disadvantage is that this approach loses much of the N2 reserve, while the strategy based on denitrification can also encourage N2O emissions to the air (Syakila and Kroeze, 2011). Centralized treatment and recycling typically has the disadvantage of high cost, but may be well-suited to necessary rebuilding of existing sewage systems and building new sewage infrastructure. One of the challenges of this approach is to minimize dilution with water, maintaining high nutrient concen-trations. This can provide the basis for more efficient re-cycling of nutrients in downstream facilities (Magid et al., 2007; Svirejeva-Hopkins et al.,2011; see Table 6.1), while at the same-time contributing substantial water savings (Moe and Reingans, 2006).
6.5 Key Actions for Societal Consumption Patterns
Key Action 8: Energy and transport savingThe use of technical measures alone, which focus on avoiding the formation or recapture of NOx from high temperature combustion (Key Actions 4 and 5), will not be sufficient, not least due to their potential to increase GHG emissions. In the same way, the use of biofuel combustion for energy has tended to reduce the carbon
Box 6.2 Food losses: what can consumers do? (European Commission, 2012) 7 Buy smartly and plan your weekly meals. Make a shopping list and stick to it. Don’t shop when you’re hungry.
Buy loose fruits and vegetables so you can buy the quantity you need. 7 Check the use-by and best-before dates. The use-by date label means the food is safe to eat until the indicated
day e.g. meat and fish. The best-before label shows the date until when the product retains its expected quality but is still safe to consume after that date.
7 Store food according to the package instructions or in the fridge at 1-5 degrees C°. 7 Bring older items in your cupboards and fridge to the front and put new food at the back to avoid stuff going
mouldy on your shelves. 7 Serve small portions. Everybody can come back for more once they’ve cleared their plate. 7 Use your leftovers at lunch the day after, for next day’s dinner or freeze for another occasion. 7 Turn it into garden food. Set up a compost bin for fruit and vegetable peelings and teat your plants to rich
compost.
Our Nutrient World_reflowed.indd 69 30/01/2013 10:27:10

70 global overview on nutrient management
footprint, but contributed to increase PM emissions, with adverse effects on local air quality.
There is a growing realisation that structural and be-havioural measures have the potential to reduce emis-sions with few or no trade-offs. This includes, but is not limited to, the management of transport activities by ad-vanced telematics and transport planning, the develop-ment of mature, highly fuel efficient (e.g. hybrid-electric) passenger cars and the provision of improved public mass transportation in urban areas. With the trend towards ur-banisation, in particular in fast growing economies, the latter measure may contribute substantially to reducing the per unit emissions of future transport systems.
Where stationary combustion sources are concerned, a general move towards less carbon-intensive fuels (e.g. from coal to natural gas) may be a short-term measure to reduce Nr emissions. For the mid- and long-term, however, the development of technologies for the widespread use of re-generative energy sources (hydro, geothermal, solar, wind, wave and tidal), in conjunction with intelligent technolo-gies for demand-side management of energy use will be required to reduce emissions from fossil fuel combustion. This should be developed in parallel to the promotion of energy efficiency, from buildings (lighting, heating, cool-ing) to electronic equipment and information technology.
The World Energy Council (WEC, 2010) identified 10 key measures:
7 incentive energy prices, 7 sustainable institutional support, 7 innovative financing, 7 quality standards for energy efficient equipment and
services, 7 regular review and strengthening of regulations, 7 packages rather than single measures; 7 measures adapted to less developed countries; 7 measures focused on behaviour; 7 monitoring of the impact of measures; and 7 enhancement of international cooperation.
Key Action 9: Lowering personal consumption of animal protein (avoiding excess and voluntary reduction)Especially in affluent regions, people generally con-sume more protein than is needed according to dietary
recommendations (Reay et al., 2011; Westhoek et al., 2011). This is mainly due to the increase in consump-tion of proteins of animal origin (meat, dairy, eggs, fish). Although this overconsumption is probably not very harmful for human health, it indicates that there are opportunities to reduce the total intake of proteins. Apart from lowering the total protein intake, also a shift from animal based protein to plant based protein will reduce nutrient emissions, as the production of animal products leads to more nutrient emissions compared to plant-based alternatives. A lower intake of meat and dairy will probably have positive health effects, as these products usually contain high levels of saturated fats.
In developing countries, the current protein intake is often below the recommended level, indicating potential health benefits from increasing protein intake. This in-creased consumption can be in the form of protein-rich plant-based products as pulses, cereals and vegetables (See Figure 6.5). In many emerging economies, the meat and dairy consumption is rapidly increasing.
People can lower the consumption of animal protein by eating less frequent meat and dairy. In some coun-tries people are being mobilized to have a ‘meat-free’ day. Another important route is the reduce portion size. A third way is to shift to poultry meat, as this is usually as-sociated with less pollution than pork and beef.
Finally, approaches have been encouraged that foster a middle path between typical meat consumption in the developed world and vegetarian diets. In the ‘demitar-ian’ approach the aim is to consume half the normal local amount of animal products (Sutton et al., 2011a; NINE, 2009).
6.6 Key Action for Integration and Optimization
Key Action 10: Spatial and temporal optimization of nutrient flowsAltering the spatial and temporal organization of human activities provides many opportunities to optimize food and energy production, while minimizing adverse im-pacts. Examples include:
7 Optimization of nutrient pollution sources to place them more distant from the most sensitive receptors,
Table 6.1 Nitrogen emitted from wastewater treatment for all European cities of over 1 million people. The table compares a scenario of current water treatment (80% treatment, using denitrification based approaches) with a system of latrine water recycling (based on per capita recalculations, Magid et al., 2006; Svirejeva-Hopkins et al., 2011).
Receiving media Current system (with 80% treatment by denitrifcation)
(k tonne N per year)
New system of latrine water recycling(k tonne N per year)
Water (Nr ) 157 26.2Sludge (Nr ) 157 52.6Air (denitrified to N2 ) 418 0Recycled (as fertiliser Nr ) 0 629Total 732 708
Our Nutrient World_reflowed.indd 70 30/01/2013 10:27:10

71global overview on nutrient management
including the use spatial planning policies and buffer zones relevant for both air and water quality, as well as avoiding high pollution emissions during the most sensitive times for adverse impacts.
7 Integration of different nutrient flows to foster their more effect use, such as through the spatial integra-tion of livestock and arable agriculture, thereby offer-ing potential for improving the nutrient use efficiency of animal manures.
7 Optimization of nutrient production to be close to consumers, thereby reducing losses associated with poor transport infrastructure, such as efforts that al-low access to local Nr production in remote areas.
The optimization of nutrient pollution in space can be integrated into planning decisions at different scales. For example, at the local scale, the application of plan-ning laws can ensure that new nutrient polluting activi-ties are not located in especially vulnerable areas. In the case of NH3 and NOx emissions to air, dispersion leads to strong local gradients over the first 1-5 km, allowing spatial policies to help avoid the most extreme adverse effects (e.g. Dragosits et al., 2002), while regional spatial policies can also contribute (Kros et al., 2012). In the case of water pollution, buffer zones have already been widely tested to avoid polluting activities immediately near wa-ter courses, and such buffer zones may also be applied for local air quality mitigation (Dragosits et al., 2002; Sutton et al., 2011b). It should be noted that nutrient pollution may have different effects depending on when it is lost to the environment. In the case of air pollution, for example, NH3 emitted during winter makes a larger contribution to particulate matter formation than emissions during summer. For this reason, particular efforts may be placed in reducing winter-time NH3 emissions, which are domi-nated by housed livestock (UNECE, 2012).
Modern industrial agriculture illustrates the challenges for better spatial integration. In intensively managed areas, such practices have often led to the decoupling of crop and animal production, with large territories specialising in ei-ther one or the other of these activities. This specialisation has strongly increased in many catchments during the last 50 years (Figure 6.6) exacerbating N and P losses to the en-vironment. It also leads to substantial long-distance trans-portation of agricultural commodities, as livestock have to be fed for a significant part by imported feed, while it becomes impossible for all the manure produced to be re-used locally as fertilizer. Better spatial localisation of crop and livestock production can therefore contribute substan-tially to improving nitrogen use efficiency (Billen et al., 2012). This also highlights the importance of applying best management experience in nutrient conservation from tra-ditional mixed farming practices.
A simple assessment of the potential benefits of re-sourcing crop and animal farming at the global scale has been provided by Billen et al. (2013): starting from the description of the current distribution and performances of agricultural activities and food consumption over the 5700 world watersheds from the GlobalNews database (Seitzinger et al., 2010; Mayorga et al., 2010), the authors built up a scenario in which livestock was redistributed per watershed to meet the local requirements of current human population, modifying the rates of synthetic fertiliser appli-cation accordingly, based on local manure availability. The better distribution of manure resources resulted in a low-er requirement for synthetic fertilisers (53 Tg N per year compared with 75 Tg N per year currently), as well as to a much lower agricultural N soil surplus (93 vs. 143 Tg). The authors also argued that such an improved spatial distribu-tion would allow biological nitrogen fixation to fully meet the Nr needs for local food production with significantly less Nr surplus and pollution.
Figure 6.5 Variation in daily average protein intake per person, based on regional estimates (based on FAO, 2010).
Our Nutrient World_reflowed.indd 71 30/01/2013 10:27:10

72 global overview on nutrient management
The opportunities of exploiting spatial optimiza-tion including the coupling in traditional farming sys-tems need to be further investigated. In particular, it has been highlighted that nitrogen losses are not necessarily smaller from organic livestock farming systems than from livestock farming systems utilizing fertilizer inputs, as the efficiency depends on detailed manure management practices (see Key Action 3; Jarvis et al., 2011). However, there may be additional advantages of such localized pro-duction, as characterized by many organic systems, where a better spatial coupling of nutrient resources may be achieved. It may be noted that in Europe organic farming practices covered 4.1% of the utilized agricultural area in 2007, with an increasing trend (Eurostat, 2012).
Such options for improved use of biological fixation also need to be evaluated in relation to technological op-tions to optimize Nr production, especially given the cur-rent debate on the extent to which BNF could meet crop needs in nutrient limited regions. One of the constraints to improved access to mineral fertilizers in such areas is the difficulty to transport N and P fertilizers across large distances in countries with poor infrastructure. This lim-its access to affordable fertilizer supplies in many remote areas. In addition to further improvement in BNF pro-duction of Nr, technological options may play a role in future.
An example of such an approach is the current devel-opment of local renewable energy approaches to produce NH3, with the added advantage that the NH3 may be used
as an energy store, recognizing the intermittent nature of renewable energy sources. Several approaches are being de-veloped that may eventually allow local production of NH3 from atmospheric N2 at low atmospheric pressure. These include both electrolytic and chemical methods, which may use hydrogen produced electrolytically from solar and wind energy (Marnellos & Stoukide, 1998; Huberty et al., 2012; Dunn et al., 2012; Holbrook and Leighty, 2009). While these techniques require further development, also in regard of their economics and environmental perfor-mance, such facilities may eventually prove to be a relevant tool for local Nr supply in areas with ample renewable en-ergy but poor surrounding infrastructure.
ReferencesAgri Recycle (2012) http://www.perdueagrirecycle.com/about.
htmlAngel R.A. & Powers W. (2006) Broiler production and the
environment. Bulletin EB 368, College of Agriculture and Natural Resources, University of Maryland, College Park, MD, USA.
Billen G., Beusen A.H.W., Bouwman A.F. & Garnier J. (2010) Anthropogenic nitrogen autotrophy and heterotrophy of the world’s watersheds: Past, present, and future trends. Global Biogeochem. Cycles 24, GB0A11, doi:10.1029/2009GB003702.
Billen G., Garnier J. & Lassaletta L. (2013) The nitrogen cascade from agricultural soils to the sea: modelling N transfers at regional watershed and global scales. Phil. Trans. Roy. Soc. B (in press)
Billen G., Garnier J., Silvestre M., Thieu V., Barles S. & Chatzimpiros P. (2012) Localising the nitrogen imprint of Paris food supply: the potential of organic farming and changes in human diet. Biogeosciences 9, 607-616.
Buzby J.C. & Hyman J. (2012) Total and per capita value of food loss in the United States. Food Policy 37: 561-570. http://ucce.ucdavis.edu/files/datastore/234-2425.pdf
Chen X.P., Cui Z.L., Vitousek P.M., Cassman K.G., Matson P.A., Bai J.S., Meng Q.F., Hou P., Yue S.C., Romheld V. & Zhang F.S. (2011). Integrated soil-crop system management for food security. Proc. Nat. Acad. Sciences U.S. 108, 6399-6404.
Climate Change Technologies (2001) Technical advice on air pollution control technologies for coal fired power plants. (report CCT-P 014.01) Alberta Research Council Inc. http://environment.gov.ab.ca/info/library/6955.pdf
De Wit C.T. (1992) Resource use efficiency in agriculture. Agric. Systems 40, 125-151.
Denison R.F. (2012) Darwinian Agriculture. How Understanding Evolution can improve Agriculture. Princeton University Press, 258 pp.
Dou Z. (2003). Phosphorus Feeding Levels and Critical Control Points on Dairy Farms. Journal of Dairy Science. 86, 3787-3795.
Dragosits U., Theobald M.R., Place C.J., Lord E., Webb J., Hill J., ApSimon H.M. and Sutton M.A. (2002) Ammonia, emission, deposition and impact assessment at a field scale: a case study of sub-grid spatial variability. Environmental Pollution 117, 147-158.
Dunn R., Lovegrove K., Burgess G. & Pye J. (2012) An experimental study of ammonia receiver geometries for dish concentrators. J. Sol. Energy Eng. 134 (4), 041007. http://dx.doi.org/10.1115/1.4006891
Figure 6.6 Relationship between the crop and grass production and the food and feed consumption in 5700 of the world’s largest watersheds (>500 km²) expressed as N per unit area in 1970 and 2000. Deviation from 1:1 is a measure of specialisation of the watershed territory into either crop farming (above the diagonal) or livestock farming (below the diagonal). Comparison of data from 2000 (black symbols) with those of 1970 (red symbols) shows the trend for increasing specialisation of many watersheds (Billen et al. 2010).
0
2000
4000
6000
8000
10000
0 2000 4000 6000 8000 10000food & feed consumption, kgN/km²/yr
ry/²mk/
Ngk ,noitcudorp ssarg & porc
19702000
Our Nutrient World_reflowed.indd 72 30/01/2013 10:27:14

73global overview on nutrient management
European Commission (2012) Health and Consumers. http://ec.europa.eu/food/food/sustainability/index_en.htm
European Union (2012) http://europa.eu/legislation_summaries/environment/air_pollution/l28186_en.htm
Eurostat. (2012) http://epp.eurostat.ec.europa.eu/statistics_explained/index.php Organic_farming_statistics
Exner M.E., Perea-Estrada H. & Spalding R.F. (2011) Long-Term Response of Groundwater Nitrate Concentrations to Management Regulations in Nebraska’s Central Platte Valley. The Scientific World Journal 10, 286-297.
FAO Statistics Division (2010), Food Balance Sheets, Food and Agriculture Organization of the United Nations, http://faostat.fao.org/, as visualized by ChartsBin statistics collector team (2011) Daily Protein Intake Per Capita, http://chartsbin.com/view/1155.
Feeny D., Berkes F., McCay B.J. & Acheson J.M. (1990) The Tragedy of the Commons: Twenty-two years later. Human Ecology 18, 1-19.
Fernandes G.W., Kunz A., Steinmetz R.L., Szogi A.A., Vanotti M.B., Flores E.M. & Dressler V.L. 2012. Chemical phosphorus removal: A clean strategy for piggery wastewater management in Brazil. Environmental Technology. 33(14), 1677-1683.
Gustavsson J., Cederberg C., Sonesson U., van Otterdijk R. & Meybeck A. (2011) Global food losses and food waste. UN Food and Agriculture Organization. http://www.fao.org/docrep/014/mb060e/mb060e00.pdf
Hardin G. (1968) The tragedy of the commons. Science 162, 1243-1248.
Heffer P. & Prud’homme M. (2010) Fertilizer Outlook 2010-2014 (78th IFA Annual Conference, 31 May-2 June 2010) International Fertilizer Industry Association (IFA), Paris.
Holbrook J.H. & Leighty W.C. (2009) Renewable Fuels: Manufacturing Ammonia from Hydropower. Hydro Review. 28 (7). http://www.hydroworld.com/articles/hr/print/volume-28/issue-7/articles/renewable-fuels-manufacturing.year=2009.html
Huberty M.S., Wagner A.L., McCormick A. & Cussler E. (2012) Ammonia absorption at haber process conditions. AIChE Journal, 58 (11), 3526–3532.
IFA (2007) Fertilizer Best Management Practices. General Principles, Strategy for their Adoption and Voluntary Initiatives vs Regulations. (http://www.fertilizer.org/ifa/HomePage/LIBRARY/)
IFDC (2012) Fertilizer Deep Placement (FDP), International Fertilizer Development Center http://www.ifdc.org/Technologies/Fertilizer/Fertilizer_Deep_Placement_(UDP)
Jarvis J., Hutchings N., Brentrup F., Olesen J.E. and van der Hoek K.W. (2011) Nitrogen flows in farming systems across Europe. Chapter 10, in: The European Nitrogen Assessment (Eds. Sutton M.A., Howard C.M., Erisman J.W., Billen G., Bleeker A., Grennfelt P., van Grinsven H. and Grizzetti B.) pp 211-228. Cambridge University Press.
Kivaisi A.K. (2001) The potential for constructed wetlands for wastewater treatment and reuse in developing countries: a review. Ecological Engineering 16, 545-560.
Magid J. , Eilersen A.M., Wrisberg, S. & Henze M. (2006) Possibilities and barriers for recirculation of nutrients and organic matter from urban to rural areas: a technical theoretical framework applied to the medium-sized town Hillerod, Denmark. Ecological Engineering 28, 44-54.
Maguire R. O., Kleinman P.J.A., Dell C.J., Beegle D.B., Brandt R.C., McGrath J.M. & Ketterings Q.M. (2011) Manure application technology in reduced tillage and forage systems: a review. J. Environmental Quality 40, 292-301
Maguire R.O, Dou Z., Sims J.T., Brake J. & Joern B.C. (2005) Dietary strategies for reduced phosphorus excretion and improved water quality. J. Environmental Quality 34, 2093-2103.
Mahowald N,. Jickells T.D., Baker A.R., Artaxo P., Benitez-Nelson C.R., Bergametti G., Tami T., Bond C., Chen Y., Cohen D.C., Herut B., Kubilay N., Losno R., Luo C., Maenhaut W. McGee K.A. Okin G.S, Siefert R.L. & Tsukuda S. (2008) Global distribution of atmospheric phosphorus sources, concentrations and deposition rates, and anthropogenic impacts. Global Biogeochem. Cycles 22, GB4026, doi:10.1029/2008GB003240
Marnellos G. & Stoukides M. (1998) Ammonia synthesis at atmospheric pressure. Science, 282, 98-100.
Marschner P. (2012) (ed.) Marschner’s Mineral Nutrition of Higher Plants Third Edition. Academic Press. 643 pp.
Mayorga E., Seitzinger S.P., Harrison J.A., Dumont E., Beusen A.H.W., Bouwman A.F., Balazs M., Fekete B.M., Kroeze C. & Van Drecht G. (2010) Global Nutrient Export from Watersheds (NEWS 2): Model development and implementation. Environmental Modelling & Software 25, 837–853
Moe C.L. and Rheingans R.D. (2006) Global challenges in water, sanitation and health. Journal of Water and Health 4 (suppl.), 41-57.
Moore P.A. & Edwards D.R. (2007) Long-term effects of poultry litter, alum-treated litter, and ammonium nitrate on phosphorus availability in soils. J. Environmental Quality 36, 163-174.
Mosier A., Syers J.K. & Freney J.R. (2004) (Eds.) Agriculture and the Nitrogen Cycle. Assessing the Impacts of Fertilizer Use on Food Production and the Environment. Island Press: Washington, D.C.
National Academy Press. (2012) Information on national guidelines for animal nutrition. Available online at: http://www.nap.edu/topics.php?topic=296 .
NinE (2009) The Barsac Declaration: Environmental Sustainability and the Demitarian Diet. http://www.nine-esf.org/barsac-declaration
Oenema O., Chardon W., Ehlert P., van Dijk K., Schoumans O. & Rulkens W. (2012) Phosphorus fertilisers from by-products and wastes. International Fertiliser Society Proceedings 717, York, UK, 56 pp.
Prud’homme M. (2010) World Phosphate Rock Flows, Losses and Uses. Paper presented at the Phosphates 2010 Conference and Exhibition, Brussels, March 2010
Quested T. & Parry A. (2011) New estimates for household food and drink waste in the UK. WRAP, Banbury, UK. http://www.wrap.org.uk/content/new-estimates-household-food-and-drink-waste-uk
Reay D.S., Howard C.M., Bleeker A., Higgins P., Smith K., Westhoek H., Rood T., Theobald M.R., Sanz Cobeña A., Rees R.M., Moran D. & Reis S. (2011) Societal choice and communicating the European nitrogen challenge, in: (Eds. Sutton M.A., Howard C.M., Erisman J.W., Billen G., Bleeker A., Grennfelt P., van Grinsven H. and Grizzetti B.) The European Nitrogen Assessment, Cambridge University Press, Cambridge.
Rotz C.A., Kleinman P.J.A., Dell C.J., Veith T.L. & Beegle D.B. (2011) Environmental and economic comparisons of manure
Our Nutrient World_reflowed.indd 73 30/01/2013 10:27:14
74 global overview on nutrient management
application methods in farming systems. J. Environmental Quality 40,438-448.
Ryan B. & Khan M. (1998) Maceral affinity of phosphorus in coals from the Elk Valley coalfield, British Columbia. Geological Fieldwork 1997, Paper 1998-l, 28, 1-20, British Columbia Geological Survey Branch.
Savant N.K. & Stangel P.J. (1990) Deep placement of urea supergranules in transplanted rice: Principles and practices. Fertilizer Research 25, 1-85.
Schröder J.J., Cordell D., Smit A.L. & Rosemarin R. (2010) Sustainable Use of Phosphorus. Report No. 357. Plant Research International, Wageningen University and Research Centre, the Netherlands, and Stockholm Environment Institute
Seitzinger S.P., Mayorga E., Bouwman A.F., Kroeze C., Beusen A.H.W., Billen G., Van Drecht G., Dumont E., Fekete B.M., Garnier J. & Harrison J.A. (2010) Global River Nutrient Export: A Scenario Analysis of Past and Future Trends. Global Biogeochemical Cycles. doi:10.1029/2009GB003587.
Sims J.T. & Maguire R.O. (2005) Soil management and conservation: Manure management. p. 402-410. Encyclopedia of Environmental Soil Science, Elsevier Science.
Sutton M.A., Bleeker A., Dragosits U., Hicks W.K., Bealey W.J. & Hallsworth S. (2011b) Current and future policy options for tackling nitrogen deposition impacts on Natura 2000 sites (Theme 5) Background Document. In: ‘Nitrogen Deposition and Natura 2000: Science & practice in determining environmental impacts’ (Eds: Hicks W.K., Whitfield C.P., Bealey W.J. & Sutton M.A.), pp 223-243. COST Office, Brussels. http://cost729.ceh.ac.uk/n2kworkshop
Sutton M.A., Oenema O., Erisman J.W., Leip A., van Grinsven H. & Winiwarter W. (2011a) Too much of a good thing. Nature, 472, 160-161.
Svirejeva-Hopkins A., Reis S., Magid J., Nardoto G., Barles S., Bouwman A.F., Erzi I., Kousoulidou M., Howard C.M. & Sutton M.A. (2011) Nitrogen flows and fate in urban landscapes. Chapter 12, in: The European Nitrogen Assessment (Eds. Sutton M.A., Howard C.M., Erisman J.W., Billen G., Bleeker A., Grennfelt P., van Grinsven H. and Grizzetti B.) pp 249-270. Cambridge University Press.
Syakila A. & Kroez C. (2011) The global N2O budget revisited. Greenhouse Gas Meas. & Mitig. 1, 17-26.
Szogi A.A., Bauer P.J. & Vanotti M.B. (2010) Fertilizer effectiveness of phosphorus recovered from broiler litter. Agronomy Journal. 102, 723-727.
Tchobanoglous G., Burton F. & Stensel H.D. (2003) Wastewater engineering: treatment and reuse. Metcalf & eddy Inc. – 4th edition. McGraw-Hill series in civil and environmental engeneering.
UNECE (2012) Draft guidance document for preventing and abating ammonia emissions from agricultural
sources. United Nations Economic Commission for Europe, Convention on Long-range Transboundary Air Pollution, Geneva. www.unece.org/fileadmin/DAM/env/documents/2012/EB/N_6_21_Ammonia_Guidance_Document_Version_20_August_2011.pdf
USDA (2012) Unified National Strategy for Animal Feeding Operations. U.S. Department of Agriculture, Washington, DC. Available online at: http://cfpub.epa.gov/npdes/afo/ustrategy.cfm.
USDA Natural Resources Conservation Service U.S. Environmental Protection Agency (1999).
USDA NRCS (2012). Comprehensive Nutrient Management Planning. Available online at: http://www.nrcs.usda.gov/wps/portal/nrcs/detail/national/technical/nra/nri/?&cid=nrcs143_014041.
Van Ittersum M.K. & Rabbinge R. (1997) Concepts in production ecology for analysis and quantification of agricultural input-output combinations. Field Crops Research 52, 197-208
Van Kauwenbergh S. (2010) World Phosphate Rock Reserves and Resources, IFDC Technical Bulletin 75. International Fertilizer Development Center (IFDC), Muscle Shoals, Alabama, USA
Vanlauwe B., Bationo A., Chianu J., Giller KE., Merckx R., Mokwunye U., Ohiokpehai O., Pypers P., Tabo R., Shepherd K., Smaling E., Woomer PL. & Sanginga, N. (2010). Integrated soil fertility management: Operational definition and consequences for implementation and dissemination. Outlook on Agriculture 39, 17-24.
Velthof G.L, Hoeksma P., Schröder J.J., Van Middelkoop J.C., Van Geel W., Ehlert P.A.I., Holshof G., Klop, G. & Lesschen J.P. (2012) Agronomic potential of mineral concentrate from processed manure as fertiliser. International Fertiliser Society Proceedings 716, York, UK, 40 pp.
Vymazal J. (2011) Constructed Wetlands for Wastewater Treatment: Five Decades of Experience. Environ. Sci. Technol. 45, 61-69.
Westhoek H., Rood T., Berg M.v.d., Janse J., Nijdam D., Reudink M.A. & Stehfest E. (2011) The protein puzzle: the consumption and production of meat, dairy and fish in the European Union. PBL (Netherlands Environmental Assessment Agency), The Hague/Bilthoven.
World Energy Council (WEC) (2010) Energy Efficiency: A Recipe for Success. London, http://www.worldenergy.org/documents/fdeneff_v2.pdf
Yasuda M., Tsugita N., Ito K., Yamauchi S., Glomm W.R., Tsuji I. & Asano H. (2011) High-efficiency NOx absorption in water using equipment packed with a glass fiber filter. Environmental Science & Technology, 45, 1840-1846.
Our Nutrient World_reflowed.indd 74 30/01/2013 10:27:14

75global overview on nutrient management
7 Current policies and barriers to changeNutrient policies are mostly inadequate at local to global scales
Overarching policy challenges 7 National and international policies have a key role to play in encouraging good nutrient management. Until
now, policies have addressed disparate nutrient sources (industry, transport, agriculture, waste, etc.) or specific issues (e.g. food supply, health, trade, water and air quality, climate change, biodiversity).
7 All these issues are drawn together in what may be termed ‘The Nutrient Nexus’, where good nutrient manage-ment can be seen as a central foundation for future food and energy security, while addressing multiple global change challenges, for environment, climate and health.
7 There is currently no international treaty that links nutrient benefits and threats. Guidance through an inter-national process would help in implementing sound nutrient policies targeted to global and region-specific objectives. The ‘barriers to change’ also necessitate a global approach, including the global scale of trade in fertilizers and agricultural products, which can constrain the adoption of nutrient best practices.
7 Existing N and P policies have been most successful in sectors consisting of few major actors (e.g. electricity generation, car manufacturing, municipal water treatment), but have made less progress when engaging many diverse actors (e.g., citizens’ transport choices, farmer practices). The challenge of diversity requires long-term dialogue, education and training, especially utilizing key actors in nutrient pathways.
Examples from regional policies 7 In some regions with too much nutrients, recent efforts have focused on regulation to avoid pollution losses.
Other countries have emphasized the need for nutrient subsidies to ensure food production. In some parts of the world there are insufficient nutrient resources, but few well-developed policies to address this.
▫ Fertilizer use in many parts of sub-Saharan Africa and Latin America is low, mainly because of poor transport and market infrastructure and poor ratio of yield increase to fertiliser cost. Major investments in research, infrastructure and markets are needed to make a difference.
▫ In Europe, government support stimulated agricultural production from the 1950s, which led to surpluses of agricultural produce and to inefficient nutrient use. In response, the common agricultural policy was reformed and a series of environmental regulations were implemented from 1990s onwards. Combined with policies on air pollution and energy, nutrient losses have decreased, improving nutrient use efficiency, although there are still many untapped opportunities to reduce adverse effects.
▫ China has very successfully increased food production, in part through heavy subsidies on fertilizer pro-duction, to such extent that fertilizer use has exceeded optimal levels. The challenge is now to lower the subsidy to such a level that food security is guaranteed and nutrient use from animal manures and fertiliz-ers is optimized, thereby drastically reducing nutrient losses and nutrient pollution threats.
▫ In India a ‘nitrogen subsidy’ on fertilizer prices has provided support directly to farmers. While further actions are still needed, a recently introduced ‘nutrient subsidy’ should help to achieve a more-balanced fertilization between nutrients, increasing nutrient use efficiency and reducing pollution.
▫ In North America and Europe, increased consumption per person (of energy, transport, animal products) has substantially offset the gains from environmental policies. Together with population growth, such increases in per capita consumption are expected to become an even larger barrier to reducing nutrient surpluses and pollution in the rapidly expanding economies of Asia and Latin America.
Specific challenges for agriculture 7 While government policies have helped improve agricultural methods in some countries, progress has been
relatively small in reducing nutrient pollution from agricultural sources, reflecting a sector with many diverse actors. Experience suggests that existing regulations are not always enforced, while only a few international agreements have made substantial progress.
7 Further efforts are needed to demonstrate best practices in the field, with education, training and targeted re-search, in combination with incentives and verification at all stages. Approaches should be matched to regional characteristics in the agri-food pathway, wherever possible utilizing the ‘cluster points’, where a few key actors play a decisive role in the chain (e.g., supermarkets, local leaders, fertilizer suppliers, etc.).
Our Nutrient World_reflowed.indd 75 30/01/2013 10:27:14

76 global overview on nutrient management
7.1 Nutrient policies are in developmentGovernmental policies can help to achieve societal goals in cases where private interests diverge from societal in-terests. Many governments have established regulations to decrease emissions from industry and households, aim-ing at levels where air and water pollution are minimized, and human health and biodiversity are not adversely af-fected. Some governments also financially support the use of mineral fertilizers in order to avoid the threat that food production becomes limited by essential nutrients, such as N and P. Still other countries have regulated the use of fertilizer and manure nutrients to minimize air and water pollution.
Indeed, some countries might be considered as hav-ing ‘a wealth of regulations and incentives’ for nutrient use and emissions, while others countries have essentially none. This contrast is related to the diversity in political organizations and systems, and to socio-economic wealth across the world.
Governmental drivers thus have to adapt to at least three other drivers in society: 1. culture (human values, traditions, fashion and cul-
tural habits), 2. market power and expertise (the ‘invisible hand’ of
the free market), and 3. societal pressure, including non-governmental orga-
nizations (NGO’s) (e.g. voluntary civil society groups, industrial lobby groups).
Governments tend to seek a balance between decisiveness and social support, also to remain in power. The fact that governmental policies address societal objectives does not mean that everybody in the society equally accepts this policy and its consequences. There is often a strong divide in societies between: a) those who believe in the cleansing mechanism of the market and in the ability of humans to act responsibly, and who therefore prefer a minimum of governmental policy, and, b) those who em-phasize the failures of markets and the need to help the less endowed in society, including the environment, and who therefore favour more extensive governmental policy (Gunningham and Grabosky, 1998).
The reality is that governments often have limited pow-er and also limited insights into the role of nutrients in food production and the wider environment. This applies even more strongly when considering role of nutrients in linking different sectors, such as energy production, industry, transport and agriculture. In order to develop sound nutrient policies, governmental agencies require insight into nutrient cycling and losses throughout both the agri-food pathway and the energy-transport pathway summarized in Figure 6.1.
In the case of agriculture, there is an especially chal-lenging diversity in production systems, from small-holder and subsistence farmers to industrial livestock operations and modern glasshouses. The FAO databases
indicate that more than 150 different crops are grown in the world, albeit that maize, wheat and rice cover 60% of the global crop production area. Livestock systems show also huge diversity, each with specific nutrient require-ments and hence utilization. Moreover, the education level and entrepreneurship of farmers greatly varies. Such diversity requires that, for any nutrient policy, a balance has to be found between a) site and farm specificity, which is costly, and, b) a general recommendation/regulation/incentive, which is easy to enforce and control.
It is often noted that governmental policies should not contribute to unfair competition. Supporting different industries or farmers in some region gives these actors a competitive advantage relative to others that did not re-ceive such support. Departure from a level playing field may also occur in the case of environmental regulation in some regions, such as obligations to decrease emis-sions, which may be costly, especially for small businesses. Negotiations within the World Trade Organization have contributed to lower trade barriers, fostering a more fair competition on the world market. Yet the question re-mains whether competition on the global market will ever truly be fair competition, given the huge competitive dif-ferences between continents, between countries, and be-tween smallholders and transnational corporations (Von Braun and Díaz-Bonilla, 2008).
Multi-lateral agreements such as in the European Union and in UN treaties (e.g., Montreal Protocol, Gothenburg Protocol) have effectively reduced some trade barriers and unfair competition though international harmonization of environmental regulations. Such regional harmoniza-tion aims to address transboundary pollution issues and to circumvent the possibility that pollution sources move to other regions. However, economic development differs between countries, as do environmental conditions and the interpretation of policies. As a consequence, policies measures are often felt differently in different countries that have all ratified the same international agreement. Harmonization of policies also takes time, but in the end can foster innovation in new markets, while improving environmental quality (Hajer, 1995).
The theoretical and empirical bases of governmental policy measures are still relatively undeveloped, especial-ly as regards environmental regulations. For example, the relationships between ‘policy objectives – policy instru-ments – change in human behaviour – human health & ecological impacts’ are complex, and to some extent based on ‘trial and error’. The toolbox for implementing govern-mental policy measures is also limited; choices have to be made between regulatory instruments, economic instru-ments and communicative / voluntary instruments, or a mix between these three (Sutton et al., 2007). The avail-able theoretical and empirical bases often do not allow an a priori indication of which combination of instruments will be most effective and efficient (OECD, 2007).
In regard of these issues, there is a need for exchange of information and for developing new models and in-struments for achieving policy objectives. Because of the
Our Nutrient World_reflowed.indd 76 30/01/2013 10:27:14
77global overview on nutrient management
complex cause-effect chain noted above, from ‘policy ob-jectives’ to ‘human health & ecological impacts’, together with the huge variety in cultures, markets, civil society or-ganisations and environments, it is no surprise that policy instruments may have different outcomes between coun-tries. Simple regulations may appear more effective for in-dustry (combustion and traffic) than for agriculture. This is in part because the number of actors is relatively low, allowing them to control both the production, marketing and sales, as well as to transfer the cost of implementing ‘best techniques’ to consumers.
In the case of Nr, the most successful pollution miti-gation policies have been noted to be those targeted as sectors consisting of a few major actors (e.g., in electric-ity generation, vehicle manufacturers, municipal water treatment). By contrast, those sectors consisting of many independent and highly diverse actors (e.g., vehicle us-age by citizens, food production by farmers) have proved most slow to respond to the intended policy drivers. This is reflected in the temporal trends of different Nr pollution sources (Oenema et al., 2011).
These differences highlight the multiple challenges facing nutrient policies: a diverse set of source sectors combined with many different of impacts and receptors. In this sense, nutrient pollution, and N in particular, can be considered as representing a systemic problem, so that better nutrient management can be expected to deliver multiple benefits: for food and energy security, environ-ment, climate and human health.
7.2 Nutrient-related policies across the worldIn this section, we provide an overview illustrating cur-rent policies related to nutrients, especially N and P, in different regions of the world. The objective of this section is to compare the nature of the challenges faced in differ-ent regions and to explore common themes.
We give particular attention to ‘Full-chain NUE’ (as defined and discussed in Section 6.1) in the context of in-ternational policies, as well as to NUE of the component stages, such as crop NUE, livestock NUE. This approach is relevant for all sources of nutrients, including mined P, Nr from industrial manufacture, biological nitrogen fixa-tion and from potential future NOx recapture technology.
In considering all of the country case-studies which follow, the message clearly emerges that there is a com-mon need to improve Full-chain Nutrient Use Efficiency (NUE) and its components: improving NUE becomes the central element in meeting the challenge ‘to produce more food and energy with less pollution’.
On the following pages, Table 7.1 provides a quick overview of the key issues and differences between re-gions. This is followed by short case-studies of experi-ence with nutrient policies in sub-Saharan Africa, Latin America, United States, Europe, India and China.
Our Nutrient World_reflowed.indd 77 30/01/2013 10:27:14

78 global overview on nutrient management
Sub-
Saha
ran
Afr
ica
Latin
Am
eric
aEu
rope
and
Nor
th A
mer
ica
Sout
h an
d C
entr
al A
sia
Sout
h Ea
st A
sia
Mai
n N
utrie
nt
Thre
ats
▪La
ck o
f acc
ess b
y fa
rmer
s to
N a
nd P
lim
its fo
od p
rodu
c-tio
n an
d ex
acte
rbat
es la
nd
degr
adat
ion.
▪
Littl
e in
vest
men
t in
fert
il-iz
er p
rodu
ctio
n, w
ith e
xist
ing
faci
litie
s foc
used
on
expo
rt.
▪La
ck o
f acc
ess b
y sm
all l
and-
hold
ers t
o bo
th N
and
P li
mits
fo
od p
rodu
ctio
n, e
spec
ially
ex
acer
batin
g th
e de
grad
atio
n of
ext
ensiv
e pa
stur
elan
d.
▪N
utrie
nt p
ollu
tion
from
inte
n-siv
e fa
rmin
g, u
rban
are
as a
nd
sew
age
affec
ts e
cosy
stem
and
hu
man
hea
lth.
▪H
igh
pollu
tion
impa
cts o
n he
alth
and
env
ironm
ent f
rom
N
and
P lo
sses
from
com
bus-
tion,
agr
icul
ture
and
sew
age.
▪H
igh
expo
sure
to p
oten
tial
risk
of fu
ture
P sh
orta
ge
▪D
eter
iora
tion
of a
gric
ultu
ral
soils
due
to u
nder
use,
imba
l-an
ced
use
(exc
ess N
rela
tive
to
othe
r nut
rient
s) a
nd o
veru
se.
▪Po
llutio
n im
pact
s fro
m N
and
P
on e
nviro
nmen
t & h
ealth
▪Ve
ry h
igh
pollu
tion
impa
cts
on h
uman
hea
lth a
nd e
nviro
n-m
ent f
rom
hig
h N
& P
rele
ases
to
air,
soil
and
wat
er.
▪Va
ryin
g ex
posu
re to
pot
entia
l ris
k of
futu
re P
shor
tage
.
Link
ed
soci
oeco
nom
ic
chal
leng
es
Nee
d fo
r im
port
s of N
, P, a
nd
for d
evel
opm
ent o
f exi
stin
g nu
trie
nt so
urce
s, co
mbi
ned
with
w
eak
infr
astr
uctu
re li
mits
acc
ess
to fe
rtili
zers
cons
trai
ning
food
pr
oduc
tion.
Nee
d fo
r im
port
s of N
, P co
m-
bine
d w
ith in
crea
sing
dem
ands
of
fert
ilize
r cou
ld in
crea
se p
ro-
duct
ion
cost
s.
Logi
stic
al ch
alle
nges
, esp
ecia
lly
rela
ted
to tr
ansp
orta
tion
Man
y en
viro
nmen
tal p
olic
ies,
but r
etic
ence
for n
ew /
join
ed-
up p
olic
ies.
Lim
ited
prog
ress
in
agr
icul
ture
link
ed to
mar
ket
perc
eptio
ns.
Incr
easin
g pe
r cap
ita co
nsum
p-tio
n is
exac
erba
ting
N a
nd P
po
llutio
n. A
focu
s on
impr
oved
N
UE
and
recy
clin
g is
also
ne
eded
that
doe
s not
com
pro-
mise
food
secu
rity.
Polic
ies f
or fo
od se
curit
y co
ncer
ns h
ave
led
to fe
rtili
zer
over
use.
Incr
easin
g pe
r cap
ita
cons
umpt
ion
and
low
man
ure r
e-cy
clin
g ar
e ex
acer
batin
g ex
trem
e N
and
P p
ollu
tion.
St
atus
of k
ey
driv
ers
Agr
icul
tura
l sou
rces
: ver
y lo
w
per c
apita
cons
umpt
ion
of a
ni-
mal
pro
duct
s, w
ith lo
w fe
rtili
zer
and
feed
inpu
ts. H
igh
leve
l of
recy
clin
g pr
actic
es, b
ut re
cycl
ed
inpu
ts li
mite
d in
qua
ntity
and
qu
ality
. Ava
ilabl
e P-
rock
dep
osits
la
ck in
vest
men
t to
supp
ort
prod
uctio
n.
Agr
icul
tura
l sou
rces
: soc
ial
dyna
mic
s con
tras
t tra
ditio
nal
smal
l lan
dhol
ders
with
mod
ern
agrib
usin
ess l
eadi
ng to
une
ven
fert
ilize
r use
. Inc
reas
ing
bioe
n-er
gy p
rodu
ctio
n an
d co
nsum
p-tio
n of
ani
mal
pro
duct
s, w
ith lo
w
fert
ilize
r & fe
ed in
puts
(gra
ss-fe
d be
ef).
Littl
e cu
rren
t foc
us o
n lo
w-e
miss
ion
met
hods
.
Agr
icul
tura
l sou
rces
: ver
y hi
gh
per c
apita
cons
umpt
ion
of a
ni-
mal
pro
duct
s, re
quiri
ng la
rge
fer-
tiliz
er in
put a
nd n
et fe
ed im
port
in
man
y co
untr
ies.
Wid
e ra
nge
of
prac
tices
, inc
ludi
ng a
dopt
ion
of
low
-em
issio
n m
etho
ds in
a fe
w
coun
trie
s.
Agr
icul
tura
l sou
rces
: une
ven
fert
ilize
r use
, foo
d co
nsum
p-tio
n sh
iftin
g fr
om co
arse
gra
ins
to fi
ne g
rain
s and
from
veg
-et
aria
nism
to m
eat.
Hig
h le
vel o
f re
cycl
ing
prac
tices
ada
ptab
le fo
r em
issio
n re
duct
ion.
Agr
icul
tura
l sou
rces
: rap
idly
in
crea
sing
per c
apita
cons
ump-
tion
of a
nim
al p
rodu
cts,
with
in
crea
sing
fert
ilize
r and
feed
in
puts
. Low
cur
rent
atte
ntio
n to
recy
clin
g an
d lo
w e
miss
ion
oppo
rtun
ities
.
Sew
age
sour
ces:
very
low
per
ca
pita
cons
umpt
ion,
but
lack
of
polic
ies a
nd im
plem
enta
tion
of
basic
wat
er tr
eatm
ent.
Sew
age
sour
ces:
basic
sew
age
trea
tmen
t is i
ncre
asin
g, a
s wel
l as
per c
apita
cons
umpt
ion,
but
ba-
sic w
ater
trea
tmen
t is n
ot e
qual
ly
dist
ribut
ed in
the
regi
on.
Sew
age
sour
ces:
very
hig
h pe
r ca
pita
cons
umpt
ion,
with
bas
ic
sew
age
trea
tmen
t, bu
t litt
le re
-cy
clin
g of
sew
age
N, P
and
littl
e te
rtia
ry N
trea
tmen
t in
the
USA
.
Sew
age
sour
ces:
incr
easin
g se
wag
e lo
adin
g du
e to
risin
g pe
r cap
ita co
nsum
ptio
n, u
neve
n tr
eatm
ent p
olic
ies/
stra
tegi
es a
nd
thei
r poo
r im
plem
enta
tion.
Sew
age
sour
ces:
incr
easin
g pe
r ca
pita
cons
umpt
ion,
dec
reas
ing
focu
s on
recy
clin
g an
d la
ck o
f w
aste
wat
er tr
eatm
ent p
olic
ies.
Com
bust
ion
sour
ces:
low
per
ca
pita
cons
umpt
ion,
but
man
y co
mbu
stio
n so
urce
s stil
l hav
e hi
gh e
miss
ion
rate
s.
Com
bust
ion
sour
ces:
biom
ass
burn
ing
and
tran
spor
tatio
n in
urb
an a
reas
(esp
ecia
lly in
m
egac
ities
as S
ão P
aulo
and
M
exic
o ci
ty) a
re m
ajor
sour
ces o
f at
mos
pher
ic p
ollu
tion.
Com
bust
ion
sour
ces:
mod
ern
tech
nolo
gies
hav
e re
duce
d N
Ox
emiss
ions
, but
ver
y hi
gh a
nd st
ill
incr
easin
g pe
r cap
ita e
nerg
y co
n-su
mpt
ion
and
tran
spor
t use
.
Com
bust
ion
sour
ces:
incr
easin
g pe
r cap
ita co
nsum
ptio
n ra
ising
ur
ban
emiss
ion
from
tran
spor
t, en
ergy
and
indu
stry
. Hig
h ru
ral
emiss
ion
due
to in
effici
ent d
o-m
estic
fuel
s.
Com
bust
ion
sour
ces:
incr
easin
g pe
r cap
ita co
nsum
ptio
n, w
hile
m
any
com
bust
ion
sour
ces h
ave
high
em
issio
n ra
tes.
Tab
le 7
.1
Over
view
of n
utrie
nt is
sues
, thr
eats
and
pol
icie
s fo
r sel
ecte
d w
orld
regi
ons.
Our Nutrient World_reflowed.indd 78 30/01/2013 10:27:15

79global overview on nutrient management
Not
es:
1.
Ann
ual i
nput
s per
hec
tare
of a
gric
ultu
ral l
and,
2.
Av
erag
e an
d ra
nge
of co
untr
y va
lues
. Nat
iona
l cro
p N
UE
base
d on
N in
nat
iona
l har
vest
ed cr
ops a
s a %
of t
he to
tal f
ertil
izer
N in
put (
deriv
ed fr
om F
AO
dat
a fo
r 200
8). V
alue
s in
brac
kets
ar
e th
e ra
nge
of n
atio
nal v
alue
s acc
ordi
ng to
App
endi
x, T
able
A1.
Val
ues i
n ex
cess
of c
.70%
impl
y ‘so
il m
inin
g’ th
ereb
y de
grad
ing
agric
ultu
ral l
and
for f
utur
e ge
nera
tions
. See
text
for
disc
ussio
n on
opt
imal
/targ
et v
alue
s of c
rop
NU
E.3.
Av
erag
e an
d ra
nge
of co
untr
y va
lues
. Nat
iona
l Ful
l-cha
in N
UE
defin
ed a
s nut
rient
s con
sum
ed b
y hu
man
s as a
% o
f the
tota
l inp
uts (
fert
ilize
r, fix
atio
n an
d ne
t im
port
). (d
eriv
ed fr
om F
AO
da
ta fo
r 200
8)4.
Av
erag
e an
d ra
nge
of co
untr
y va
lues
. Ann
ual p
er c
apita
Nr i
nput
incl
udin
g in
dust
rial fi
xatio
n by
the
Hab
er-B
osch
, com
bust
ion
fixat
ion
as N
Ox,
biol
ogic
al N
fixa
tion
and
net i
mpo
rt at
a
natio
nal l
evel
. Val
ues b
ased
on
the
mea
n an
d ra
nges
for r
egio
ns a
re g
iven
acc
ordi
ng to
App
endi
x, T
able
A1.
Sub-
Saha
ran
Afr
ica
Latin
Am
eric
aEu
rope
and
Nor
th A
mer
ica
Sout
h an
d C
entr
al A
sia
Sout
h Ea
st A
sia
Loca
l val
ues
Ty
pica
l fiel
d
N &
P in
puts
18
(0-2
0) k
g N
0.
5 (0
-2) k
g P
60 (0
-120
) kg
N
20 (4
-35)
kg
P 80
(50-
300)
kg
N5
(2-1
0) k
g P
40 (1
0 –
200)
kg
N3
(1-8
) kg
P25
0 (5
0 –
1000
) kg
N45
(20-
100)
kg
PN
atio
nal v
alue
s
Cro
p N
UE2
91 (2
9-18
7)26
(6-6
8)35
(8-6
8)58
(15-
146)
30 (7
-79)
Ful
l-cha
in
NU
E339
(4-1
12)
22 (6
-56)
22 (7
-52)
33 (8
-106
)23
(1-4
2)
kg
Nr i
nput
per
p
erso
n417
(1-1
52)
39 (3
-102
)60
(9-1
06)
24 (6
-140
)28
(1-4
08)
Out
look
ac
cord
ing
to
curr
ent p
olic
ies
Ther
e is
only
wea
k im
plem
en-
tatio
n of
nat
iona
l, re
gion
al
and
glob
al p
olic
ies t
o en
sure
ad
equa
te N
& P
supp
ly to
smal
l-ho
lder
farm
ers.
Lack
of e
ffect
ive
infr
astr
uctu
re to
supp
ly N
& P
fr
om d
istan
t sou
rces
incr
ease
s fe
rtili
zer p
rices
mak
ing
them
un-
affor
dabl
e fo
r man
y sm
allh
olde
r fa
rmer
s.
A la
ck o
f effe
ctiv
e pol
icie
s to
ensu
re ad
equa
te N
& P
supp
ly
to sm
all l
andh
olde
rs. A
maj
or
chal
leng
e is t
o de
velo
p po
licie
s th
at h
andl
e the
pol
ariz
atio
n be
twee
n sm
allh
olde
r far
mer
s an
d su
bsta
ntia
l agr
ic-b
usin
ess
inte
rests
in th
e cro
p an
d liv
esto
ck
sect
ors.
Insu
ffici
ent a
ir an
d w
ater
po
licie
s, in
cludi
ng fo
r loc
al an
d tr
ansb
ound
ary
air p
ollu
tion
from
bi
omas
s bur
ning
.
NO
x em
issio
ns re
duce
d by
~30
-40
% si
nce
1995
; litt
le re
duct
ion
in N
H3 a
nd N
2O e
miss
ions
(<
5%).
NH
3 em
issio
ns st
ill
incr
easin
g in
som
e ar
eas (
cent
ral
US,
sout
h-w
est E
urop
e). S
ewag
e P
loss
es d
ecre
ased
subs
tant
ially
in
Eur
ope,
but m
uch
N a
nd P
still
lo
st to
wat
er co
urse
s. Po
licy
syn-
ergi
es n
ot b
eing
fully
exp
loite
d.
N fe
rtili
zer i
s sub
sidiz
ed in
som
e co
untr
ies.
A n
ew ‘n
utrie
nt-b
ased
’ su
bsid
y in
Indi
a m
ay ra
ise N
UE;
ba
nnin
g bi
omas
s bur
ning
has
he
lped
whe
re im
plem
ente
d.
Stro
nger
pol
icie
s and
impl
emen
-ta
tion
are
need
ed fo
r int
egra
ted
nutr
ient
man
agem
ent,
inc.
crop
s, liv
esto
ck, a
quac
ultu
re, a
utom
o-bi
le, e
nerg
y an
d ot
her s
ecto
rs to
re
duce
N &
P p
ollu
tion.
N fe
rtili
zer i
s sub
sidiz
ed in
C
hina
, with
ove
ruse
in a
rabl
e la
nd a
nd lo
w N
UE.
Few
nut
rient
m
itiga
tion
polic
ies a
re a
dopt
ed.
Furt
her a
ctio
n is
vita
l to
avoi
d ex
trem
e N
& P
em
issio
n an
d po
llutio
n as
futu
re co
nsum
ptio
n in
crea
ses.
Key
need
s for
fu
ture
pol
icie
sC
omm
itmen
t to
impr
ove
infr
a-st
ruct
ure
for a
dequ
ate
N &
P
supp
ly to
farm
ers,
whi
le d
evel
op-
ing
exist
ing
recy
clin
g be
st-p
rac-
tices
and
impr
ovin
g N
UE.
Com
mitm
ents
to im
prov
e in
fra-
stru
ctur
e fo
r ade
quat
e N
& P
su
pply
to sm
all l
andh
olde
rs, t
o re
duce
surp
luse
s and
incr
ease
fu
ll ch
ain
NU
E (g
iven
incr
easin
g pe
r cap
ita co
nsum
ptio
n), i
nc. r
e-cy
clin
g of
nut
rient
s fro
m w
aste
s, an
d st
abili
zing
cons
umpt
ion
of
anim
al p
rodu
cts.
Com
mitm
ent t
o re
duce
nut
rient
su
rplu
ses a
nd in
crea
se N
UE
in
agric
ultu
re; r
ecyc
ling
of N
& P
in
was
te w
ater
; red
uce
per c
apita
ov
er-c
onsu
mpt
ion
of a
nim
al
prod
ucts
tow
ards
env
ironm
enta
l an
d he
alth
gui
delin
es.
Com
mitm
ent t
o re
duce
surp
luse
s an
d in
crea
se fu
ll ch
ain
nutr
i-en
t use
effi
cien
cy fo
r pla
nt a
nd
anim
al fo
ods a
ssum
ing
incr
ease
d pe
r cap
ita co
nsum
ptio
n, in
c. re
-cy
clin
g of
nut
rient
s fro
m w
aste
s, an
d st
abili
zing
cons
umpt
ion
of
anim
al p
rodu
cts.
Com
mitm
ent t
o re
duce
surp
luse
s an
d in
crea
se fu
ll ch
ain
NU
E fo
r pl
ant a
nd a
nim
al fo
ods u
nder
th
e an
ticip
atio
n of
incr
easin
g pe
r ca
pita
cons
umpt
ion.
Our Nutrient World_reflowed.indd 79 30/01/2013 10:27:15

80 global overview on nutrient management
7.4 Case Study 1: Sub-Saharan Africa, Current nutrient policies and barriers to changeIt has been said that: Poor people are poor because mar-kets fail them and governments fail them (Devarajan, 2008). The arrangements of capital markets in develop-ing countries are such that economies of scale will not en-sure that smallholder farmers get the services they need to practice agriculture as a business, including access to nutrient inputs. To overcome this, governments and in-ternational institutions have stepped in with well-inten-tioned policies and incentives, with different degrees of success. African countries recognize, for example, that to make a lasting solution to increased nutrient inputs into African agriculture from external sources, there is need to sustain robust distribution networks including adequate credit sources, retail outlets, transportation, as well as transfer of technology and knowledge for efficient input use (Africa Fertiliser Summit, 2006, see IFDC, 2007). There appears to be a trend in improving agricultural growth in countries where such infrastructure is in place. Based on the FAOSTAT Data of 2007-8, it has been shown (Nkonya, pers. comm.) that the countries with the high-est N fertilizer application rate in Africa were Mauritius, South Africa, Zambia, Malawi, Zimbabwe, Kenya, Mali and Nigeria, all of which have good road network den-sity and/or with fertilizer subsidy programs (Zambia, Malawi, Mali, Nigeria). Such countries exhibit, among
other things, stronger leadership, an improving business climate, innovation and market-based solutions (see Box 7.1). There is a need to overcome government failure to implement policies that work, especially in those coun-tries that have yet to implement actions to which they are already signatories.
These and other high profile fertilizer subsidy programs, such as that of Malawi, are targeting smallholder farmers. While problems remain in their implementation, yields have increased dramatically: For example, Malawi went from being a net maize importer, dependent on food aid, to producing a surplus, exporting this to neighbouring countries (Denning et al., 2009). The NUE of the applied fertilizer, however, has been estimated to be low, with a partial factor productivity of only 12 kg grain per kg N ap-plied (Dorward et al. 2008; compare Figure 2.6), resulting in losses to the environment. Improved site-specific fertil-izer recommendations and strengthened extension services would increase NUE and yields while reducing losses.
7.5 Case Study 2: Nutrient policies in Latin AmericaIn this section we compare policies in two countries, Brazil and Mexico. The present situation in Mexico is highlighted in Box 7.2.
Brazil is the largest country in Latin America and the fifth largest in the world, with an area of 850 million ha (5.7% of the planet´s dry land and 21% of the land area
Box 7.1 Raising yields: the case for economic reforms in the fertilizer sector in KenyaAchievements
7 Maize remains a staple food to a large proportion of people in Kenya, and receives a fair share of fertilizer inputs, after coffee and tea.
7 The Kenya maize production has steadily grown over time, rising from about 2.6 billion tons in 2001 to about 3.8 billion in 2010.
Key drivers of successPolicies toward promoting the free market and reducing transaction costs brought about important changes in the Kenyan fertilizer sector:
7 The government targeted the fertilizer sector for support and liberalization; 7 In 1990, government removed import quota restrictions and abolished licensing requirements for fertilizer
imports; 7 In 1993, government liberalized the sector and allowed participation of the private sector in importing, trading
and distribution; 7 In 2009, custom duties and value added taxes imposed on fertilizer were removed; retail price controls were
eliminated too; 7 There was a rapid response in investment by the private sector; for example, fertilizer retailers increased from
5000 in 1996 to 8000 by 2000 (Jayne et al., 2003); 7 Government targeted resource-poor and disadvantaged farmers with start-up grants (voucher system) also
establishing linkages with input dealers, produce markets and financial services; 7 The use of vouchers enabled farmers to access inputs within their localities in a timely manner. In order not to
create perpetual dependency, this is a one-time subsidy for each beneficiary; 7 Farmers are able to take advantage of this procedure because of their experiences and capacity to use fertilizers; 7 Government is addressing the problems of poor infrastructure, bad roads, and associated high transport costs
so as to facilitate further development and growth of the agricultural sector.
Our Nutrient World_reflowed.indd 80 30/01/2013 10:27:15

81global overview on nutrient management
of the American continent). Between 2000 and 2010 the country’s population grew by 12%, making it the world’s fifth largest population with 191 million inhabitants, of which 84% live in urban areas (UN Habitat, 2011). Brazil is an urban-industrial country with an economy partly anchored in the export of primary products, including agricultural commodities. The processes of intensification of agricultural activities and urbanization in Brazil in the last decades, their interactions and consequences in terms of land use changes are important drivers in changes of N and P cycling in Brazilian ecosystems.
The agriculture production and productivity have in-creased substantially in Brazil, and consequently so has the use of fertilizer and pesticides. The country produced, in 2011, 163 million ton of grains in 50 million ha. The cattle stock in the country reached 212 million heads, mainly grass fed, with low occupancy (mean of 1 head per hectare), and low fertilizer consumption. Poultry reached more than 1,000 million heads. The nitrogen fertilizer
use in 2011 reached 3.0 million ton driven mainly by the production of sugar cane, cotton, corn, coffee, wheat and rice. Low N fertilizer demand crops such as soy and other beans occupy 48 and 8%, respectively, of all crop area in the country. Total fertilizer consumption in 2011 reached 25 million tons. Current legislation prescribes quality cri-teria of inorganic fertilizers in terms of contaminants (e.g. heavy metals), but there is no specific policy to regulate the excessive use of N or P fertilizers.
In 1970s, the first state laws on water pollution emerged in Brazil with emission standards being the same for any source of pollution. Nevertheless, in practice, stronger de-mands were placed on private companies (industrial ef-fluents) to reduce pollution releases than placed on public agencies (sewage). In recent years when policy makers were demanded to establish effective control of pollu-tion by sewage from cities hundreds of treatment systems were deployed. In Brazil, the proportion of households with adequate sanitation rose from 45% in 1991 to 62%
Box 7.2 Nitrogen and nutrient policies in MexicoAgriculture is the largest contributor to Nr emissions (62% of the 39 kt calculated in 2002), followed by waste-water treatment and management (16%) and transport (14%). Government policies and monitoring programs are es-sentially focused on fertilizer management for intensive agriculture, emissions from industry and automobiles, and sewage water monitoring and treatment programs.
In the agricultural sector, Mexico is regarded along with Brazil as the two Latin American countries with a higher fertilizer use. Studies in specific agricultural regions show that up to 40% of fertilizer cannot be accounted for in crop systems, suggesting important losses to the environment and potentially serious pollution problems. Fertilizer management in irrigation areas is closely related to water management. Due to these problems, agricultural research centers like CIMMyT (the International Maize and Wheat Improvement Center, which is based in Mexico), are conducting investigations to establish more efficient N fertilization programs for wheat cultivation. Manure is rarely used as fertilizer, but is becoming increasingly popular due to the steady increase in the costs of chemical fertilizers and the demand for organic production of some profitable crops (avocado, coffee, lime, berries), driven mainly by European markets. Only 10% of manure is currently used to return to agriculture or pasture fields, but this figure is increasing despite the overall reduction in animal production (beef production is decreasing, while poultry is increasing). Still, chemical N fertilizer use is the most widespread, promoted and often subsidized by agricultural programs and local governments without concomitant education, extension or consultant support towards a reduc-tion in fertilizer use or an improvement in NUE. There is no national program to reduce or monitor water pollution or quality in rural areas, even though it is repeatedly mentioned in the environmental agenda.
Emissions of nitrogen oxides (NOx) and nitrous oxide (N2O) from industry and automobile combustion are monitored by the National Institute of Ecology to establish critical areas requiring emission controls, especially in large cities where these programs are currently implemented. However, the coverage of the programs is still small and stronger policy is needed both to increase the number of urban areas under emission control programs and to replace old and polluting vehicles.
Nitrogen flows through water systems derived from industry and sewage water represent a major problem for Mexico through surface and deep water pollution of aquifers and through eutrophication of coastal areas. Policy and management programs are established at the national and municipality levels through the Mexican Institute for Water Technology within the Ministry of the Environment and Natural Resources and through local and regional organizations. For example, the Junta Intermunicipal de Medio Ambiente para la Gestión Integral de la Cuenca Baja del Río Ayuquila (JIRA) promotes concrete actions at the municipality level to reduce pollution in the Ayuquila and Tuxcacuesco Rivers derived from industrial and urban water discharges. Other local government organizations exist although they are not widespread in the country.
Treatment plants for sewage water have been built and are promoted, although the effort is not generalized and is frequently influenced by both political and economic interests. Only 36% of sewage water is treated. Treatment plants have increased, but so has the amount of people migrating from rural to urban areas, which is now 78% of the total population. Therefore, water treatment is clearly insufficient and lagging behind the migration of people to cities.
Our Nutrient World_reflowed.indd 81 30/01/2013 10:27:15

82 global overview on nutrient management
in 2010. Currently, in Brazil, the average daily water con-sumption per person is 150 litres, with 80% of the water consumed being transformed into sewage. According to the Brazilian Ministry of Cities, only 45% of the popula-tion is connected to sewage networks, and in relation to sewage collected, only about 40% is treated. The increas-ing number of sewage treatment plants in the country is related to the use of sewage sludge in agricultural areas.
The use of sewage sludge in agriculture is governed by implementing rules that take into account their physical, chemical and biological characteristics, as well as the area where it is applied in order to reduce the risk of environ-mental contamination by harmful substances and chemi-cals. The content of mineral and organic N in sewage sludge, the mineralization rate and the crop demand for N are critical factors to determine the application. However, an important aspect of the agricultural use of sewage sludge, still poorly investigated in tropical soils, refers to the possibility of contamination of the groundwater and streams with nitrate resulting from mineralization of or-ganic N in sludge. Some research papers indicated that significant amounts of nitrate can move to layers underly-ing the rooting zone of annual crops, setting a high risk of water contamination.
In addition to water pollution, air pollution in urban centers and agricultural areas creates high costs for society. Increased reactive Nr deposition is also due to expansion of agro-industry. Measurements of the main inorganic ni-trogen species nitrogen dioxide (NO2), ammonia (NH3), nitric acid (HNO3) and aerosol nitrate (NO3-) and ammo-nium (NH4) indicate that oxidized species were estimated to account for ∼90% of dry deposited Nr, due to the region’s large emissions of nitrogen oxides (NOx) from biomass burning and road transport. Nr from NO2 is important closer to urban areas, however, overall, HNO3 represents the largest component of dry deposited Nr.
The Brazilian Forest Code foresees the creation and implementation of National Policy on Management, Prevention and Control of Forest Fires, which should increase resources and allow greater articulation to gov-ernment to control fires, still widely used in deforesta-tion practices and management of pasture areas (which often drives fires occurrence in adjacent forested areas). Another substantial source of Nr in the atmosphere is sugarcane burning before harvesting. Public policies are being implemented to gradually eliminate this practice by 2014. With support of the federal government, many states are developing plans to control air pollution from transportation.
7.6 Case Study 3: Reactive nitrogen and phosphorus in the United States The Clean Water Act and the Clear Air Act passed by the US Congress in the 1970s and subsequently amended have greatly improved the quality of air and water in the USA. Expansion of secondary sewage treatment, controls on point sources of water pollution, and reduced use of
phosphorus detergents resulted in clean up of many rivers and lakes. Similarly, air pollution regulations in industrial, energy, and transportation sectors have resulted in de-creased NOx emissions and reductions in ground level O3 exposures. However, non-point agricultural sources of NO3-
and PO43- losses to surface waters and groundwaters remain problematic, NH3 emissions from agriculture and livestock operations are growing and mostly unregulated, and many localities still experience NOx, O3, and particle matter con-centrations above regulatory levels. Deposition of N onto native ecosystems has reduced biodiversity and contributed to expansion of exotic species. Both shallow wellwater and deep groundwater concentrations of NO3- are increasing in many agricultural regions, and the number of coastal areas experiencing hypoxia due to N and P loading is increasing. The potential of significant improvement in nutrient use ef-ficiently in agricultural has been demonstrated, and many diverse programs have been implemented regionally to en-courage farmer participation, but many economic, social, and political impediments remain for the widespread op-tion of these practices which are needed to further improve air and water quality (see Box 7.3).
7.7 Case Study 4: Nutrient-related policies in the European UnionEnvironmental policy in the European Union is mostly established through Directives, implementing envi-ronmental objectives to be achieved by the 27 Member States. Directives set the framework in which Member States must then create national legislation directed to stakeholders in order to attain the environmental qual-ity objectives laid down in the Directives. In contrast, EU agricultural policy is mostly established through so-called Regulations. These Regulations are directly binding for Member States and, depending on the issue, the specific stakeholders. Hence, Directives provide more flexibility to Member States than Regulations as regards their im-plementation. Directives are commonly based on regula-tory instruments and the Regulations themselves are then based on a mixture of economic instruments and regula-tory instruments.
Understanding EU environmental policy requires in-sight in the changes in understanding and perception of cause-effect relationships over time by scientists and poli-cy makers. Several Directives specifically deal with one or more Nr species. None of the Directives specifically deals with P, although targets for both N and P are included in the Water Framework Directive (see below). Many cur-rent policy measures dealing with Nr emissions reflect a simple ‘source – receptor/effect’ model of understanding. Combustion (mainly NOx by industry, power plants and traffic), waste waters (Nr and P in discharges by indus-try and households) and agriculture (diffuse emissions of NH3 and N2O to air and NO3- to waters) are seen as the main sources, while atmosphere, surface waters and groundwater are all seen as the direct receptors. Thus, many policy measures focus on decreasing N emissions
Our Nutrient World_reflowed.indd 82 30/01/2013 10:27:15

83global overview on nutrient management
Box 7.3 Key policy challenges for nitrogen and phosphorus in the United States
Sources 7 Approximately 29 Tg (1012 g) of newly formed Nr are introduced annually into the US; with about 25 Tg N
introduced intentionally with N fertilizers and with the cultivation of crops that biologically fix N. 7 The remainder, approximately 15-20 % of the total, occurs from unintentional N fixation derived from vehicle
use, fossil fuel combustion by stationary power plants, industrial boilers, and other similar processes, mostly emitted to the air as nitrogen oxides (NOx) and nitrous oxide (N2O).
7 On an annual basis, about 54 % (14 Tg N) of intentionally introduced Nr is converted to food, livestock feed, biofuel (energy), or industrial products. Considering only the agricultural sector, approximately 38 % of US agricultural N inputs enter the annual food and livestock feed supply.
7 Emissions of Nr to air from the energy and transportation sectors are declining (mostly as NOx), but agricul-tural emissions (mostly as ammonia (NH3) and N2O) are increasing.
Impacts 7 Two-thirds of US coastal systems are moderately to severely impaired due to nutrient loading; there are now
nearly 300 hypoxic (low oxygen) zones along the US coastline and the number is growing. 7 Many surface waters remain negatively impacted by Nr and P, causing well-known water quality problems as-
sociated with eutrophication, despite reductions in point source pollution since the 1970s. 7 National efforts continue to mitigate non-point nutrient pollution from agriculture, leading the U.S.
Environmental Protection Agency to take an eco-regional approach when defining nutrient criteria for both causative (N, P) and response variables that are associated with the prevention and assessment of eutrophic conditions (such as chlorophyll a and turbidity).
7 Air pollution continues to reduce biodiversity. A nation-wide assessment has documented losses of N-sensitive native species in favour of exotic, invasive species.
7 The best estimates are that more than 1.5 million Americans drink well-water contaminated with too much (or close to too much) nitrate, potentially placing them at increased risk of birth defects and cancer, although more research is needed on these health risks.
7 Overall, the effect of N cycling processes in the US on global warming is probably a modest cooling effect for a 20-year time frame, and a modest warming for a 100-year time frame. Combustion sources are likely causing cooling, and are declining in the US due to enforcement of air pollution regulations for human health. In con-trast, most agricultural sources cause long-term warming, especially N2O, and are mostly unregulated.
Existing policies and barriers to change 7 Regulation of NOx emissions from energy and transportation sectors has greatly improved air quality, espe-
cially in the eastern US. NOx is expected to decline further as stronger regulations take effect. 7 Emissions of NH3 remain mostly unregulated. These emissions are expected to increase unless better controls
on NH3 emissions from livestock operations are implemented. 7 Nitrogen loss from farm and livestock operations can be reduced 30-50% using current practices and technolo-
gies and up to 70-90% with innovative applications of existing methods, relevant for reducing nitrate leaching, and emissions of NH3, N2O and N2.
7 Phosphorus is building-up to very high levels in many US states, particularly where animal agriculture is con-centrated. This has led to contentious new policies that restrict land application of manures and sewage sludge based on risk assessment for P loss to water. Considerable progress has been made nationally in P manage-ment by animal agriculture, through implementation of comprehensive nutrient management plans. However, long-term impacts from ‘legacy’ soil P are expected and management options to deplete P saturated soils are currently limited.
7 Current US agricultural policies and support systems and declining investments in agricultural extension impede the adoption of these practices.
Based on Suddick et al. (2012) and Davidson et al. (2012)
Our Nutrient World_reflowed.indd 83 30/01/2013 10:27:15

84 global overview on nutrient management
from specific sources and/or on decreasing Nr concentra-tions in specific receiving bodies (receptors) below critical concentrations (e.g. Figure 7.2).
Currently, there is an overarching Directive dealing with air quality (including ‘daughter directives’), which sets critical values for a range of pollutant concentrations and release rates to air. This is supported by the Directive on National Emission Ceilings, which sets maximum emis-sions from each Member State for a range of air pollutants (including NOx and NH3), and by the Industrial Emissions Directive, which requires Best Available Techniques (BAT) to be used by specified industrial operations, including large pig and poultry farms (Oenema et al., 2011). While these directives set ambitious requirements for NOx emis-sions, so far they have made only modest requirements for reducing NH3 emissions. This is illustrated by the recent revision of the ‘Gothenburg Protocol’ of the United Nations Economic Commission for Europe (UNECE), under the Convention on Long-range Transboundary Air Pollution (CLRTAP), which includes signatories from across Europe, North America and Central Asia (Reis et al., 2012).
As regards nutrient loss to water, the Water Framework Directive (WFD) provides an overarching agreement that incorporates the Urban Waste Water Treatment Directive, the Nitrates Directive and Groundwater Directive, and the Marine Strategy Framework Directive. These
agreements set limit values and targets for pollutants for specific catchments, rivers, lakes, groundwater bodies, and coastal zones, although it has proved challenging to meet all these targets, especially regarding agricultural sources (Oenema et al. 2011).
The Common Agricultural Policy (CAP) of the EU was established already in 1958 and has since then undergone a series of reforms, including the so-called ‘cross-com-pliance regulation’, which requires farmers to implement all statutory environmental Directives and good agricul-tural and environmental practices in exchange for sup-port (direct payments). In practice, this requirement does not extend to all relevant Directives, such as the Habitat Directive, which sets a precautionary approach for protec-tion of Europe’s biodiversity, including the establishment of Special Areas of Conservation (SACs). The farm sup-port payments are therefore not currently tested against the possible impact of agricultural activities on SACs, such as from different kinds of N and P release to the en-vironment (Hicks et al., 2011). Current reform of CAP is especially aimed at increasing cross-compliance toward better environmental performance.
In addition to the Habitats Directive, the Biofuel Directive, is also relevant for nutrient use, as this sets tar-gets for Member States to increase the share of biofuels in replacing fossil fuels. This provides a significant driver
Figure 7.1 Water quality criteria for nutrients (N, P) have been defined by eco-regions across the United States based on the type of freshwater systems present. These criteria represent surface waters that are minimally impacted by anthropogenic activities that cause eutrophication and are recommended baseline values that identify problem areas and serve as goals for successful restoration of ecological health in various types of waters (EPA, 2012). The regions must address a substantial spatial variation in amounts of excess manure nitrogen as shown here (assuming no export of manure from farms).
Our Nutrient World_reflowed.indd 84 30/01/2013 10:27:18

85global overview on nutrient management
for increasing the amount of bioenergy crops, including interactions with land-use change in other countries.
So far, policy measures aimed at decreasing N species emissions have achieved larger responses from combus-tion sources than from urban sources and especially agri-cultural sources. As a result, the highest relative emissions
reductions have been achieved for NOx emissions > Ntotal emissions from urban areas > NO3- leaching from agri-culture > NH3 emissions from agriculture (Oenema et al., 2011). Based on the most recent analysis, there are still major losses of Nr to the European environment, with sub-stantial regional variation, as shown by Figure 7.3. Overall
NOX
NH3
N2O
NO3
Nt
Acidification
Eutrophication
Ground-level ozone(O3) formation
Fine-particle matter(PMX) formation
Toxification
Human health
Biodiversity loss
Food production
Material loss
Climate changeRadiation
interception
Corrosion
Glo
bal
Cha
nge
Emissions targets
Ecological process rate
targets
Human health & ecological
impacts targets
Other substances
Concentrations targets
[NOX] in air
[NH3] in air
[N2O] in air
[NO3] in water bodies
[Nt] surface waters
Interactions
NH4[NH4] in
drinking water
Figure 7.2 Illustration of the major links between the multiple forms of Nr emission and the resulting impacts on different concentration, processes and impact targets (Oenema et al., 2011). While many of the components are addressed by European Union policies, there is often a limited coherency between the different policies. This can make it difficult for policy makers to quantify the full set of trade-offs and co-benefits of particular strategies.
Figure 7.3 Estimated distribution of reactive nitrogen emissions across Europe (expressed as kg N per km2 for 2000) including (left) emissions to air as the sum of NOx, NH3 and N2O, and (right) total losses to aquatic systems, including nitrate and other Nr leaching and wastewaters. These high spatial resolution maps illustrate the challenge of managing nitrogen flows given the wide spatial variation experienced (based on Leip et al., 2011).
Our Nutrient World_reflowed.indd 85 30/01/2013 10:27:32

86 global overview on nutrient management
total N fixation in the EU (by Nr manufacture, BNF and NOx formation) is estimated at 21 Tg N per year, of which 18 Tg is ultimately lost as Nr in water and NH3, NOx and N2O to air. This estimate of 84% Nr loss, indicates that, despite the many European policies, there is substantial progress still to be made.
By comparison with Nr, somewhat larger progress has been made in reducing P losses to water. Analysis by the Oslo and Paris Commission for Protection of the North East Atlantic illustrates how six countries achieved a 50-85% reduction in P losses, compared with 27 to 54% reduc-tion for Nr between 1985 and 2006 (OSPAR, 2008). This can be explained by the relatively larger share of munici-pal sources to P than for Nr, which have achieved a larger reduction in losses than agriculture, with agriculture con-tributing a larger share to the Nr losses. The reduction of P losses achieved is largely due to the banning of P in wash-ing detergents and P removal in sewage water treatment. Similar achievements have been made in the Baltic Sea, reducing P inputs by 45% and Nr inputs by 30% compared with 1990 (HELCOM, 2010; Oenema et al., 2011).
7.8 Case Study 5: Nutrient management policies in IndiaThe recognition of nutrient losses to the environment and their sustainable management varies between regions, sec-tors and levels of implementation. While more policy inputs could help in the medium/long term, effective implementa-tion of existing policies could bring significant gains in the
short term (e.g. site-specific/balanced/integrated nutrient management, banning biomass burning etc.).
The recent Indian policy of nutrient-based subsidy for fertilizers is important in providing incentive to develop and adopt use-efficient and balanced fertilizers, including each of chemical, biological and organic fertilizer sources (see Box 7.4).
India experiences problems of both too much and too little N and P (Abrol et al., 2007, 2008; Singh et al., 2008). Underuse of fertilizers is damaging soil health in vast ar-eas of rain-fed agriculture, while fertilizer overuse is in-creasing in irrigated areas, mainly for cereal production, contributing to increased nutrient losses to the environ-ment. The growth in fertilizer use in the underuse areas can be offset by more efficient use in the overuse areas, in-cluding the recycling of nutrients lost from other sources. For example, cattle dung is best used as manure, but it is also used to make fuel cakes and burnt inefficiently, con-tributes to emissions of both greenhouse gases and par-ticulate matter in the air. Similarly, substantial nutrients are lost in sewage, but never returned to the crops. India has a huge recycling industry, but this does not yet serve nutrient management or the agricultural sector. An en-abling policy framework that gives incentives for nutrient recovery and recycling is needed.
Inadequacies in policies and their enforcement are also leading to losses of nutrients from intensive animal husbandry, aquaculture, poultry, etc. Recycling these nutrients into agriculture is inadequate, uneven and not guided by strong policy incentives. For example, poultry
Figure 7.4 Too much or too little of nitrogen and phosphorus inputs in agriculture: The case of India. District (county)-wise consumption of N and P. (Data Sources: Directorate of economics and statistics, Ministry of Agriculture, Govt. of India, and Fertilizer Association of India).
Our Nutrient World_reflowed.indd 86 30/01/2013 10:27:36
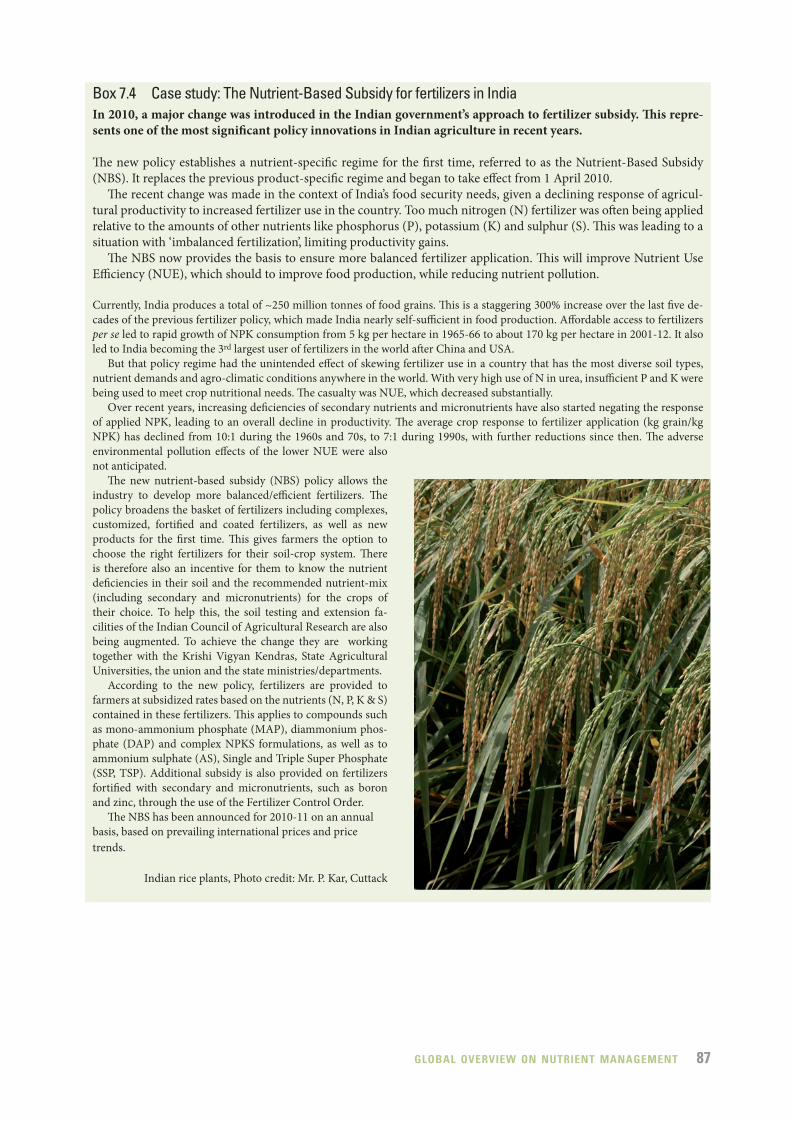
87global overview on nutrient management
Box 7.4 Case study: The Nutrient-Based Subsidy for fertilizers in IndiaIn 2010, a major change was introduced in the Indian government’s approach to fertilizer subsidy. This repre-sents one of the most significant policy innovations in Indian agriculture in recent years.
The new policy establishes a nutrient-specific regime for the first time, referred to as the Nutrient-Based Subsidy (NBS). It replaces the previous product-specific regime and began to take effect from 1 April 2010.
The recent change was made in the context of India’s food security needs, given a declining response of agricul-tural productivity to increased fertilizer use in the country. Too much nitrogen (N) fertilizer was often being applied relative to the amounts of other nutrients like phosphorus (P), potassium (K) and sulphur (S). This was leading to a situation with ‘imbalanced fertilization’, limiting productivity gains.
The NBS now provides the basis to ensure more balanced fertilizer application. This will improve Nutrient Use Efficiency (NUE), which should to improve food production, while reducing nutrient pollution.
Currently, India produces a total of ~250 million tonnes of food grains. This is a staggering 300% increase over the last five de-cades of the previous fertilizer policy, which made India nearly self-sufficient in food production. Affordable access to fertilizers per se led to rapid growth of NPK consumption from 5 kg per hectare in 1965-66 to about 170 kg per hectare in 2001-12. It also led to India becoming the 3rd largest user of fertilizers in the world after China and USA.
But that policy regime had the unintended effect of skewing fertilizer use in a country that has the most diverse soil types, nutrient demands and agro-climatic conditions anywhere in the world. With very high use of N in urea, insufficient P and K were being used to meet crop nutritional needs. The casualty was NUE, which decreased substantially.
Over recent years, increasing deficiencies of secondary nutrients and micronutrients have also started negating the response of applied NPK, leading to an overall decline in productivity. The average crop response to fertilizer application (kg grain/kg NPK) has declined from 10:1 during the 1960s and 70s, to 7:1 during 1990s, with further reductions since then. The adverse environmental pollution effects of the lower NUE were also not anticipated.
The new nutrient-based subsidy (NBS) policy allows the industry to develop more balanced/efficient fertilizers. The policy broadens the basket of fertilizers including complexes, customized, fortified and coated fertilizers, as well as new products for the first time. This gives farmers the option to choose the right fertilizers for their soil-crop system. There is therefore also an incentive for them to know the nutrient deficiencies in their soil and the recommended nutrient-mix (including secondary and micronutrients) for the crops of their choice. To help this, the soil testing and extension fa-cilities of the Indian Council of Agricultural Research are also being augmented. To achieve the change they are working together with the Krishi Vigyan Kendras, State Agricultural Universities, the union and the state ministries/departments.
According to the new policy, fertilizers are provided to farmers at subsidized rates based on the nutrients (N, P, K & S) contained in these fertilizers. This applies to compounds such as mono-ammonium phosphate (MAP), diammonium phos-phate (DAP) and complex NPKS formulations, as well as to ammonium sulphate (AS), Single and Triple Super Phosphate (SSP, TSP). Additional subsidy is also provided on fertilizers fortified with secondary and micronutrients, such as boron and zinc, through the use of the Fertilizer Control Order.
The NBS has been announced for 2010-11 on an annual basis, based on prevailing international prices and price trends.
Indian rice plants, Photo credit: Mr. P. Kar, Cuttack
Our Nutrient World_reflowed.indd 87 30/01/2013 10:27:38

88 global overview on nutrient management
manure is a good source of N and P and is recycled as fertilizer in states like Andhra and Karnataka of India, but there remains a major opportunity to extend such recy-cling approaches much more widely.
In aquaculture, neem cake and karanja cake are used against predator fishes, but this also helps in controlling nitrification-denitrification and the consequent N-losses.
The consumption of animal products occurs only among 4% of the Indian population, but this is growing and its contribution to inefficient nutrient use needs to be factored into the long-term nutrient management plan-ning of India, both considering the implications for food/feed security and for N and P pollution.
In the automobile sector, the growth of private trans-port (especially diesel vehicles) is leading to the growing loss of N as NOx. In Delhi, this trend is reversing major gains made over the last decade through the Compressed Natural Gas (CNG) policy, which has also improved pub-lic transport through metro trains and modernized buses. Other policy successes of India are in the nationwide im-plementation of Bharat stage I-IV emission norms (on the lines of Euro I-IV vehicle emission standards), phasing out 2-stroke engines, enabling new technologies like Selective Catalytic Reduction (SCR) to reduce NOx emissions from diesel vehicles, electric vehicles, hybrid vehicles, etc.
In the energy sector, the growing combustion of fossil fuels to meet the energy needs of a growing economy has led to increasing formation and emission of Nr as NOx from thermal power plants, although their relative contri-bution compared to other sectors is currently still small. Technologies like low NOx burners are being encouraged to limit NOx emissions from such large point sources.
Thus, by making the right policy initiatives by em-phasizing and incentivizing nutrient recovery and recy-cling, and by boosting their implementation, India could make significant reductions in overall nutrient losses, while improving NUE. Above all, this will require a de-termined initiative for monitoring and quantifying of major nutrient sources, sinks and flows, as well as further identification of recycling options and best practices for informed policy interventions towards sustainable nutri-ent management.
7.9 Case Study 6: Reducing the environmental impacts of excessive nitrogen fertiliser use in ChinaChina’s current policies on nutrient use mainly focus on increasing nitrogen (N) fertilizer use to raise food security by promoting both crop and animal production. China’s fertilizer subsidies, for example, are mainly distributed to NH3 synthesis industries so that the farmers can buy rela-tively cheaper fertilizers.
In order to feed its population, now over 1.3 billion people, China has greatly intensified its agriculture over the last few decades. One aspect has been the greatly in-creased use of N fertilizer by Chinese farmers, increasing more than 3-fold between 1980 and 2010 (from 10 to 32
Tg N per year). The substantial increase in N fertilizer use has largely contributed to increased grain production in China since the 1980s.
The negative impacts of overuse of N fertilizer are now being given more and more attention in China (e.g., Guo et al., 2010). China’s 12th five year plan (2011-2015) em-phasizes the need for environmental quality improvement in Chinese rural areas and specifically aims to reduce pol-lution from animal production. At the installation of the new leadership of China, premier Xi Jinping set the goal to transform China into an ecological society by 2020. Currently, the regulation on integrated pollution preven-tion control from livestock and poultry is being devel-oped, which is aimed at reducing environmental impact from animal production and improving the utilization of animal manures.
Environmental ImpactsHowever, the negative impacts of overuse of N fertilizer are now being given more and more attention in China (e.g., Guo et al., 2010). Greenhouse gas emissions asso-ciated with N fertilizer are estimated to have increased correspondingly, from 126 Tg CO2-eq in 1980 to 435 Tg CO2-eq in 2010. This includes both carbon dioxide (CO2) and nitrous oxide (N2O) from the manufacturing process, and substantial further emissions of N2O from agricul-tural soils. Fertilizer-related activities are now estimated to constitute about 7% of total greenhouse gas emissions from China (Liu and Zhang, 2011; Zhang et al., 2013).
As one third of the entire world’s N fertilizer is now manufactured and used in China – its management in China is of global significance.
Although N fertilizer will continue to be an essential part of the strategy to secure food security in China, there is now overwhelming evidence that it is used in excessive quantities in many situations, and often applied inappro-priately or at the wrong time.
Many cases are documented with a range of crops and regions of the country where rates of N fertilizer could be cut by 30% or even more, with no impact on crop yields (Ju et al., 2009). In fact yields often increase slightly when excessive N rates are reduced to a rational level. Current high rates of N application lead to very low Nutrient Use Efficiency (NUE) with serious environmental impacts from nutrient pollution.
In addition to unnecessarily large greenhouse gas emissions, the environmental impacts of large N applica-tions include (Guo et al., 2010; Liu et al., 2013):
7 Soil acidification (through nitrification of ammoni-um to nitrate by soil microbes and subsequent leach-ing of nitrate, NO3-);
7 Increased nitrate concentrations in surface waters which, together with phosphate, causes algal blooms, damage to fisheries, and problems with drinking wa-ter quality;
7 Ammonia (NH3) emissions to the atmosphere that contribute to poor air quality and nutrient enrich-ment of soil and water after it is re-deposited;
Our Nutrient World_reflowed.indd 88 30/01/2013 10:27:38

89global overview on nutrient management
7 Increased atmospheric concentrations of nitrogen oxides (NOx), which also leads to the formation of high ozone (O3) concentrations near the ground, which can be harmful to human health.
The search for solutionsNormal advisory efforts with farmers are ineffective, partly because N fertilizer is relatively cheap due to government subsidies. These were logical at an earlier stage of the country’s development when there was an urgent need to increase N fertilizer use to boost crop production.
But it is clear that this is no longer the priority, so it is logical to alter the subsidy policy. One example would be to subsidise the additional cost of urease or nitrifica-tion inhibitors instead of the basic cost of urea fertilizer: in some situations these additives have been shown to in-crease NUE, while decreasing NH3 volatilization and N2O emissions in field conditions.
An even greater challenge is that many farmers now only work part-time, with households deriving much of their income from off-farm activities. So agriculture is given a low priority when making decisions on amounts of N or the timing or method of application.
An approach being promoted to improve N manage-ment is the greater use of contractors to apply N: this is al-ready occurring in some regions for pesticide applications and for crop harvesting. It is a means of overcoming the
labour shortage at key times, due to able-bodied family members being away or engaged in more profitable work. It also facilitates the development of a more professional group of farm operation specialists who are likely to be more amenable to training. This emphasises the impor-tance of including social, economic and policy factors when seeking to overcome agricultural and environmen-tal problems.
In the case of greenhouse gas reductions, it has been re-cently estimated that a combination of measures to man-ufacture N fertilizer more efficiently and to use it more appropriately could lead to national emissions reductions of between 2 and 7% by 2030 (Zhang et al., in press). This is in addition to the substantial reductions pollution levels in China’s air, rivers and lakes.
But these changes would only be achieved if policy and financial issues are altered in order to facilitate technical and management changes. In practice, China needs strict-er environmental policies to restrict both N and P nutrient use, particularly in many environmentally and ecologi-cally sensitive regions of China. Appropriate approaches may include the prevention of over concentration of ani-mal production geographically by spatial planning based on crop demand for manure in the vicinity.
Overall the Chinese Government has gradually real-ized the importance of sustainable agricultural production with less environmental impact. A major achievement is the nationwide practice of China’s National Soil Testing
Figure 7.5 Illustration of intensive cropping practices in challenging terrain with traditional terraces in the Guizhou Province of China (Photo: Fusuo Zhang).
Our Nutrient World_reflowed.indd 89 30/01/2013 10:27:40

90 global overview on nutrient management
and Fertilization Recommendation Programme (imple-mented since 2005), which has promoted rational use of N, P and K fertilizers with less Nr (e.g. NH3 and N2O) and P emissions to the environment.
However, there are still some major barriers (including the small household farmers, improper fertilizer subsidies and incomplete agricultural technique extension system) which need to be removed by a combination of innova-tions in of both policy and technologies. Such changes will be essential to improve nutrient use efficiency in China, contributing simultaneously to improved food se-curity and less environmental pollution.
7.10 Toward regional and global coordination of N and P policies
Evolving policy challengesChapters 3 to 5 have shown how the scale and intensity of nutrient use and emissions to the wider environment have greatly increased during the last century. These changes have been especially rapid during the last five decades, accompanying increases in human population, food pro-duction and industrialization.
Nutrient use and emissions have always had a some impact on the environment, but the scale of these impacts has increased from local to regional to global scales. At the same time, the intensity of nutrient use and emissions has also increased substantially. This reflects both increas-ing human population and increasing rates per person of food and energy consumption and of vehicle use.
The earliest pollution-related policies in human civi-lization addressed local issues. These included not to ex-tract drinking water from wells nearby settlements, or to drink beer and wine instead of local water sources. In modern society, many other nutrient pollution policies have been developed. These include policies to avoid high levels of nitrate in drinking water, to limit nitrogen ox-ides emissions to air, with these increasing substantially in their spatial scale compared with earlier policies.
Over recent years, however, it has been recognized that existing policies have been mainly limited to single issues. Although such single-issue policies can potentially com-plement each other, they often risk interference with an-tagonistic effects, while not considering the factors which would optimize the overall performance. Many issues can also be left hanging in the gaps between policy areas. This leads increasingly to a need for joined-up policies, par-ticularly to minimize trade-offs and maximize synergies.
Needs for regional and global coordinationGiven the increasing scale and intensity of current global nutrient use and emissions, and the many pitfalls in exist-ing policies, there is also increasing awareness of the need for better regional and global coordination. The needs and tasks for such coordination are considered further in Chapter 8. Based on comparison of the examples illus-trated in this chapter, it is already clear that:
7 There are both major problems of too much and too little Nr and P. Current policies have made a start, but there is much still to do to address these problems.
7 Nutrient cycles are often out of balance with each other (Nr, P, K, etc.), often leading to problems of pollution, while reducing nutrient use efficiency (NUE).
7 Exiting policies have often focused on single issues, while the multi-dimensional nature of nutrient cycles highlights the need to quantify synergies to count the co-benefits of policy actions, while avoiding trade-offs.
7 Regions with too much Nr and P, face major pollution problems especially from combustion sources (elec-tricity generation, industry, transport), agriculture and waste water treatment, threatening water, air and soil quality, climate and biodiversity.
7 Countries working to meet core food security goals have often implemented policies to reduce fertilizer prices, but then find themselves using excess nutri-ents or an inappropriate balance of between nutrients, reducing NUE and exacerbating pollution losses.
7 Regions with insufficient local nutrient resources struggle with costs and infrastructure to ensure ad-equate Nr and P supply. This limits food production while risking soil nutrient mining, degrading soils, which can exacerbate the conversion of virgin eco-systems into agricultural land.
7 A focus on measures to optimize Nutrient Use Efficiency (NUE) provides a common message that unites all these situations. In particular, ‘Full-chain NUE’ provides an easy-to-understand metric that provides maximum flexibility in exploring regionally specific response strategies.
7 A focus on component NUE estimates, such as crop NUE, animal NUE, industrial NUE, has an important complementary role to play in fostering better nutri-ent management and recycling of existing nutrient pools at different stages of the nutrient pathways.
7 Nutrient policies may benefit from a mix of volun-tary approaches, economic approaches and regula-tion, recognizing the diverse structure within and between and nutrient source sectors and between regions.
7 There is an essential need to develop improved com-munication and understanding between stakehold-ers, together with appropriate education, training and advice, supported by nutrient/pollution testing ser-vices for relevant sectors (e.g. soil, water, air testing).
The development of an overarching international process to address these points would greatly support govern-ments in their implementation of sound nutrient policies. Recognizing the diversity, such a process would need to consider progress and barriers in existing region-specific actions, as well as the benefits of developing overarching global consensus and tools.
Our Nutrient World_reflowed.indd 90 30/01/2013 10:27:40
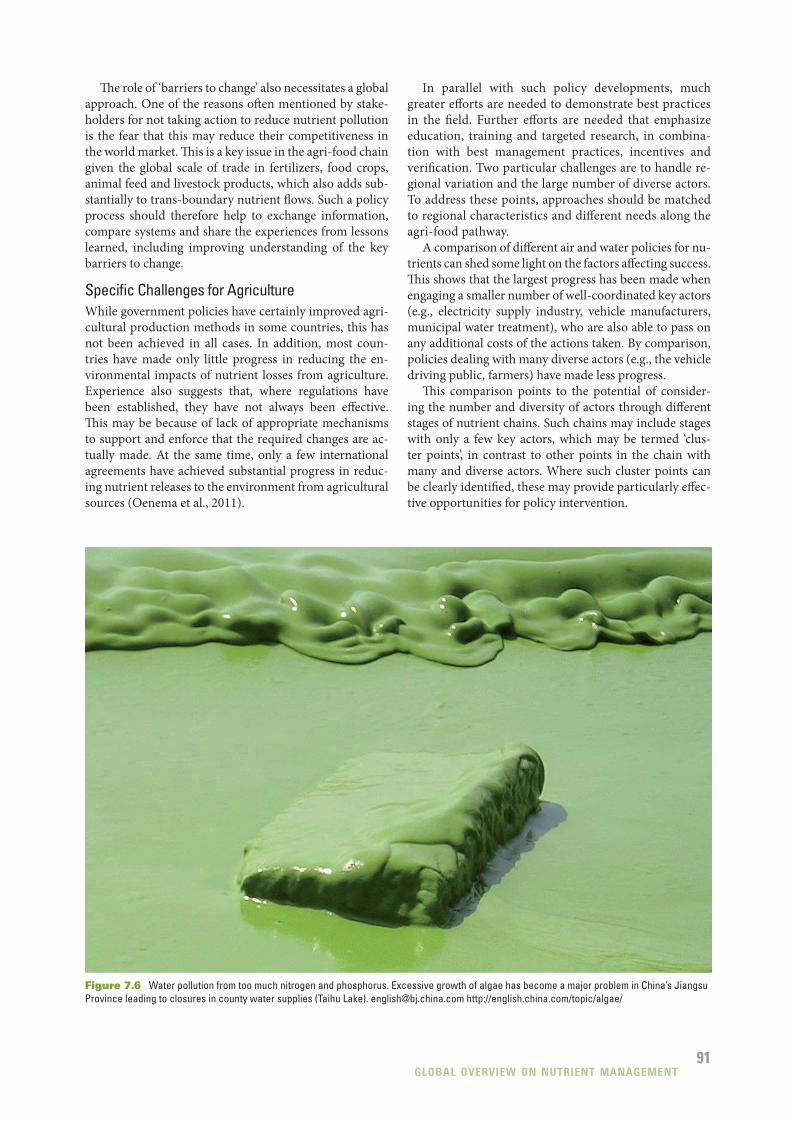
91global overview on nutrient management
The role of ‘barriers to change’ also necessitates a global approach. One of the reasons often mentioned by stake-holders for not taking action to reduce nutrient pollution is the fear that this may reduce their competitiveness in the world market. This is a key issue in the agri-food chain given the global scale of trade in fertilizers, food crops, animal feed and livestock products, which also adds sub-stantially to trans-boundary nutrient flows. Such a policy process should therefore help to exchange information, compare systems and share the experiences from lessons learned, including improving understanding of the key barriers to change.
Specific Challenges for AgricultureWhile government policies have certainly improved agri-cultural production methods in some countries, this has not been achieved in all cases. In addition, most coun-tries have made only little progress in reducing the en-vironmental impacts of nutrient losses from agriculture. Experience also suggests that, where regulations have been established, they have not always been effective. This may be because of lack of appropriate mechanisms to support and enforce that the required changes are ac-tually made. At the same time, only a few international agreements have achieved substantial progress in reduc-ing nutrient releases to the environment from agricultural sources (Oenema et al., 2011).
In parallel with such policy developments, much greater efforts are needed to demonstrate best practices in the field. Further efforts are needed that emphasize education, training and targeted research, in combina-tion with best management practices, incentives and verification. Two particular challenges are to handle re-gional variation and the large number of diverse actors. To address these points, approaches should be matched to regional characteristics and different needs along the agri-food pathway.
A comparison of different air and water policies for nu-trients can shed some light on the factors affecting success. This shows that the largest progress has been made when engaging a smaller number of well-coordinated key actors (e.g., electricity supply industry, vehicle manufacturers, municipal water treatment), who are also able to pass on any additional costs of the actions taken. By comparison, policies dealing with many diverse actors (e.g., the vehicle driving public, farmers) have made less progress.
This comparison points to the potential of consider-ing the number and diversity of actors through different stages of nutrient chains. Such chains may include stages with only a few key actors, which may be termed ‘clus-ter points’, in contrast to other points in the chain with many and diverse actors. Where such cluster points can be clearly identified, these may provide particularly effec-tive opportunities for policy intervention.
Figure 7.6 Water pollution from too much nitrogen and phosphorus. Excessive growth of algae has become a major problem in China’s Jiangsu Province leading to closures in county water supplies (Taihu Lake). [email protected] http://english.china.com/topic/algae/
Our Nutrient World_reflowed.indd 91 30/01/2013 10:27:41
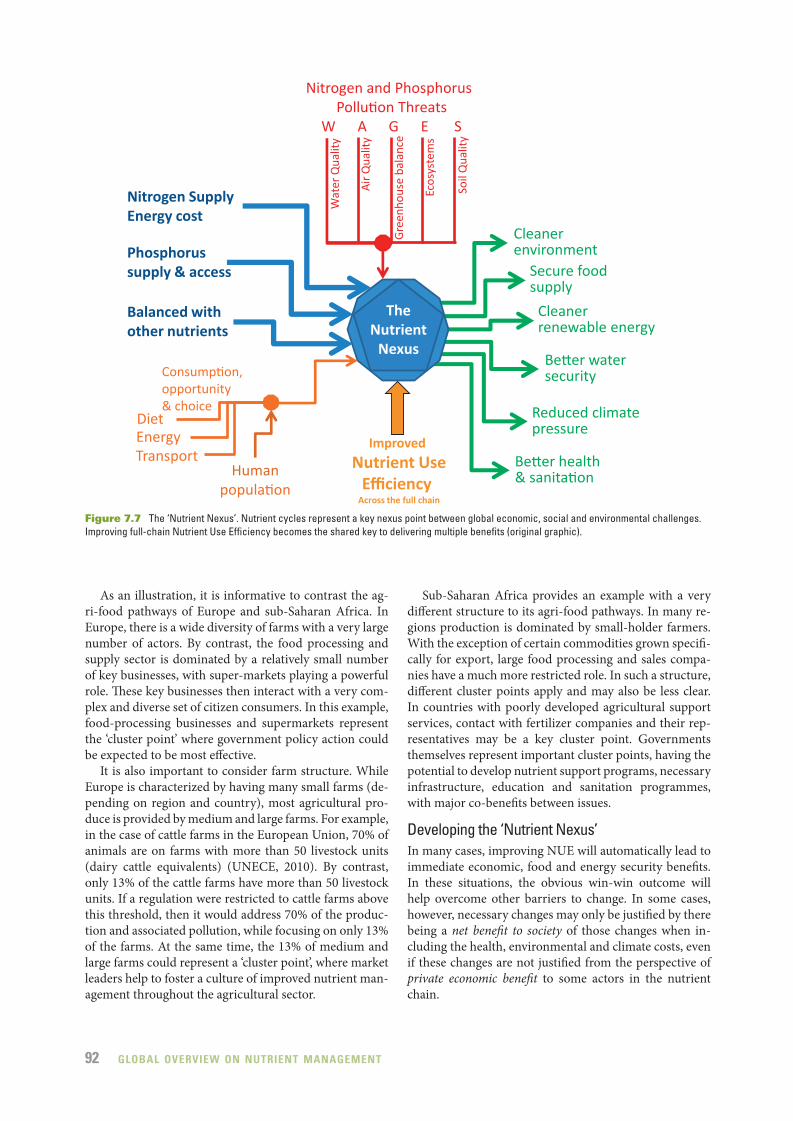
92 global overview on nutrient management
As an illustration, it is informative to contrast the ag-ri-food pathways of Europe and sub-Saharan Africa. In Europe, there is a wide diversity of farms with a very large number of actors. By contrast, the food processing and supply sector is dominated by a relatively small number of key businesses, with super-markets playing a powerful role. These key businesses then interact with a very com-plex and diverse set of citizen consumers. In this example, food-processing businesses and supermarkets represent the ‘cluster point’ where government policy action could be expected to be most effective.
It is also important to consider farm structure. While Europe is characterized by having many small farms (de-pending on region and country), most agricultural pro-duce is provided by medium and large farms. For example, in the case of cattle farms in the European Union, 70% of animals are on farms with more than 50 livestock units (dairy cattle equivalents) (UNECE, 2010). By contrast, only 13% of the cattle farms have more than 50 livestock units. If a regulation were restricted to cattle farms above this threshold, then it would address 70% of the produc-tion and associated pollution, while focusing on only 13% of the farms. At the same time, the 13% of medium and large farms could represent a ‘cluster point’, where market leaders help to foster a culture of improved nutrient man-agement throughout the agricultural sector.
Sub-Saharan Africa provides an example with a very different structure to its agri-food pathways. In many re-gions production is dominated by small-holder farmers. With the exception of certain commodities grown specifi-cally for export, large food processing and sales compa-nies have a much more restricted role. In such a structure, different cluster points apply and may also be less clear. In countries with poorly developed agricultural support services, contact with fertilizer companies and their rep-resentatives may be a key cluster point. Governments themselves represent important cluster points, having the potential to develop nutrient support programs, necessary infrastructure, education and sanitation programmes, with major co-benefits between issues.
Developing the ‘Nutrient Nexus’In many cases, improving NUE will automatically lead to immediate economic, food and energy security benefits. In these situations, the obvious win-win outcome will help overcome other barriers to change. In some cases, however, necessary changes may only be justified by there being a net benefit to society of those changes when in-cluding the health, environmental and climate costs, even if these changes are not justified from the perspective of private economic benefit to some actors in the nutrient chain.
The Nutrient
Nexus
Nitrogen and Phosphorus Pollution Threats
W A G E S
Nitrogen Supply Energy cost
Phosphorus supply & access
Balanced with other nutrients
Diet
Transport Energy
Cleaner environment
Secure food supply
Cleaner renewable energy
Better water security
Reduced climate pressure
Better health & sanitation
Improved
Nutrient Use Efficiency
Across the full chain
Human population
Consumption, opportunity & choice
Ecos
yste
ms
Soil
Qua
lity
Air
Qua
lity
Gre
enho
use
bala
nce
Wat
er Q
ualit
y
Figure 7.7 The ‘Nutrient Nexus’. Nutrient cycles represent a key nexus point between global economic, social and environmental challenges. Improving full-chain Nutrient Use Efficiency becomes the shared key to delivering multiple benefits (original graphic).
Our Nutrient World_reflowed.indd 92 30/01/2013 10:27:42

93global overview on nutrient management
In these situations policy interventions may gain in effectiveness by strengthening the involvement of key businesses. Exploring possible policy approaches in this way would have the triple advantage of: a) working at the cluster point of well-coordinated actors, b) foster-ing improvements in NUE that may lead to significant cost savings, and c) developing the options for policies that allow the private costs of pollution mitigation to be shared with wider society through their assimilation into product pricing. By combining, at a higher level, the simultaneous cost savings from improved efficiency with any additional costs to some actors, there is also substantial potential to buffer and minimize cost conse-quences for consumers.
To achieve these changes, however, a much higher vis-ibility of Nitrogen and Phosphorus and other nutrients will first be needed.
The multi-faceted role of the N and P cycles must be-come a core part of the policy agendas for each of food, energy, health, environment and climate. Even more than that, N and P must increasingly become central in the de-veloping public conversation throughout society on how to produce more food and energy with less pollution.
In this way we should speak not just of cluster points in nutrient supply chains, but of the Nutrient Nexus itself. This represents the unique way in which the biogeochemical cy-cles of N and P, and their good management with other nu-trients, draw together all global change challenges – food, energy, health, environment and climate (see Figure 7.7).
Only once the world’s citizens begin realise how nu-trients represent a nexus that unites all our concerns, will many governments become sufficiently empowered to support society as a whole in taking the actions needed.
Nutrients feed the world. Yet we waste them with little thought. Too little or too much – we all gain from their smarter use.
References Abrol Y.P., Raghuram N. & Sachdev M.S. (2007) Agricultural N
Use and its environmental Implications’, I K International, New Delhi.
Abrol Y.P., Raghuram N. & Chanakya H.N. (2008) Reactive Nitrogen in a Agriculture, Environment and Health’ (Guest Editors): Current Science (Special Issue) 94 (11): 1375-1477.
Davidson E.A., David M.B., Galloway J.N., Goodale C.L., Haeuber R., Harrison J.A., Howarth R.W., Jaynes D.B., Lowrance R.R., Nolan B.T., Peel J.L., Pinder R.W., Porter E., Snyder C.S., Townsend A.R. & Ward M.H. (2012) Excess nitrogen in the U.S. environment: trends, risks, and solutions. Issues in Ecology, Report Number 15, Ecological Society of America.
Denning G., Kabambe P., Sanchez P., Malik A., Flor R., Harawa R., Nkhoma P., Zamba C., Banda C., Magombo C., Keating M., Wangila J. & Sachs J. (2009) Input subsidies to improve smallholder maize productivity in Malawi: Toward an African green revolution. PLoS Biology 7, e1000023 doi:10.1371/journal.pbio.1000023 .
Devarajan S. (2008) Poverty in Africa and elsewhere. Blogs.worldbank.org.africacan/poverty-in-africa-and-elsewhere
Dorward D., Chirwa E, Kelly V., Jayne T., Slater R. & Boughton D. (2008) Evaluation of the 2006/7 agricultural input subsidy programme, Malawi. Final report. Ministry of Agriculture and Food Security of Malawi.
EPA (2012) US Environmental Protection Agency. Ecoregions for definition of water quality criteria for nutrients. http://water.epa.gov/scitech/swguidance/standards/criteria/nutrients/ecoregions/index.cfm.
Gunningham N. & Grabosky P. (1998). SMART Regulation: Designing environmental policy. Clarendon Press, Oxford.
Guo J.H., Liu X.J., Zhang Y., Shen J.L., Han W.X., Zhang W.F., Christie P., Goulding K., Vitousek P. & Zhang F.S. (2010) Significant soil acidification in major Chinese croplands. Science 327, 1008-1010.
Hajer M. (1995) The Politics of Environmental Discourse – Ecological Modernization and the Policy Process, Oxford University Press.
HELCOM (2010) Helsinki Commission/Baltic Marine Environment Protection Commission. www.helcom.fi/
Hicks W.K, Whitfield C.P., Bealey W.J. & Sutton M.A. (2011) Nitrogen Deposition and Natura 2000: Science & practice in determining environmental impacts (Eds.) (Findings of a European workshop linking scientists, environmental managers and policymakers, Brussels, 18th-20th May, 2009), COST Office, Brussels. http://cost729.ceh.ac.uk/n2kworkshop
IFDC (2007) Africa Fertilizer Summit Proceedings, Proceedings of the Africa Fertilizer Summit (9-13 June, 2007, Abuja, Nigeria), IFDC-SP-39, International Fertilizer Development Center, Muscle Shoals, AL
Jayne T.S., Govereh J., Wanzala M. & Demeke M. (2003) Fertilizer Market Development: a Comparative Analysis of Ethiopia, Kenya, and Zambia. Food Policy 28(4), 293-316.
Ju X.T., Xing G.X., Chen X.P., Zhang S.L., Zhang L.J., Liu X.J., Cui Z.L., Yin B., Christie P., Zhu Z.L. & Zhang F.S. (2009) Reducing environmental risk by improving N management in intensive Chinese agricultural systems. PNAS 106, 3041-3046.
Leip A., Achermann B., Billen G., Bleeker A., Bouwman L., de Vries W., Dragosits U., Döring U., Fernall D., Geupel M., Johnes P., Le Gall A.C., Monni S., Neverčeřal R., Orlandini L., Prud’homme M., Reuter H., Simpson D., Seufert G., Spranger T., Sutton M.A., van Ardenne J., Voss M. & Winiwarter W. (2011) Integrating nitrogen fluxes at the European scale. Chapter 16 in: The European Nitrogen Assessment (Eds. Sutton M.A., Howard C.M., Erisman J.W., Billen G., Bleeker A., Grennfelt P., van Grinsven H. & Grizzetti B.), pp. 345-376, Cambridge University Press.
Liu X.J. & Zhang F.S. (2011) Nitrogen fertilizer induced greenhouse gas emissions in China. Current Opinion in Environmental Sustainability 3, 407-413.
Liu X., Zhang Y., Han W., Tang A., Shen J., Cui Z., Vitousek P., Erisman J.W., Goulding K., Christie P., Fangmeier A. & Zhang F. (2013) Enhanced nitrogen deposition over China. Nature, in press.
Nkonya E. Draft paper to the African N-RAP (N in Africa’s country and regional policies: lessons to enhance broader stakeholder and policy-maker engagement) (pers. comm. 2012).
OECD (2007). Instrument Mixes for Environmental Policy, OECD, Paris, 238 pp.
Our Nutrient World_reflowed.indd 93 30/01/2013 10:27:42

94 global overview on nutrient management
Oenema O., Bleeker A., Braathen N.A. Budňáková M., Bull K., Čermák P., Geupel M., Hicks K., Hoft R., Kozlova N., Leip A., Spranger T., Valli L., Velthof G. & Winiwarter W. (2011) Nitrogen in current European policies. Chapter 4 in: The European Nitrogen Assessment (Eds. Sutton M.A., Howard C.M., Erisman J.W., Billen G., Bleeker A., Grennfelt P., van Grinsven H. & Grizzetti B.), pp. 62-81, Cambridge University Press.
OSPAR (2008) Nutrients in the OSPAR Convention area: Assessment of the Implementation of PARCOM Recommendations 88/2 and 89/4. OSPAR publication No. 344/2008, OSPAR Commission, London.
Reis S., Grennfelt P., Klimont Z., Amann M., ApSimon H., Hettelingh J.P., Holland M., LeGall A.C., Maas R., Posch M., Spranger T., Sutton M.A. & Williams M. (2012) From Acid Rain to Climate Change. Science 338, 1153-1154.
Singh B., Tiwari M.K. & Abrol Y.P. (2008) Reactive Nitrogen: In Agriculture, Industry and Environment in India, IGBP-WCRP-SCOPE Report Series No 3, Indian National ScienceAcademy Publication.
Suddick E.C., Whitney P., Townsend A.R. & Davidson E.A. (2012) The role of nitrogen in climate change and the impacts of nitrogen–climate interactions in the United States: foreword to thematic issue. Biogeochemistry, DOI 10.1007/s10533-012-9795-z.
Sutton M.A., Erisman J.W. & Oenema O. (2007) Strategies for controlling nitrogen emissions from agriculture: Regulatory, voluntary and economic approaches. In: Fertilizer Best Management Practices: General Principles, Strategy for their Adoption and Voluntary Initiatives vs Regulations. pp 245-259. International Fertilizer Industry Association, Paris. (ISBN 2-9523139-2-X).
Von Braun J. & Díaz-Bonilla E. (2008) Globalization of Food and Agriculture and the Poor. IFPR. Oxford, UK.
UN Habitat (2011) State of the World’s Cities 2010/2011–Cities for All: Bridging the Urban Divide. www.unhabitat.org/
UNECE (2010) Options for revising the Gothenburg Protocol. Reactive Nitrogen. Report by the co-chairs of the Task Force on Reactive Nitrogen. (Including annexes on possible farm size thresholds) ECE/EB.AIR/WG.5/2010/4 (English, French and Russian) 27 pp http://www.unece.org/env/lrtap/WorkingGroups/wgs/docs46th%20session.htm
Zhang W.F., Dou Z.X., He P., Ju X.T., Powlson D., Chadwick D., Norse D., Lu Y.L., Zhang Y., Wu L., Chen X.P., Cassman K.G. & Zhang F.S. (2012) New technologies reduce greenhouse gas emissions from nitrogenous fertilizer in China. PNAS, (in press).
Our Nutrient World_reflowed.indd 94 30/01/2013 10:27:42

95global overview on nutrient management
8 Future needs, targets and opportunitiesDevelopment of effective solutions must link from local to global scales
8.1 The gravity of shared ambitionThe preceding chapters have highlighted the urgent need to develop joined-up approaches to optimize human management of our planet’s nutrient cycles. This is vi-tal if global society is to ensure that the food and energy needs of all populations are met, while reducing threats to human health, climate and ecosystems. It is important to
emphasize that some 13% of the global human population still suffers from under-nutrition (FAO, 2013) with short-ages of key food nutrients limiting production, while sub-stantial amounts of nutrients are simultaneously lost to the environment through human activities across the planet.
The examples presented show how nutrient cycles op-erate across multiple scales, with a high degree of temporal
7 There is an urgent need to develop joined-up approaches to optimize the planet’s nutrient cycles for delivery of our food and energy needs, while reducing threats to climate, ecosystem services and human health.
7 Such inter-connections require an international approach that takes account of local and regional conditions and focuses on a shared aim to improve nutrient use efficiency (NUE).
7 Further efforts should be dedicated to quantifying ‘Full-chain NUE’, together with the component terms, to in-corporate all influences and opportunities for improvement. First estimates are made of a potential aspirational goal for a common global endeavour to improve nitrogen use efficiency by 20%.
7 The intergovernmental institutional options to improve management of regional and global nutrient cycles need to be further explored. One option would be to strengthen and extend the mandate of the ‘Global Programme of Action for the Protection of the Marine Environment from Land-based Activities’ (GPA), to develop the links between source activities and component nutrient challenges.
7 Although GPA has a current focus on the marine environment, it is already taking a lead in developing a multi-issue approach through the Global Partnership on Nutrient Management (GPNM).
7 International consensus is now needed that mandates a partnership of the key stakeholders, including GPA, UNEP, CBD, GEF and others to:
▫ Establish a global assessment process for nitrogen, phosphorus and other nutrient interactions between air, land, water, climate and biodiversity, considering main driving forces, the interactions with food and energy security, the costs and benefits and the opportunities for the Green Economy,
▫ Develop consensus on the indicators including nutrient use efficiency, with benchmarking with which to compare progress in making improvements and in reducing the adverse environmental impacts of nutrient losses.
▫ Further investigate options for improvement of NUE, demonstrating social and economic benefits for health, environment, and the supply of food and energy,
▫ Identify and address the major barriers to change, fostering education, multi-stakeholder discourse and public awareness,
▫ Establish internationally agreed targets for improved Nr and P management at regional and planetary scales,
▫ Quantify the multiple benefits of meeting the nutrient targets for marine, freshwater and terrestrial eco-systems, mitigation of greenhouse gases and other climate threats, and improvement of human health,
▫ Develop and implement an approach for monitoring achievement of the nutrient targets within different time-scales, and for sharing and diffusing new technologies and practices that would help to achieve the targets.
7 In a ‘constant output scenario’ it is estimated that the proposed aspirational goal for a 20% improvement in full-chain NUE by 2020 would deliver an annual estimated saving of 20 million tonnes of Nr globally. Based on initial estimates, this equates to a net benefit of $170 (50-400) billion per year, when counting the fertilizer savings, implementation costs and benefits for health, climate and biodiversity.
7 In a ‘constant output scenario’ a 20% improvement in full-chain NUE while maintaining current levels of N input would deliver smaller quantified net benefits $70 (15-165) billion per year, although this figure does not include the substantial additional benefits of increased food and energy production. Further efforts should seek to value the production benefits, P savings and other co-benefits.
Our Nutrient World_reflowed.indd 95 30/01/2013 10:27:42

96 global overview on nutrient management
and spatial variability. This variability operates from the dynamics of a single field, to transport within local river catchments and airshed, and transport of air and water pollution in the coastal zone and across national bound-aries. Finally it includes regional and global effects on the marine environment and climate, such as result from eu-trophic and hypoxic zones in water and the alteration of nitrous oxide, carbon dioxide, ozone and aerosol levels in air (Chapters 2-4).
Chapters 6-7 have focused on practical Key Actions for nutrient management and current policies, high-lighting the many relevant policy initiatives addressing individual nutrient-relevant issues at national and lo-cal levels, including some regional international agree-ments. These agreements have been supported by several global intergovernmental statements, including the re-cent Manila Declaration on the protection of the marine environment from land based activities (UNEP, 2012) and the Rio+20 Declaration: ‘The Future We Want’ (UN, 2012).
While recognizing the importance of these statements of international intent, and that several of the Key Actions outlined in Chapter 6 are beginning to be applied, the present overview has clearly highlighted the lack of any global intergovernmental process to foster better manage-ment of N and P cycles that links the major challenges, in-cluding environmental quality, climate, health, food and energy security.
In this chapter, we examine some of the options for a future international nutrient policy framework, starting with a consideration of appropriate indicators, and then reflecting on the future tasks and possible home for such a global international process. Finally, we consider what could be achieved by a future aspirational goal to improve nitrogen use efficiency (NUEN), including a preliminary cost-benefit calculation drawing on the estimates from Chapter 5.
The central message is that nutrients, in particular N and P, have not received sufficient industry, public and policy attention, especially as they cross the bounds be-tween traditional domains. A joined-up approach to ad-dress the Nutrient Nexus has the potential to contribute to multiple global challenges. Future efforts should high-light and quantify these connections, thereby establishing stronger gravity through the shared ambition for better management of Our Nutrient World.
8.2 Development of common indicatorsOne of the central challenges in developing a more joined-up approach for global N and P management is the need to agree on the most appropriate indicators to measure progress. Given the role of the Nutrient Nexus in bringing together so many issues (Figure 7.7), there is an equally diverse set of indicator options, including:
National and spatial (modelling) estimates of: 7 new nutrient inputs through industrial, agricultural
and other sources, such as by total Nr fixation and P mining, as well as of recycled nutrient resources,
7 intended nutrient benefits, including food and energy production and per capita consumption in relation to targets, such as minimum and maximum recom-mended daily intake,
7 N and P budgets, integrating all the key inputs and harvested outputs to calculate nutrient surpluses and NUE, including component NUE terms and the full-chain NUE,
7 nutrient losses to the environment, including emis-sions to air as N2O, NOx, NH3, N2 and other Nr and P compounds, and losses to water by leaching and run-off of NO3-, PO43- and other Nr and P compounds,
Measurement-based monitoring, supported by modelling of: 7 concentrations of these different Nr and P com-
pounds in the air and water bodies, as well as their secondary products and other consequences, such as tropospheric ozone, atmospheric particulate matter and oxygen content of water bodies,
7 soil quality, including improvement of soil fertility by nutrient management and degradation by nutri-ent undersupply (e.g. depletion) or overuse (e.g. acidification),
7 biological risks and extent of environmental change, including data on human health, alteration of bio-diversity, species health and populations and loss of ecosystem services, such as fish stocks, recreational value and carbon sequestration,
Other approaches, through monitoring of: 7 actions taken nationally and locally including regu-
latory and voluntary approaches on measures to improve nutrient management, with measures of suc-cess and barriers to change,
7 the financial investment targeted to improve nutrient management and the net benefits of actions through cost-benefit and other analyses.
All of these approaches have merits according to their spe-cific purpose, given the type of information needed, the fre-quency of estimation and the resources available. Substantial progress has already been made in refining and implement-ing many of these indicators for different countries and through regional intergovernmental agreements. These in-clude, for example, requirements to monitor air pollution emissions, concentrations and environmental risks under the UNECE Convention on Long-range Transboundary Air Pollution, through the regional Marine Conventions and through complementary air pollution, climate and wa-ter legislation in many countries (see Chapter 7).
In the case of the Organization for Economic Cooperation and Development (OECD), significant ef-forts have been made in recent years to calculate national
Our Nutrient World_reflowed.indd 96 30/01/2013 10:27:42

97global overview on nutrient management
nitrogen budgets for agricultural soils (OECD, 2008), with substantial potential for further development and extension. More recently, the Convention on Biological Diversity has adopted the indicators atmospheric nitrogen deposition and total per capita nitrogen loss due to national consumption (CBD, 2012), both of which now need sup-port for their further development and application. Finally, the UNECE has been developing an approach to establish comprehensive national nitrogen budgets (UNECE, 2012) to complement its established indicators of national emis-sions, air concentrations, deposition and critical thresholds (critical loads and critical levels).
Criteria for indicator selection in a global contextThe resource requirement for these different indicators varies greatly. While national calculations on nutrient inputs, losses to the environment and predicted envi-ronmental levels can often be derived using available sta-tistical information and models, measurement-based monitoring of flows, levels and damage can require much larger investment. In both cases, there is a need to agree harmonized methodologies.
In addressing the global nutrient challenge, it is essen-tial to recognize these resource constraints when consid-ering possible indicator approaches (e.g. Mayo & Sessa, 2010; Eurostat, 2011). In particular, given the global scale of the challenge, the first priority must be to identify and refine indicators that:a) are sufficiently easy to be implemented by all
countries, b) can be based as far as possible on already available
international data, andc) provide a reference for comparison with more-de-
tailed indicators, including appropriate chemical and biological monitoring where this can be afforded by countries.
These requirements highlight the need for indicators based on national and other statistics, rather than on am-bitious new measurement activities. For example, while high quality long-term chemical data on nutrient inputs to oceans from all river systems provides essential infor-mation to verify the consequences of land-based nutrient management practices, such measurements may only be achievable by a subset of countries.
A second feature of interest in developing nutrient in-dicators must be to highlight the integration of different parts of the N and P cycles. For this purpose, national and regional nutrient budgeting approaches are central (e.g. OECD, 2008; UNECE, 2012) as they sum all the key inputs and outputs. Efforts to reduce any ‘nutrient surplus’ (i.e., excess nutrients in the national balance not contributing to productive output), will reduce the overall burden of pollution losses. Such national nutrient budget activities can also complement the use of local or farm-scale nutri-ent budgets to help improve nutrient decision making.
Such approaches also help emphasize the potential to improve financial performance in different sectors, while
reducing pollution losses. This is a key advantage of the focus on nutrient use efficiency (NUE). By improving NUE across the full chain, stakeholders can see how good management practices simultaneously contribute to the Green Economy, reducing environmental pollution, while delivering financial and social benefits for human health, climate and biodiversity.
Considering all of these points, it is proposed here that a future global framework on nutrients would give central attention to apply NUE as a key indicator. Additional efforts may then be focused on establishing and tracking national nutrient budgets. These two ap-proaches are closely related, as the data needed to esti-mate NUE also provide the foundation for subsequent more detailed calculation of nutrient budgets. An em-phasis on full-chain NUE maximizes the flexibility in approaches to improve performance and reduce overall nutrient losses. Calculating NUE and nutrient budgets also provides the basis to start making the links with other issues, including quantifying the contribution of improved nutrient management toward meeting exist-ing policy targets (e.g. for air and water pollution and greenhouse gas emissions commitments).
In addition to full-chain NUE, calculation of the main component stages can be useful to focus the efforts of specific sectors, such as calculating NUE for crop or ani-mal production, or in potential future ‘Nitrogen oxides Capture and Utilization’ (NCU) technologies (Chapter 6). By fostering an approach that can be implemented by all countries, NUE and nutrient budget estimates also provide a reference against which countries can compare available chemical and biological monitoring data.
Calculation of Nutrient Use Efficiency in a global contextTwo broad strategies can be followed in the calculation of national NUE applied across the globe: a) detailed mass-flow models, which is most easily carried out centrally, and b) simple calculations based as far as possible on pub-licly available datasets, which, with appropriate guidance, may also be applied by individual countries. Both these approaches have their benefits: the second especially has the advantage of supporting regional and national im-provement programmes, while the first can provide over-arching validation and confirmation.
An illustration of the centralized application of a de-tailed mass flow approach is shown in Figure 8.1, which shows calculations from the IMAGE model (Integrated Model to Assess the Global Environment). The figure compares estimates of the component NUE for crop and animal production (termed ‘nitrogen recovery’ by those authors). For crop NUE, the values shown here are calcu-lated as the percentage of N or P inputs (from fertilizer, manure, nitrogen fixation and atmospheric deposition) that is recovered in the harvest. High values, particularly those in excess of 100%, reflect substantial estimated ‘nu-trient mining’, where soil quality is gradually degraded by the removal of more nutrients than is replaced by fresh
Our Nutrient World_reflowed.indd 97 30/01/2013 10:27:42

98 global overview on nutrient management
inputs resulting in reduced levels of crop production and possible food insecurity.
Values in excess of 70% generally indicate a risk of soil nutrient mining, given that a fraction of inputs is also lost to the environment. Such adversely high values were globally typical in 1900 and 1950. Increased use of mineral N and P fertilizers (Haber Bosch Nr and mined P) has since brought down estimated NUE values in the Americas, Europe and Asia. This has led to improved soil nutrient status and crop production, while increasing lev-els of nutrient pollution. The NUE changes between 1970 and 2000 vary from region to region, resulting from dif-ferences in the crop mix, yield levels and nutrient man-agement. For example, NUE in Europe shows in increase, North America a slight change only, and South Asia a de-crease, primarily due to rapidly increasing fertilizer use in India and China. The projected NUE values in Figure 8.1 for 2050 portray a scenario with increasing efficiency in all world regions, reflecting a situation if NUE were eventually to converge to values prevailing at present in Western Europe and North America.
The component NUE estimates for livestock (Figure 8.1c, d) are lower than for crops, with the overall total
for the full chain being even lower (not shown), as live-stock are fed from crop and grass production. Livestock NUE has in all cases increased over time, especially due to improvements in livestock breeding, feeding optimiza-tion and choice of animals. This is particularly the case in Europe and North America, where there has also been a shift from animal products with a low NUE, such as cattle and sheep, to more intensively farmed animals with higher NUE, such as pig and poultry (e.g. Sutton et al., 2011). It should be noted that in this case, losses to the environment have in many cases still increased, due to in-tensification which has allowed higher stocking and con-sumption rates, as well as an increase in the occurrence of large ‘point sources’ of pollution. This result highlights the importance to also consider NUE in the context of overall nutrient budgets. It is also notable in these estimates, that the lowest livestock NUE is estimated for Africa, which is also the continent with the smallest overall rates of N and P supply. This finding indicates the potential for substan-tial nutrient savings by improvement of livestock NUE in this region, especially when considering each stage of animal feed production, animal production and manure nutrient utilization.
Figure 8.1 Regional estimates of nutrient use efficiency (NUE) for N and P (here termed ‘recovery efficiency’) for crops (A, B) and for livestock (C, D) as calculated by the IMAGE model (Bouwman et al., 2011) from 1900 to 2000, and according to the baseline scenario of the IIASTD (2009) for 2050 on the assumption that substantial improvements in NUE were to be achieved by 2050. NUEN(crop) = Nharvest/(Nfertilizer + Nmanure + Nfixation + Ndeposition)*100; NUEN(livestock)= Nproducts/(Nexcreta+Nproducts)*100, with parallel approach used for phosphorus.
The area codes shown are: NA, North America (Canada, United States); SCA, South and Central America; EUR, Europe; AFR, Africa; NAS, North Asia (Russian Federation, Belarus, Ukraine, Republic of Moldova); SAS, South Asia (rest of Asia); OCE, Oceania (Australia and New Zealand); WRLD, World; IND, Industrialized countries; DEV, developing countries
Our Nutrient World_reflowed.indd 98 30/01/2013 10:27:44

99global overview on nutrient management
An illustration of NUE calculation based on available national statistics is shown in Figure 8.2. Here national data from the UN Food and Agriculture Organization (FAO) and other sources are combined to calculate crop NUEN and full-chain NUEN illustrating how national performance compares across the world. In the case of crop NUEN, the amounts of N in national harvests is es-timated as the fraction of all N inputs, including mineral fertilizer, manure and biological N fixation (BNF). For the full-chain NUEN presented here, a first approach is applied, where the total amount of N in plant and ani-mal food is considered as a fraction of the total new N inputs from mineral fertilizers, BNF and imported feed and food. Future efforts should extend the calculation of full-chain NUE to consider all sources of N and P forma-tion (including NOx emissions), to account for consumer waste, and to account for energy and other uses. Similarly, further efforts should consider the geographic accumula-tion and depletion of nutrients in relation to their sources and uses, so as to analyze how spatial optimization could improve NUE (Chapter 6, Key Action 10). Figure 8.2 shows the wide variation in both NUE indicators, indicat-ing substantial potential for future improvement.
8.3 Tasks for an international policy framework on nutrientsGiven the scale of the nutrient challenge, there is an ur-gent need for the international community to develop a coordinated approach on nutrients. Consensus should be developed toward establishing a mandate from the inter-national community, which draws on inputs from govern-ments, business and industry, academia and civil society. The tasks of such an international framework should in-clude to:
7 Establish a global assessment process for nitro-gen, phosphorus and other nutrient interactions between air, land, water, climate and biodiversity, considering the main driving forces, the interactions with food and energy security and the opportunities for the Green Economy. A technical support process is necessary to bring together the issues, to relate the emissions to threats and to identify the key synergies and benefits emerging from a coordinated approach. It should emphasize the development of future op-tions, including cost-benefit and other socio-eco-nomic analyses.
Figure 8.2 Estimation of national Nutrient Use Efficiency for nitrogen (NUEN) based on FAO and other data. Top: crop NUEN and Bottom: a first estimate of full-chain NUEN for the food production chain (see Appendix).
Our Nutrient World_reflowed.indd 99 30/01/2013 10:27:48

100 global overview on nutrient management
7 Develop consensus on the operational indicators to record progress on improving nutrient use effi-ciency and reducing the adverse environmental im-pacts. It is proposed to focus especially on full-chain NUE, together with component NUE of the main stages. This should include indicator benchmarking to refine the optimum values, to allow comparison between regions and systems. Efforts will be needed
to tune these approaches as part of building the in-tergovernmental consensus required to ensure their adoption.
7 Further investigate options for improvement of NUE, demonstrating benefits for health, environ-ment, and the supply of food and energy. Drawing on the scientific and technical assessment process, including the involvement of industry, business and
Box 8.1 Nitrogen footprints: Working out what you can doThe personal choices of us all make a big difference to the global nitrogen cycle. In our daily lives we use reactive nitrogen (Nr) from which we benefit profoundly, especially as it is essential to all plants and animals, being a key component of all proteins, several vitamins, and even DNA.
But the full chain, from fertilizing a farmer’s field to the food that reaches our plate, has many opportunities to lose this Nr, which threatens the environment. The problems include air and water pollution, which affect people’s health, while also contributing to climate change and threatening biodiversity.
Not only that, but when we use electricity or transport based on fossil fuels, the pollutant mixture NOx (nitrogen oxides) is emitted into the atmosphere. With current technology, none of this is captured at the source to make use-ful products. Together, these different forms of Nr that are lost to the environment cause a cascade of interlinked environmental changes.
So what can you do?
A good first step is to know the size of your nitrogen footprint. You can then see how your choices affect it, and think about some simple lifestyle choices with less impact.
The N-PRINT calculator has been designed with just these ideas in mind. It’s on the internet at www.n-print.org. The front-end is easy to use. You simply type in key points about your usual food, energy and transport choices. Behind the scenes, a mathematical model converts these data into estimated rates of Nr that you consume. It also works out the amounts of Nr you use that is lost to the environment before it ever reaches you – ‘virtual nitrogen’. To do this, it combines your data with information for different countries.
The graph below compares the average Nitrogen Footprint of a citizen from the United States with one from the Netherlands. For both countries, the food portion of the footprint is the largest. The N lost during food production is actually even bigger than the amount eaten in food.
As you can see, at 39 kg of N per year, the nitrogen footprint of the average US citizen is around 70% higher than that of the citizen of the Netherlands. But both of these footprints are massive compared with someone living in sub-Saharan Africa, which will often be less than a fifth of that consumed by a US citizen.
The big message is that our lifestyles are critical for nitrogen, with food choice being especially impor-tant. While many in developing countries need bet-ter diets, people in the richest countries can help the environment by simply avoiding excess and eat-ing a healthy diet.
N-PRINT will even show you how much you can do by altering the balance of plant, meat and dairy produce in your lunch.
Figure 8.3 Comparison of annual personal nitrogen footprints of the United States and Netherlands (www.n-print.org). Graphic adapted from Leach et al. (2012). At 39 kg N per person, the footprint for an average citizen from the United States is 70% higher than the average for the Netherlands.
Our Nutrient World_reflowed.indd 100 30/01/2013 10:27:49

101global overview on nutrient management
civil society, the policy framework should consider the range of options available to improve NUE (see Chapter 6), and build consensus on the common-alities applicable to all countries, together with the recognition of approaches optimized for different re-gions, climates and economic situations.
7 Address the barriers to change, fostering educa-tion, multi-stakeholder discourse and public aware-ness. The limited extent of progress to date highlights the substantial barriers to change that must be ad-dressed. Fundamental issues include those related to quality of life and societal aspirations (Figure 4.12), as well as those related to global markets and inter-national governance. The framework should provide a platform for exchange of information with mul-tiple stakeholders, including industry, business, civil society and other non-governmental organizations and foster education and public outreach activities (e.g., Box 8.1).
7 Develop consensus on the strengths and weakness of different response strategies, incorporating the views of all stakeholders and addressing key areas of contention. An example is the building a common un-derstanding of the benefits and limitations of different voluntary, regulatory and economic approaches. Even more contentious is the issue of how to improve ag-ricultural production in nutrient-limited areas. This includes the need to resolve potentially conflicting recommendations, such as to avoid use of fertilizers based on fossil fuels and to minimize dependence on expensive bought-in inputs (Heinemann et al., 2009), or to increase fertilizer inputs to support food secu-rity goals (Sanchez, 2010), while fostering a concept of ‘sustainable intensification’ (Garnett and Godfrey, 2012), such as to minimize land-use change, as well as to ensure that available nutrient pools are recycled effectively (Section 2.3).
7 Establish internationally agreed targets for im-proved Nr and P management at regional and planetary scales. Such goals have a key role to play in developing a global nutrient management strategy, targeted to securing food and energy production, ef-ficient resource use and environmental sustainability. The potential for aspirational goals is discussed fur-ther below. At the same time, the developing frame-work should provide support to countries in the development and implementation of their national nutrient policies.
7 Quantify the multiple benefits of meeting the nu-trient targets for marine, freshwater and terrestrial ecosystems, mitigation of greenhouse gases and other climate threats, and improvement of human health, supporting the overall coordination of nutrient man-agement activities between different institutions and governmental bodies. This quantification will be vital to demonstrate the case for better nutrient manage-ment, including achievement of other international goals
7 Develop and implement an approach for monitor-ing time-bound achievement of the nutrient targets, including provision of support where this is needed. Based on agreement of the indicators and establish-ment of technical support process, it will be essential to demonstrate the success of the policy framework, as well to understand emerging barriers to refine the strategy. At the same time, there needs to be devel-oped a mechanism for new technologies and practic-es to support the sharing and diffusion of approaches needed to achieve the targets.
We leave open the question of whether such an interna-tional policy framework should focus on voluntary and as-pirational agreements or should eventually develop legally binding commitments. In the current political climate, the latter may be considered unattractive by some countries, and may even add the risk that concern over new com-mitments could hinder rather than advance the process. Irrespective of the approach adopted, the focus should be on inspiring and supporting quantifiable change.
The essential challenges for the proposed process are thus: a) to demonstrate the win-win outcomes that arise from better nutrient management, b) to bring together ‘the gravity of common cause’ between multiple stake-holders, c) to provide options and tools to support coun-tries, industries and citizens in making progress, d) to provide indicators to allow them to assess progress over time and between different areas, e) to provide a forum that can investigate the barriers to change and f) to pro-vide a basis to quantify how good nutrient management also helps meet other international commitments. The resources needed to implement such an approach, in-cluding appropriate organization and delivery of essential scientific and technical support, would be tiny compared with the net economic benefits from taking action (see Section 8.6).
8.4 Possible homes for the international policy frameworkAchieving the objectives outlined above will require an approach with strong support from countries and all ma-jor stakeholders. Since no such global intergovernmental process currently exists, a key question is whether to ex-tend an existing policy process or to establish a new one, specifically designed to improve nitrogen, phosphorus and other nutrient management. Reflection on this ques-tion must be a priority over the next 1-2 years if a solid consensus is to be built.
The options and conclusions illustrated below reflect the outcome of discussions with diverse stakeholders, including at meetings of the transboundary air and wa-ter pollution conventions, the climate and biodiversity conventions, at the Rio+20 Conference on Sustainable Development, and at the First Stakeholder Workshop toward Global Nitrogen Assessment (see front matter of this report).
Our Nutrient World_reflowed.indd 101 30/01/2013 10:27:49

102 global overview on nutrient management
The discussions with stakeholders so far suggest the following: a) That there is growing consensus on the urgent need
to take action on nitrogen and phosphorus cycles and that a coordinated policy process is essential. The ap-proach should make the links between the benefits for environment, health, climate, food security and energy security;
b) That there is still debate on fine-tuning the proposed scope and emphasis, including whether to focus es-pecially on nitrogen as the priority, while considering its relationships with other nutrients (P, C, S, etc), or whether to focus on nutrients as a whole (especially N and P) as the headline challenge;
c) That the option to extend an existing policy frame-work is generally preferred to the establishment of a completely new policy process. It was frequently commented that there are already many policy frame-works, and the first priority should be to find ways to build on existing activities;
d) That a pragmatic approach will be needed, with final decisions on scope and emphasis being influenced by decisions on how to work with and between existing intergovernmental processes;
e) That the options available for building on existing policy frameworks include a choice between adding nutrient management to one of several already large and complex international conventions with many competing interests, or extending a more focused process where nitrogen and phosphorus are already recognized as key challenges.
The last point can be illustrated by the contrast between the Framework Convention on Climate Change (UNFCCC), the Convention on Biological Diversity (CBD) and the Global Programme of Action on the Protection of the Marine Environment from Land-based Activities (GPA). Nitrogen and phosphorus are of key relevance to each of these existing international policy frameworks. In the case of the UNFCCC, this is tightly focused in relation to climate objectives. Therefore, given the competing chal-lenges already faced, it is seems unlikely that the multiple challenges associated with N and P could be incorporated. The structure of the UNFCCC also involves a rather clear separation between the policy framework and the process of supporting scientific assessment, delivered through the Intergovernmental Panel on Climate Change (IPCC). As has recently been highlighted from the experience of the UNECE Convention on Long-range Transboundary Air Pollution, developing a closer working approach between the scientific assessment and policy processes can yield significant benefits (Reis et al., 2012).
One of the advantages of the UNFCCC is that its core fo-cus is associated with biophysical changes to the earth sys-tem, making it relevant to establish specific quantified goals related to emissions of trace substances including CO2, CH4 and N2O. In principle, the UNFCCC objective therefore has many commonalities with the nutrient challenge.
It is relevant to contrast this with the CBD, which in-corporates a much wider set of interests and key threats, many of which extend substantially beyond biogeo-chemistry, as illustrated by the broad portfolio of indica-tors being developed as part of the Aichi target setting process (CBD, 2012). As noted above, a revised N in-dicator has recently been included among the package of biodiversity indicators. This is an important addi-tion that can also help raise the visibility of N as one of the key environmental challenges of the 21st century. Nevertheless, given the very wide range of competing concerns, it might be difficult for the CBD to take the lead as the core home to develop an integrated approach for N and P management.
By contrast to UNFCCC and CBD, the GPA is an inter-national programme subject to regular intergovernmental review rather than a convention. The approach of the GPA focuses primarily on drawing together and supporting the activities of regional programmes to protect the marine environment. The approach developed by the GPA is il-lustrated in the recent Manila Declaration (UNEP, 2012), which emphasizes working together towards a focused set of common aims. As a programme rather than a conven-tion, GPA does not include binding legal targets, while the opportunity remains open to develop consensus on pos-sible aspirational goals. The short-list of issues addressed by GPA is highly relevant to N and P. Among its differ-ent objectives, it has set three priority challenges: nutrient management, waste water and marine litter.
While the current focus of the GPA is strongly on the marine environment, there is a further advantage of the GPA as a potential lead for developing a global approach for N and P. As argued in previous chapters, it will take the gravity of common cause’ across the Nutrient Nexus to help motivate the key actions needed to protect the marine environment. By being able to count the ben-efits for multiple issues, a much stronger approach could therefore be developed, playing a critical role in helping GPA to meet its existing aims. It quickly becomes a logi-cal next step to extend this to take the lead in demon-strating how joined up management of N and P cycles can help meet other existing commitments. It should be noted that GPA is already taking a lead in developing a multi-issue approach through the Global Partnership on Nutrient Management (GPNM), to which this report is a contribution.
While we recognize there are many other relevant pol-icy frameworks, to which a future strategy on nutrients should link, the comparison of these examples should be sufficient to illustrate the challenges associated with the different institutional options. It should also be noted that, while a clear lead needs to be taken by one inter-governmental process, substantial involvement of other conventions and voluntary programmes is envisaged, both in providing input and in being customers for devel-oped products and outcomes. Existing intergovernmental organizations have essential expertise which should be incorporated, such as the UN Environment Programme
Our Nutrient World_reflowed.indd 102 30/01/2013 10:27:49

103global overview on nutrient management
(UNEP), Global Environment Facility (GEF), the Food and Agriculture Organization (FAO), Development Programme (UNDP), World Meteorological Organization (WMO), United Nations Educational Scientific and Cultural Organization (UNESCO), together with many other actions from business and civil society.
Considering these options, we wish to stimulate further feedback from governments and other stakeholders by proposing the following provisional conclusions:1. that the necessary future global policy framework for
N and P should build on an existing process rather than seek to establish a new separate activity;
2. that it is likely to be more effective to build on an activity that is already closely focused on N and P, rather than a larger convention with many competing concerns;
3. that a successful approach would gather inputs from multiple existing policy domains, conventions and programmes, both to receive and provide data, and to show how N and P management can make quantified contributions to the objectives of these other processes;
4. that it is essential the nutrient framework be devel-oped in an intergovernmental process, in order to de-velop common approaches and support governments in achieving change, in partnership with key stake-holders, including industry, business, other interna-tional organizations and civil society;
5. that it is not essential that steps over the next 3-5 years be conducted as part of a full international convention associated with the possibility of binding targets. Recognizing the current challenges faced by such legally binding agreements at the global scale, more rapid progress for N and P may be made by de-veloping the foundations for good nutrient manage-ment within an intergovernmental programme based on voluntary partnership;
6. that the priorities for such a common framework include developing ‘the gravity of common cause’ around the Nutrient Nexus, building consensus on common indicators, sharing of best practices, devel-oping opportunities for the Green Economy, and pro-viding support to help achieve realistic aspirational goals;
7. that a suitable approach would be to strengthen and extend the mandate of the current Global Programme of Action for the Protection of the Marine Environment from Land-based Activities (GPA), to take the lead in developing a future joined-up approach to N and P management;
8. that the starting point of an extended mandate for GPA would be the consensus by governments that consideration of the full global cycles of N and P will allow the multiple benefits of good nutrient management in different sectors to be counted, thereby substantially strengthening the GPA to meet its existing objectives to protect the marine environment;
9. that the mandate for an extended GPA should cover the joining up of global nutrient cycles, including their regional variations, as a basis to develop and recommend management options with quantified benefits for food and energy security, environmental quality, climate and human health;
10. that the mandate for an extended GPA should encour-age input from the lead international frameworks on the different challenges listed in 9, while supporting those processes through the sharing of expertise and demonstration of how improved nutrient manage-ment helps to meet their own objectives.
Using these conclusions as a starting point, international consensus now needs to be developed in cooperation with key stakeholders, including business, industry and civil society, that mandates a partnership of GPA, UNEP, CBD, GEF and others to develop the necessary next steps
8.5 A global aspirational goal to improve nutrient use efficiencyIn this section, we outline the basis for a possible aspira-tional goal to improve nutrient use efficiency (NUE) by 20%, considering how this might be described, and esti-mating the direct benefits. The focus of the present calcu-lation is on ‘nitrogen savings’, reducing the cost of mineral fertilizer while reducing pollution effects. In Section 8.6, we then illustrate a cost-benefit calculation, contrasting two scenarios for 2020: a) constant output scenario: maintaining food and en-
ergy production at current rates, allowing nutrient savings through improved NUE, and
b) constant input scenario: maintaining nutrient inputs at current rates, allowing increased food and energy production though improved NUE.
For the purpose of the present calculations, the aspira-tional goal is formulated using both crop NUEN and the estimate of full-chain NUEN, as outlined in Section 8.2. (Figure 8.2b). Future development should extend this ap-proach in future to include additional sources and stages, and to apply it for phosphorus.
In describing these aspirational goals, the distinction is recognized between countries with high nutrient use, particularly associated with low NUE, and countries with low nutrient use, which may have apparently high NUE values associated with soil nutrient mining. The target to increase the national NUE indicator is clearly focused on the first group of countries. While there is a common need to improve NUE in all countries, the second group countries need to improve N and P supply in a sustainable way. Considering these differences, we describe the NUE aspirational goals in relation to eventual target values with the aim to avoid long-term depletion of soil nutrient stocks, considering the need to maintain or improve agri-cultural productivity and food security. The overall global outcome for the 20% improvement is not very sensitive
Our Nutrient World_reflowed.indd 103 30/01/2013 10:27:50
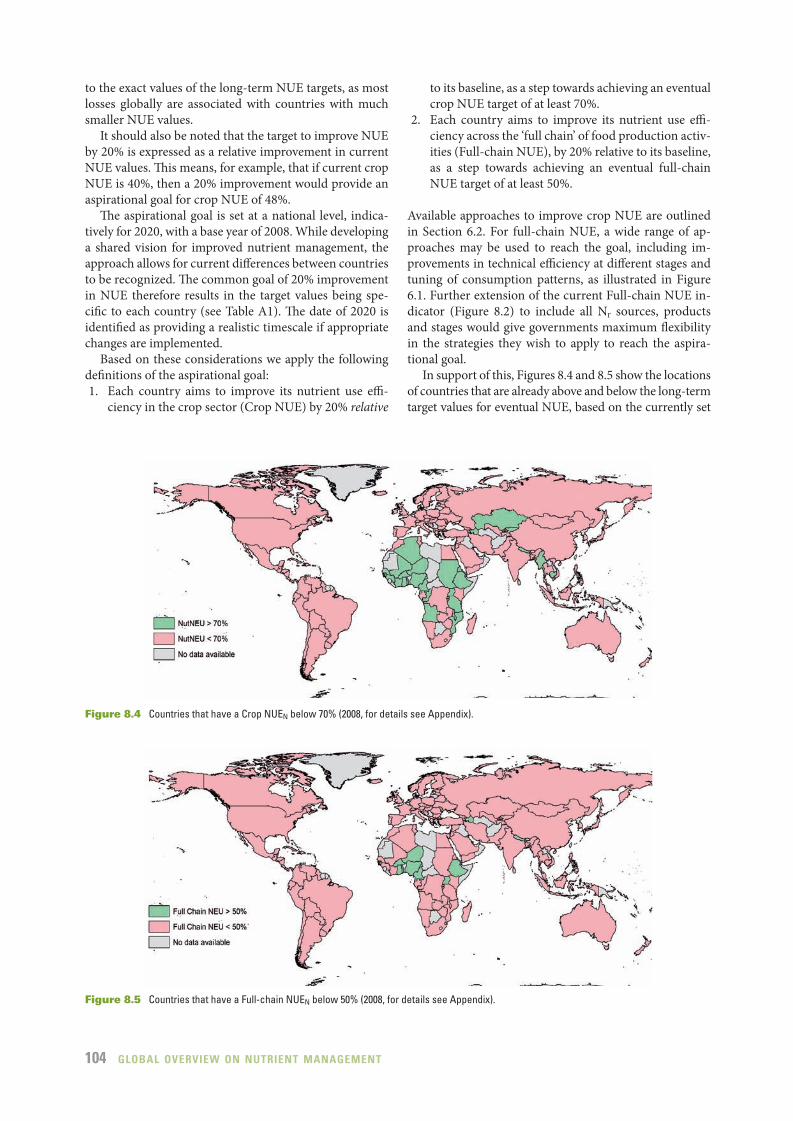
104 global overview on nutrient management
to the exact values of the long-term NUE targets, as most losses globally are associated with countries with much smaller NUE values.
It should also be noted that the target to improve NUE by 20% is expressed as a relative improvement in current NUE values. This means, for example, that if current crop NUE is 40%, then a 20% improvement would provide an aspirational goal for crop NUE of 48%.
The aspirational goal is set at a national level, indica-tively for 2020, with a base year of 2008. While developing a shared vision for improved nutrient management, the approach allows for current differences between countries to be recognized. The common goal of 20% improvement in NUE therefore results in the target values being spe-cific to each country (see Table A1). The date of 2020 is identified as providing a realistic timescale if appropriate changes are implemented.
Based on these considerations we apply the following definitions of the aspirational goal:1. Each country aims to improve its nutrient use effi-
ciency in the crop sector (Crop NUE) by 20% relative
to its baseline, as a step towards achieving an eventual crop NUE target of at least 70%.
2. Each country aims to improve its nutrient use effi-ciency across the ‘full chain’ of food production activ-ities (Full-chain NUE), by 20% relative to its baseline, as a step towards achieving an eventual full-chain NUE target of at least 50%.
Available approaches to improve crop NUE are outlined in Section 6.2. For full-chain NUE, a wide range of ap-proaches may be used to reach the goal, including im-provements in technical efficiency at different stages and tuning of consumption patterns, as illustrated in Figure 6.1. Further extension of the current Full-chain NUE in-dicator (Figure 8.2) to include all Nr sources, products and stages would give governments maximum flexibility in the strategies they wish to apply to reach the aspira-tional goal.
In support of this, Figures 8.4 and 8.5 show the locations of countries that are already above and below the long-term target values for eventual NUE, based on the currently set
Figure 8.4 Countries that have a Crop NUEN below 70% (2008, for details see Appendix).
Figure 8.5 Countries that have a Full-chain NUEN below 50% (2008, for details see Appendix).
Our Nutrient World_reflowed.indd 104 30/01/2013 10:27:54

105global overview on nutrient management
thresholds of 70% (crop NUE) and 50% (full-chain NUE). Countries already exceeding these thresholds are estimated to be suffering from significant soil nutrient mining, low levels of crop productivity and food insecurity. It should be noted that all of the regions globally with very high levels of nutrient input (see Chapter 3) are below these thresholds, so that the 20% goal implies a common endeavour to work towards improved NUE. In the case of countries experienc-ing soil nutrient mining, practices that improve efficiency need to be combined with improved nutrient supply to match removals from the system.
The 20:20 goal for 2020The nitrogen savings accruing from meeting the NUE goal are visualized in Figures 8.6 and 8.7, where they are expressed as annual N saving per hectare of agricultural land. In the Appendix (Table A1), values of the N sav-ing are tabulated for each country, expressed as ktonne N saved per year. Overall, based on the current values and the thresholds set, the global aspirational goal to
improve NUE by 20% would provide a saving of around 23 Tg (=million tonnes) N per year in the case of both indicators.
These estimates characterize what we may broadly term ‘the 20:20 aspirational goal’:
A 20% improvement in NUE,to save 20 million tonnes of N annually,
by the year 2020.
8.6 Cost-benefit calculation for the aspirational goalA preliminary cost-benefit calculation of the 20:20 Aspirational Goal can be constructed as follows. As with the aspirational goal itself, this is focused here on N. Further work would be required to extend the calculation to cover both N and P. We first consider the case of the constant output scenario. 1. Based on calculations in the Appendix, and account-
ing for exemptions related to low N availability, a
Figure 8.7 Absolute nutrient savings achieved as a result of meeting the 5 year target for countries that have a Full-chain NUEN below 50% (for 2008). The improvement in Full-chain NUEN is expressed here as the equivalent annual N fertilizer saving per hectare (For details see Appendix).
Figure 8.6 Absolute nutrient savings achieved as a result of meeting the 5 year target for countries that have a Crop NUEN below 70% (for 2008). The improvement in Crop NUEN is expressed here as the equivalent annual N fertilizer saving per hectare (For details see Appendix).
Our Nutrient World_reflowed.indd 105 30/01/2013 10:27:57

106 global overview on nutrient management
20% relative improvement in full-chain NUE would equate to global N savings of 23 Tg (=23 million tonnes) N per year . Considering a current fertilizer price of 1 (0.8 to 1.2) US dollar per kg N, this repre-sents an equivalent annual fertilizer cost saving of 23 (18-28) billion US dollar.
2. Improved NUE would be expected to lead to a reduc-tion in emissions N, which would be further reduced if less N is also put into the global system. Based on Figure 3.1, total anthropogenic inputs are 220 Tg N annually (40 Tg from NOx, 120 from synthetic fer-tilizers, 60 from crop BNF), so that the aspirational goal would allow a 10% reduction in inputs while maintaining outputs. Improved efficiency would mean a smaller fraction of the available N is lost. Annual emissions are 120 Tg from N2, N2O, NO and N leaching from agricultural soils, plus 87 Tg NOx and NH3 from combustion and terrestrial volatiliza-tion sources (total 207 Tg). Improvement in NUE it-self would therefore also save a further 10% of these losses. Overall, the improvement in NUE under this scenario would provide around 20% reduction in the N pollution losses. This calculation is consistent with a simple mass balance of N lost from the food chain (i.e., 20% reduction in emissions).
3. A preliminary estimate of the global annual damage cost associated with N pollution is 200 to 2000 bil-lion US dollar (Chapter 5), for which a mid-range estimate of 800 billion US dollar is used for the pres-ent calculation. Although several non-linearities ap-ply, if NUE is improved making use of all sources of Nr, an NUE aspirational goal of 20% improvement would equate to a reduction in environmental and health threats worth around 160 (40-400) billion US dollar. In order to achieve the full value of these benefits, it would be important to take the widest possible approach to improving full-chain NUE, especially including NOx savings, since these con-tribute to a substantial fraction of the estimated en-vironmental damage costs.
4. The implementation cost of measures to improve NUE efficiency will vary greatly according to the methods adopted, especially given the wide vari-ety of Key Actions outlined in Chapter 6. Some approaches will lead to cost savings even without considering the value of N saved, while for others the saved fertilizer value will be critical to demon-strating their cost-effectiveness. In many cases, more expensive abatement technologies will also be justi-fied, considering the value associated with reduced environmental pollution. Based on costs estimated for NH3 abatement by the UNECE (2012), and here excluding the value of N saved (as included in point 1. above), typical available measures range from 0 to 5 US dollar per kg N saved, with many measures available at around 1-2 US dollar. As illustrated in Figure 5.2, the cost per unit N saved increases with higher ambition. In many cases, the overall costs
are dominated by labour rates, so that much lower abatement costs can be expected in many sectors for the developing world. Considering these differ-ences, we here set an indicative average abatement cost at 0.5 (0.2-1.5) US dollar per kg N saved. Based on saving 20 Tg N annually, this would equate to 12 (5-35) billion US dollars.
Considering each of these terms, we can therefore esti-mate the bottom line for the ‘Nutrient Green Economy’, when achieving the aspirational goal to improve NUE by 20%, as shown in Table 8.1, under the constant output scenario. An overall net cost saving of the order of 170 (50-400) billion US dollars per year is estimated, with the indicative range highlighting the uncertainties inherent in such a calculation.
These values represent broad first-order estimates, so that their interpretation should focus on the main fea-tures of Table 8.1. Firstly, the environmental and health benefits are estimated to be the largest term. This points to a strong case for societal action to improve NUE (i.e. net ‘public economic benefit’). Secondly, the average im-plementation costs are here estimated to be somewhat smaller than the N savings. This implies that there is po-tential for economic benefit within source sectors from improving NUE (i.e. ‘private economic benefit’). The ac-tual potential for increased profitability will depend on the approaches taken in each case. These should build on existing best practices and develop of future technolo-gies (Chapter 6), fostering adoption of the most cost-ef-fective options. The core idea in each case is to make best use of Nr from all available sources (including biological fixation, manures, mineral fertilizer, and eventually NOx from combustion sources).
It should be noted that there is substantial poten-tial for other co-benefits in improving NUE that is not represented in Table 8.1. Firstly, these calculations only consider N, so that extending the analysis to include P would show significant additional net financial benefits. Secondly, there are many other benefits that are harder to value, such as interactions between development of im-proved N and P management technologies, sanitation and improved food, energy and water security.
The underlying assumption of the constant output sce-nario shown in Table 8.1 is that improved NUE provides N savings, while producing the same overall amount of food and energy. Under future population growth it is also of relevant to envisage how improved NUE could help contribute to increased food and energy production in future. This is considered in the constant input scenar-io. At its simplest this calculation is straightforward, as a 20% improvement in full chain NUE, while using the same amount of N input, would provide a 20% increase in N in food and energy produced, contributing substan-tially to future food and energy security. Some reduction in environmental impacts would be achieved at the same time in this scenario, as an increased share of the input N finds its way to intended products, rather than being
Our Nutrient World_reflowed.indd 106 30/01/2013 10:27:57

107global overview on nutrient management
loss to the environment. This represents the second part of the calculation in bullet 2, above, equivalent to around 5-10% reduction in losses to the environment, depending on the basis of calculation (e.g. proportionate reduction in N emissions, or mass balance from food chain). Table 8.2 illustrates the cost components of this scenario, show-ing how it gives less net economic benefit for the terms considered, primarily associated with reduced environ-mental impacts of N losses. However, a full assessment would need to include the substantial economic value of the additional food and energy produced globally, which has not been estimated here.
Although the two scenarios presented must be con-sidered only as providing indicative estimates, the com-parison of Tables 8.1 and 8.2 illustrates the potential for net cost savings by improving NUE. These savings are substantial, whether the objective is to reduce N inputs while maintaining production or to increase product pro-duction, while maintaining inputs at current levels. The examples illustrated here demonstrate the need for a more comprehensive cost-benefit analysis also considering oth-er scenarios and further goal development related to the problems of too much and too little nutrients.
Table 8.1 Indicative cost-benefit calculation of the global aspirational goal to improve nutrient use efficiency (NUE) for nitrogen by 20%: Constant output scenario. Under this scenario, improved NUE allows fertilizer savings while maintaining total food and energy production at current rates. See text for the basis and other assumptions
Benefits and costs billion US dollar per year
Fertilizer N saving 23 (18 – 28)Environment & Health benefits 160 (40 – 400)Implementation cost -12 (-5 – -35)Net economic benefit (rounded) 170 (50 – 400)
Table 8.2 Indicative cost-benefit calculation of the global aspirational goal to improve nutrient use efficiency (NUE) for nitrogen by 20%: Constant intput scenario. Under this scenario, improved NUE allows increased total food and energy production while maintaining N inputs at current rates. See text for the basis and other assumptions
Benefits and costs billion US dollar per year
Fertilizer N saving 0Environment & Health benefits 80 (20 – 200)Implementation cost -12 (-5 – -35)Value of additional food and energy produced
?
Net economic benefit (rounded) >70 (15 – 165)
8.7 Your feedbackThis Global Overview is part of an ongoing process of scientific, technical and policy analysis, supported by ex-panding and developing dialogue with a wide range of stakeholders from governments, intergovernmental orga-nizations, industry, business and civil society.
Your comments on this report are welcome as input to the next stages of the science and policy dialogue.
Comments on this report may be addressed to:The Global Partnership on Nutrient Management, Secretariat ([email protected]), andThe International Nitrogen Initiative, Operations Office ([email protected]).
ReferencesBouwman L. Goldewijk K.K., Van Der Hoek K.W., Beusen
A.H.W., Van Vuuren D.P., Willems J., Rufino M.C. & Stehfest E. (2011) Exploring global changes in nitrogen and phosphorus cycles in agriculture induced by livestock production over the 1900–2050 period. PNAS. www.pnas.org/cgi/doi/10.1073/pnas.1012878108
CBD (2012) Decisions adopted by the Conference of the Parties to the Convention on Biological Diversity at its eleventh meeting (Hyderabad, India, 8-19 October 2012). UNEP/CBD/COP/11/35. (see p 102 for nitrogen indicator under Aichi Biodiversity Target 8). http://www.cbd.int/doc/decisions/cop-11/full/cop-11-dec-en.pdf
Eurostat. (2011). Farm data needed for agri-environmental reporting. Technical document summarizing the findings of the DireDate project for the Final Seminar in Luxembourg on 28 March 2011. Oenema O., Amon B., van Beek C., Hutchings N., Perez-Soba M., Procter C., Pietrzak S., Velthof G.L., Vinther F. & Wilson L. Eurostat methodologies and working papers 1977-0375, Luxembourg.
FAO (2013) Hunger Portal. United Nations Food and Agriculture Organization. http://www.fao.org/hunger/en/
Garnett T. & Godfrey C.J. (2012) Sustainable intensification in agriculture. Navigating a course through competing food system priorities. Food Climate Research Network and the Oxford Martin Programme on the Future of Food, University of Oxford, UK.
Heinemann J., Abate T., Hilbeck A. & Murray D. (2009) Biotechnology. p 43. In: Agriculture at a Crossroads. International Assessment of Agricultural Knowledge, Science and Technology for Development. Synthesis Report. (Eds. McIntyre B.D., Herren H.R., Wakhungu J. & Watson R.T.). Island Press, Washington DC.
IIASTD (2009) Agriculture at a Crossroads. Global Report. International Assessment of Agricultural Knowledge Science and Technology for Development. (Eds. McIntyre B.D., Herren H.R., Wakhungu J. & Watson R.T.), Island Press.
Leach A.M., Galloway J.N., Bleeker A., Erisman J.W., Kohn R. & Kitzes J. (2012) A nitrogen footprint model to help consumers understand their role in nitrogen losses to the environment. Environmental Development 1, 40-66.
Mayo M. & Sessa R. (2010) Challenges and solutions for data on agricultural greenhouse gas emissions. (ICAS-V: Fifth International Conference On Agricultural Statistics, Kampala, UGANDA, October 12-15, 2010 (www.fao.
Our Nutrient World_reflowed.indd 107 30/01/2013 10:27:57

108 global overview on nutrient management
org/fileadmin/templates/ess/documents/meetings_and_workshops/ICAS5/PDF/ICASV_4.2_117_Paper_Mayo.pdf)
OECD (2008) Environmental Performance of OECD Agriculture since 1990. Organisation for Economic Cooperation and Development (OECD), Paris, France.
Reis S., Grennfelt P., Klimont Z., Amann M., ApSimon H., Hettelingh J.P., Holland M., LeGall A.C., Maas R., Posch M., Spranger T., Sutton M.A. & Williams M. (2012) From Acid Rain to Climate Change. Science. 338, 1153-1154.
Sanchez P.A. (2010) Tripling crop yields in tropical Africa. Nature Geoscience 3, 299-300.
Sutton M.A., van Grinsven H., Billen G., Bleeker A., Bouwman A.F., Bull K., Erisman J.W., Grennfelt P., Grizzetti B., Howard C.M., Oenema O., Spranger T. & Winiwarter W. (2011) Summary for Policy Makers. In: The European Nitrogen Assessment (Eds. Sutton M.A., Howard C.M., Erisman J.W., Billen G., Bleeker A., Grennfelt P., van Grinsven H. & Grizzetti B.) pp xxiv-xxxiv, Cambridge University Press.
UN (2012) Rio Declaration: The Future We Want. United Nations General Assembly, Resolution 66/288, (available in Arabic, Chinese, English, French, Russian and Spanish) http://sustainabledevelopment.un.org/documents.html
UNECE (2012) Draft decision on adoption of guidance document on national nitrogen budgets. Convention on Long-range Transboundary Air Pollution. ECE/EB.AIR/2012/L.8 (available in English, French and Russian) http://www.unece.org/index.php?id=28315
UNEP (2012) Manila Declaration on the continued Implementation of the Global Programme of Action for the Protection of the Marine Environment from Land based Activities. UNEP/GPA/IGR.3/CRP.1/Rev.1 (available in Arabic, Chinese, English, French, Russian and Spanish). http://www.gpa.depiweb.org/igr-3/meeting-documents.html
Our Nutrient World_reflowed.indd 108 30/01/2013 10:27:57

global overview on nutrient management 109
Appendix: National Nitrogen Use Efficiency estimates and aspirational goals
Nutrient use efficiency (NUE) expresses the fraction of input nutrients that reaches desired products, typically expressed as a percentage. NUE can be estimated at many different scales, from field and farm scales, to national re-gional and global scales. Depending on the choice of in-puts and products, different NUE definitions can also be made for parts of the overall chain of nutrient use.
In this appendix we focus on national NUE calculations for nitrogen use efficiency (NUEN) drawing on statistics published by the UN Food and Agriculture Organization (FAO, 2011) and other estimates (using data from the IMAGE model, Bouwman et al., 2011). We here apply two NUE estimates, Crop NUE and Full-chain NUE, accord-ing to the following definitions:
Crop NUE is here defined as the nutrients in harvested crops in a country as a % of the total nutrient input to that country (sum of mineral fertilizer input plus crop biologi-cal nitrogen fixation).
Full-chain NUE is here defined as the nutrients in food available for human consumption in a country as a % of the total nutrient inputs to that country (sum of fer-tilizer inputs, BNF in crops and grass, import in fertilizer, feed and food).
Estimates of national crop NUEN and full-chain NUEN are listed for different countries in Table A1, based on the year 2008. It should be a topic for future work to extend both these indicators, including estimation of other com-ponents and further extension of the full-chain NUE ap-proach to include P, other sources and products.
Comparison of Crop and Full-chain NUE indicatorsThe crop and full-chain indicators fulfil complementary functions. To meet the overall goal of improving national nutrient use efficiency, it is recommended to consider both these indicators.
The crop NUE indicator is the simplest to calculate, but necessarily only provides a partial view of the challenge to improve productivity and simultaneously reduce pol-lution. It should be noted that other definitions of crop NUE sometimes exclude crop biological nitrogen fixa-tion, or consider organic manures as an ‘input’ (i.e., rather than a recycled nutrient pool), or consider the output as total plant update rather than the amount of nutrients in the harvest.
The ‘full-chain’ indicator provides the basis to assess overall improvement in NUE. It also provides govern-ments with maximum flexibility in how they achieve the targets set. For example, they can achieve it through the application of improved management methods on farms, as well as through education to avoid very high levels of consumption of animal products. The last fac-tor is effective because inclusion of animals in the food
chain greatly reduces NUE and therefore increases pol-lution losses.
Note that animal manures do not form part of the in-puts in the definition of full-chain NUE. This is because the definition of inputs considers only new sources of nutrients (fertilizer, BNF etc), while manure is an exist-ing pool allowing nutrient recycling. Making better use of manure means that smaller inputs of new nutrients are needed. Better manure management practices therefore result in an improvement in calculated full-chain NUE.
The national full-chain NUE calculations should even-tually be refined to be based on the amount of nutrients directly consumed by human (e.g. food on the plate). In this way, the overall efficiency incorporates losses between product sale and consumption. Similarly, the efficiency of non-food nutrient consumption pathways should be included. Substantial further analysis would be required to achieve this for all countries. Until this can be done, the full-chain NUE values estimated here are based on the amounts of nutrients in food available for consump-tion, which is the simplest to derive from available FAO statistics.
Definition of aspirational goals for improvement in nutrient use efficiencyIt is useful to consider what would be the quantified re-sults of an overall improvement in NUE. For this purpose, we envisage the consequences of an aspirational goal to improve nitrogen use efficiency for each country by 20% in 2020 relative to a baseline for 2008.
This aspirational goal is envisaged as being met accord-ing to the two complementary indicators, toward eventual target values:1. Each country aims to improve its nutrient use effi-
ciency in the crop sector (Crop NUE) by 20% relative to its baseline, as a step towards achieving an eventual crop NUE target of at least 70%..
2. Each country aims to improve its nutrient use ef-ficiency across the ‘full chain’ of food production activities (Full-chain NUE), by 20% relative to its baseline, as a step towards achieving an eventual full-chain NUE target of at least 50%.
It is important to note that the target definition used here represents a relative change in the existing national NUE values, and is not the absolute difference in NUE between the base and future year. For example: If the Crop NUEN value of a country in 2008 is 40%, then the relative im-provement by 20%, would point to an aspirational goal for this country equal to 48%. Similarly, a 20% relative im-provement in Full-chain NUEN from 15% in 2008 would point to an aspirational goal of 18%.
Our Nutrient World_reflowed.indd 109 30/01/2013 10:27:57

110 global overview on nutrient management
Eventual target values and provision for countries with too little nutrients The definitions of crop NUE and full-chain NUE outlined above have the advantage of relative simplicity and ease of calculation based on FAO and other statistics. Many countries are calculated as having very low NUE values, especially those with intensive production practices and a high ratio of animal/plant-based production. In the ab-sence of appropriate measures, both these factors tend to increase Nr losses and reduce full-chain NUE. It is for such countries with low NUE values to which the aspira-tional goals primarily apply.
By contrast, it should be noted that with minimal new nutrient inputs, it is possible for agricultural harvests and Nr losses to the environment to deplete soil nutrient stocks. Such mining of soil capital happens in some of the poorest countries, which have limited access to additional N and P nutrient sources. In this context, based on the FAO and other statistics, it is feasible that the calculated value of both crop NUE and full-chain NUE may exceed 100% (i.e. the products exceed the inputs, leading to re-duction in soil nutrient capital).
To address this effect, values are set here of eventual target NUE values, which should be achievable with good practices that minimize losses to the environment while maintaining a sustainable soil nutrient capital. These val-ues are set based on estimates of conceivable best prac-tices in arable agriculture and losses in livestock-based food chains.
The effect of the eventual NUE targets in the defini-tion of the aspirational goals is that some of the poorest countries with low additional N inputs can be considered
as already meeting the long term NUE targets, while the focus is on countries with intensive high input practices to improve efficiency. In the case of the poorest countries, efforts to improve NUE and reduce losses are matched by challenges to ensure sufficient and balanced nutrient sup-ply and distribution. Further work is needed in the refine-ment of aspirational objectives suitable for this context.
Quantifying nutrient savings from the aspirational goalsBased on the envisaged aspirational targets, we calculate the equivalent nutrient saving (expressed as ktonne N per country) that represents the reduction in N losses to the environment consequent of the NUE improvements. This N saving may be met by different ways, including improv-ing production efficiency, reducing inputs or, in the case of full-chain NUE, by altering the share of different ani-mal and plant products produced. The calculated values are shown in Table A1.
ReferencesBouwman L. Goldewijk K.K., Van Der Hoek K.W., Beusen
A.H.W., Van Vuuren D.P., Willems J., Rufino M.C. & Stehfest E. (2011) Exploring global changes in nitrogen and phosphorus cycles in agriculture induced by livestock production over the 1900–2050 period. PNAS. www.pnas.org/cgi/doi/10.1073/pnas.1012878108
FAO (2011) United Nations Food and Agriculture Organization. Database on Fertilizer consumption, Crops and Meat production and consumption. (http://faostat.fao.org.)
Our Nutrient World_reflowed.indd 110 30/01/2013 10:27:58

global overview on nutrient management 111
Estimated annual N input per
person
Crop NUEN
Full-chain NUEN
Crop NUEN Full-chain NUEN
N saving from aspirational Crop NUEN
goal
N saving from aspirational Full-chain NUEN goal
Baseline (2008)
Baseline (2008)
Baseline (2008)
Aspirational Goal (2020)
Aspirational Goal (2020)
Region kg N / person
% % % % (ktonne N /yr)
(ktonne N /yr)
Sub Saharan Africa
Angola 39 92 11 70 14 0 55
Botswana 127 - - - - - -
Belize 19 34 27 41 32 1 1
Burundi 9 53 43 64 50 6 7
Cameroon 10 75 56 70 50 0 0
Central African Republic 21 - - - - - -
Chad 47 - - - - - -
Congo 37 82 15 70 18 0 9
Côte d’Ivoire 14 95 38 70 45 0 23
Democratic Republic of the Congo 8 63 34 70 41 15 35Eritrea 17 113 27 70 33 0 8
Ethiopia 9 114 74 70 50 0 0
Gambia 4 149 60 70 50 0 0
Ghana 8 136 64 70 50 0 0
Kenya 12 51 45 61 50 24 44
Lesotho 15 - - - - - -
Liberia 10 - - - - - -
Malawi 11 71 36 70 44 0 20
Mali 26 115 22 70 26 0 35
Mozambique 22 71 15 70 18 0 47
Namibia 152 54 4 65 4 1 33
Niger 13 131 57 70 50 0 0
Nigeria 8 166 76 70 50 0 0
Rwanda 4 141 112 70 50 0 0
Senegal 8 76 47 70 50 0 12
South Africa 42 29 21 35 25 87 167
Sudan 36 71 24 70 29 0 108
Swaziland 16 - - - - - -
Togo 10 95 59 70 50 0 0
Uganda 9 98 58 70 50 0 0
United Republic of Tanzania 13 127 35 70 42 0 50
Zambia 37 29 12 35 14 15 42
Zimbabwe 21 39 21 47 26 14 29
Table A1 Estimated Crop NUEN and Full-chain NUEN per country for 2008 (baseline) as compared with an aspirational target for 2020, based on a 20% relative improvement from the 2008 values. The right hand columns show the equivalent total savings per country (ktonne N /year) achieved by the aspirational goals. For countries where the baseline values exceed the eventual target values, the nutrient saving is set at zero in the last two columns. - indicates data not available. Nr input per person is calculated as the sum of fertilizer input, combustion fixation as NOx, biological N fixation and import at a national level.
Our Nutrient World_reflowed.indd 111 30/01/2013 10:27:58

112 global overview on nutrient management
Estimated annual N input per
person
Crop NUEN
Full-chain NUEN
Crop NUEN Full-chain NUEN
N saving from aspirational Crop NUEN
goal
N saving from aspirational Full-chain NUEN goal
Baseline (2008)
Baseline (2008)
Baseline (2008)
Aspirational Goal (2020)
Aspirational Goal (2020)
Region kg N / person
% % % % (ktonne N /yr)
(ktonne N /yr)
Latin America
Antigua and Barbuda 7 10 83 12 50 0 0
Argentina 102 23 7 27 8 395 494
Bahamas 20 - - - - 0 0
Barbados 9 6 36 7 43 0 1
Bermuda 9 - - - - - -
Bolivia (Plurinational State of) 48 25 11 30 13 16 43
Brazil 46 30 14 36 17 878 1043
Chile 32 12 15 14 18 61 79
Colombia 31 11 17 14 20 108 151
Costa Rica 24 13 16 16 19 12 19
Cuba 12 21 36 25 43 12 21
Dominican Republic 14 14 25 17 30 13 18
Ecuador 18 24 22 29 26 24 31
El Salvador 15 25 25 30 29 13 16
Guatemala 17 19 20 23 25 26 32
Haiti 3 - - - - - -
Honduras 20 16 22 19 27 17 19
Jamaica 8 32 56 38 50 1 0
Mauritius 11 1 33 2 40 1 2
Mexico 27 37 24 44 29 231 363
Netherlands Antilles 53 - - - - - -
Nicaragua 19 38 25 45 30 9 13
Panama 17 17 31 20 37 4 7
Paraguay 87 68 6 70 8 48 60
Peru 21 27 20 32 24 46 79
Suriname 14 - - - - - -
Trinidad and Tobago 26 - - - - - -
Uruguay 102 24 7 29 8 22 33
Venezuela (Bolivarian Republic of) 28 13 22 15 26 61 83
Europe & North America
Albania 15 25 40 31 48 5 7
Austria 29 68 30 70 36 18 25
Bosnia and Herzegovina 22 55 37 66 44 5 7
Bulgaria 53 23 13 27 15 39 41
Canada 106 47 7 56 8 395 419
Czech Republic 56 48 17 57 21 45 48
Cyprus 19 17 25 20 30 1 3
Denmark 63 46 11 55 14 38 42
Our Nutrient World_reflowed.indd 112 30/01/2013 10:27:59
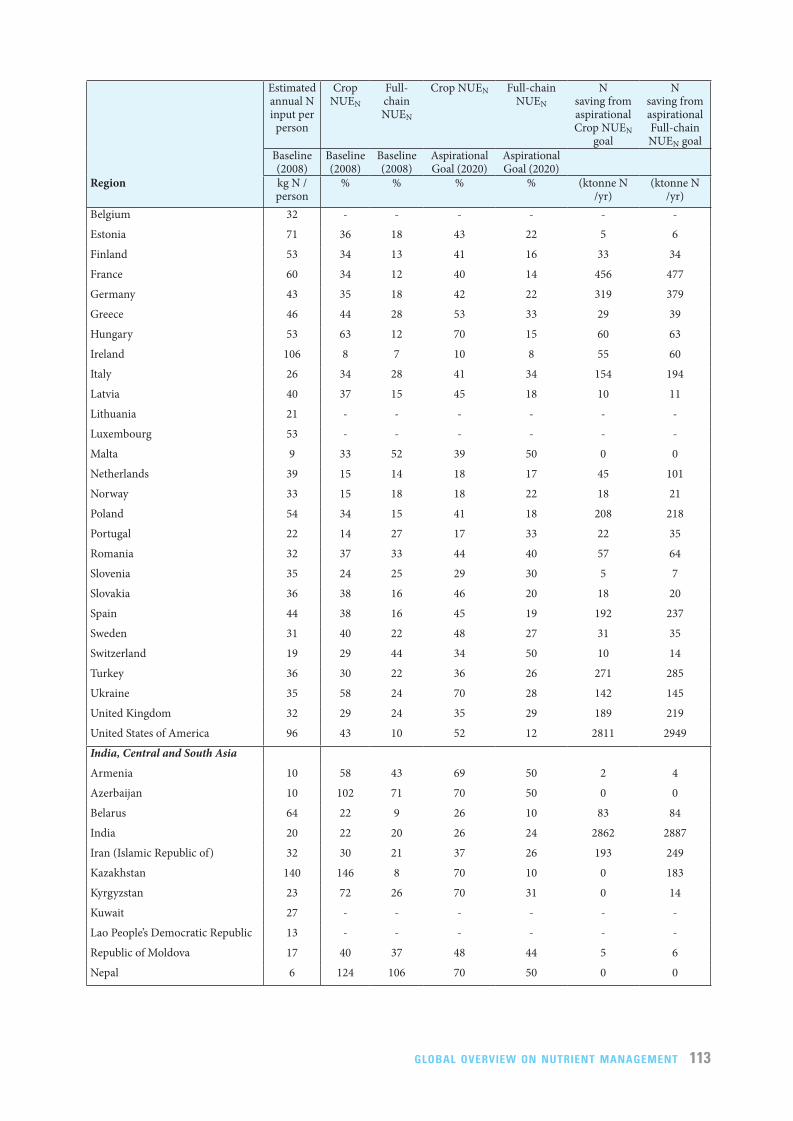
global overview on nutrient management 113
Estimated annual N input per
person
Crop NUEN
Full-chain NUEN
Crop NUEN Full-chain NUEN
N saving from aspirational Crop NUEN
goal
N saving from aspirational Full-chain NUEN goal
Baseline (2008)
Baseline (2008)
Baseline (2008)
Aspirational Goal (2020)
Aspirational Goal (2020)
Region kg N / person
% % % % (ktonne N /yr)
(ktonne N /yr)
Belgium 32 - - - - - -
Estonia 71 36 18 43 22 5 6
Finland 53 34 13 41 16 33 34
France 60 34 12 40 14 456 477
Germany 43 35 18 42 22 319 379
Greece 46 44 28 53 33 29 39
Hungary 53 63 12 70 15 60 63
Ireland 106 8 7 10 8 55 60
Italy 26 34 28 41 34 154 194
Latvia 40 37 15 45 18 10 11
Lithuania 21 - - - - - -
Luxembourg 53 - - - - - -
Malta 9 33 52 39 50 0 0
Netherlands 39 15 14 18 17 45 101
Norway 33 15 18 18 22 18 21
Poland 54 34 15 41 18 208 218
Portugal 22 14 27 17 33 22 35
Romania 32 37 33 44 40 57 64
Slovenia 35 24 25 29 30 5 7
Slovakia 36 38 16 46 20 18 20
Spain 44 38 16 45 19 192 237
Sweden 31 40 22 48 27 31 35
Switzerland 19 29 44 34 50 10 14
Turkey 36 30 22 36 26 271 285
Ukraine 35 58 24 70 28 142 145
United Kingdom 32 29 24 35 29 189 219
United States of America 96 43 10 52 12 2811 2949
India, Central and South Asia
Armenia 10 58 43 69 50 2 4
Azerbaijan 10 102 71 70 50 0 0
Belarus 64 22 9 26 10 83 84
India 20 22 20 26 24 2862 2887
Iran (Islamic Republic of) 32 30 21 37 26 193 249
Kazakhstan 140 146 8 70 10 0 183
Kyrgyzstan 23 72 26 70 31 0 14
Kuwait 27 - - - - - -
Lao People’s Democratic Republic 13 - - - - - -
Republic of Moldova 17 40 37 48 44 5 6
Nepal 6 124 106 70 50 0 0
Our Nutrient World_reflowed.indd 113 30/01/2013 10:27:59

114 global overview on nutrient management
Estimated annual N input per
person
Crop NUEN
Full-chain NUEN
Crop NUEN Full-chain NUEN
N saving from aspirational Crop NUEN
goal
N saving from aspirational Full-chain NUEN goal
Baseline (2008)
Baseline (2008)
Baseline (2008)
Aspirational Goal (2020)
Aspirational Goal (2020)
Region kg N / person
% % % % (ktonne N /yr)
(ktonne N /yr)
Pakistan 22 15 18 19 22 486 491
Russian Federation 38 66 30 70 36 320 392
Saudi Arabia 47 18 15 21 19 43 119
Sri Lanka 12 18 23 22 28 33 37
Tajikistan 17 19 20 23 25 11 15
Turkmenistan 48 - - - - - -
United Arab Emirates 53 - - - - - -
Uzbekistan 33 16 16 20 19 95 115
China, Southeast Asia
Australia 228 36 4 43 4 203 531
Bangladesh 11 30 29 37 35 214 228
Brunei Darussalam 1 3 63 3 50 0 0
Cambodia 10 79 42 70 50 0 16
China 31 22 14 27 17 5906 6431
Democratic People’s Republic of Korea
8 - - - - - -
Fiji 14 10 26 12 32 1 2
Indonesia 16 28 19 33 22 497 519
Japan 17 20 35 24 42 101 229
Malaysia 37 7 10 8 12 123 138
Maldives 3 - - - - - -
Mauritania 78 - - - - - -
Mongolia 408 17 1 20 2 1 119
Myanmar 12 105 43 70 50 0 64
New Zealand 108 5 5 6 6 53 61
Philippines 9 51 33 61 40 104 115
Republic of Korea 23 16 28 19 34 65 101
Thailand 32 21 10 26 12 263 269
Viet Nam 20 31 22 38 26 224 231
Other
Algeria 14 78 45 70 50 0 56
Egypt 19 27 27 33 33 195 228
Israel 24 16 36 19 43 11 21
Jordan 15 5 28 6 33 7 15
Lebanon 11 19 39 23 46 4 7
Libyan Arab Jamahiriya 39 - - - - - -
Morocco 22 13 24 15 29 66 97
Occupied Palestinian Territory 2 - - - - - -
Syrian Arab Republic 28 33 23 39 27 50 65
Tunisia 16 59 34 70 41 14 23
Our Nutrient World_reflowed.indd 114 30/01/2013 10:27:59

Contributors Affiliation CountryM.A. Sutton Centre for Ecology & Hydrology (CEH) UKA. Bleeker Energy research Centre for The Netherlands (ECN) The NetherlandsC.M. Howard Centre for Ecology & Hydrology (CEH); University of Edinburgh UKM. Bekunda Makerere University UgandaB. Grizzetti CNRS/Université Pierre et Marie Curie (UPMC) FranceW. de Vries Alterra; Wageningen University The NetherlandsH.J.M. van Grinsven Netherlands Environmental Assessment Agency (PBL) The NetherlandsY.P. Abrol Indian Nitrogen Group, New Delhi IndiaT.K. Adhya KIIT University, Bhubaneswar IndiaG. Billen CNRS/Université Pierre et Marie Curie (UPMC) FranceE.A. Davidson The Woods Hole Research Center USAA. Datta United Nations Environment Programme KenyaR. Diaz Virginia Institute of Marine Science USAJ.W. Erisman Louis Bolk Institute The NetherlandsX.J. Liu China Agricultural University ChinaO. Oenema Alterrra; Wageningen University The NetherlandsC. Palm Earth Institute, Columbia University USAN. Raghuram School of Biotechnology, GGS Indraprastha University IndiaS. Reis Centre for Ecology & Hydrology UKR.W. Scholz ETH Zurich, Department of Environmental Systems Science SwitzerlandT. Sims College of Agriculture and Natural Resources, Michigan State University USAH. Westhoek Netherlands Environmental Assessment Agency (PBL) The NetherlandsF.S. Zhang China Agricultural University ChinaS. Ayyappan Ministry of Agriculture, Department of Agricultural Research and Education IndiaA.F. Bouwman Netherlands Environmental Assessment Agency (PBL) The NetherlandsM. Bustamante Brazilian Ministry of Science and Technology & University of Brasilia BrazilD. Fowler Centre for Ecology & Hydrology UKJ.N. Galloway University of Virginia USAM.E. Gavito National Autonomous University of Mexico MexicoJ. Garnier CNRS/Université Pierre et Marie Curie (UPMC) FranceS. Greenwood Scientific Committee on Problems of the Environment (SCOPE) FranceD.T. Hellums International Fertilizer Development Center (IFDC) Brazil/MexicoM. Holland EMRC UKC. Hoysall Centre for Sustainable Technologies, Indian Institute of Science IndiaV.J. Jaramillo National Autonomous University of Mexico MexicoZ. Klimont International Institute for Applied Systems Analysis AustriaJ.P. Ometto National Institute for Space Research (INPE) BrazilH. Pathak Indian Agricultural Research Institute IndiaV. Plocq Fichelet Scientific Committee on Problems of the Environment (SCOPE) FranceD. Powlson Rothamsted Research UKK. Ramakrishna United National Economic and Social Commission for Asia and the Pacific (UNESCAP) Republic of KoreaA. Roy International Fertilizer Development Center (IFDC) USAK. Sanders The Netherlands Ministry of Infrastructure & Environment The NetherlandsC. Sharma Indian Nitrogen Group (ING), New Dehli IndiaB. Singh Indian Nitrogen Group (ING), New Dehli IndiaU. Singh International Fertilizer Development Center (IFDC) USAX.Y. Yan Institute of Soil Science, Chinese Academy of Sciences ChinaY. Zhang China Agricultural University China
Front cover, image credit: 123RTF#4371030Back cover, image credit: F. lamiot [CC-BY-SA-2.5 (http://creativecommons.org/licenses/by-sa/2.5)], via Wikimedia Commons
Affiliations of contributors
Our Nutrient World_reflowed.indd 115 30/01/2013 10:28:00
Our Nutrient World: The challenge to produce more food and energy with less pollution. Global Overview on Nutrient Management, prepared by the Global Partnership on Nutrient Management in collaboration with the International Nitrogen Initiative
This report draws attention to the multiple benefits and threats of human nutrient use. It highlights how nitrogen and phosphorus fertilizers are estimated to feed half the human population alive today, and how they will remain critical in the future, especially given increasing population and potential bioenergy needs. Yet high nutrient use has created a web of pollution affecting the environment and human health, while insufficient access to nutrients has led to soil degradation, causing food insecurity and exacerbating loss of natural ecosystems. The report shows how these problems cross all global change challenges, threatening water, air and soil quality, climate balance, stratospheric ozone and biodiversity.
The risk of depleting global phosphorus sources over the next century is examined and concluded to be much less than suggested by some previous publications. Remaining risks concern the distribution of available nutrient reserves and the long-term needs of humanity (including for potassium, zinc and other nutrients), all of which support the environmental and food-security case for better nutrient stewardship.
Ten key actions are identified that would help maximize nutrient benefits for humanity, while minimizing the many threats. Improving nutrient use efficiency across the full supply chain is identified as a shared challenge for all countries that links these key actions, while contributing to the Green Economy.
Examples of current national and regional nutrient policies are illustrated showing many positive actions. However, it is concluded that a more joined-up approach addressing the ‘Nutrient Nexus’ would be expected to deliver substantial synergies, motivating common action while minimizing trade-offs.
The report highlights that there is still no intergovernmental framework to address the multiple challenges for nitrogen, phosphorus and other nutrients. A blueprint for such a framework is outlined, considering the institutional options. The potential for net economic benefits is illustrated by estimating the consequences of meeting a common aspirational goal to improve nutrient use efficiency by 20% by the year 2020.
Our Nutrient World_reflowed.indd 116 30/01/2013 10:28:03