Embed Size (px)
Citation preview

Q U A L I T Y A N D O U T C O M E S
Department of Ophthalmology
2015

Table of Contents
Letter from the President and CEO and the Chair of Ophthalmology ...........................1
About the Quality and Outcomes Program ..................................................................................................2
Ophthalmology Clinical Leadership in Quality: 2015 ........................................................................4
About Massachusetts Eye and Ear ...........................................................................................................................5
Department of Ophthalmology Overview .....................................................................................................6
Key Statistics .....................................................................................................................................................................................9
Emergency Department ...................................................................................................................................................10
Eye Trauma Service ...............................................................................................................................................................12
Comprehensive Ophthalmology and Cataract Consultation Service ............................14
Retina Service ..............................................................................................................................................................................16
Ocular Oncology Service ...............................................................................................................................................19
Glaucoma Consultation Service ..............................................................................................................................20
Cornea and Refractive Surgery Service ...........................................................................................................24
Ophthalmic Plastic Surgery Service .....................................................................................................................31
Pediatric Ophthalmology and Strabismus ...................................................................................................33
Neuro-Ophthalmology Service ................................................................................................................................39
Ocular Immunology and Uveitis Service .......................................................................................................42
Vision Rehabilitation Service .......................................................................................................................................43
Ophthalmology Department Full-time and
Affiliate Medical Staff and Practice Locations ................................................................................46
Contributors ..................................................................................................................................................................................48
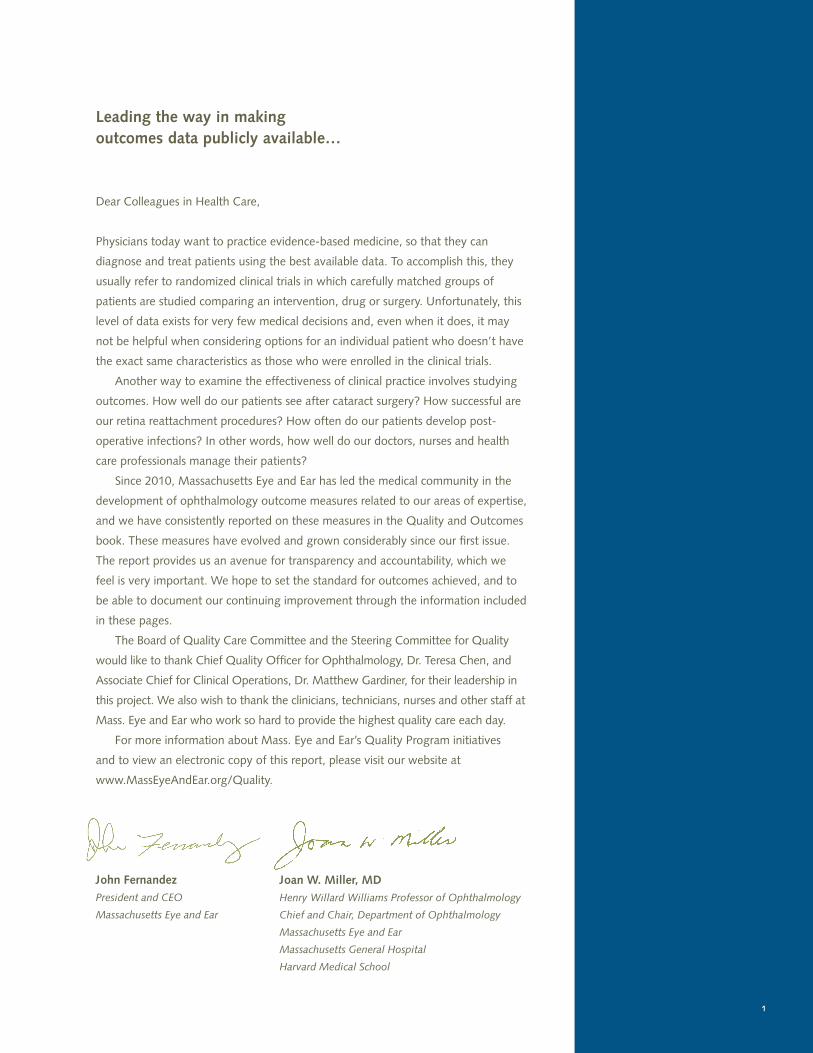
Leading the way in making outcomes data publicly available…
Dear Colleagues in Health Care,
Physicians today want to practice evidence-based medicine, so that they can
diagnose and treat patients using the best available data. To accomplish this, they
usually refer to randomized clinical trials in which carefully matched groups of
patients are studied comparing an intervention, drug or surgery. Unfortunately, this
level of data exists for very few medical decisions and, even when it does, it may
not be helpful when considering options for an individual patient who doesn’t have
the exact same characteristics as those who were enrolled in the clinical trials.
Another way to examine the effectiveness of clinical practice involves studying
outcomes. How well do our patients see after cataract surgery? How successful are
our retina reattachment procedures? How often do our patients develop post-
operative infections? In other words, how well do our doctors, nurses and health
care professionals manage their patients?
Since 2010, Massachusetts Eye and Ear has led the medical community in the
development of ophthalmology outcome measures related to our areas of expertise,
and we have consistently reported on these measures in the Quality and Outcomes
book. These measures have evolved and grown considerably since our first issue.
The report provides us an avenue for transparency and accountability, which we
feel is very important. We hope to set the standard for outcomes achieved, and to
be able to document our continuing improvement through the information included
in these pages.
The Board of Quality Care Committee and the Steering Committee for Quality
would like to thank Chief Quality Officer for Ophthalmology, Dr. Teresa Chen, and
Associate Chief for Clinical Operations, Dr. Matthew Gardiner, for their leadership in
this project. We also wish to thank the clinicians, technicians, nurses and other staff at
Mass. Eye and Ear who work so hard to provide the highest quality care each day.
For more information about Mass. Eye and Ear’s Quality Program initiatives
and to view an electronic copy of this report, please visit our website at
www.MassEyeAndEar.org/Quality.
John FernandezPresident and CEO
Massachusetts Eye and Ear
Joan W. Miller, MDHenry Willard Williams Professor of Ophthalmology
Chief and Chair, Department of Ophthalmology
Massachusetts Eye and Ear
Massachusetts General Hospital
Harvard Medical School
1
About the Quality and Outcomes Program
2
Each year, Massachusetts Eye and Ear publishes the Quality and Outcomes book to
objectively evaluate our quality and outcomes for the public. Now in its sixth year of
reporting outcomes, the book serves as a testament to the premier care we provide
for our patients at Mass. Eye and Ear, and it is our hope that other institutions may be
inspired to consider publishing similar reports.
We have been a leader in the medical community for quality and outcomes in
a variety of ways. In ophthalmology—for instance—the international benchmark
in cataract surgery for achieving within 1 diopter of target refraction is between 71
and 94 percent.1 Even though we have always exceeded international benchmarks,
our latest data show that we now exceed the upper range, with 96 percent of our
patients achieving target refraction criteria. Our outcomes measure was submitted
to Medicare and is now a nationwide outcomes measure. Mass. Eye and Ear also
has some of the lowest reported rates of endophthalmitis after intravitreal injections,
which is one of the most common outpatient procedures in ophthalmology.2
Behind the Quality and Outcomes book is the Mass. Eye and Ear Quality
Program, an institutional initiative directed by the Board of Quality Care Committee
and the Steering Committee for Quality, which meets weekly to review issues in four
core areas: outcomes, provider excellence, clinical incidents response and process
improvement. These meetings provide a forum for close interaction between quality
leaders in Ophthalmology, Otolaryngology, Anesthesia, Nursing, Legal, Information
Services and others, fostering a team approach to achieve best practices and enhance
communication between functional areas of the hospital.
When problems do arise, clinical incidences are tracked electronically and
subsequently reviewed by the Steering Committee for Quality, which works together
to identify trends and implement a correction plan. We work with other hospital
committees, including the OR committee, infection control, medical records, patient
family advisory council and others, when we need their expertise and advice on
certain issues.
For example, in a past Steering Committee for Quality meeting, we had
addressed a cataract surgery case with a wrong intraocular lens (IOL), a serious
reportable event. During the post-event review process, we found that poor
handwriting on the order form was the root cause of this wrong IOL. We corrected
the problem by mandating that all IOL orders be typed. We published our “lessons
learned” in the journal Ophthalmology in 2012, addressing the issues associated
with wrong IOLs, which is one of the most common preventable medical errors
in ophthalmology.3
In 2015, Dr. Miller and I shared our experience in creating and implementing
new policies in a paper published in JAMA Ophthalmology, “Sentinel Events,
Serious Reportable Events and Root Cause Analysis.”4 The paper describes our
multidisciplinary team approach for identifying the primary or root cause of sentinel
events, with the ultimate goal of improving quality and outcomes in ophthalmology.
Our article is one of the first to demonstrate how leadership can create and reinforce
new policies that improve ophthalmology outcomes.
Today, the Mass. Eye and Ear Quality Program remains committed to publishing
a robust and transparent assessment of quality care report each year. We hope you
find the publication interesting and useful, and we welcome your comments and
feedback. It is our hope that we can continue to set new standards for outcomes
achieved in our field.
Teresa C. Chen, M.D.Chief Quality Officer for Ophthalmology
Department of Ophthalmology
Massachusetts Eye and Ear
Harvard Medical School
1Simon SS, Chee Y, Haddadin RI, Veldman PB, Borboli-Gerogiannis S, Brauner SC, Chang KK, Chen, SH, Gardiner MF,
Greenstein SH, Kloek CE, Chen TC. Achieving Target Refraction After Cataract Surgery. Ophthalmology. 2014;121(2):440-4.2Englander M, Chen TC, Paschalis EI, Miller JW, Kim I. Intravitreal Injections at the Massachusetts Eye and Ear
Infirmary: Analysis of Treatment Indications and Postinjection Endophthalmitis Rates. British Journal of Ophthalmology.
2013;97(4):460-5. 3Schein OD, Banta JT, Chen TC, Pritzker S, Schachat AP. Lessons Learned: Wrong Intraocular Lens.
Ophthalmology. 2012 Oct;119(10):2059-64. 4Chen TC, Schein OD, Miller JW. Sentinel Events, Serious Reportable Events
and Root Cause Analysis. JAMA Ophthalmology. 2015 Jun;133(6):631-2.
3

Ophthalmology Clinical Leadership in Quality: 2015
Joan W. Miller, M.D.Henry Willard Williams Professor and Chair of Ophthalmology, Harvard Medical SchoolChief of Ophthalmology, Massachusetts Eye and Ear, Massachusetts General Hospital
Teresa C. Chen, M.D.Associate Professor of Ophthalmology, Harvard Medical SchoolChief Quality Officer, Department of Ophthalmology, Massachusetts Eye and Ear
Matthew Gardiner, M.D.Assistant Professor of Ophthalmology, Harvard Medical SchoolAssociate Chief for Clinical Operations, Massachusetts Eye and Ear
Eileen Lowell, R.N., M.M.Vice President of Patient Care Services, Chief Nursing Officer, Massachusetts Eye and Ear
Debra Rogers, M.S.Vice President for OphthalmologyMassachusetts Eye and Ear
Deborah Cronin-Waelde, RN, MSN, NEA-BCDirector of Operations, OphthalmologyMassachusetts Eye and Ear
Sunil Eappen, M.D.Assistant Professor of Anaesthesia, Harvard Medical SchoolChief Medical Officer, Chief of Anesthesiology, Massachusetts Eye and Ear
4
Clinical Locations
Boston — Main Campus
Boston — Longwood
Boston — Joslin
Braintree
Concord
Duxbury
East Bridgewater
Medford
Milton
Newton
Plainville
Providence
Quincy
Stoneham
Waltham
Weymouth
For more information, visit
MassEyeAndEar.org/Locations.
About Massachusetts Eye and Ear
Founded in 1824, Massachusetts Eye and Ear is a pre-eminent specialty, teaching
and research hospital dedicated to caring for disorders of the eyes, ears, nose, throat,
head and neck. Our dedicated staff provides primary and subspecialty care and serves
as a referral center for inpatient and outpatient medical and surgical care.
Mass. Eye and Ear is the leading authority in its specialties throughout
the northeast and is a resource globally for advances in patient care, research
and education. As the primary academic center for Harvard Medical School’s
Departments of Ophthalmology and Otolaryngology, we are deeply committed
to providing a superb education to the next generation of visionary health care
leaders. Our world-renowned experts are continuously innovating in the fields of
translational and bench research, turning insights into cures that benefit countless
people. We continue to forge new partnerships and alliances—locally, nationally
and beyond our borders—to increase our reach and make our expertise, services
and resources available to all who need them.
Pivotal to our clinical quality efforts is the use of Partners eCare, a highly
integrated health and administrative information system that primarily uses
the software vendor Epic. Partners eCare is utilized by the majority of Harvard
Medical School’s network of hospitals and affiliates, facilitating quick and easy
communication among referring physicians and Mass. Eye and Ear’s consulting
ophthalmologists, otolaryngologists and radiologists. It also enables our physicians
to instantly access our specialists, affording seamless and rapid access to some of
the best ophthalmology and otolaryngology resources available.
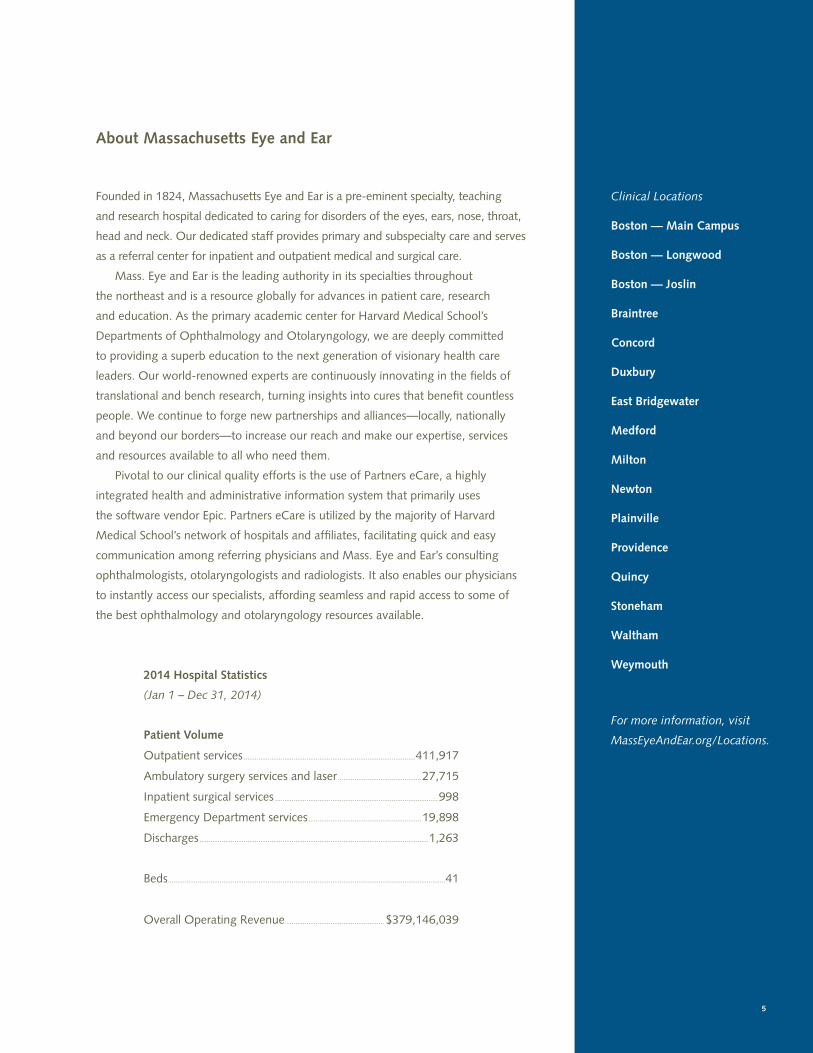
2014 Hospital Statistics
(Jan 1 – Dec 31, 2014)
Patient Volume
Outpatient services .............................................................................................411,917
Ambulatory surgery services and laser .............................................27,715
Inpatient surgical services ........................................................................................998
Emergency Department services .............................................................19,898
Discharges ............................................................................................................................1,263
Beds ......................................................................................................................................................41
Overall Operating Revenue ..................................................... $379,146,039
Stoneham
5
Academic Affiliations
Harvard Medical School
Massachusetts General Hospital
Brigham and Women’s Hospital
Joslin Diabetes Center/ Beetham Eye Institute
Boston Children’s Hospital
Beth Israel Deaconess Medical Center
Veterans Affairs Boston Healthcare System
VA Maine Healthcare System
Cambridge Health Alliance
Aravind Eye Hospital, India
Eye and ENT Hospital of Fudan University, Shanghai, China
At Mass. Eye and Ear/Harvard Medical School Department of Ophthalmology, we
have nearly two centuries of experience in developing innovative approaches to
treating eye disease and reducing blindness worldwide. We founded subspecialty
training in the areas of cornea, retina and glaucoma, and have pioneered tools and
treatments for numerous diseases and conditions ranging from retinal detachment
to age-related macular degeneration to corneal scarring. Our patient-centered
core values focus on delivering the highest quality of care through education,
innovation and service excellence.
We Are:
• The primary teaching hospital of the Harvard Medical School Department
of Ophthalmology
• Home to Schepens Eye Research Institute, Howe Laboratory, and Berman-Gund
Laboratory for the Study of Retinal Degenerations
• Accelerating research and discovery through our multidisciplinary institutes and
subspecialty-based centers of excellence:
Ocular Genomics Institute
Ocular Regenerative Medicine Institute
Infectious Disease Institute
Age-related Macular Degeneration Center of Excellence
Cornea Center of Excellence
Diabetic Eye Disease Center of Excellence
Glaucoma Center of Excellence
Mobility Enhancement & Vision Rehabilitation Center of Excellence
Ocular Oncology Center of Excellence
Clinical Affiliations
Massachusetts General Hospital (MGH) Department of Ophthalmology
• Mass. Eye and Ear provides comprehensive and subspecialty care and
inpatient consultations to MGH patients, including 24/7 emergency eye care
and trauma coverage. Mass. Eye and Ear clinicians also coordinate Neuro-
Ophthalmology and Burn Unit consultations at MGH.
• Mass. Eye and Ear staff screen MGH patients with or at high risk for diabetic
eye disease on a same-day basis in the main campus Retina Service and
through MGH’s Chelsea HealthCare Center teleretinal screening program.
6
Massachusetts Eye and Ear Ophthalmology Department
For more information about
the Mass. Eye and Ear Quality
Program or the Department
of Ophthalmology, please
visit our website at
www.MassEyeAndEar.org.
• Mass. Eye and Ear’s new Same Day Service evaluates urgent and emergent
eye concerns of MGH patients as a less costly, more efficient alternative to
Emergency Department care.
Joslin Diabetes Center/Beetham Eye Institute (BEI)
• Mass. Eye and Ear and BEI clinicians provide coordinated, integrated and
comprehensive care to patients throughout Boston to prevent, diagnose and
treat patients at risk for diabetic eye disease.
Brigham and Women’s Hospital (BWH)
• Mass. Eye and Ear ophthalmologists provide subspecialty care in glaucoma,
cornea, and pediatric retina surgery at Boston Children’s Hospital.
• BWH patients also receive a full range of ophthalmic care including Same
Day Service urgent consultation and evaluations at Mass. Eye and Ear,
Longwood, staffed by Mass. Eye and Ear clinicians with participation from
Joslin diabetes specialists.
Children’s Hospital Ophthalmology Foundation
• Mass. Eye and Ear ophthalmologists provide subspecialty care in glaucoma,
cornea, and pediatric retina surgery at Boston Children’s Hospital.
• Children’s Hospital clinicians staff the comprehensive pediatric
ophthalmology and strabismus service at Mass. Eye and Ear.
Ophthalmology Resources at Mass. Eye and Ear
• Highly skilled teams provide a full spectrum of primary and subspecialty
ophthalmic care.
• Our dedicated eye emergency department is available 24/7.
• The Morse Laser Center provides advanced laser procedures using state-of-the-
art refractive, glaucoma, retinal and anterior segment lasers.
• The Ocular Surface Imaging Center enables rapid, non-invasive corneal biopsies.
• Our Inherited Retinal Disorders Service performs evaluations of patients
referred for diagnosis, prognosis, genetic counseling and treatment of retinal
degenerative disorders.
• The David Glendenning Cogan Laboratory of Ophthalmic Pathology provides
enhanced diagnostic services in conjunction with the MGH Surgical Pathology Service.
• Our expanding Optometry Service provides screening and vision care in the
context of ophthalmic practice.
7
• The full service Contact Lens Service specializes in therapeutic fits, bandage and
specialty contact lenses.
• The Howe Library houses one of the most extensive ophthalmology research
collections in the world.
• The Mass. Eye and Ear Medical Unit is staffed by Mass. Eye and Ear hospitalists
and nurse practitioners.
• The Mass. Eye and Ear Radiology Department houses a dedicated MRI/CT
imaging suite.
• Our dedicated Social Work and Discharge Planning Department provides
information, counseling and referral services to patients and their families.
• The International Program offers patients assistance with appointments,
transportation, accommodations and language translation.
• Mass. Eye and Ear’s Retina Service houses a dedicated ophthalmic ultrasound
imaging suite as part of the Minda de Gunzburg Retinal Imaging Center.
8
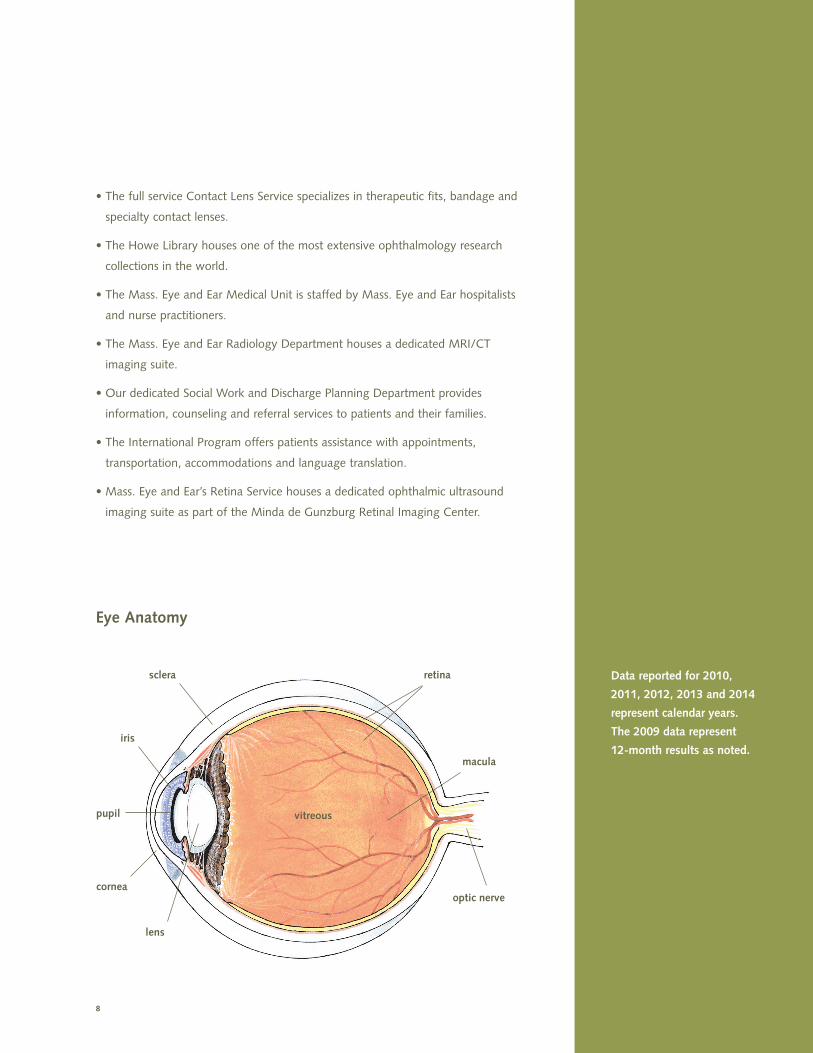
cornea
lens
pupil
iris
sclera retina
macula
optic nerve
vitreous
Data reported for 2010,
2011, 2012, 2013 and 2014
represent calendar years.
The 2009 data represent
12-month results as noted.
Eye Anatomy
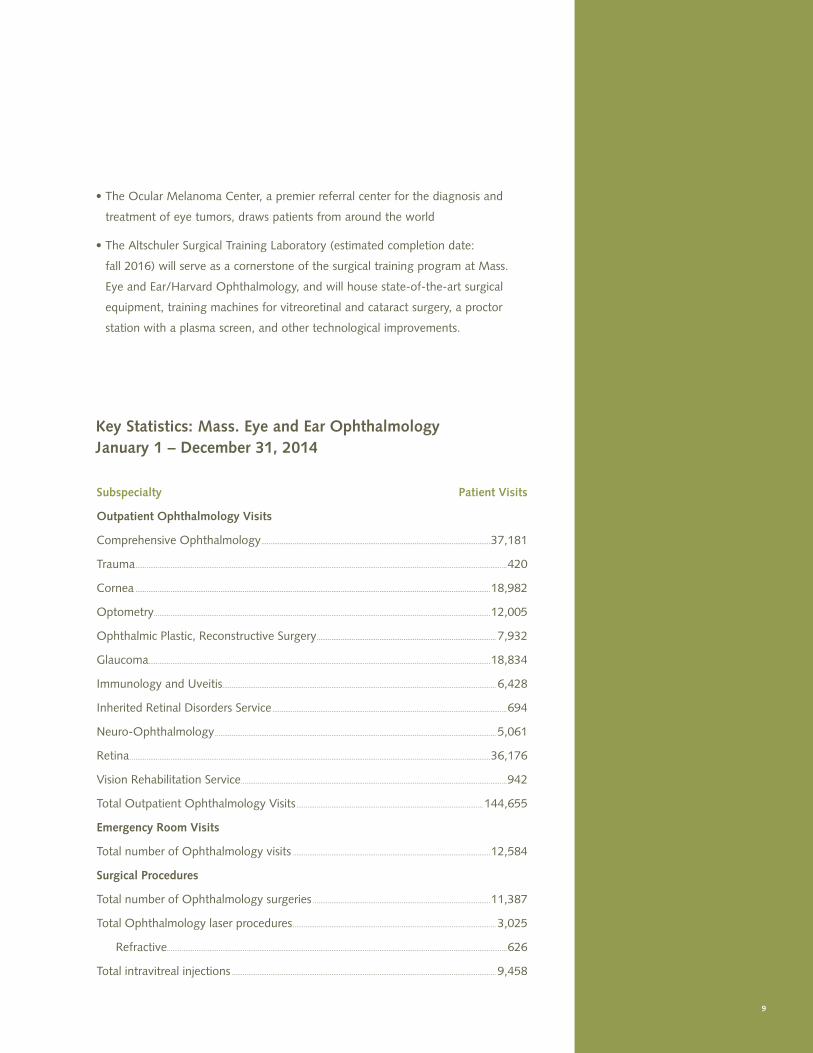
Key Statistics: Mass. Eye and Ear OphthalmologyJanuary 1 – December 31, 2014
• The Ocular Melanoma Center, a premier referral center for the diagnosis and
treatment of eye tumors, draws patients from around the world
• The Altschuler Surgical Training Laboratory (estimated completion date:
fall 2016) will serve as a cornerstone of the surgical training program at Mass.
Eye and Ear/Harvard Ophthalmology, and will house state-of-the-art surgical
equipment, training machines for vitreoretinal and cataract surgery, a proctor
station with a plasma screen, and other technological improvements.
9
Subspecialty Patient Visits
Outpatient Ophthalmology Visits
Comprehensive Ophthalmology ............................................................................................................................37,181
Trauma .........................................................................................................................................................................................................420
Cornea ................................................................................................................................................................................................18,982
Optometry ......................................................................................................................................................................................12,005
Ophthalmic Plastic, Reconstructive Surgery ................................................................................................. 7,932
Glaucoma.........................................................................................................................................................................................18,834
Immunology and Uveitis.................................................................................................................................................... 6,428
Inherited Retinal Disorders Service ...............................................................................................................................694
Neuro-Ophthalmology ........................................................................................................................................................ 5,061
Retina ...................................................................................................................................................................................................36,176
Vision Rehabilitation Service ................................................................................................................................................942
Total Outpatient Ophthalmology Visits ..................................................................................................... 144,655
Emergency Room Visits
Total number of Ophthalmology visits ...........................................................................................................12,584
Surgical Procedures
Total number of Ophthalmology surgeries ................................................................................................11,387
Total Ophthalmology laser procedures .............................................................................................................. 3,025
Refractive........................................................................................................................................................................................626
Total intravitreal injections ............................................................................................................................................... 9,458
10
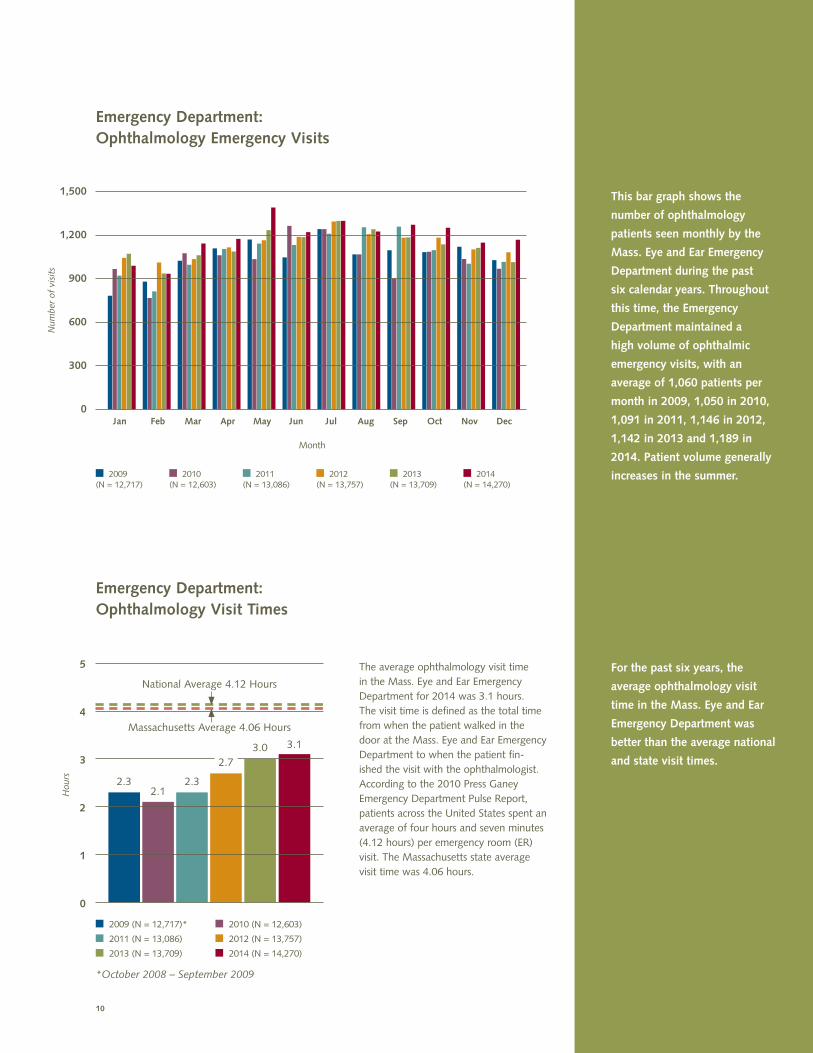
Emergency Department: Ophthalmology Emergency Visits
1,500
1,200
900
600
300
0Jan Feb Mar Apr May Jun Jul Aug Sep Oct Nov Dec
Num
ber
of v
isit
s
2009 (N = 12,717)
2010 (N = 12,603)
2011 (N = 13,086)
2012 (N = 13,757)
2013 (N = 13,709)
2014 (N = 14,270)
Month
For the past six years, the
average ophthalmology visit
time in the Mass. Eye and Ear
Emergency Department was
better than the average national
and state visit times.
Emergency Department: Ophthalmology Visit Times
5
4
3
2
1
0
2.32.1
2.3
3.0 3.1
Massachusetts Average 4.06 Hours
Hou
rs
The average ophthalmology visit time in the Mass. Eye and Ear Emergency Department for 2014 was 3.1 hours. The visit time is defined as the total time from when the patient walked in the door at the Mass. Eye and Ear Emergency Department to when the patient fin-ished the visit with the ophthalmologist. According to the 2010 Press Ganey Emergency Department Pulse Report, patients across the United States spent an average of four hours and seven minutes (4.12 hours) per emergency room (ER) visit. The Massachusetts state average visit time was 4.06 hours.
National Average 4.12 Hours
2009 (N = 12,717)* 2010 (N = 12,603)
2011 (N = 13,086) 2012 (N = 13,757)
2013 (N = 13,709) 2014 (N = 14,270)
*October 2008 – September 2009
2.7
This bar graph shows the
number of ophthalmology
patients seen monthly by the
Mass. Eye and Ear Emergency
Department during the past
six calendar years. Throughout
this time, the Emergency
Department maintained a
high volume of ophthalmic
emergency visits, with an
average of 1,060 patients per
month in 2009, 1,050 in 2010,
1,091 in 2011, 1,146 in 2012,
1,142 in 2013 and 1,189 in
2014. Patient volume generally
increases in the summer.
The Mass. Eye and Ear
Emergency Department
has a lower LWBS rate
when compared to national
benchmarks.
11
Emergency Department: Ophthalmology “Left Without Being Seen” (LWBS) Rate
10
9
8
7
6
5
4
3
2
1
0
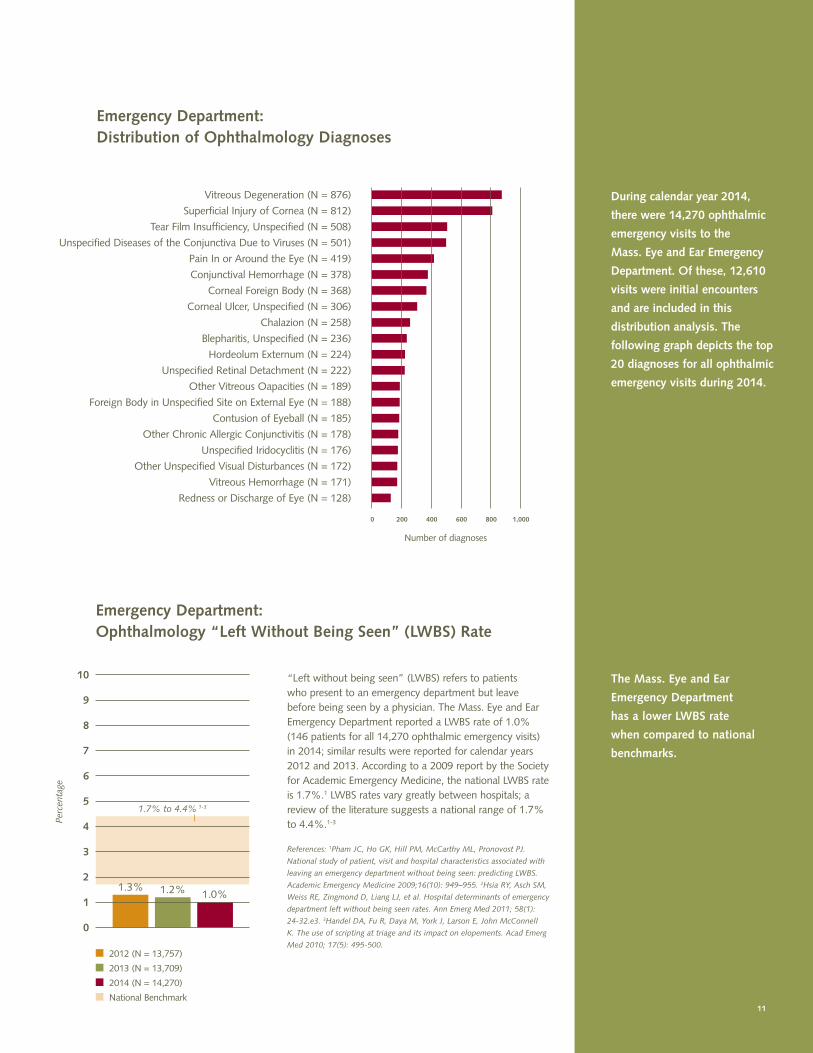
“Left without being seen” (LWBS) refers to patients who present to an emergency department but leave before being seen by a physician. The Mass. Eye and Ear Emergency Department reported a LWBS rate of 1.0% (146 patients for all 14,270 ophthalmic emergency visits) in 2014; similar results were reported for calendar years 2012 and 2013. According to a 2009 report by the Society for Academic Emergency Medicine, the national LWBS rate is 1.7%.1 LWBS rates vary greatly between hospitals; a review of the literature suggests a national range of 1.7% to 4.4%.1-3
References: 1Pham JC, Ho GK, Hill PM, McCarthy ML, Pronovost PJ.
National study of patient, visit and hospital characteristics associated with
leaving an emergency department without being seen: predicting LWBS.
Academic Emergency Medicine 2009;16(10): 949–955. 2Hsia RY, Asch SM,
Weiss RE, Zingmond D, Liang LJ, et al. Hospital determinants of emergency
department left without being seen rates. Ann Emerg Med 2011; 58(1):
24-32.e3. 3Handel DA, Fu R, Daya M, York J, Larson E, John McConnell
K. The use of scripting at triage and its impact on elopements. Acad Emerg
Med 2010; 17(5): 495-500.
Vitreous Degeneration (N = 876)
Superficial Injury of Cornea (N = 812)
Tear Film Insufficiency, Unspecified (N = 508)
Unspecified Diseases of the Conjunctiva Due to Viruses (N = 501)
Pain In or Around the Eye (N = 419)
Conjunctival Hemorrhage (N = 378)
Corneal Foreign Body (N = 368)
Corneal Ulcer, Unspecified (N = 306)
Chalazion (N = 258)
Blepharitis, Unspecified (N = 236)
Hordeolum Externum (N = 224)
Unspecified Retinal Detachment (N = 222)
Other Vitreous Oapacities (N = 189)
Foreign Body in Unspecified Site on External Eye (N = 188)
Contusion of Eyeball (N = 185)
Other Chronic Allergic Conjunctivitis (N = 178)
Unspecified Iridocyclitis (N = 176)
Other Unspecified Visual Disturbances (N = 172)
Vitreous Hemorrhage (N = 171)
Redness or Discharge of Eye (N = 128)
1.7% to 4.4% 1-3
Perc
enta
ge
1.3% 1.2% 1.0%
2012 (N = 13,757)
2013 (N = 13,709)
2014 (N = 14,270)
National Benchmark
During calendar year 2014,
there were 14,270 ophthalmic
emergency visits to the
Mass. Eye and Ear Emergency
Department. Of these, 12,610
visits were initial encounters
and are included in this
distribution analysis. The
following graph depicts the top
20 diagnoses for all ophthalmic
emergency visits during 2014.
Emergency Department: Distribution of Ophthalmology Diagnoses
0 200 400 600 800 1,000
Number of diagnoses
12
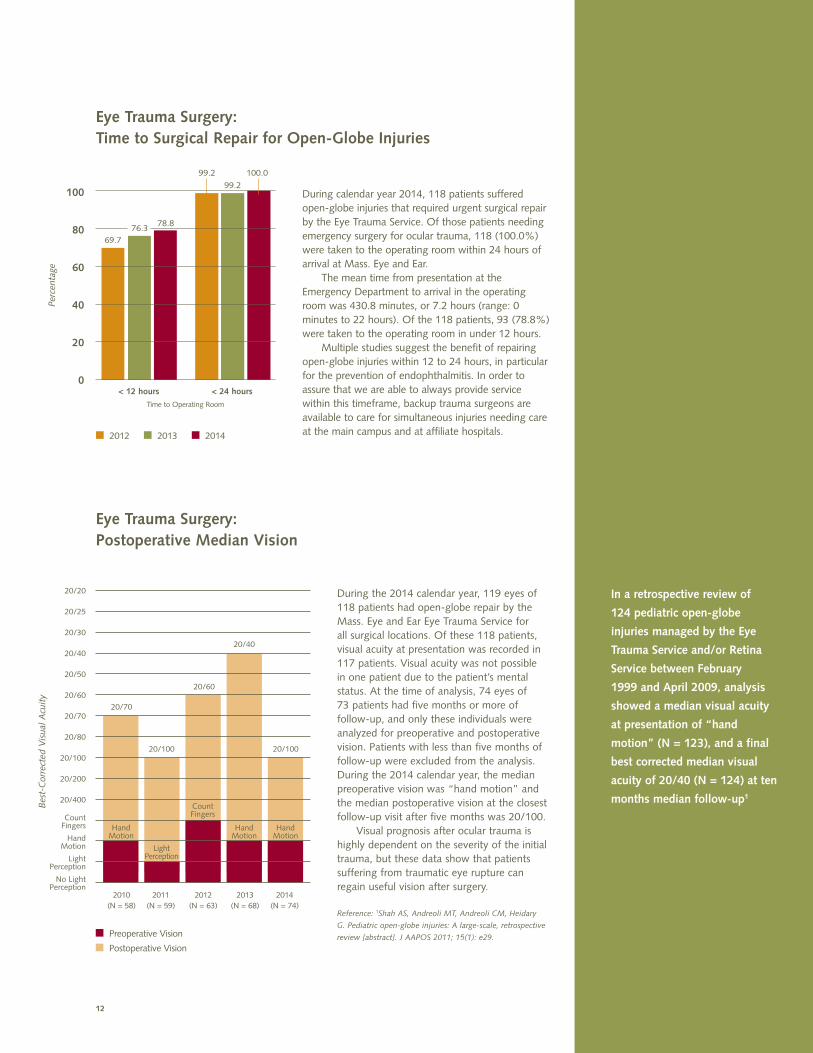
In a retrospective review of
124 pediatric open-globe
injuries managed by the Eye
Trauma Service and/or Retina
Service between February
1999 and April 2009, analysis
showed a median visual acuity
at presentation of “hand
motion” (N = 123), and a final
best corrected median visual
acuity of 20/40 (N = 124) at ten
months median follow-up1
Eye Trauma Surgery: Postoperative Median Vision
Bes
t-C
orre
cted
Vis
ual A
cuit
y
Preoperative Vision
Postoperative Vision
2010(N = 58)
2011 (N = 59)
2012 (N = 63)
2013(N = 68)
2014(N = 74)
20/70
20/100 20/100
Light Perception
CountFingers
Hand Motion
Hand Motion
Hand Motion
20/60
20/40
During the 2014 calendar year, 119 eyes of 118 patients had open-globe repair by the Mass. Eye and Ear Eye Trauma Service for all surgical locations. Of these 118 patients, visual acuity at presentation was recorded in 117 patients. Visual acuity was not possible in one patient due to the patient’s mental status. At the time of analysis, 74 eyes of 73 patients had five months or more of follow-up, and only these individuals were analyzed for preoperative and postoperative vision. Patients with less than five months of follow-up were excluded from the analysis. During the 2014 calendar year, the median preoperative vision was “hand motion” and the median postoperative vision at the closest follow-up visit after five months was 20/100. Visual prognosis after ocular trauma is highly dependent on the severity of the initial trauma, but these data show that patients suffering from traumatic eye rupture can regain useful vision after surgery.
Reference: 1Shah AS, Andreoli MT, Andreoli CM, Heidary
G. Pediatric open-globe injuries: A large-scale, retrospective
review [abstract]. J AAPOS 2011; 15(1): e29.
20/20
20/25
20/30
20/40
20/50
20/60
20/70
20/80
20/100
20/200
20/400
Count Fingers
Hand Motion
Light Perception
No Light Perception
Eye Trauma Surgery: Time to Surgical Repair for Open-Globe Injuries
During calendar year 2014, 118 patients suffered open-globe injuries that required urgent surgical repair by the Eye Trauma Service. Of those patients needing emergency surgery for ocular trauma, 118 (100.0%) were taken to the operating room within 24 hours of arrival at Mass. Eye and Ear. The mean time from presentation at the Emergency Department to arrival in the operating room was 430.8 minutes, or 7.2 hours (range: 0 minutes to 22 hours). Of the 118 patients, 93 (78.8%) were taken to the operating room in under 12 hours. Multiple studies suggest the benefit of repairing open-globe injuries within 12 to 24 hours, in particular for the prevention of endophthalmitis. In order to assure that we are able to always provide service within this timeframe, backup trauma surgeons are available to care for simultaneous injuries needing care at the main campus and at affiliate hospitals.
100
80
60
40
20
0
2012 2013 2014
Perc
enta
ge
< 12 hours < 24 hours
Time to Operating Room
100.0
69.776.3 78.8
99.299.2
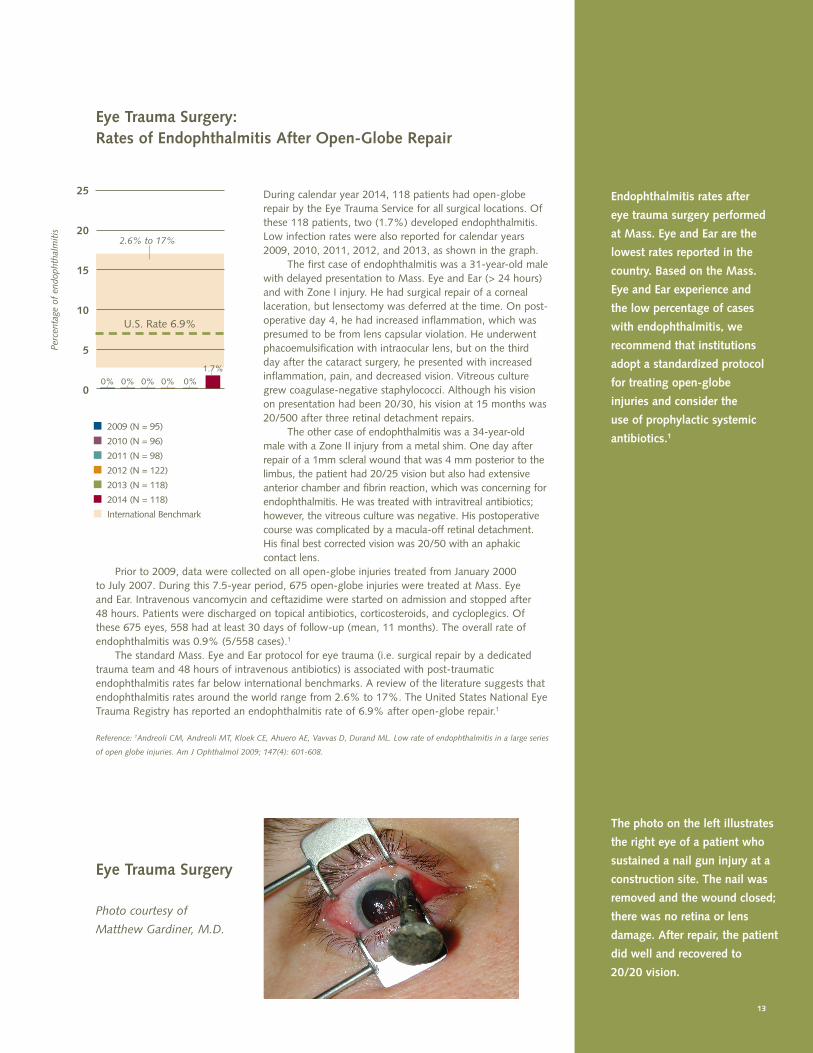
During calendar year 2014, 118 patients had open-globe repair by the Eye Trauma Service for all surgical locations. Of these 118 patients, two (1.7%) developed endophthalmitis. Low infection rates were also reported for calendar years 2009, 2010, 2011, 2012, and 2013, as shown in the graph. The first case of endophthalmitis was a 31-year-old male with delayed presentation to Mass. Eye and Ear (> 24 hours) and with Zone I injury. He had surgical repair of a corneal laceration, but lensectomy was deferred at the time. On post-operative day 4, he had increased inflammation, which was presumed to be from lens capsular violation. He underwent phacoemulsification with intraocular lens, but on the third day after the cataract surgery, he presented with increased inflammation, pain, and decreased vision. Vitreous culture grew coagulase-negative staphylococci. Although his vision on presentation had been 20/30, his vision at 15 months was 20/500 after three retinal detachment repairs. The other case of endophthalmitis was a 34-year-old male with a Zone II injury from a metal shim. One day after repair of a 1mm scleral wound that was 4 mm posterior to the limbus, the patient had 20/25 vision but also had extensive anterior chamber and fibrin reaction, which was concerning for endophthalmitis. He was treated with intravitreal antibiotics; however, the vitreous culture was negative. His postoperative course was complicated by a macula-off retinal detachment. His final best corrected vision was 20/50 with an aphakic contact lens.
Prior to 2009, data were collected on all open-globe injuries treated from January 2000 to July 2007. During this 7.5-year period, 675 open-globe injuries were treated at Mass. Eye and Ear. Intravenous vancomycin and ceftazidime were started on admission and stopped after 48 hours. Patients were discharged on topical antibiotics, corticosteroids, and cycloplegics. Of these 675 eyes, 558 had at least 30 days of follow-up (mean, 11 months). The overall rate of endophthalmitis was 0.9% (5/558 cases).1 The standard Mass. Eye and Ear protocol for eye trauma (i.e. surgical repair by a dedicated trauma team and 48 hours of intravenous antibiotics) is associated with post-traumatic endophthalmitis rates far below international benchmarks. A review of the literature suggests that endophthalmitis rates around the world range from 2.6% to 17%. The United States National Eye Trauma Registry has reported an endophthalmitis rate of 6.9% after open-globe repair.1
Reference: 1Andreoli CM, Andreoli MT, Kloek CE, Ahuero AE, Vavvas D, Durand ML. Low rate of endophthalmitis in a large series
of open globe injuries. Am J Ophthalmol 2009; 147(4): 601-608.
13
The photo on the left illustrates
the right eye of a patient who
sustained a nail gun injury at a
construction site. The nail was
removed and the wound closed;
there was no retina or lens
damage. After repair, the patient
did well and recovered to
20/20 vision.
Eye Trauma Surgery
Photo courtesy of
Matthew Gardiner, M.D.
0%0% 0% 0% 0%
Endophthalmitis rates after
eye trauma surgery performed
at Mass. Eye and Ear are the
lowest rates reported in the
country. Based on the Mass.
Eye and Ear experience and
the low percentage of cases
with endophthalmitis, we
recommend that institutions
adopt a standardized protocol
for treating open-globe
injuries and consider the
use of prophylactic systemic
antibiotics.1
Eye Trauma Surgery: Rates of Endophthalmitis After Open-Globe Repair
25
20
15
10
5
0
Perc
enta
ge o
f en
doph
thal
mit
is
2.6% to 17%
2009 (N = 95)
2010 (N = 96)
2011 (N = 98)
2012 (N = 122)
2013 (N = 118)
2014 (N = 118)
International Benchmark
U.S. Rate 6.9%
1.7%
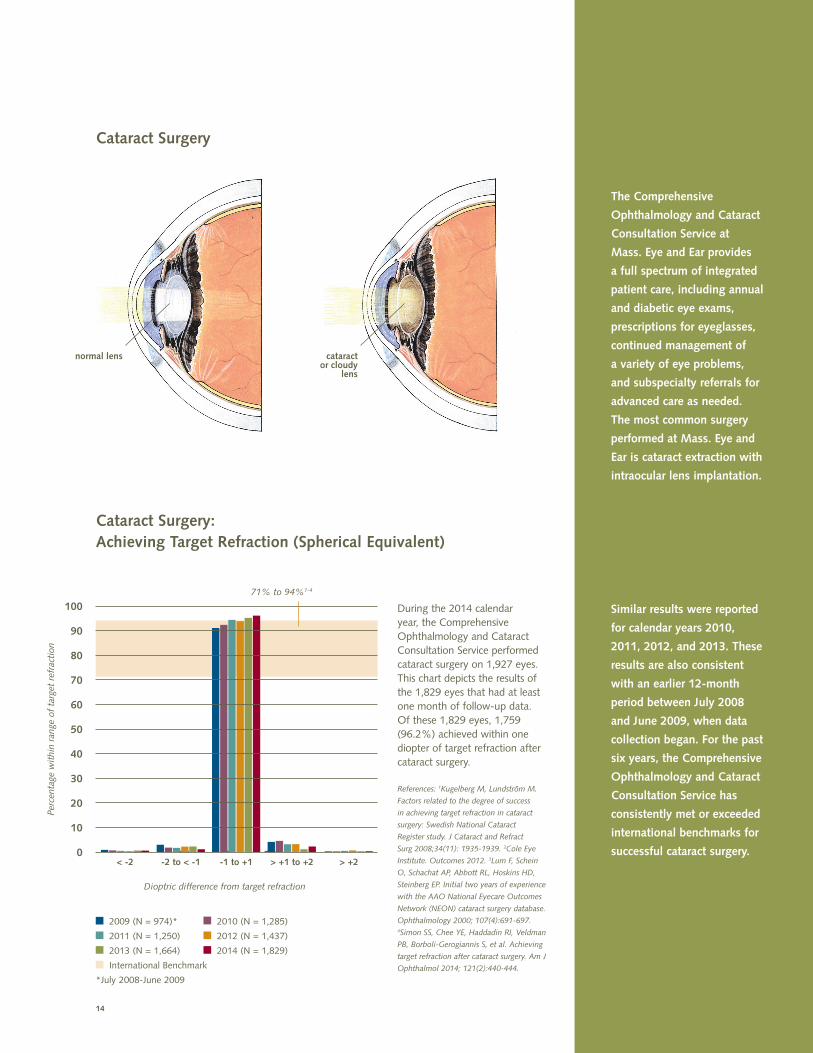
The Comprehensive
Ophthalmology and Cataract
Consultation Service at
Mass. Eye and Ear provides
a full spectrum of integrated
patient care, including annual
and diabetic eye exams,
prescriptions for eyeglasses,
continued management of
a variety of eye problems,
and subspecialty referrals for
advanced care as needed.
The most common surgery
performed at Mass. Eye and
Ear is cataract extraction with
intraocular lens implantation.
Similar results were reported
for calendar years 2010,
2011, 2012, and 2013. These
results are also consistent
with an earlier 12-month
period between July 2008
and June 2009, when data
collection began. For the past
six years, the Comprehensive
Ophthalmology and Cataract
Consultation Service has
consistently met or exceeded
international benchmarks for
successful cataract surgery.
14
Cataract Surgery: Achieving Target Refraction (Spherical Equivalent)
During the 2014 calendar year, the Comprehensive Ophthalmology and Cataract Consultation Service performed cataract surgery on 1,927 eyes. This chart depicts the results of the 1,829 eyes that had at least one month of follow-up data. Of these 1,829 eyes, 1,759 (96.2%) achieved within one diopter of target refraction after cataract surgery.
References: 1Kugelberg M, Lundström M.
Factors related to the degree of success
in achieving target refraction in cataract
surgery: Swedish National Cataract
Register study. J Cataract and Refract
Surg 2008;34(11): 1935-1939. 2Cole Eye
Institute. Outcomes 2012. 3Lum F, Schein
O, Schachat AP, Abbott RL, Hoskins HD,
Steinberg EP. Initial two years of experience
with the AAO National Eyecare Outcomes
Network (NEON) cataract surgery database.
Ophthalmology 2000; 107(4):691-697. 4Simon SS, Chee YE, Haddadin RI, Veldman
PB, Borboli-Gerogiannis S, et al. Achieving
target refraction after cataract surgery. Am J
Ophthalmol 2014; 121(2):440-444.
normal lens cataract or cloudy
lens
Cataract Surgery
100
90
80
70
60
50
40
30
20
10
0
Perc
enta
ge w
ithi
n ra
nge
of t
arge
t re
frac
tion
Dioptric difference from target refraction
71% to 94%1-4
2009 (N = 974)* 2010 (N = 1,285)
2011 (N = 1,250) 2012 (N = 1,437)
2013 (N = 1,664) 2014 (N = 1,829)
International Benchmark
*July 2008-June 2009
< -2 -2 to < -1 -1 to +1 > +1 to +2 > +2
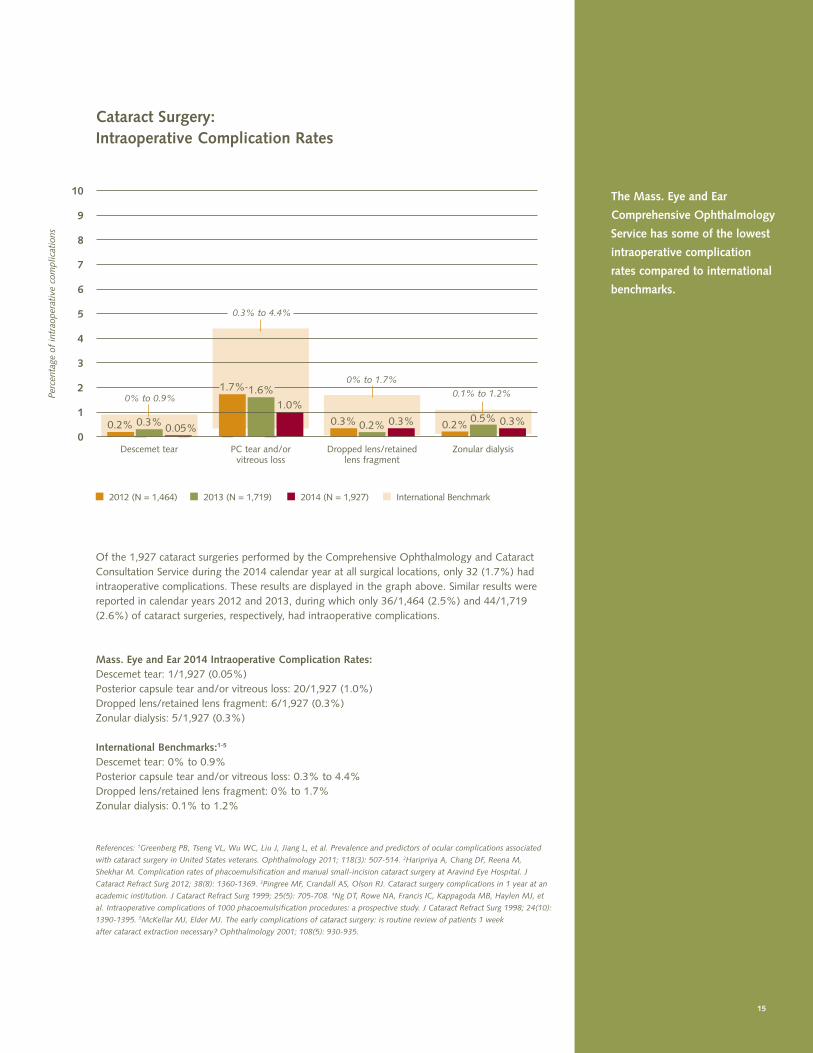
The Mass. Eye and Ear
Comprehensive Ophthalmology
Service has some of the lowest
intraoperative complication
rates compared to international
benchmarks.
15
Cataract Surgery: Intraoperative Complication Rates
Of the 1,927 cataract surgeries performed by the Comprehensive Ophthalmology and Cataract Consultation Service during the 2014 calendar year at all surgical locations, only 32 (1.7%) had intraoperative complications. These results are displayed in the graph above. Similar results were reported in calendar years 2012 and 2013, during which only 36/1,464 (2.5%) and 44/1,719 (2.6%) of cataract surgeries, respectively, had intraoperative complications.
Mass. Eye and Ear 2014 Intraoperative Complication Rates:Descemet tear: 1/1,927 (0.05%)Posterior capsule tear and/or vitreous loss: 20/1,927 (1.0%)Dropped lens/retained lens fragment: 6/1,927 (0.3%)Zonular dialysis: 5/1,927 (0.3%)
International Benchmarks:1-5
Descemet tear: 0% to 0.9%Posterior capsule tear and/or vitreous loss: 0.3% to 4.4% Dropped lens/retained lens fragment: 0% to 1.7%Zonular dialysis: 0.1% to 1.2%
References: 1Greenberg PB, Tseng VL, Wu WC, Liu J, Jiang L, et al. Prevalence and predictors of ocular complications associated
with cataract surgery in United States veterans. Ophthalmology 2011; 118(3): 507-514. 2Haripriya A, Chang DF, Reena M,
Shekhar M. Complication rates of phacoemulsification and manual small-incision cataract surgery at Aravind Eye Hospital. J
Cataract Refract Surg 2012; 38(8): 1360-1369. 3Pingree MF, Crandall AS, Olson RJ. Cataract surgery complications in 1 year at an
academic institution. J Cataract Refract Surg 1999; 25(5): 705-708. 4Ng DT, Rowe NA, Francis IC, Kappagoda MB, Haylen MJ, et
al. Intraoperative complications of 1000 phacoemulsification procedures: a prospective study. J Cataract Refract Surg 1998; 24(10):
1390-1395. 5McKellar MJ, Elder MJ. The early complications of cataract surgery: is routine review of patients 1 week
after cataract extraction necessary? Ophthalmology 2001; 108(5): 930-935.
10
9
8
7
6
5
4
3
2
1
0
Perc
enta
ge o
f in
trao
pera
tive
com
plic
atio
ns
2012 (N = 1,464) 2013 (N = 1,719) 2014 (N = 1,927) International Benchmark
Descemet tear PC tear and/or vitreous loss
Dropped lens/retained lens fragment
Zonular dialysis
0.2% 0.3% 0.05%
1.7% 1.6%1.0%
0.3% 0.3% 0.3%0.2% 0.2%0.5%
0% to 0.9%
0.3% to 4.4%
0% to 1.7%
0.1% to 1.2%
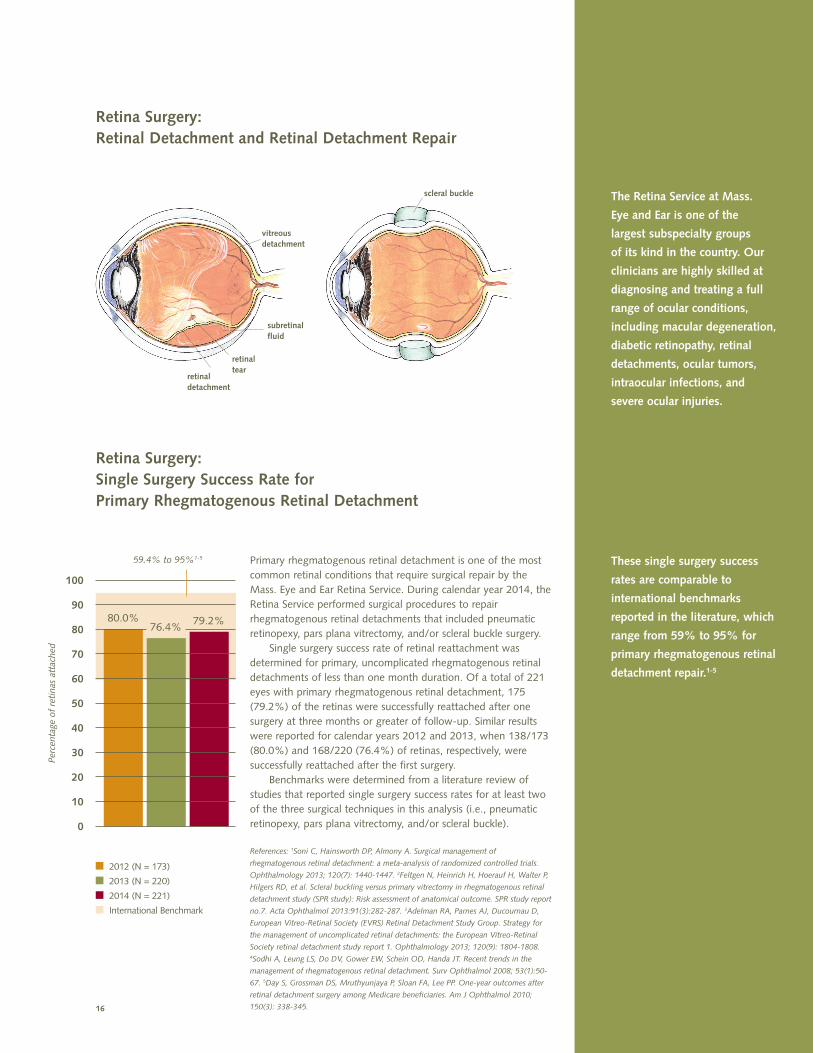
The Retina Service at Mass.
Eye and Ear is one of the
largest subspecialty groups
of its kind in the country. Our
clinicians are highly skilled at
diagnosing and treating a full
range of ocular conditions,
including macular degeneration,
diabetic retinopathy, retinal
detachments, ocular tumors,
intraocular infections, and
severe ocular injuries.
These single surgery success
rates are comparable to
international benchmarks
reported in the literature, which
range from 59% to 95% for
primary rhegmatogenous retinal
detachment repair.1-5
16
Retina Surgery: Retinal Detachment and Retinal Detachment Repair
vitreousdetachment
subretinalfluid
retinaltear
retinaldetachment
scleral buckle
Retina Surgery: Single Surgery Success Rate for Primary Rhegmatogenous Retinal Detachment
Primary rhegmatogenous retinal detachment is one of the most common retinal conditions that require surgical repair by the Mass. Eye and Ear Retina Service. During calendar year 2014, the Retina Service performed surgical procedures to repair rhegmatogenous retinal detachments that included pneumatic retinopexy, pars plana vitrectomy, and/or scleral buckle surgery. Single surgery success rate of retinal reattachment was determined for primary, uncomplicated rhegmatogenous retinal detachments of less than one month duration. Of a total of 221 eyes with primary rhegmatogenous retinal detachment, 175 (79.2%) of the retinas were successfully reattached after one surgery at three months or greater of follow-up. Similar results were reported for calendar years 2012 and 2013, when 138/173 (80.0%) and 168/220 (76.4%) of retinas, respectively, were successfully reattached after the first surgery. Benchmarks were determined from a literature review of studies that reported single surgery success rates for at least two of the three surgical techniques in this analysis (i.e., pneumatic retinopexy, pars plana vitrectomy, and/or scleral buckle).
References: 1Soni C, Hainsworth DP, Almony A. Surgical management of
rhegmatogenous retinal detachment: a meta-analysis of randomized controlled trials.
Ophthalmology 2013; 120(7): 1440-1447. 2Feltgen N, Heinrich H, Hoerauf H, Walter P,
Hilgers RD, et al. Scleral buckling versus primary vitrectomy in rhegmatogenous retinal
detachment study (SPR study): Risk assessment of anatomical outcome. SPR study report
no.7. Acta Ophthalmol 2013:91(3):282-287. 3Adelman RA, Parnes AJ, Ducournau D,
European Vitreo-Retinal Society (EVRS) Retinal Detachment Study Group. Strategy for
the management of uncomplicated retinal detachments: the European Vitreo-Retinal
Society retinal detachment study report 1. Ophthalmology 2013; 120(9): 1804-1808. 4Sodhi A, Leung LS, Do DV, Gower EW, Schein OD, Handa JT. Recent trends in the
management of rhegmatogenous retinal detachment. Surv Ophthalmol 2008; 53(1):50-
67. 5Day S, Grossman DS, Mruthyunjaya P, Sloan FA, Lee PP. One-year outcomes after
retinal detachment surgery among Medicare beneficiaries. Am J Ophthalmol 2010;
150(3): 338-345.
100
90
80
70
60
50
40
30
20
10
0
Perc
enta
ge o
f re
tina
s at
tach
ed
59.4% to 95%1-5
2012 (N = 173)
2013 (N = 220)
2014 (N = 221)
International Benchmark
80.0%76.4% 79.2%
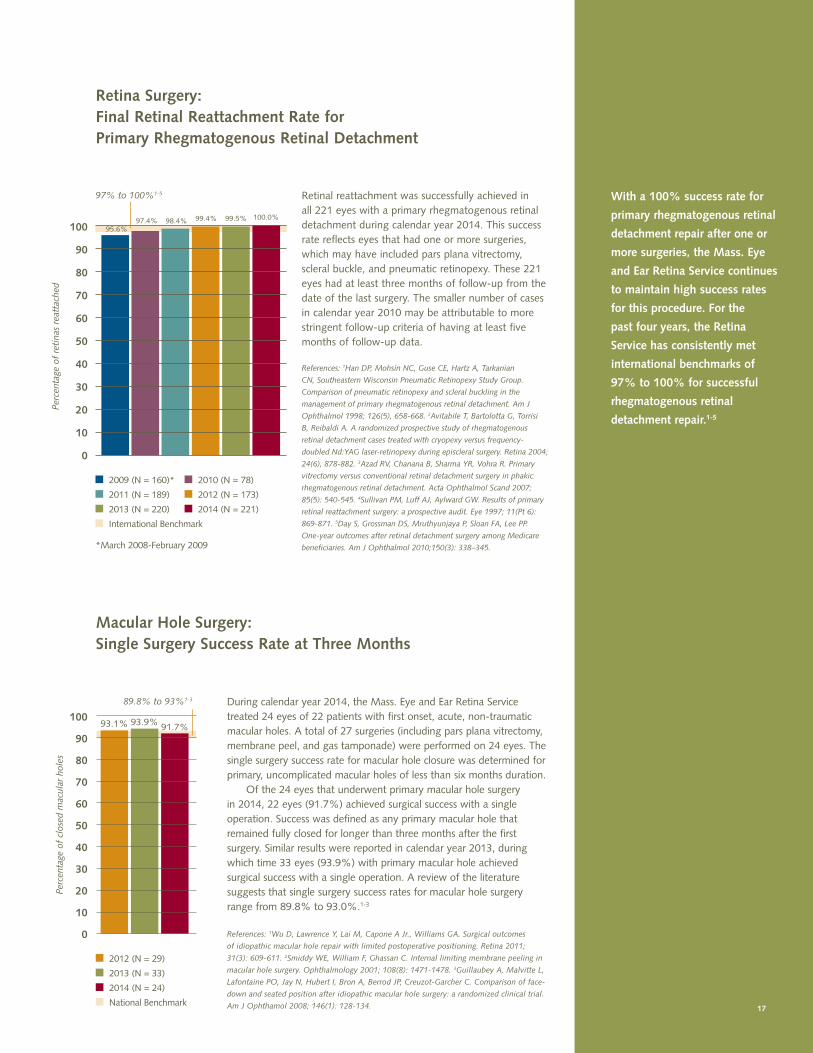
With a 100% success rate for
primary rhegmatogenous retinal
detachment repair after one or
more surgeries, the Mass. Eye
and Ear Retina Service continues
to maintain high success rates
for this procedure. For the
past four years, the Retina
Service has consistently met
international benchmarks of
97% to 100% for successful
rhegmatogenous retinal
detachment repair.1-5
17
Retina Surgery: Final Retinal Reattachment Rate for Primary Rhegmatogenous Retinal Detachment
Retinal reattachment was successfully achieved in all 221 eyes with a primary rhegmatogenous retinal detachment during calendar year 2014. This success rate reflects eyes that had one or more surgeries, which may have included pars plana vitrectomy, scleral buckle, and pneumatic retinopexy. These 221 eyes had at least three months of follow-up from the date of the last surgery. The smaller number of cases in calendar year 2010 may be attributable to more stringent follow-up criteria of having at least five months of follow-up data.
References: 1Han DP, Mohsin NC, Guse CE, Hartz A, Tarkanian
CN, Southeastern Wisconsin Pneumatic Retinopexy Study Group.
Comparison of pneumatic retinopexy and scleral buckling in the
management of primary rhegmatogenous retinal detachment. Am J
Ophthalmol 1998; 126(5), 658-668. 2Avitabile T, Bartolotta G, Torrisi
B, Reibaldi A. A randomized prospective study of rhegmatogenous
retinal detachment cases treated with cryopexy versus frequency-
doubled Nd:YAG laser-retinopexy during episcleral surgery. Retina 2004;
24(6), 878-882. 3Azad RV, Chanana B, Sharma YR, Vohra R. Primary
vitrectomy versus conventional retinal detachment surgery in phakic
rhegmatogenous retinal detachment. Acta Ophthalmol Scand 2007;
85(5): 540-545. 4Sullivan PM, Luff AJ, Aylward GW. Results of primary
retinal reattachment surgery: a prospective audit. Eye 1997; 11(Pt 6):
869-871. 5Day S, Grossman DS, Mruthyunjaya P, Sloan FA, Lee PP.
One-year outcomes after retinal detachment surgery among Medicare
beneficiaries. Am J Ophthalmol 2010;150(3): 338–345.
100
90
80
70
60
50
40
30
20
10
0
Perc
enta
ge o
f re
tina
s re
atta
ched
95.6%97.4% 98.4% 99.4% 99.5% 100.0%
97% to 100%1-5
2009 (N = 160)* 2010 (N = 78)
2011 (N = 189) 2012 (N = 173)
2013 (N = 220) 2014 (N = 221)
International Benchmark
*March 2008-February 2009
Macular Hole Surgery: Single Surgery Success Rate at Three Months
During calendar year 2014, the Mass. Eye and Ear Retina Service treated 24 eyes of 22 patients with first onset, acute, non-traumatic macular holes. A total of 27 surgeries (including pars plana vitrectomy, membrane peel, and gas tamponade) were performed on 24 eyes. The single surgery success rate for macular hole closure was determined for primary, uncomplicated macular holes of less than six months duration. Of the 24 eyes that underwent primary macular hole surgery in 2014, 22 eyes (91.7%) achieved surgical success with a single operation. Success was defined as any primary macular hole that remained fully closed for longer than three months after the first surgery. Similar results were reported in calendar year 2013, during which time 33 eyes (93.9%) with primary macular hole achieved surgical success with a single operation. A review of the literature suggests that single surgery success rates for macular hole surgery range from 89.8% to 93.0%.1-3
References: 1Wu D, Lawrence Y, Lai M, Capone A Jr., Williams GA. Surgical outcomes
of idiopathic macular hole repair with limited postoperative positioning. Retina 2011;
31(3): 609-611. 2Smiddy WE, William F, Ghassan C. Internal limiting membrane peeling in
macular hole surgery. Ophthalmology 2001; 108(8): 1471-1478. 3Guillaubey A, Malvitte L,
Lafontaine PO, Jay N, Hubert I, Bron A, Berrod JP, Creuzot-Garcher C. Comparison of face-
down and seated position after idiopathic macular hole surgery: a randomized clinical trial.
Am J Ophthamol 2008; 146(1): 128-134.
89.8% to 93%1-3
100
90
80
70
60
50
40
30
20
10
0
Perc
enta
ge o
f cl
osed
mac
ular
hol
es
93.1% 93.9% 91.7%
2012 (N = 29)
2013 (N = 33)
2014 (N = 24)
National Benchmark
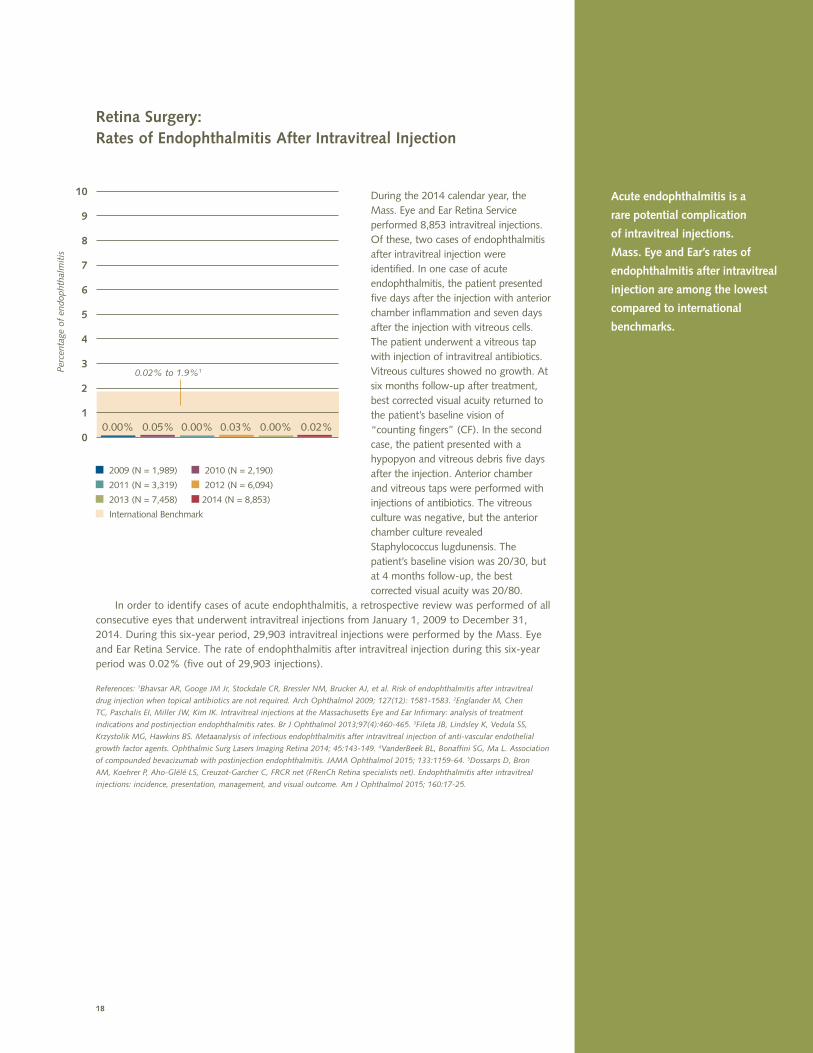
During the 2014 calendar year, the Mass. Eye and Ear Retina Service performed 8,853 intravitreal injections. Of these, two cases of endophthalmitis after intravitreal injection were identified. In one case of acute endophthalmitis, the patient presented five days after the injection with anterior chamber inflammation and seven days after the injection with vitreous cells. The patient underwent a vitreous tap with injection of intravitreal antibiotics. Vitreous cultures showed no growth. At six months follow-up after treatment, best corrected visual acuity returned to the patient’s baseline vision of “counting fingers” (CF). In the second case, the patient presented with a hypopyon and vitreous debris five days after the injection. Anterior chamber and vitreous taps were performed with injections of antibiotics. The vitreous culture was negative, but the anterior chamber culture revealed Staphylococcus lugdunensis. The patient’s baseline vision was 20/30, but at 4 months follow-up, the best corrected visual acuity was 20/80.
In order to identify cases of acute endophthalmitis, a retrospective review was performed of all consecutive eyes that underwent intravitreal injections from January 1, 2009 to December 31, 2014. During this six-year period, 29,903 intravitreal injections were performed by the Mass. Eye and Ear Retina Service. The rate of endophthalmitis after intravitreal injection during this six-year period was 0.02% (five out of 29,903 injections).
References: 1Bhavsar AR, Googe JM Jr, Stockdale CR, Bressler NM, Brucker AJ, et al. Risk of endophthalmitis after intravitreal
drug injection when topical antibiotics are not required. Arch Ophthalmol 2009; 127(12): 1581-1583. 2Englander M, Chen
TC, Paschalis EI, Miller JW, Kim IK. Intravitreal injections at the Massachusetts Eye and Ear Infirmary: analysis of treatment
indications and postinjection endophthalmitis rates. Br J Ophthalmol 2013;97(4):460-465. 3Fileta JB, Lindsley K, Vedula SS,
Krzystolik MG, Hawkins BS. Metaanalysis of infectious endophthalmitis after intravitreal injection of anti-vascular endothelial
growth factor agents. Ophthalmic Surg Lasers Imaging Retina 2014; 45:143-149. 4VanderBeek BL, Bonaffini SG, Ma L. Association
of compounded bevacizumab with postinjection endophthalmitis. JAMA Ophthalmol 2015; 133:1159-64. 5Dossarps D, Bron
AM, Koehrer P, Aho-Glélé LS, Creuzot-Garcher C, FRCR net (FRenCh Retina specialists net). Endophthalmitis after intravitreal
injections: incidence, presentation, management, and visual outcome. Am J Ophthalmol 2015; 160:17-25.
18
Acute endophthalmitis is a
rare potential complication
of intravitreal injections.
Mass. Eye and Ear’s rates of
endophthalmitis after intravitreal
injection are among the lowest
compared to international
benchmarks.
10
9
8
7
6
5
4
3
2
1
00.00% 0.05% 0.00% 0.03% 0.02%0.00%
Perc
enta
ge o
f en
doph
thal
mit
is
0.02% to 1.9%1
Retina Surgery: Rates of Endophthalmitis After Intravitreal Injection
2009 (N = 1,989) 2010 (N = 2,190)
2011 (N = 3,319) 2012 (N = 6,094)
2013 (N = 7,458) 2014 (N = 8,853)
International Benchmark
The Ocular Melanoma Center at
Mass. Eye and Ear, co-directed
by Evangelos Gragoudas, M.D.,
and Ivana Kim, M.D., is an
international referral center for
the diagnosis and treatment of
eye neoplasms.
Proton beam irradiation was
developed at Mass. Eye and
Ear in conjunction with a team
of radiotherapists from Mass.
General Hospital. In 1975, the
first proton beam irradiation
treatment was administered to a
Mass. Eye and Ear patient with
intraocular malignant melanoma.
19
Retina Surgery: Ocular Melanoma Center – Globe Perforation Rate from Surgery
Tumors located within the eye can be challenging to diagnose and treat effectively without causing damage to the eye, resulting in a loss of vision. Proton beam irradiation is one of the most effective therapies for treating intraocular tumors while minimizing visual loss from radiation complications.1 Before receiving radiation treatment for uveal melanoma, most patients have tantalum ring surgery to localize the tumor. Perforation of the globe is a potential complication during tumor localization surgery. During calendar year 2014, the Ocular Melanoma Center at Mass. Eye and Ear performed tantalum ring surgery in preparation for proton beam irradiation on 105 eyes. Zero cases of globe perforation from surgery were reported. There were also no cases of globe perforation reported in 2012 and 2013.
Reference: 1Gragoudas ES. Proton beam irradiation of uveal melanomas:
the first 30 years. The Weisenfeld Lecture. Invest Ophthalmol Vis Sci. 2006
Nov;47(11):4666-73.
10
9
8
7
6
5
4
3
2
1
00% 0% 0%
Perc
enta
ge o
f gl
obe
perf
orat
ions
2012 (N = 99)
2013 (N = 101)
2014 (N = 105)
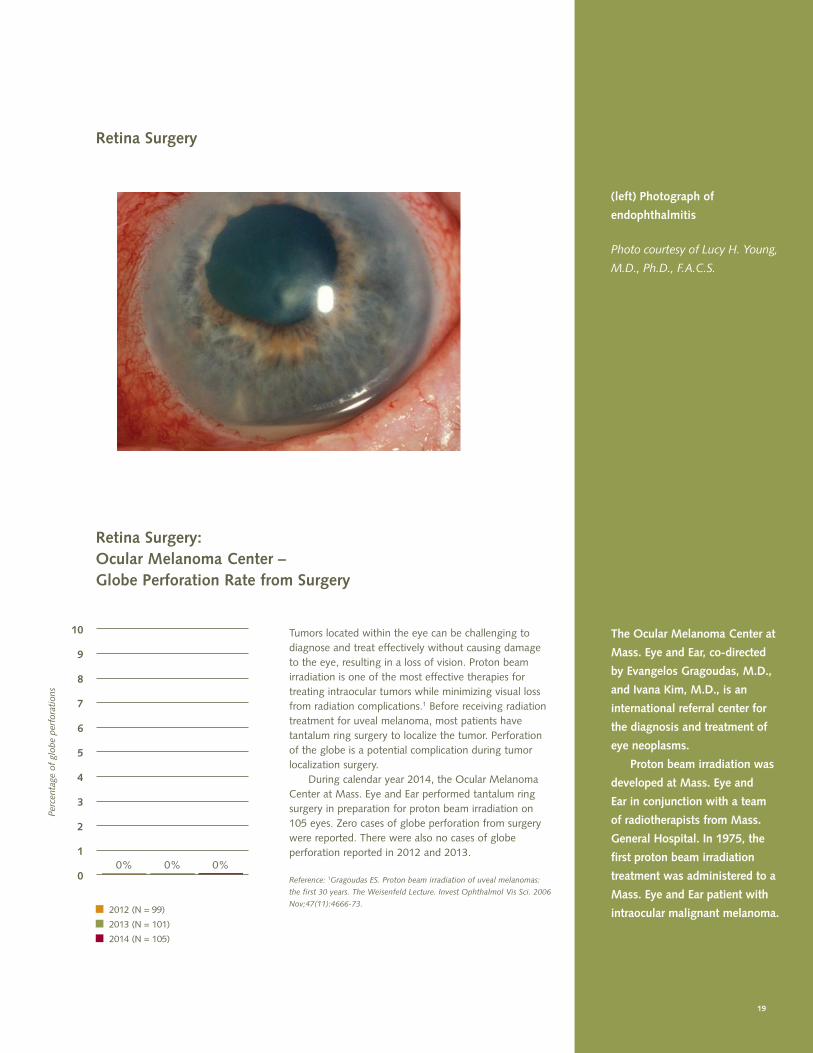
(left) Photograph of
endophthalmitis
Photo courtesy of Lucy H. Young,
M.D., Ph.D., F.A.C.S.
Retina Surgery
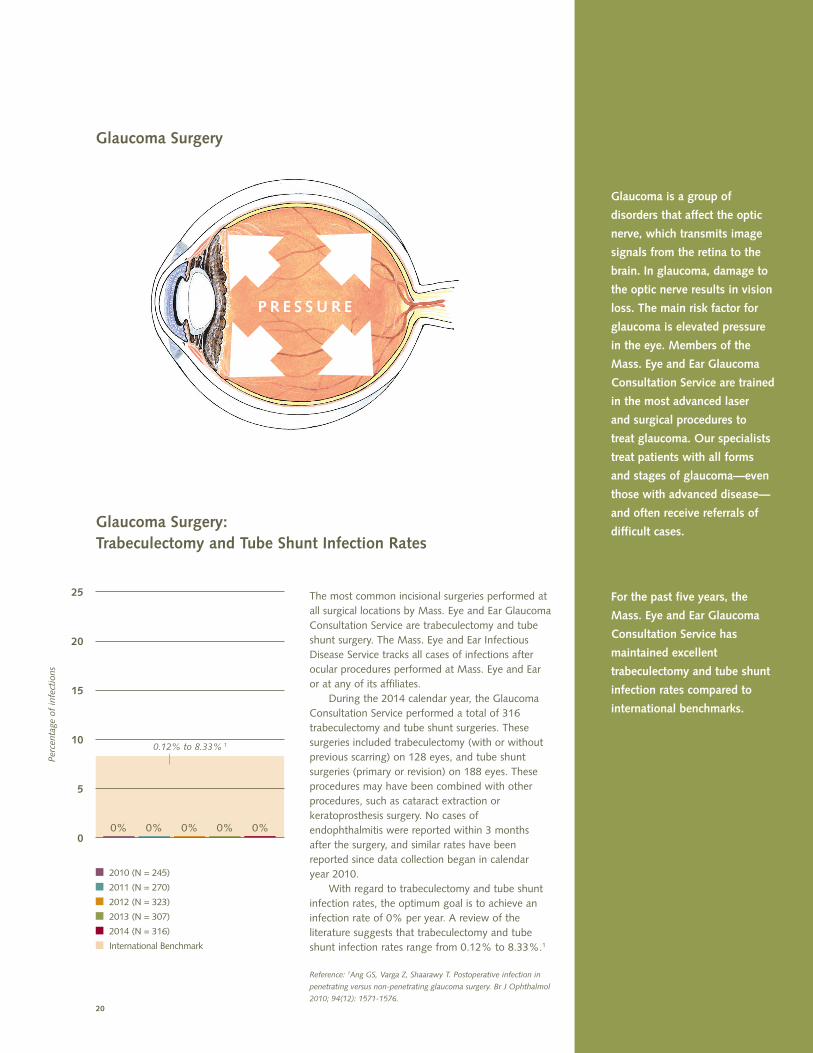
P R E S S U R E
Glaucoma Surgery: Trabeculectomy and Tube Shunt Infection Rates
The most common incisional surgeries performed at all surgical locations by Mass. Eye and Ear Glaucoma Consultation Service are trabeculectomy and tube shunt surgery. The Mass. Eye and Ear Infectious Disease Service tracks all cases of infections after ocular procedures performed at Mass. Eye and Ear or at any of its affiliates. During the 2014 calendar year, the Glaucoma Consultation Service performed a total of 316 trabeculectomy and tube shunt surgeries. These surgeries included trabeculectomy (with or without previous scarring) on 128 eyes, and tube shunt surgeries (primary or revision) on 188 eyes. These procedures may have been combined with other procedures, such as cataract extraction or keratoprosthesis surgery. No cases of endophthalmitis were reported within 3 months after the surgery, and similar rates have been reported since data collection began in calendar year 2010. With regard to trabeculectomy and tube shunt infection rates, the optimum goal is to achieve an infection rate of 0% per year. A review of the literature suggests that trabeculectomy and tube shunt infection rates range from 0.12% to 8.33%.1
Reference: 1Ang GS, Varga Z, Shaarawy T. Postoperative infection in
penetrating versus non-penetrating glaucoma surgery. Br J Ophthalmol
2010; 94(12): 1571-1576.
25
20
15
10
5
00% 0% 0% 0% 0%
Perc
enta
ge o
f in
fect
ions
0.12% to 8.33% 1
2010 (N = 245)
2011 (N = 270)
2012 (N = 323)
2013 (N = 307)
2014 (N = 316)
International Benchmark
Glaucoma is a group of
disorders that affect the optic
nerve, which transmits image
signals from the retina to the
brain. In glaucoma, damage to
the optic nerve results in vision
loss. The main risk factor for
glaucoma is elevated pressure
in the eye. Members of the
Mass. Eye and Ear Glaucoma
Consultation Service are trained
in the most advanced laser
and surgical procedures to
treat glaucoma. Our specialists
treat patients with all forms
and stages of glaucoma—even
those with advanced disease—
and often receive referrals of
difficult cases.
For the past five years, the
Mass. Eye and Ear Glaucoma
Consultation Service has
maintained excellent
trabeculectomy and tube shunt
infection rates compared to
international benchmarks.
20
Glaucoma Surgery
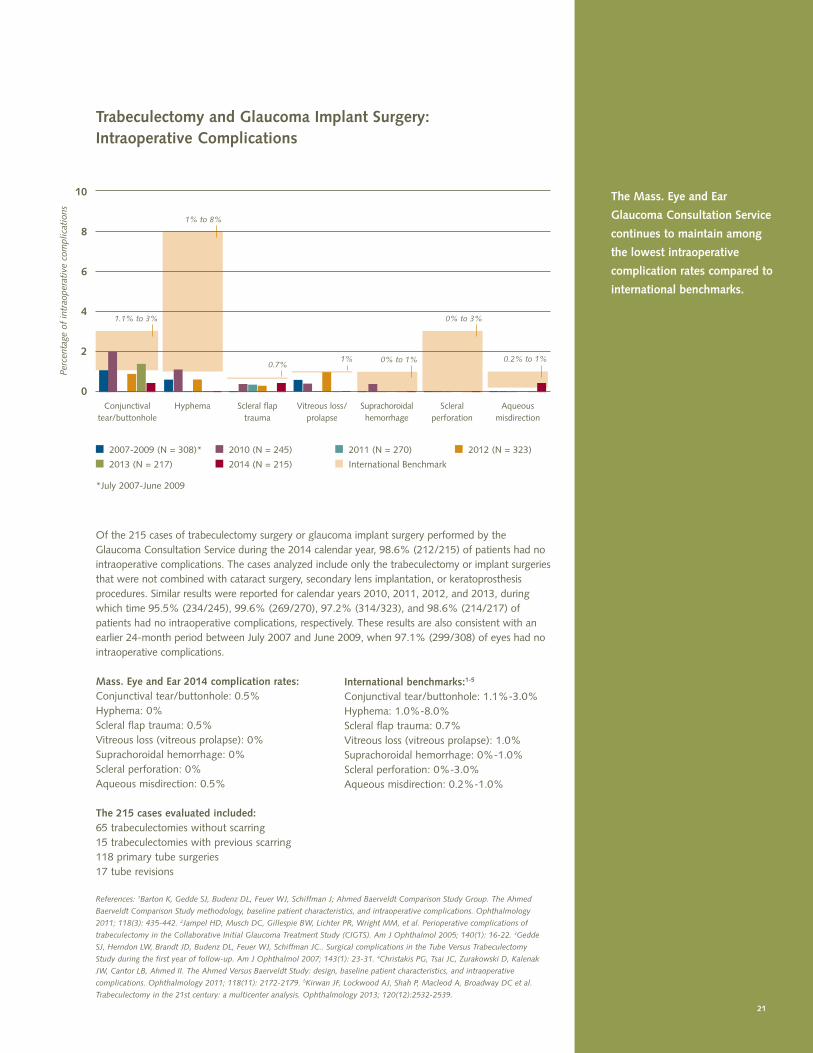
The Mass. Eye and Ear
Glaucoma Consultation Service
continues to maintain among
the lowest intraoperative
complication rates compared to
international benchmarks.
21
Trabeculectomy and Glaucoma Implant Surgery: Intraoperative Complications
10
8
6
4
2
0Conjunctival
tear/buttonholeHyphema Scleral flap
traumaVitreous loss/
prolapseSuprachoroidalhemorrhage
Scleral perforation
Aqueousmisdirection
Of the 215 cases of trabeculectomy surgery or glaucoma implant surgery performed by the Glaucoma Consultation Service during the 2014 calendar year, 98.6% (212/215) of patients had no intraoperative complications. The cases analyzed include only the trabeculectomy or implant surgeries that were not combined with cataract surgery, secondary lens implantation, or keratoprosthesis procedures. Similar results were reported for calendar years 2010, 2011, 2012, and 2013, during which time 95.5% (234/245), 99.6% (269/270), 97.2% (314/323), and 98.6% (214/217) of patients had no intraoperative complications, respectively. These results are also consistent with an earlier 24-month period between July 2007 and June 2009, when 97.1% (299/308) of eyes had no intraoperative complications. Mass. Eye and Ear 2014 complication rates:Conjunctival tear/buttonhole: 0.5%Hyphema: 0%Scleral flap trauma: 0.5%Vitreous loss (vitreous prolapse): 0%Suprachoroidal hemorrhage: 0%Scleral perforation: 0%Aqueous misdirection: 0.5%
The 215 cases evaluated included:65 trabeculectomies without scarring15 trabeculectomies with previous scarring118 primary tube surgeries17 tube revisions
References: 1Barton K, Gedde SJ, Budenz DL, Feuer WJ, Schiffman J; Ahmed Baerveldt Comparison Study Group. The Ahmed
Baerveldt Comparison Study methodology, baseline patient characteristics, and intraoperative complications. Ophthalmology
2011; 118(3): 435-442. 2Jampel HD, Musch DC, Gillespie BW, Lichter PR, Wright MM, et al. Perioperative complications of
trabeculectomy in the Collaborative Initial Glaucoma Treatment Study (CIGTS). Am J Ophthalmol 2005; 140(1): 16-22. 3Gedde
SJ, Herndon LW, Brandt JD, Budenz DL, Feuer WJ, Schiffman JC.. Surgical complications in the Tube Versus Trabeculectomy
Study during the first year of follow-up. Am J Ophthalmol 2007; 143(1): 23-31. 4Christakis PG, Tsai JC, Zurakowski D, Kalenak
JW, Cantor LB, Ahmed II. The Ahmed Versus Baerveldt Study: design, baseline patient characteristics, and intraoperative
complications. Ophthalmology 2011; 118(11): 2172-2179. 5Kirwan JF, Lockwood AJ, Shah P, Macleod A, Broadway DC et al.
Trabeculectomy in the 21st century: a multicenter analysis. Ophthalmology 2013; 120(12):2532-2539.
International benchmarks:1-5
Conjunctival tear/buttonhole: 1.1%-3.0%Hyphema: 1.0%-8.0%Scleral flap trauma: 0.7%Vitreous loss (vitreous prolapse): 1.0%Suprachoroidal hemorrhage: 0%-1.0%Scleral perforation: 0%-3.0%Aqueous misdirection: 0.2%-1.0%
Perc
enta
ge o
f in
trao
pera
tive
com
plic
atio
ns
2007-2009 (N = 308)* 2010 (N = 245) 2011 (N = 270) 2012 (N = 323)
2013 (N = 217) 2014 (N = 215) International Benchmark
*July 2007-June 2009
1.1% to 3%
1% to 8%
0.7%1% 0% to 1%
0% to 3%
0.2% to 1%
22
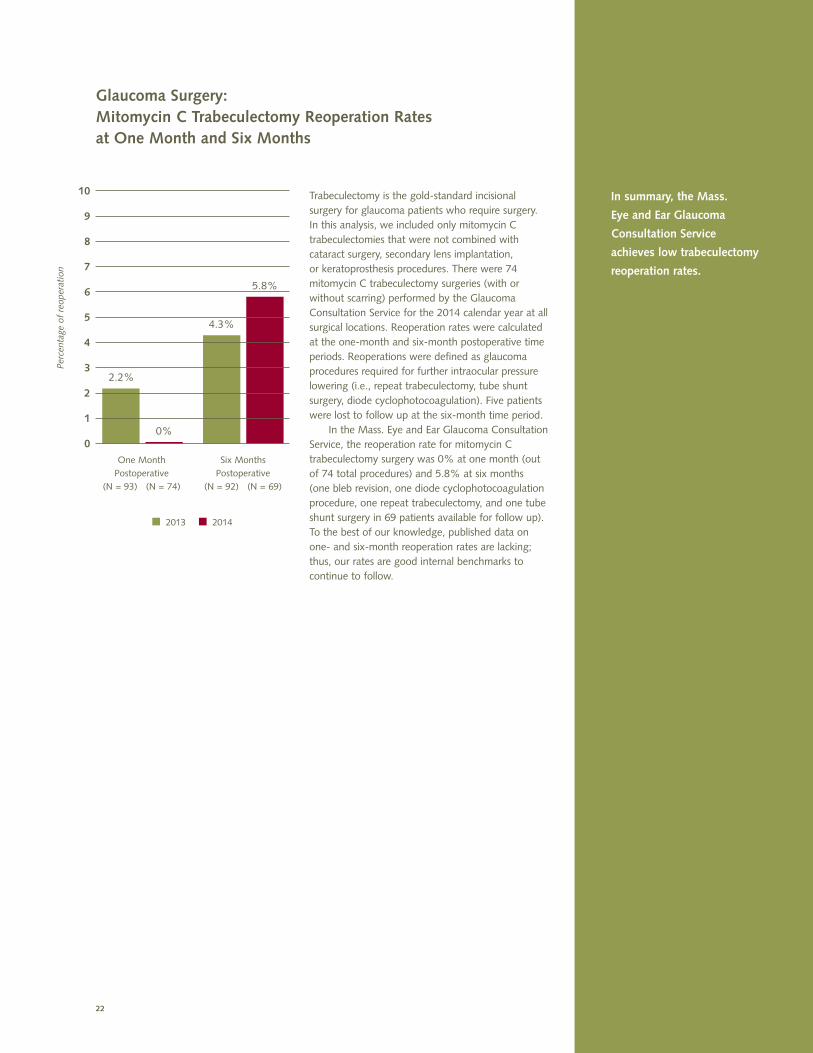
In summary, the Mass.
Eye and Ear Glaucoma
Consultation Service
achieves low trabeculectomy
reoperation rates.
Glaucoma Surgery: Mitomycin C Trabeculectomy Reoperation Rates at One Month and Six Months
10
9
8
7
6
5
4
3
2
1
0
Trabeculectomy is the gold-standard incisional surgery for glaucoma patients who require surgery. In this analysis, we included only mitomycin C trabeculectomies that were not combined with cataract surgery, secondary lens implantation, or keratoprosthesis procedures. There were 74 mitomycin C trabeculectomy surgeries (with or without scarring) performed by the Glaucoma Consultation Service for the 2014 calendar year at all surgical locations. Reoperation rates were calculated at the one-month and six-month postoperative time periods. Reoperations were defined as glaucoma procedures required for further intraocular pressure lowering (i.e., repeat trabeculectomy, tube shunt surgery, diode cyclophotocoagulation). Five patients were lost to follow up at the six-month time period. In the Mass. Eye and Ear Glaucoma Consultation Service, the reoperation rate for mitomycin C trabeculectomy surgery was 0% at one month (out of 74 total procedures) and 5.8% at six months (one bleb revision, one diode cyclophotocoagulation procedure, one repeat trabeculectomy, and one tube shunt surgery in 69 patients available for follow up). To the best of our knowledge, published data on one- and six-month reoperation rates are lacking; thus, our rates are good internal benchmarks to continue to follow.
Perc
enta
ge o
f re
oper
atio
n
4.3%
5.8%
One Month Postoperative
(N = 93) (N = 74)
Six Months Postoperative
(N = 92) (N = 69)
2.2%
0%
2013 2014
23
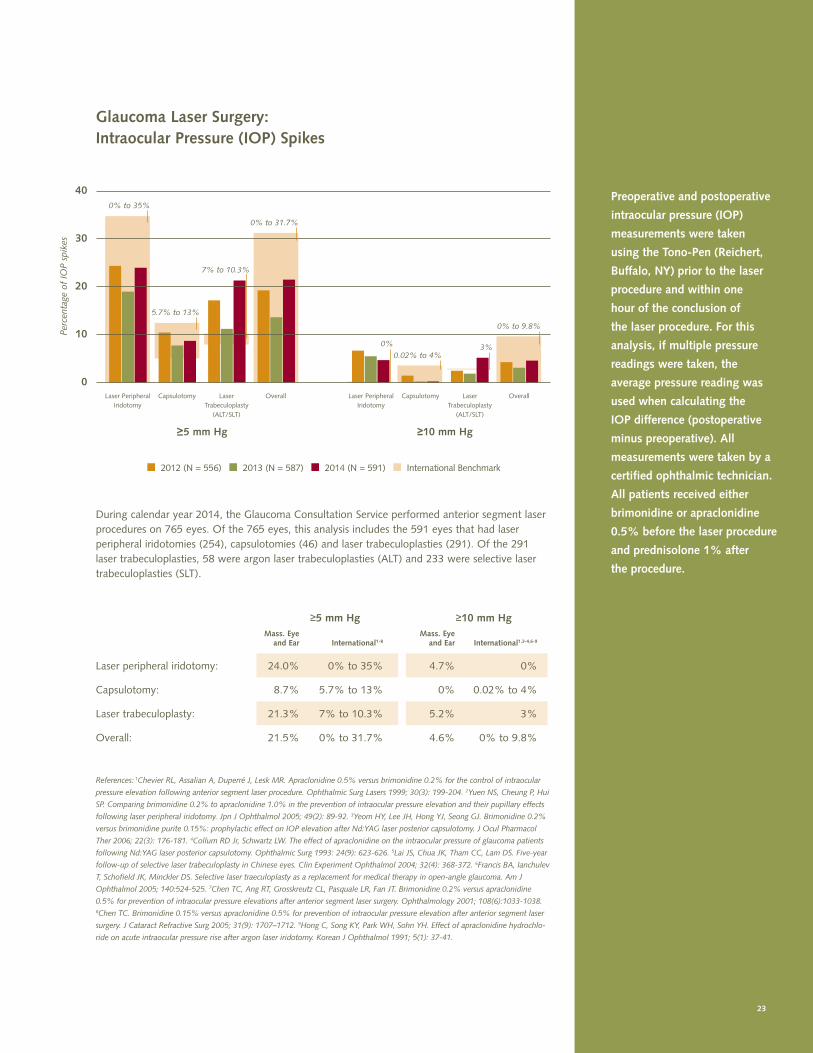
Preoperative and postoperative
intraocular pressure (IOP)
measurements were taken
using the Tono-Pen (Reichert,
Buffalo, NY) prior to the laser
procedure and within one
hour of the conclusion of
the laser procedure. For this
analysis, if multiple pressure
readings were taken, the
average pressure reading was
used when calculating the
IOP difference (postoperative
minus preoperative). All
measurements were taken by a
certified ophthalmic technician.
All patients received either
brimonidine or apraclonidine
0.5% before the laser procedure
and prednisolone 1% after
the procedure.
Glaucoma Laser Surgery: Intraocular Pressure (IOP) Spikes
During calendar year 2014, the Glaucoma Consultation Service performed anterior segment laser procedures on 765 eyes. Of the 765 eyes, this analysis includes the 591 eyes that had laser peripheral iridotomies (254), capsulotomies (46) and laser trabeculoplasties (291). Of the 291 laser trabeculoplasties, 58 were argon laser trabeculoplasties (ALT) and 233 were selective laser trabeculoplasties (SLT).
≥5 mm Hg ≥10 mm Hg Mass. Eye Mass. Eye and Ear International1-8 and Ear International1,3-4,6-9
Laser peripheral iridotomy: 24.0% 0% to 35% 4.7% 0%
Capsulotomy: 8.7% 5.7% to 13% 0% 0.02% to 4%
Laser trabeculoplasty: 21.3% 7% to 10.3% 5.2% 3%
Overall: 21.5% 0% to 31.7% 4.6% 0% to 9.8%
References: 1Chevier RL, Assalian A, Duperré J, Lesk MR. Apraclonidine 0.5% versus brimonidine 0.2% for the control of intraocular
pressure elevation following anterior segment laser procedure. Ophthalmic Surg Lasers 1999; 30(3): 199-204. 2Yuen NS, Cheung P, Hui
SP. Comparing brimonidine 0.2% to apraclonidine 1.0% in the prevention of intraocular pressure elevation and their pupillary effects
following laser peripheral iridotomy. Jpn J Ophthalmol 2005; 49(2): 89-92. 3Yeom HY, Lee JH, Hong YJ, Seong GJ. Brimonidine 0.2%
versus brimonidine purite 0.15%: prophylactic effect on IOP elevation after Nd:YAG laser posterior capsulotomy. J Ocul Pharmacol
Ther 2006; 22(3): 176-181. 4Collum RD Jr, Schwartz LW. The effect of apraclonidine on the intraocular pressure of glaucoma patients
following Nd:YAG laser posterior capsulotomy. Ophthalmic Surg 1993: 24(9): 623-626. 5Lai JS, Chua JK, Tham CC, Lam DS. Five-year
follow-up of selective laser trabeculoplasty in Chinese eyes. Clin Experiment Ophthalmol 2004; 32(4): 368-372. 6Francis BA, Ianchulev
T, Schofield JK, Minckler DS. Selective laser traeculoplasty as a replacement for medical therapy in open-angle glaucoma. Am J
Ophthalmol 2005; 140:524-525. 7Chen TC, Ang RT, Grosskreutz CL, Pasquale LR, Fan JT. Brimonidine 0.2% versus apraclonidine
0.5% for prevention of intraocular pressure elevations after anterior segment laser surgery. Ophthalmology 2001; 108(6):1033-1038. 8Chen TC. Brimonidine 0.15% versus apraclonidine 0.5% for prevention of intraocular pressure elevation after anterior segment laser
surgery. J Cataract Refractive Surg 2005; 31(9): 1707–1712. 9Hong C, Song KY, Park WH, Sohn YH. Effect of apraclonidine hydrochlo-
ride on acute intraocular pressure rise after argon laser iridotomy. Korean J Ophthalmol 1991; 5(1): 37-41.
40
30
20
10
0
≥5 mm Hg ≥10 mm Hg
Perc
enta
ge o
f IO
P sp
ikes
Laser Peripheral Iridotomy
Laser Peripheral Iridotomy
Capsulotomy CapsulotomyLaserTrabeculoplasty
(ALT/SLT)
LaserTrabeculoplasty
(ALT/SLT)
Overall Overall
0% to 35%
5.7% to 13%
7% to 10.3%
0% 3%
0% to 31.7%
0% to 9.8%
0.02% to 4%
2012 (N = 556) 2013 (N = 587) 2014 (N = 591) International Benchmark
1.
3.
2.
4.
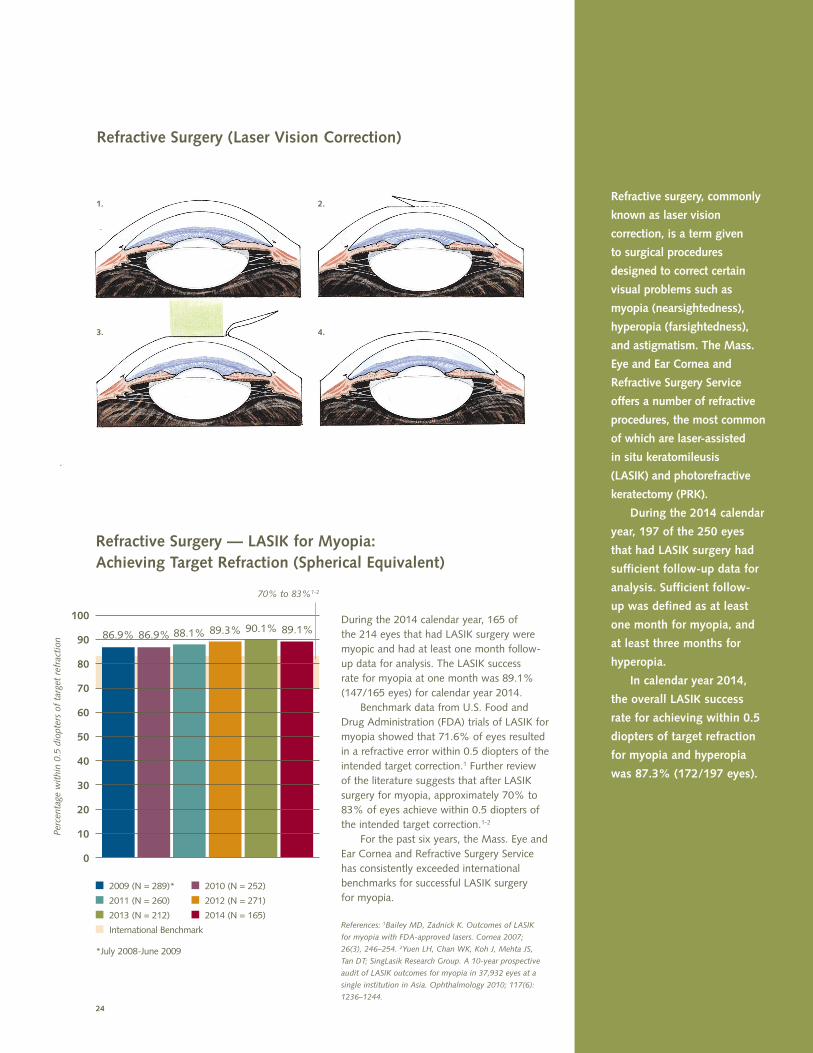
Refractive surgery, commonly
known as laser vision
correction, is a term given
to surgical procedures
designed to correct certain
visual problems such as
myopia (nearsightedness),
hyperopia (farsightedness),
and astigmatism. The Mass.
Eye and Ear Cornea and
Refractive Surgery Service
offers a number of refractive
procedures, the most common
of which are laser-assisted
in situ keratomileusis
(LASIK) and photorefractive
keratectomy (PRK).
During the 2014 calendar
year, 197 of the 250 eyes
that had LASIK surgery had
sufficient follow-up data for
analysis. Sufficient follow-
up was defined as at least
one month for myopia, and
at least three months for
hyperopia.
In calendar year 2014,
the overall LASIK success
rate for achieving within 0.5
diopters of target refraction
for myopia and hyperopia
was 87.3% (172/197 eyes).
24
Refractive Surgery (Laser Vision Correction)
Refractive Surgery — LASIK for Myopia: Achieving Target Refraction (Spherical Equivalent)
100
90
80
70
60
50
40
30
20
10
0
Perc
enta
ge w
ithi
n 0.
5 di
opte
rs o
f ta
rget
ref
ract
ion
During the 2014 calendar year, 165 of the 214 eyes that had LASIK surgery were myopic and had at least one month follow-up data for analysis. The LASIK success rate for myopia at one month was 89.1% (147/165 eyes) for calendar year 2014. Benchmark data from U.S. Food and Drug Administration (FDA) trials of LASIK for myopia showed that 71.6% of eyes resulted in a refractive error within 0.5 diopters of the intended target correction.1 Further review of the literature suggests that after LASIK surgery for myopia, approximately 70% to 83% of eyes achieve within 0.5 diopters of the intended target correction.1-2 For the past six years, the Mass. Eye and Ear Cornea and Refractive Surgery Service has consistently exceeded international benchmarks for successful LASIK surgery for myopia.
References: 1Bailey MD, Zadnick K. Outcomes of LASIK
for myopia with FDA-approved lasers. Cornea 2007;
26(3), 246–254. 2Yuen LH, Chan WK, Koh J, Mehta JS,
Tan DT; SingLasik Research Group. A 10-year prospective
audit of LASIK outcomes for myopia in 37,932 eyes at a
single institution in Asia. Ophthalmology 2010; 117(6):
1236–1244.
86.9% 86.9% 88.1% 89.3% 90.1% 89.1%
70% to 83%1-2
2009 (N = 289)* 2010 (N = 252)
2011 (N = 260) 2012 (N = 271)
2013 (N = 212) 2014 (N = 165)
International Benchmark
*July 2008-June 2009
The Mass. Eye and Ear Cornea
and Refractive Surgery Service
continues to maintain a high
overall success rate for LASIK
surgery for myopia.
25
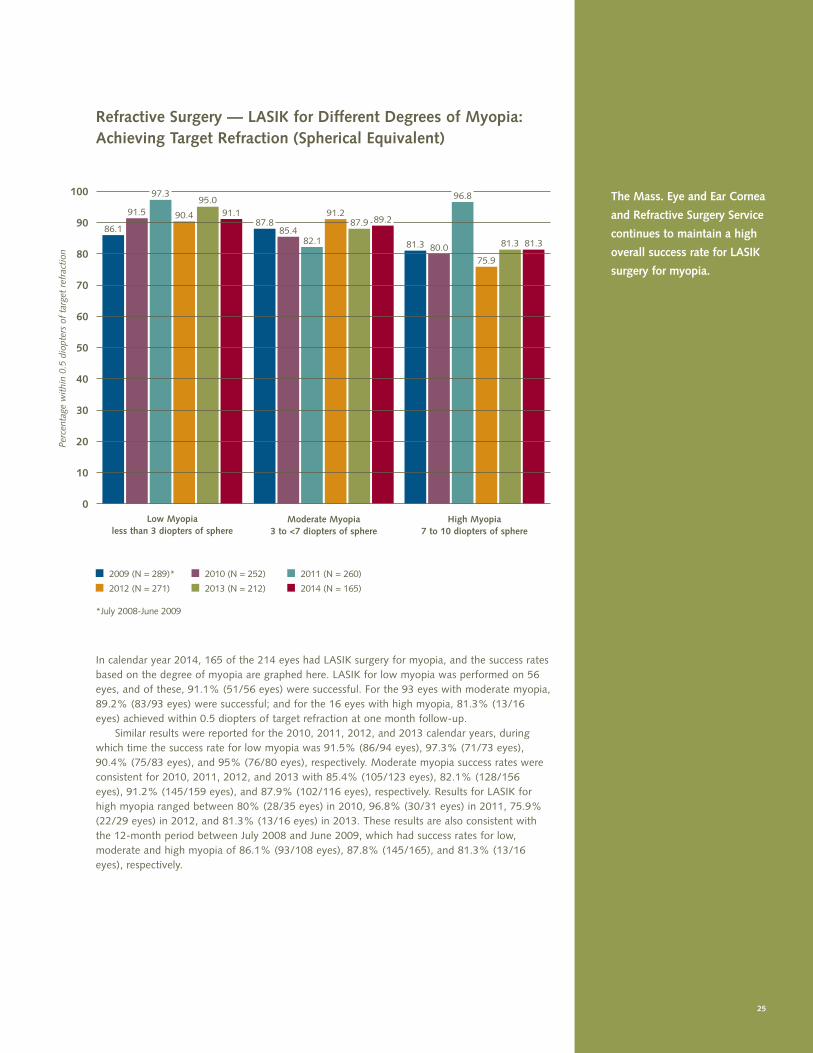
Refractive Surgery — LASIK for Different Degrees of Myopia: Achieving Target Refraction (Spherical Equivalent)
In calendar year 2014, 165 of the 214 eyes had LASIK surgery for myopia, and the success rates based on the degree of myopia are graphed here. LASIK for low myopia was performed on 56 eyes, and of these, 91.1% (51/56 eyes) were successful. For the 93 eyes with moderate myopia, 89.2% (83/93 eyes) were successful; and for the 16 eyes with high myopia, 81.3% (13/16 eyes) achieved within 0.5 diopters of target refraction at one month follow-up. Similar results were reported for the 2010, 2011, 2012, and 2013 calendar years, during which time the success rate for low myopia was 91.5% (86/94 eyes), 97.3% (71/73 eyes), 90.4% (75/83 eyes), and 95% (76/80 eyes), respectively. Moderate myopia success rates were consistent for 2010, 2011, 2012, and 2013 with 85.4% (105/123 eyes), 82.1% (128/156 eyes), 91.2% (145/159 eyes), and 87.9% (102/116 eyes), respectively. Results for LASIK for high myopia ranged between 80% (28/35 eyes) in 2010, 96.8% (30/31 eyes) in 2011, 75.9% (22/29 eyes) in 2012, and 81.3% (13/16 eyes) in 2013. These results are also consistent with the 12-month period between July 2008 and June 2009, which had success rates for low, moderate and high myopia of 86.1% (93/108 eyes), 87.8% (145/165), and 81.3% (13/16 eyes), respectively.
100
90
80
70
60
50
40
30
20
10
0Low Myopia
less than 3 diopters of sphereModerate Myopia
3 to <7 diopters of sphereHigh Myopia
7 to 10 diopters of sphere
Perc
enta
ge w
ithi
n 0.
5 di
opte
rs o
f ta
rget
ref
ract
ion
2009 (N = 289)* 2010 (N = 252) 2011 (N = 260)
2012 (N = 271) 2013 (N = 212) 2014 (N = 165)
*July 2008-June 2009
86.1
91.5
97.3
90.4
95.091.1
87.885.4
82.1
91.287.9 89.2
81.3 80.0
96.8
75.9
81.3 81.3
26
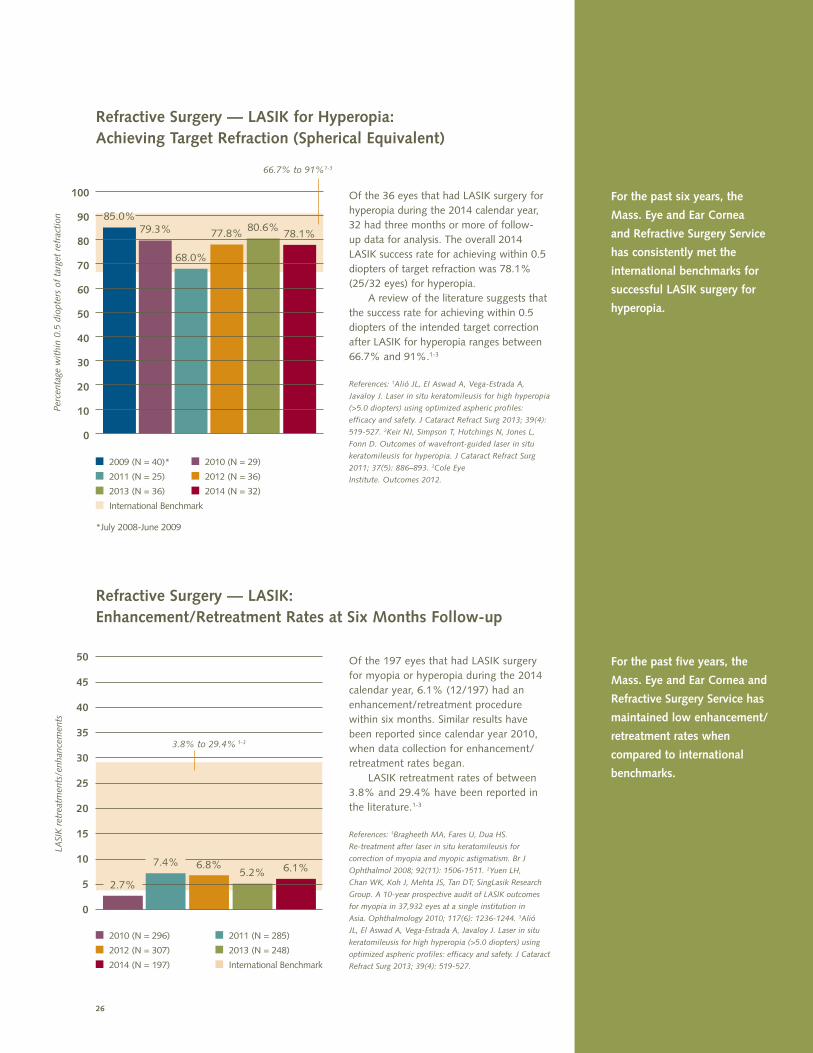
Refractive Surgery — LASIK for Hyperopia: Achieving Target Refraction (Spherical Equivalent)
79.3%85.0%
77.8%
68.0%
100
90
80
70
60
50
40
30
20
10
0
Perc
enta
ge w
ithi
n 0.
5 di
opte
rs o
f ta
rget
ref
ract
ion
Of the 36 eyes that had LASIK surgery for hyperopia during the 2014 calendar year, 32 had three months or more of follow-up data for analysis. The overall 2014 LASIK success rate for achieving within 0.5 diopters of target refraction was 78.1% (25/32 eyes) for hyperopia. A review of the literature suggests that the success rate for achieving within 0.5 diopters of the intended target correction after LASIK for hyperopia ranges between 66.7% and 91%.1-3
References: 1Alió JL, El Aswad A, Vega-Estrada A,
Javaloy J. Laser in situ keratomileusis for high hyperopia
(>5.0 diopters) using optimized aspheric profiles:
efficacy and safety. J Cataract Refract Surg 2013; 39(4):
519-527. 2Keir NJ, Simpson T, Hutchings N, Jones L,
Fonn D. Outcomes of wavefront-guided laser in situ
keratomileusis for hyperopia. J Cataract Refract Surg
2011; 37(5): 886–893. 3Cole Eye
Institute. Outcomes 2012.
80.6%78.1%
66.7% to 91%1-3
2009 (N = 40)* 2010 (N = 29)
2011 (N = 25) 2012 (N = 36)
2013 (N = 36) 2014 (N = 32)
International Benchmark
*July 2008-June 2009
For the past five years, the
Mass. Eye and Ear Cornea and
Refractive Surgery Service has
maintained low enhancement/
retreatment rates when
compared to international
benchmarks.
For the past six years, the
Mass. Eye and Ear Cornea
and Refractive Surgery Service
has consistently met the
international benchmarks for
successful LASIK surgery for
hyperopia.
Refractive Surgery — LASIK: Enhancement/Retreatment Rates at Six Months Follow-up
50
45
40
35
30
25
20
15
10
5
0
Of the 197 eyes that had LASIK surgery for myopia or hyperopia during the 2014 calendar year, 6.1% (12/197) had an enhancement/retreatment procedure within six months. Similar results have been reported since calendar year 2010, when data collection for enhancement/retreatment rates began. LASIK retreatment rates of between 3.8% and 29.4% have been reported in the literature.1-3
References: 1Bragheeth MA, Fares U, Dua HS.
Re-treatment after laser in situ keratomileusis for
correction of myopia and myopic astigmatism. Br J
Ophthalmol 2008; 92(11): 1506-1511. 2Yuen LH,
Chan WK, Koh J, Mehta JS, Tan DT; SingLasik Research
Group. A 10-year prospective audit of LASIK outcomes
for myopia in 37,932 eyes at a single institution in
Asia. Ophthalmology 2010; 117(6): 1236-1244. 3Alió
JL, El Aswad A, Vega-Estrada A, Javaloy J. Laser in situ
keratomileusis for high hyperopia (>5.0 diopters) using
optimized aspheric profiles: efficacy and safety. J Cataract
Refract Surg 2013; 39(4): 519-527.
3.8% to 29.4% 1-3
LASI
K r
etre
atm
ents
/enh
ance
men
ts
7.4% 6.8%5.2% 6.1%
2010 (N = 296) 2011 (N = 285)
2012 (N = 307) 2013 (N = 248)
2014 (N = 197) International Benchmark
2.7%
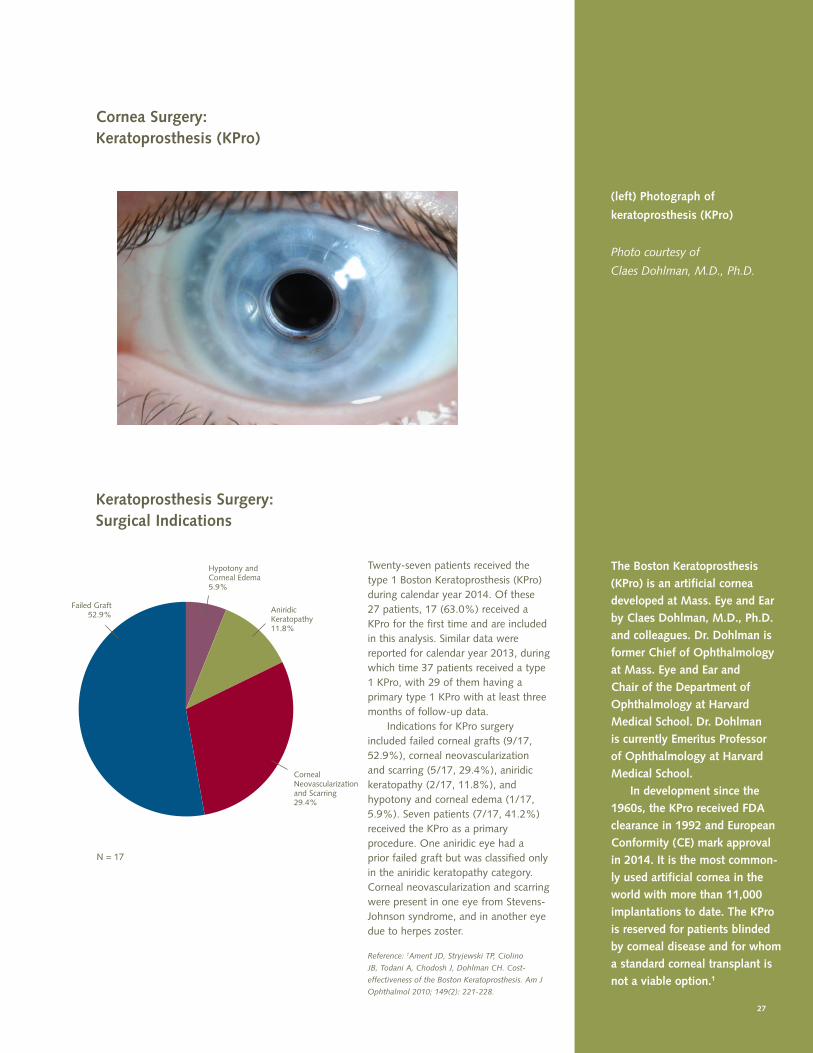
(left) Photograph of
keratoprosthesis (KPro)
Photo courtesy of
Claes Dohlman, M.D., Ph.D.
27
Cornea Surgery:Keratoprosthesis (KPro)
The Boston Keratoprosthesis (KPro) is an artificial cornea developed at Mass. Eye and Ear by Claes Dohlman, M.D., Ph.D. and colleagues. Dr. Dohlman is former Chief of Ophthalmology at Mass. Eye and Ear and Chair of the Department of Ophthalmology at Harvard Medical School. Dr. Dohlman is currently Emeritus Professor of Ophthalmology at Harvard Medical School. In development since the 1960s, the KPro received FDA clearance in 1992 and European Conformity (CE) mark approval in 2014. It is the most common-ly used artificial cornea in the world with more than 11,000 implantations to date. The KPro is reserved for patients blinded by corneal disease and for whom a standard corneal transplant is not a viable option.1
N = 17
Keratoprosthesis Surgery: Surgical Indications
Twenty-seven patients received the type 1 Boston Keratoprosthesis (KPro) during calendar year 2014. Of these 27 patients, 17 (63.0%) received a KPro for the first time and are included in this analysis. Similar data were reported for calendar year 2013, during which time 37 patients received a type 1 KPro, with 29 of them having a primary type 1 KPro with at least three months of follow-up data. Indications for KPro surgery included failed corneal grafts (9/17, 52.9%), corneal neovascularization and scarring (5/17, 29.4%), aniridic keratopathy (2/17, 11.8%), and hypotony and corneal edema (1/17, 5.9%). Seven patients (7/17, 41.2%) received the KPro as a primary procedure. One aniridic eye had a prior failed graft but was classified only in the aniridic keratopathy category. Corneal neovascularization and scarring were present in one eye from Stevens-Johnson syndrome, and in another eye due to herpes zoster.
Reference: 1Ament JD, Stryjewski TP, Ciolino
JB, Todani A, Chodosh J, Dohlman CH. Cost-
effectiveness of the Boston Keratoprosthesis. Am J
Ophthalmol 2010; 149(2): 221-228.
Failed Graft 52.9%
AniridicKeratopathy11.8%
Hypotony andCorneal Edema5.9%
Corneal Neovascularization and Scarring29.4%
100
90
80
70
60
50
40
30
20
10
0
Perc
enta
ge
28
Keratoprosthesis Surgery: Visual Outcomes
Keratoprosthesis Surgery: Retention Rates
100
90
80
70
60
50
40
30
20
10
0
Perc
enta
ge
Of the 17 primary type 1 Boston Keratoprosthesis (KPro) surgeries in calendar year 2014 for which three months of follow-up data were available, 100% of patients retained the KPro at three months. Similar results (100% KPro retention at three months) were reported for calendar years 2011, 2012, and 2013. Per the literature, expected retention rates range from 90.5% to 95% of patients.1-2
References: 1Kang JJ, de la Cruz J, Cortina MS. Visual outcomes of
Boston keratoprosthesis implantation as the primary penetrating
corneal procedure. Cornea 2012; 31(12):1436-40. 2Zerbe BL,
Berlin MW, Ciolino JB, Boston Type 1 Keratoprosthesis Study
Group. Results from the multicenter Boston type I keratoprosthesis
study. Ophthalmology 2006; 113(1): 1779.e1-1779.e7.
100% 100% 100% 100%
90.5% to 95%1-2
2011 (N = 27) 2012 (N = 25)
2013 (N = 29) 2014 (N = 17)
National Benchmark
2011 (N = 27) 2012 (N = 25)
2013 (N = 29) 2014 (N = 17)
National Benchmark
During calendar year 2014, 17 patients underwent primary type 1 Boston Keratoprosthesis (KPro) surgery for the first time and had at least three months of follow-up data available for analysis. Of these 17 patients, 13 (76.5%) achieved 20/200 vision or better at any point within the three-month postoperative period or beyond. This is comparable to national benchmarks of 56% to 89% reported in the literature.1-3
Four patients did not achieve postoperative vision of 20/200 or better, and in each case the visual prognosis was limited due to pre-existing severe retinal disease or advanced glaucoma.
References: 1Kang JJ, de la Cruz J, Cortina MS. Visual outcomes of
Boston keratoprosthesis implantation as the primary penetrating
corneal procedure. Cornea 2012; 31(12):1436-40. 2Zerbe BL,
Berlin MW, Ciolino JB. Results from the multicenter Boston type
I keratoprosthesis study. Ophthalmology 2006; 113(1): 1779.
e1-1779.e7. 3Greiner MA, Li JY, Mannis MJ. Longer-term vision
outcomes and complications with the Boston type 1 keratoprosthesis
at the University of California, Davis. Ophthalmology 2011; 118(8):
1543-1550.
56% to 89%1-3
20/200 or better
66.7%
84%
76% 76.5%
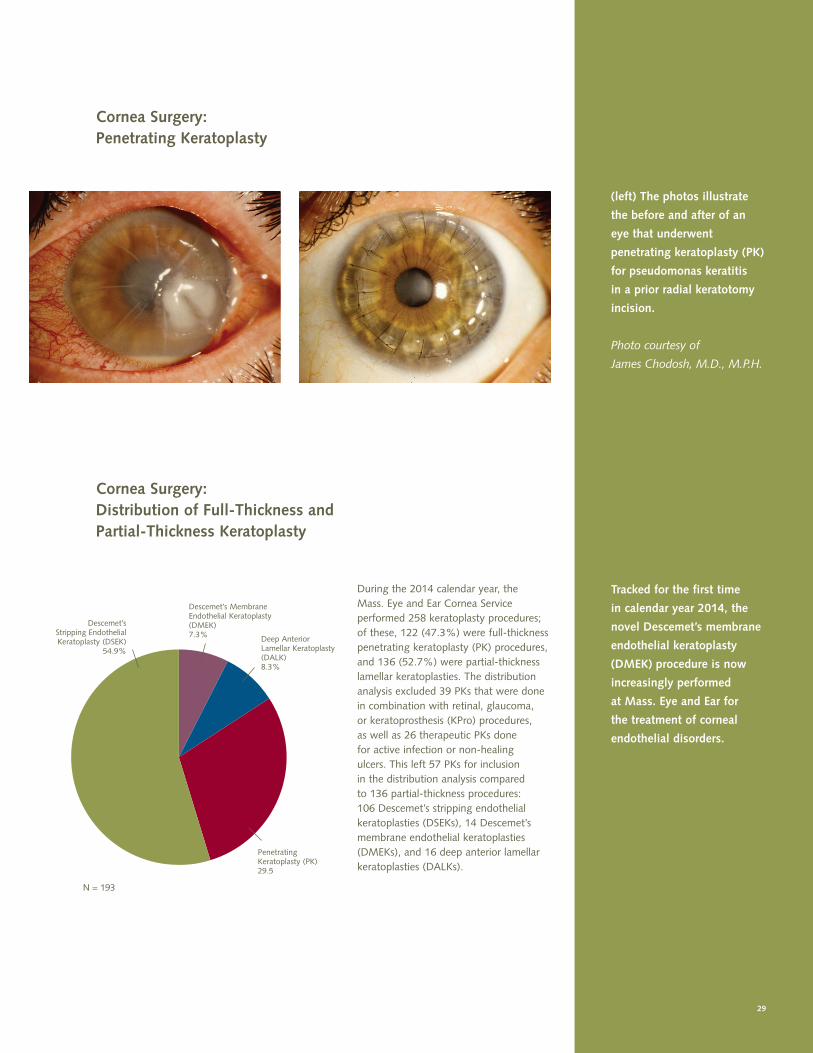
(left) The photos illustrate
the before and after of an
eye that underwent
penetrating keratoplasty (PK)
for pseudomonas keratitis
in a prior radial keratotomy
incision.
Photo courtesy of
James Chodosh, M.D., M.P.H.
29
Cornea Surgery: Penetrating Keratoplasty
Tracked for the first time
in calendar year 2014, the
novel Descemet’s membrane
endothelial keratoplasty
(DMEK) procedure is now
increasingly performed
at Mass. Eye and Ear for
the treatment of corneal
endothelial disorders.
Cornea Surgery: Distribution of Full-Thickness and Partial-Thickness Keratoplasty
During the 2014 calendar year, the Mass. Eye and Ear Cornea Service performed 258 keratoplasty procedures; of these, 122 (47.3%) were full-thickness penetrating keratoplasty (PK) procedures, and 136 (52.7%) were partial-thickness lamellar keratoplasties. The distribution analysis excluded 39 PKs that were done in combination with retinal, glaucoma, or keratoprosthesis (KPro) procedures, as well as 26 therapeutic PKs done for active infection or non-healing ulcers. This left 57 PKs for inclusion in the distribution analysis compared to 136 partial-thickness procedures: 106 Descemet’s stripping endothelial keratoplasties (DSEKs), 14 Descemet’s membrane endothelial keratoplasties (DMEKs), and 16 deep anterior lamellar keratoplasties (DALKs).
N = 193
Deep AnteriorLamellar Keratoplasty(DALK)8.3%
Penetrating Keratoplasty (PK)29.5
Descemet’sStripping Endothelial Keratoplasty (DSEK)
54.9%
Descemet’s Membrane Endothelial Keratoplasty (DMEK)7.3%
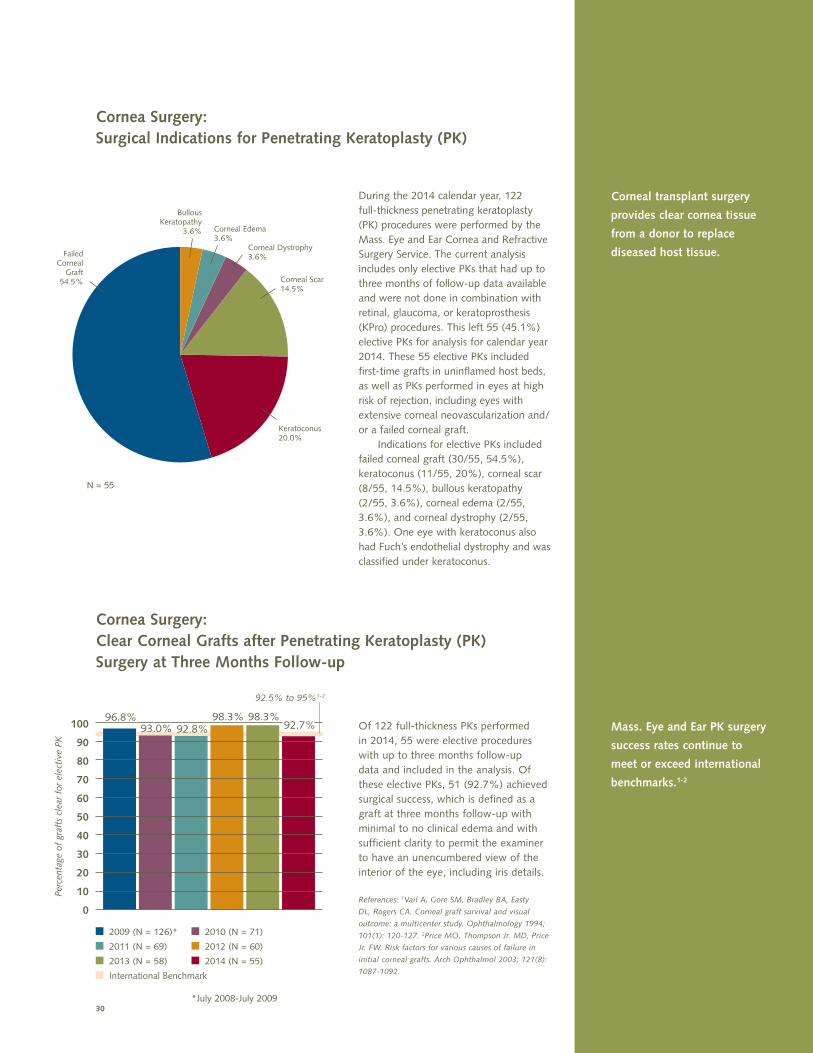
30
Corneal transplant surgery
provides clear cornea tissue
from a donor to replace
diseased host tissue.
Mass. Eye and Ear PK surgery
success rates continue to
meet or exceed international
benchmarks.1-2
Cornea Surgery: Surgical Indications for Penetrating Keratoplasty (PK)
During the 2014 calendar year, 122 full-thickness penetrating keratoplasty (PK) procedures were performed by the Mass. Eye and Ear Cornea and Refractive Surgery Service. The current analysis includes only elective PKs that had up to three months of follow-up data available and were not done in combination with retinal, glaucoma, or keratoprosthesis (KPro) procedures. This left 55 (45.1%) elective PKs for analysis for calendar year 2014. These 55 elective PKs included first-time grafts in uninflamed host beds, as well as PKs performed in eyes at high risk of rejection, including eyes with extensive corneal neovascularization and/or a failed corneal graft. Indications for elective PKs included failed corneal graft (30/55, 54.5%), keratoconus (11/55, 20%), corneal scar (8/55, 14.5%), bullous keratopathy (2/55, 3.6%), corneal edema (2/55, 3.6%), and corneal dystrophy (2/55, 3.6%). One eye with keratoconus also had Fuch’s endothelial dystrophy and was classified under keratoconus.
N = 55
BullousKeratopathy
3.6% Corneal Edema3.6%
Corneal Scar14.5%
Keratoconus20.0%
Failed Corneal
Graft54.5%
Corneal Dystrophy3.6%
Cornea Surgery: Clear Corneal Grafts after Penetrating Keratoplasty (PK) Surgery at Three Months Follow-up
100
90
80
70
60
50
40
30
20
10
0
Perc
enta
ge o
f gr
afts
cle
ar f
or e
lect
ive
PK
Of 122 full-thickness PKs performed in 2014, 55 were elective procedures with up to three months follow-up data and included in the analysis. Of these elective PKs, 51 (92.7%) achieved surgical success, which is defined as a graft at three months follow-up with minimal to no clinical edema and with sufficient clarity to permit the examiner to have an unencumbered view of the interior of the eye, including iris details.
References: 1Vail A, Gore SM, Bradley BA, Easty
DL, Rogers CA. Corneal graft survival and visual
outcome: a multicenter study. Ophthalmology 1994;
101(1): 120-127. 2Price MO, Thompson Jr. MD, Price
Jr. FW. Risk factors for various causes of failure in
initial corneal grafts. Arch Ophthalmol 2003; 121(8):
1087-1092.
93.0% 92.8%98.3% 98.3%
92.7%
92.5% to 95%1-2
96.8%
2009 (N = 126)* 2010 (N = 71)
2011 (N = 69) 2012 (N = 60)
2013 (N = 58) 2014 (N = 55)
International Benchmark
*July 2008-July 2009
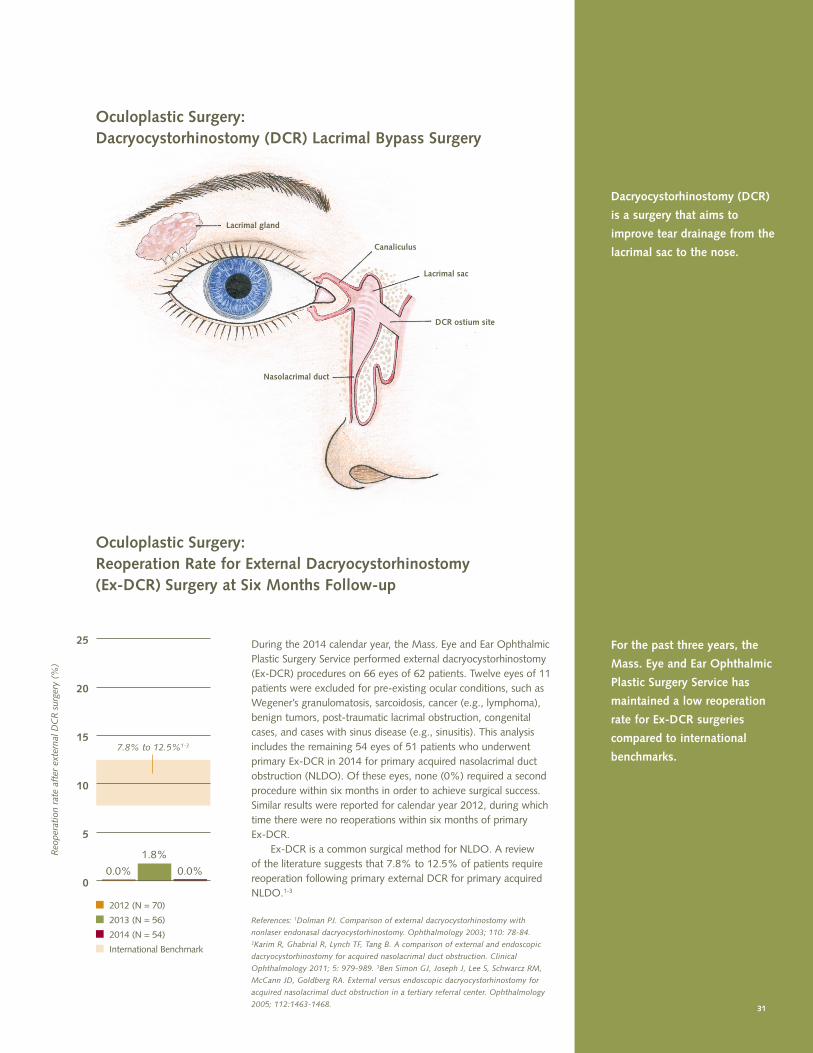
Oculoplastic Surgery: Reoperation Rate for External Dacryocystorhinostomy (Ex-DCR) Surgery at Six Months Follow-up
25
20
15
10
5
0
Reo
pera
tion
rat
e af
ter
exte
rnal
DC
R s
urge
ry (
%)
During the 2014 calendar year, the Mass. Eye and Ear Ophthalmic Plastic Surgery Service performed external dacryocystorhinostomy (Ex-DCR) procedures on 66 eyes of 62 patients. Twelve eyes of 11 patients were excluded for pre-existing ocular conditions, such as Wegener’s granulomatosis, sarcoidosis, cancer (e.g., lymphoma), benign tumors, post-traumatic lacrimal obstruction, congenital cases, and cases with sinus disease (e.g., sinusitis). This analysis includes the remaining 54 eyes of 51 patients who underwent primary Ex-DCR in 2014 for primary acquired nasolacrimal duct obstruction (NLDO). Of these eyes, none (0%) required a second procedure within six months in order to achieve surgical success. Similar results were reported for calendar year 2012, during which time there were no reoperations within six months of primary Ex-DCR. Ex-DCR is a common surgical method for NLDO. A review of the literature suggests that 7.8% to 12.5% of patients require reoperation following primary external DCR for primary acquired NLDO.1-3
References: 1Dolman PJ. Comparison of external dacryocystorhinostomy with
nonlaser endonasal dacryocystorhinostomy. Ophthalmology 2003; 110: 78-84. 2Karim R, Ghabrial R, Lynch TF, Tang B. A comparison of external and endoscopic
dacryocystorhinostomy for acquired nasolacrimal duct obstruction. Clinical
Ophthalmology 2011; 5: 979-989. 3Ben Simon GJ, Joseph J, Lee S, Schwarcz RM,
McCann JD, Goldberg RA. External versus endoscopic dacryocystorhinostomy for
acquired nasolacrimal duct obstruction in a tertiary referral center. Ophthalmology
2005; 112:1463-1468.
7.8% to 12.5%1-3
2012 (N = 70)
2013 (N = 56)
2014 (N = 54)
International Benchmark
0.0% 0.0%
1.8%
31
Oculoplastic Surgery: Dacryocystorhinostomy (DCR) Lacrimal Bypass Surgery
For the past three years, the
Mass. Eye and Ear Ophthalmic
Plastic Surgery Service has
maintained a low reoperation
rate for Ex-DCR surgeries
compared to international
benchmarks.
Dacryocystorhinostomy (DCR)
is a surgery that aims to
improve tear drainage from the
lacrimal sac to the nose.
Lacrimal gland
Canaliculus
Lacrimal sac
DCR ostium site
Nasolacrimal duct
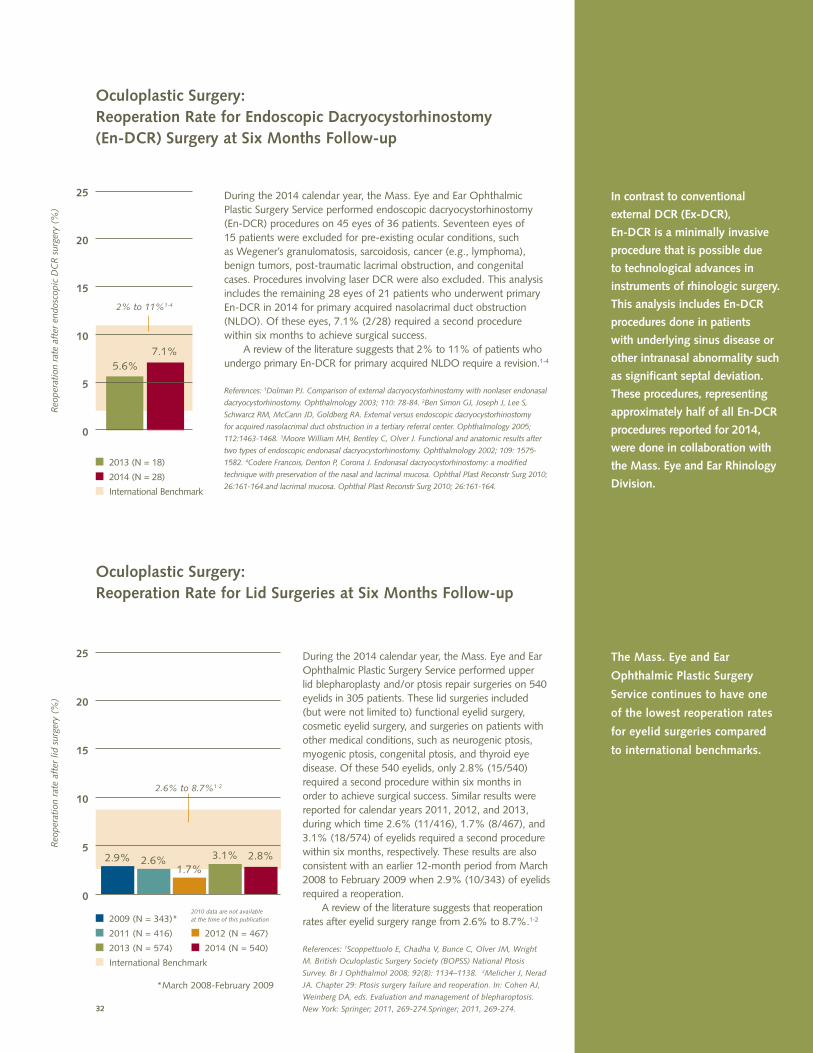
2% to 11%1-4
Oculoplastic Surgery: Reoperation Rate for Lid Surgeries at Six Months Follow-up
32
In contrast to conventional
external DCR (Ex-DCR),
En-DCR is a minimally invasive
procedure that is possible due
to technological advances in
instruments of rhinologic surgery.
This analysis includes En-DCR
procedures done in patients
with underlying sinus disease or
other intranasal abnormality such
as significant septal deviation.
These procedures, representing
approximately half of all En-DCR
procedures reported for 2014,
were done in collaboration with
the Mass. Eye and Ear Rhinology
Division.
The Mass. Eye and Ear
Ophthalmic Plastic Surgery
Service continues to have one
of the lowest reoperation rates
for eyelid surgeries compared
to international benchmarks.
Oculoplastic Surgery: Reoperation Rate for Endoscopic Dacryocystorhinostomy (En-DCR) Surgery at Six Months Follow-up
25
20
15
10
5
0
Reo
pera
tion
rat
e af
ter
lid s
urge
ry (
%)
During the 2014 calendar year, the Mass. Eye and Ear Ophthalmic Plastic Surgery Service performed upper lid blepharoplasty and/or ptosis repair surgeries on 540 eyelids in 305 patients. These lid surgeries included (but were not limited to) functional eyelid surgery, cosmetic eyelid surgery, and surgeries on patients with other medical conditions, such as neurogenic ptosis, myogenic ptosis, congenital ptosis, and thyroid eye disease. Of these 540 eyelids, only 2.8% (15/540) required a second procedure within six months in order to achieve surgical success. Similar results were reported for calendar years 2011, 2012, and 2013, during which time 2.6% (11/416), 1.7% (8/467), and 3.1% (18/574) of eyelids required a second procedure within six months, respectively. These results are also consistent with an earlier 12-month period from March 2008 to February 2009 when 2.9% (10/343) of eyelids required a reoperation. A review of the literature suggests that reoperation rates after eyelid surgery range from 2.6% to 8.7%.1-2
References: 1Scoppettuolo E, Chadha V, Bunce C, Olver JM, Wright
M. British Oculoplastic Surgery Society (BOPSS) National Ptosis
Survey. Br J Ophthalmol 2008; 92(8): 1134–1138. 2Melicher J, Nerad
JA. Chapter 29: Ptosis surgery failure and reoperation. In: Cohen AJ,
Weinberg DA, eds. Evaluation and management of blepharoptosis.
New York: Springer; 2011, 269-274.Springer; 2011, 269-274.
2.6% to 8.7%1-2
2009 (N = 343)*
2011 (N = 416) 2012 (N = 467)
2013 (N = 574) 2014 (N = 540)
International Benchmark
*March 2008-February 2009
2.9% 2.6%1.7%
3.1% 2.8%
25
20
15
10
5
0
Reo
pera
tion
rat
e af
ter
endo
scop
ic D
CR
sur
gery
(%
)
During the 2014 calendar year, the Mass. Eye and Ear Ophthalmic Plastic Surgery Service performed endoscopic dacryocystorhinostomy (En-DCR) procedures on 45 eyes of 36 patients. Seventeen eyes of 15 patients were excluded for pre-existing ocular conditions, such as Wegener’s granulomatosis, sarcoidosis, cancer (e.g., lymphoma), benign tumors, post-traumatic lacrimal obstruction, and congenital cases. Procedures involving laser DCR were also excluded. This analysis includes the remaining 28 eyes of 21 patients who underwent primary En-DCR in 2014 for primary acquired nasolacrimal duct obstruction (NLDO). Of these eyes, 7.1% (2/28) required a second procedure within six months to achieve surgical success. A review of the literature suggests that 2% to 11% of patients who undergo primary En-DCR for primary acquired NLDO require a revision.1-4
References: 1Dolman PJ. Comparison of external dacryocystorhinostomy with nonlaser endonasal
dacryocystorhinostomy. Ophthalmology 2003; 110: 78-84. 2Ben Simon GJ, Joseph J, Lee S,
Schwarcz RM, McCann JD, Goldberg RA. External versus endoscopic dacryocystorhinostomy
for acquired nasolacrimal duct obstruction in a tertiary referral center. Ophthalmology 2005;
112:1463-1468. 3Moore William MH, Bentley C, Olver J. Functional and anatomic results after
two types of endoscopic endonasal dacryocystorhinostomy. Ophthalmology 2002; 109: 1575-
1582. 4Codere Francois, Denton P, Corona J. Endonasal dacryocystorhinostomy: a modified
technique with preservation of the nasal and lacrimal mucosa. Ophthal Plast Reconstr Surg 2010;
26:161-164.and lacrimal mucosa. Ophthal Plast Reconstr Surg 2010; 26:161-164.
5.6%7.1%
2013 (N = 18)
2014 (N = 28)
International Benchmark
2010 data are not available at the time of this publication
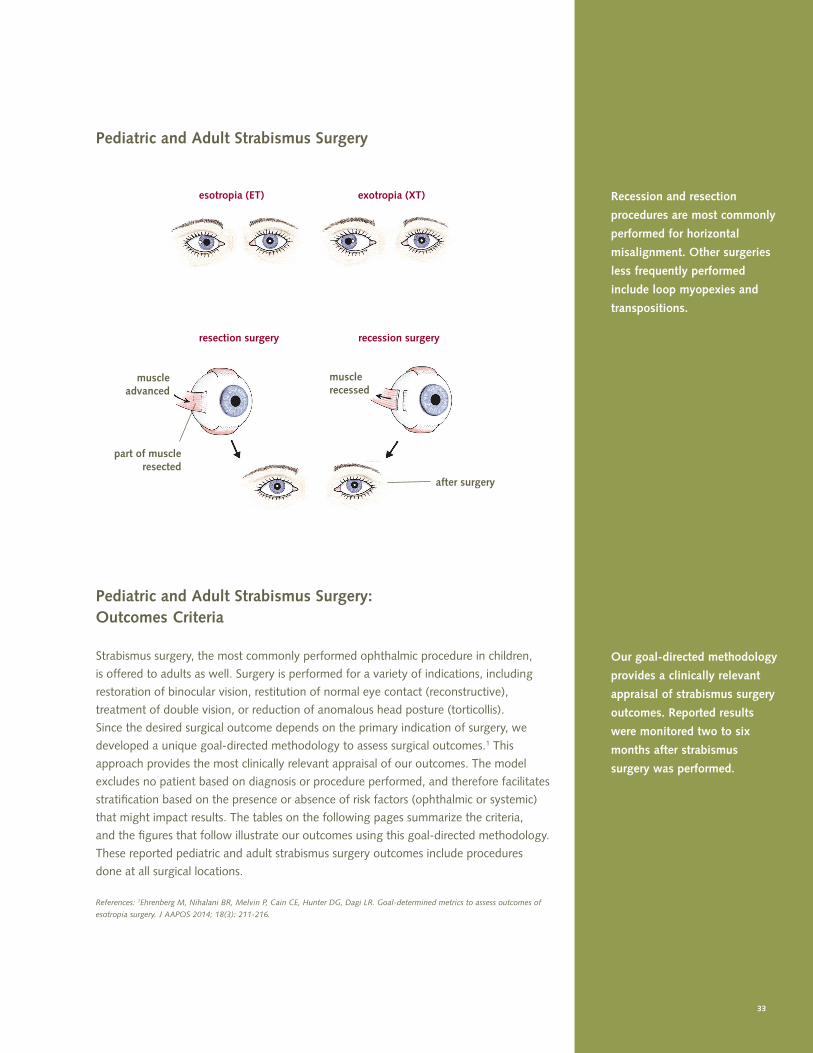
exotropia (XT)esotropia (ET)
recession surgeryresection surgery
part of muscleresected
musclerecessed
muscleadvanced
after surgery
Recession and resection
procedures are most commonly
performed for horizontal
misalignment. Other surgeries
less frequently performed
include loop myopexies and
transpositions.
33
Pediatric and Adult Strabismus Surgery
Pediatric and Adult Strabismus Surgery: Outcomes Criteria
Strabismus surgery, the most commonly performed ophthalmic procedure in children,
is offered to adults as well. Surgery is performed for a variety of indications, including
restoration of binocular vision, restitution of normal eye contact (reconstructive),
treatment of double vision, or reduction of anomalous head posture (torticollis).
Since the desired surgical outcome depends on the primary indication of surgery, we
developed a unique goal-directed methodology to assess surgical outcomes.1 This
approach provides the most clinically relevant appraisal of our outcomes. The model
excludes no patient based on diagnosis or procedure performed, and therefore facilitates
stratification based on the presence or absence of risk factors (ophthalmic or systemic)
that might impact results. The tables on the following pages summarize the criteria,
and the figures that follow illustrate our outcomes using this goal-directed methodology.
These reported pediatric and adult strabismus surgery outcomes include procedures
done at all surgical locations.
References: 1Ehrenberg M, Nihalani BR, Melvin P, Cain CE, Hunter DG, Dagi LR. Goal-determined metrics to assess outcomes of
esotropia surgery. J AAPOS 2014; 18(3): 211-216.
Our goal-directed methodology
provides a clinically relevant
appraisal of strabismus surgery
outcomes. Reported results
were monitored two to six
months after strabismus
surgery was performed.
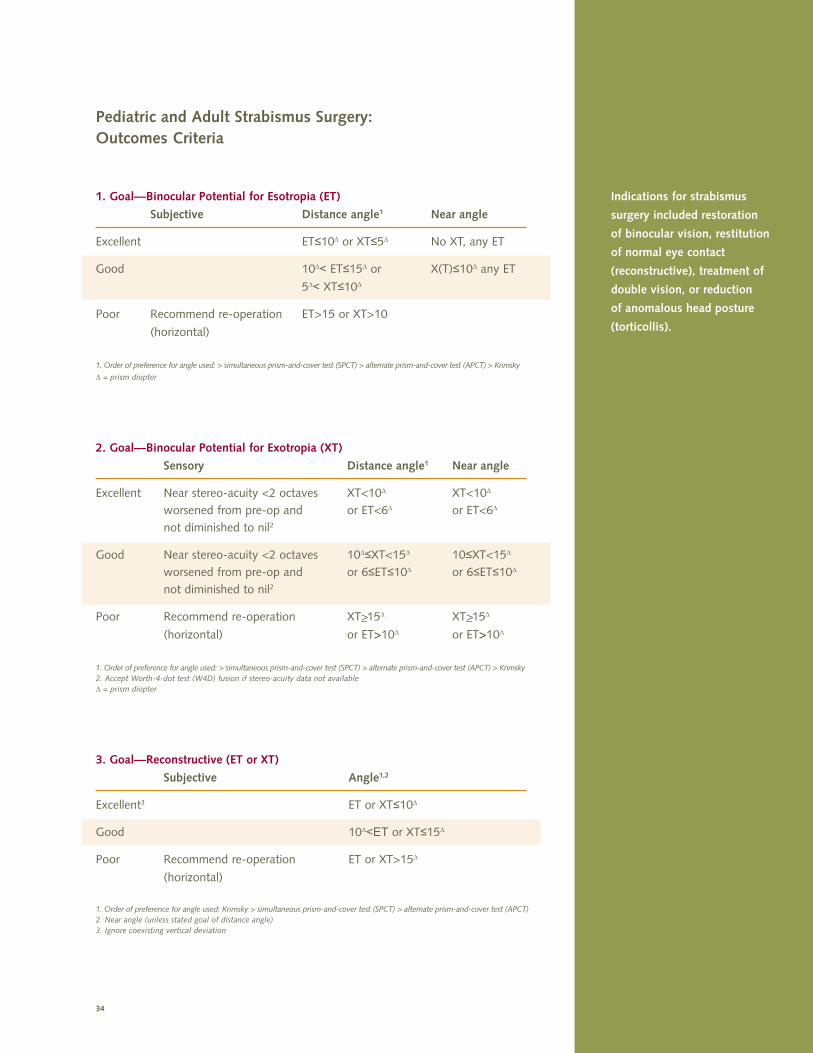
34
Indications for strabismus
surgery included restoration
of binocular vision, restitution
of normal eye contact
(reconstructive), treatment of
double vision, or reduction
of anomalous head posture
(torticollis).
Pediatric and Adult Strabismus Surgery:Outcomes Criteria
1. Goal—Binocular Potential for Esotropia (ET)
Subjective Distance angle1 Near angle
Excellent ET≤10∆ or XT≤5∆ No XT, any ET
Good 10∆< ET≤15∆ or X(T)≤10∆ any ET
5∆< XT≤10∆
Poor Recommend re-operation ET>15 or XT>10
(horizontal)
1. Order of preference for angle used: > simultaneous prism-and-cover test (SPCT) > alternate prism-and-cover test (APCT) > Krimsky
∆ = prism diopter
2. Goal—Binocular Potential for Exotropia (XT)
Sensory Distance angle1 Near angle
Excellent Near stereo-acuity <2 octaves XT<10∆ XT<10∆ worsened from pre-op and or ET<6∆ or ET<6∆
not diminished to nil2
Good Near stereo-acuity <2 octaves 10∆≤XT<15∆ 10≤XT<15∆
worsened from pre-op and or 6≤ET≤10∆ or 6≤ET≤10∆
not diminished to nil2
Poor Recommend re-operation XT>_15∆ XT>_15∆
(horizontal) or ET>>10∆ or ET>>10∆
1. Order of preference for angle used: > simultaneous prism-and-cover test (SPCT) > alternate prism-and-cover test (APCT) > Krimsky 2. Accept Worth-4-dot test (W4D) fusion if stereo-acuity data not available ∆ = prism diopter
3. Goal—Reconstructive (ET or XT)
Subjective Angle1,2
Excellent3 ET or XT≤10∆
Good 10∆<ET or XT≤15∆
Poor Recommend re-operation ET or XT>15∆
(horizontal)
1. Order of preference for angle used: Krimsky > simultaneous prism-and-cover test (SPCT) > alternate prism-and-cover test (APCT)2. Near angle (unless stated goal of distance angle)3. Ignore coexisting vertical deviation
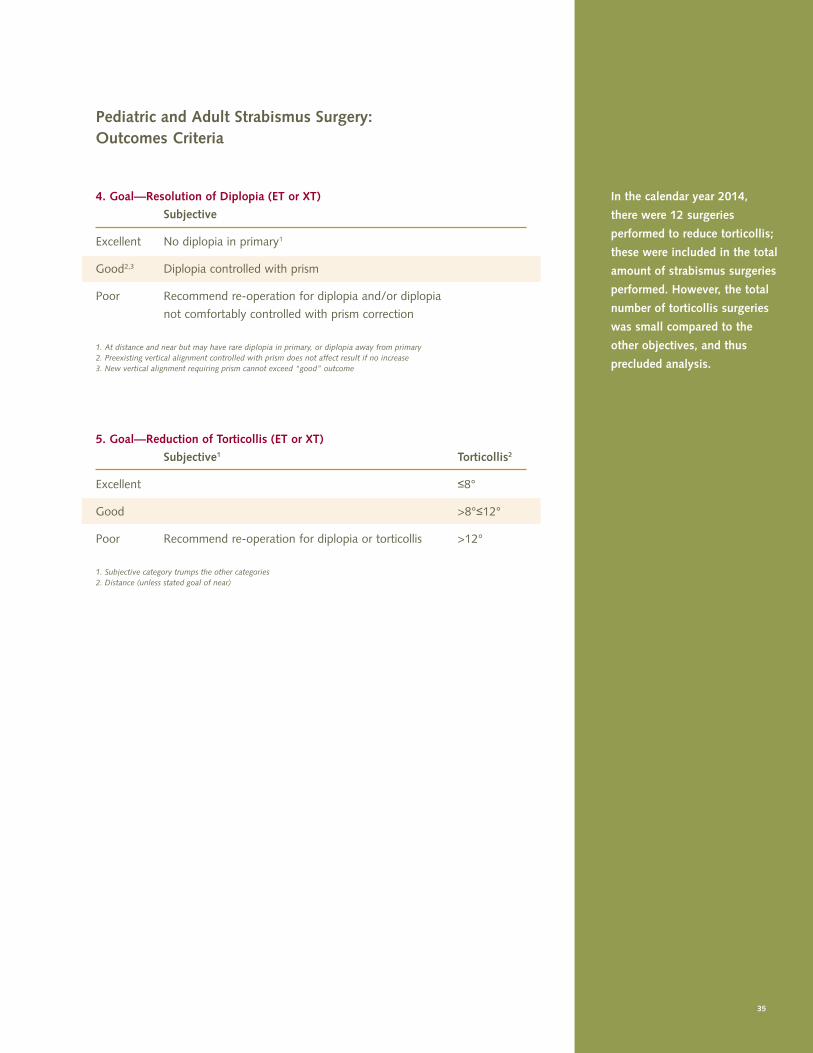
In the calendar year 2014,
there were 12 surgeries
performed to reduce torticollis;
these were included in the total
amount of strabismus surgeries
performed. However, the total
number of torticollis surgeries
was small compared to the
other objectives, and thus
precluded analysis.
35
4. Goal—Resolution of Diplopia (ET or XT)
Subjective
Excellent No diplopia in primary1
Good2,3 Diplopia controlled with prism
Poor Recommend re-operation for diplopia and/or diplopia
not comfortably controlled with prism correction
1. At distance and near but may have rare diplopia in primary, or diplopia away from primary2. Preexisting vertical alignment controlled with prism does not affect result if no increase3. New vertical alignment requiring prism cannot exceed “good” outcome
5. Goal—Reduction of Torticollis (ET or XT)
Subjective1 Torticollis2
Excellent ≤8°
Good >8°≤12°
Poor Recommend re-operation for diplopia or torticollis >12°
1. Subjective category trumps the other categories 2. Distance (unless stated goal of near)
Pediatric and Adult Strabismus Surgery:Outcomes Criteria
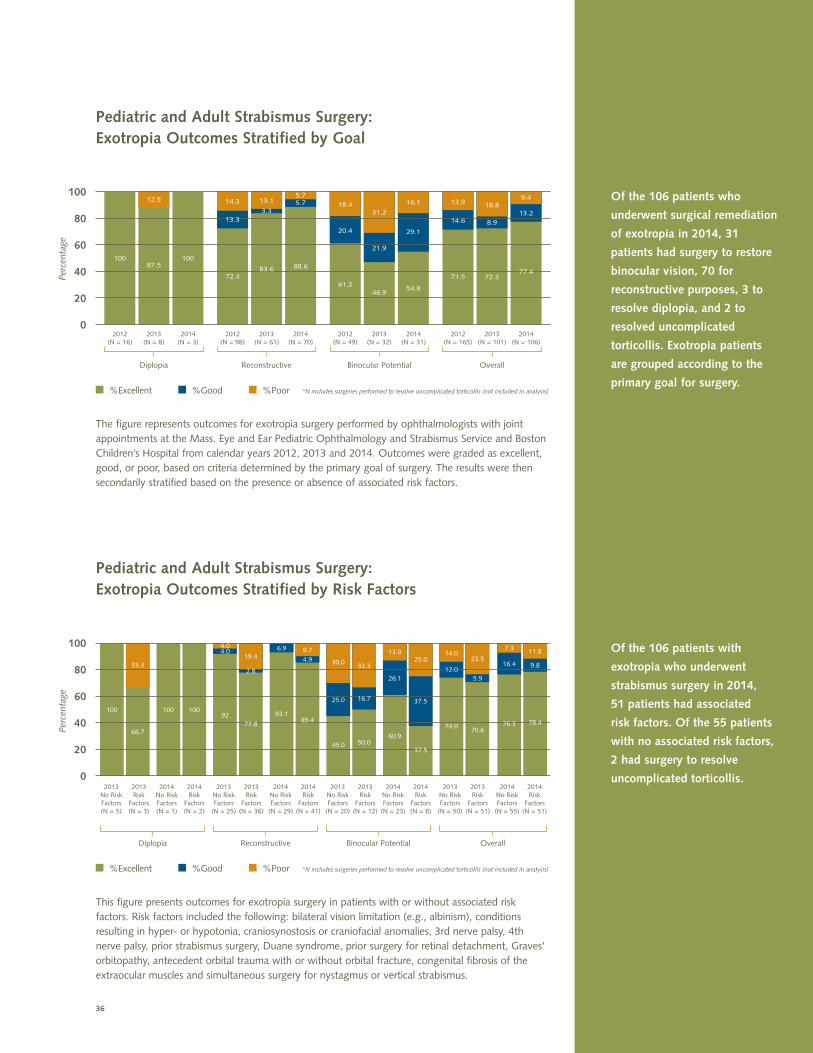
36
Of the 106 patients who
underwent surgical remediation
of exotropia in 2014, 31
patients had surgery to restore
binocular vision, 70 for
reconstructive purposes, 3 to
resolve diplopia, and 2 to
resolved uncomplicated
torticollis. Exotropia patients
are grouped according to the
primary goal for surgery.
Of the 106 patients with
exotropia who underwent
strabismus surgery in 2014,
51 patients had associated
risk factors. Of the 55 patients
with no associated risk factors,
2 had surgery to resolve
uncomplicated torticollis.
Pediatric and Adult Strabismus Surgery: Exotropia Outcomes Stratified by Goal
100
80
60
40
20
0
100
80
60
40
20
0
100
72.4
14.3
13.3
61.2
18.4
20.4
71.5
14.6
13.9
87.5
12.5
83.6
13.1
3.3
46.9
21.9
31.2
72.3
18.8
8.9
10088.6
5.75.7
54.8
16.1
29.1
77.4
13.2
9.4
Perc
enta
gePe
rcen
tage
Pediatric and Adult Strabismus Surgery: Exotropia Outcomes Stratified by Risk Factors
This figure presents outcomes for exotropia surgery in patients with or without associated risk factors. Risk factors included the following: bilateral vision limitation (e.g., albinism), conditions resulting in hyper- or hypotonia, craniosynostosis or craniofacial anomalies, 3rd nerve palsy, 4th nerve palsy, prior strabismus surgery, Duane syndrome, prior surgery for retinal detachment, Graves’ orbitopathy, antecedent orbital trauma with or without orbital fracture, congenital fibrosis of the extraocular muscles and simultaneous surgery for nystagmus or vertical strabismus.
The figure represents outcomes for exotropia surgery performed by ophthalmologists with joint appointments at the Mass. Eye and Ear Pediatric Ophthalmology and Strabismus Service and Boston Children’s Hospital from calendar years 2012, 2013 and 2014. Outcomes were graded as excellent, good, or poor, based on criteria determined by the primary goal of surgery. The results were then secondarily stratified based on the presence or absence of associated risk factors.
%Excellent %Good %Poor *N includes surgeries performed to resolve uncomplicated torticollis (not included in analysis)
%Excellent %Good %Poor *N includes surgeries performed to resolve uncomplicated torticollis (not included in analysis)
Binocular Potential
2012(N = 49)
2013(N = 32)
2014(N = 31)
2013No RiskFactors(N = 5)
2013Risk
Factors(N = 3)
2013No RiskFactors
(N = 20)
2013Risk
Factors(N = 12)
2014No RiskFactors(N = 1)
2014Risk
Factors(N = 2)
2014No Risk Factors
(N = 23)
2014Risk
Factors(N = 8)
2013No RiskFactors
(N = 25)
2013Risk
Factors(N = 36)
2013No RiskFactors
(N = 50)
2013Risk
Factors(N = 51)
2014No Risk Factors
(N = 29)
2014Risk
Factors(N = 41)
2014No RiskFactors
(N = 55)
2014Risk
Factors(N = 51)
2012(N = 98)
2013(N = 61)
2014(N = 70)
2012(N = 16)
2013(N = 8)
2014(N = 3)
2012(N = 165)
2013(N = 101)
2014(N = 106)
Diplopia
Reconstructive
Reconstructive
Diplopia
Binocular Potential
Overall
Overall
100
66.7
33.3
100 10092
77.8
93.185.4
4.99.7
30.0
25.0
45.0 50.0
16.7
33.3
13.0
26.1
60.9
37.5
37.5
25.014.0
12.0
74.070.6
5.9
23.5
7.3
16.4
76.3 78.4
9.8
11.8
2.8
19.46.94.0
4.0
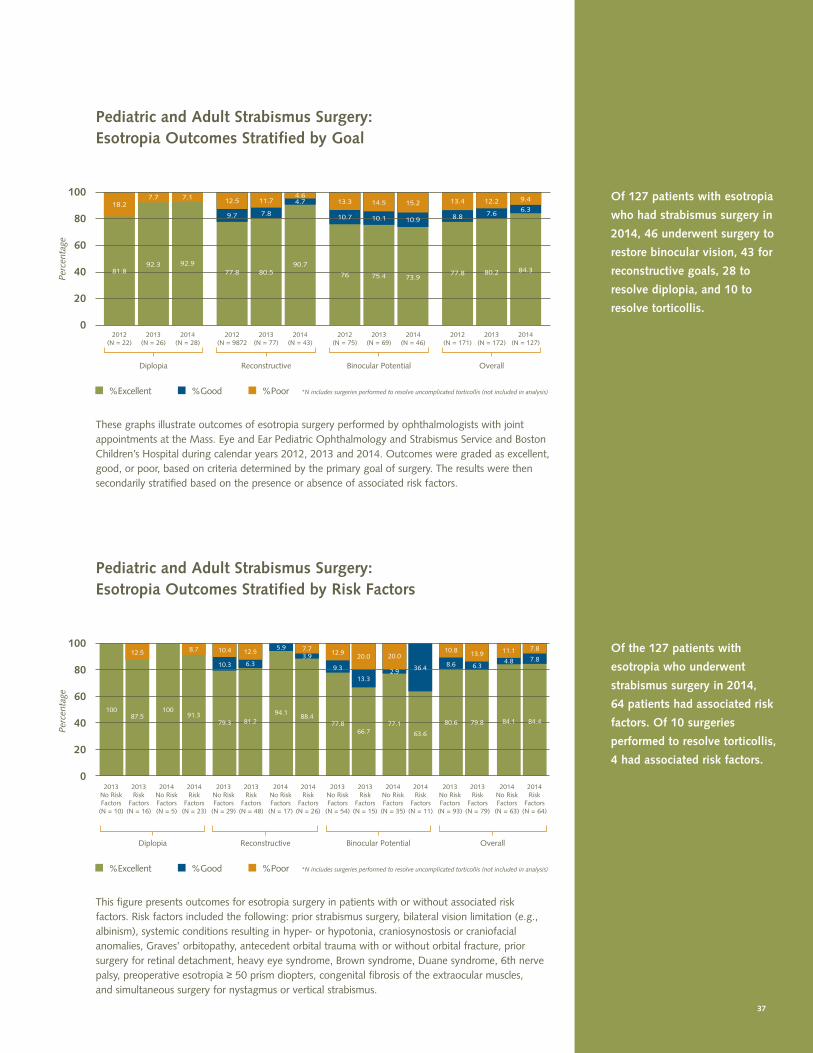
Of 127 patients with esotropia
who had strabismus surgery in
2014, 46 underwent surgery to
restore binocular vision, 43 for
reconstructive goals, 28 to
resolve diplopia, and 10 to
resolve torticollis.
Of the 127 patients with
esotropia who underwent
strabismus surgery in 2014,
64 patients had associated risk
factors. Of 10 surgeries
performed to resolve torticollis,
4 had associated risk factors.
37
Pediatric and Adult Strabismus Surgery: Esotropia Outcomes Stratified by Goal
100
80
60
40
20
0
100
80
60
40
20
0
81.8
18.2
77.8
9.7
12.5
76
10.7
13.3
77.8
8.8
13.4
92.3
7.7
80.5
11.7
7.8
75.4
10.1
14.5
80.2
7.6
12.2
92.9
7.1
90.7
4.74.6
73.9
10.9
15.2
84.3
6.3
9.4
Perc
enta
gePe
rcen
tage
Pediatric and Adult Strabismus Surgery: Esotropia Outcomes Stratified by Risk Factors
This figure presents outcomes for esotropia surgery in patients with or without associated risk factors. Risk factors included the following: prior strabismus surgery, bilateral vision limitation (e.g., albinism), systemic conditions resulting in hyper- or hypotonia, craniosynostosis or craniofacial anomalies, Graves’ orbitopathy, antecedent orbital trauma with or without orbital fracture, prior surgery for retinal detachment, heavy eye syndrome, Brown syndrome, Duane syndrome, 6th nerve palsy, preoperative esotropia ≥ 50 prism diopters, congenital fibrosis of the extraocular muscles, and simultaneous surgery for nystagmus or vertical strabismus.
These graphs illustrate outcomes of esotropia surgery performed by ophthalmologists with joint appointments at the Mass. Eye and Ear Pediatric Ophthalmology and Strabismus Service and Boston Children’s Hospital during calendar years 2012, 2013 and 2014. Outcomes were graded as excellent, good, or poor, based on criteria determined by the primary goal of surgery. The results were then secondarily stratified based on the presence or absence of associated risk factors.
%Excellent %Good %Poor *N includes surgeries performed to resolve uncomplicated torticollis (not included in analysis)
%Excellent %Good %Poor *N includes surgeries performed to resolve uncomplicated torticollis (not included in analysis)
Binocular Potential
2012(N = 75)
2013(N = 69)
2014(N = 46)
2013No RiskFactors
(N = 10)
2013Risk
Factors(N = 16)
2013No RiskFactors
(N = 54)
2013Risk
Factors(N = 15)
2014No RiskFactors(N = 5)
2014Risk
Factors(N = 23)
2014No Risk Factors
(N = 35)
2014Risk
Factors(N = 11)
2013No RiskFactors
(N = 29)
2013Risk
Factors(N = 48)
2013No RiskFactors
(N = 93)
2013Risk
Factors(N = 79)
2014No Risk Factors
(N = 17)
2014Risk
Factors(N = 26)
2014No RiskFactors
(N = 63)
2014Risk
Factors(N = 64)
2012(N = 9872
2013(N = 77)
2014(N = 43)
2012(N = 22)
2013(N = 26)
2014(N = 28)
2012(N = 171)
2013(N = 172)
2014(N = 127)
Diplopia
Reconstructive
Reconstructive
Diplopia
Binocular Potential
Overall
Overall
10087.5
12.5
10091.3
8.7
79.3
10.3
10.4
81.2
6.3
12.5
94.1
5.9
88.4
3.97.7
77.8
9.3
12.9
66.7
13.3
20.0
77.1
2.9
20.0
63.6
36.4
80.6
8.6
10.8
79.8
6.3
13.9
84.1
11.1
4.8
84.4
7.8
7.8
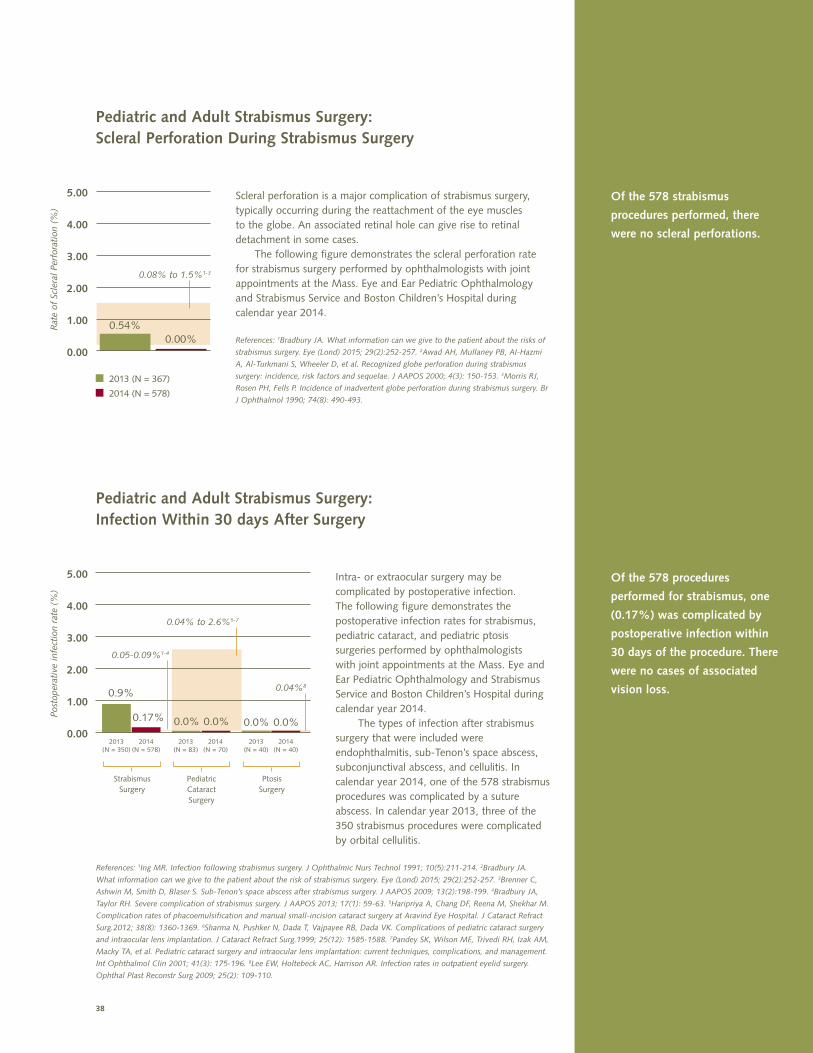
38
Of the 578 procedures
performed for strabismus, one
(0.17%) was complicated by
postoperative infection within
30 days of the procedure. There
were no cases of associated
vision loss.
Of the 578 strabismus
procedures performed, there
were no scleral perforations.
Pediatric and Adult Strabismus Surgery: Scleral Perforation During Strabismus Surgery
Pediatric and Adult Strabismus Surgery: Infection Within 30 days After Surgery
5.00
4.00
3.00
2.00
1.00
0.00
5.00
4.00
3.00
2.00
1.00
0.00
Rat
e of
Scl
eral
Per
fora
tion
(%
)Po
stop
erat
ive
infe
ctio
n ra
te (
%)
Scleral perforation is a major complication of strabismus surgery, typically occurring during the reattachment of the eye muscles to the globe. An associated retinal hole can give rise to retinal detachment in some cases. The following figure demonstrates the scleral perforation rate for strabismus surgery performed by ophthalmologists with joint appointments at the Mass. Eye and Ear Pediatric Ophthalmology and Strabismus Service and Boston Children’s Hospital during calendar year 2014.
References: 1Bradbury JA. What information can we give to the patient about the risks of
strabismus surgery. Eye (Lond) 2015; 29(2):252-257. 2Awad AH, Mullaney PB, AI-Hazmi
A, Al-Turkmani S, Wheeler D, et al. Recognized globe perforation during strabismus
surgery: incidence, risk factors and sequelae. J AAPOS 2000; 4(3): 150-153. 3Morris RJ,
Rosen PH, Fells P. Incidence of inadvertent globe perforation during strabismus surgery. Br
J Ophthalmol 1990; 74(8): 490-493.
Intra- or extraocular surgery may be complicated by postoperative infection. The following figure demonstrates the postoperative infection rates for strabismus, pediatric cataract, and pediatric ptosis surgeries performed by ophthalmologists with joint appointments at the Mass. Eye and Ear Pediatric Ophthalmology and Strabismus Service and Boston Children’s Hospital during calendar year 2014. The types of infection after strabismus surgery that were included were endophthalmitis, sub-Tenon’s space abscess, subconjunctival abscess, and cellulitis. In calendar year 2014, one of the 578 strabismus procedures was complicated by a suture abscess. In calendar year 2013, three of the 350 strabismus procedures were complicated by orbital cellulitis.
References: 1Ing MR. Infection following strabismus surgery. J Ophthalmic Nurs Technol 1991; 10(5):211-214. 2Bradbury JA.
What information can we give to the patient about the risk of strabismus surgery. Eye (Lond) 2015; 29(2):252-257. 3Brenner C,
Ashwin M, Smith D, Blaser S. Sub-Tenon’s space abscess after strabismus surgery. J AAPOS 2009; 13(2):198-199. 4Bradbury JA,
Taylor RH. Severe complication of strabismus surgery. J AAPOS 2013; 17(1): 59-63. 5Haripriya A, Chang DF, Reena M, Shekhar M.
Complication rates of phacoemulsification and manual small-incision cataract surgery at Aravind Eye Hospital. J Cataract Refract
Surg.2012; 38(8): 1360-1369. 6Sharma N, Pushker N, Dada T, Vajpayee RB, Dada VK. Complications of pediatric cataract surgery
and intraocular lens implantation. J Cataract Refract Surg.1999; 25(12): 1585-1588. 7Pandey SK, Wilson ME, Trivedi RH, Izak AM,
Macky TA, et al. Pediatric cataract surgery and intraocular lens implantation: current techniques, complications, and management.
Int Ophthalmol Clin 2001; 41(3): 175-196. 8Lee EW, Holtebeck AC, Harrison AR. Infection rates in outpatient eyelid surgery.
Ophthal Plast Reconstr Surg 2009; 25(2): 109-110.
0.54%0.00%
0.9%
0.0%0.17% 0.0% 0.0% 0.0%
2013 (N = 367)
2014 (N = 578)
0.08% to 1.5%1-3
0.04% to 2.6%5-7
0.04%8
0.05-0.09%1-4
2013(N = 350)
2014(N = 578)
2013(N = 83)
2014(N = 70)
2013(N = 40)
2014(N = 40)
StrabismusSurgery
Pediatric CataractSurgery
PtosisSurgery
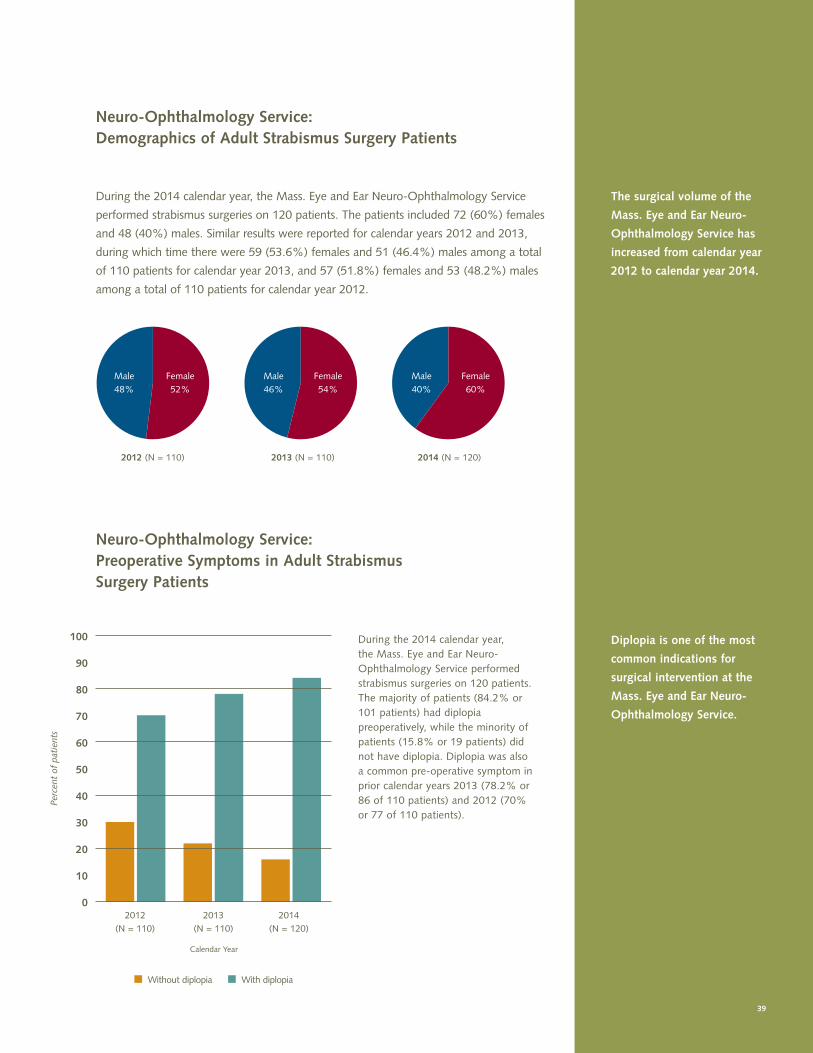
39
The surgical volume of the
Mass. Eye and Ear Neuro-
Ophthalmology Service has
increased from calendar year
2012 to calendar year 2014.
Neuro-Ophthalmology Service: Demographics of Adult Strabismus Surgery Patients
During the 2014 calendar year, the Mass. Eye and Ear Neuro-Ophthalmology Service
performed strabismus surgeries on 120 patients. The patients included 72 (60%) females
and 48 (40%) males. Similar results were reported for calendar years 2012 and 2013,
during which time there were 59 (53.6%) females and 51 (46.4%) males among a total
of 110 patients for calendar year 2013, and 57 (51.8%) females and 53 (48.2%) males
among a total of 110 patients for calendar year 2012.
Diplopia is one of the most
common indications for
surgical intervention at the
Mass. Eye and Ear Neuro-
Ophthalmology Service.
Neuro-Ophthalmology Service: Preoperative Symptoms in Adult Strabismus Surgery Patients
100
90
80
70
60
50
40
30
20
10
0
Perc
ent
of p
atie
nts
During the 2014 calendar year, the Mass. Eye and Ear Neuro-Ophthalmology Service performed strabismus surgeries on 120 patients. The majority of patients (84.2% or 101 patients) had diplopia preoperatively, while the minority of patients (15.8% or 19 patients) did not have diplopia. Diplopia was also a common pre-operative symptom in prior calendar years 2013 (78.2% or 86 of 110 patients) and 2012 (70% or 77 of 110 patients).
Without diplopia With diplopia
2012 (N = 110) 2013 (N = 110) 2014 (N = 120)
2012 (N = 110)
2013 (N = 110)
2014 (N = 120)
Calendar Year
Male 48%
Male 46%
Male 40%
Female 52%
Female 54%
Female 60%
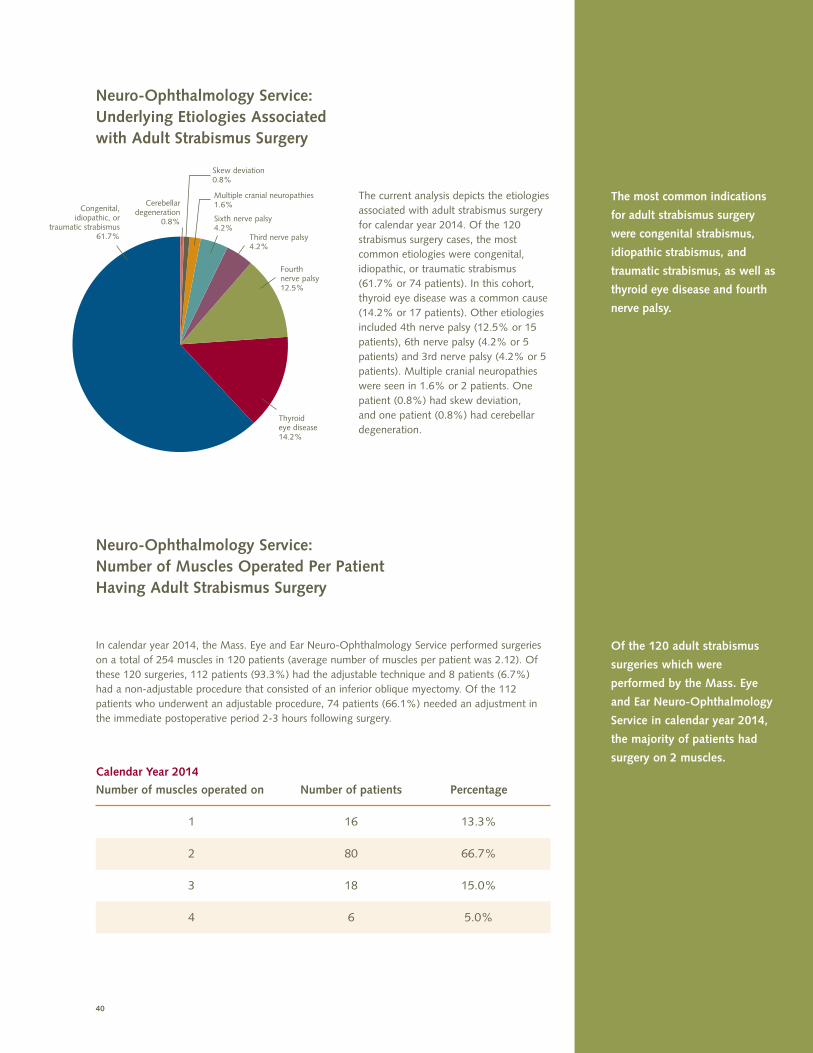
40
The most common indications
for adult strabismus surgery
were congenital strabismus,
idiopathic strabismus, and
traumatic strabismus, as well as
thyroid eye disease and fourth
nerve palsy.
Neuro-Ophthalmology Service: Underlying Etiologies Associated with Adult Strabismus Surgery
The current analysis depicts the etiologies associated with adult strabismus surgery for calendar year 2014. Of the 120 strabismus surgery cases, the most common etiologies were congenital, idiopathic, or traumatic strabismus (61.7% or 74 patients). In this cohort, thyroid eye disease was a common cause (14.2% or 17 patients). Other etiologies included 4th nerve palsy (12.5% or 15 patients), 6th nerve palsy (4.2% or 5 patients) and 3rd nerve palsy (4.2% or 5 patients). Multiple cranial neuropathies were seen in 1.6% or 2 patients. One patient (0.8%) had skew deviation, and one patient (0.8%) had cerebellar degeneration.
Cerebellardegeneration
0.8% Sixth nerve palsy4.2%
Multiple cranial neuropathies1.6%
Skew deviation0.8%
Fourth nerve palsy12.5%
Thyroid eye disease14.2%
Congenital, idiopathic, or
traumatic strabismus61.7% Third nerve palsy
4.2%
Of the 120 adult strabismus
surgeries which were
performed by the Mass. Eye
and Ear Neuro-Ophthalmology
Service in calendar year 2014,
the majority of patients had
surgery on 2 muscles.
Neuro-Ophthalmology Service: Number of Muscles Operated Per Patient Having Adult Strabismus Surgery
In calendar year 2014, the Mass. Eye and Ear Neuro-Ophthalmology Service performed surgeries on a total of 254 muscles in 120 patients (average number of muscles per patient was 2.12). Of these 120 surgeries, 112 patients (93.3%) had the adjustable technique and 8 patients (6.7%) had a non-adjustable procedure that consisted of an inferior oblique myectomy. Of the 112 patients who underwent an adjustable procedure, 74 patients (66.1%) needed an adjustment in the immediate postoperative period 2-3 hours following surgery.
Calendar Year 2014
Number of muscles operated on Number of patients Percentage
1 16 13.3%
2 80 66.7%
3 18 15.0%
4 6 5.0%
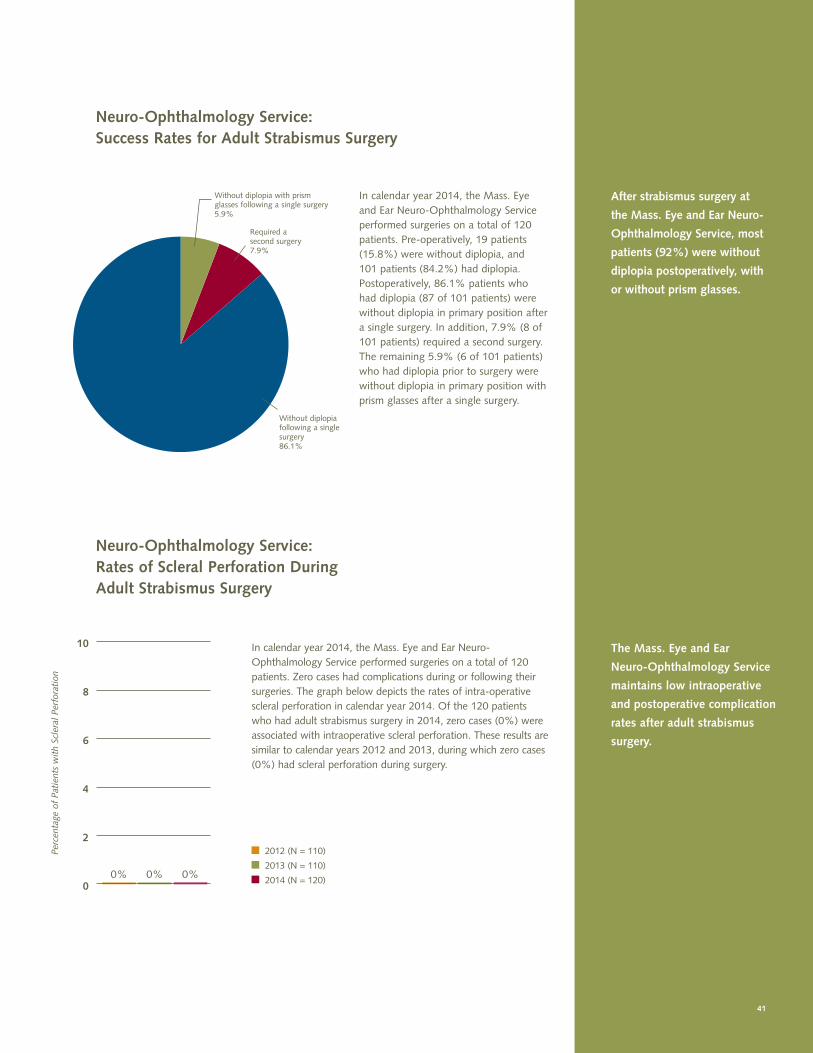
41
After strabismus surgery at
the Mass. Eye and Ear Neuro-
Ophthalmology Service, most
patients (92%) were without
diplopia postoperatively, with
or without prism glasses.
Neuro-Ophthalmology Service: Success Rates for Adult Strabismus Surgery
In calendar year 2014, the Mass. Eye and Ear Neuro-Ophthalmology Service performed surgeries on a total of 120 patients. Pre-operatively, 19 patients (15.8%) were without diplopia, and 101 patients (84.2%) had diplopia. Postoperatively, 86.1% patients who had diplopia (87 of 101 patients) were without diplopia in primary position after a single surgery. In addition, 7.9% (8 of 101 patients) required a second surgery. The remaining 5.9% (6 of 101 patients) who had diplopia prior to surgery were without diplopia in primary position with prism glasses after a single surgery.
Without diplopia with prism glasses following a single surgery5.9%
Without diplopia following a single surgery86.1%
Required a second surgery7.9%
Neuro-Ophthalmology Service: Rates of Scleral Perforation During Adult Strabismus Surgery
10
8
6
4
2
0
Perc
enta
ge o
f Pa
tien
ts w
ith
Scle
ral P
erfo
rati
on
In calendar year 2014, the Mass. Eye and Ear Neuro-Ophthalmology Service performed surgeries on a total of 120 patients. Zero cases had complications during or following their surgeries. The graph below depicts the rates of intra-operative scleral perforation in calendar year 2014. Of the 120 patients who had adult strabismus surgery in 2014, zero cases (0%) were associated with intraoperative scleral perforation. These results are similar to calendar years 2012 and 2013, during which zero cases (0%) had scleral perforation during surgery.
2012 (N = 110)
2013 (N = 110)
2014 (N = 120)0% 0%0%
The Mass. Eye and Ear
Neuro-Ophthalmology Service
maintains low intraoperative
and postoperative complication
rates after adult strabismus
surgery.
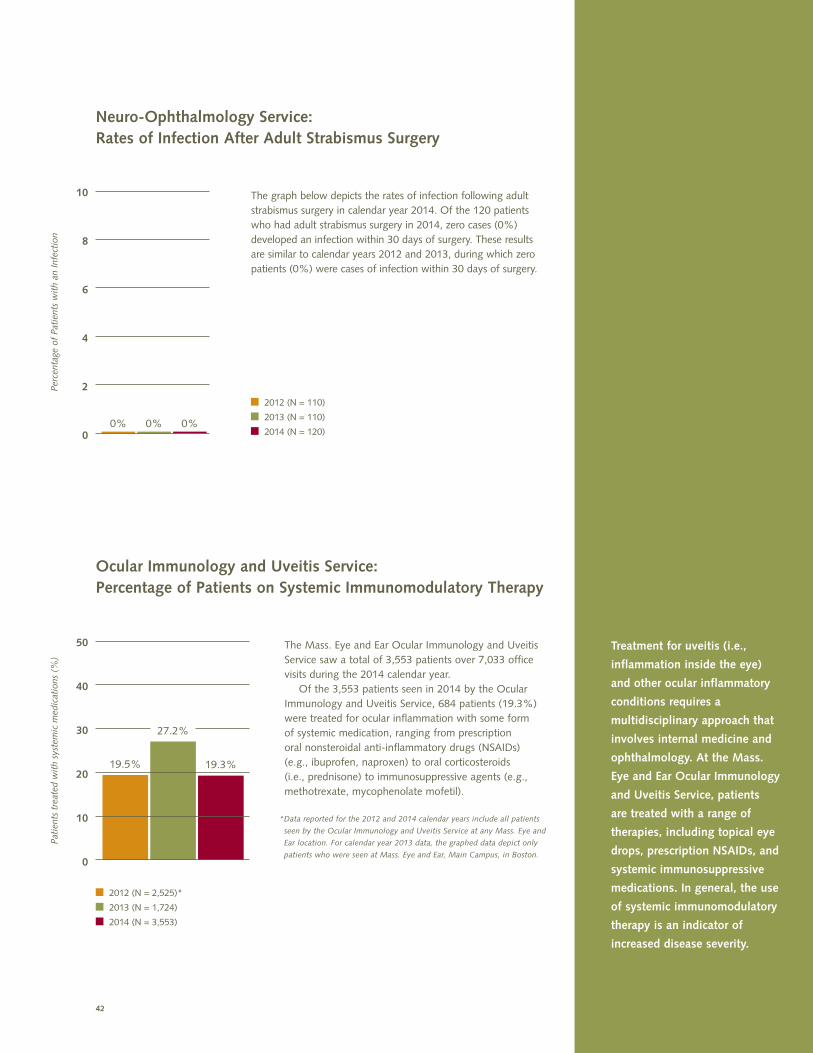
42
Ocular Immunology and Uveitis Service: Percentage of Patients on Systemic Immunomodulatory Therapy
50
40
30
20
10
0
Pati
ents
tre
ated
wit
h sy
stem
ic m
edic
atio
ns (
%)
The Mass. Eye and Ear Ocular Immunology and Uveitis Service saw a total of 3,553 patients over 7,033 office visits during the 2014 calendar year. Of the 3,553 patients seen in 2014 by the Ocular Immunology and Uveitis Service, 684 patients (19.3%) were treated for ocular inflammation with some form of systemic medication, ranging from prescription oral nonsteroidal anti-inflammatory drugs (NSAIDs) (e.g., ibuprofen, naproxen) to oral corticosteroids (i.e., prednisone) to immunosuppressive agents (e.g., methotrexate, mycophenolate mofetil).
* Data reported for the 2012 and 2014 calendar years include all patients
seen by the Ocular Immunology and Uveitis Service at any Mass. Eye and
Ear location. For calendar year 2013 data, the graphed data depict only
patients who were seen at Mass. Eye and Ear, Main Campus, in Boston.
19.5% 19.3%
27.2%
2012 (N = 2,525)*
2013 (N = 1,724)
2014 (N = 3,553)
Treatment for uveitis (i.e.,
inflammation inside the eye)
and other ocular inflammatory
conditions requires a
multidisciplinary approach that
involves internal medicine and
ophthalmology. At the Mass.
Eye and Ear Ocular Immunology
and Uveitis Service, patients
are treated with a range of
therapies, including topical eye
drops, prescription NSAIDs, and
systemic immunosuppressive
medications. In general, the use
of systemic immunomodulatory
therapy is an indicator of
increased disease severity.
Neuro-Ophthalmology Service: Rates of Infection After Adult Strabismus Surgery
10
8
6
4
2
0
Perc
enta
ge o
f Pa
tien
ts w
ith
an In
fect
ion
The graph below depicts the rates of infection following adult strabismus surgery in calendar year 2014. Of the 120 patients who had adult strabismus surgery in 2014, zero cases (0%) developed an infection within 30 days of surgery. These results are similar to calendar years 2012 and 2013, during which zero patients (0%) were cases of infection within 30 days of surgery.
2012 (N = 110)
2013 (N = 110)
2014 (N = 120)0% 0%0%
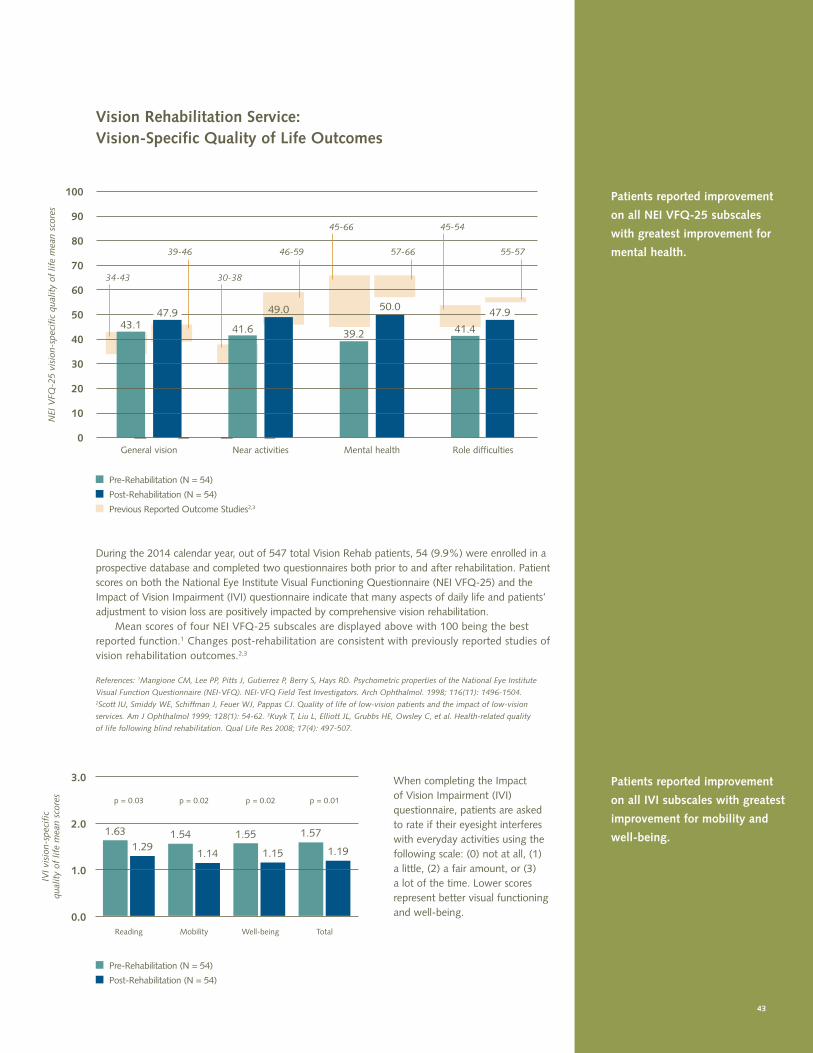
43
Vision Rehabilitation Service: Vision-Specific Quality of Life Outcomes
Patients reported improvement
on all IVI subscales with greatest
improvement for mobility and
well-being.
3.0
2.0
1.0
0.0
IVI v
isio
n-sp
ecif
ic
qual
ity
of li
fe m
ean
scor
es
When completing the Impact of Vision Impairment (IVI) questionnaire, patients are asked to rate if their eyesight interferes with everyday activities using the following scale: (0) not at all, (1) a little, (2) a fair amount, or (3) a lot of the time. Lower scores represent better visual functioning and well-being.
Pre-Rehabilitation (N = 54)
Post-Rehabilitation (N = 54)
Total
p = 0.01
Reading
p = 0.03
Mobility
p = 0.02
Well-being
p = 0.02
1.631.29
1.54
1.14
1.55
1.15
1.57
1.19
During the 2014 calendar year, out of 547 total Vision Rehab patients, 54 (9.9%) were enrolled in a prospective database and completed two questionnaires both prior to and after rehabilitation. Patient scores on both the National Eye Institute Visual Functioning Questionnaire (NEI VFQ-25) and the Impact of Vision Impairment (IVI) questionnaire indicate that many aspects of daily life and patients’ adjustment to vision loss are positively impacted by comprehensive vision rehabilitation. Mean scores of four NEI VFQ-25 subscales are displayed above with 100 being the best reported function.1 Changes post-rehabilitation are consistent with previously reported studies of vision rehabilitation outcomes.2,3
References: 1Mangione CM, Lee PP, Pitts J, Gutierrez P, Berry S, Hays RD. Psychometric properties of the National Eye Institute
Visual Function Questionnaire (NEI-VFQ). NEI-VFQ Field Test Investigators. Arch Ophthalmol. 1998; 116(11): 1496-1504. 2Scott IU, Smiddy WE, Schiffman J, Feuer WJ, Pappas CJ. Quality of life of low-vision patients and the impact of low-vision
services. Am J Ophthalmol 1999; 128(1): 54-62. 3Kuyk T, Liu L, Elliott JL, Grubbs HE, Owsley C, et al. Health-related quality
of life following blind rehabilitation. Qual Life Res 2008; 17(4): 497-507.
100
90
80
70
60
50
40
30
20
10
0
NEI
VFQ
-25
visi
on-s
peci
fic
qual
ity
of li
fe m
ean
scor
es
Pre-Rehabilitation (N = 54)
Post-Rehabilitation (N = 54)
Previous Reported Outcome Studies2,3
General vision Near activities Mental health Role difficulties
43.147.9
41.6
49.0
39.2
50.0
41.4
47.9
Patients reported improvement
on all NEI VFQ-25 subscales
with greatest improvement for
mental health.55-57
45-66 45-54
57-66
30-38
39-46 46-59
34-43
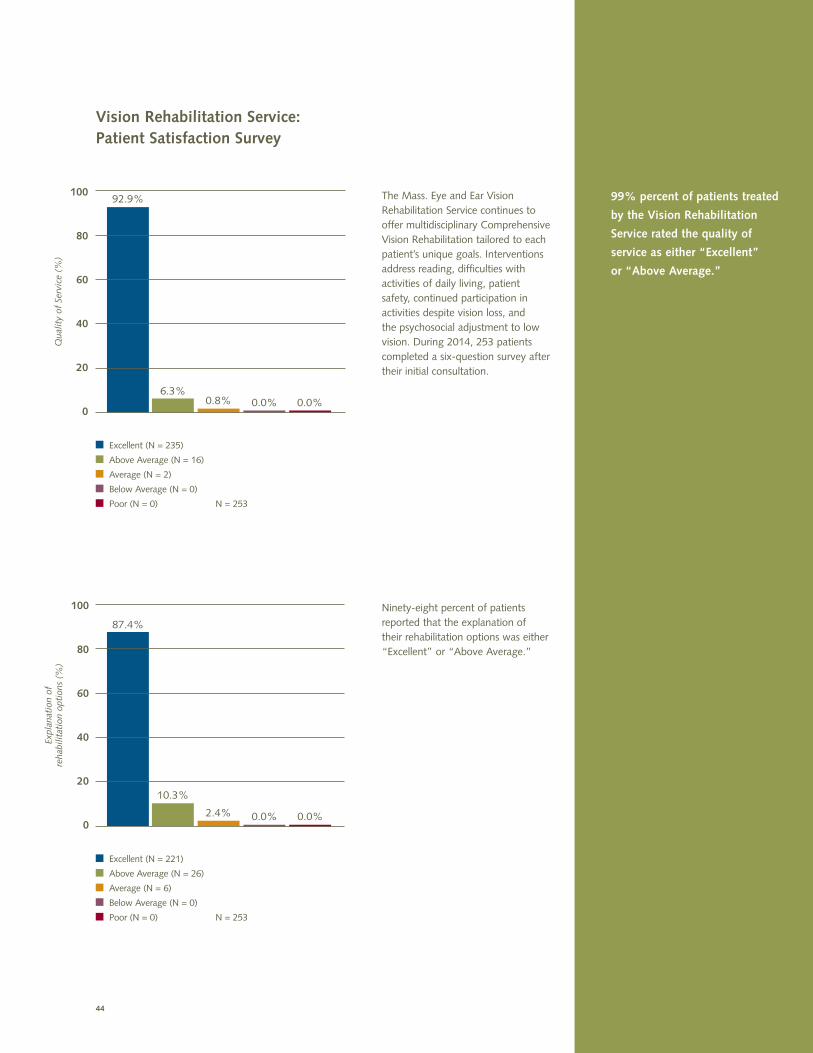
44
100
80
60
40
20
0
Ninety-eight percent of patients reported that the explanation of their rehabilitation options was either “Excellent” or “Above Average.”
Excellent (N = 221)
Above Average (N = 26)
Average (N = 6)
Below Average (N = 0)
Poor (N = 0) N = 253
Expl
anat
ion
of
reha
bilit
atio
n op
tion
s (%
)
87.4%
10.3%
2.4% 0.0% 0.0%
99% percent of patients treated
by the Vision Rehabilitation
Service rated the quality of
service as either “Excellent”
or “Above Average.”
100
80
60
40
20
0
The Mass. Eye and Ear Vision Rehabilitation Service continues to offer multidisciplinary Comprehensive Vision Rehabilitation tailored to each patient’s unique goals. Interventions address reading, difficulties with activities of daily living, patient safety, continued participation in activities despite vision loss, and the psychosocial adjustment to low vision. During 2014, 253 patients completed a six-question survey after their initial consultation.
Excellent (N = 235)
Above Average (N = 16)
Average (N = 2)
Below Average (N = 0)
Poor (N = 0) N = 253
Qua
lity
of S
ervi
ce (
%)
92.9%
6.3%0.8% 0.0% 0.0%
Vision Rehabilitation Service: Patient Satisfaction Survey
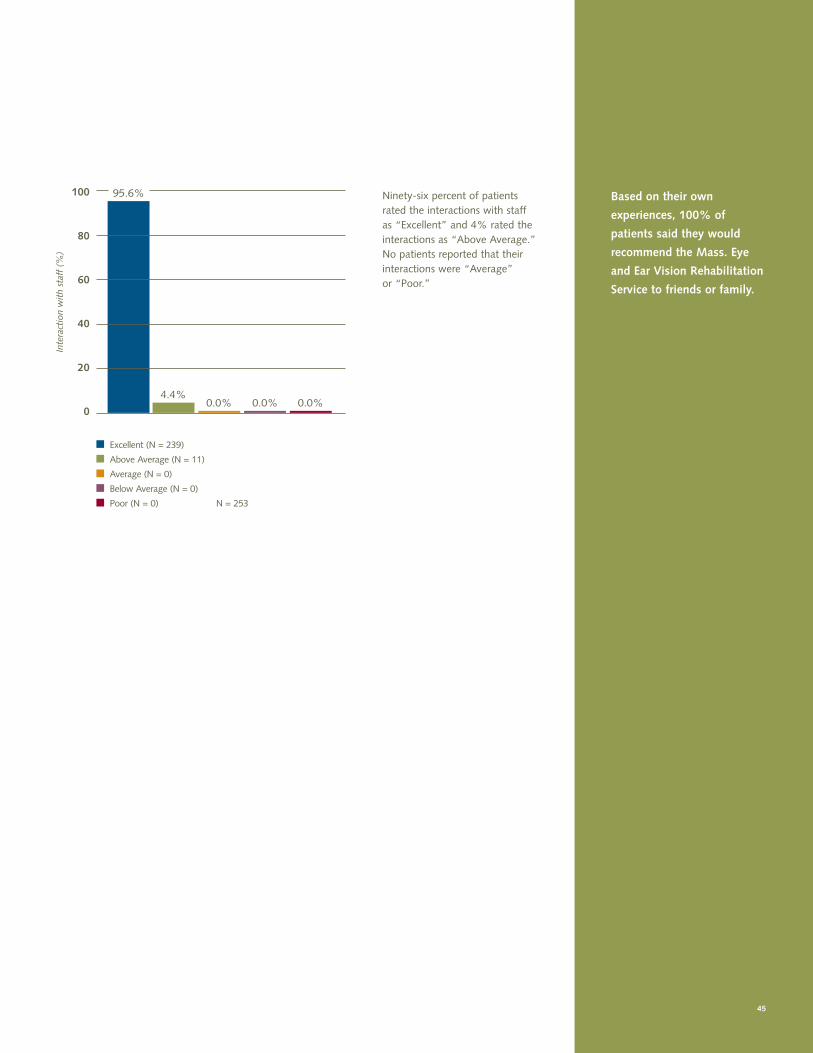
100
80
60
40
20
0
Excellent (N = 239)
Above Average (N = 11)
Average (N = 0)
Below Average (N = 0)
Poor (N = 0) N = 253
Ninety-six percent of patients rated the interactions with staff as “Excellent” and 4% rated the interactions as “Above Average.” No patients reported that their interactions were “Average” or “Poor.”
Inte
ract
ion
wit
h st
aff
(%)
95.6%
4.4%0.0% 0.0% 0.0%
45
Based on their own
experiences, 100% of
patients said they would
recommend the Mass. Eye
and Ear Vision Rehabilitation
Service to friends or family.
Ophthalmology Medical Staff and Practice Locations
Locations
Mass. Eye and Ear, Main Campus
243 Charles Street
Boston, MA 02114
Tel: 617-573-3202
Mass. Eye and Ear, East Bridgewater
400 N. Bedford Street
E. Bridgewater, MA 02333
Tel: 508-378-2058
Site Director, Angela Turalba, MD
Mass. Eye and Ear, Longwood
800 Huntington Ave.
Boston, MA 02115
Tel: 617-398-2947
Clinical Director of Ophthalmology,
Carolyn E. Kloek, MD
Mass. Eye and Ear, Plainville
30 Man Mar Drive Suite 2
Plainville, MA 02762
Tel: 508-695-9550
Site Director, Magdalena Krzystolik, MD
Mass. Eye and Ear, Providence
One Randall Square Suite 203
Providence, RI 02904
Tel: 401-453-4600
Site Director, Magdalena Krzystolik, MD
Mass. Eye and Ear, Stoneham
1 Montvale Avenue
Stoneham, MA 02180
Tel: 781-279-4418
Site Director, Matthew F. Gardiner, MD
Mass. Eye and Ear, Retina Consultants
3 Woodland Road Suite 210
Stoneham, MA 02180
Tel: 781-662-5520
Site Director, Deeba Husain, MD
Mass. Eye and Ear, Waltham
1601 Trapelo Road
Reservoir Place, Ste. 184
Waltham, MA 02451
Tel: 781-890-1023
Site Director, Kathryn M. Hatch, MD
Comprehensive Ophthalmology
and Cataract Consultation
Sheila Borboli-Gerogiannis, MD
Stacey C. Brauner, MD
Han-Ying Peggy Chang, MD
Sherleen H. Chen, MD, Service Director
Matthew F. Gardiner, MD
Scott H. Greenstein, MD
Kathryn M. Hatch, MD
Carolyn E. Kloek, MD
Kristine Tan Lo, MD
Alice C. Lorch, MD
Zhonghui Katie Luo, MD, PhD
George N. Papaliodis, MD
Christian E. Song, MD
Ryan A. Vasan, MD
Silas Wang, MD
Cornea and External Disease
Sheila Borboli-Gerogiannis, MD
Han-Ying Peggy Chang, MD
James Chodosh, MD, MPH, Associate
Service Director
Joseph B. Ciolino, MD
Reza Dana, MD, MSc, MPH, Service Director
Claes H. Dohlman, MD, PhD
Kathryn M. Hatch, MD
Deborah S. Jacobs, MD
Ula V. Jurkunas, MD
Zhonghui Katie Luo, MD, PhD
Samir A. Melki, MD, PhD
Roberto Pineda II, MD
Hajirah N. Saeed, MD
Jonathan Talamo, MD
Peter B. Veldman, MD
Emergency Ophthalmology &
Eye Trauma, Emergency Department
Matthew F. Gardiner, MD, Service Director
Maggie B. Hymowitz, MD
Eye Trauma Appointments
Seanna Grob, MD, Service Director
46
47
Glaucoma
Teresa C. Chen, MD
Iryna A. Falkenstein, MD
Cynthia L. Grosskreutz, MD, PhD
Ambika S. Hoguet, MD
Milica Margeta, MD, PhD
Louis R. Pasquale, MD, Service Director
Veena Rao, MD, MSc
Lucy Q. Shen, MD
Brian J. Song, MD
Angela V. Turalba, MD, Associate
Service Director
Janey L. Wiggs, MD, PhD
Neuro-Ophthalmology
and Adult Strabismus
Dean M. Cestari, MD
John W. Gittinger, Jr., MD
Robert Mallery, MD
Joseph F. Rizzo III, MD, Service Director
Ocular Oncology
Suzanne K. Freitag, MD
Evangelos S. Gragoudas, MD
Frederick A. Jakobiec, MD, DSc
Ivana K. Kim, MD
Nahyoung Grace Lee, MD
Shizuo Mukai, MD
Francis Sutula, MD
Michael K. Yoon, MD
Ophthalmic Pathology
Thaddeus P. Dryja, MD
Frederick A. Jakobiec, MD, DSc,
Service Director
Rebecca C. Stacy, MD, PhD,
Associate Director
Ophthalmic Plastic Surgery
Suzanne K. Freitag, MD, Service Director
Nahyoung Grace Lee, MD
Daniel R. Lefebvre, MD
Francis C. Sutula, MD
Michael K. Yoon, MD
Optometry/Contact Lens
Mark M. Bernardo, OD
Shannon Bligdon, OD
Matt Goodman, OD
Yan Jiang, OD, PhD
Charles D. Leahy, OD, MS
Brittney J. Mazza, OD
Amy Scally, OD
Amy C. Watts, OD, Service Director
Karen L. Zar, OD
Vision Care for the Deaf
Andrew D. Baker, OD
Pediatric Ophthalmology and Strabismus
(in collaboration with
Boston Children’s Hospital)
Anna Maria Baglieri, OD
Kimberley Chan, OD
Linda R. Dagi, MD
Bharti Gangwani, MD
Gena Heidary, MD, PhD
Melanie A. Kazlas, MD,
Service Director, Mass. Eye and Ear
Danielle M. Ledoux, MD
Jason Mantagos, MD
Robert A. Petersen, MD, DMSc
Ankoor S. Shah, MD, PhD
Mary C. Whitman, MD, PhD
Carolyn S. Wu, MD, PhD
Refractive Surgery
Kathryn M. Hatch, MD
Ula V. Jurkunas, MD
Zhonghui Katie Luo, MD, PhD
Samir A. Melki, MD, PhD
Roberto Pineda II, MD, Service Director
Hajirah N. Saeed, MD
Christian E. Song, MD
Retina
Jason I. Comander, MD, PhD
Dean Eliott, MD, Associate
Service Director
Evangelos S. Gragoudas, MD, Service Director
Paul B. Greenberg, MD
Rachel Huckfeldt, MD, PhD
Deeba Husain, MD
Ivana K. Kim, MD
Leo A. Kim, MD, PhD
Magdalena Krzystolik, MD
Jan A. Kylstra, MD
John I. Loewenstein, MD
Joan W. Miller, MD
John B. Miller, MD
Shizuo Mukai, MD
Eric A. Pierce, MD, PhD
Lucia Sobrin, MD, MPH
Demetrios G. Vavvas, MD, PhD
Richard Watson, MD
David M. Wu, MD, PhD
Yoshihiro Yonekawa, MD
Lucy H. Y. Young, MD, PhD
Inherited Retinal Disorders
Jason I. Comander, MD, PhD
Brian Hafler, MD, PhD
Rachel Huckfeldt, MD, PhD
Eric A. Pierce, MD, PhD, Service Director
Uveitis and Immunology
Reza Dana, MD, MSc, MPH
George N. Papaliodis, MD, Service Director
Lucia Sobrin, MD, MPH
Lucy H. Y. Young, MD, PhD
Vision Rehabilitation
Calliope Galatis, OD
Kevin E. Houston, OD
Amy Watts, OD, Service Director
Contributors
Elizabeth Acosta
Olumuyiwa Adebona
Shakhsanam Aliyeva
Bilal Alwattar
John Anderson
Christopher Andreoli
Olamide Awosanya
Sandra Baptista-Pires
Patricia Barthelemy
Linda Belkner
Cobi Ben-David
Jean Bibeau
Bridget Boles
Sheila Borboli-Gerogiannis
Stacey Brauner
Monica Bynoe
Chris Buliga
Charlene Callahan
Joel Carusone
Dean Cestari
Kenneth Chang
Peggy Chang
Wendy Chao
Yewlin Chee
Sherleen Chen
Teresa Chen
Sal Chiev
James Chodosh
Catherine Choi
Jonathan Chou
Bo Young Chun
Janet Cohan
Louise Collins
Lisa Cowan
Greta Covino
Deborah Cronin-Waelde
Linda Dagi
Reza Dana
Mindy Davis
Suzanne Day
Sandy DeCelle
Peter Delisle
April Dobbs
Claes Dohlman
Erica Donadio
Anne Marie Donnelly
Marlene Durand
Dean Eliott
Tobias Elze
Kimberly Farwell
Tanya Fedyshyn
Joan Feltman
Ashley Femino
John Fernandez
Ruben Fernandez
Cherie Florio
Jenna Forgione
Leila Foster
Martha Fraser
Suzanne Freitag
Sandra Gallagher
Matthew Gardiner
Elizabeth Garlo
Sharyn Ghiloni
Amanda Goggin
Evangelos Gragoudas
Scott Greenstein
Kathryn Hatch
Leo Hill
Fariba Houman
David Hunter
Deeba Husain
Mary-Lou Jackson
Maryann Jerrier
Yan Jiang
Grace Jonak
Ula Jurkunas
Justin Kanoff
Melanie Kazlas
Diane Keogh
Ivana Kim
Leo Kim
Carolyn Kloek
Magdalena Krzystolik
Anne Marie Lane
Mary Leach
Eliza-Eve Leas
Daniel Lefebvre
Kathleen Lennon
Olga Levy
Patricia Li
Michael Lin
Ann-Marie Lobo
John Loewenstein
Peter Lok
Alice Lorch
Migdali Lorenzo
Cara Ludwick
Pedro Lugo
Katie Luo
Christina Marko
Joe Marshall
Maureen Martinez
Kathy McCormack
Fran McDonald
Lisa McLellan
Samir Melki
Joan Miller
John Miller
Alfred Minincleri
Nicolas Moretti
Scot Morrison
Anne Murphy
Michael Navetta
Sheelagh Nelis-Swain
Toni Nuzzo
Bob O’Hare
Sheila O’Keefe
George Papaliodis
Louis Pasquale
Eric Pierce
Roberto Pineda
Corinne Powers
Suzette Profio
Andrew Rabkin
Michael Reinhart
Mike Ricci
Debbie Rich
Joseph Rizzo
Marsha Robinson
Alexandra Rondan
Debra Rogers
Barbara Ruchie
Charles Ruberto
Mary Savell
Samuel Scott
Barbara Scully
Alexandra Selivanova
Lucia Sobrin
Brian Song
Ravichandran Srinivasan
Jennifer Street
Christopher Taylor
Helen Todisco
Debra Trocchi
Angela Turalba
Edem Tsikata
Joseph Vadakekalam
Peter Veldman
Christina Venditti
Merideth Vida
Kenny Vien
Rhonda Walcott-Harris
Jay Wang
Suzanne Ward
Amy Watts
Lauren Winter
Julia Wong
Emily Woodcock
Janet Yedziniak
Lucy Young
Research Fellow:
Jing Zhang, M.D.
Study Coordinators:
Laura D’Amico
Madeline Freeman
Medical illustrations by:
Laurel Cook Lhowe
Graphic Design by:
Marc Harpin, Rhumba
48


243 Charles Street
Boston, MA 02114-3096
617-523-7900
617-523-5498 (T.D.D.)
MassEyeAndEar.org