Embed Size (px)
Citation preview

2020 Vision for Culturally Responsive Classrooms through Tribal Consultation
(Our Land, Our Stories, Our Future)
State Advisory Council on Indian Education | Report to the North Carolina State Board of Education
In Pursuit of Educational Excellence for All American Indian Students in North Carolina
APRIL 2020

THE STATE ADVISORY COUNCIL ON INDIAN EDUCATION: BACKGROUND AND MEMBERSHIP
The State Advisory Council on Indian Education advocates collectively on behalf of American Indian students; examines the applicability of state and national trends in Indian education; collaborates with education practitioners, including the Title VI-IEA administrators; and re-examines its mission and goals as school reform initiatives steer the direction of the public school system in North Carolina. Council membership is comprised of parents of American Indian students in K-12 public schools, K-12 American Indian educators, representatives from both houses of the North Carolina General Assembly, the University of North Carolina Board of Governors, and the North Carolina Commission of Indian Affairs.
JIM DAVIS State Senator, District 50
CHARLES GRAHAM House Representative, District 87
CONNIE HARLAND North Central Region
REAH JACOBS Sandhills/South Central Region
GWENDOLYN JONES Piedmont Region
KAMIYO LANNING Western Region
ALICIA LEYVA Sandhills/South Central Region
DR. CONNIE LOCKLEAR Sandhills/South Central Region
DR. TIFFANY LOCKLEAR Southeast Region
DR. LARONDA LOWERY Sandhills/South Central Region
WILL PAUL North Central Region
TIFFANY PEARSON Sandhills/South Central Region
ANGELIA RICHARDSON North Central Region
DOROTHY STEWART YATES Piedmont Triad Region
RONDA WATKINS Piedmont Triad Region
DR. OLIVIA OXENDINE, SBE LiaisonDR. SUSAN SILVER, NCDPI LiaisonDR. KELLI BRIGGS, NCDPI Support Staff
NC DEPARTMENT OF PUBLIC INSTRUCTIONMark Johnson, State Superintendent / 301 N. Wilmington Street / Raleigh, North Carolina 27601-2825
In compliance with federal law, the NC Department of Public Instruction administers all state-operated educational programs, employment activities and admissions without discrimination because of race, religion, national or ethnic origin, color, age, military service, disability, or gender, except where exemption is appropriate and allowed by law.
Inquiries or complaints regarding discrimination issues should be directed to:Joe Maimone, Chief of Staff 6307 Mail Service Center, Raleigh, NC 27699-6307 / Phone: (919) 807-3431 / Fax: (919) 807-3445
Visit us on the Web: www.ncpublicschools.org 1219
STATE BOARD OF EDUCATIONSTATE BOARD OF EDUCATION VISION: Every public school student in North Carolina will be empowered to accept academic challenges, prepared to pursue their chosen path after graduating high school, and encouraged to become lifelong learners with the capacity to engage in a globally-collaborative society.
STATE BOARD OF EDUCATION MISSION: The mission of the North Carolina State Board of Education is to use its constitutional authority to guard and maintain the right of a sound, basic education for every child in North Carolina Public Schools.
ERIC DAVISChair: Charlotte – At-Large
ALAN DUNCANVice Chair: Greensboro – Piedmont-Triad Region
DAN FORESTLieutenant Governor: Raleigh – Ex Officio
DALE FOLWELLState Treasurer: Raleigh – Ex Officio
MARK JOHNSONSecretary to the Board – Raleigh
JILL CAMNITZGreenville – Northeast Region
REGINALD KENANRose Hill – Southeast Region
AMY WHITEGarner – North Central Region
OLIVIA OXENDINELumberton – Sandhills Region
JAMES FORDCharlotte – Southwest Region
TODD CHASTEENBlowing Rock – Northwest Region
DONNA TIPTON-ROGERSBrasstown – Western Region
J. WENDELL HALLAhoskie – At-Large
J.B. BUXTONRaleigh – At-Large
Visit us on the Web: www.dpi.nc.gov
3
Acknowledgements ..................................................................................................................................... 4
Letter From the SACIE Chairperson ............................................................................................................. 5
PART I: Executive Summary and Recommendations .................................................................................. 6
• Legislative Requirement
• Public School Enrollment Data
• State-level Findings
• Recommendations
PART II: Discussion of State and LEA Findings ...........................................................................................8
STATE FINDINGS: AMERICAN INDIAN STUDENT PERFORMANCE
Elementary and Middle School ..................................................................................................... 11
• End-of-Grade (EOG) Reading and Math (Grades 3-8 Combined)
High School ...................................................................................................................................12
• End-of-Course (EOC)
• 4-Year Cohort Graduation and Annual Dropout Rates
• Advanced Placement (AP) and SAT
• ACT College Admission Assessment
• Discipline Data
LEA FINDINGS: AMERICAN INDIAN STUDENT PERFORMANCE
American Indian Student Performance by LEA or Charter School (alphabetically listed) .............. 17
• End-of-Grade Results
• End-of-Course Results
• 4-Year Cohort Graduation and Annual Dropout Rates
• Advanced Placement (AP) and SAT
• ACT College Admission Assessment
References ............................................................................................................................................... 61
Appendices
Appendix A: The Elementary and Secondary Education Act: Title VI – Indian, Native Hawaiian, and Alaska Native Education ........................................................62
Appendix B: Legislative History of the Indian Education Act of 1972 .................................................63
Appendix C: Title VI – The Indian Education Act in North Carolina: A Brief Description ......................64
Appendix D: Title VI – Indian Education Grantees in North Carolina ...................................................65
Appendix E: Title VI – Student Eligibility Certification (506 Form) .......................................................66
Appendix F: American Indian Tribes and Urban Organizations in North Carolina ................................67
Appendix G: Definition of Terms .........................................................................................................68
Appendix H: American Indian Mascot Update ....................................................................................71
Appendix I: Data Notes .......................................................................................................................72
North Carolina Tribes and Title VI Grantee Counties ................................................... Inside Back Cover
TABLE OF CONTENTS

4
ACKNOWLEDGEMENTSA special note of gratitude is extended to the following individuals whose perspectivesand information have added value to this annual report.
Photos
Ivan Richardson (Haliwa-Saponi)
Fotoworkx by Ivan Studio
Dr. Connie Locklear (Lumbee), Title VI Director, Public Schools of Robeson County
Gwendolyn Jones, SACIE Member (SACIESummit)
Higher Education
Dr. Olivia Oxendine, Associate Professor, School Administration and Counseling, UNC Pembroke
Department of Public Instruction
Josh Lees, Graphic Artist, Communications and Information
Swetha Pamulaparthy, Analysis and Reporting, Accountability Services
Dr. Susan Silver, Instructional Review Coach Support Administrator, District and Regional Support
Dr. Kelli Briggs, Instructional Review Coach, District and Regional Support
External Agencies
North Carolina Commission of Indian Affairs

5
“Tell me and I’ll forget. Show me, and I may not remember. Involve me, and I’ll understand” — Native American Proverb
As Chairwoman of the State Advisory Council on Indian Education (SACIE), it is my honor to present the SACIE Report, 2020 Vision for Culturally Responsive Classrooms Through Tribal Consultation: (Our Land, Our Stories, Our Future). This year’s theme emphasizes the importance of culturally responsive instruction in all classrooms and the Every Student Succeeds Act (ESSA) mandate, which requires tribal consultation and meaningful collaboration. We believe when curriculum is connected to our land and our stories, then our students will be successful, for they are our future. The report consists of educational data for American Indian students as well as their counterparts in order to see where the gaps exist; it also highlights the work of SACIE.
This past year, SACIE sponsored the North Carolina Educational Summit in Greensboro, NC which consisted of State Board of Education members, North Carolina Department of Public Instruction, SACIE, the Executive Director of the National Indian Education Board, a Representative from the U.S. Department of Education, Tribal Leaders, District Leaders, students, and community leaders. The focus of this year’s summit was Tribal Consultation and Meaningful Collaboration. According to attendees, the event was informative and provided additional information for both tribal communities as well as district leaders. Because of ESSA, districts are required to have meaningful, active, ongoing, and timely collaboration with tribal communities in reference to educational opportunities for the American Indian student.
I have had the pleasure to serve on SACIE for the past four years and my term ends this year. The opportunity to impact American Indian students across our state has been one of the climaxes of my professional career and I have taken this role very seriously. I will always remember my time with this council and each member has affected my life for the better. According to a Native American proverb, “We will be known forever by the tracks we leave; “ my prayer is that I have left some positive tracks behind at SACIE. Although my term is ending, my participation in SACIE is not. I will continue to attend the SACIE meetings because I believe this council will continue to push for educational equity for our American Indian children.
Thank you for allowing me to serve on the council and as your Chairwoman.
Warm regards,
Connie Locklear, Ed.D
LETTER FROM THE SACIE CHAIRWOMAN

6 | Source: Division of Accountability Services, NC Department of Public Instruction, 2019
This is the annual report of the State Advisory Council on Indian Education to the State Board of Education. As legislatively mandated, via this report, the Council is presenting a summary of American Indian student performance outcomes in specified areas and recommendations to improve academic achievement.
Legislative Requirement
In 1988, the State Board of Education (SBE) adopted an Indian Education policy to identify Indian Education issues in grades K-12. In that same year, the North Carolina General Assembly enacted Article 13A (NCGS § 115C-210 et seq.) that established the State Advisory Council on Indian Education (SACIE) to advocate on behalf of American Indian students in North Carolina. In 2015, the NC General Assembly enacted SECTION 1. of NCGS § 115C-210.1 to modify the membership composition of the State Advisory Council on Indian Education. The 15-member SACIE board consists of five parents of American Indian students enrolled in K-12 public schools, including charter schools, and five American Indian K-12 public school educators. One of these members shall be a Title VI director or coordinator, to be appointed by the State Board of Education, members of the North Carolina Senate and House of Representatives, members from the UNC Board of Governors, and the North Carolina Commission of Indian Affairs (NCCIA).
The law (NCGS § 115C-201.4) requires the Council to submit to the SBE an annual report of performance outcomes and related recommendations about the achievement of American Indian students in grades K-12. Each finding in this report compares American Indian student performance with three peer groups: 1) White, 2) Black, and 3) Hispanic, except in the state-level findings where the highest performing subgroup and American Indians are compared. It is important to note that a rating of “proficiency” means that students are performing “at or above” grade level. Conversely, “non-proficient” means that student performance falls below grade level. Teachers, principals, and parents are advised to consider all performance percentages.
Public School Enrollment Data
As of the 2018-19 academic year, the total enrollment of American Indian/Alaskan Native (AI/AN) students in North Carolina’s public schools was 17,782 (NC Department of Public Instruction, 2019). Of this number, 14,435 students were enrolled in 18 school districts that receive funding through the Title VI Indian Education Act (IEA) of 1972 (see Appendices A, B, C and D). One district, Hertford County, is not a Title VI grantee but does enroll Indian students of the Meherrin Tribe. This report provides performance data of all students self-identified as American Indian/ Alaskan Native to include those served by Title VI programs. Enrollment data is based on the final Average Daily Membership (ADM) reported by the LEA for the 2018-19 school year.
PART I: Executive Summary and Recommendations
FIGURE 1: Percentage of North Carolina American Indian Students Enrolled in the IEA Cohort vs. the Non-IEA Cohort
Non-IEA Cohort3,347 or 18.8%
IEA Cohort14,435 or 81.2%
Source: Division of Accountability Services, NC Department of Public Instruction, 2019

7Source: Division of Accountability Services, NC Department of Public Instruction, 2019 |
State-level Findings
The table below compares academic performance of American Indian students to that of White students in five academic areas. Also included are data on the four-year cohort graduation and dropout rates. These outcomes are for students attending the 18 Title VI school districts and Hertford County Schools. Federal schools are not included in this report for 2018-19.
Data Comparisons American Indian Students White Students Difference
(Percentage Points)
EOG Reading 42.3% 70.4% 28.1
EOG Math 44.2% 70.9% 26.7
EOC Math I 35.7% 52.7% 17.0
EOC English II 46.1% 71.5% 25.4
EOC Biology 46.9% 72.1% 25.2
Four Year Cohort Graduation Rate 81.2% 89.6% 8.4
Dropout Rate 3.05% 1.62% 1.43
Recommendations
The North Carolina State Advisory Council on Indian Education (SACIE) recommends that the NCDPI work closely with school districts and Title VI Indian Education coordinators to implement the following recommendations:
1. Strongly encourage schools that enroll American Indian students who are underperforming academically to review and analyze data from the annual SACIE report. Following review, develop culturally responsive goals, activities, resources and educational best practices that specifically address the academic disparities of American Indian students in the school improvement plans they are required to develop under G.S.§ 115C-105.27.
2. Ensure every American Indian student in North Carolina public schools has access to highly qualified, culturally responsive educators every day to ensure equitable learning opportunities and sustainable academic growth.
3. Strongly encourage all NC Department of Public Instruction staff and all NC educators, specifically those who support districts and schools with American Indian populations, to be aware of American Indian tribes in NC, their history, and their culture. These educators should also have knowledge of all available instructional resources to support the academic growth of American Indian students. These resources include, but are not limited to, collaborating with NC American Indian tribes, organizations, or Indian education programs to receive training or consultation and/or requiring them to review the current SACIE Report and educational resources available through the Culturally Responsive Teaching about American Indians Self-paced Module in connection with NC Teaching Standard II.
4. Encourage all schools to become knowledgeable of and promote the teaching and celebration of American Indian cultures, languages, and histories throughout the school year, including but not limited to the celebration of American Indian Heritage Month.
5. Ensure the current annual SACIE Report, 2020 Vision for Culturally Responsive Classrooms through Tribal Consultation (Our Land, Our Stories, Our Future) in North Carolina, is widely disseminated across school districts and shared with external stakeholders. In addition, the current report should be posted on the websites of all schools and districts that serve American Indian students.
6. Strongly encourage district leaders to include American Indian Education Directors and Coordinators at district-wide leadership meetings and strongly encourage meaningful collaboration and tribal consultation as outlined by ESSA (meaningful, timely, active, and ongoing).

8 | Source: Division of Accountability Services, NC Department of Public Instruction, 2019
Interpreting the Findings
The 2018-19 edition of the State Advisory Council on Indian Education Report consists of state-level and district-level achievement profiles. It is intended to inform educators, policymakers, parents, and tribal communities about the annual progress of American Indian students in critical areas of school success across North Carolina. In this report, the academic achievement of American Indian students is profiled for the state and each of the Title VI school districts and one additional district in the following assessment categories:
1) End-of-Grade (EOG) Reading (grades 3-8 combined)2) End-of-Grade (EOG) Math (grades 3-8 combined)3) End-of-Course (EOC) Math I4) End-of-Course (EOC) Biology5) End-of-Course (EOC) English II6) Cohort Graduation Rate (CGR)7) Dropout Rate, grades 9-138) Scholastic Aptitude Test (SAT)9) American College Test (ACT)
10) Advanced Placement (AP)11) Short Term Suspension
Three years of data have been provided for each assessment. Beginning in 2013-14, five achievement levels were reported instead of four levels in the previous year. For more details, see the 2012-13 READY Accountability Background Brief at http://www.ncpublicschools.org/accountability/reporting/.
The cohort graduation rate, SAT data, and AP data in the state and district profiles are provided for three years: 2016-17, 2017-18, and 2018-19. This report highlights a three-year data trend to align with the critical transition period for the physical, emotional, and cognitive development of students in the upper elementary grades (grades 3-5) through middle school (grades 6-8). This point is particularly relevant, given research that supports a stage-theory approach for students, especially minority and disadvantaged students.
End-of-Grade (EOG) and End-of-Course (EOC) Data
Students who have a solid or superior command of course content are on target for a career-and-college ready path, have met the proficiency standard, and are performing “at or above grade level.” To meet the proficiency standard or to perform at or above grade level, students must attain Achievement Level 3, Achievement Level 4 or Achievement Level 5 on the EOG and EOC assessments. Students who score at Achievement Level 3 are prepared for the next grade but do not meet the career-and-college readiness standard. Students who score at Achievement Level 1 or Achievement Level 2, or Achievement Level Not Proficient (for math), have not met the proficiency standard and are not on a trajectory to be career-and-college ready.
The single year of data in the tables and figures for EOG reading, Biology, and English II indicate the percentage of students who performed at or above Achievement Level 3 in 2018-19. The achievement level descriptors for 2018-19 are:
• Achievement Level 1: Students performing at this level have limited command of the knowledge and skills contained in the SBE-adopted ELA content standards and the NC Essential Standards for Science assessed at their grade level and will need academic support to engage successfully in this content area.
• Achievement Level 2: Students performing at this level have partial command of the knowledge and skills contained in the SBE-adopted ELA content standards and the NC Essential Standards for Science assessed at their grade level and will likely need academic support to engage successfully in this content area.
PART II: Discussion of State and LEA Findings

9Source: Division of Accountability Services, NC Department of Public Instruction, 2019 |
• Achievement Level 3: Students performing at this level have a sufficient command of grade-level knowledge and skills contained in the SBE-adopted ELA content standards and the NC Essential Standards for Science assessed at their grade level, but they may need academic support to engage successfully in the content area in the next grade level.
• Achievement Level 4: Students performing at this level have solid command of the knowledge and skills contained in the SBE-adopted ELA content standards and the NC Essential Standards for Science assessed at their grade level and are academically prepared to engage successfully in the content area.
• Achievement Level 5: Students performing at this level have superior command of the knowledge and skills contained in the SBE-adopted ELA content standards and the NC Essential Standards for Science assessed at their grade level and are academically well-prepared to engage successfully in the content area.
The achievement levels for EOG mathematics, Math I, and Math III were changed during the 2018-19 school year. The achievement level descriptors for 2018-19 are:
• Achievement Level Not Proficient: Students who are Not Proficient demonstrate inconsistent understanding of grade level content standards and will need support.
• Achievement Level 3: Students at Level 3 demonstrate sufficient understanding of grade level content standards, though some support may be needed to engage with content at the next grade/course.
• Achievement Level 4: Students at Level 4 demonstrate a thorough understanding of grade level content standards and are on track for career and college.
• Achievement Level 5: Students at Level 5 demonstrate comprehensive understanding of grade level content standards, are on track for career and college, and are prepared for advanced content at the next grade/course.
For example, if 57 percent of American Indian students performed at Achievement Level 3 or above in a given subject, this percentage of students was “proficient” in that subject. Conversely, the 43 percent of students who performed below grade level were not proficient in the same subject.
More detailed information regarding the achievement levels for the EOG and EOC assessments may be found at https://www.dpi.nc.gov/data-reports.
Cohort Graduation Rate
In July 2005, all 50 states signed the National Governors Association’s Graduation Counts Compact on State High School Graduation Data. In the compact, governors agreed to take steps to implement a standard, four-year adjusted cohort graduation rate. North Carolina’s four-year cohort graduation rate reflects the percentage of ninth graders who graduated from high school four years later. The five-year cohort graduation rate, not referenced in this report, reflects the percentage of ninth graders who graduated from high school five years later. The three years of data in the figures and tables for the cohort graduation rate reflect the cohort percentage of students, by race and gender, who graduated with a regular diploma in four years or less.
Dropout Rate
North Carolina General Statute 115C-12(27) requires the compilation of an annual report of students in the state dropping out of schools. Dropouts are reported for each district and charter school in the state, and “event dropout rates” are computed. The three years of dropout data in the state and district profiles show the percentage of students in grades 9-12, by race, and by race and gender, who dropped out between 2017 and 2019.
SAT
The three-year trend of SAT data and district profiles shows the participation rates and the mean total SAT scores of graduating seniors from 2016-17 to 2018-19. SAT performance is compared at the state, district and subgroup levels.

10 | Source: Division of Accountability Services, NC Department of Public Instruction, 2019
Advanced Placement (AP)
The three-year trend of AP data and district profiles shows the participation rates and the percentages of AP test takers in grades 9-12 who scored a Level 3 or higher from 2017 to 2019. Additional details regarding these assessments, and special abbreviations and notations, may be found in the Data Notes section of Appendix I.
ACT
The ACT college admissions assessment is given to all students in the 11th grade and the ACT WorkKeys assessment is administered to seniors who are Career and Technical Education (CTE) concentrators. Beginning in 2012-13, the ACT and the ACT WorkKeys became part of North Carolina’s school accountability program. In order to support student success on the ACT, North Carolina administers the ACT Plan assessment at 10th grade. ACT Plan is a diagnostic assessment that predicts future performance on the ACT. It also provides information to help parents, teachers, and students determine future goals. ACT scores can range from a score of 1 to a max score of 36. The overall ACT test score is the average of scores (also 1-36) in the English, Math, Reading, and Science sections of the test.
Racial/Ethnic Subgroups
As a way to compare the rates of academic achievement, this report presents achievement data for the following subgroups: 1) American Indian; 2) White; 3) Black; and 4) Hispanic.
Cultural Information
There are eight American Indian tribes located in North Carolina that hold membership on the NC Commission of Indian Affairs. Under the Dawes Act of 1887, the Eastern Band of Cherokee Indians was incorporated with the state of North Carolina as a sovereign entity. Therefore, the Cherokee Tribe is both state and federally recognized. The Lumbee Tribe of North Carolina is also state and federally recognized. The Lumbee were recognized by the federal government under the “Lumbee Act of 1956” in name only. As per NCGS 143B-704, eight Indian tribes and four Urban Indian Associations hold membership on the NC Commission of Indian Affairs. Chapter 71A of the North Carolina General Statutes provides summary of the Indian tribes recognized by the state of North Carolina (see Appendix F). As part of each profile, attention is given to the major American Indian tribes represented in the statewide student population. In some cases, however, no specific tribes are mentioned, mainly because the variety is too extensive to capture in this report (NC Department of Administration, Commission of Indian Affairs, 2015).
Using the Findings
Because the enrollment of American Indians in most school districts is comparatively small, conclusions drawn from the data should be reached carefully and weighed against other evidence, including local assessments such as nine-week grades, daily classroom progress, and other teacher-administered assessments. Nevertheless, because it is safe to conclude that American Indian students, for the most part, are performing below grade level in reading and math, extra effort must be made to increase achievement in these areas. In some districts, the level of low achievement rightly justifies the need for ongoing and intensive intervention. The State Advisory Council on Indian Education strongly encourages educators to continue collecting and reviewing achievement data and monitoring the impact of instructional strategies and approaches on American Indian students in classroom settings.

11Source: Division of Accountability Services, NC Department of Public Instruction, 2019 |
0
10
20
30
40
50
60
70
80
90
100
Hispanic
Black
White
A.Indian
State
2018-192017-182016-17
>95
0
10
20
30
40
50
60
70
80
90
100
Hispanic
Black
White
A.Indian
State
2018-192017-182016-17
>95
EOG: Reading and Math
American Indian students’ proficiency data in EOG reading (for grades three through eight) has gone through an ebb and flow pattern for the last three years, decreasing 1.1 percentage points since the 2017-18 school year. The EOG reading data show that American Indian students performed 14.9 percentage points below the state average proficiency rate in 2018-19. This is a slight increase from last year’s difference of 13.9 percentage points. To explain, 42.3% of American Indian students demonstrated grade level proficiency in reading compared to the state average for all students of 57.2%. American Indian students (42.3%) performed 2.2 percentage points higher in reading than their Black peers (40.1%).
American Indian students (42.3%) performed 2 percentage points below Hispanic students (44.3%).
Compared to White students (70.4%), American Indians (42.3%) performed 28.1 percentage points lower.
American Indian students across grades three through eight gained 2.2 percentage points in overall proficiency for EOG math. The EOG math data show that American Indian students performed significantly lower, 14.4 percentage points, than all students in the state average proficiency rate in 2018-19. To explain, 44.2% of American Indian students demonstrated grade level proficiency in math compared to the state average of 58.6% of students who demonstrated grade-level proficiency.
American Indian students (44.2%) scored 26.7 percentage points lower than their White peers (70.9%) and 6.4 percentage points lower than their Hispanic peers (50.6%).
American Indian students scored 4.9 percentage points higher than their Black peers (39.3%).
STATE FINDINGS
Year State American Indian White Black Hispanic
End-of-Grade Reading (Grades 3-8 Combined) Percent at/above Level 32016-17 57.5 42.8 70.6 39.6 43.92017-18 57.3 43.4 70.7 39.7 43.92018-19 57.2 42.3 70.4 40.1 44.3
End-of-Grade Math (Grades 3-8 Combined) Percent at/above Level 32016-17 55.4 40.0 67.3 35.7 47.22017-18 56.1 42.0 68.2 36.5 48.02018-19 58.6 44.2 70.9 39.3 50.6
END-OF-GRADE READING AND MATH (GRADES 3-8 COMBINED)
READING
MATH
% a
t/ab
ove
Lev
el 3
% a
t/ab
ove
Lev
el 3
State American Indian White Black HispanicLEAState American
Indian White Black HispanicLEA

12 | Source: Division of Accountability Services, NC Department of Public Instruction, 2019
0
10
20
30
40
50
60
70
80
90
100
Hispanic
Black
White
A.Indian
State
2018-192017-182016-17
>95
ENGLISH II
% a
t/ab
ove
Lev
el 3
EOC: Math I, Biology and English II
In 2018-19, overall proficiency rates decreased in Math I (41.2%) and English II (59.7%) slightly. While overall proficiency rates for Biology (59.6%) increased 1.3 percentage points.
In 2018-19, American Indian students’ EOC Math I proficiency rate decreased 6.7 percentage points. American Indian students (35.7%) performed 5.5 percentage points lower in Math I than the state average for all students (41.2%), and 17 percentage points lower than their White peers (52.7%). In addition, American Indian students performed slightly higher than their Hispanic peers (35.4%) and 8.4 percentage points above their Black peers (27.3%).
A somewhat similar trend applies to proficiency rates for Biology; however, American Indian students (46.9%) performed above their Black peers (39.4%) but slightly below their Hispanic peers (47.4%) in EOC Biology.
The state average in EOC Biology is 59.6%, which is 12.7 percentage points above that of American Indian students’ (46.9%). American Indian students demonstrated lower rates of proficiency than White students (71.4%) in EOC Biology.
Likewise, the percentage of students demonstrating proficiency in English II reflects the same trend as Math I and Biology, with American Indian students lagging behind the state average. American Indian students (46.1%) performed 13.6 percentage points below the state average (59.7%). American Indian students achieved lower rates of proficiency than both White (71.5%) and Hispanic (48.5%) students. American Indian students performed slightly higher than their Black peers (41.5%).
Year State American Indian White Black Hispanic
Math I: End-of-Course – Percent at/above Level 32016-17 64.3 49.3 75.1 43.3 54.72017-18 57.4 42.4 69.4 38.5 48.12018-19 41.2 35.7 52.7 27.3 35.4
Biology: End-of-Course – Percent at/above Level 32016-17 56.1 42.3 69.2 34.9 44.22017-18 58.3 47.0 71.4 37.7 46.42018-19 59.6 46.9 72.1 39.4 47.4
English II: End-of-Course – Percent at/above Level 32016-17 60.7 44.9 72.4 42.4 50.32017-18 59.8 46.6 71.7 42.1 48.42018-19 59.7 46.1 71.5 41.5 48.5
HIGH SCHOOL END-OF-COURSE TESTS
0
10
20
30
40
50
60
70
80
90
100
Hispanic
Black
White
A.Indian
State
2018-192017-182016-17
>95
MATH I
% a
t/ab
ove
Lev
el 3
0
10
20
30
40
50
60
70
80
90
100
Hispanic
Black
White
A.Indian
State
2018-192017-182016-17
>95
BIOLOGY
% a
t/ab
ove
Lev
el 3
STATE FINDINGS
State American Indian White Black HispanicLEAState American
Indian White Black HispanicLEA

13Source: Division of Accountability Services, NC Department of Public Instruction, 2019 |
50
60
70
80
90
100
Hispanic
Black
White
A.Indian
State
2018-192017-182016-17
>95
HIGH SCHOOL COHORT GRADUATION AND ANNUAL DROPOUT RATES
NORTH CAROLINA 4-YEAR COHORT GRADUATION RATES
0
1
2
3
4
5
6
Hispanic
Black
White
A.Indian
State
2017-182016-172015-16
>95
ANNUAL DROPOUT RATES (GRADES 9-13)
ANNUAL DROPOUT RATES (GRADES 9-13) Male and Female Students
Year State American Indian White Black Hispanic
NC 4-Year Cohort Graduation Rates2016-17 86.5 84.3 89.3 83.9 80.52017-18 86.3 84.4 89.6 83.2 79.92018-19 86.5 81.2 89.6 83.7 81.1Annual Dropout Rates (Grades 9-13)2015-16 2.29 2.46 1.85 2.68 3.412016-17 2.31 2.83 1.73 2.70 3.70
2017-18 2.18 3.05 1.62 2.59 3.38Annual Dropout Rates (Grades 9-13), Male & Female Students
F M F M F M F M
2015-16 2.29 1.97 2.95 1.47 2.21 2.04 3.31 2.74 4.052016-17 2.31 2.36 3.30 1.39 2.06 2.09 3.30 2.82 4.532017-18 2.18 2.51 3.60 1.27 1.95 1.96 3.20 2.44 4.26
Perc
enta
ge
of S
tud
ents
Perc
enta
ge
of S
tud
ents
Perc
enta
ge
of S
tud
ents
0
1
2
3
4
5
2017-182016-172015-16
M
F
M
F
M
F
M
F
M
F
M
F
M
F
M
F
M
F
M
F
M
F
M
F
STATE FINDINGS
Four-Year Cohort Graduation Rate (CGR)
The four-year cohort graduation rate of American Indian students (81.2%) trailed that of all students in the state (86.5%) by 5.3 percentage points. In 2018-19 American Indian students four-year cohort graduation rate dropped from the previous year. In addition, the four-year graduation rate of American Indian students (81.2%) lags behind White students (89.6%) by 5.2 percentage points and Black students (83.7%) by 2.5 percentage points.
Annual Dropout Rate
The dropout rate within the American Indian population has been a long-standing issue of public concern. Because the dropout rate and the cohort graduation rate tend to be inversely related, the more students who remain in school, the more who will also graduate from high school. From 2017- 18 to 2018-19 there was an increase in the number of American Indian students who dropped out of high school. A moderate decrease is noted in the dropout rates for White, Black and Hispanic students. The dropout rate for American Indian students in 2018-19 was 3.05 percent, which is lower than that of their Hispanic (3.38%) peers and slightly higher than their White (1.62) and Black (2.59%) peers. Also, the dropout rate among for American Indian students continues to be higher than the state’s average rate at 2.18 percent. When comparing the dropout rates for male and female students, the data continue to show that male students in all racial/ethnic groups tend to drop out at a higher rate than female students. The 2017-18 dropout rate for American Indian males and females students has increased considerably since 2015-16.
State American Indian White Black HispanicLEAState American
Indian White Black HispanicLEA
14 | Source: Division of Accountability Services, NC Department of Public Instruction, 2019
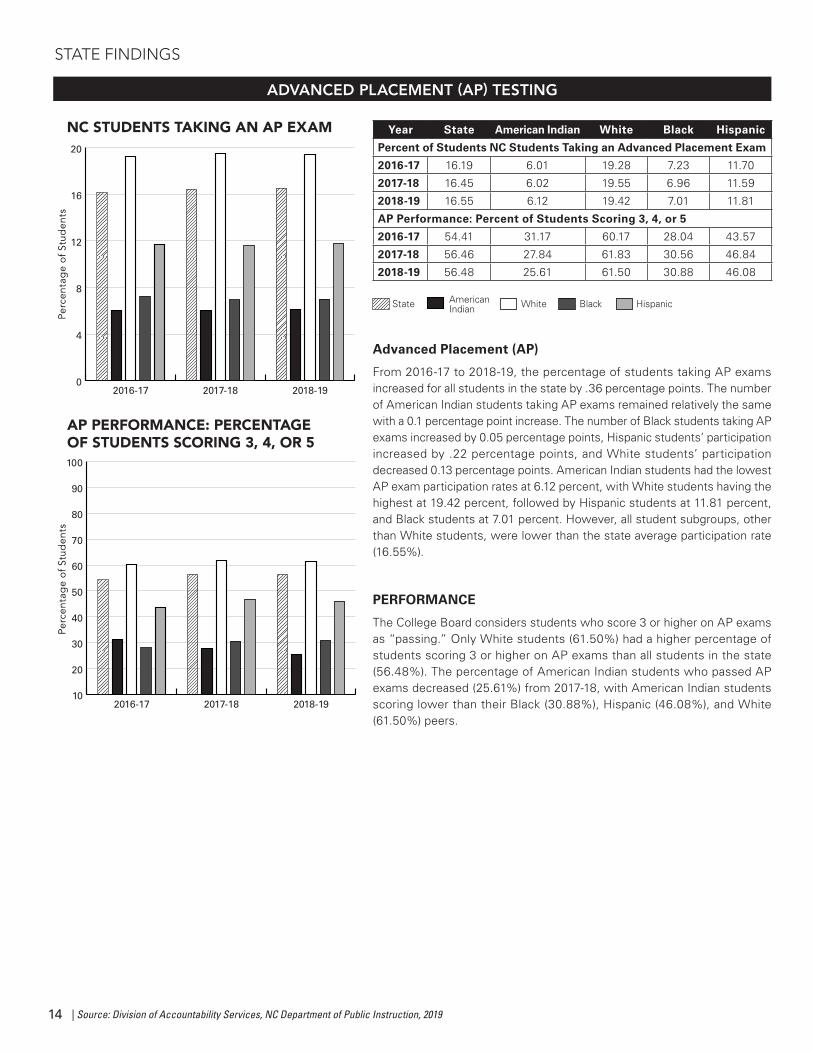
Advanced Placement (AP)
From 2016-17 to 2018-19, the percentage of students taking AP exams increased for all students in the state by .36 percentage points. The number of American Indian students taking AP exams remained relatively the same with a 0.1 percentage point increase. The number of Black students taking AP exams increased by 0.05 percentage points, Hispanic students’ participation increased by .22 percentage points, and White students’ participation decreased 0.13 percentage points. American Indian students had the lowest AP exam participation rates at 6.12 percent, with White students having the highest at 19.42 percent, followed by Hispanic students at 11.81 percent, and Black students at 7.01 percent. However, all student subgroups, other than White students, were lower than the state average participation rate (16.55%).
PERFORMANCE
The College Board considers students who score 3 or higher on AP exams as “passing.” Only White students (61.50%) had a higher percentage of students scoring 3 or higher on AP exams than all students in the state (56.48%). The percentage of American Indian students who passed AP exams decreased (25.61%) from 2017-18, with American Indian students scoring lower than their Black (30.88%), Hispanic (46.08%), and White (61.50%) peers.
0
4
8
12
16
20
Hispanic
Black
White
A.Indian
State
2018-192017-182016-17
>95
10
20
30
40
50
60
70
80
90
100
Hispanic
Black
White
A.Indian
State
2018-192017-182016-17
>95
Year State American Indian White Black Hispanic
Percent of Students NC Students Taking an Advanced Placement Exam
2016-17 16.19 6.01 19.28 7.23 11.70
2017-18 16.45 6.02 19.55 6.96 11.59
2018-19 16.55 6.12 19.42 7.01 11.81
AP Performance: Percent of Students Scoring 3, 4, or 5
2016-17 54.41 31.17 60.17 28.04 43.57
2017-18 56.46 27.84 61.83 30.56 46.84
2018-19 56.48 25.61 61.50 30.88 46.08
NC STUDENTS TAKING AN AP EXAM
AP PERFORMANCE: PERCENTAGE OF STUDENTS SCORING 3, 4, OR 5
ADVANCED PLACEMENT (AP) TESTING
Perc
enta
ge
of S
tud
ents
Perc
enta
ge
of S
tud
ents
State American Indian White Black HispanicLEAState American
Indian White Black HispanicLEA
STATE FINDINGS

15Source: Division of Accountability Services, NC Department of Public Instruction, 2019 |
SAT
The SAT is an important academic indicator of student preparation for college and career opportunities. Student performance in critical reading, mathematics, and writing is considered a strong predictor of college and career readiness.
PARTICIPATION
According to the 2018-19 College Board data, SAT participation decreased across the state. The rate of all North Carolina public school students taking the SAT in 2018-19 (45.67%) was 1.10 percentage points below the rate of test takers in 2017-18 (46.77%). The rate of American Indian students taking the SAT in 2018-19 (28.78%) was 4.15 percentage points above the participation in 2016-17. Data show that the largest gain in SAT participation from 2016-17 to 2018-19 is still among American Indian Students, followed by White students with a 2.98 percentage point increase.
PERFORMANCE
For those taking the SAT in 2018-19, average scores for the state increased from the previous year; however, not all student subgroup scores increased. American Indian students scored 6 points lower in 2018-19 than in 2016-17. However, the 2018-19 average score for American Indians was 981, which was 110 points below the state average (1091), 170 points lower than the score of their White peers (1151), and 58 points lower than their Hispanic peers (1039).
SAT AND ACT TESTING
Year State American Indian White Black Hispanic
Percent of NC Students Taking the SAT
2016-17 44.02 24.63 41.49 43.67 35.54
2017-18 46.77 29.01 45.74 43.63 34.49
2018-19 45.67 28.78 44.47 39.73 34.84
NC Average SAT Scores
2016-17 1074 987 1137 952 1042
2017-18 1090 986 1149 958 1041
2018-19 1091 981 1151 956 1039
10
20
30
40
50
60
70
80
90
100
Hispanic
Black
White
A.Indian
State
2018-192017-182016-17
>95
NC STUDENTS TAKING THE SAT
Perc
enta
ge
of S
tud
ents
700
750
800
850
900
950
1000
1050
1100
1150
1200
Hispanic
Black
White
A.Indian
State
2018-192017-182016-17
>95
NC AVERAGE SAT SCORES
Ave
rag
e SA
T Sc
ore
State American Indian White Black HispanicLEAState American
Indian White Black HispanicLEA
STATE FINDINGS
ACT
According to the 2018-19 ACT assessment data, American Indian students had an average score of 16.1, which is 2.6 points lower than the state average score (18.7). In relation to their peers, American Indians’ average ACT score was 4.4 points lower than Whites, 0.9 points below Hispanics, and 0.2 points above their Black peers.
Year State American Indian White Black Hispanic
NC Average ACT Scores
2016-17 18.9 16.7 20.6 16.1 17.4
2017-18 18.9 16.7 20.6 16.0 17.12018-19 18.7 16.1 20.5 15.9 17.0
1
8
15
22
29
36
Hispanic
Black
White
A.Indian
State
2018-192017-182016-17
>95
NC AVERAGE ACT SCORES
State American Indian White Black HispanicLEAState American
Indian White Black HispanicLEA

16
0
20000
40000
60000
80000
100000
120000
140000
Hispanic
Black
White
A.Indian
State
2018-192017-182016-17
>95
0
50
100
150
200
250
300
350
Hispanic
Black
White
A.Indian
State
2018-192017-182016-17
>95
Year American Indian White Black Hispanic
Short-Term Suspensions by Race/Ethnicity2016-17 4524 52985 118398 217162017-18 4592 54396 116597 234962018-19 3935 54368 109882 22110
Short-Term Suspensions Rate (Per 1,000 Enrolled)2, By Race/Ethnicity2016-17 233 71 303 842017-18 246 73 300 882018-19 217 74 282 79
SHORT-TERM SUSPENSIONS BY RACE/ETHNICITY
SHORT-TERM SUSPENSIONS RATE (PER 1,000 ENROLLED)2, BY RACE/ETHNICITY
State American Indian White Black HispanicLEA
SUSPENSION DATA BY SUBGROUPS
STATE FINDINGS
Short-Term Suspensions
In 2018-2019, there were 203,298 short-term suspensions reported statewide, a decrease of 3.8% from the 211,228 reported in the 2017-2018 academic year. The number of short-term suspensions for American Indian (3,935), White (54,368) Black (109,882), and Hispanic (22,110) students decreased slightly compared to the previous academic year. In 2018-2019, Black students had the highest rate of short-term suspension (282), followed by American Indian students (217). These rates did decrease for American Indian students by 29 percentage points and for Black students by 18 percentage points from the 2017-2018 academic year.
Num
ber
of S
hort
-Ter
m S
usp
ensi
ons
by
R
ace/
Eth
nici
tyR
ate
of S
hort
-Ter
m S
usp
ensi
ons
by
R
ace/
Eth
nici
ty

17
The following pages contain American Indian Student Performance by LEA or Charter School (alphabetically listed)
LEA FINDINGS: AMERICAN INDIAN STUDENT PERFORMANCE
STATE ADVISORY COUNCIL
ON IN DIA N E D U C ATIO
NSACIE
Richmond
ClintonCity

18 | Source: Division of Accountability Services, NC Department of Public Instruction, 2019
CHARLOTTE-MECKLENBURG SCHOOLS
0
10
20
30
40
50
60
70
80
90
100
Hispanic
Black
White
A.Indian
LEA
State
2018-192017-182016-17
>95
0
10
20
30
40
50
60
70
80
90
100
Hispanic
Black
White
A.Indian
LEA
State
2018-192017-182016-17
>95
Charlotte-Mecklenburg Schools enrolled 146,647 students in 177 schools in 2018-19, which includes a variety of theme-specific campuses. The 2018-19 enrollment reflects 317 (0.22%) American Indian students from various tribes. In 2018-19, the district proficiency rates were slightly higher than the state proficiency rates on all EOG/ EOC assessments except for EOG Reading. The district’s proficiency rate in EOG reading was 2.8 percentage points lower than the state. American Indian students performed below the state and district averages in all EOG/EOC subjects. In addition, American Indian students’ performance percentage in most tested areas dropped considerably from last year. Decreasing by 6.6 points in EOG Reading, 4.5 points in EOG Math, 9.5 in EOC Math I, and 11.6 points in EOC English II. Biology percentage for American Indian students increased by 6.1 percentage points. American Indian students demonstrated higher rates of proficiency than their Hispanic and Black peers on the all EOG/EOC subjects except the EOC Math I and EOC English II. In addition, American Indian students’ proficiency rates were significantly lower than their White peers in all EOG/EOC assessments. The American Indian 4-Year Cohort Graduation Rate increased significantly (11.8 percentage points) for 2018-19 and was above all racial and ethnic subgroups and the state and district averages. No data have been reported for the annual dropout rate of American Indians for the last three years.
DISTRICT CONTACT: CHIQUITHA LLOYD http://www.cms.k12.nc.us
SOUTHWEST
MATH
% a
t/ab
ove
Lev
el 3
% a
t/ab
ove
Lev
el 3
READING
END-OF-GRADE READING AND MATH (GRADES 3-8 COMBINED)
Year State District American Indian White Black Hispanic
End-of-Grade Reading (Grades 3-8 Combined) – Percent at/above Level 32016-17 57.5 57.2 50.0 82.9 43.9 43.02017-18 57.3 55.1 55.2 81.3 42.1 41.32018-19 57.2 54.4 48.6 81.1 41.8 40.2
End-of-Grade Math (Grades 3-8 Combined) – Percent at/above Level 32016-17 55.4 60.0 52.3 84.1 43.9 52.02017-18 56.1 60.1 60.8 84.2 43.8 52.52018-19 58.6 63.6 56.3 86.8 48.9 55.3
Math I: End-of-Course – Percent at/above Level 32016-17 64.3 68.9 58.9 90.1 51.3 58.02017-18 57.4 60.2 39.5 86.0 44.5 50.02018-19 41.2 42.2 30.0 70.8 33.6 35.7
Biology: End-of-Course – Percent at/above Level 32016-17 56.1 56.3 30.6 83.5 39.9 43.32017-18 58.3 59.7 48.7 85.2 44.9 46.72018-19 59.6 60.3 54.8 86.3 44.8 48.6
English II: End-of-Course – Percent at/above Level 32016-17 60.7 63.8 41.5 87.7 49.9 53.42017-18 59.8 61.3 58.5 86.8 47.7 48.82018-19 59.7 61.0 46.9 85.6 47.4 48.54-Year Cohort Graduation Rate2016-17 86.5 89.4 92.6 94.8 89.7 78.52017-18 86.3 85.4 81.1 93.1 84.9 74.02018-19 86.5 85.5 92.9 92.4 85.2 74.5Annual Dropout Rate (Grades 9-13)2015-16 2.29 2.40 n/a 1.13 2.04 5.402016-17 2.31 2.20 n/a 0.81 1.96 4.962017-18 2.18 2.26 n/a 0.99 2.12 4.55

19Source: Division of Accountability Services, NC Department of Public Instruction, 2019 |
END-OF-COURSE TESTS%
at/
abo
ve L
evel
3%
at/
abo
ve L
evel
3%
at/
abo
ve L
evel
3
40
50
60
70
80
90
100
Hispanic
Black
White
A.Indian
LEA
State
2018-192017-182016-17
0
2
4
6
8
10
12
Hispanic
Black
White
A.Indian
LEA
State
2017-182016-172015-16
>95
n/a n/an/a
HIGH SCHOOL COMPLETION
ANNUAL DROPOUT RATES (GRADES 9-13)
4-YEAR COHORT GRADUATION RATES
Perc
enta
ge
of S
tud
ents
Perc
enta
ge
of S
tud
ents
Graduation Year
0
10
20
30
40
50
60
70
80
90
100
Hispanic
Black
White
A.Indian
LEA
State
2018-192017-182016-17
*
>95
0
10
20
30
40
50
60
70
80
90
100
Hispanic
Black
White
A.Indian
LEA
State
2018-192017-182016-17
*
>95>95
0
10
20
30
40
50
60
70
80
90
100
Hispanic
Black
White
A.Indian
LEA
State
2018-192017-182016-17
*
>95
MATH I
ENGLISH II
BIOLOGY
> = Scores changed due to data corrections.
* = Indicates that the student population in the subgroup is too small to report the value (Fewer than five students in the cohort. Beginning in 2015-16, this increased to fewer than ten students.)
n/a = Current year data are unavailable or contain no scores for the selected test.
<5 or >95 = The percentage and number of students are not shown if the percentage is greater than 95 percent or less than five percent.
State American Indian White Black HispanicLEA

20 | Source: Division of Accountability Services, NC Department of Public Instruction, 2019
CLINTON CITY
0
10
20
30
40
50
60
70
80
90
100
Hispanic
Black
White
A.Indian
LEA
State
2018-192017-182016-17
>95
0
10
20
30
40
50
60
70
80
90
100
Hispanic
Black
White
A.Indian
LEA
State
2018-192017-182016-17
>95
Clinton City Schools enrolled 2,921 students, including 75 (2.6%) American Indians, mainly of the Cohaire Tribe in 2018-19. In the Title VI cohort, Clinton City Schools (located in Sampson County) operates five schools, including one high school. In 2018-19, the district proficiency rates were below the state in all EOG and EOC tested areas. American Indian students performed above the district average in EOG Reading, however, American Indian students were 2.1 percentage points below in EOG Math. Data are not available for proficiency rates for Math I, Biology, and English II EOC assessments. American Indian students demonstrated higher rates of proficiency than their Black and Hispanic peers in EOG Reading; although, they were behind their Hispanic peers in EOG Math and their White peers in both EOG assessments. American Indian students showed a gain of 9.6 percentage points from 2017-18 to 2018-19 in EOG Reading, but dropped 9 percentage points in EOG Math. The 4-Year Cohort Graduation rate for American Indian students is not reported due to insufficient data. In addition, the annual dropout rate for American Indians is unavailable due to the low number of American Indian students in the district.
DISTRICT CONTACT: SHIRLEY WILLIAMS http://www.clinton.k12.nc.us
SANDHILLS
% a
t/ab
ove
Lev
el 3
% a
t/ab
ove
Lev
el 3
END-OF-GRADE READING AND MATH (GRADES 3-8 COMBINED)
MATHREADING
Year State District American Indian White Black Hispanic
End-of-Grade Reading (Grades 3-8 Combined) – Percent at/above Level 32016-17 57.5 52.9 51.2 71.5 41.5 47.22017-18 57.3 53.4 46.5 72.2 44.1 47.12018-19 57.2 50.3 56.1 69.3 41.1 46.9
End-of-Grade Math (Grades 3-8 Combined) – Percent at/above Level 32016-17 55.4 56.4 51.2 69.9 45.6 57.02017-18 56.1 58.7 65.1 76.2 44.9 59.22018-19 58.6 58.2 56.1 78.0 46.3 58.4
Math I: End-of-Course – Percent at/above Level 32016-17 64.3 64.9 53.8 84.5 51.4 50.02017-18 57.4 44.1 50.0 62.1 31.5 39.72018-19 41.2 28.1 * 36.7 23.7 28.6
Biology: End-of-Course – Percent at/above Level 32016-17 56.1 41.1 * 55.0 29.6 39.62017-18 58.3 38.6 * 63.5 23.5 27.62018-19 59.6 50.8 * 77.8 33.3 43.2
English II: End-of-Course – Percent at/above Level 32016-17 60.7 53.3 * 70.4 38.4 50.02017-18 59.8 51.9 * 77.6 37.2 35.4
2018-19 59.7 52.9 * 68.6 41.3 46.74-Year Cohort Graduation Rate2016-17 86.5 87.4 * 94.7 89.0 79.22017-18 86.3 84.0 * 85.7 86.2 82.62018-19 86.5 77.6 * 75.3 81.7 75.0Annual Dropout Rate (Grades 9-13)2015-16 2.29 2.29 n/a n/a n/a n/a2016-17 2.31 3.54 n/a n/a n/a 5.192017-18 2.18 2.93 n/a n/a n/a 5.05

21Source: Division of Accountability Services, NC Department of Public Instruction, 2019 |
40
50
60
70
80
90
100
Hispanic
Black
White
A.Indian
LEA
State
2018-192017-182016-17
>95
***
0
2
4
6
8
10
12
Hispanic
Black
White
A.Indian
LEA
State
2017-182016-172015-16
>95
n/a n/an/a n/an/a n/an/a n/a n/an/a
END-OF-COURSE TESTS HIGH SCHOOL COMPLETION%
at/
abo
ve L
evel
3%
at/
abo
ve L
evel
3%
at/
abo
ve L
evel
3
Graduation Year
0
10
20
30
40
50
60
70
80
90
100
Hispanic
Black
White
A.Indian
LEA
State
2018-192017-182016-17
*
*
>95
0
10
20
30
40
50
60
70
80
90
100
Hispanic
Black
White
A.Indian
LEA
State
2018-192017-182016-17
*
>95
***
0
10
20
30
40
50
60
70
80
90
100
Hispanic
Black
White
A.Indian
LEA
State
2018-192017-182016-17** *
>95
Perc
enta
ge
of S
tud
ents
Perc
enta
ge
of S
tud
ents
ANNUAL DROPOUT RATES (GRADES 9-13)
4-YEAR COHORT GRADUATION RATESMATH I
ENGLISH II
BIOLOGY
> = Scores changed due to data corrections.
* = Indicates that the student population in the subgroup is too small to report the value (Fewer than five students in the cohort. Beginning in 2015-16, this increased to fewer than ten students.)
n/a = Current year data are unavailable or contain no scores for the selected test.
<5 or >95 = The percentage and number of students are not shown if the percentage is greater than 95 percent or less than five percent.
State American Indian White Black HispanicLEA

22 | Source: Division of Accountability Services, NC Department of Public Instruction, 2019
COLUMBUS COUNTY
0
10
20
30
40
50
60
70
80
90
100
Hispanic
Black
White
A.Indian
LEA
State
2018-192017-182016-17
>95
0
10
20
30
40
50
60
70
80
90
100
Hispanic
Black
White
A.Indian
LEA
State
2018-192017-182016-17
>95
In 2018-19, Columbus County Schools enrolled 5,425 students of whom 257 (4.7%) are American Indians, primarily from the Waccamaw Siouan Tribe, which is indigenous to Bladen County and surrounding communities. In 2018-19 the average proficiency rate of the district was lower than the state average in all EOG/ EOC assessments. American Indian students performed above the district proficiency rates in EOG Reading and Math and EOC Math I. However, when comparing other EOC proficiency rates for Biology and English II, American Indian students were below both state and district percentages. In addition, proficiency rates for American Indian students decreased significantly in EOC Biology by 16.6 percentage points and in EOC English II by 27.3 percentage points between 2017-18 and 2018-19. American Indian students demonstrated higher proficiency rates than their Black peers in most EOG/EOC subjects except for EOC English II and above their Hispanic peers in EOG Reading and EOC Math I. However, the average proficiency rates of American Indian students lagged behind those of their White peers on all EOG/EOC assessments. The 4-Year Cohort Graduation rate for American Indian students decreased significantly and is lower than the state and district rates as well as the rates of their White, Black, and Hispanic peers. Sufficient data are not available for comparison of the annual dropout rate of American Indians.
DISTRICT CONTACT: KENWOOD ROYALhttp://www.columbus.k12.nc.us
SANDHILLS
% a
t/ab
ove
Lev
el 3
% a
t/ab
ove
Lev
el 3
END-OF-GRADE READING AND MATH (GRADES 3-8 COMBINED)
MATHREADING
Year State District American Indian White Black Hispanic
End-of-Grade Reading (Grades 3-8 Combined) – Percent at/above Level 32016-17 57.5 52.1 56.2 61.6 37.7 46.12017-18 57.3 53.5 57.3 63.1 39.8 48.02018-19 57.2 52.0 53.1 61.4 37.7 48.6
End-of-Grade Math (Grades 3-8 Combined) – Percent at/above Level 32016-17 55.4 48.1 41.5 56.6 35.3 46.92017-18 56.1 49.9 49.2 59.0 36.1 48.22018-19 58.6 50.8 53.1 58.1 38.2 53.6
Math I: End-of-Course – Percent at/above Level 32016-17 64.3 57.2 65.5 62.1 43.4 58.02017-18 57.4 47.4 20.0 56.4 36.9 42.92018-19 41.2 33.3 39.1 41.3 24.1 23.3
Biology: End-of-Course – Percent at/above Level 32016-17 56.1 51.9 43.8 62.1 33.8 55.22017-18 58.3 56.2 62.1 64.6 38.6 59.52018-19 59.6 55.0 45.5 64.7 34.0 50.0
English II: End-of-Course – Percent at/above Level 32016-17 60.7 58.9 42.1 70.6 40.3 58.32017-18 59.8 51.1 63.0 55.8 36.9 51.22018-19 59.7 52.1 35.7 60.3 35.7 46.34-Year Cohort Graduation Rate2016-17 86.5 84.6 94.9 84.5 85.5 74.52017-18 86.3 81.3 93.5 81.3 80.7 76.22018-19 86.5 85.4 80.8 88.3 81.0 94.4Annual Dropout Rate (Grades 9-13)2015-16 2.29 1.81 n/a 1.76 2.00 n/a2016-17 2.31 1.75 n/a 1.82 2.07 n/a2017-18 2.18 1.63 n/a 1.26 2.59 n/a

23Source: Division of Accountability Services, NC Department of Public Instruction, 2019 |
40
50
60
70
80
90
100
Hispanic
Black
White
A.Indian
LEA
State
2018-192017-182016-17
>95
0
2
4
6
8
10
12
Hispanic
Black
White
A.Indian
LEA
State
2017-182016-172015-16
>95
n/a n/a n/a n/a n/an/a
END-OF-COURSE TESTS HIGH SCHOOL COMPLETION%
at/
abo
ve L
evel
3%
at/
abo
ve L
evel
3%
at/
abo
ve L
evel
3
0
10
20
30
40
50
60
70
80
90
100
Hispanic
Black
White
A.Indian
LEA
State
2018-192017-182016-17
0
10
20
30
40
50
60
70
80
90
100
Hispanic
Black
White
A.Indian
LEA
State
2018-192017-182016-17
*
>95>95 >95
0
10
20
30
40
50
60
70
80
90
100
Hispanic
Black
White
A.Indian
LEA
State
2018-192017-182016-17
*
>95
Perc
enta
ge
of S
tud
ents
Perc
enta
ge
of S
tud
ents
ANNUAL DROPOUT RATES (GRADES 9-13)
Graduation Year
4-YEAR COHORT GRADUATION RATESMATH I
ENGLISH II
BIOLOGY
> = Scores changed due to data corrections.
* = Indicates that the student population in the subgroup is too small to report the value (Fewer than five students in the cohort. Beginning in 2015-16, this increased to fewer than ten students.)
n/a = Current year data are unavailable or contain no scores for the selected test.
<5 or >95 = The percentage and number of students are not shown if the percentage is greater than 95 percent or less than five percent.
State American Indian White Black HispanicLEA

24 | Source: Division of Accountability Services, NC Department of Public Instruction, 2019
CUMBERLAND COUNTY
0
10
20
30
40
50
60
70
80
90
100
Hispanic
Black
White
A.Indian
LEA
State
2018-192017-182016-17
>95
0
10
20
30
40
50
60
70
80
90
100
Hispanic
Black
White
A.Indian
LEA
State
2018-192017-182016-17
>95
Cumberland County Schools serves an expansive military community, which adds to the diversity of the district. In 2018-19 the district served 49,385 students, including 736 (1.5%) American Indian students, mainly of the Lumbee Tribe. The district operates 87 schools, including 14 high schools, two early colleges, and a Cooperative Innovative High School. In 2018-19, the average proficiency rate for the district was below the state average in most EOG/EOC subject areas except EOC Math I. American Indian students’ average rate of proficiency was below the district and state averages in all EOG/EOC areas. Proficiency rates for American Indian students decreased in all EOG tested subjects and most EOC tested subjects except Biology where there was a slight increase of 1.1 percentage points. American Indian students demonstrated higher rates of proficiency than their Black peers in almost all EOG/ EOC tested subjects, except EOG Reading. However, proficiency rates of American Indian students were below those of their White and Hispanic peers in all areas. Compared to the state, the district, and all other racial/ethnic groups, American Indians have the lowest 4-Year Cohort Graduation rate. American Indians also have a higher annual dropout rate than the state, the district, and all other racial/ ethnic groups.
DISTRICT CONTACT: RODNEY JACKSONhttp://ccs.k12.nc.us
SANDHILLS
% a
t/ab
ove
Lev
el 3
% a
t/ab
ove
Lev
el 3
END-OF-GRADE READING AND MATH (GRADES 3-8 COMBINED)
MATHREADING
Year State District American Indian White Black Hispanic
End-of-Grade Reading (Grades 3-8 Combined) – Percent at/above Level 32016-17 57.5 57.3 48.5 72.2 45.8 57.82017-18 57.3 56.3 50.4 71.8 45.0 56.42018-19 57.2 54.6 42.8 69.0 44.1 54.4
End-of-Grade Math (Grades 3-8 Combined) – Percent at/above Level 32016-17 55.4 50.8 37.7 65.7 38.8 52.62017-18 56.1 50.6 42.2 66.7 38.5 51.32018-19 58.6 50.5 41.3 65.6 39.1 51.2
Math I: End-of-Course – Percent at/above Level 32016-17 64.3 60.2 61.5 73.4 48.3 63.32017-18 57.4 57.6 46.0 71.8 45.5 57.92018-19 41.2 41.6 39.0 54.6 34.5 41.9
Biology: End-of-Course – Percent at/above Level 32016-17 56.1 53.5 53.2 69.6 40.5 55.62017-18 58.3 53.4 46.0 67.1 41.2 58.42018-19 59.6 58.5 47.1 73.3 46.1 59.8
English II: End-of-Course – Percent at/above Level 32016-17 60.7 60.1 64.1 73.0 49.2 63.82017-18 59.8 58.6 54.1 71.7 47.3 59.92018-19 59.7 56.9 50.0 71.1 46.0 56.74-Year Cohort Graduation Rate2016-17 86.5 82.1 68.9 85.6 79.6 83.52017-18 86.3 82.0 75.4 84.8 79.9 79.82018-19 86.5 83.8 73.5 85.9 83.6 82.5Annual Dropout Rate (Grades 9-13)2015-16 2.29 2.55 4.53 2.39 2.72 2.522016-17 2.31 2.31 5.42 1.81 2.31 3.152017-18 2.18 2.01 4.89 1.49 2.30 1.84

25Source: Division of Accountability Services, NC Department of Public Instruction, 2019 |
40
50
60
70
80
90
100
Hispanic
Black
White
A.Indian
LEA
State
2018-192017-182016-17
0
2
4
6
8
10
12
Hispanic
Black
White
A.Indian
LEA
State
2017-182016-172015-16
>95
END-OF-COURSE TESTS HIGH SCHOOL COMPLETION
Perc
enta
ge
of S
tud
ents
Perc
enta
ge
of S
tud
ents
0
10
20
30
40
50
60
70
80
90
100
Hispanic
Black
White
A.Indian
LEA
State
2018-192017-182016-17
0
10
20
30
40
50
60
70
80
90
100
Hispanic
Black
White
A.Indian
LEA
State
2018-192017-182016-17
*
>95
0
10
20
30
40
50
60
70
80
90
100
Hispanic
Black
White
A.Indian
LEA
State
2018-192017-182016-17
*
>95
% a
t/ab
ove
Lev
el 3
% a
t/ab
ove
Lev
el 3
% a
t/ab
ove
Lev
el 3
ANNUAL DROPOUT RATES (GRADES 9-13)
MATH I
ENGLISH II
BIOLOGYGraduation Year
4-YEAR COHORT GRADUATION RATES
> = Scores changed due to data corrections.
* = Indicates that the student population in the subgroup is too small to report the value (Fewer than five students in the cohort. Beginning in 2015-16, this increased to fewer than ten students.)
n/a = Current year data are unavailable or contain no scores for the selected test.
<5 or >95 = The percentage and number of students are not shown if the percentage is greater than 95 percent or less than five percent.
State American Indian White Black HispanicLEA

26 | Source: Division of Accountability Services, NC Department of Public Instruction, 2019
GRAHAM COUNTY
0
10
20
30
40
50
60
70
80
90
100
Hispanic
Black
White
A.Indian
LEA
State
2018-192017-182016-17
>95
*** 0
10
20
30
40
50
60
70
80
90
100
Hispanic
Black
White
A.Indian
LEA
State
2018-192017-182016-17
>95
*** *
Graham County Schools is located near the Qualla Boundary (a reservation of the Eastern Band of the Cherokee). In 2018-19, the district enrolled 768 students including 133 (17.3%) American Indians, which are mainly from the Eastern Band of Cherokee. The district operates an elementary, middle, and high school. In 2018-19, the district was below the state’s average in proficiency rates in most EOG and EOC subject areas except EOC Math I. American Indian students exceeded the district and state average grade-level proficiency rates in EOC Math I. However, American Indian students’ proficiency rates were below all other district and state EOG and EOC proficiency averages. Proficiency rates increased in all EOG areas but dropped significantly in EOC Biology. When compared to their White and Hispanic peers, less American Indians showed proficiency in EOG reading, EOG math, and EOC Biology. Sufficient data were not available for comparison to their Black peers in any areas. For 2018-19, the 4-year Cohort Graduation rate was greater than 95 percent, which was above the state (86.5%), district (84%), and their White peers (81.8%). The three-year annual dropout data for 2017-18 was not available to report.
DISTRICT CONTACT: NED LONGhttp://www.grahamcountyschools.org
WESTERN
% a
t/ab
ove
Lev
el 3
% a
t/ab
ove
Lev
el 3
END-OF-GRADE READING AND MATH (GRADES 3-8 COMBINED)MATHREADING
Year State District American Indian White Black Hispanic
End-of-Grade Reading (Grades 3-8 Combined) – Percent at/above Level 32016-17 57.5 60.0 56.6 61.2 * 52.42017-18 57.3 53.8 41.1 56.4 * 54.52018-19 57.2 51.4 44.3 53.9 * 50.0
End-of-Grade Math (Grades 3-8 Combined) – Percent at/above Level 32016-17 55.4 48.6 44.6 49.5 * 38.12017-18 56.1 44.2 32.2 47.3 * 36.42018-19 58.6 53.4 43.8 56.4 * 50.0
Math I: End-of-Course – Percent at/above Level 32016-17 64.3 63.3 84.6 62.3 * *2017-18 57.4 56.6 * 58.6 * *2018-19 41.2 54.9 55.6 55.4 * *
Biology: End-of-Course – Percent at/above Level 32016-17 56.1 52.4 61.5 54.7 * *2017-18 58.3 63.6 76.9 60.6 * *2018-19 59.6 50 16.7 54.9 * *
English II: End-of-Course – Percent at/above Level 32016-17 60.7 53.6 53.8 55.4 * *2017-18 59.8 56.7 53.3 59.7 * *2018-19 59.7 53.2 * 53.3 * *4-Year Cohort Graduation Rate2016-17 86.5 93.2 >95 92.0 n/a *2017-18 86.3 85.4 88.9 84.8 n/a *2018-19 86.5 84.0 >95 81.8 n/a *Annual Dropout Rate (Grades 9-13)2015-16 2.29 3.23 n/a 3.26 n/a n/a2016-17 2.31 1.56 n/a n/a n/a n/a2017-18 2.18 3.22 n/a 3.67 n/a n/a

27Source: Division of Accountability Services, NC Department of Public Instruction, 2019 |
40
50
60
70
80
90
100
Hispanic
Black
White
A.Indian
LEA
State
2018-192017-182016-17
n/an/a
>95>95
*n/a * *
>95
0
2
4
6
8
10
12
Hispanic
Black
White
A.Indian
LEA
State
2017-182016-172015-16
>95
n/a n/an/an/a n/an/a n/a n/a n/an/a
END-OF-COURSE TESTS HIGH SCHOOL COMPLETION%
at/
abo
ve L
evel
3%
at/
abo
ve L
evel
3%
at/
abo
ve L
evel
3
0
10
20
30
40
50
60
70
80
90
100
Hispanic
Black
White
A.Indian
LEA
State
2018-192017-182016-17* * ** * * *
0
10
20
30
40
50
60
70
80
90
100
Hispanic
Black
White
A.Indian
LEA
State
2018-192017-182016-17
*
>95
* * * ** *
0
10
20
30
40
50
60
70
80
90
100
Hispanic
Black
White
A.Indian
LEA
State
2018-192017-182016-17
*
>95
*** ** **
Perc
enta
ge
of S
tud
ents
Perc
enta
ge
of S
tud
ents
ANNUAL DROPOUT RATES (GRADES 9-13)
Graduation Year
4-YEAR COHORT GRADUATION RATESMATH I
ENGLISH II
BIOLOGY
> = Scores changed due to data corrections.
* = Indicates that the student population in the subgroup is too small to report the value (Fewer than five students in the cohort. Beginning in 2015-16, this increased to fewer than ten students.)
n/a = Current year data are unavailable or contain no scores for the selected test.
<5 or >95 = The percentage and number of students are not shown if the percentage is greater than 95 percent or less than five percent.
State American Indian White Black HispanicLEA

28 | Source: Division of Accountability Services, NC Department of Public Instruction, 2019
GUILFORD COUNTY
0
10
20
30
40
50
60
70
80
90
100
Hispanic
Black
White
A.Indian
LEA
State
2018-192017-182016-17
>95
0
10
20
30
40
50
60
70
80
90
100
Hispanic
Black
White
A.Indian
LEA
State
2018-192017-182016-17
>95
Guilford County Schools enrolled 71,124 students in 2018-19, of whom 259 (.36%) are American Indians representing both federal and state recognized tribes. Guilford County operates 124 schools, including a myriad of magnet campuses. The district’s proficiency rates on all EOG/EOC assessments is below those of the state’s. The 2018-19 data showed the rate of American Indian students demonstrating proficiency on all EOG/EOC assessments was lower than the state and most district rates except for Math I. American Indian students demonstrated higher levels of proficiency than their Black peers on most EOG/EOC assessments except for EOC Biology. However, they were behind their White peers in all tested areas and fell behind their Hispanic peers in EOG math, EOC Biology, and EOC English II. The American Indian 4-year Cohort Graduation rate has steadily increased over the last three years and was reported at greater than 95 percent. For the 2018-19, it was above the cohort graduation rates for the state, district, and all peer subgroups. Sufficient data are not available for comparison to the dropout rate for American Indian students for 2017-18.
DISTRICT CONTACT: MIA MALESOVAhttp://www.gcsnc.com
% a
t/ab
ove
Lev
el 3
% a
t/ab
ove
Lev
el 3
END-OF-GRADE READING AND MATH (GRADES 3-8 COMBINED)
MATHREADING
PIEDMONT-TRIAD
Year State District American Indian White Black Hispanic
End-of-Grade Reading (Grades 3-8 Combined) – Percent at/above Level 32016-17 57.5 52.5 45.9 73.8 38.1 42.52017-18 57.3 52.2 43.7 73.7 38.5 42.32018-19 57.2 55.5 46.6 77.1 42.0 46.6
End-of-Grade Math (Grades 3-8 Combined) – Percent at/above Level 32016-17 55.4 51.2 41.1 71.6 34.6 46.32017-18 56.1 50.4 34.9 72.1 34.2 44.22018-19 58.6 52.5 42.7 74.4 36.8 46.6
Math I: End-of-Course – Percent at/above Level 32016-17 64.3 66.9 41.2 83.9 49.3 59.12017-18 57.4 54.1 50.0 75.6 38.2 44.82018-19 41.2 27.0 33.3 40.0 20.2 24.2
Biology: End-of-Course – Percent at/above Level 32016-17 56.1 54.0 60.0 73.6 37.3 44.42017-18 58.3 58.9 40.0 78.2 42.4 50.32018-19 59.6 57.7 39.4 77.3 42.2 48.5
English II: End-of-Course – Percent at/above Level 32016-17 60.7 61.1 47.4 80.8 45.8 51.42017-18 59.8 59.7 25.0 77.7 45.9 52.02018-19 59.7 57.3 46.7 77.4 41.8 49.04-Year Cohort Graduation Rate2016-17 86.5 89.8 87.9 93.1 87.8 83.22017-18 86.3 89.3 92.6 93.9 87.7 80.42018-19 86.5 89.2 >95 93.5 87.7 81.8Annual Dropout Rate (Grades 9-13)2015-16 2.29 2.04 n/a 1.32 2.46 3.402016-17 2.31 1.87 n/a 1.04 2.29 2.932017-18 2.18 2.02 n/a 1.07 2.41 3.65

29Source: Division of Accountability Services, NC Department of Public Instruction, 2019 |
40
50
60
70
80
90
100
Hispanic
Black
White
A.Indian
LEA
State
2018-192017-182016-17
0
2
4
6
8
10
12
Hispanic
Black
White
A.Indian
LEA
State
2017-182016-172015-16
>95
n/an/an/a
END-OF-COURSE TESTS HIGH SCHOOL COMPLETION%
at/
abo
ve L
evel
3%
at/
abo
ve L
evel
3%
at/
abo
ve L
evel
3
0
10
20
30
40
50
60
70
80
90
100
Hispanic
Black
White
A.Indian
LEA
State
2018-192017-182016-17
0
10
20
30
40
50
60
70
80
90
100
Hispanic
Black
White
A.Indian
LEA
State
2018-192017-182016-17
*
>95
0
10
20
30
40
50
60
70
80
90
100
Hispanic
Black
White
A.Indian
LEA
State
2018-192017-182016-17
*
>95
Perc
enta
ge
of S
tud
ents
Perc
enta
ge
of S
tud
ents
ANNUAL DROPOUT RATES (GRADES 9-13)
Graduation Year
4-YEAR COHORT GRADUATION RATESMATH I
ENGLISH II
BIOLOGY
> = Scores changed due to data corrections.
* = Indicates that the student population in the subgroup is too small to report the value (Fewer than five students in the cohort. Beginning in 2015-16, this increased to fewer than ten students.)
n/a = Current year data are unavailable or contain no scores for the selected test.
<5 or >95 = The percentage and number of students are not shown if the percentage is greater than 95 percent or less than five percent.
State American Indian White Black HispanicLEA

30 | Source: Division of Accountability Services, NC Department of Public Instruction, 2019
HALIFAX COUNTY
0
10
20
30
40
50
60
70
80
90
100
Hispanic
Black
White
A.Indian
LEA
State
2018-192017-182016-17
>95
0
10
20
30
40
50
60
70
80
90
100
Hispanic
Black
White
A.Indian
LEA
State
2018-192017-182016-17
Halifax County Schools enrolled 2,333 students in 2018-19, of whom 153 (6.6%) are American Indian, mostly from the Haliwa-Saponi Indian Tribe. There are 11 campuses across the district, including two high schools and one early college. In the EOG and EOC tested subjects, the district proficiency rates for 2018-19 remained below the state averages. There was insufficient data to determine the proficiency rate for EOC Math I. In all other EOG and EOC tested areas the percentage of American Indian students who were proficient exceeded the district rate. Where data were provided, the proficiency rates reveal that American Indian students increased proficiency rates in EOG reading and math slightly. American Indian students performed above their Black and Hispanic peers in all EOG areas. Data was not provided for Hispanic or White peers in EOC areas, however, American Indian students showed higher proficiency rates in both EOC Biology (20.0%) and EOC English II (91.7%) than their Black peers. The 4-year Cohort Graduation rate and the Annual Dropout rate for American Indian students are not reported at the district level due to insufficient data.
DISTRICT CONTACT: TYRANA BATTLE http://www.halifax.k12.nc.us
NORTHEAST
% a
t/ab
ove
Lev
el 3
% a
t/ab
ove
Lev
el 3
END-OF-GRADE READING AND MATH (GRADES 3-8 COMBINED)
MATHREADING
Year State District American Indian White Black Hispanic
End-of-Grade Reading (Grades 3-8 Combined) – Percent at/above Level 32016-17 57.5 37.9 47.5 44.0 36.0 47.22017-18 57.3 38.4 50.0 61.0 35.6 55.62018-19 57.2 40.2 50.7 64.4 37.8 43.2
End-of-Grade Math (Grades 3-8 Combined) – Percent at/above Level 32016-17 55.4 35.8 46.3 36.0 34.2 43.42017-18 56.1 36.5 47.5 53.7 34.5 43.22018-19 58.6 37.2 50.7 56.8 35.5 31.8
Math I: End-of-Course – Percent at/above Level 32016-17 64.3 25.0 50.0 * 23.0 50.02017-18 57.4 16.7 27.3 * 16.7 *2018-19 41.2 13.1 * * 12.6 *
Biology: End-of-Course – Percent at/above Level 32016-17 56.1 25.0 27.3 * 24.3 *2017-18 58.3 28.7 * * 25.9 *2018-19 59.6 10.8 20.0 * 10.3 *
English II: End-of-Course – Percent at/above Level 32016-17 60.7 32.5 * * 31.4 *2017-18 59.8 27.2 * * 24.4 *2018-19 59.7 32.1 91.7 * 26.3 *4-Year Cohort Graduation Rate2016-17 86.5 74.3 * * 75.3 *2017-18 86.3 69.7 * * 69.1 90.9
2018-19 86.5 77.4 * * 77.5 *Annual Dropout Rate (Grades 9-13)2015-16 2.29 3.78 n/a n/a 3.96 n/a2016-17 2.31 3.73 n/a n/a 3.62 n/a2017-18 2.18 6.08 n/a n/a 5.91 n/a

31Source: Division of Accountability Services, NC Department of Public Instruction, 2019 |
40
50
60
70
80
90
100
Hispanic
Black
White
A.Indian
LEA
State
2018-192017-182016-17
n/a** * *** * *
0
2
4
6
8
10
12
Hispanic
Black
White
A.Indian
LEA
State
2017-182016-172015-16
>95
n/a n/an/an/an/a n/a n/a n/a n/a
END-OF-COURSE TESTS HIGH SCHOOL COMPLETION%
at/
abo
ve L
evel
3%
at/
abo
ve L
evel
3%
at/
abo
ve L
evel
3
0
10
20
30
40
50
60
70
80
90
100
Hispanic
Black
White
A.Indian
LEA
State
2018-192017-182016-17
*>95
* ** **
0
10
20
30
40
50
60
70
80
90
100
Hispanic
Black
White
A.Indian
LEA
State
2018-192017-182016-17
*
>95
* * ** ** *
0
10
20
30
40
50
60
70
80
90
100
Hispanic
Black
White
A.Indian
LEA
State
2018-192017-182016-17
*
>95
*** * * * * *
Perc
enta
ge
of S
tud
ents
Perc
enta
ge
of S
tud
ents
ANNUAL DROPOUT RATES (GRADES 9-13)
Graduation Year
4-YEAR COHORT GRADUATION RATESMATH I
ENGLISH II
BIOLOGY
> = Scores changed due to data corrections.
* = Indicates that the student population in the subgroup is too small to report the value (Fewer than five students in the cohort. Beginning in 2015-16, this increased to fewer than ten students.)
n/a = Current year data are unavailable or contain no scores for the selected test.
<5 or >95 = The percentage and number of students are not shown if the percentage is greater than 95 percent or less than five percent.
State American Indian White Black HispanicLEA

32 | Source: Division of Accountability Services, NC Department of Public Instruction, 2019
0
10
20
30
40
50
60
70
80
90
100
Hispanic
Black
White
A.Indian
LEA
State
2018-192017-182016-17
>95
* * ******
*
* 0
10
20
30
40
50
60
70
80
90
100
Hispanic
Black
White
A.Indian
LEA
State
2018-192017-182016-17
>95
* * **
*
** ** *
HALIWA-SAPONI TRIBAL SCHOOL
Approved as a charter school by the State Board of Education in 2000, the Haliwa-Saponi Tribal School had a total enrollment of 152 students, 98 (73.1%) of whom are American Indian, in 2018-19. The school is committed to the preservation of the Haliwa-Saponi traditions and integrates their customs and values across the curriculum. The school serves students in grades K-12 and is located in Warren County. The percentage of American Indian students demonstrating proficiency was much lower than that of the state in all subjects. American Indian students showed an increase in proficiency percentages in EOG Math, with a gain of 10.5 percentage points as well as an increase of 2.9 percentage points in EOC Biology. Conversely, there was a drop in American Indian students’ proficiency rate for EOG Reading by 14.4 percentage points. There was insufficient data for reporting the American Indian 4-Year Cohort Graduation as well as the annual dropout percentage rate for grades 9 – 13.
DISTRICT CONTACT: CONSUELA RICHARDSON http://hstsedu.org
NORTHEAST
% a
t/ab
ove
Lev
el 3
% a
t/ab
ove
Lev
el 3
END-OF-GRADE READING AND MATH (GRADES 3-8 COMBINED)
MATHREADING
Year State District American Indian White Black Hispanic
End-of-Grade Reading (Grades 3-8 Combined) – Percent at/above Level 32016-17 57.5 34.3 34.0 * * *
2017-18 57.3 37.7 42.2 * * *2018-19 57.2 29.0 27.8 * * *
End-of-Grade Math (Grades 3-8 Combined) – Percent at/above Level 32016-17 55.4 9.0 10.6 * * *2017-18 56.1 21.3 22.2 * * *2018-19 58.6 32.9 32.7 * * *
Math I: End-of-Course – Percent at/above Level 32016-17 64.3 21.7 26.7 * * *2017-18 57.4 13.3 9.1 * * *2018-19 41.2 7.1 9.1 * * *
Biology: End-of-Course – Percent at/above Level 32016-17 56.1 * * * * *2017-18 58.3 13.0 12.5 * * *
2018-19 59.6 11.8 15.4 * * *
English II: End-of-Course – Percent at/above Level 32016-17 60.7 20.0 * * * *2017-18 59.8 35.3 38.5 * * *2018-19 59.7 * * * * *4-Year Cohort Graduation Rate2016-17 86.5 70.0 64.3 n/a * *2017-18 86.3 81.3 84.6 n/a * n/a2018-19 86.5 69.2 * * * n/aAnnual Dropout Rate (Grades 9-13)2015-16 2.29 4.55 n/a n/a n/a n/a2016-17 2.31 9.23 n/a n/a n/a n/a2017-18 2.18 5.56 n/a n/a n/a n/a
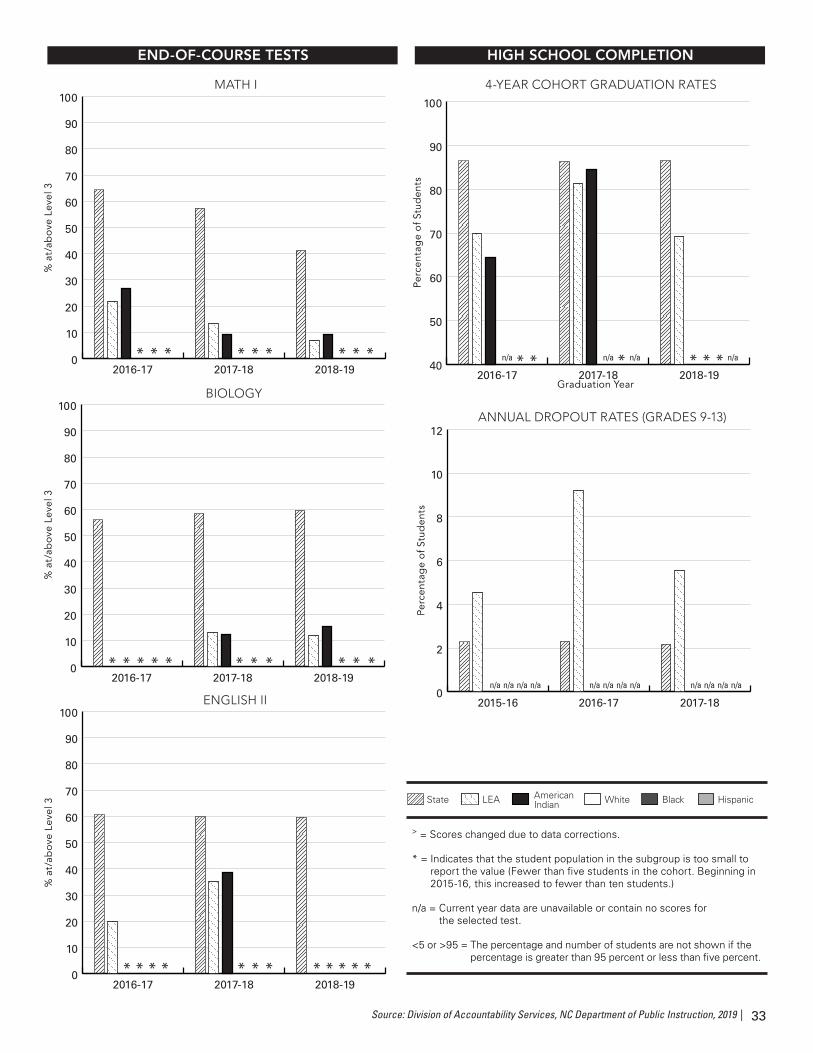
33Source: Division of Accountability Services, NC Department of Public Instruction, 2019 |
40
50
60
70
80
90
100
Hispanic
Black
White
A.Indian
LEA
State
2018-192017-182016-17
n/a n/a n/a n/a***** *
>95 >95
0
2
4
6
8
10
12
Hispanic
Black
White
A.Indian
LEA
State
2017-182016-172015-16
>95
n/an/a n/an/a n/an/a n/an/an/an/a n/an/a *
END-OF-COURSE TESTS HIGH SCHOOL COMPLETION
Perc
enta
ge
of S
tud
ents
% a
t/ab
ove
Lev
el 3
% a
t/ab
ove
Lev
el 3
Perc
enta
ge
of S
tud
ents
% a
t/ab
ove
Lev
el 3
0
10
20
30
40
50
60
70
80
90
100
Hispanic
Black
White
A.Indian
LEA
State
2018-192017-182016-17
*
>95
* *
<5 <5
** *** **
0
10
20
30
40
50
60
70
80
90
100
Hispanic
Black
White
A.Indian
LEA
State
2018-192017-182016-17
*
>95
* * ** * ** ** * *
0
10
20
30
40
50
60
70
80
90
100
Hispanic
Black
White
A.Indian
LEA
State
2018-192017-182016-17
*
>95
** ** **** ** **
ANNUAL DROPOUT RATES (GRADES 9-13)
Graduation Year
4-YEAR COHORT GRADUATION RATESMATH I
ENGLISH II
BIOLOGY
> = Scores changed due to data corrections.
* = Indicates that the student population in the subgroup is too small to report the value (Fewer than five students in the cohort. Beginning in 2015-16, this increased to fewer than ten students.)
n/a = Current year data are unavailable or contain no scores for the selected test.
<5 or >95 = The percentage and number of students are not shown if the percentage is greater than 95 percent or less than five percent.
State American Indian White Black HispanicLEA

34 | Source: Division of Accountability Services, NC Department of Public Instruction, 2019
HERTFORD COUNTY
Hertford County Schools in 2018-19 enrolled approximately 2,658 students, of whom 24 (0.90%) identified as American Indian, mainly of the Meherrin Tribe. The district operates seven schools, three elementary, one middle, two high schools, and one early college. Data for 2018-19 showed that district proficiency rates lagged behind the state in most EOG and EOC tested subjects except for EOC Biology. Proficiency rates for American Indian students in both EOG areas was above the district and the rate in EOG Reading was above the state. In addition, American Indian students showed a proficiency rate above all peer subgroups for EOG Reading and they were above their Black peers in EOG Math. Data was not reported for any EOC areas and there was insufficient data for the 4-Year Cohort Graduation rate or the annual dropout rate.
http://www.hertford.k12.nc.us
0
10
20
30
40
50
60
70
80
90
100
Hispanic
Black
White
A.Indian
LEA
State
2018-192017-182016-17
*
* * 0
10
20
30
40
50
60
70
80
90
100
Hispanic
Black
White
A.Indian
LEA
State
2018-192017-182016-17* *
*
NORTHEAST
% a
t/ab
ove
Lev
el 3
% a
t/ab
ove
Lev
el 3
END-OF-GRADE READING AND MATH (GRADES 3-8 COMBINED)
MATHREADING
Year State District American Indian White Black Hispanic
End-of-Grade Reading (Grades 3-8 Combined) – Percent at/above Level 32016-17 57.5 37.2 * 59.0 32.5 40.72017-18 57.3 38.5 * 63.9 33.2 42.92018-19 57.2 38.2 70.0 58.4 33.8 45.5
End-of-Grade Math (Grades 3-8 Combined) – Percent at/above Level 32016-17 55.4 33.9 * 54.8 29.2 40.02017-18 56.1 32.8 * 46.8 28.8 38.82018-19 58.6 34.5 40.0 57.1 30.0 40.0
Math I: End-of-Course – Percent at/above Level 32016-17 64.3 43.5 * 49.0 39.5 54.52017-18 57.4 34.2 * 48.6 29.2 60.02018-19 41.2 28.0 * 54.3 22.5 *
Biology: End-of-Course – Percent at/above Level 32016-17 56.1 55.1 * 61.8 53.7 *2017-18 58.3 59.0 * 75.8 54.1 *2018-19 59.6 68.5 * 84.0 65.3 60.0
English II: End-of-Course – Percent at/above Level 32016-17 60.7 48.5 * 63.6 44.6 *2017-18 59.8 44.9 * 52.9 41.9 *2018-19 59.7 50.6 * 81.5 44.0 *4-Year Cohort Graduation Rate2016-17 86.5 82.4 n/a 70.8 85.0 *2017-18 86.3 85.5 * 75.8 86.4 >952018-19 86.5 79.0 * 72.2 80.7 *Annual Dropout Rate (Grades 9-13)2015-16 2.29 2.66 n/a n/a 2.75 n/a2016-17 2.31 3.61 n/a n/a 3.46 n/a2017-18 2.18 2.86 n/a n/a 2.66 n/a

35Source: Division of Accountability Services, NC Department of Public Instruction, 2019 |
40
50
60
70
80
90
100
Hispanic
Black
White
A.Indian
LEA
State
2018-192017-182016-17
n/a
>95
* * **
0
2
4
6
8
10
12
Hispanic
Black
White
A.Indian
LEA
State
2017-182016-172015-16
>95
n/a n/an/a n/a n/a n/a n/a n/an/a
END-OF-COURSE TESTS HIGH SCHOOL COMPLETION
Perc
enta
ge
of S
tud
ents
% a
t/ab
ove
Lev
el 3
% a
t/ab
ove
Lev
el 3
Perc
enta
ge
of S
tud
ents
% a
t/ab
ove
Lev
el 3
Graduation Year
0
10
20
30
40
50
60
70
80
90
100
Hispanic
Black
White
A.Indian
LEA
State
2018-192017-182016-17* ***
**
>95
*
0
10
20
30
40
50
60
70
80
90
100
Hispanic
Black
White
A.Indian
LEA
State
2018-192017-182016-17* * * **
0
10
20
30
40
50
60
70
80
90
100
Hispanic
Black
White
A.Indian
LEA
State
2018-192017-182016-17
*
>95
* **** *
ANNUAL DROPOUT RATES (GRADES 9-13)
4-YEAR COHORT GRADUATION RATESMATH I
ENGLISH II
BIOLOGY
> = Scores changed due to data corrections.
* = Indicates that the student population in the subgroup is too small to report the value (Fewer than five students in the cohort. Beginning in 2015-16, this increased to fewer than ten students.)
n/a = Current year data are unavailable or contain no scores for the selected test.
<5 or >95 = The percentage and number of students are not shown if the percentage is greater than 95 percent or less than five percent.
State American Indian White Black HispanicLEA

36 | Source: Division of Accountability Services, NC Department of Public Instruction, 2019
HOKE COUNTY
0
10
20
30
40
50
60
70
80
90
100
Hispanic
Black
White
A.Indian
LEA
State
2018-192017-182016-17
>95
0
10
20
30
40
50
60
70
80
90
100
Hispanic
Black
White
A.Indian
LEA
State
2018-192017-182016-17
>95
Hoke County Schools enrolled 8,630 students, which included 698 (8.1%) American Indians in 2018-19. Students attend one of 14 schools, which include one high school, one alternative school, and an early college. In 2018-19, the district proficiency rate was lower than the state rate for all EOG and EOC tested subjects except for EOC Biology. For American Indian students, deficits were noted in each EOG and EOC tested subjects. The proficiency rates for American Indian students in all EOG and EOC subjects were lower than all racial and ethnic groups in the district. The 4-Year Cohort Graduation rate for American Indians (67.1%) was lower than both district (80.4%) and state (86.5%) rates. The annual dropout rate for American Indians decreased slightly from 3.91 percent in 2016-17, to 3.89 percent in 2017-18 and remains above the state, district and their Black peers.
DISTRICT CONTACT: ELIZABETH MITCHELL http://www.hcs.k12.nc.us
SANDHILLS
% a
t/ab
ove
Lev
el 3
% a
t/ab
ove
Lev
el 3
END-OF-GRADE READING AND MATH (GRADES 3-8 COMBINED)
MATHREADING
Year State District American Indian White Black Hispanic
End-of-Grade Reading (Grades 3-8 Combined) – Percent at/above Level 32016-17 57.5 51.0 33.4 68.5 42.0 47.12017-18 57.3 51.3 36.2 69.5 44.0 44.52018-19 57.2 51.9 40.3 67.6 45.6 44.2
End-of-Grade Math (Grades 3-8 Combined) – Percent at/above Level 32016-17 55.4 54.6 41.6 68.3 43.9 57.22017-18 56.1 53.9 40.1 67.2 45.5 53.62018-19 58.6 53.5 40.6 66.6 44.0 54.2
Math I: End-of-Course – Percent at/above Level 32016-17 64.3 75.2 63.0 85.0 66.6 84.12017-18 57.4 59.7 42.9 77.2 51.5 61.52018-19 41.2 24.5 15.8 37.3 20.9 29.0
Biology: End-of-Course – Percent at/above Level 32016-17 56.1 48.7 24.3 71.4 39.8 52.92017-18 58.3 53.2 40.9 77.2 43.8 59.12018-19 59.6 59.6 37.1 80.4 45.4 66.9
English II: End-of-Course – Percent at/above Level 32016-17 60.7 50.4 31.9 73.2 42.0 55.12017-18 59.8 54.5 37.3 74.8 46.7 54.32018-19 59.7 55.9 31.0 70.3 44.6 65.54-Year Cohort Graduation Rate2016-17 86.5 78.8 73.2 78.6 80.0 80.02017-18 86.3 81.7 77.0 82.2 83.4 81.92018-19 86.5 80.4 67.1 78.2 85.3 84.3Annual Dropout Rate (Grades 9-13)2015-16 2.29 1.77 3.81 1.83 0.99 n/a2016-17 2.31 1.76 3.91 n/a 1.98 n/a2017-18 2.18 1.89 3.89 n/a 1.65 n/a

37Source: Division of Accountability Services, NC Department of Public Instruction, 2019 |
40
50
60
70
80
90
100
Hispanic
Black
White
A.Indian
LEA
State
2018-192017-182016-17
0
2
4
6
8
10
12
Hispanic
Black
White
A.Indian
LEA
State
2017-182016-172015-16
>95
n/an/an/an/an/a
END-OF-COURSE TESTS HIGH SCHOOL COMPLETION
Perc
enta
ge
of S
tud
ents
% a
t/ab
ove
Lev
el 3
% a
t/ab
ove
Lev
el 3
Perc
enta
ge
of S
tud
ents
% a
t/ab
ove
Lev
el 3
0
10
20
30
40
50
60
70
80
90
100
Hispanic
Black
White
A.Indian
LEA
State
2018-192017-182016-17
*
>95
0
10
20
30
40
50
60
70
80
90
100
Hispanic
Black
White
A.Indian
LEA
State
2018-192017-182016-17
*
>95>95
0
10
20
30
40
50
60
70
80
90
100
Hispanic
Black
White
A.Indian
LEA
State
2018-192017-182016-17
*
>95
ANNUAL DROPOUT RATES (GRADES 9-13)
Graduation Year
4-YEAR COHORT GRADUATION RATESMATH I
ENGLISH II
BIOLOGY
> = Scores changed due to data corrections.
* = Indicates that the student population in the subgroup is too small to report the value (Fewer than five students in the cohort. Beginning in 2015-16, this increased to fewer than ten students.)
n/a = Current year data are unavailable or contain no scores for the selected test.
<5 or >95 = The percentage and number of students are not shown if the percentage is greater than 95 percent or less than five percent.
State American Indian White Black HispanicLEA