Embed Size (px)
Citation preview

Our core value:Supporting our customers’
2 0 0 7 A N N U A L R E P O R T
( N Y S E : O F G ) www.OrientalOnline.com
�nancial aspirations

Table of Contents
Oriental Financial Group
1 Financial Highlights
2 From the Chairman of the Board to our Shareholders
3 Board of Directors
4 From the President & CEO to our Shareholders
10 Leadership Team
12 Form 10-K
General Information
Table of Contents
www.OrientalOnline.com
B U S I N E S S L I N E S
( N Y S E : O F G )
Banking Consumer / Commercial
Mortgage
Brokerage
Trust
Insurance
Pension Plans
Oriental Financial Group
�
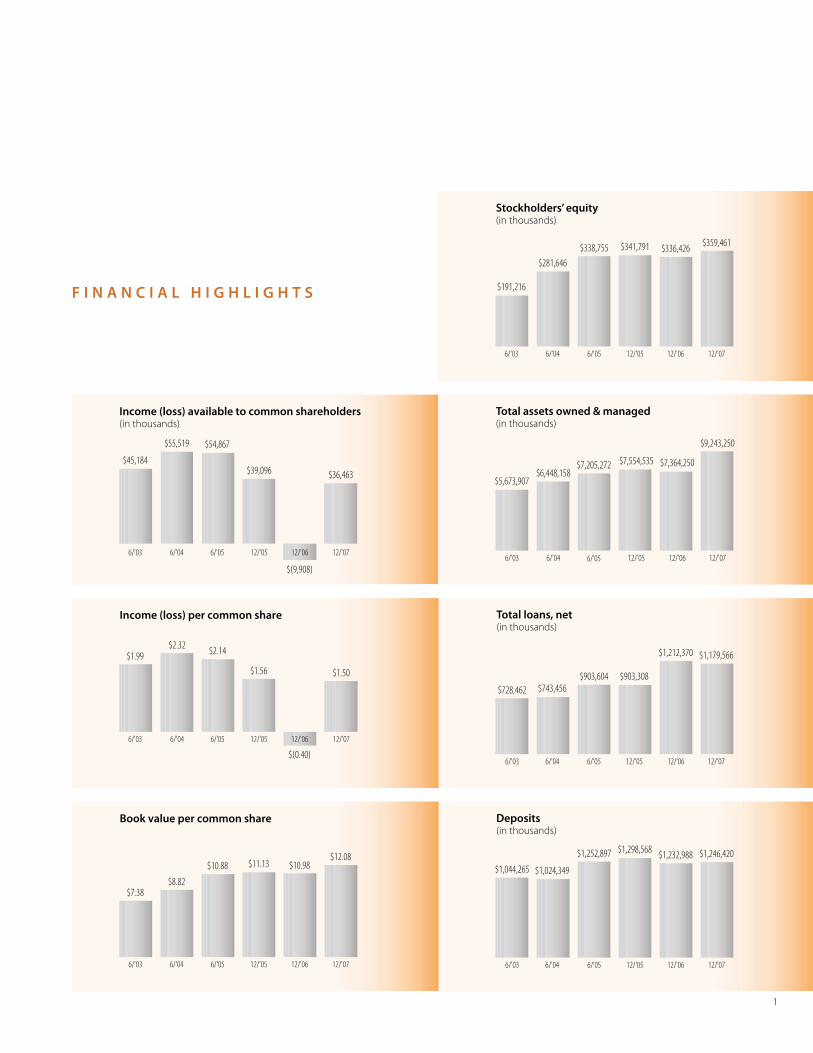
F I N A N C I A L H I G H L I G H T S
Income (loss) available to common shareholders (in thousands)
Income (loss) per common share
Book value per common share
Stockholders’ equity (in thousands)
Total assets owned & managed (in thousands)
Total loans, net (in thousands)
6/'03 6/'04 6/'05 12/'05 12/'06 12/'07
6/'03 6/'04 6/'05 12/'05 12/'06 12/'07
6/'03 6/'04 6/'05 12/'05 12/'06 12/'07
6/'03 6/'04 6/'05 12/'05 12/'06 12/'07
6/'03 6/'04 6/'05 12/'05 12/'06 12/'07
6/'03 6/'04 6/'05 12/'05 12/'06 12/'07
6/'03 6/'04 6/'05 12/'05 12/'06 12/'07
$45,184
$55,519 $54,867
$39,096
$(9,908)
$36,463
$1.99$2.32 $2.14
$1.56
$(0.40)
$1.50
$7.38$8.82
$10.88 $11.13 $10.98$12.08
$191,216
$281,646$338,755 $341,791 $336,426 $359,461
$5,673,907$6,448,158
$7,205,272 $7,554,535 $7,364,250
$9,243,250
$728,462 $743,456$903,604 $903,308
$1,212,370 $1,179,566
$1,044,265 $1,024,349
$1,252,897 $1,298,568 $1,232,988 $1,246,420
Deposits (in thousands)

� �
and work closely with members of
management to achieve and sustain the
highest possible performance levels.
Towards the end of this past year, we
added a new member to the Board, Héctor
J. Vázquez-Muñiz, who brings considerable
experience in financial risk management,
adding to the already broad backgrounds
that our existing Directors share in
accounting, business, government affairs,
real estate and other areas.
Thank you for your confidence in us.
These are difficult economic times
through which we are passing, both in
Puerto Rico and the United States, but
be assured that the Board, together with
an excellent management team, remains
dedicated to realizing our goals for the
future. Oriental Financial Group has a
fine and distinguished history as one of
Puerto Rico’s leading financial institutions,
and our commitment is to continue
that excellent tradition on behalf of its
shareholders and the community it serves.
José J. Gil de Lamadrid
Chairman of the Board of Directors
On behalf of my colleagues on the
Board, I would like to extend our best
wishes to our Shareholders. We are
pleased with the financial performance
of Oriental this past year, and we
congratulate the management team on its
accomplishments.
Our Board, consisting of independent
directors, and only one current member
of management, CEO and President
José Rafael Fernández, has as its primary
function, consistent with the best interests
of all constituents, the formation and
oversight of the policies by which the
Group and its subsidiaries are managed.
In addition to regular monthly meetings
of the Board, each of us participates in
meetings of various Board committees;
Compensation, Governance, Audit and the
Boards of our subsidiaries. My fellow Board
members have my appreciation for their
commitment and dedication as evidenced
by their almost perfect attendance at all
Board and committee meetings.
Among our Board’s objectives is the
assurance that the Group adheres to
the highest standards of corporate
responsibility and governance. We take
these responsibilities very seriously
F R O M T H E C H A I R M A N O F T H E B O A R D T O O U R S H A R E H O L D E R S

� �
From left:
Pedro Morazzani-Ferrer, CPA;
Carlos O. Souffront, Esq.;
Mari Carmen Aponte, Esq.;
Pablo Iván Altieri, M.D.;
Juan Carlos Aguayo, P.E.;
Francisco Arriví;
Héctor J. Vázquez Muñiz, CPA;
Nelson García-Mangual, CPA.
Seated from left:
José Rafael Fernández;
José J. Gil de Lamadrid, CPA.
José J. Gil de Lamadrid, CPA - Chairman of the Board, Oriental Financial Group
José Rafael Fernández - President and CEO, Inc. of Oriental Financial Group
Juan Carlos Aguayo, P.E. - President and CEO of Structural Steel Works, Inc.
Pablo Iván Altieri, M.D.
Mari Carmen Aponte, Esq.
Francisco Arriví - President and CEO of Pulte Homes International Caribbean Corp.
Nelson García-Mangual, CPA - President of Impress Quality Printing
Pedro Morazzani-Ferrer, CPA - Partner, CPA Firm Zayas, Morazzani & Co.
Héctor J. Vázquez Muñiz, CPA
Carlos O. Souffront, Esq. - Board Secretary
B O A R D O F D I R E C T O R S

� �
F R O M T H E P R E S I D E N T & C E O T O O U R S H A R E H O L D E R S

� �
�007 was a highly successful year.
Income available to common
shareholders rebounded to $�6.�
million, or $�.�0 per common share,
compared to a year-ago loss. Book
value per common share of $��.08
was up �0.0% from a year ago.
We believe that the Group is entering
�008 on solid footing and is off to a
strong start as we move to further
integrate the delivery of banking and
financial products and services for our
mid- and high-net worth customers
in Puerto Rico.

6 7
If we can do that, we will help people in
Puerto Rico achieve their goals. We will
make Oriental Group a better investment,
and we will continue to live up to our
promise “Aquí tu dinero crece.” With us,
your money grows.
�007 Results & Accomplishments
Our performance reflected a number of
accomplishments -- the repositioning of
our securities portfolio and related funding,
growth in financial services, controlling
non-interest expenses, our conservative
lending policies, and the continued
strengthening of our management team.
Net Interest Income
Net interest income, our largest source of
revenues, increased 69.�%, to $67.� million
in �007. Growth reflected a ��.6% increase
in interest income from investment
securities and loans, while total interest
expenses rose by only half as much. This
was primarily due to repositioning of the
available-for-sale portfolio (AFS) and related
funding in late �006-early �007.
We also replaced lower yielding
investments that matured in the held-
to-maturity portfolio with new, higher
yielding securities for the AFS portfolio, and
the balance of our borrowings, as well as
our deposits, benefited from the Federal
Reserve Bank’s decision to cut interest rates.
Oriental Group was able to match groups
of new securities with related funding in
order to realize favorable spreads, reduce
interest rate sensitivity and produce
steadier net interest income growth from
investment securities over longer periods.
Our Vision of Financial Planning
Financial planning is one of the keys to
success in helping individuals and families
to achieve their monetary and lifetime
goals. At one time, access to planning and
the necessary products were available only
for the wealthy few. Nowadays, technology
has made it easier than ever to access
these financial products. The challenge
remains, however, in getting the right
advice and services.
At Oriental Group, our vision is to bring
all the benefits of sophisticated financial
planning to our core customers in an
efficient manner. We’ve already taken
great strides, but there is even greater
opportunity. To achieve that, we are:
�. Launching a systematic method to get
to know each of our customers’ needs,
goals and aspirations, so we can help
them plan for the future.
�. Creating streamlined processes so that
we can deliver value added advice,
products and services, on a consistent
basis, throughout our branch network.
�. Training our people to develop long-
term customer relationships, provide the
right advice, and intimately understand
all financial planning products.
�. Remodeling and relocating our branches
to ensure we are attracting and
providing convenient access to our core
mid- and high-net worth customers.
�. Implementing all of the above in a
highly efficient manner so as to leverage
our existing infrastructure as much as
possible.

6 7
Primarily due to economic conditions
in Puerto Rico, �007 was a challenging
year for our mortgage business. In
response, we right-sized our production
department and expanded our wholesale
mortgage purchasing team. To further
expand our mortgage business in �008,
we entered into an exclusive alliance to
supply mortgages, in line with our credit
standards, to Citigroup’s Primerica Financial
Services for its clients in Puerto Rico.
Considering the state of the economy, our
commercial lending business held up well
in �007. In �008, we plan to offer new cash
management products to develop the
deposit side of our commercial business,
and through an exclusive relationship with
The Sage Group plc, which markets point
of sale solutions, we expect to increase our
commercial retail clientele.
Credit Quality
One of Oriental’s priorities in loan
management is maintaining high credit
quality, which helps to improve profitability
and build our capital base. While net credit
losses and non-performing mortgage loans
increased in �007, our net credit losses, at
0.�7% of total loans outstanding, were well
below the 0.88% average for Puerto Rico
banks as a group. We do not anticipate
the increase in non-performing residential
mortgage loans will lead to significantly
higher net credit losses as these loans are
generally well collateralized with adequate
loan-to-value ratios.
Non-Interest Revenues
Non-interest revenues from banking and
financial services, our other major recurring
source of revenues, increased slightly in
�007, primarily due to a 7.9% increase in
financial service revenues.
Our retail businesses generated increased
fees from brokerage, wealth management,
asset protection, and personal trust and
retirement programs, including Keogh and
Individual Retirement Accounts. We also
expanded revenues in our corporate trust
and retirement businesses, which involve
setting up �0�K programs and managing
the administration of private pension plans
through our subsidiary, Caribbean Pension
Consultants. Trust assets managed grew
6.�% in �007 and broker dealer assets
managed increased ��.0%.
In marketing, we also rely on offering the
right kind of deposit products to attract
customers. The success of our Oriental
Money account generated a significant
increase in savings deposits in �007,
enabling us to grow core deposits and
reduce the use of more costly wholesale
certificates of deposit.
Loan Production
Oriental’s lending activities are focused
on residential mortgages and commercial
loans. We are highly conservative, with
more than 90% of our mortgage portfolio
featuring fixed-rate, fully amortizing, and
fully documented loans. In commercial
lending, more than 90% of our loans are
collateralized with real estate.

8 9
Our five key strategies
1 Expand our retail and wholesale mortgage businesses and
our commercial lending operations
2 Integrate and innovate the delivery of financial and banking services
for mid net worth clients through all our financial centers
3 Develop a robust, wealth management business for high net worth clients
4 Diversify interest income and reduce interest rate sensitivity
5 Vigorously manage and control expenses
Our five key strategies

8 9
Executive Team
We continued to strengthen our executive
team in �007, most recently with the
appointment of Lidio V. Soriano as
Executive Vice President in charge of the
Group’s Retail Banking, Financial Service
and Mortgage Divisions. Lidio is the former
head of Citibank’s consumer mortgage
operation in Puerto Rico. His joining
Oriental follows our appointment last
year of Julio R. Micheo as Senior Executive
Vice President and Chief Investment
Officer, in charge of our Institutional
businesses. Julio’s responsibilities include
the investment securities portfolios,
investment banking, and the wholesale
purchases of mortgages and their sale into
the secondary market.
Outlook
We are well positioned for the challenges
ahead, particularly in light of the
recessionary environment in Puerto Rico.
None of our accomplishments in �007
would have been possible, nor can we
hope to achieve our goals, without the
loyal and dedicated support of our staff,
shareholders, partners in the marketplace,
management and executive teams, and
our Board of Directors. They have our
sincerest appreciation.
José Rafael Fernández
President and Chief Executive Officer
Non-Interest Expenses
An important accomplishment in �007
was containing the growth of non-interest
expenses to only �.9%, thereby improving
our operating leverage. During �007, we
completed the updating of our technology,
moving our banking platform to Metavante
Corporation. This follows the transfer in
�006 of our platforms for wrap accounts
to Fidelity’s National Financial Services
and for consumer Internet access to S�
Corporation. This combination of world-
class technologies provides us with one
of the most advanced banking-financial
services infrastructures in Puerto Rico.
Stockholders’ Equity
Once again, the Group ended the year with
some of the strongest capital ratios among
Puerto Rico banks. Stockholders’ equity
increased 6.8% in �007, to $��9.� million
from a year ago. Our Leverage Capital Ratio
was �.7 times higher than the minimum,
Tier I Risk-Based Capital Ratio was �.7 times
higher, and Total Risk-Based Capital Ratio
was �.� times higher. We also repurchased
�.�% of shares in the open market in �007
at an average price of $9.�9 each, and the
Board of Directors doubled the size of our
repurchase program to $�� million. At
year end, $��.� million of authorization
remained.

�0 ��
Executive Team
José Rafael Fernández, President and CEO
Julio Micheo, CPA, Senior Executive VP and Chief Investments Officer
Lidio Soriano, CPA, Executive VP Banking, Mortgage and Oriental Financial Services
Norberto González, CPA, JD, Executive VP & Chief Financial Officer
Ganesh Kumar, Executive VP Strategic Planning & Operations
Officers
José Rafael Fernández, President and CEO
Julio Micheo, CPA, Senior Executive VP and Chief Investments Officer
Lidio Soriano, CPA, Executive VP Banking, Mortgage and Oriental Financial Services
Norberto González, CPA, JD, Executive VP & Chief Financial Officer
Ganesh Kumar, Executive VP Strategic Planning & Operations
Luis Raúl Salvá, Senior VP, Chief Lending Officer
Mari Evelyn Rodríguez, Senior VP Strategic Planning & Marketing
César A. Ortíz, CPA, Esq., Senior VP and Chief Risk Officer
Grettel Báez, CPA, VP and General Auditor
José Gabriel Díaz, Esq., First Senior VP & Executive Trust Officer
Francisco Portero, Senior VP Commercial Banking
Bill Hummer, President Caribbean Pension Consultants (CPC)
Juan José Santiago, CPA, Senior VP IRA & Keogh Trust Office
Ana T. Ramos, Senior VP Information Technology
Carlos Viña, CPA, Senior VP and Controller
Patrick Dunn, Senior VP Operations – Oriental Financial Services
Rafael Cruz, Eng., Senior VP Operations
L E A D E R S H I P T E A M

�0 ��
From left:
Julio Micheo;
José Rafael Fernández;
Norberto González.
Seated from left:
Lidio Soriano;
Ganesh Kumar.

��
F O R M 1 0 - K
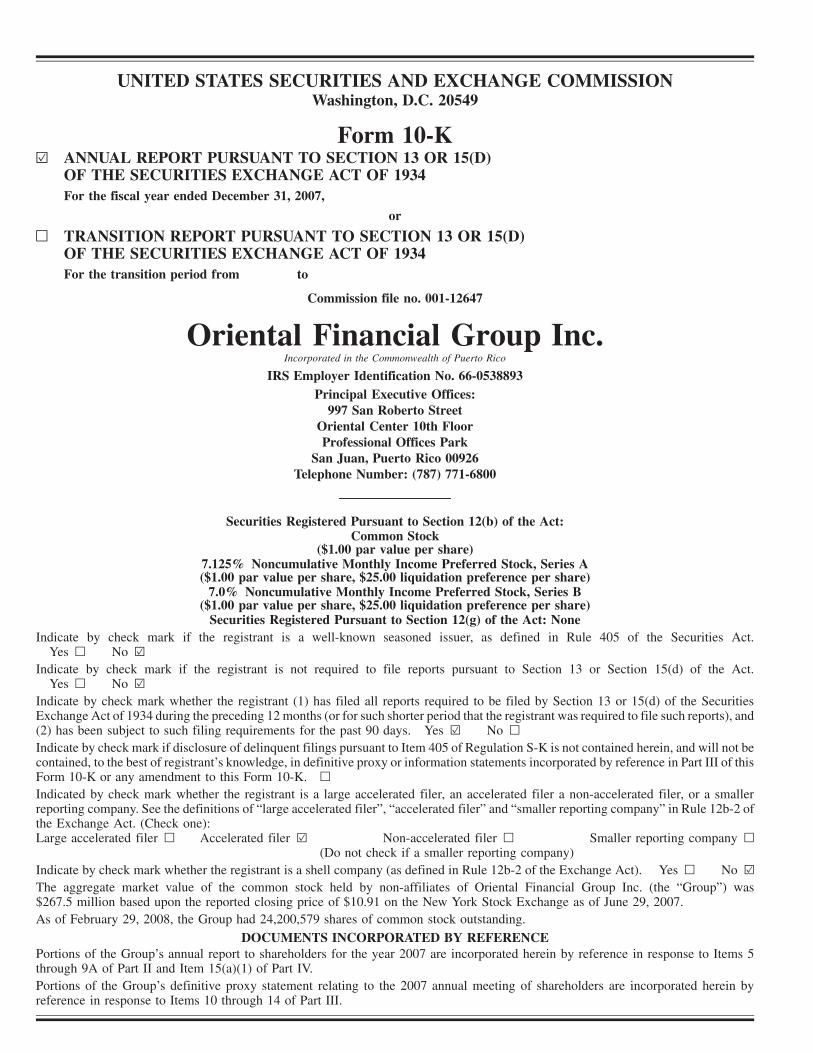
UNITED STATES SECURITIES AND EXCHANGE COMMISSIONWashington, D.C. 20549
Form 10-K¥ ANNUAL REPORT PURSUANT TO SECTION 13 OR 15(D)
OF THE SECURITIES EXCHANGE ACT OF 1934For the fiscal year ended December 31, 2007,
or
n TRANSITION REPORT PURSUANT TO SECTION 13 OR 15(D)OF THE SECURITIES EXCHANGE ACT OF 1934For the transition period from to
Commission file no. 001-12647
Oriental Financial Group Inc.Incorporated in the Commonwealth of Puerto Rico
IRS Employer Identification No. 66-0538893Principal Executive Offices:
997 San Roberto StreetOriental Center 10th FloorProfessional Offices Park
San Juan, Puerto Rico 00926Telephone Number: (787) 771-6800
Securities Registered Pursuant to Section 12(b) of the Act:Common Stock
($1.00 par value per share)7.125% Noncumulative Monthly Income Preferred Stock, Series A($1.00 par value per share, $25.00 liquidation preference per share)
7.0% Noncumulative Monthly Income Preferred Stock, Series B($1.00 par value per share, $25.00 liquidation preference per share)
Securities Registered Pursuant to Section 12(g) of the Act: NoneIndicate by check mark if the registrant is a well-known seasoned issuer, as defined in Rule 405 of the Securities Act.
Yes n No ¥
Indicate by check mark if the registrant is not required to file reports pursuant to Section 13 or Section 15(d) of the Act.Yes n No ¥
Indicate by check mark whether the registrant (1) has filed all reports required to be filed by Section 13 or 15(d) of the SecuritiesExchange Act of 1934 during the preceding 12 months (or for such shorter period that the registrant was required to file such reports), and(2) has been subject to such filing requirements for the past 90 days. Yes ¥ No n
Indicate by check mark if disclosure of delinquent filings pursuant to Item 405 of Regulation S-K is not contained herein, and will not becontained, to the best of registrant’s knowledge, in definitive proxy or information statements incorporated by reference in Part III of thisForm 10-K or any amendment to this Form 10-K. n
Indicated by check mark whether the registrant is a large accelerated filer, an accelerated filer a non-accelerated filer, or a smallerreporting company. See the definitions of “large accelerated filer”, “accelerated filer” and “smaller reporting company” in Rule 12b-2 ofthe Exchange Act. (Check one):Large accelerated filer n Accelerated filer ¥ Non-accelerated filer n Smaller reporting company n
(Do not check if a smaller reporting company)Indicate by check mark whether the registrant is a shell company (as defined in Rule 12b-2 of the Exchange Act). Yes n No ¥
The aggregate market value of the common stock held by non-affiliates of Oriental Financial Group Inc. (the “Group”) was$267.5 million based upon the reported closing price of $10.91 on the New York Stock Exchange as of June 29, 2007.As of February 29, 2008, the Group had 24,200,579 shares of common stock outstanding.
DOCUMENTS INCORPORATED BY REFERENCEPortions of the Group’s annual report to shareholders for the year 2007 are incorporated herein by reference in response to Items 5through 9A of Part II and Item 15(a)(1) of Part IV.Portions of the Group’s definitive proxy statement relating to the 2007 annual meeting of shareholders are incorporated herein byreference in response to Items 10 through 14 of Part III.
ORIENTAL FINANCIAL GROUP INC.
FORM 10-K
For the Year Ended December 31, 2007
TABLE OF CONTENTS
PART IItem 1. Business . . . . . . . . . . . . . . . . . . . . . . . . . . . . . . . . . . . . . . . . . . . . . . . . . . . . . . . . . . . . . . 3-16
Item 1A. Risk Factors . . . . . . . . . . . . . . . . . . . . . . . . . . . . . . . . . . . . . . . . . . . . . . . . . . . . . . . . . . . 16-20Item 1B. Unresolved Staff Comments . . . . . . . . . . . . . . . . . . . . . . . . . . . . . . . . . . . . . . . . . . . . . . . 20
Item 2. Properties . . . . . . . . . . . . . . . . . . . . . . . . . . . . . . . . . . . . . . . . . . . . . . . . . . . . . . . . . . . . . 20
Item 3. Legal Proceedings . . . . . . . . . . . . . . . . . . . . . . . . . . . . . . . . . . . . . . . . . . . . . . . . . . . . . . . 20-21
Item 4. Submissions of Matters to a Vote of Security Holders. . . . . . . . . . . . . . . . . . . . . . . . . . . . . 21
PART IIItem 5. Market for Registrant’s Common Equity, Related Stockholder Matters and Issuer Purchases
of Equity Securities . . . . . . . . . . . . . . . . . . . . . . . . . . . . . . . . . . . . . . . . . . . . . . . . . . . . . . 21-22
Item 6. Selected Financial Data . . . . . . . . . . . . . . . . . . . . . . . . . . . . . . . . . . . . . . . . . . . . . . . . . . . 22-23
Item 7. Management’s Discussion and Analysis of Financial Condition and Results of Operations . . 23
Item 7A. Quantitative and Qualitative Disclosures About Market Risk. . . . . . . . . . . . . . . . . . . . . . . . 23
Item 8. Financial Statements and Supplementary Data . . . . . . . . . . . . . . . . . . . . . . . . . . . . . . . . . . 23
Item 9. Changes in and Disagreements with Accountants on Accounting and Financial Disclosure. . 23
Item 9A. Controls and Procedures . . . . . . . . . . . . . . . . . . . . . . . . . . . . . . . . . . . . . . . . . . . . . . . . . . 23-24
Item 9B. Other Information . . . . . . . . . . . . . . . . . . . . . . . . . . . . . . . . . . . . . . . . . . . . . . . . . . . . . . . 24
PART IIIItem 10. Directors, Executive Officers and Corporate Governance . . . . . . . . . . . . . . . . . . . . . . . . . . 24
Item 11. Executive Compensation . . . . . . . . . . . . . . . . . . . . . . . . . . . . . . . . . . . . . . . . . . . . . . . . . . 24
Item 12. Security Ownership of Certain Beneficial Owners and Management and RelatedStockholder Matters . . . . . . . . . . . . . . . . . . . . . . . . . . . . . . . . . . . . . . . . . . . . . . . . . . . . . 24
Item 13. Certain Relationships, Related Transactions, and Director Independence . . . . . . . . . . . . . . . 24
Item 14. Principal Accountant Fees and Services . . . . . . . . . . . . . . . . . . . . . . . . . . . . . . . . . . . . . . . 24
PART IVItem 15. Exhibits and Financial Statement Schedules . . . . . . . . . . . . . . . . . . . . . . . . . . . . . . . . . . . . 24-26
2
FORWARD-LOOKING STATEMENTS
When used in this Form 10-K or future filings by Oriental Financial Group Inc. (the “Group”) with the Securitiesand Exchange Commission (the “SEC”), in the Group’s press releases or other public or shareholder communi-cations, or in oral statements made with the approval of an authorized executive officer, the words or phrases “wouldbe,” “will allow,” “intends to,” “will likely result,” “are expected to,” “will continue,” “is anticipated,” “estimated,”“project,” “believe,” “should” or similar expressions are intended to identify “forward-looking statements” withinthe meaning of the Private Securities Litigation Reform Act of 1995.
The future results of the Group could be affected by subsequent events and could differ materially from thoseexpressed in forward-looking statements. If future events and actual performance differ from the Group’sassumptions, the actual results could vary significantly from the performance projected in the forward-lookingstatements.
The Group wishes to caution readers not to place undue reliance on any such forward-looking statements, whichspeak only as of the date made and are based on management’s current expectations, and to advise readers thatvarious factors, including regional and national economic conditions, substantial changes in levels of marketinterest rates, credit and other risks of lending and investment activities, competitive, and regulatory factors,legislative changes and accounting pronouncements, could affect the Group’s financial performance and couldcause the Group’s actual results for future periods to differ materially from those anticipated or projected. TheGroup does not undertake, and specifically disclaims, any obligation to update any forward-looking statements toreflect occurrences or unanticipated events or circumstances after the date of such statements.
PART I
ITEM 1. BUSINESS
General
The Group is a publicly-owned financial holding company incorporated on June 14, 1996 under the laws of theCommonwealth of Puerto Rico, providing a full range of financial services through its subsidiaries. The Group issubject to the provisions of the U.S. Bank Holding Company Act of 1956, as amended, (the “BHC Act”) and,accordingly, subject to the supervision and regulation of the Board of Governors of the Federal Reserve System (the“Federal Reserve Board”).
The Group provides comprehensive financial services to its clients through a complete range of banking andfinancial solutions, including mortgage, commercial and consumer lending; checking and savings accounts;financial planning, insurance, asset management, and investment brokerage; and corporate and individual trust andretirement services. The Group operates through three major business segments: Banking, Treasury and FinancialServices, and distinguishes itself based on quality service and marketing efforts focused on mid and high net worthindividuals and families, including professionals and owners of small and mid-sized businesses, primarily in PuertoRico. The Group has 24 financial centers in Puerto Rico and a subsidiary, Caribbean Pension Consultants Inc.(“CPC”), based in Boca Raton, Florida. The Group’s long-term goal is to strengthen its banking-financial servicesfranchise by expanding its lending businesses, increasing the level of integration in the marketing and delivery ofbanking and financial services, continuing to maintain effective asset-liability management, growing non-interestrevenues from banking and financial services, and improving operating efficiencies.
The Group’s strategy involves:
(1) Strengthening its banking-financial services franchise by expanding its ability to attract deposits andbuild relationships with mid net worth individual customers and professional and mid-market commercialbusinesses through aggressive marketing and expansion of its sales force;
(2) Focusing on greater growth in mortgage, commercial and consumer lending; insurance products,trust and wealth management services, which traditionally have been one of the Group’s greatest strengths; andincreasing the level of integration in the marketing and delivery of banking and financial services;
3
(3) To maximize net interest income, the Group matches its portfolio of investment securities with therelated funding to better lock-in favorable spreads. To emphasize safety and liquidity, the Group primarilyinvests in U.S. government agency obligations. The Group plans to continue to build its investments profile,while remaining attentive to market opportunities that could further improve net interest margin.
(4) Opening, expanding or relocating financial centers; improving operating efficiencies; and continuingto maintain effective asset-liability management; and
(5) Implementing a broad ranging effort to instill in employees and make customers aware of the Group’sdetermination to effectively serve and advise its customer base in a responsive and professional manner.
Together with a highly experienced group of senior and mid level executives, this strategy has generally resulted insustained growth in the Group’s mortgage, commercial, consumer lending and wealth-management activities,allowing the Group to distinguish itself in a highly competitive industry. The unstable interest rate environment ofrecent years has validated the strategy’s basic premise for greater revenue diversity, which remains an integral partof the Group’s long-term goal.
While progress is expected to continue, the Group is not immune from general and local financial and economicconditions. However, the Group remains well capitalized, having one of the strongest capital positions in the PuertoRico banking industry. Past experience is not necessarily indicative of future performance, especially given marketuncertainties, but based on a reasonable time horizon of three to five years, the strategy is expected to maintain itssteady progress towards the Group’s long-term goal.
Segment Disclosure
The Group has three reportable segments: Banking, Treasury, and Financial Services. Management established thereportable segments based on the internal reporting used to evaluate performance and to assess where to allocateresources. Other factors such as the Group’s organizational structure, nature of products, distribution channels andeconomic characteristics of the products were also considered in the determination of the reportable segments. TheGroup measures the performance of these reportable segments based on pre-established goals involving differentfinancial parameters such as net income, interest spread, loan production, and fees generated.
For detailed information regarding performance of the Group’s operating segments, please refer to Note 17 to theGroup’s accompanying consolidated financial statements.
Banking Activities
Oriental Bank and Trust (the “Bank”), the Group’s main subsidiary, is a full-service Puerto Rico commercial bankwith its main office located in San Juan, Puerto Rico. The Bank has 24 branches throughout Puerto Rico and wasincorporated in 1964 as a federal mutual savings and loan association. It became a federal mutual savings bank inJuly 1983 and converted to a federal stock savings bank in April 1987. Its conversion from a federally-charteredsavings bank to a commercial bank chartered under the banking law of the Commonwealth of Puerto Rico, onJune 30, 1994, allowed the Bank to more effectively pursue opportunities in its market and obtain more flexibility inits businesses, placing the Bank in the mainstream of financial services in Puerto Rico. As a Puerto Rico-charteredcommercial bank, it is subject to examination by the Federal Deposit Insurance Corporation (the “FDIC”) and theOffice of the Commissioner of Financial Institutions of Puerto Rico (the “OCFI”). The Bank offers banking servicessuch as commercial and consumer lending, saving and time deposit products, financial planning, and corporate andindividual trust services, and, through its residential mortgage lending division and its mortgage lending subsidiary,Oriental Mortgage Corporation (“Oriental Mortgage”), capitalizes on its banking network. The Bank operates aninternational banking entity (“IBE”) pursuant to the International Banking Center Regulatory Act of Puerto Rico, asamended (the “IBE Act”) which is a wholly-owned subsidiary of the Bank, named Oriental International Bank Inc.(the “IBE subsidiary”) organized in November 2003. The IBE subsidiary offers the Bank certain Puerto Rico taxadvantages and its services are limited under Puerto Rico law to persons and assets/liabilities located outside ofPuerto Rico. Another IBE, which operated as a division of the Bank, was liquidated on May 31, 2007, afterobtaining the corresponding regulatory approvals.
4
Banking activities include the Bank’s branches and mortgage banking activities with traditional retail bankingproducts such as deposits and mortgage, commercial, and consumer loans. The Bank’s lending activities areprimarily with consumers located in Puerto Rico. The Bank’s loan transactions include a diversified number ofindustries and activities, all of which are encompassed within three main categories: mortgage, commercial, andconsumer.
The Group’s mortgage banking activities are conducted through a division of the Bank, and also through OrientalMortgage. The mortgage banking activities primarily consist of the origination and purchase of residentialmortgage loans for the Group’s own portfolio and from time to time, if conditions so warrant, the Group mayengage in the sale of such loans to other financial institutions in the secondary market. The Group originates FederalHousing Administration (“FHA”)-insured, Veterans Administration (“VA”)-guaranteed mortgages, and RuralHousing Service (“RHS”)-guaranteed loans that are primarily securitized for issuance of Government NationalMortgage Association (“GNMA”) mortgage-backed securities which can be resold to individual or institutionalinvestors in the secondary market. Conventional loans that meet the underwriting requirements for sale or exchangeunder standard Federal National Mortgage Association (the “FNMA”) or the Federal Home Loan MortgageCorporation (the “FHLMC”) programs are referred to as conforming mortgage loans and are also securitized forissuance of FNMA or FHLMC mortgage-backed securities. In 2006, and after FNMA’s approval for the Group tosell FNMA-conforming conventional mortgage loans directly in the secondary market, the Group became anapproved seller of FNMA, as well as FHLMC, mortgage loans for issuance of FNMA and FHLMC mortgage-backed securities. The Group is also an approved issuer of GNMA mortgage-backed securities. The Groupcontinues to outsource the servicing of the GNMA, FNMA and FHLMC pools that it issues and its mortgage loanportfolio. In January 2008, the Group entered into an exclusive alliance with Primerica Financial Services, Inc.(“Primerica”), a wholly-owned subsidiary of Citigroup, in which the Group is the supplier of a mortgage platformand related services for Primerica in its program to market home loans to its clients in Puerto Rico.
Servicing assets represent the contractual right to service loans for others. Servicing assets are included as part ofother assets in the consolidated statements of financial condition. Loan servicing fees, which are based on apercentage of the principal balances of the loans serviced, are credited to income as loan payments are collected.
Servicing assets are initially recognized at fair value. The Group elected the amortization method with periodictesting for impairment.
Loan Underwriting
All loan originations, regardless of whether originated through the Group’s retail banking network or purchasedfrom third parties, must be underwritten in accordance with the Group’s underwriting criteria includingloan-to-value ratios, borrower income qualifications, debt ratios and credit history, investor requirements, andtitle insurance and property appraisal requirements. The Group’s underwriting standards comply with the relevantguidelines set forth by the Department of Housing and Urban Development (“HUD”), VA, FNMA, FHLMC, federaland Puerto Rico banking regulatory authorities, as applicable. The Group’s underwriting personnel, while operatingwithin the Group’s loan offices, make underwriting decisions independent of the Group’s mortgage loan originationpersonnel.
Sale of Loans and Securitization Activities
The Group may engage in the sale or securitization of a portion of the residential mortgage loans that it originatesand purchases and utilizes various channels to sell its mortgage products. The Group is an approved issuer ofGNMA-guaranteed mortgage-backed securities which involves the packaging of FHA loans, RHS loans or VA loansinto pools of mortgage-backed securities for sale primarily to securities broker-dealers and other institutionalinvestors. The Group can also act as issuer in the case of conforming conventional loans in order to group them intopools of FNMA or FHLMC-issued mortgage-backed securities which the Group then sells to securities broker-dealers. The issuance of mortgage-backed securities provides the Group with flexibility in selling the mortgageloans that it originates or purchases and also provides income by increasing the value and marketability of suchloans. In the case of conforming conventional loans, the Group also has the option to sell such loans through theFNMA and FHLMC cash window program.
5
Treasury Activities
Treasury activities encompass all of the Group’s treasury-related functions. The Group’s investment portfolioconsists of mortgage-backed securities, collateralized mortgage obligations, both non-agency and those issued byU.S. Government agencies, U.S. Treasury notes, U.S. Government agency bonds, P.R. Government obligations,structured credit investments and money market instruments. Mortgage-backed securities, the largest component,consist principally of pools of residential mortgage loans that are made to consumers and then resold in the form ofpass-through certificates in the secondary market, the payment of interest and principal of which is guaranteed byGNMA, FNMA or FHLMC. For more information see Notes 2 and 3 to the accompanying consolidated financialstatements.
The Group’s principal funding sources are securities sold under agreements to repurchase, branch deposits, FederalHome Loan Bank (“FHLB”) advances, and subordinated capital notes. Through its branch system, the Bank offerspersonal non-interest and interest-bearing checking accounts, savings accounts, certificates of deposit, individualretirement accounts (“IRAs”) and commercial non-interest bearing checking accounts. The FDIC insures theBank’s deposit accounts up to applicable limits. Management makes retail deposit pricing decisions periodicallythrough the Asset and Liability Management Committee (“ALCO”), which adjusts the rates paid on retail depositsin response to general market conditions and local competition. Pricing decisions take into account the rates beingoffered by other local banks, LIBOR, and mainland U.S. market interest rates.
Financial Services Activities
Financial services activities are generated by such businesses as securities brokerage, fiduciary services, insurance,and pension administration.
Oriental Financial Services Corp. (“OFSC”) is a Puerto Rico corporation and the Group’s subsidiary engaged insecurities brokerage and investment banking activities in accordance with the Group’s strategy of providing fullyintegrated financial solutions to the Group’s clients. OFSC, a member of the Financial Industry RegulatoryAuthority (“FINRA”) and the Securities Investor Protection Corporation, is a registered securities broker-dealerpursuant to Section 15(b) of the Securities Exchange Act of 1934. OFSC does not carry customer accounts and is,accordingly, exempt from the Customer Protection Rule (SEC Rule 15c3-3) pursuant to subsection (k)(2)(ii) of suchrule. It clears securities transactions through National Financial Services, LLC, a clearing agent which carries theaccounts of OFSC’s customers on a “fully disclosed” basis.
OFSC offers securities brokerage services covering various investment alternatives such as tax-advantaged fixedincome securities, mutual funds, stocks, and bonds to retail and institutional clients. It also offers separatelymanaged accounts and mutual fund asset allocation programs sponsored by unaffiliated professional assetmanagers. These services are designed to meet each client’s specific needs and preferences, including transac-tion-based pricing and asset-based fee pricing.
OFSC also manages and participates in public offerings and private placements of debt and equity securities inPuerto Rico. It has a joint venture agreement with Bear, Stearns & Co. Inc. to engage in municipal securitiesbusiness with the Commonwealth of Puerto Rico and its instrumentalities, municipalities, and public corporations.Investment banking revenue from such activities include gains, losses, and fees, net of syndicate expenses, arisingfrom securities offerings in which OFSC acts as an underwriter or agent. Investment banking revenue also includesfees earned from providing merger-and-acquisition and financial restructuring advisory services. Investmentbanking management fees are recorded on the offering date, sales concessions on settlement date, and underwritingfees at the time the underwriting is completed and the income is reasonably determinable.
Oriental Insurance Inc. (“Oriental Insurance”) is a Puerto Rico corporation and the Group’s subsidiary engaged ininsurance agency services. It was established by the Group to take advantage of the cross-marketing opportunitiesprovided by financial modernization legislation. Oriental Insurance currently earns commissions by acting as alicensed insurance agent in connection with the issuance of insurance policies by unaffiliated insurance companiesand anticipates continued growth as it expands the products and services it provides and continues to cross marketits services to the Group’s existing customer base.
6
Caribbean Pension Consultants, Inc., a Florida corporation, is the Group’s subsidiary engaged in the administrationof retirement plans in the U.S., Puerto Rico, and the Caribbean.
Market Area and Competition
The main geographic business and service area of the Group is in Puerto Rico, where the banking market is highlycompetitive. As of December 31, 2007, Puerto Rico had 10 commercial banking institutions with a total ofapproximately $101 billion in assets according to industry statistics published by the FDIC. The Group ranked8th based on total assets at December 31, 2007. Puerto Rico banks are subject to the same federal laws, regulationsand supervision that apply to similar institutions in the United States of America.
The Group competes with brokerage firms with retail operations, credit unions, savings and loan cooperatives,small loan companies, insurance agencies, and mortgage banks in Puerto Rico. The Group encounters intensecompetition in attracting and retaining deposits and in its consumer and commercial lending activities. Managementbelieves that the Group has been able to compete effectively for deposits and loans by offering a variety oftransaction account products and loans with competitive terms, by emphasizing the quality of its service, by pricingits products at competitive interest rates, by offering convenient branch locations, and by offering financial planningservices at each of its branch locations. The Group’s ability to originate loans depends primarily on the service itprovides to its borrowers in making prompt credit decisions and on the rates and fees that it charges.
Regulation and Supervision
General
The Group is a financial holding company subject to supervision and regulation by the Federal Reserve Board underthe BHC Act and the Gramm-Leach-Bliley Act of 1999. The qualification requirements and the process for a bankholding company that elects to be treated as a financial holding company requires that all of the subsidiary bankscontrolled by the bank holding company at the time of election must be and remain at all times “well capitalized”and “well managed.”
The Group elected to be treated as a financial holding company as permitted by the Gramm-Leach-Bliley Act.Under the Gramm-Leach-Bliley Act, if the Group fails to meet the requirements for being a financial holdingcompany and is unable to correct such deficiencies within certain prescribed time periods, the Federal ReserveBoard could require the Group to divest control of its depository institution subsidiary or alternatively ceaseconducting activities that are not permissible for bank holding companies that are not financial holding companies.
Financial holding companies may engage, directly or indirectly, in any activity that is determined to be (i) financialin nature, (ii) incidental to such financial activity, or (iii) complementary to a financial activity provided it does notpose a substantial risk to the safety and soundness of depository institutions or the financial system generally. TheGramm-Leach-Bliley Act specifically provides that the following activities have been determined to be “financialin nature”: (a) lending, trust and other banking activities; (b) insurance activities; (c) financial, investment oreconomic advisory services; (d) securitization of assets; (e) securities underwriting and dealing; (f) existing bankholding company domestic activities; (g) existing bank holding company foreign activities; and (h) merchantbanking activities.
In addition, the Gramm-Leach-Bliley Act specifically gives the Federal Reserve Board the authority, by regulationor order, to expand the list of financial or incidental activities but requires consultation with the U.S. TreasuryDepartment and gives the Federal Reserve Board authority to allow a financial holding company to engage in anyactivity that is complementary to a financial activity and does not pose a substantial risk to the safety and soundnessof depository institutions or the financial system.
The Group is required to file with the Federal Reserve Board and the SEC periodic reports and other informationconcerning its own business operations and those of its subsidiaries. In addition, Federal Reserve Board approvalmust also be obtained before a bank holding company acquires all or substantially all of the assets of another bank ormerges or consolidates with another bank holding company. The Federal Reserve Board also has the authority toissue cease and desist orders against bank holding companies and their non-bank subsidiaries.
7
The Bank is regulated by various agencies in the United States and the Commonwealth of Puerto Rico. Its mainregulators are the OCFI and the FDIC. The FDIC insures the Bank’s deposits up to $100,000 per depositor, exceptfor certain retirement accounts which are insured up to $250,000 per depositor. The Bank is subject to extensiveregulation and examination by the OCFI and the FDIC, and is subject to certain Federal Reserve Board regulationsof transactions with Bank affiliates. The federal and Puerto Rico laws and regulations which are applicable to theBank regulate, among other things, the scope of its business, its investments, its reserves against deposits, the timingof the availability of deposited funds, and the nature and amount of and collateral for certain loans. In addition to theimpact of such regulations, commercial banks are affected significantly by the actions of the Federal Reserve Boardas it attempts to control the money supply and credit availability in order to control inflation in the economy.
The Group’s mortgage banking business is subject to the rules and regulations of FHA, VA, RHS, FNMA, FHLMC,HUD and GNMA with respect to the origination, processing and selling of mortgage loans and the sale ofmortgage-backed securities. Those rules and regulations, among other things, prohibit discrimination and establishunderwriting guidelines which include provisions for inspections and appraisal reports, require credit reports onprospective borrowers and fix maximum loan amounts, and, with respect to VA loans, fix maximum interest rates.Mortgage origination activities are subject to, among others, the Equal Credit Opportunity Act, FederalTruth-in-Lending Act, the Real Estate Settlement Procedures Act and the regulations promulgated thereunderwhich, among other things, prohibit discrimination and require the disclosure of certain basic information tomortgagors concerning credit terms and settlement costs. The Group is also subject to regulation by the OCFI withrespect to, among other things, licensing requirements and maximum origination fees on certain types of mortgageloan products.
The Group and its subsidiaries are subject to the rules and regulations of certain other regulatory agencies. OFSC, asa registered broker-dealer, is subject to the supervision, examination and regulation of the FINRA, the SEC, and theOCFI in matters relating to the conduct of its securities business, including record keeping and reportingrequirements, supervision and licensing of employees and obligations to customers.
Oriental Insurance is subject to the supervision, examination and regulation of the Office of the Commissioner ofInsurance of Puerto Rico in matters relating to insurance sales, including but not limited to, licensing of employees,sales practices, charging of commissions and reporting requirements.
Holding Company Structure
The Bank is subject to restrictions under federal laws that limit the transfer of funds to its affiliates (including theGroup), whether in the form of loans, other extensions of credit, investments or asset purchases, among others. Suchtransfers are limited to 10% of the transferring institution’s capital stock and surplus with respect to any affiliate(including the Group), and, with respect to all affiliates, to an aggregate of 20% of the transferring institution’scapital stock and surplus. Furthermore, such loans and extensions of credit are required to be secured in specifiedamounts, carried out on an arm’s length basis, and consistent with safe and sound banking practices.
Under Federal Reserve Board policy, a bank holding company, such as the Group, is expected to act as a source offinancial and managerial strength to its banking subsidiaries and to also commit resources to support them. Thissupport may be required at times when, absent such policy, the bank holding company might not otherwise providesuch support. In the event of a bank holding company’s bankruptcy, any commitment by the bank holding companyto a federal bank regulatory agency to maintain capital of a subsidiary bank will be assumed by the bankruptcytrustee and be entitled to a priority of payment. In addition, any capital loans by a bank holding company to any of itssubsidiary banks are subordinate in right of payment to deposits and to certain other indebtedness of such subsidiarybank. The Bank is currently the only depository institution subsidiary of the Group.
Since the Group is a financial holding company, its right to participate in the assets of any subsidiary upon thelatter’s liquidation or reorganization will be subject to the prior claims of the subsidiary’s creditors (includingdepositors in the case of depository institution subsidiaries) except to the extent that the Group is a creditor withrecognized claims against the subsidiary.
8
Dividend Restrictions
The principal source of funds for the Group is the dividends from the Bank. The ability of the Bank to pay dividendson its common stock is restricted by the Puerto Rico Banking Act of 1933, as amended (the Banking Act”), theFDIA and FDIC regulations. In general terms, the Banking Act provides that when the expenditures of a bank aregreater than receipts, the excess of expenditures over receipts shall be charged against the undistributed profits ofthe bank and the balance, if any, shall be charged against the required reserve fund of the bank. If there is nosufficient reserve fund to cover such balance in whole or in part, the outstanding amount shall be charged against thebank’s capital account. The Banking Act provides that until said capital has been restored to its original amount andthe reserve fund to 20% of the original capital, the bank may not declare any dividends. In general terms, the FDIAand the FDIC regulations restrict the payment of dividends when a bank is undercapitalized, when a bank has failedto pay insurance assessments, or when there are safety and soundness concerns regarding a bank. For moreinformation see Note 13 to the accompanying consolidated financial statements.
The payment of dividends by the Bank may also be affected by other regulatory requirements and policies, such asmaintenance of adequate capital. If, in the opinion of the regulatory authority, a depository institution under itsjurisdiction is engaged in, or is about to engage in, an unsafe or unsound practice (that, depending on the financialcondition of the depository institution, could include the payment of dividends), such authority may require, afternotice and hearing, that such depository institution cease and desist from such practice. The Federal Reserve Boardhas issued a policy statement that provides that insured banks and bank holding companies should generally paydividends only out of operating earnings for the current and preceding two years. In addition, all insured depositoryinstitutions are subject to the capital-based limitations required by the Federal Deposit Insurance CorporationImprovement Act of 1991(“FDICIA”).
Federal Home Loan Bank System
The FHLB system, of which the Bank is a member, consists of 12 regional FHLBs governed and regulated by theFederal Housing Finance Board. The FHLB serves as a credit facility for member institutions within their assignedregions. They are funded primarily from proceeds derived from the sale of consolidated obligations of the FHLBsystem. They make loans (i.e., advances) to members in accordance with policies and procedures established by theFHLB and the boards of directors of each regional FHLB.
As a system member, the Bank is entitled to borrow from the FHLB of New York (the “FHLB-NY”) and is requiredto own capital stock in the FHLB-NY in an amount equal to the greater of $500; 1% of the Bank’s aggregate unpaidprincipal of its home mortgage loans, home purchase contracts, and similar obligations; or 5% of the Bank’saggregate amount of outstanding advances by the FHLB-NY. The Bank is in compliance with the stock ownershiprules described above with respect to such advances, commitments, home mortgage loans and similar obligations.All loans, advances and other extensions of credit made by the FHLB-NY to the Bank are secured by a portion of theBank’s mortgage loan portfolio, certain other investments and the capital stock of the FHLB-NY held by the Bank.At no time may the aggregate amount of outstanding advances made by the FHLB-NY to the Bank exceed 20 timesthe amount paid in by the Bank for capital stock in the FHLB-NY.
Federal Deposit Insurance Corporation Improvement Act
Under FDICIA the federal banking regulators must take prompt corrective action in respect to depositoryinstitutions that do not meet minimum capital requirements. FDICIA, and the regulations issued thereunder,established five capital tiers: (i) “well capitalized,” if it has a total risk-based capital ratio of 10.0% or more, has aTier I risk-based capital ratio of 6.0% or more, has a Tier I leverage capital ratio of 5.0% or more, and is not subjectto any written capital order or directive; (ii) “adequately capitalized,” if it has a total risk-based capital ratio of 8.0%or more, a Tier I risk-based capital ratio of 4.0% or more and a Tier I leverage capital ratio of 4.0% or more (3.0%under certain circumstances) and does not meet the definition of “well capitalized,” (iii) “undercapitalized,” if it hasa total risk-based capital ratio that is less than 8.0%, a Tier I risk-based ratio that is less than 4.0% or a Tier I leveragecapital ratio that is less than 4.0% (3.0% under certain circumstances), (iv) “significantly undercapitalized,” if it hasa total risk-based capital ratio that is less than 6.0%, a Tier I risk-based capital ratio that is less than 3.0% or a Tier Ileverage capital ratio that is less than 3.0%, and (v) “critically undercapitalized,” if it has a ratio of tangible equity to
9
total assets that is equal to or less than 2.0%. A depository institution may be deemed to be in a capitalizationcategory that is lower than is indicated by its actual capital position if it receives a less than satisfactory examinationrating in any of the first four categories. The Bank is a “well-capitalized” institution.
FDICIA generally prohibits a depository institution from making any capital distribution (including payment of adividend) or paying any management fees to its holding company if the depository institution would thereafter beundercapitalized. Undercapitalized depository institutions are subject to restrictions on borrowing from the FederalReserve System. In addition, undercapitalized depository institutions are subject to growth limitations and arerequired to submit capital restoration plans. A depository institution’s holding company must guarantee the capitalplan, up to an amount equal to the lesser of 5% of the depository institution’s assets at the time it becomesundercapitalized or the amount of the capital deficiency when the institution fails to comply with the plan. Thefederal banking agencies may not accept a capital plan without determining, among other things, that the plan isbased on realistic assumptions and is likely to succeed in restoring the depository institution’s capital. Significantlyundercapitalized depository institutions may be subject to a number of requirements and restrictions, includingorders to sell sufficient voting stock to become adequately capitalized, requirements to reduce total assets, andcessation of receipt of deposits from corresponding banks. Critically undercapitalized depository institutions aresubject to the appointment of a receiver or conservator.
Insurance of Accounts and FDIC Insurance Assessments
The Bank is subject to FDIC deposit insurance assessments. The Federal Deposit Insurance Reform Act of 2005(the “Reform Act”) merged the Bank Insurance Fund (“BIF”) and the Savings Association Insurance Fund(“SAIF”) into a single Deposit Insurance Fund, and increased the maximum amount of the insurance coverage forcertain retirement accounts, and possible “inflation adjustments” in the maximum amount of coverage availablewith respect to other insured accounts. In addition, it granted a one-time initial assessment credit (of approximately$4.7 billion) to recognize institutions’ past contributions to the fund. As a result of the merger of the BIF and theSAIF, all insured institutions are subject to the same assessment rate schedule.
Under the Reform Act, the FDIC made significant changes to its risk-based assessment system so that effectiveJanuary 1, 2007 the FDIC imposes insurance premiums based upon a matrix that is designed to more closely tiewhat banks pay for deposit insurance to the risks they pose. The new FDIC risk-based assessment system imposespremiums based upon factors that vary depending upon the size of the bank. These factors are: for banks with lessthan $10 billion in assets — capital level, supervisory rating, and certain financial ratios; for banks with $10 billionup to $30 billion in assets — capital level, supervisory rating, certain financial ratios and (if at least one is available)debt issuer ratings, and additional risk information; and for banks with over $30 billion in assets — capital level,supervisory rating, debt issuer ratings (unless none are available in which case certain financial ratios are used), andadditional risk information. The FDIC has adopted a new base schedule of rates that the FDIC can adjust up ordown, depending on the revenue needs of the DIF, and has set initial premiums for 2007 that range from 5 cents per$100 of domestic deposits for the banks in the lowest risk category to 43 cents per $100 of domestic deposits forbanks in the highest risk category. The new assessment system is expected to result in increased annual assessmentson the deposits of the Bank of 5 basis points per $100 of deposits. The Bank had available an FDIC credit ofapproximately $630,000 which was fully utilized to offset the 2007 assessment. The Bank paid insurance premiumsto the FDIC of approximately $154,000 during 2007 after utilizing such credits.
Regulatory Capital Requirements
The Federal Reserve Board has adopted risk-based capital guidelines for bank holding companies. Under theguidelines, the minimum ratio of qualifying total capital to risk-weighted assets is 8%. At least half of the totalcapital is to be comprised of qualifying common stockholders’ equity, qualifying noncumulative perpetualpreferred stock (including related surplus), minority interests related to qualifying common or noncumulativeperpetual preferred stock directly issued by a consolidated U.S. depository institution or foreign bank subsidiary,and restricted core capital elements (collectively “Tier 1 Capital”). The remainder (“Tier 2 Capital”) may consist,subject to certain limitations, of allowance for loan and lease losses; perpetual preferred stock and related surplushybrid capital instruments, perpetual debt, and mandatory convertible debt securities; term subordinated debt andintermediate-term preferred stock, including related surplus; and unrealized holding gains on equity securities.
10
The Federal Reserve Board has adopted regulations with respect to risk-based and leverage capital ratios thatrequire most intangibles, including core deposit intangibles, to be deducted from Tier 1 Capital. The regulations,however, permit the inclusion of a limited amount of intangibles related to originated and purchased mortgageservicing rights and purchased credit card relationships and include a “grandfathered” provision permittinginclusion of certain existing intangibles.
In addition, the Federal Reserve Board has established minimum leverage ratio (Tier 1 Capital to total assets)guidelines for bank holding companies and member banks. These guidelines provide for a minimum leverage ratioof 3% for bank holding companies and member banks that meet certain specified criteria including that they havethe highest regulatory rating. All other bank holding companies and member banks are required to maintain aminimum ratio of Tier 1 Capital to total assets of 4%. The guidelines also provide that banking organizationsexperiencing internal growth or making acquisitions are expected to maintain strong capital positions substantiallyabove the minimum supervisory levels without significant reliance on intangible assets. Furthermore, the guidelinesstate that the Federal Reserve Board will continue to consider a “tangible Tier 1 leverage ratio” and other indicatorsof capital strength in evaluating proposals for expansion or new activities.
Failure to meet the capital guidelines could subject an institution to a variety of enforcement actions including thetermination of deposit insurance by the FDIC and to certain restrictions on its business. At December 31, 2007, theGroup was in compliance with all capital requirements. For more information, please refer to Note 13 to theaccompanying consolidated financial statements.
Safety and Soundness Standards
Section 39 of the FDIA, as amended by FDICIA, requires each federal banking agency to prescribe for all insureddepository institutions standards relating to internal control, information systems, and internal audit systems, loandocumentation, credit underwriting, interest rate exposure, asset growth, compensation, fees and benefits, and suchother operational and managerial standards as the agency deems appropriate. In addition, each federal bankingagency also is required to adopt for all insured depository institutions standards relating to asset quality, earningsand stock valuation that the agency determines to be appropriate. Finally, each federal banking agency is required toprescribe standards for the employment contracts and other compensation arrangements of executive officers,employees, directors and principal stockholders of insured depository institutions that would prohibit compen-sation, benefits and other arrangements that are excessive or that could lead to a material financial loss for theinstitution. If an institution fails to meet any of the standards described above, it will be required to submit to theappropriate federal banking agency a plan specifying the steps that will be taken to cure the deficiency. If theinstitution fails to submit an acceptable plan or fails to implement the plan, the appropriate federal banking agencywill require the institution to correct the deficiency and, until it is corrected, may impose other restrictions on theinstitution, including any of the restrictions applicable under the prompt corrective action provisions of FDICIA.
The FDIC and the other federal banking agencies have adopted Interagency Guidelines Establishing Standards forSafety and Soundness that, among other things, set forth standards relating to internal controls, information systemsand internal audit systems, loan documentation, credit, underwriting, interest rate exposure, asset growth andemployee compensation.
Activities and Investments of Insured State-Chartered Banks
Section 24 of the FDIA, as amended by FDICIA, generally limits the activities and equity investments ofFDIC-insured, state-chartered banks to those that are permissible for national banks. Under FDIC regulations ofequity investments, an insured state bank generally may not directly or indirectly acquire or retain any equityinvestment of a type, or in an amount, that is not permissible for a national bank. An insured state bank, such as theBank, is not prohibited from, among other things, (i) acquiring or retaining a majority interest in a subsidiaryengaged in permissible activities, (ii) investing as a limited partner in a partnership, or as a non-controlling interestholder of a limited liability company, the sole purpose of which is direct or indirect investment in the acquisition,rehabilitation or new construction of a qualified housing project, provided that such investments may not exceed 2%of the bank’s total assets, (iii) acquiring up to 10% of the voting stock of a company that solely provides or reinsuresdirectors’, trustees’ and officers’ liability insurance coverage or bankers’ blanket bond group insurance coverage for
11
insured depository institutions, and (iv) acquiring or retaining the voting stock of an insured depository institutionowned exclusively by insured depository institutions.
Under the FDIC regulations governing the activities and investments of insured state banks which furtherimplemented Section 24 of the FDIA, as amended by FDICIA, an insured state-chartered bank may not, directly,or indirectly through a subsidiary, engage as “principal” in any activity that is not permissible for a national bankunless the FDIC has determined that such activities would pose no risk to the insurance fund of which it is a memberand the bank is in compliance with applicable regulatory capital requirements. Any insured state-chartered bankdirectly or indirectly engaged in any activity that is not permitted for a national bank must cease the impermissibleactivity.
Transactions with Affiliates and Related Parties
Transactions between the Bank and any of its affiliates are governed by sections 23A and 23B of the FederalReserve Act. These sections are important statutory provisions designed to protect a depository institution fromtransferring to its affiliates the subsidy arising from the institution’s access to the Federal safety net. An affiliate of abank is any company or entity that controls, is controlled by or is under common control with the bank. Generally,sections 23A and 23B (1) limit the extent to which a bank or its subsidiaries may engage in “covered transactions”with any one affiliate to an amount equal to 10% of the bank’s capital stock and surplus, and limit such transactionswith all affiliates to an amount equal to 20% of such capital stock and surplus, and (2) require that all suchtransactions be on terms that are consistent with safe and sound banking practices. The term “covered transactions”includes the making of loans, purchase of or investment in securities issued by the affiliate, purchase of assets,issuance of guarantees and other similar types of transactions. Most loans by a bank to any of its affiliates must besecured by collateral in amounts ranging from 100 to 130 percent of the loan amount, depending on the nature of thecollateral. In addition, any covered transaction by a bank with an affiliate and any sale of assets or provision ofservices to an affiliate must be on terms that are substantially the same, or at least as favorable to the bank, as thoseprevailing at the time for comparable transactions with nonaffiliated companies.
Regulation W of the Federal Reserve Board comprehensively implements sections 23A and 23B. The regulationunified and updated staff interpretations issued over the years prior to its adoption, incorporated several interpre-tative proposals (such as to clarify when transactions with an unrelated third party will be attributed to an affiliate),and addressed issues arising as a result of the expanded scope of non-banking activities engaged in by banks andbank holding companies and authorized for financial holding companies under the Gramm-Leach-Bliley Act.
Sections 22(g) and (h) of the Federal Reserve Act place restrictions on loans by a bank to executive officers,directors, and principal shareholders. Regulation O of the Federal Reserve Board implements these provisions.Under Section 22(h) and Regulation O, loans to a director, an executive officer and to a greater than 10%shareholders of a bank and certain of their related interests (“insiders”), and insiders of its affiliates, may not exceed,together with all other outstanding loans to such person and related interests, the bank’s single borrower limit(generally equal to 15% of the institution’s unimpaired capital and surplus). Section 22(h) and Regulation O alsorequire that loans to insiders and to insiders of affiliates be made on terms substantially the same as offered incomparable transactions to other persons, unless the loans are made pursuant to a benefit or compensation programthat (i) is widely available to employees of the bank and (ii) does not give preference to insiders over otheremployees of the bank. Section 22(h) and Regulation O also require prior board of directors’ approval for certainloans, and the aggregate amount of extensions of credit by a bank to all insiders cannot exceed the institution’sunimpaired capital and surplus. Furthermore, Section 22(g) and Regulation O place additional restrictions on loansto executive officers.
Community Reinvestment Act
Under the Community Reinvestment Act (“CRA”), a financial institution has a continuing and affirmativeobligation, consistent with its safe and sound operation, to help meet the credit needs of its entire community,including low and moderate income neighborhoods. The CRA does not establish specific lending requirements orprograms for financial institutions nor does it limit an institution’s discretion to develop the types of products andservices that it believes are best suited to its particular community, consistent with the CRA. The CRA requires
12
federal examiners, in connection with the examination of a financial institution, to assess the institution’s record ofmeeting the credit needs of its community and to take such record into account in its evaluation of certainapplications by such institution. The CRA also requires all institutions to make public disclosure of their CRAratings. The Group has a Compliance Department, which oversees the planning of products and services offered tothe community, especially those aimed to serve low and moderate income communities.
USA Patriot Act
Under Title III of the USA Patriot Act, also known as the International Money Laundering Abatement andAnti-Terrorism Financing Act of 2001, all financial institutions, including the Group, OFSC and the Bank, arerequired in general to identify their customers, adopt formal and comprehensive anti-money laundering programs,scrutinize or prohibit altogether certain transactions of special concern, and be prepared to respond to inquiries fromU.S. law enforcement agencies concerning their customers and their transactions.
The U.S. Treasury Department (“US Treasury”) has issued a number of regulations implementing the USA PatriotAct that apply certain of its requirements to financial institutions. The regulations impose obligations on financialinstitutions to maintain appropriate policies, procedures and controls to detect, prevent and report money launderingand terrorist financing.
Failure of a financial institution to comply with the USA Patriot Act’s requirements could have serious legalconsequences for the institution. The Group and its subsidiaries, including the Bank, have adopted policies,procedures and controls to address compliance with the USA Patriot Act under existing regulations, and willcontinue to revise and update their policies, procedures and controls to reflect changes required by the USA PatriotAct and US Treasury’s regulations.
Privacy Policies
Under the Gramm-Leach-Bliley Act, all financial institutions are required to adopt privacy policies, restrict thesharing of nonpublic customer data with nonaffiliated parties at the customer’s request, and establish proceduresand practices to protect customer data from unauthorized access. The Group and its subsidiaries have establishedpolicies and procedures to assure the Group’s compliance with all privacy provisions of the Gramm-Leach-BlileyAct.
Sarbanes-Oxley Act
The Sarbanes-Oxley Act of 2002 (“SOX”) implemented legislative reforms intended to address corporate andaccounting fraud. SOX contains reforms of various business practices and numerous aspects of corporategovernance. Most of these requirements have been implemented pursuant to regulations issued by the SEC.The following is a summary of certain key provisions of SOX.
In addition to the establishment of an accounting oversight board that enforces auditing, quality control andindependence standards and is funded by fees from all registered public accounting firms and publicly tradedcompanies, SOX places restrictions on the scope of services that may be provided by accounting firms to theirpublic company audit clients. Any non-audit services being provided to a public company audit client requires pre-approval by the Audit Committee of the Board of Directors (“Audit Committee”). In addition, SOX makes certainchanges to the requirements for partner rotation after a period of time. SOX requires chief executive officers andchief financial officers, or their equivalent, to certify to the accuracy of periodic reports filed with the SEC, subjectto civil and criminal penalties if they knowingly or willingly violate this certification requirement. In addition,counsel is required to report evidence of a material violation of securities laws or a breach of fiduciary duties to thecompany’s chief legal officer or to both the company’s chief executive officer and its chief legal officer, and, if anyof such officers does not appropriately respond, to report such evidence to the Audit Committee or other similarcommittee of the Board of Directors (the “Board”) or to the Board itself.
Under SOX, longer prison terms apply to corporate executives who violate federal securities laws; the period duringwhich certain types of suits can be brought against a company or its officers is extended; and bonuses issued to topexecutives prior to restatement of a company’s financial statements are now subject to disgorgement if such
13
restatement was due to corporate misconduct. Executives are also prohibited from insider trading during retirementplan “blackout” periods, and loans to company executives (other than loans by financial institutions permitted byfederal rules or regulations) are restricted. In addition, the legislation accelerates the time frame for disclosures bypublic companies, as they must immediately disclose any material changes in their financial condition oroperations. Directors and executive officers required to report changes in ownership in a company’s securitiesmust now report any such change within two business days of the change.
SOX increases responsibilities and codifies certain requirements relating to audit committees of public companiesand how they interact with the company’s independent registered public accounting firm. Audit committeemembers must be independent and are barred from accepting consulting, advisory or other compensatory fees fromthe company. In addition, companies are required to disclose whether at least one member of the committee is a“financial expert” (as such term is defined by the SEC) and if not, why not. A company’s independent registeredpublic accounting firm is prohibited from performing statutorily mandated audit services for a company if thecompany’s chief executive officer, chief financial officer, controller, chief accounting officer or any person servingin equivalent positions had been employed by such firm and participated in the audit of such company during theone-year period preceding the audit initiation date. SOX also prohibits any officer or director of a company or anyother person acting under their direction from taking any action to fraudulently influence, coerce, manipulate ormislead any independent public or certified accountant engaged in the audit of the company’s financial statementsfor the purpose of rendering the financial statements materially misleading.
SOX also has provisions relating to inclusion of certain internal control reports and assessments by management inthe annual report to stockholders. The law also requires the company’s registered public accounting firm to providean attestation report on the company’s internal control over financial reporting. The Group is required to include inits annual report on Form 10-K an internal control report containing management’s assertions regarding theeffectiveness of the Group’s internal control structure and procedures over financial reporting. The internal controlreport must include a statement of management’s responsibility for establishing and maintaining adequate internalcontrol over financial reporting for the Group; of management’s assessment as to the effectiveness of the Group’sinternal control over financial reporting based on management’s evaluation of it, as of the end of the Group’s mostrecent fiscal year, including disclosure of any material weaknesses therein; of the framework used by managementas criteria for evaluating the effectiveness of the Group’s internal control over financial reporting; and a statementthat the Group’s independent registered public accounting firm that audited its financial statements has audited theeffectiveness of the Group’s internal control over financial reporting as of December 31, 2007.
Puerto Rico Banking Act
As a Puerto Rico-chartered commercial bank, the Bank is subject to regulation and supervision by the OCFI underthe Banking Act (the “Banking Act”), which contains provisions governing the incorporation and organization,rights and responsibilities of directors, officers and stockholders as well as the corporate powers, savings, lending,capital and investment requirements and other aspects of the Bank and its affairs. In addition, the OCFI is givenextensive rulemaking power and administrative discretion under the Banking Act. The OCFI generally examinesthe Bank at least once every year.
The Banking Act requires that at least 10% of the yearly net income of the Bank be credited annually to a reservefund. This apportionment shall be done every year until the reserve fund is equal to the total paid-in capital oncommon and preferred stock. As of December 31, 2007, the Bank’s capital reserve fund, which is presented as“Legal surplus” in the accompanying consolidated financial statements, was $40.6 million.
The Banking Act also provides that when the expenditures of a bank are greater that the receipts, the excess of theformer over the latter shall be charged against the undistributed profits of the bank, and the balance, if any, shall becharged against the reserve fund, as a reduction thereof. If there is no reserve fund sufficient to cover such balance inwhole or in part, the outstanding amount shall be charged against the capital account and no dividend shall bedeclared until said capital has been restored to its original amount and the reserve fund to 20% of the originalcapital.
14
The Banking Act further requires every bank to maintain a legal reserve which shall not be less than 20% of itsdemand liabilities, except government deposits (federal, commonwealth and municipal), which are secured byactual collateral.
The Banking Act also requires change of control filings. When any person or entity will own, directly or indirectly,upon consummation of a transfer, 5% or more of the outstanding voting capital stock of a bank, the acquiring partiesmust inform the OCFI of the details not less than 60 days prior to the date said transfer is to be consummated. Thetransfer will require the approval of the OCFI if it results in a change of control of the bank. Under the Banking Act,a change of control is presumed if an acquirer who did not own more than 5% of the voting capital stock before thetransfer exceeds such percentage after the transfer.
The Banking Act permits Puerto Rico commercial banks to make loans to any one person, firm, partnership orcorporation, up to an aggregate amount of 15% of the sum of: (i) the bank’s paid-in capital; (ii) the bank’s reservefund; (iii) 50% of the bank’s retained earnings; subject to certain limitations; and (iv) any other components that theCommissioner may determine from time to time. If such loans are secured by collateral worth at least 25% morethan the amount of the loan, the aggregate maximum amount shall include 33.33% of 50% of the bank’s retainedearnings. There are no restrictions under the Banking Act on the amount of loans that are wholly secured by bonds,securities and other evidence of indebtedness of the Government of the United States, or of the Commonwealth ofPuerto Rico, or by bonds, not in default, of municipalities or instrumentalities of the Commonwealth of Puerto Rico.
Due to the reclassification of certain mortgage loans purchase transactions as a commercial loan to the seller of themortgage loans (refer to Note 20), at December 31, 2006 the Group had a lending concentration of $76.8 millionoutstanding to the financial institution from which it had purchased the mortgage loans. The resulting commercialloan was secured by mortgage loans on family residences located in Puerto Rico and the obligations of the borrowerunder the commercial loan were also secured by a guarantee from its parent company. The reclassification of themortgage loans purchase transactions as a commercial loan to the seller resulted in the Group booking a loanexceeding the loan to one borrower limits imposed by Puerto Rico banking laws. To address it, the Group requesteda waiver from the OCFI and it was issued on May 4, 2006 allowing the Group to retain the commercial loan on itsbooks until paid in full. By an agreement entered into on July 13, 2007, the borrower under the commercial loan andthe Group agreed to the repayment of the outstanding principal balance on the commercial loan. In payment of theoutstanding principal balance on the commercial loan, the Group (i) retained certain mortgage loans which werepart of the collateral for the commercial loan with an outstanding principal balance of $26.6 million; (ii) receivedfrom the borrower mortgage loans meeting the Group’s credit underwriting standards with an outstanding principalbalance of $25.9 million; and (iii) cash. The Group does not have any lending credit relationship in excess of itslending limit for loans to a single borrower at December 31, 2007.
The Puerto Rico Finance Board is composed of the Commissioner of Financial Institutions of Puerto Rico; thePresidents of the Government Development Bank for Puerto Rico, the Economic Development Bank for PuertoRico and the Planning Board; the Puerto Rico Secretaries of Commerce and Economic Development, Treasury andConsumer Affairs; the Commissioner of Insurance; and the President of the Public Corporation for Insurance andSupervision of Puerto Rico Cooperatives. It has the authority to regulate the maximum interest rates and financecharges that may be charged on loans to individuals and unincorporated businesses in the Commonwealth, andpromulgates regulations that specify maximum rates on various types of loans to individuals.
The current regulations of the Puerto Rico Finance Board provide that the applicable interest rate on loans toindividuals and unincorporated businesses (including real estate development loans, but excluding certain otherpersonal and commercial loans secured by mortgages on real estate property) is to be determined by freecompetition. The Puerto Rico Finance Board also has the authority to regulate maximum finance charges onretail installment sales contracts and for credit card purchases. There is presently no maximum rate for retailinstallment sales contracts and for credit card purchases.
International Banking Center Regulatory Act of Puerto Rico
The business and operations of the Bank’s IBE subsidiary are subject to supervision and regulation by the OCFI.Under the IBE Act, no sale, encumbrance, assignment, merger, exchange or transfer of shares, interest orparticipation in the capital of an IBE may be initiated without the prior approval of the OCFI, if by such transaction
15
a person would acquire, directly or indirectly, control of 10% or more of any class of stock, interest or participationin the capital of the IBE. The IBE Act and the regulations issued thereunder by the OCFI (the “IBE Regulations”)limit the business activities that may be carried out by an IBE. Such activities are limited in part to persons andassets/liabilities located outside of Puerto Rico. The IBE Act provides further that every IBE must have not less than$300,000 of unencumbered assets or acceptable financial guarantees.
Pursuant to the IBE Act and the IBE Regulations, the Bank’s IBE subsidiary has to maintain books and records of allits transactions in the ordinary course of business. It is also required to submit quarterly and annual reports of theirfinancial condition and results of operations to the OCFI, including annual audited financial statements.
The IBE Act empowers the OCFI to revoke or suspend, after notice and hearing, a license issued thereunder if,among other things, the IBE fails to comply with the IBE Act, the IBE Regulations or the terms of its license, or ifthe OCFI finds that the business or affairs of the IBE are conducted in a manner that is not consistent with the publicinterest.
Employees
At December 31, 2007, the Group had 518 employees. None of its employees is represented by a collectivebargaining group. The Group considers its employee relations to be good.
Internet Access to Reports
The Group’s annual report on Form 10-K, quarterly reports on Form 10-Q, current reports on Form 8-K, and any andall amendments to such reports, filed or furnished pursuant to Section 13(a) or 15(d) of the Securities Exchange Actof 1934, are available free of charge on or through the Group’s internet website at www.orientalfg.com, as soon asreasonably practicable after the Group electronically files such material with, or furnishes it to, the SEC.
The Group’s corporate governance guidelines, code of business conduct and ethics, and the charters of its auditcommittee, compensation committee, and corporate governance and nominating committee are available free ofcharge on the Group’s website at www.orientalfg.com in the investor relations section under the corporategovernance link. The Group’s code of business conduct and ethic applies to its directors, officers, employeesand agents, including its principal executive, financial and accounting officers.
ITEM 1A. RISK FACTORS
In addition to the other information contained elsewhere in this report and the Group’s other filings with the SEC,the following risk factors should be carefully considered in evaluating the Group and its subsidiaries. The risks anduncertainties described below are not the only ones facing the Group and its subsidiaries. Additional risks anduncertainties, not presently known to us or otherwise, may also impair our business operations. If any of the risksdescribed below or such other risks actually occur, our business, financial condition or results of operations could bematerially and adversely affected.
Puerto Rico’s current economic condition may have an adverse effect on our loan portfolio
Beginning in 2005 and continuing through 2007, a number of key economic indicators suggested that the economyof Puerto Rico was slowing down.
Construction remained weak during 2007, as the combination of rising interest rates, the Commonwealth’s fiscalsituation and decreasing public investment in construction projects affected the sector. During the period fromJanuary to November of the calendar year 2007, cement production, a real indicator of construction activity,declined by 11.7% as compared to the same period in 2006. As of September 2007, exports decreased by 11.7%,while imports decreased by 8.9%, a negative trade, which continues since the first negative trade balance of the lastdecade was registered in November 2006. Tourism activity has also declined during fiscal year 2007. Total hotelregistrations for the fiscal year 2007 declined 5.1% as compared to the fiscal year 2006. During 2007, new vehiclesales decreased by 13%, the lowest since 1993. In 2007, average employment declined by 1.27% while the averagenumber of unemployed increased by 3.30%; the unemployment rate increased to 11.2% when compared to theDecember 2006 unemployment rate of 10.2%.
16
In general, the Puerto Rico economy continued its trend of decreasing growth, primarily due to weaker manu-facturing, softer consumption and decreased government investment in construction. Increases in oil prices andother consumer goods and services, coupled with a 7% sales tax implemented in October 2006 as part of agovernment program of tax and fiscal reforms, have also contributed to the general economic slowdown.
Factors such as the government’s ability to implement meaningful steps to curb operating expenditures, improvemanagerial and budgetary controls, and eliminate the government’s reliance on operating budget loans from theGovernment Development Bank of Puerto Rico will be key determinants of future economic stability. Also, theinability to agree on future fiscal year Commonwealth budgets could result in ratings pressure from the ratingagencies.
These economic concerns and uncertainties in the private and public sectors have had an adverse effect in the creditquality of our loan portfolios as delinquency rates have increased in the short-term and may continue to increaseuntil the economy stabilizes. The reduction in consumer spending may continue to impact growth in our otherinterest and non-interest revenue sources.
A prolonged economic slowdown or a decline in the real estate market could harm the results of ouroperations
The residential mortgage loan origination business has historically been cyclical, enjoying periods of strong growthand profitability followed by periods of lower volumes and industry-wide losses. The market for residentialmortgage loan originations is currently in decline, and this trend could also reduce the level of mortgage loans thatwe may originate in the future and may adversely impact our business. During periods of declining interest rates,such as the one being currently experienced, refinancing activity on mortgage loans has tended to increase.However, due to the general economic slowdown in Puerto Rico and its impact on the value of residential properties,an increase in mortgage refinancing activity has not yet occurred. A recent trend of decreasing values in certainhousing segments has been noted. There is a risk that a reduction in housing values could negatively impact our losslevels on the mortgage portfolio. Any sustained period of increased delinquencies, foreclosures or losses could harmour ability to sell loans, the price we receive on the sale of such loans, and the value of our mortgage loan portfolio,all of which could have a negative impact on our results of operations and financial condition.
Financial results are constantly exposed to market risk
Market risk refers to the probability of variations in the net interest income or the market value of assets andliabilities due to interest rate volatility. Despite the varied nature of market risks, the primary source of this risk to usis the impact of changes in interest rates on net interest income.
Net interest income is the difference between the revenue generated on earning assets and the interest cost offunding those assets. Depending on the duration and repricing characteristics of the assets, liabilities and off-balance sheet items, changes in interest rates could either increase or decrease the level of net interest income. Forany given period, the pricing structure of the assets and liabilities is matched when an equal amount of such assetsand liabilities mature or reprice in that period. Any mismatch of interest-earning assets and interest-bearingliabilities is known as a gap position. A positive gap denotes asset sensitivity, which means that an increase ininterest rates could have a positive effect on net interest income, while a decrease in interest rates could have anegative effect on net interest income.
We are subject to interest rate risk because of the following factors:
• Assets and liabilities may mature or reprice at different times. For example, if assets reprice slower than liabilitiesand interest rates are generally rising, earnings may initially decline.
• Assets and liabilities may reprice at the same time but by different amounts. For example, when the general levelof interest rates is rising, we may increase rates charged on loans by an amount that is less than the generalincrease in market interest rates because of intense pricing competition. Also, basis risk occurs when assets andliabilities have similar repricing frequencies but are tied to different market interest rate indices that may notmove in tandem.
17
• Short-term and long-term market interest rates may change by different amounts, i.e., the shape of the yield curvemay affect new loan yields and funding costs differently.
• The remaining maturity of various assets and liabilities may shorten or lengthen as interest rates change. Forexample, if long-term mortgage interest rates decline sharply, mortgage-backed securities held in the securitiesavailable-for-sale portfolio may prepay significantly earlier than anticipated, which could reduce portfolioincome. If prepayment rates increase, we would be required to amortize net premiums into income over a shorterperiod of time, thereby reducing the corresponding asset yield and net interest income. Prepayment risk also has asignificant impact on mortgage-backed securities and collateralized mortgage obligations, since prepaymentscould shorten the weighted average life of these portfolios.
• Interest rates may have an indirect impact on loan demand, credit losses, loan origination volume, the value offinancial assets and financial liabilities, gains and losses on sales of securities and loans, the value of mortgageservicing rights and other sources of earnings.
In limiting interest rate risk to an acceptable level, management may alter the mix of floating and fixed rate assetsand liabilities, change pricing schedules, adjust maturities through sales and purchases of investment securities, andenter into derivative contracts, among other alternatives. We may suffer losses or experience lower spreads thananticipated in initial projections as management implement strategies to reduce future interest rate exposure.
A continuing decline in the real estate market in the U.S. mainland and ongoing disruptions in thecapital markets may harm our investment securities and wholesale funding portfolios
The housing market in the U.S. is undergoing a correction of historic proportions. After a period of several years ofbooming housing markets, fueled by liberal credit conditions and rapidly rising property values, the sector has beenin the midst of a substantial dislocation since early 2007. The general level of property values in the U.S., asmeasured by several indices widely followed by the market, has declined. These declines are the result of ongoingmarket adjustments that are aligning property values with income levels and home inventories. The supply of homesin the market has increased substantially, and additional property value decreases may be required to clear theoverhang of excess inventory in the U.S. market. Declining property values could impact the credit quality and fairvalue of our non-agency collateralized mortgage obligations and structured credit investments included as part ofour investment securities portfolio.
Our business could be adversely affected if we cannot maintain access to stable funding sources
Our business requires continuous access to various funding sources. While we are able to fund our operationsthrough deposits as well as through advances from the Federal Home Loan Bank of New York and other alternativesources, our business is significantly dependent upon other wholesale funding sources, such as repurchaseagreements.
While we expect to have continued access to credit from the foregoing sources of funds, there can be no assurancethat such financing sources will continue to be available or will be available on favorable terms. In the event thatsuch sources of funds are reduced or eliminated and we are not able to replace them on a cost-effective basis, wemay be forced to curtail or cease our loan origination business and treasury activities, which would have a materialadverse effect on our operations and financial condition.
Our decisions regarding credit risk and the allowance for loan losses may materially and adversely affectour business and results of operations
Making loans is an essential element of our business and there is a risk that our loans will not be repaid. The defaultrisk is affected by a number of factors, including:
• the duration of the loan;
• credit risks of a particular borrower;
18
• changes in economic or industry conditions; and
• in the case of a collateralized loan, risks resulting from uncertainties about the future value of the collateral.
We strive to maintain an appropriate allowance for loan losses to provide for probable losses inherent in our loanportfolio. We periodically determine the amount of the allowance based on consideration of several factors such asdefault frequency, internal risk ratings, expected future cash collections, loss recovery rates and general economicfactors, among others, as are the size and diversity of individual credits. Our methodology for measuring theadequacy of the allowance relies on several key elements which include a specific allowance for identified problemloans, a general systematic allowance, and an unallocated allowance.
We recorded a provision for loan losses of $6.6 million in 2007 based on our overall evaluation of the risks of ourloan portfolio. Although we believe that our allowance for loan losses is currently sufficient given the constantmonitoring of the risk inherent in our loan portfolio, there is no precise method of predicting loan losses andtherefore we always face the risk that charge-offs in future periods will exceed our allowance for loan losses and thatadditional increases in the allowance for loan losses will be required. In addition, the FDIC as well as the OCFI mayrequire us to establish additional reserves. Additions to the allowance for loan losses would result in a decrease inour net earnings and capital and could hinder our ability to pay dividends.
We are subject to default and other risks in connection with our mortgage loan originations
From the time that we fund the mortgage loans we originate to the time we sell them, we are generally at risk for anymortgage loan defaults. Once we sell the mortgage loans, the risk of loss from mortgage loan defaults andforeclosures passes to the purchaser or insurer of the mortgage loans. However, in the ordinary course of business,we make representations and warranties to the purchasers and insurers of mortgage loans relating to the validity ofsuch loans. If there is a breach of any of these representations or warranties, we may be required to repurchase themortgage loan and bear any subsequent loss on the mortgage loan. In addition, we incur higher liquidity risk withrespect to the non-conforming mortgage loans originated by us, because of the lack of a favorable secondary marketin which to sell them.
We are at risk because most of our business is conducted in a geographically concentrated area
Because most of our business activities are conducted in Puerto Rico, and a substantial portion of our creditexposure is in Puerto Rico, we are at risk from adverse economic, political or business developments including adownturn in real estate values and natural hazards that affect Puerto Rico. If Puerto Rico’s economy experiences anoverall decline as a result of these adverse developments or natural hazards, the rates of delinquencies, foreclosures,bankruptcies and losses on loan portfolios would probably increase substantially. This would cause our profitabilityto decrease.
Competition with other financial institutions could adversely affect our profitability
We face substantial competition in originating loans and in attracting deposits. The competition in originating loanscomes principally from other U.S., Puerto Rico and foreign banks, mortgage banking companies, consumer financecompanies, credit unions, insurance companies, and other institutional lenders and purchasers of loans. We willencounter greater competition as we expand our operations. Increased competition may require us to increase therates we pay on deposits or lower the rates we offer on loans which could adversely affect our profitability.
The Group operates in a highly regulated environment and may be adversely affected by changes infederal and local laws and regulations
The Group is subject to extensive regulation, supervision and examination by federal and Puerto Rico bankingauthorities. Any change in applicable federal or Puerto Rico laws or regulations could have a substantial impact onits operations. Additional laws and regulations may be enacted or adopted in the future that could significantlyaffect the Group’s powers, authority and operations, which could have a material adverse effect on the Group’sfinancial condition and results of operations. Further, regulators, in the performance of their supervisory andenforcement duties, have significant discretion and power to prevent or remedy unsafe and unsound practices or
19
violations of laws by banks and bank holding companies. The exercise of this regulatory discretion and power mayhave a negative impact on the Group.
Competition in attracting talented people could adversely affect our operations
We depend on our ability to attract and retain key personnel and we rely heavily on our management team. Theinability to recruit and retain key personnel or the unexpected loss of key managers may adversely affect ouroperations. Our success to date has been influenced strongly by our ability to attract and retain senior managementexperienced in banking and financial services. Retention of senior managers and appropriate succession planningwill continue to be critical to the successful implementation of our strategies.
ITEM 1B. UNRESOLVED STAFF COMMENTS
Not applicable.
ITEM 2. PROPERTIES
The Group leases its main offices located at 997 San Roberto Street, Oriental Center, Professional Offices Park,San Juan, Puerto Rico. The executive office, treasury, trust division, brokerage, investment banking, mortgagebanking, commercial banking, insurance services, and back-office support departments are maintained at suchlocation.
The Bank owns seven branch premises and leases seventeen branch commercial offices throughout Puerto Rico.The Bank’s management believes that each of its facilities is well maintained and suitable for its purpose and canreadily obtain appropriate additional space as may be required at competitive rates by extending expiring leases orfinding alternative space.
At December 31, 2007, the aggregate future rental commitments under the terms of the leases, exclusive of taxes,insurance and maintenance expenses payable by the Group, was $23.3 million.
The Group’s investment in premises and equipment, exclusive of leasehold improvements, at December 31, 2007,was $12.4 million.
ITEM 3. LEGAL PROCEEDINGS
On August 14, 1998, as a result of a review of its accounts in connection with the admission by a former Groupofficer of having embezzled funds and manipulated bank accounts and records, the Group became aware of certainirregularities. The Group notified the appropriate regulatory authorities and commenced an intensive investigationwith the assistance of forensic accountants, fraud experts, and legal counsel. The investigation determined losses of$9.6 million, resulting from dishonest and fraudulent acts and omissions involving several former Groupemployees. These losses were submitted to the Group’s fidelity insurance policy (the “Policy”) issued by FederalInsurance Company, Inc. (“FIC”), a stock insurance corporation organized under the laws of the State of Indiana. Inthe opinion of the Group’s management, its legal counsel and experts, the losses determined by the investigationwere covered by the Policy. However, FIC denied all claims for such losses. On August 11, 2000, the Group filed alawsuit in the United States District Court for the District of Puerto Rico against FIC for breach of insurancecontract, breach of covenant of good faith and fair dealing and damages, seeking payment of the Group’s$9.6 million insurance claim loss and the payment of consequential damages of no less than $13.0 million resultingfrom FIC’s bad faith, capricious, arbitrary, fraudulent and without cause denial of the Group’s claims. The lossesresulting from such dishonest and fraudulent acts and omissions were expensed in prior years. On October 3, 2005, ajury rendered a verdict of $7.5 million in favor of the Group and against FIC (“2005 Verdict”). The jury granted theGroup $453,219 for fraud and loss documentation in connection with its Accounts Receivable Returned ChecksAccount and $7,078,640.60 regarding its bad faith claim. However, the jury could not reach a decision on theGroup’s claim for $3.4 million in connection with fraud in its Cash Accounts, thus forcing a new trial on this issue.The jury denied the Group’s claim for $5.6 million in connection with fraud in the Mortgage Loans Account. Thecourt decided not to enter a final judgment for the aforementioned awards until a new trial regarding the Cash
20
Accounts claim be held. On August 14, 2007, a jury rendered a verdict in favor of FIC and against the Group,regarding its Cash Accounts (“2007 Verdict”).
Judgment pursuant to the aforementioned 2005 and 2007 verdicts was entered on August 15, 2007. FIC filed amotion to set aside the 2005 Verdict which OFG opposed. The Group filed a motion to set aside the 2007 Verdictwhich FIC opposed. In addition, the Group filed Motion to Correct Judgment, Bill of Costs and Motion forImposition of Attorneys and Experts Costs so as to recover pre and post judgment interest, costs, fees and expensesrelated to the prosecution of its claims.
The Group has not recognized any income on these claims since the post-trial motions have not been ruled upon yetand appellate rights have not been exhausted. Thus, the amount to be collected cannot be determined at this time.
In addition, the Group and its subsidiaries are defendants in a number of legal proceedings incidental to theirbusiness. The Group is vigorously contesting such claims. Based upon a review by legal counsel and thedevelopment of these matters to date, Management is of the opinion that the ultimate aggregate liability, ifany, resulting from these claims will not have a material adverse effect on the Group’s financial condition or resultsof operations.
ITEM 4. SUBMISSIONS OF MATTERS TO A VOTE OF SECURITY HOLDERS
Not applicable.
PART II
ITEM 5. MARKET FOR REGISTRANT’S COMMON EQUITY, RELATED STOCKHOLDER MATTERSAND ISSUER PURCHASES OF EQUITY SECURITIES
The Group’s common stock is traded on the New York Stock Exchange (“NYSE”) under the symbol “OFG”.Information concerning the range of high and low sales prices for the Group’s common stock for each quarter in theyears ended December 31, 2007 and 2006, as well as cash dividends declared for such periods are contained inTable 7 (“Capital, Dividends and Stock Data”) and under the “Stockholders’ Equity” caption in the Management’sDiscussion and Analysis of Financial Condition and Results of Operations (“MD&A”).
Information concerning legal or regulatory restrictions on the payment of dividends by the Group and the Bank iscontained under the caption “Dividend Restrictions” in Item 1 of this report.
As of December 31, 2007, the Group had approximately 6,760 holders of record of its common stock, including alldirectors and officers of the Group, and beneficial owners whose shares are held in “street” name by securitiesbroker-dealers or other nominees.
The Puerto Rico Internal Revenue Code of 1994, as amended, generally imposes a withholding tax on the amount ofany dividends paid by Puerto Rico corporations to individuals, whether residents of Puerto Rico or not, trusts,estates, and special partnerships at a special 10% withholding tax rate. Prior to the first dividend distribution for thetaxable year, such shareholders may elect to be taxed on the dividends at the regular rates, in which case the special10% tax will not be withheld from such year’s distributions. Dividends distributed by Puerto Rico corporations toforeign corporations or partnerships not engaged in trade or business in Puerto Rico are also generally subject towithholding tax at a 10% rate.
United States citizens who are non-residents of Puerto Rico will not be subject to Puerto Rico tax on dividends if theindividual’s gross income from sources within Puerto Rico during the taxable year does not exceed $1,300 if single,or $3,000 if married, and form AS 2732 of the Puerto Rico Treasury Department “Withholding Tax Exemp-tion Certificate for the Purpose of Section 1147” is filed with the withholding agent. U.S. income tax law permits acredit against the U.S. income tax liability, subject to certain limitations, for certain foreign income taxes paid ordeemed paid with respect to foreign source income, including that arising from dividends from foreign corpo-rations, such as the Group.
21
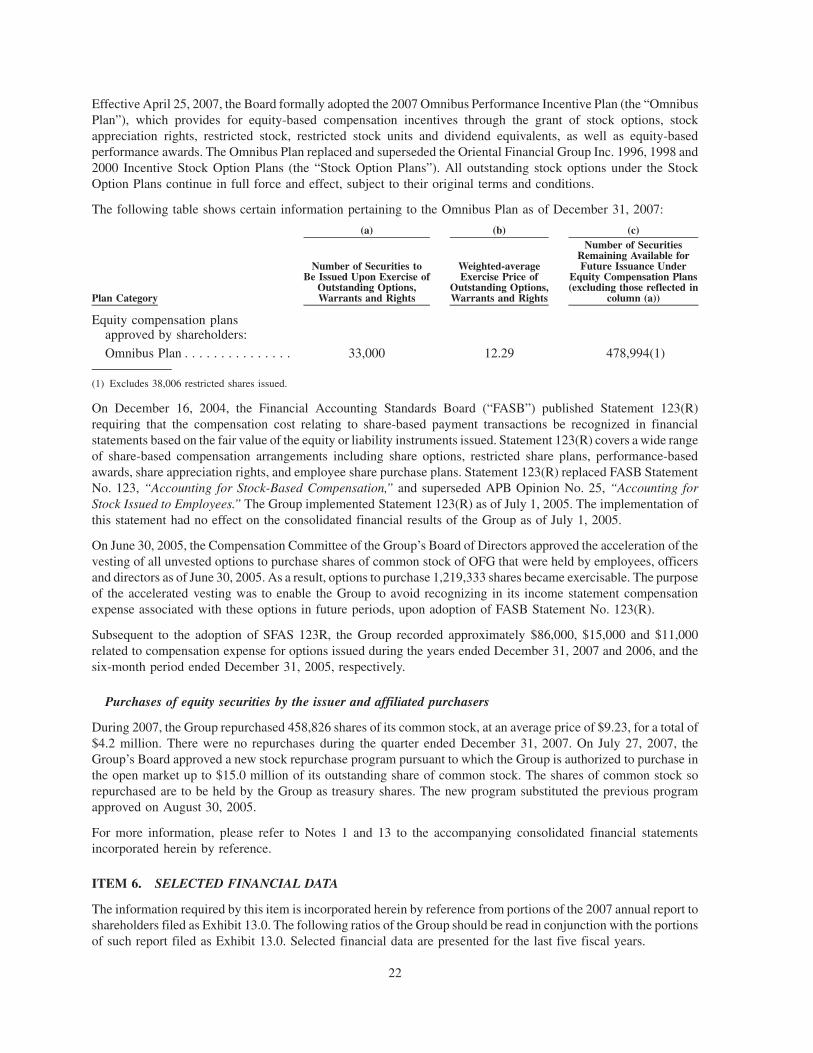
Effective April 25, 2007, the Board formally adopted the 2007 Omnibus Performance Incentive Plan (the “OmnibusPlan”), which provides for equity-based compensation incentives through the grant of stock options, stockappreciation rights, restricted stock, restricted stock units and dividend equivalents, as well as equity-basedperformance awards. The Omnibus Plan replaced and superseded the Oriental Financial Group Inc. 1996, 1998 and2000 Incentive Stock Option Plans (the “Stock Option Plans”). All outstanding stock options under the StockOption Plans continue in full force and effect, subject to their original terms and conditions.
The following table shows certain information pertaining to the Omnibus Plan as of December 31, 2007:
Plan Category
Number of Securities toBe Issued Upon Exercise of
Outstanding Options,Warrants and Rights
Weighted-averageExercise Price of
Outstanding Options,Warrants and Rights
Number of SecuritiesRemaining Available forFuture Issuance Under
Equity Compensation Plans(excluding those reflected in
column (a))
(a) (b) (c)
Equity compensation plansapproved by shareholders:
Omnibus Plan . . . . . . . . . . . . . . . 33,000 12.29 478,994(1)
(1) Excludes 38,006 restricted shares issued.
On December 16, 2004, the Financial Accounting Standards Board (“FASB”) published Statement 123(R)requiring that the compensation cost relating to share-based payment transactions be recognized in financialstatements based on the fair value of the equity or liability instruments issued. Statement 123(R) covers a wide rangeof share-based compensation arrangements including share options, restricted share plans, performance-basedawards, share appreciation rights, and employee share purchase plans. Statement 123(R) replaced FASB StatementNo. 123, “Accounting for Stock-Based Compensation,” and superseded APB Opinion No. 25, “Accounting forStock Issued to Employees.” The Group implemented Statement 123(R) as of July 1, 2005. The implementation ofthis statement had no effect on the consolidated financial results of the Group as of July 1, 2005.
On June 30, 2005, the Compensation Committee of the Group’s Board of Directors approved the acceleration of thevesting of all unvested options to purchase shares of common stock of OFG that were held by employees, officersand directors as of June 30, 2005. As a result, options to purchase 1,219,333 shares became exercisable. The purposeof the accelerated vesting was to enable the Group to avoid recognizing in its income statement compensationexpense associated with these options in future periods, upon adoption of FASB Statement No. 123(R).
Subsequent to the adoption of SFAS 123R, the Group recorded approximately $86,000, $15,000 and $11,000related to compensation expense for options issued during the years ended December 31, 2007 and 2006, and thesix-month period ended December 31, 2005, respectively.
Purchases of equity securities by the issuer and affiliated purchasers
During 2007, the Group repurchased 458,826 shares of its common stock, at an average price of $9.23, for a total of$4.2 million. There were no repurchases during the quarter ended December 31, 2007. On July 27, 2007, theGroup’s Board approved a new stock repurchase program pursuant to which the Group is authorized to purchase inthe open market up to $15.0 million of its outstanding share of common stock. The shares of common stock sorepurchased are to be held by the Group as treasury shares. The new program substituted the previous programapproved on August 30, 2005.
For more information, please refer to Notes 1 and 13 to the accompanying consolidated financial statementsincorporated herein by reference.
ITEM 6. SELECTED FINANCIAL DATA
The information required by this item is incorporated herein by reference from portions of the 2007 annual report toshareholders filed as Exhibit 13.0. The following ratios of the Group should be read in conjunction with the portionsof such report filed as Exhibit 13.0. Selected financial data are presented for the last five fiscal years.
22
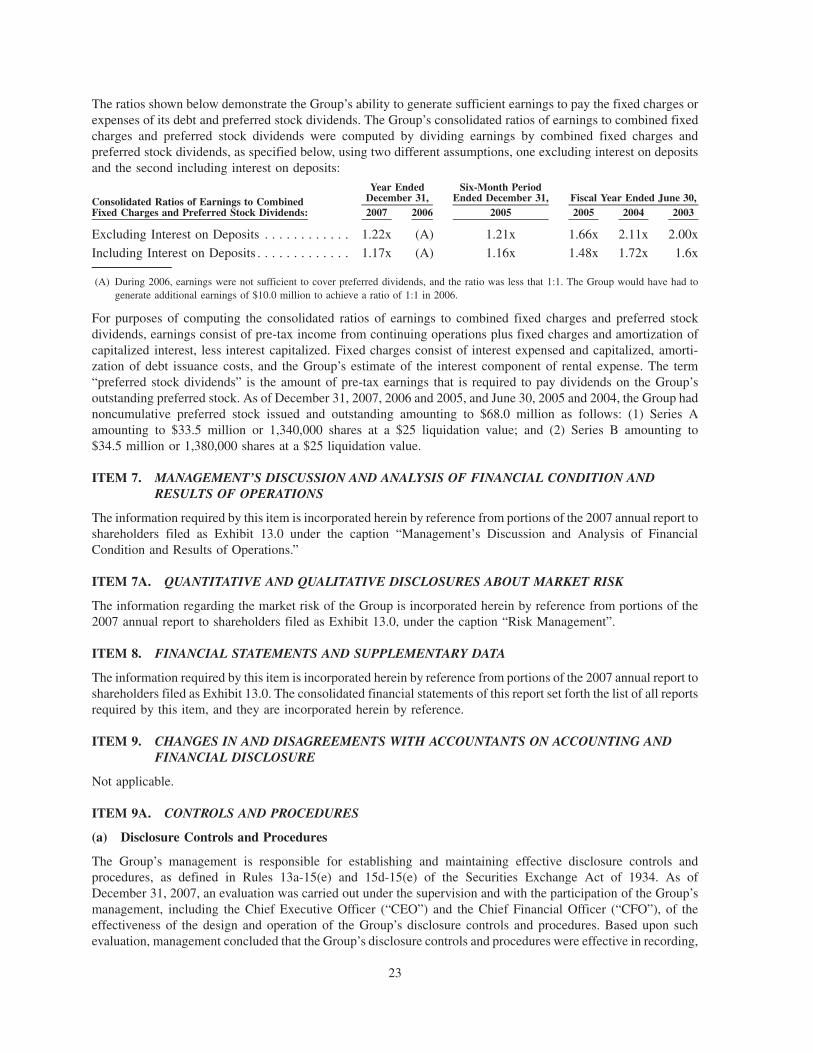
The ratios shown below demonstrate the Group’s ability to generate sufficient earnings to pay the fixed charges orexpenses of its debt and preferred stock dividends. The Group’s consolidated ratios of earnings to combined fixedcharges and preferred stock dividends were computed by dividing earnings by combined fixed charges andpreferred stock dividends, as specified below, using two different assumptions, one excluding interest on depositsand the second including interest on deposits:
Consolidated Ratios of Earnings to CombinedFixed Charges and Preferred Stock Dividends: 2007 2006 2005 2005 2004 2003
Year EndedDecember 31,
Six-Month PeriodEnded December 31, Fiscal Year Ended June 30,
Excluding Interest on Deposits . . . . . . . . . . . . 1.22x (A) 1.21x 1.66x 2.11x 2.00x
Including Interest on Deposits . . . . . . . . . . . . . 1.17x (A) 1.16x 1.48x 1.72x 1.6x
(A) During 2006, earnings were not sufficient to cover preferred dividends, and the ratio was less that 1:1. The Group would have had togenerate additional earnings of $10.0 million to achieve a ratio of 1:1 in 2006.
For purposes of computing the consolidated ratios of earnings to combined fixed charges and preferred stockdividends, earnings consist of pre-tax income from continuing operations plus fixed charges and amortization ofcapitalized interest, less interest capitalized. Fixed charges consist of interest expensed and capitalized, amorti-zation of debt issuance costs, and the Group’s estimate of the interest component of rental expense. The term“preferred stock dividends” is the amount of pre-tax earnings that is required to pay dividends on the Group’soutstanding preferred stock. As of December 31, 2007, 2006 and 2005, and June 30, 2005 and 2004, the Group hadnoncumulative preferred stock issued and outstanding amounting to $68.0 million as follows: (1) Series Aamounting to $33.5 million or 1,340,000 shares at a $25 liquidation value; and (2) Series B amounting to$34.5 million or 1,380,000 shares at a $25 liquidation value.
ITEM 7. MANAGEMENT’S DISCUSSION AND ANALYSIS OF FINANCIAL CONDITION ANDRESULTS OF OPERATIONS
The information required by this item is incorporated herein by reference from portions of the 2007 annual report toshareholders filed as Exhibit 13.0 under the caption “Management’s Discussion and Analysis of FinancialCondition and Results of Operations.”
ITEM 7A. QUANTITATIVE AND QUALITATIVE DISCLOSURES ABOUT MARKET RISK
The information regarding the market risk of the Group is incorporated herein by reference from portions of the2007 annual report to shareholders filed as Exhibit 13.0, under the caption “Risk Management”.
ITEM 8. FINANCIAL STATEMENTS AND SUPPLEMENTARY DATA
The information required by this item is incorporated herein by reference from portions of the 2007 annual report toshareholders filed as Exhibit 13.0. The consolidated financial statements of this report set forth the list of all reportsrequired by this item, and they are incorporated herein by reference.
ITEM 9. CHANGES IN AND DISAGREEMENTS WITH ACCOUNTANTS ON ACCOUNTING ANDFINANCIAL DISCLOSURE
Not applicable.
ITEM 9A. CONTROLS AND PROCEDURES
(a) Disclosure Controls and Procedures
The Group’s management is responsible for establishing and maintaining effective disclosure controls andprocedures, as defined in Rules 13a-15(e) and 15d-15(e) of the Securities Exchange Act of 1934. As ofDecember 31, 2007, an evaluation was carried out under the supervision and with the participation of the Group’smanagement, including the Chief Executive Officer (“CEO”) and the Chief Financial Officer (“CFO”), of theeffectiveness of the design and operation of the Group’s disclosure controls and procedures. Based upon suchevaluation, management concluded that the Group’s disclosure controls and procedures were effective in recording,
23
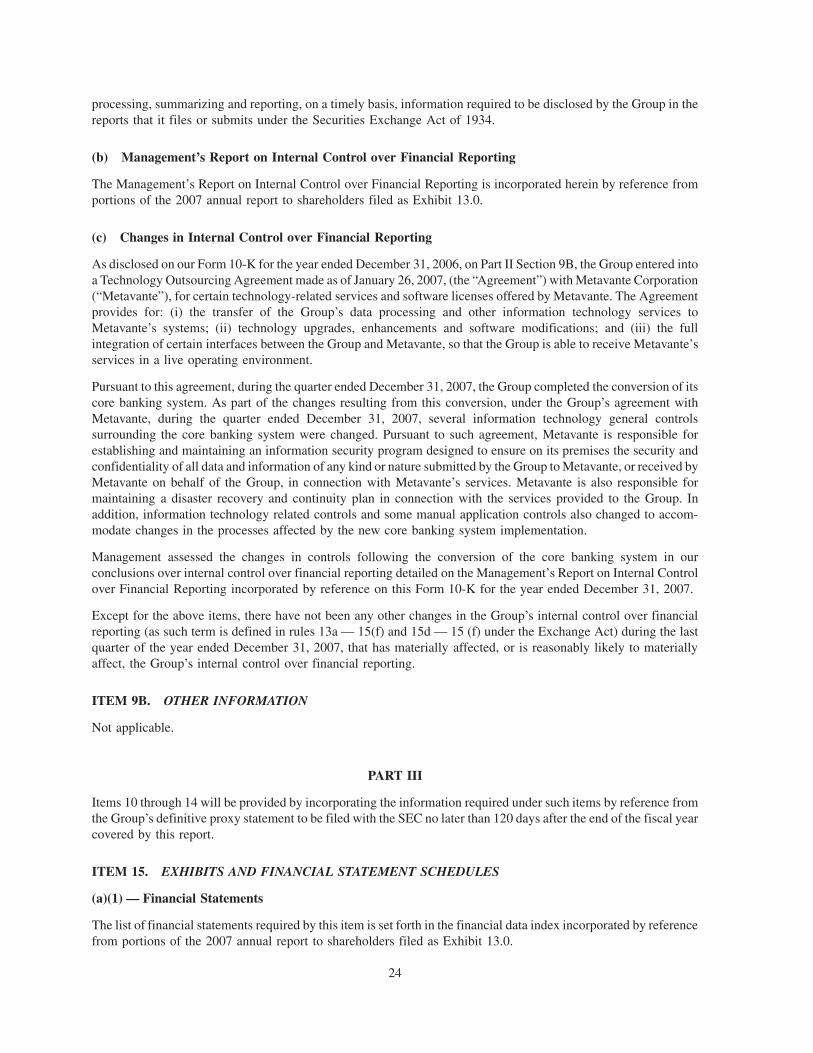
processing, summarizing and reporting, on a timely basis, information required to be disclosed by the Group in thereports that it files or submits under the Securities Exchange Act of 1934.
(b) Management’s Report on Internal Control over Financial Reporting
The Management’s Report on Internal Control over Financial Reporting is incorporated herein by reference fromportions of the 2007 annual report to shareholders filed as Exhibit 13.0.
(c) Changes in Internal Control over Financial Reporting
As disclosed on our Form 10-K for the year ended December 31, 2006, on Part II Section 9B, the Group entered intoa Technology Outsourcing Agreement made as of January 26, 2007, (the “Agreement”) with Metavante Corporation(“Metavante”), for certain technology-related services and software licenses offered by Metavante. The Agreementprovides for: (i) the transfer of the Group’s data processing and other information technology services toMetavante’s systems; (ii) technology upgrades, enhancements and software modifications; and (iii) the fullintegration of certain interfaces between the Group and Metavante, so that the Group is able to receive Metavante’sservices in a live operating environment.
Pursuant to this agreement, during the quarter ended December 31, 2007, the Group completed the conversion of itscore banking system. As part of the changes resulting from this conversion, under the Group’s agreement withMetavante, during the quarter ended December 31, 2007, several information technology general controlssurrounding the core banking system were changed. Pursuant to such agreement, Metavante is responsible forestablishing and maintaining an information security program designed to ensure on its premises the security andconfidentiality of all data and information of any kind or nature submitted by the Group to Metavante, or received byMetavante on behalf of the Group, in connection with Metavante’s services. Metavante is also responsible formaintaining a disaster recovery and continuity plan in connection with the services provided to the Group. Inaddition, information technology related controls and some manual application controls also changed to accom-modate changes in the processes affected by the new core banking system implementation.
Management assessed the changes in controls following the conversion of the core banking system in ourconclusions over internal control over financial reporting detailed on the Management’s Report on Internal Controlover Financial Reporting incorporated by reference on this Form 10-K for the year ended December 31, 2007.
Except for the above items, there have not been any other changes in the Group’s internal control over financialreporting (as such term is defined in rules 13a — 15(f) and 15d — 15 (f) under the Exchange Act) during the lastquarter of the year ended December 31, 2007, that has materially affected, or is reasonably likely to materiallyaffect, the Group’s internal control over financial reporting.
ITEM 9B. OTHER INFORMATION
Not applicable.
PART III
Items 10 through 14 will be provided by incorporating the information required under such items by reference fromthe Group’s definitive proxy statement to be filed with the SEC no later than 120 days after the end of the fiscal yearcovered by this report.
ITEM 15. EXHIBITS AND FINANCIAL STATEMENT SCHEDULES
(a)(1) — Financial Statements
The list of financial statements required by this item is set forth in the financial data index incorporated by referencefrom portions of the 2007 annual report to shareholders filed as Exhibit 13.0.
24
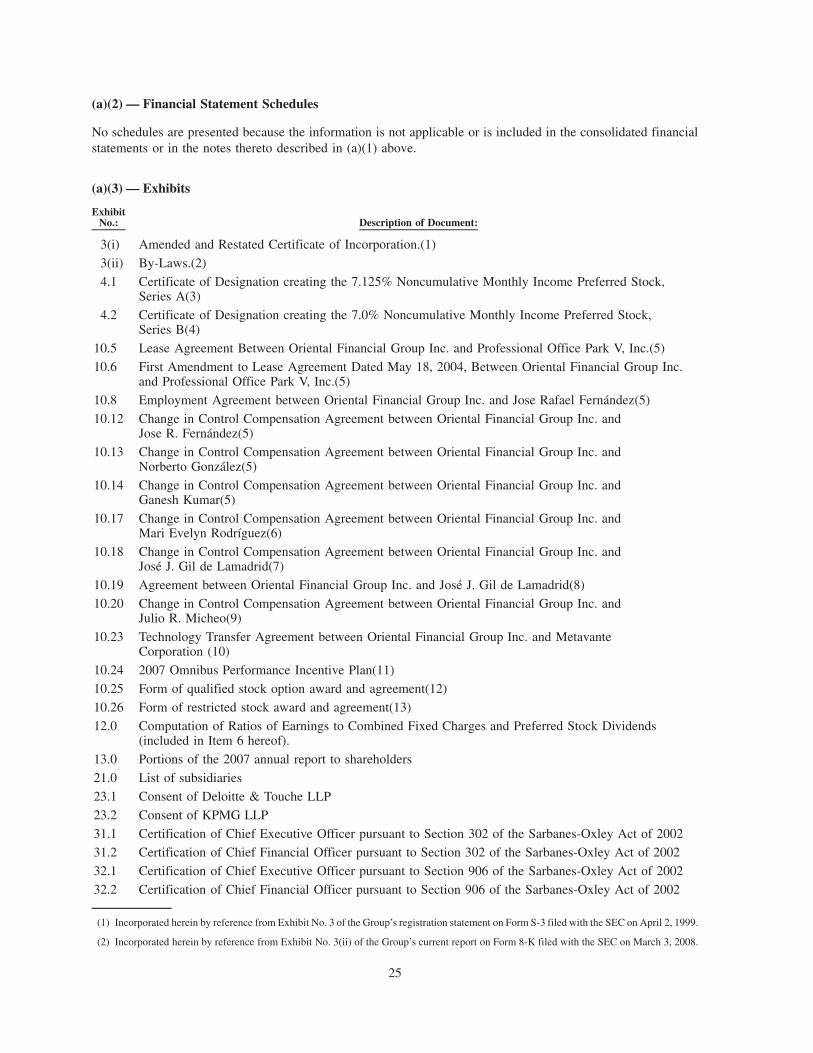
(a)(2) — Financial Statement Schedules
No schedules are presented because the information is not applicable or is included in the consolidated financialstatements or in the notes thereto described in (a)(1) above.
(a)(3) — Exhibits
ExhibitNo.: Description of Document:
3(i) Amended and Restated Certificate of Incorporation.(1)
3(ii) By-Laws.(2)
4.1 Certificate of Designation creating the 7.125% Noncumulative Monthly Income Preferred Stock,Series A(3)
4.2 Certificate of Designation creating the 7.0% Noncumulative Monthly Income Preferred Stock,Series B(4)
10.5 Lease Agreement Between Oriental Financial Group Inc. and Professional Office Park V, Inc.(5)
10.6 First Amendment to Lease Agreement Dated May 18, 2004, Between Oriental Financial Group Inc.and Professional Office Park V, Inc.(5)
10.8 Employment Agreement between Oriental Financial Group Inc. and Jose Rafael Fernández(5)
10.12 Change in Control Compensation Agreement between Oriental Financial Group Inc. andJose R. Fernández(5)
10.13 Change in Control Compensation Agreement between Oriental Financial Group Inc. andNorberto González(5)
10.14 Change in Control Compensation Agreement between Oriental Financial Group Inc. andGanesh Kumar(5)
10.17 Change in Control Compensation Agreement between Oriental Financial Group Inc. andMari Evelyn Rodríguez(6)
10.18 Change in Control Compensation Agreement between Oriental Financial Group Inc. andJosé J. Gil de Lamadrid(7)
10.19 Agreement between Oriental Financial Group Inc. and José J. Gil de Lamadrid(8)
10.20 Change in Control Compensation Agreement between Oriental Financial Group Inc. andJulio R. Micheo(9)
10.23 Technology Transfer Agreement between Oriental Financial Group Inc. and MetavanteCorporation (10)
10.24 2007 Omnibus Performance Incentive Plan(11)
10.25 Form of qualified stock option award and agreement(12)
10.26 Form of restricted stock award and agreement(13)
12.0 Computation of Ratios of Earnings to Combined Fixed Charges and Preferred Stock Dividends(included in Item 6 hereof).
13.0 Portions of the 2007 annual report to shareholders
21.0 List of subsidiaries
23.1 Consent of Deloitte & Touche LLP
23.2 Consent of KPMG LLP
31.1 Certification of Chief Executive Officer pursuant to Section 302 of the Sarbanes-Oxley Act of 2002
31.2 Certification of Chief Financial Officer pursuant to Section 302 of the Sarbanes-Oxley Act of 2002
32.1 Certification of Chief Executive Officer pursuant to Section 906 of the Sarbanes-Oxley Act of 2002
32.2 Certification of Chief Financial Officer pursuant to Section 906 of the Sarbanes-Oxley Act of 2002
(1) Incorporated herein by reference from Exhibit No. 3 of the Group’s registration statement on Form S-3 filed with the SEC on April 2, 1999.
(2) Incorporated herein by reference from Exhibit No. 3(ii) of the Group’s current report on Form 8-K filed with the SEC on March 3, 2008.
25
(3) Incorporated herein by reference from Exhibit No. 4.1 of the Group’s registration statement on Form 8-A filed with the SEC on April 30,1999.
(4) Incorporated herein by reference from Exhibit No. 4.1 of the Group’s registration statement on Form 8-A filed with the SEC onSeptember 26, 2003.
(5) Incorporated herein by reference from Exhibit 10 of the Group’s annual report on Form 10-K filed with the SEC on September 13, 2005.
(6) Incorporated herein by reference from Exhibit 10.1 of the Group’s quarterly report on Form 10-Q filed with the SEC on October 17, 2006.
(7) Incorporated herein by reference from Exhibit 10.2 of the Group’s current report on Form 8-K filed with the SEC on December 4, 2006.
(8) Incorporated herein by reference from Exhibit 10.1 of the Group’s current report on Form 8-K filed with the SEC on December 4, 2006.
(9) Incorporated herein by reference from Exhibit 10 of the Group’s current report on Form 10-K filed with the SEC on December 15, 2006.
(10) Portions of this exhibit have been omitted pursuant to a request for confidential treatment.
(11) Incorporated herein by reference from the Group’s definitive proxy statement for the 2007 annual meeting of stockholders filed with theSEC on May 23, 2007.
(12) Incorporated herein by reference from Exhibit No. 10.1 of the Group’s registration statement on Form S-8 filed with the SEC onNovember 30, 2007.
(13) Incorporated herein by reference from Exhibit No. 10.2 of the Group’s registration statement on Form S-8 filed with the SEC onNovember 30, 2007.
26
SIGNATURES
Pursuant to the requirements of Section 13 or 15(d) of the Securities Exchange Act of 1934, the registrant has dulycaused this report to be signed on its behalf by the undersigned, thereunto duly authorized.
ORIENTAL FINANCIAL GROUP INC.
By: /s/ José Rafael Férnandez
José Rafael Férnandez,President and Chief Executive Officer
Dated: March 14, 2008
By: /s/ Norberto González
Norberto GonzálezExecutive Vice President and ChiefFinancial Officer
Dated: March 14, 2008
Pursuant to the requirements of the Securities Exchange Act of 1934, this report has been signed below by thefollowing persons on behalf of the Registrant in the capacities and on the date indicated.
By: /s/ José J. Gil de Lamadrid
José J. Gil de LamadridChairman of the Board
Dated: March 14, 2008
By: /s/ José Rafael Fernández
José Rafael FernándezDirector
Dated: March 14, 2008
By: /s/ Maricarmen Aponte
Maricarmen AponteDirector
Dated: March 14, 2008
By: /s/ Francisco Arriví
Francisco ArrivíDirector
Dated: March 14, 2008
By: /s/ Dr. Pablo I. Altieri
Dr. Pablo I. AltieriDirector
Dated: March 14, 2008
By: /s/ Juan Carlos Aguayo
Juan Carlos AguayoDirector
Dated: March 14, 2008
By: /s/ Nelson García
Nelson GarcíaDirector
Dated: March 14, 2008
27

By: /s/ Pedro Morazzani
Pedro MorazzaniDirector
Dated: March 14, 2008
By: /s/ Héctor Vázquez Muñiz
Héctor Vázquez MuñizDirector
Dated: March 14, 2008
28
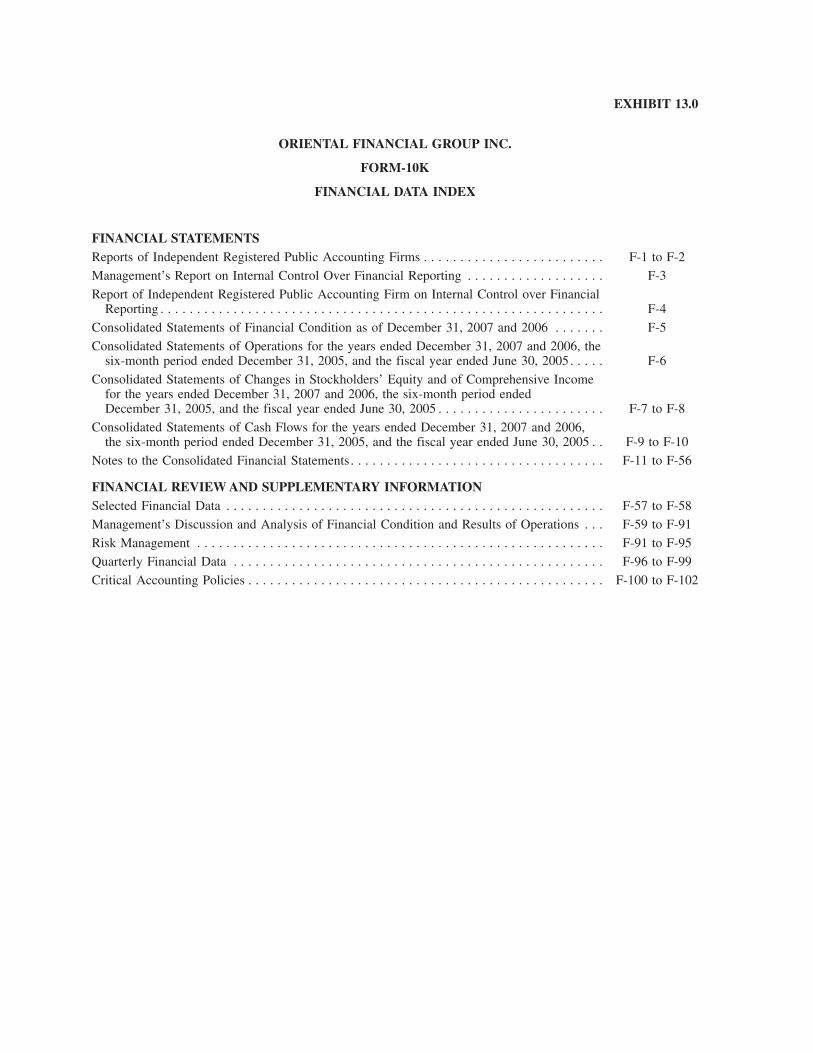
EXHIBIT 13.0
ORIENTAL FINANCIAL GROUP INC.
FORM-10K
FINANCIAL DATA INDEX
FINANCIAL STATEMENTSReports of Independent Registered Public Accounting Firms . . . . . . . . . . . . . . . . . . . . . . . . . F-1 to F-2
Management’s Report on Internal Control Over Financial Reporting . . . . . . . . . . . . . . . . . . . F-3
Report of Independent Registered Public Accounting Firm on Internal Control over FinancialReporting . . . . . . . . . . . . . . . . . . . . . . . . . . . . . . . . . . . . . . . . . . . . . . . . . . . . . . . . . . . . . F-4
Consolidated Statements of Financial Condition as of December 31, 2007 and 2006 . . . . . . . F-5
Consolidated Statements of Operations for the years ended December 31, 2007 and 2006, thesix-month period ended December 31, 2005, and the fiscal year ended June 30, 2005. . . . . F-6
Consolidated Statements of Changes in Stockholders’ Equity and of Comprehensive Incomefor the years ended December 31, 2007 and 2006, the six-month period endedDecember 31, 2005, and the fiscal year ended June 30, 2005 . . . . . . . . . . . . . . . . . . . . . . . F-7 to F-8
Consolidated Statements of Cash Flows for the years ended December 31, 2007 and 2006,the six-month period ended December 31, 2005, and the fiscal year ended June 30, 2005 . . F-9 to F-10
Notes to the Consolidated Financial Statements. . . . . . . . . . . . . . . . . . . . . . . . . . . . . . . . . . . F-11 to F-56
FINANCIAL REVIEW AND SUPPLEMENTARY INFORMATIONSelected Financial Data . . . . . . . . . . . . . . . . . . . . . . . . . . . . . . . . . . . . . . . . . . . . . . . . . . . . F-57 to F-58
Management’s Discussion and Analysis of Financial Condition and Results of Operations . . . F-59 to F-91
Risk Management . . . . . . . . . . . . . . . . . . . . . . . . . . . . . . . . . . . . . . . . . . . . . . . . . . . . . . . . F-91 to F-95Quarterly Financial Data . . . . . . . . . . . . . . . . . . . . . . . . . . . . . . . . . . . . . . . . . . . . . . . . . . . F-96 to F-99
Critical Accounting Policies . . . . . . . . . . . . . . . . . . . . . . . . . . . . . . . . . . . . . . . . . . . . . . . . . F-100 to F-102
REPORT OF INDEPENDENT REGISTERED PUBLIC ACCOUNTING FIRM
The Board of Directors and Stockholders ofOriental Financial Group Inc:
We have audited the accompanying consolidated statements of financial condition of Oriental Financial Group Inc.and subsidiaries (the “Group”) as of December 31, 2007 and 2006, and the related consolidated statements ofoperations, changes in stockholders’ equity, comprehensive income, and cash flows for the years endedDecember 31, 2007 and 2006 and the six-month period ended December 31, 2005. These consolidated financialstatements are the responsibility of the Group’s management. Our responsibility is to express an opinion on theseconsolidated financial statements based on our audits.
We conducted our audits in accordance with the standards of the Public Company Accounting Oversight Board(United States). Those standards require that we plan and perform the audit to obtain reasonable assurance aboutwhether the financial statements are free of material misstatement. An audit includes examining, on a test basis,evidence supporting the amounts and disclosures in the financial statements. An audit also includes assessing theaccounting principles used and significant estimates made by management, as well as evaluating the overallfinancial statement presentation. We believe that our audits provide a reasonable basis for our opinion.
In our opinion, the consolidated financial statements referred to above present fairly, in all material respects, thefinancial position of Oriental Financial Group Inc. and subsidiaries as of December 31, 2007 and 2006, and theresults of their operations and their cash flows for the years ended December 31, 2007 and 2006 and the six monthperiod ended December 31, 2005, in conformity with U.S. generally accepted accounting principles.
As discussed in Note 1 to the consolidated financial statements, effective January 1, 2006, the Group changed itsmethod of evaluating prior year misstatements and, effective July 1, 2005, also changed its method of accounting forshare-based payment in accordance with Statement of Financial Accounting Standards No. 123 (Revised 2004),Shared-Based Payment.
We also have audited, in accordance with the standards of the Public Company Accounting Oversight Board(United States), Oriental Financial Group Inc. and subsidiaries’ internal control over financial reporting as ofDecember 31, 2007, based on criteria established in Internal Control — Integrated Framework issued by theCommittee of Sponsoring Organizations of the Treadway Commission, and our report dated March 13, 2008expressed an unqualified opinion on the effectiveness of the Company’s internal control over financial reporting.
/s/ KPMG LLP
San Juan, Puerto RicoMarch 13, 2008
Stamp No. 2222084 of the Puerto RicoSociety of Certified Public Accountantswas affixed to the record copy of this report.
F-1
REPORT OF INDEPENDENT REGISTERED PUBLIC ACCOUNTING FIRM
To the Board of Directors and Stockholders ofOriental Financial Group Inc.San Juan, Puerto Rico
We have audited the accompanying consolidated statements of operations, changes in stockholders’ equity,comprehensive income, and cash flows of Oriental Financial Group Inc. and its subsidiaries (the “Group”) forthe year ended June 30, 2005. These financial statements are the responsibility of the Group’s management. Ourresponsibility is to express an opinion on these financial statements based on our audit.
We conducted our audit in accordance with the standards of the Public Company Accounting Oversight Board(United States). Those standards require that we plan and perform the audit to obtain reasonable assurance aboutwhether the financial statements are free of material misstatement. An audit includes examining, on a test basis,evidence supporting the amounts and disclosures in the financial statements. An audit also includes assessing theaccounting principles used and significant estimates made by management, as well as evaluating the overallfinancial statement presentation. We believe that our audit provides a reasonable basis for our opinion.
In our opinion, such consolidated financial statements present fairly, in all material respects, the results ofoperations and the cash flows of Oriental Financial Group Inc. and its subsidiaries for the year ended June 30, 2005in conformity with accounting principles generally accepted in the United States of America.
As discussed in Note 20, the accompanying financial statements for the year ended June 30, 2005 have beenrestated.
/s/ DELOITTE & TOUCHE LLP
San Juan, Puerto RicoSeptember 9, 2005 (June 9, 2006 asto the effects of the restatementdiscussed in Note 20)
Stamp No. 2293190affixed to original.
F-2
ORIENTAL FINANCIAL GROUP INC.
MANAGEMENT’S REPORT ON INTERNAL CONTROL OVER FINANCIAL REPORTING
To the Board of Directors and stockholders of Oriental Financial Group Inc.:
The management of Oriental Financial Group Inc. (the “Group”) is responsible for establishing and maintainingeffective internal control over financial reporting, as defined in Rules 13a-15(f) and 15d-15(f) under the SecuritiesExchange Act of 1934, and for the assessment of internal control over financial reporting. The Group’s internalcontrol over financial reporting is a process designed to provide reasonable assurance regarding the reliability offinancial reporting and the preparation of financial statements for external purposes in accordance with accountingprinciples generally accepted in the United States of America.
The Group’s internal control over financial reporting includes those policies and procedures that:
(1) pertain to the maintenance of records that, in reasonable detail, accurately and fairly reflect thetransactions and dispositions of the assets of the Group;
(2) provide reasonable assurance that transactions are recorded as necessary to permit preparation offinancial statements in accordance with accounting principles generally accepted in the United States ofAmerica, and that receipts and expenditures of the Group are being made only in accordance with autho-rization of management and directors of the Group; and
(3) provide reasonable assurance regarding prevention or timely detection of unauthorized acquisition,use or disposition of the Group’s assets that could have a material effect on the financial statements.
Because of its inherent limitations, internal control over financial reporting may not prevent or detect misstate-ments. Also, projections of any evaluation of effectiveness to future periods are subject to the risk that controls maybecome inadequate because of changes in conditions, or that the degree of compliance with the policies orprocedures may deteriorate.
As called for by Section 404 of the Sarbanes-Oxley Act of 2002, management has assessed the effectiveness of theGroup’s internal control over financial reporting as of December 31, 2007. Management made its assessment usingthe criteria set forth in the Internal Control-Integrated Framework issued by the Committee of SponsoringOrganizations of the Treadway Commission (the “COSO Criteria”).
Based on its assessment, management has concluded that the Group maintained effective internal control overfinancial reporting as of December 31, 2007 based on the COSO Criteria. The effectiveness of the Group’s internalcontrol over financial reporting as of December 31, 2007, has been audited by KPMG LLP, the Group’s independentregistered public accounting firm, as stated in their report dated March13, 2008.
By: /s/ José Rafael Fernández By: /s/ Norberto González
José Rafael FernándezPresident and Chief Executive OfficerDate: March 13, 2008
Norberto GonzálezExecutive Vice President and Chief Financial OfficerDate: March 13, 2008
F-3
REPORT OF INDEPENDENT REGISTERED PUBLIC ACCOUNTING FIRM
The Board of Directors and StockholdersOriental Financial Group Inc:
We have audited Oriental Financial Group Inc.’s (the “Group’s”) internal control over financial reporting as ofDecember 31, 2007, based on criteria established in Internal Control-Integrated Framework issued by theCommittee of Sponsoring Organizations of the Treadway Commission (“COSO”). The Group’s management isresponsible for maintaining effective internal control over financial reporting and for its assessment of theeffectiveness of internal control over financial reporting, included in the accompanying Management’s Reporton Internal Control Over Financial Reporting. Our responsibility is to express an opinion on the Group’s internalcontrol over financial reporting based on our audit.
We conducted our audit in accordance with the standards of the Public Company Accounting Oversight Board(United States). Those standards require that we plan and perform the audit to obtain reasonable assurance aboutwhether effective internal control over financial reporting was maintained in all material respects. Our auditincluded obtaining an understanding of internal control over financial reporting, assessing the risk that a materialweakness exists, and testing and evaluating the design and operating effectiveness of internal control based on theassessed risk. Our audit also included performing such other procedures as we considered necessary in thecircumstances. We believe that our audit provides a reasonable basis for our opinion.
A company’s internal control over financial reporting is a process designed to provide reasonable assuranceregarding the reliability of financial reporting and the preparation of financial statements for external purposes inaccordance with generally accepted accounting principles. A company’s internal control over financial reportingincludes those policies and procedures that (1) pertain to the maintenance of records that, in reasonable detail,accurately and fairly reflect the transactions and dispositions of the assets of the company; (2) provide reasonableassurance that transactions are recorded as necessary to permit preparation of financial statements in accordancewith generally accepted accounting principles, and that receipts and expenditures of the company are being madeonly in accordance with authorizations of management and directors of the company; and (3) provide reasonableassurance regarding prevention or timely detection of unauthorized acquisition, use, or disposition of the company’sassets that could have a material effect on the financial statements.
Because of its inherent limitations, internal control over financial reporting may not prevent or detect misstate-ments. Also, projections of any evaluation of effectiveness to future periods are subject to the risk that controls maybecome inadequate because of changes in conditions, or that the degree of compliance with the policies orprocedures may deteriorate.
In our opinion, Oriental Financial Group Inc. maintained, in all material respects, effective internal control overfinancial reporting as of December 31, 2007, based on criteria established in Internal Control-Integrated Frame-work issued by the Committee of Sponsoring Organizations of the Treadway Commission.
We also have audited, in accordance with the standards of the Public Company Accounting Oversight Board(United States), the consolidated statements of financial condition of Oriental Financial Group Inc. as ofDecember 31, 2007 and 2006, and the related consolidated statements of operations, stockholders’ equity,comprehensive income, and cash flows for the years ended December 31, 2007 and 2006, and the six-monthperiod ended December 31, 2005, and our report dated March 13, 2008, expressed an unqualified opinion on thoseconsolidated financial statements.
/s/ KPMG LLP
San Juan, Puerto RicoMarch 13, 2008
Stamp No. 2222073 of the Puerto RicoSociety of Certified Public Accountantswas affixed to the record copy of this report.
F-4
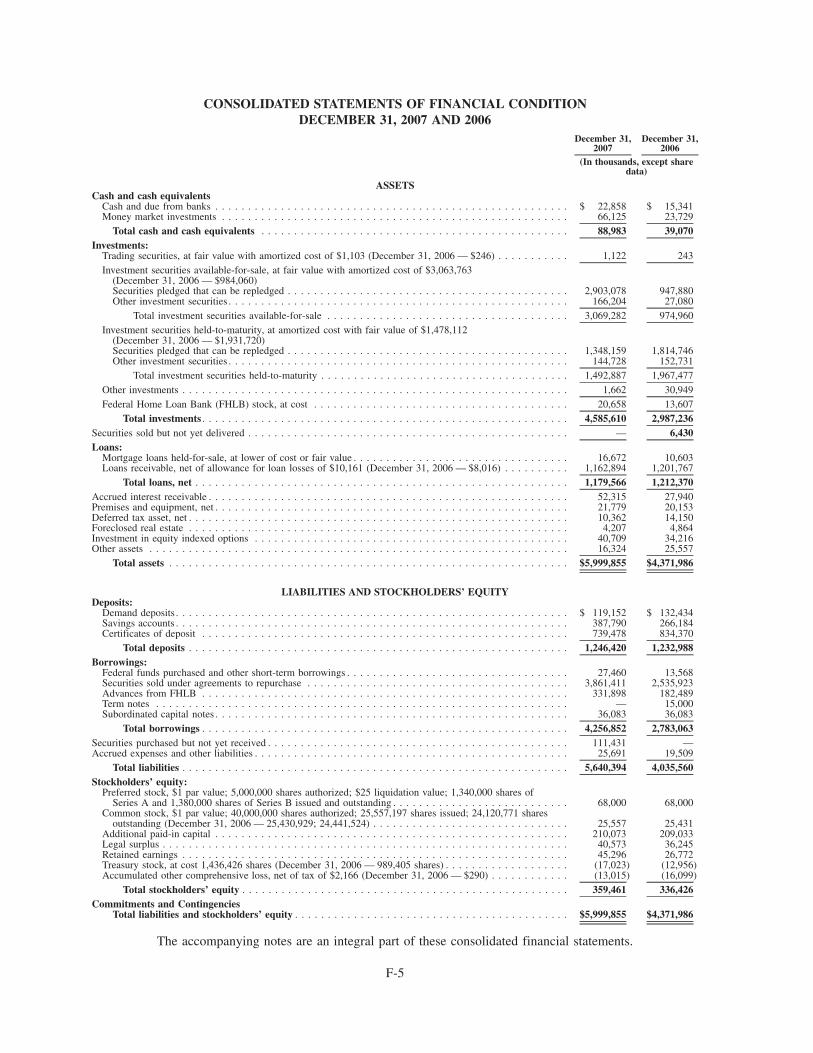
CONSOLIDATED STATEMENTS OF FINANCIAL CONDITIONDECEMBER 31, 2007 AND 2006
December 31,2007
December 31,2006
(In thousands, except sharedata)
ASSETSCash and cash equivalents
Cash and due from banks . . . . . . . . . . . . . . . . . . . . . . . . . . . . . . . . . . . . . . . . . . . . . . . . . . . . . . $ 22,858 $ 15,341Money market investments . . . . . . . . . . . . . . . . . . . . . . . . . . . . . . . . . . . . . . . . . . . . . . . . . . . . . 66,125 23,729
Total cash and cash equivalents . . . . . . . . . . . . . . . . . . . . . . . . . . . . . . . . . . . . . . . . . . . . . . . 88,983 39,070Investments:
Trading securities, at fair value with amortized cost of $1,103 (December 31, 2006 — $246) . . . . . . . . . . . 1,122 243Investment securities available-for-sale, at fair value with amortized cost of $3,063,763
(December 31, 2006 — $984,060)Securities pledged that can be repledged . . . . . . . . . . . . . . . . . . . . . . . . . . . . . . . . . . . . . . . . . . . 2,903,078 947,880Other investment securities . . . . . . . . . . . . . . . . . . . . . . . . . . . . . . . . . . . . . . . . . . . . . . . . . . . . 166,204 27,080
Total investment securities available-for-sale . . . . . . . . . . . . . . . . . . . . . . . . . . . . . . . . . . . . . 3,069,282 974,960Investment securities held-to-maturity, at amortized cost with fair value of $1,478,112
(December 31, 2006 — $1,931,720)Securities pledged that can be repledged . . . . . . . . . . . . . . . . . . . . . . . . . . . . . . . . . . . . . . . . . . . 1,348,159 1,814,746Other investment securities . . . . . . . . . . . . . . . . . . . . . . . . . . . . . . . . . . . . . . . . . . . . . . . . . . . . 144,728 152,731
Total investment securities held-to-maturity . . . . . . . . . . . . . . . . . . . . . . . . . . . . . . . . . . . . . . 1,492,887 1,967,477Other investments . . . . . . . . . . . . . . . . . . . . . . . . . . . . . . . . . . . . . . . . . . . . . . . . . . . . . . . . . . . 1,662 30,949Federal Home Loan Bank (FHLB) stock, at cost . . . . . . . . . . . . . . . . . . . . . . . . . . . . . . . . . . . . . . . 20,658 13,607
Total investments . . . . . . . . . . . . . . . . . . . . . . . . . . . . . . . . . . . . . . . . . . . . . . . . . . . . . . . . 4,585,610 2,987,236Securities sold but not yet delivered . . . . . . . . . . . . . . . . . . . . . . . . . . . . . . . . . . . . . . . . . . . . . . . . . — 6,430Loans:
Mortgage loans held-for-sale, at lower of cost or fair value . . . . . . . . . . . . . . . . . . . . . . . . . . . . . . . . . 16,672 10,603Loans receivable, net of allowance for loan losses of $10,161 (December 31, 2006 — $8,016) . . . . . . . . . . 1,162,894 1,201,767
Total loans, net . . . . . . . . . . . . . . . . . . . . . . . . . . . . . . . . . . . . . . . . . . . . . . . . . . . . . . . . . 1,179,566 1,212,370Accrued interest receivable . . . . . . . . . . . . . . . . . . . . . . . . . . . . . . . . . . . . . . . . . . . . . . . . . . . . . . . 52,315 27,940Premises and equipment, net . . . . . . . . . . . . . . . . . . . . . . . . . . . . . . . . . . . . . . . . . . . . . . . . . . . . . . 21,779 20,153Deferred tax asset, net . . . . . . . . . . . . . . . . . . . . . . . . . . . . . . . . . . . . . . . . . . . . . . . . . . . . . . . . . . 10,362 14,150Foreclosed real estate . . . . . . . . . . . . . . . . . . . . . . . . . . . . . . . . . . . . . . . . . . . . . . . . . . . . . . . . . . 4,207 4,864Investment in equity indexed options . . . . . . . . . . . . . . . . . . . . . . . . . . . . . . . . . . . . . . . . . . . . . . . . 40,709 34,216Other assets . . . . . . . . . . . . . . . . . . . . . . . . . . . . . . . . . . . . . . . . . . . . . . . . . . . . . . . . . . . . . . . . 16,324 25,557
Total assets . . . . . . . . . . . . . . . . . . . . . . . . . . . . . . . . . . . . . . . . . . . . . . . . . . . . . . . . . . . . . $5,999,855 $4,371,986
LIABILITIES AND STOCKHOLDERS’ EQUITYDeposits:
Demand deposits . . . . . . . . . . . . . . . . . . . . . . . . . . . . . . . . . . . . . . . . . . . . . . . . . . . . . . . . . . . . $ 119,152 $ 132,434Savings accounts . . . . . . . . . . . . . . . . . . . . . . . . . . . . . . . . . . . . . . . . . . . . . . . . . . . . . . . . . . . . 387,790 266,184Certificates of deposit . . . . . . . . . . . . . . . . . . . . . . . . . . . . . . . . . . . . . . . . . . . . . . . . . . . . . . . . 739,478 834,370
Total deposits . . . . . . . . . . . . . . . . . . . . . . . . . . . . . . . . . . . . . . . . . . . . . . . . . . . . . . . . . . 1,246,420 1,232,988Borrowings:
Federal funds purchased and other short-term borrowings . . . . . . . . . . . . . . . . . . . . . . . . . . . . . . . . . . 27,460 13,568Securities sold under agreements to repurchase . . . . . . . . . . . . . . . . . . . . . . . . . . . . . . . . . . . . . . . . 3,861,411 2,535,923Advances from FHLB . . . . . . . . . . . . . . . . . . . . . . . . . . . . . . . . . . . . . . . . . . . . . . . . . . . . . . . . 331,898 182,489Term notes . . . . . . . . . . . . . . . . . . . . . . . . . . . . . . . . . . . . . . . . . . . . . . . . . . . . . . . . . . . . . . . — 15,000Subordinated capital notes . . . . . . . . . . . . . . . . . . . . . . . . . . . . . . . . . . . . . . . . . . . . . . . . . . . . . . 36,083 36,083
Total borrowings . . . . . . . . . . . . . . . . . . . . . . . . . . . . . . . . . . . . . . . . . . . . . . . . . . . . . . . . 4,256,852 2,783,063Securities purchased but not yet received . . . . . . . . . . . . . . . . . . . . . . . . . . . . . . . . . . . . . . . . . . . . . . 111,431 —Accrued expenses and other liabilities . . . . . . . . . . . . . . . . . . . . . . . . . . . . . . . . . . . . . . . . . . . . . . . . 25,691 19,509
Total liabilities . . . . . . . . . . . . . . . . . . . . . . . . . . . . . . . . . . . . . . . . . . . . . . . . . . . . . . . . . . . 5,640,394 4,035,560Stockholders’ equity:
Preferred stock, $1 par value; 5,000,000 shares authorized; $25 liquidation value; 1,340,000 shares ofSeries A and 1,380,000 shares of Series B issued and outstanding . . . . . . . . . . . . . . . . . . . . . . . . . . . 68,000 68,000
Common stock, $1 par value; 40,000,000 shares authorized; 25,557,197 shares issued; 24,120,771 sharesoutstanding (December 31, 2006 — 25,430,929; 24,441,524) . . . . . . . . . . . . . . . . . . . . . . . . . . . . . . 25,557 25,431
Additional paid-in capital . . . . . . . . . . . . . . . . . . . . . . . . . . . . . . . . . . . . . . . . . . . . . . . . . . . . . . 210,073 209,033Legal surplus . . . . . . . . . . . . . . . . . . . . . . . . . . . . . . . . . . . . . . . . . . . . . . . . . . . . . . . . . . . . . . 40,573 36,245Retained earnings . . . . . . . . . . . . . . . . . . . . . . . . . . . . . . . . . . . . . . . . . . . . . . . . . . . . . . . . . . . 45,296 26,772Treasury stock, at cost 1,436,426 shares (December 31, 2006 — 989,405 shares) . . . . . . . . . . . . . . . . . . . (17,023) (12,956)Accumulated other comprehensive loss, net of tax of $2,166 (December 31, 2006 — $290) . . . . . . . . . . . . (13,015) (16,099)
Total stockholders’ equity . . . . . . . . . . . . . . . . . . . . . . . . . . . . . . . . . . . . . . . . . . . . . . . . . . 359,461 336,426Commitments and Contingencies
Total liabilities and stockholders’ equity . . . . . . . . . . . . . . . . . . . . . . . . . . . . . . . . . . . . . . . . . . $5,999,855 $4,371,986
The accompanying notes are an integral part of these consolidated financial statements.
F-5
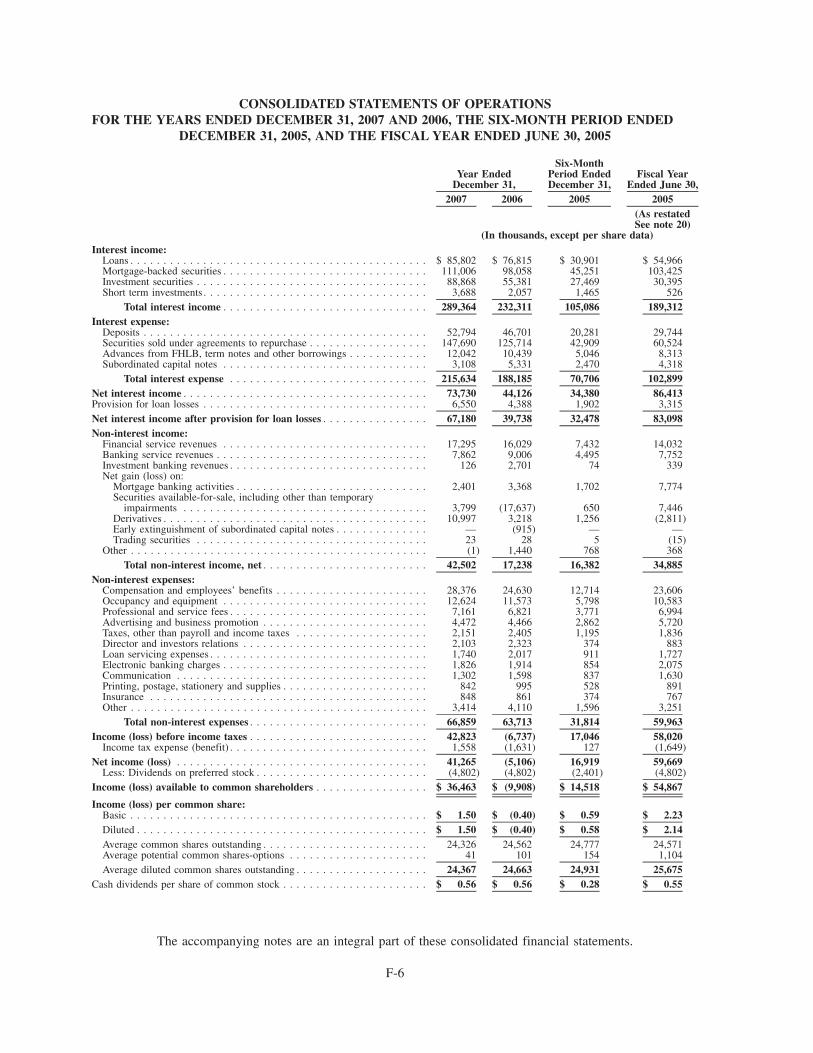
CONSOLIDATED STATEMENTS OF OPERATIONSFOR THE YEARS ENDED DECEMBER 31, 2007 AND 2006, THE SIX-MONTH PERIOD ENDED
DECEMBER 31, 2005, AND THE FISCAL YEAR ENDED JUNE 30, 2005
2007 2006 2005 2005
Year EndedDecember 31,
Six-MonthPeriod EndedDecember 31,
Fiscal YearEnded June 30,
(As restatedSee note 20)
(In thousands, except per share data)Interest income:
Loans . . . . . . . . . . . . . . . . . . . . . . . . . . . . . . . . . . . . . . . . . . . . . $ 85,802 $ 76,815 $ 30,901 $ 54,966Mortgage-backed securities . . . . . . . . . . . . . . . . . . . . . . . . . . . . . . . 111,006 98,058 45,251 103,425Investment securities . . . . . . . . . . . . . . . . . . . . . . . . . . . . . . . . . . . 88,868 55,381 27,469 30,395Short term investments . . . . . . . . . . . . . . . . . . . . . . . . . . . . . . . . . . 3,688 2,057 1,465 526
Total interest income . . . . . . . . . . . . . . . . . . . . . . . . . . . . . . . 289,364 232,311 105,086 189,312Interest expense:
Deposits . . . . . . . . . . . . . . . . . . . . . . . . . . . . . . . . . . . . . . . . . . . 52,794 46,701 20,281 29,744Securities sold under agreements to repurchase . . . . . . . . . . . . . . . . . . 147,690 125,714 42,909 60,524Advances from FHLB, term notes and other borrowings . . . . . . . . . . . . 12,042 10,439 5,046 8,313Subordinated capital notes . . . . . . . . . . . . . . . . . . . . . . . . . . . . . . . 3,108 5,331 2,470 4,318
Total interest expense . . . . . . . . . . . . . . . . . . . . . . . . . . . . . . 215,634 188,185 70,706 102,899Net interest income . . . . . . . . . . . . . . . . . . . . . . . . . . . . . . . . . . . . . 73,730 44,126 34,380 86,413Provision for loan losses . . . . . . . . . . . . . . . . . . . . . . . . . . . . . . . . . . 6,550 4,388 1,902 3,315Net interest income after provision for loan losses . . . . . . . . . . . . . . . . 67,180 39,738 32,478 83,098Non-interest income:
Financial service revenues . . . . . . . . . . . . . . . . . . . . . . . . . . . . . . . 17,295 16,029 7,432 14,032Banking service revenues . . . . . . . . . . . . . . . . . . . . . . . . . . . . . . . . 7,862 9,006 4,495 7,752Investment banking revenues . . . . . . . . . . . . . . . . . . . . . . . . . . . . . . 126 2,701 74 339Net gain (loss) on:
Mortgage banking activities . . . . . . . . . . . . . . . . . . . . . . . . . . . . . 2,401 3,368 1,702 7,774Securities available-for-sale, including other than temporary
impairments . . . . . . . . . . . . . . . . . . . . . . . . . . . . . . . . . . . . . 3,799 (17,637) 650 7,446Derivatives . . . . . . . . . . . . . . . . . . . . . . . . . . . . . . . . . . . . . . . . 10,997 3,218 1,256 (2,811)Early extinguishment of subordinated capital notes . . . . . . . . . . . . . . — (915) — —Trading securities . . . . . . . . . . . . . . . . . . . . . . . . . . . . . . . . . . . 23 28 5 (15)
Other . . . . . . . . . . . . . . . . . . . . . . . . . . . . . . . . . . . . . . . . . . . . . (1) 1,440 768 368Total non-interest income, net . . . . . . . . . . . . . . . . . . . . . . . . . 42,502 17,238 16,382 34,885
Non-interest expenses:Compensation and employees’ benefits . . . . . . . . . . . . . . . . . . . . . . . 28,376 24,630 12,714 23,606Occupancy and equipment . . . . . . . . . . . . . . . . . . . . . . . . . . . . . . . 12,624 11,573 5,798 10,583Professional and service fees . . . . . . . . . . . . . . . . . . . . . . . . . . . . . . 7,161 6,821 3,771 6,994Advertising and business promotion . . . . . . . . . . . . . . . . . . . . . . . . . 4,472 4,466 2,862 5,720Taxes, other than payroll and income taxes . . . . . . . . . . . . . . . . . . . . 2,151 2,405 1,195 1,836Director and investors relations . . . . . . . . . . . . . . . . . . . . . . . . . . . . 2,103 2,323 374 883Loan servicing expenses . . . . . . . . . . . . . . . . . . . . . . . . . . . . . . . . . 1,740 2,017 911 1,727Electronic banking charges . . . . . . . . . . . . . . . . . . . . . . . . . . . . . . . 1,826 1,914 854 2,075Communication . . . . . . . . . . . . . . . . . . . . . . . . . . . . . . . . . . . . . . 1,302 1,598 837 1,630Printing, postage, stationery and supplies . . . . . . . . . . . . . . . . . . . . . . 842 995 528 891Insurance . . . . . . . . . . . . . . . . . . . . . . . . . . . . . . . . . . . . . . . . . . 848 861 374 767Other . . . . . . . . . . . . . . . . . . . . . . . . . . . . . . . . . . . . . . . . . . . . . 3,414 4,110 1,596 3,251
Total non-interest expenses . . . . . . . . . . . . . . . . . . . . . . . . . . . 66,859 63,713 31,814 59,963Income (loss) before income taxes . . . . . . . . . . . . . . . . . . . . . . . . . . . 42,823 (6,737) 17,046 58,020
Income tax expense (benefit) . . . . . . . . . . . . . . . . . . . . . . . . . . . . . . 1,558 (1,631) 127 (1,649)Net income (loss) . . . . . . . . . . . . . . . . . . . . . . . . . . . . . . . . . . . . . . 41,265 (5,106) 16,919 59,669
Less: Dividends on preferred stock . . . . . . . . . . . . . . . . . . . . . . . . . . (4,802) (4,802) (2,401) (4,802)Income (loss) available to common shareholders . . . . . . . . . . . . . . . . . $ 36,463 $ (9,908) $ 14,518 $ 54,867
Income (loss) per common share:Basic . . . . . . . . . . . . . . . . . . . . . . . . . . . . . . . . . . . . . . . . . . . . . $ 1.50 $ (0.40) $ 0.59 $ 2.23Diluted . . . . . . . . . . . . . . . . . . . . . . . . . . . . . . . . . . . . . . . . . . . . $ 1.50 $ (0.40) $ 0.58 $ 2.14Average common shares outstanding . . . . . . . . . . . . . . . . . . . . . . . . . 24,326 24,562 24,777 24,571Average potential common shares-options . . . . . . . . . . . . . . . . . . . . . 41 101 154 1,104Average diluted common shares outstanding . . . . . . . . . . . . . . . . . . . . 24,367 24,663 24,931 25,675
Cash dividends per share of common stock . . . . . . . . . . . . . . . . . . . . . . $ 0.56 $ 0.56 $ 0.28 $ 0.55
The accompanying notes are an integral part of these consolidated financial statements.
F-6
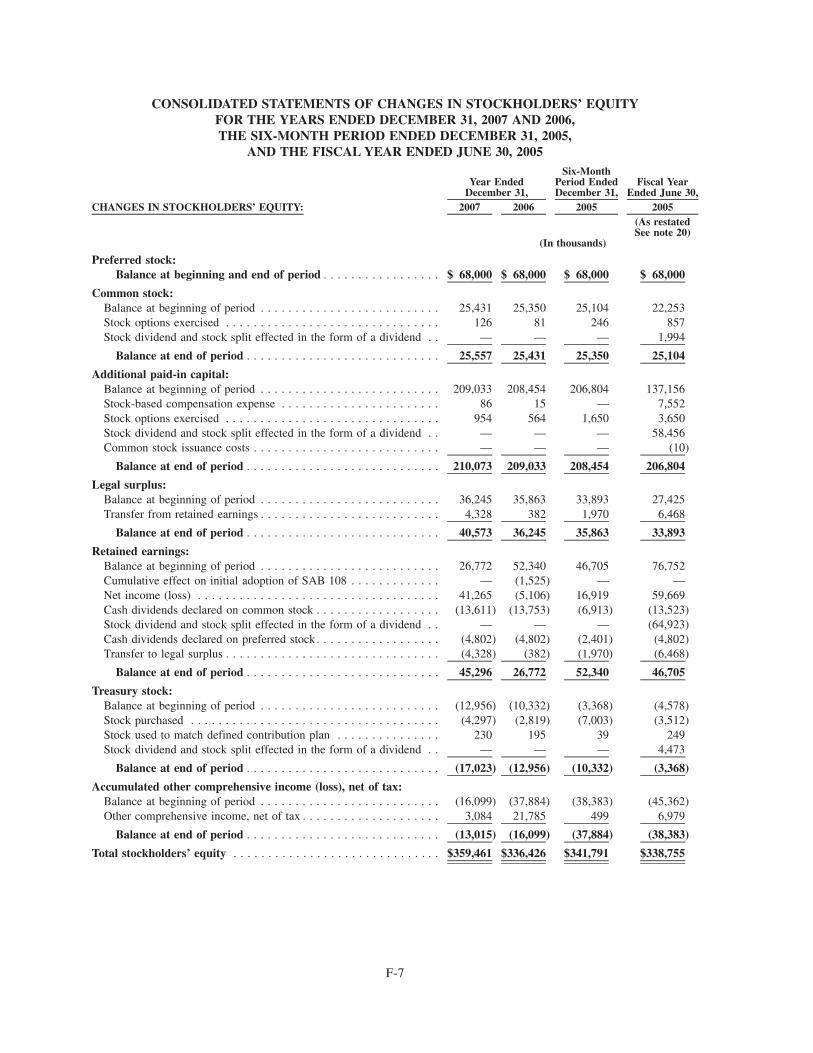
CONSOLIDATED STATEMENTS OF CHANGES IN STOCKHOLDERS’ EQUITYFOR THE YEARS ENDED DECEMBER 31, 2007 AND 2006,THE SIX-MONTH PERIOD ENDED DECEMBER 31, 2005,
AND THE FISCAL YEAR ENDED JUNE 30, 2005
CHANGES IN STOCKHOLDERS’ EQUITY: 2007 2006 2005 2005
Year EndedDecember 31,
Six-MonthPeriod EndedDecember 31,
Fiscal YearEnded June 30,
(As restatedSee note 20)
(In thousands)
Preferred stock:Balance at beginning and end of period . . . . . . . . . . . . . . . . . $ 68,000 $ 68,000 $ 68,000 $ 68,000
Common stock:Balance at beginning of period . . . . . . . . . . . . . . . . . . . . . . . . . . 25,431 25,350 25,104 22,253Stock options exercised . . . . . . . . . . . . . . . . . . . . . . . . . . . . . . . 126 81 246 857Stock dividend and stock split effected in the form of a dividend . . — — — 1,994
Balance at end of period . . . . . . . . . . . . . . . . . . . . . . . . . . . . 25,557 25,431 25,350 25,104
Additional paid-in capital:Balance at beginning of period . . . . . . . . . . . . . . . . . . . . . . . . . . 209,033 208,454 206,804 137,156Stock-based compensation expense . . . . . . . . . . . . . . . . . . . . . . . 86 15 — 7,552Stock options exercised . . . . . . . . . . . . . . . . . . . . . . . . . . . . . . . 954 564 1,650 3,650Stock dividend and stock split effected in the form of a dividend . . — — — 58,456Common stock issuance costs . . . . . . . . . . . . . . . . . . . . . . . . . . . — — — (10)
Balance at end of period . . . . . . . . . . . . . . . . . . . . . . . . . . . . 210,073 209,033 208,454 206,804
Legal surplus:Balance at beginning of period . . . . . . . . . . . . . . . . . . . . . . . . . . 36,245 35,863 33,893 27,425Transfer from retained earnings . . . . . . . . . . . . . . . . . . . . . . . . . . 4,328 382 1,970 6,468
Balance at end of period . . . . . . . . . . . . . . . . . . . . . . . . . . . . 40,573 36,245 35,863 33,893
Retained earnings:Balance at beginning of period . . . . . . . . . . . . . . . . . . . . . . . . . . 26,772 52,340 46,705 76,752Cumulative effect on initial adoption of SAB 108 . . . . . . . . . . . . . — (1,525) — —Net income (loss) . . . . . . . . . . . . . . . . . . . . . . . . . . . . . . . . . . . 41,265 (5,106) 16,919 59,669Cash dividends declared on common stock . . . . . . . . . . . . . . . . . . (13,611) (13,753) (6,913) (13,523)Stock dividend and stock split effected in the form of a dividend . . — — — (64,923)Cash dividends declared on preferred stock. . . . . . . . . . . . . . . . . . (4,802) (4,802) (2,401) (4,802)Transfer to legal surplus . . . . . . . . . . . . . . . . . . . . . . . . . . . . . . . (4,328) (382) (1,970) (6,468)
Balance at end of period . . . . . . . . . . . . . . . . . . . . . . . . . . . . 45,296 26,772 52,340 46,705
Treasury stock:Balance at beginning of period . . . . . . . . . . . . . . . . . . . . . . . . . . (12,956) (10,332) (3,368) (4,578)Stock purchased . . . . . . . . . . . . . . . . . . . . . . . . . . . . . . . . . . . . (4,297) (2,819) (7,003) (3,512)Stock used to match defined contribution plan . . . . . . . . . . . . . . . 230 195 39 249Stock dividend and stock split effected in the form of a dividend . . — — — 4,473
Balance at end of period . . . . . . . . . . . . . . . . . . . . . . . . . . . . (17,023) (12,956) (10,332) (3,368)
Accumulated other comprehensive income (loss), net of tax:Balance at beginning of period . . . . . . . . . . . . . . . . . . . . . . . . . . (16,099) (37,884) (38,383) (45,362)Other comprehensive income, net of tax . . . . . . . . . . . . . . . . . . . . 3,084 21,785 499 6,979
Balance at end of period . . . . . . . . . . . . . . . . . . . . . . . . . . . . (13,015) (16,099) (37,884) (38,383)
Total stockholders’ equity . . . . . . . . . . . . . . . . . . . . . . . . . . . . . . $359,461 $336,426 $341,791 $338,755
F-7
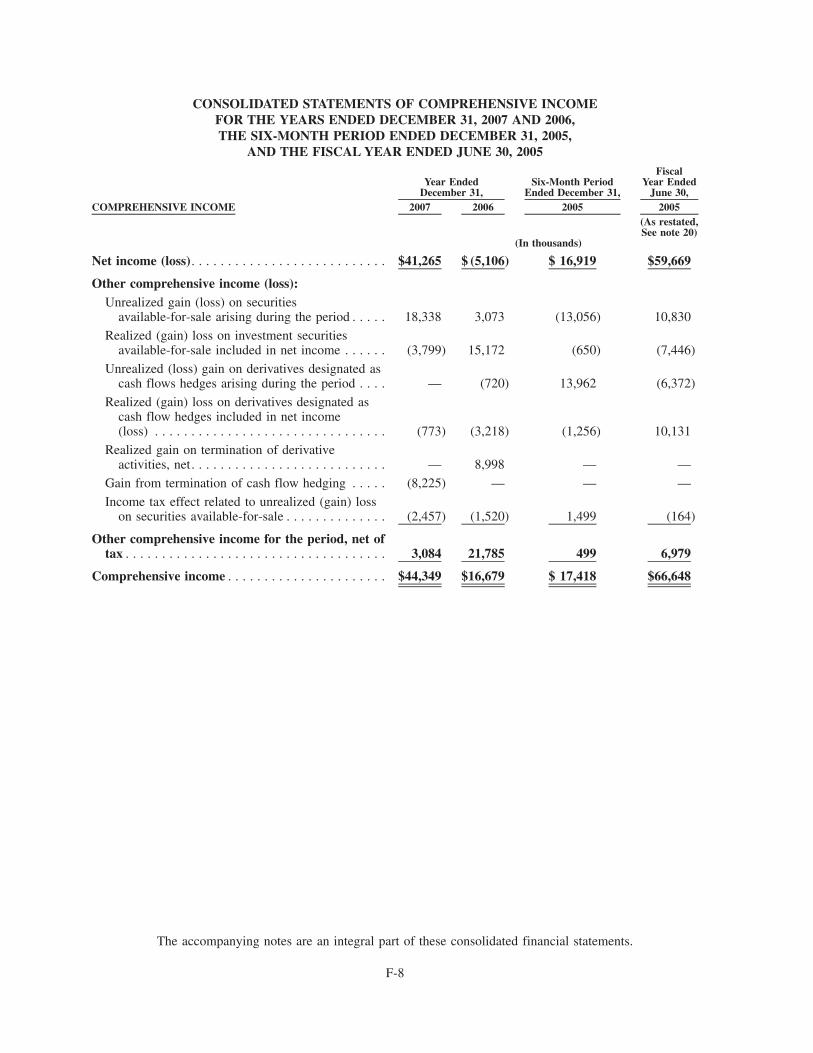
CONSOLIDATED STATEMENTS OF COMPREHENSIVE INCOMEFOR THE YEARS ENDED DECEMBER 31, 2007 AND 2006,THE SIX-MONTH PERIOD ENDED DECEMBER 31, 2005,
AND THE FISCAL YEAR ENDED JUNE 30, 2005
COMPREHENSIVE INCOME 2007 2006 2005 2005
Year EndedDecember 31,
Six-Month PeriodEnded December 31,
FiscalYear Ended
June 30,
(As restated,See note 20)
(In thousands)
Net income (loss). . . . . . . . . . . . . . . . . . . . . . . . . . . $41,265 $ (5,106) $ 16,919 $59,669
Other comprehensive income (loss):Unrealized gain (loss) on securities
available-for-sale arising during the period . . . . . 18,338 3,073 (13,056) 10,830
Realized (gain) loss on investment securitiesavailable-for-sale included in net income . . . . . . (3,799) 15,172 (650) (7,446)
Unrealized (loss) gain on derivatives designated ascash flows hedges arising during the period . . . . — (720) 13,962 (6,372)
Realized (gain) loss on derivatives designated ascash flow hedges included in net income(loss) . . . . . . . . . . . . . . . . . . . . . . . . . . . . . . . . (773) (3,218) (1,256) 10,131
Realized gain on termination of derivativeactivities, net. . . . . . . . . . . . . . . . . . . . . . . . . . . — 8,998 — —
Gain from termination of cash flow hedging . . . . . (8,225) — — —
Income tax effect related to unrealized (gain) losson securities available-for-sale . . . . . . . . . . . . . . (2,457) (1,520) 1,499 (164)
Other comprehensive income for the period, net oftax . . . . . . . . . . . . . . . . . . . . . . . . . . . . . . . . . . . . 3,084 21,785 499 6,979
Comprehensive income . . . . . . . . . . . . . . . . . . . . . . $44,349 $16,679 $ 17,418 $66,648
The accompanying notes are an integral part of these consolidated financial statements.
F-8
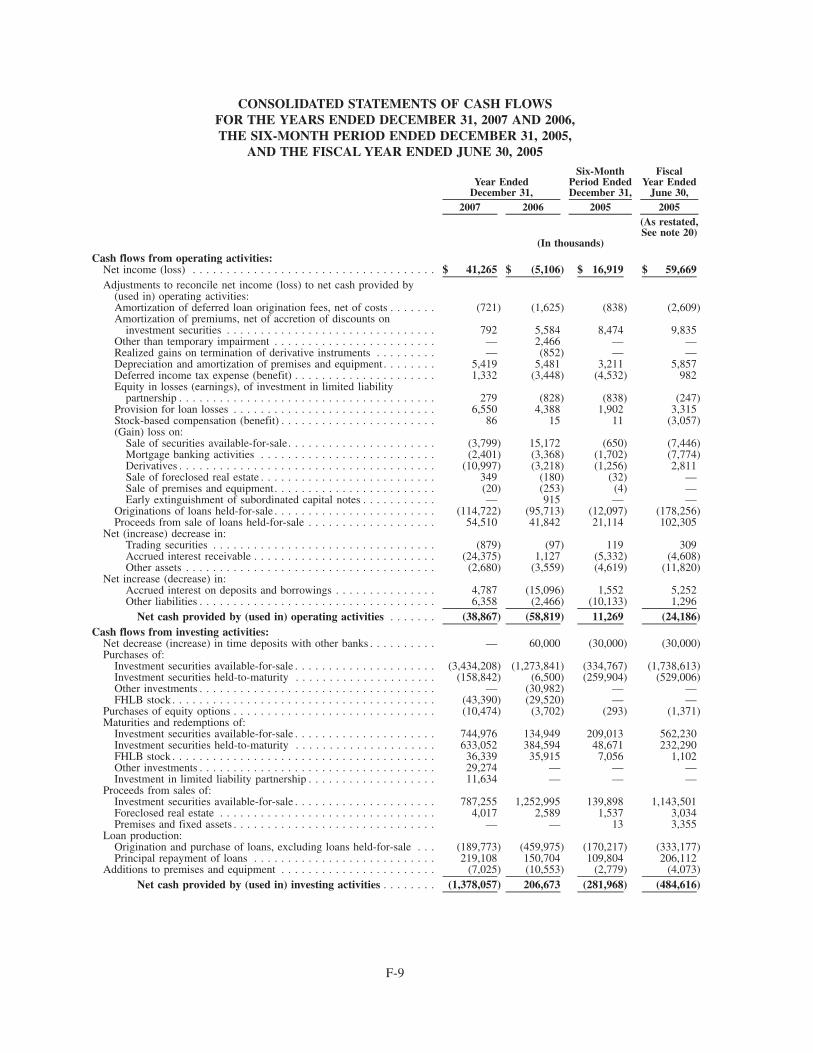
CONSOLIDATED STATEMENTS OF CASH FLOWSFOR THE YEARS ENDED DECEMBER 31, 2007 AND 2006,THE SIX-MONTH PERIOD ENDED DECEMBER 31, 2005,
AND THE FISCAL YEAR ENDED JUNE 30, 2005
2007 2006 2005 2005
Year EndedDecember 31,
Six-MonthPeriod EndedDecember 31,
FiscalYear Ended
June 30,
(As restated,See note 20)
(In thousands)Cash flows from operating activities:
Net income (loss) . . . . . . . . . . . . . . . . . . . . . . . . . . . . . . . . . . . . $ 41,265 $ (5,106) $ 16,919 $ 59,669Adjustments to reconcile net income (loss) to net cash provided by
(used in) operating activities:Amortization of deferred loan origination fees, net of costs . . . . . . . (721) (1,625) (838) (2,609)Amortization of premiums, net of accretion of discounts on
investment securities . . . . . . . . . . . . . . . . . . . . . . . . . . . . . . . 792 5,584 8,474 9,835Other than temporary impairment . . . . . . . . . . . . . . . . . . . . . . . . — 2,466 — —Realized gains on termination of derivative instruments . . . . . . . . . — (852) — —Depreciation and amortization of premises and equipment . . . . . . . . 5,419 5,481 3,211 5,857Deferred income tax expense (benefit) . . . . . . . . . . . . . . . . . . . . . 1,332 (3,448) (4,532) 982Equity in losses (earnings), of investment in limited liability
partnership . . . . . . . . . . . . . . . . . . . . . . . . . . . . . . . . . . . . . . 279 (828) (838) (247)Provision for loan losses . . . . . . . . . . . . . . . . . . . . . . . . . . . . . . 6,550 4,388 1,902 3,315Stock-based compensation (benefit) . . . . . . . . . . . . . . . . . . . . . . . 86 15 11 (3,057)(Gain) loss on:
Sale of securities available-for-sale. . . . . . . . . . . . . . . . . . . . . . (3,799) 15,172 (650) (7,446)Mortgage banking activities . . . . . . . . . . . . . . . . . . . . . . . . . . (2,401) (3,368) (1,702) (7,774)Derivatives . . . . . . . . . . . . . . . . . . . . . . . . . . . . . . . . . . . . . . (10,997) (3,218) (1,256) 2,811Sale of foreclosed real estate . . . . . . . . . . . . . . . . . . . . . . . . . . 349 (180) (32) —Sale of premises and equipment. . . . . . . . . . . . . . . . . . . . . . . . (20) (253) (4) —Early extinguishment of subordinated capital notes . . . . . . . . . . . — 915 — —
Originations of loans held-for-sale . . . . . . . . . . . . . . . . . . . . . . . . (114,722) (95,713) (12,097) (178,256)Proceeds from sale of loans held-for-sale . . . . . . . . . . . . . . . . . . . 54,510 41,842 21,114 102,305
Net (increase) decrease in:Trading securities . . . . . . . . . . . . . . . . . . . . . . . . . . . . . . . . . (879) (97) 119 309Accrued interest receivable . . . . . . . . . . . . . . . . . . . . . . . . . . . (24,375) 1,127 (5,332) (4,608)Other assets . . . . . . . . . . . . . . . . . . . . . . . . . . . . . . . . . . . . . (2,680) (3,559) (4,619) (11,820)
Net increase (decrease) in:Accrued interest on deposits and borrowings . . . . . . . . . . . . . . . 4,787 (15,096) 1,552 5,252Other liabilities . . . . . . . . . . . . . . . . . . . . . . . . . . . . . . . . . . . 6,358 (2,466) (10,133) 1,296
Net cash provided by (used in) operating activities . . . . . . . (38,867) (58,819) 11,269 (24,186)Cash flows from investing activities:
Net decrease (increase) in time deposits with other banks . . . . . . . . . . — 60,000 (30,000) (30,000)Purchases of:
Investment securities available-for-sale . . . . . . . . . . . . . . . . . . . . . (3,434,208) (1,273,841) (334,767) (1,738,613)Investment securities held-to-maturity . . . . . . . . . . . . . . . . . . . . . (158,842) (6,500) (259,904) (529,006)Other investments . . . . . . . . . . . . . . . . . . . . . . . . . . . . . . . . . . . — (30,982) — —FHLB stock . . . . . . . . . . . . . . . . . . . . . . . . . . . . . . . . . . . . . . . (43,390) (29,520) — —
Purchases of equity options . . . . . . . . . . . . . . . . . . . . . . . . . . . . . . (10,474) (3,702) (293) (1,371)Maturities and redemptions of:
Investment securities available-for-sale . . . . . . . . . . . . . . . . . . . . . 744,976 134,949 209,013 562,230Investment securities held-to-maturity . . . . . . . . . . . . . . . . . . . . . 633,052 384,594 48,671 232,290FHLB stock . . . . . . . . . . . . . . . . . . . . . . . . . . . . . . . . . . . . . . . 36,339 35,915 7,056 1,102Other investments . . . . . . . . . . . . . . . . . . . . . . . . . . . . . . . . . . . 29,274 — — —Investment in limited liability partnership . . . . . . . . . . . . . . . . . . . 11,634 — — —
Proceeds from sales of:Investment securities available-for-sale . . . . . . . . . . . . . . . . . . . . . 787,255 1,252,995 139,898 1,143,501Foreclosed real estate . . . . . . . . . . . . . . . . . . . . . . . . . . . . . . . . 4,017 2,589 1,537 3,034Premises and fixed assets . . . . . . . . . . . . . . . . . . . . . . . . . . . . . . — — 13 3,355
Loan production:Origination and purchase of loans, excluding loans held-for-sale . . . (189,773) (459,975) (170,217) (333,177)Principal repayment of loans . . . . . . . . . . . . . . . . . . . . . . . . . . . 219,108 150,704 109,804 206,112
Additions to premises and equipment . . . . . . . . . . . . . . . . . . . . . . . (7,025) (10,553) (2,779) (4,073)Net cash provided by (used in) investing activities . . . . . . . . (1,378,057) 206,673 (281,968) (484,616)
F-9
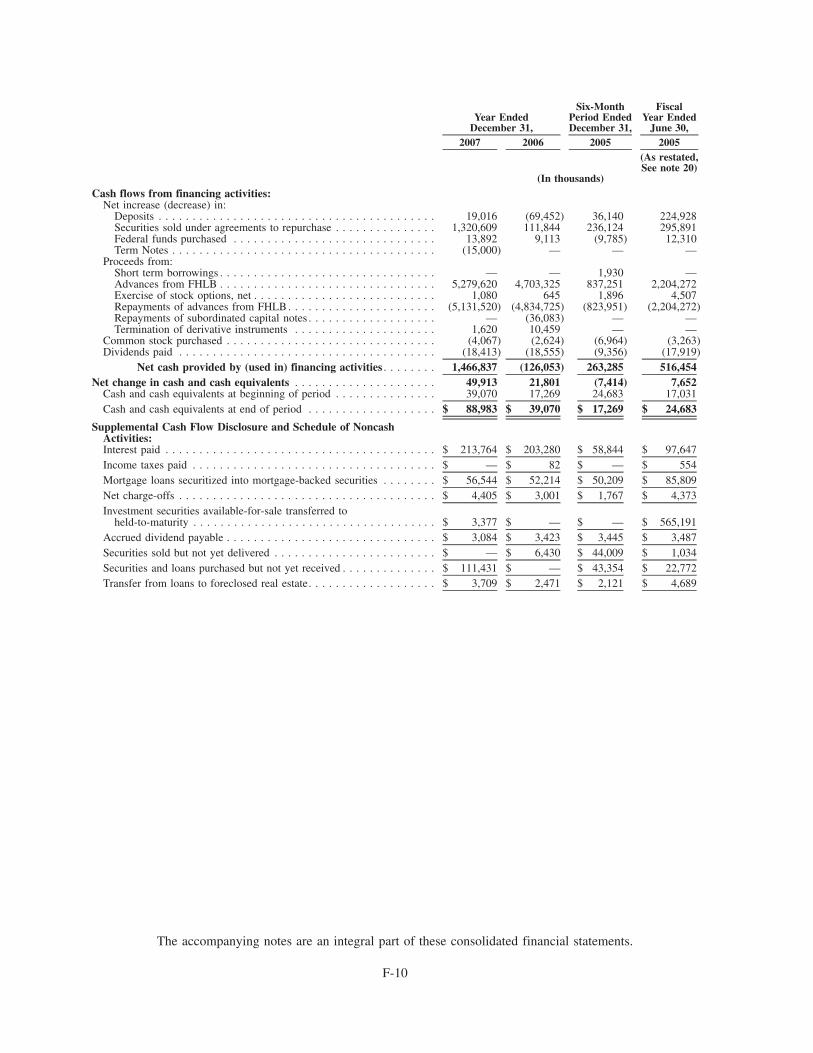
2007 2006 2005 2005
Year EndedDecember 31,
Six-MonthPeriod EndedDecember 31,
FiscalYear Ended
June 30,
(As restated,See note 20)
(In thousands)Cash flows from financing activities:
Net increase (decrease) in:Deposits . . . . . . . . . . . . . . . . . . . . . . . . . . . . . . . . . . . . . . . . . 19,016 (69,452) 36,140 224,928Securities sold under agreements to repurchase . . . . . . . . . . . . . . . 1,320,609 111,844 236,124 295,891Federal funds purchased . . . . . . . . . . . . . . . . . . . . . . . . . . . . . . 13,892 9,113 (9,785) 12,310Term Notes . . . . . . . . . . . . . . . . . . . . . . . . . . . . . . . . . . . . . . . (15,000) — — —
Proceeds from:Short term borrowings . . . . . . . . . . . . . . . . . . . . . . . . . . . . . . . . — — 1,930 —Advances from FHLB . . . . . . . . . . . . . . . . . . . . . . . . . . . . . . . . 5,279,620 4,703,325 837,251 2,204,272Exercise of stock options, net . . . . . . . . . . . . . . . . . . . . . . . . . . . 1,080 645 1,896 4,507Repayments of advances from FHLB . . . . . . . . . . . . . . . . . . . . . . (5,131,520) (4,834,725) (823,951) (2,204,272)Repayments of subordinated capital notes . . . . . . . . . . . . . . . . . . . — (36,083) — —Termination of derivative instruments . . . . . . . . . . . . . . . . . . . . . 1,620 10,459 — —
Common stock purchased . . . . . . . . . . . . . . . . . . . . . . . . . . . . . . . (4,067) (2,624) (6,964) (3,263)Dividends paid . . . . . . . . . . . . . . . . . . . . . . . . . . . . . . . . . . . . . . (18,413) (18,555) (9,356) (17,919)
Net cash provided by (used in) financing activities . . . . . . . . 1,466,837 (126,053) 263,285 516,454Net change in cash and cash equivalents . . . . . . . . . . . . . . . . . . . . . 49,913 21,801 (7,414) 7,652
Cash and cash equivalents at beginning of period . . . . . . . . . . . . . . . 39,070 17,269 24,683 17,031Cash and cash equivalents at end of period . . . . . . . . . . . . . . . . . . . $ 88,983 $ 39,070 $ 17,269 $ 24,683
Supplemental Cash Flow Disclosure and Schedule of NoncashActivities:Interest paid . . . . . . . . . . . . . . . . . . . . . . . . . . . . . . . . . . . . . . . . $ 213,764 $ 203,280 $ 58,844 $ 97,647Income taxes paid . . . . . . . . . . . . . . . . . . . . . . . . . . . . . . . . . . . . $ — $ 82 $ — $ 554Mortgage loans securitized into mortgage-backed securities . . . . . . . . $ 56,544 $ 52,214 $ 50,209 $ 85,809Net charge-offs . . . . . . . . . . . . . . . . . . . . . . . . . . . . . . . . . . . . . . $ 4,405 $ 3,001 $ 1,767 $ 4,373Investment securities available-for-sale transferred to
held-to-maturity . . . . . . . . . . . . . . . . . . . . . . . . . . . . . . . . . . . . $ 3,377 $ — $ — $ 565,191Accrued dividend payable . . . . . . . . . . . . . . . . . . . . . . . . . . . . . . . $ 3,084 $ 3,423 $ 3,445 $ 3,487Securities sold but not yet delivered . . . . . . . . . . . . . . . . . . . . . . . . $ — $ 6,430 $ 44,009 $ 1,034Securities and loans purchased but not yet received . . . . . . . . . . . . . . $ 111,431 $ — $ 43,354 $ 22,772Transfer from loans to foreclosed real estate. . . . . . . . . . . . . . . . . . . $ 3,709 $ 2,471 $ 2,121 $ 4,689
The accompanying notes are an integral part of these consolidated financial statements.
F-10
NOTES TO CONSOLIDATED FINANCIAL STATEMENTSAS OF DECEMBER 31, 2007 AND 2006
AND FOR THE YEARS ENDED DECEMBER 31, 2007 AND 2006,THE SIX-MONTH PERIOD ENDED DECEMBER 31, 2005,
AND THE FISCAL YEAR ENDED JUNE 30, 2005
1. SUMMARY OF SIGNIFICANT ACCOUNTING POLICIES
The accounting and reporting policies of Oriental Financial Group Inc. (the “Group” or “Oriental”) conform toU.S. generally accepted accounting principles (“GAAP”) and to financial services industry practices. The followingis a description of the Group’s most significant accounting policies:
Nature of Operations
Oriental is a publicly-owned financial holding company incorporated under the laws of the Commonwealth ofPuerto Rico. It has four direct subsidiaries, Oriental Bank and Trust (the “Bank”), Oriental Financial Services Corp.(“Oriental Financial Services”), Oriental Insurance, Inc. (“Oriental Insurance”) and Caribbean Pension Consult-ants, Inc., which is located in Boca Raton, Florida. The Group also has two special purpose entities, OrientalFinancial (PR) Statutory Trust I (the “Statutory Trust I”, presently inactive) and Oriental Financial (PR) StatutoryTrust II (the “Statutory Trust II”). Through these subsidiaries and its divisions, the Group provides a wide range offinancial services such as mortgage, commercial and consumer lending, financial planning, insurance sales, moneymanagement and investment banking and brokerage services, as well as corporate and individual trust services.Note 17 to the consolidated financial statements presents further information about the operations of the Group’sbusiness segments.
The main offices for the Group and its subsidiaries are located in San Juan, Puerto Rico. The Group is subject toexamination, regulation and periodic reporting under the U.S. Bank Holding Company Act of 1956, as amended,which is administered by the Board of Governors of the Federal Reserve System.
The Bank operates through 24 financial centers located throughout Puerto Rico and is subject to the supervision,examination and regulation of the Office of the Commissioner of Financial Institutions of Puerto Rico (“OCFI”) andthe Federal Deposit Insurance Corporation (“FDIC”). The Bank offers banking services such as commercial andconsumer lending, saving and time deposit products, financial planning, and corporate and individual trust services,and capitalizes on its commercial banking network to provide mortgage lending products to its clients, which it alsoprovides through its wholly-owned mortgage lending subsidiary, Oriental Mortgage Corporation. The Bank alsooperates an IBE pursuant to the IBE Act, Oriental International Bank Inc., which is a wholly-owned subsidiary ofthe Bank. The IBE subsidiary offers the Bank certain Puerto Rico tax advantages and its services are limited underPuerto Rico law to persons and assets/liabilities located outside of Puerto Rico. Another IBE, which operated as adivision of the Bank, was liquidated on May 31, 2007, after obtaining the required regulatory approvals.
Oriental Financial Services is subject to the supervision, examination and regulation of the Financial IndustryRegulatory Authority (“FINRA”), the Securities and Exchange Commission (“SEC”), and the OCFI. OrientalInsurance is subject to the supervision, examination and regulation of the Office of the Commissioner of Insuranceof Puerto Rico.
Use of Estimates in the Preparation of Financial Statements
The preparation of financial statements in conformity with GAAP requires management to make certain estimatesand assumptions that affect the reported amounts of assets and liabilities and disclosure of contingent assets andliabilities as of the date of the consolidated financial statements and the reported amount of revenues and expensesduring the reporting period. Actual results could differ from those estimates. Material estimates that are particularlysusceptible to significant change in the near term relate mainly to the determination of the allowance for loan losses,the valuation of derivative instruments, and the determination of income taxes.
F-11
Fiscal Year
On August 30, 2005, the Group’s Board of Directors amended Section 1 of Article IX of the Group’s Bylaws tochange its fiscal year to a calendar year. The fiscal year was from July 1 of each year to June 30 of the following year.Data presented on the accompanying consolidated financial statements includes balance sheet data as ofDecember 31, 2007 and 2006, and operations data for the years ended December 31, 2007 and 2006, the six-monthperiod ended December 31, 2005 and the fiscal year ended June 30, 2005. Please refer to Note 19 of theaccompanying consolidated financial statements for comparative information.
Principles of Consolidation
The accompanying consolidated financial statements include the accounts of the Group and its wholly-ownedsubsidiaries. All significant intercompany transactions and balances have been eliminated in consolidation. Thespecial purpose entities are exempt from the consolidation requirements, under the provisions of FinancialAccounting Standards Board (“FASB”) Interpretation No. 46 (Revised), “Consolidation of Variable InterestEntities, an Interpretation of ARB No. 51.”
Cash Equivalents
The Group considers as cash equivalents all money market instruments that are not pledged and that have maturitiesof three months or less at the date of acquisition.
Earnings per Common Share
Basic earnings per share is calculated by dividing income available to common shareholders (net income reduced bydividends on preferred stock) by the weighted average of outstanding common shares. Diluted earnings per share issimilar to the computation of basic earnings per share except that the weighted average of common shares isincreased to include the number of additional common shares that would have been outstanding if the dilutivepotential common shares (options) had been issued, assuming that proceeds from exercise are used to repurchaseshares in the market (treasury stock method). Any stock splits and dividends are retroactively recognized in allperiods presented in the consolidated financial statements.
Securities Purchased/Sold Under Agreements to Resell/Repurchase
The Group purchases securities under agreements to resell the same or similar securities. Amounts advanced underthese agreements represent short-term loans and are reflected as assets in the consolidated statements of financialcondition. It is the Group’s policy to take possession of securities purchased under resale agreements while thecounterparty retains effective control over the securities. The Group monitors the fair value of the underlyingsecurities as compared to the related receivable, including accrued interest, and requests additional collateral whendeemed appropriate. The Group also sells securities under agreements to repurchase the same or similar securities.The Group retains effective control over the securities sold under these agreements; accordingly, such agreementsare treated as financing arrangements, and the obligations to repurchase the securities sold are reflected asliabilities. The securities underlying the financing agreements remain included in the asset accounts. Thecounterparty to repurchase agreements generally has the right to repledge the securities received as collateral.
Investment Securities
Securities are classified as held-to-maturity, available-for-sale or trading. Securities for which the Group has theintent and ability to hold to maturity are classified as held-to-maturity and are carried at amortized cost. Securitiesthat might be sold prior to maturity because of interest rate changes, to meet liquidity needs, or to better match therepricing characteristics of funding sources are classified as available-for-sale. These securities are reported at fairvalue, with unrealized gains and losses excluded from earnings and reported net of tax in other comprehensiveincome.
F-12
NOTES TO CONSOLIDATED FINANCIAL STATEMENTS — (Continued)
The Group classifies as trading those securities that are acquired and held principally for the purpose of selling themin the near future. These securities are carried at fair value with realized and unrealized changes in fair valueincluded in earnings in the period in which the changes occur.
The Group’s investment in the Federal Home Loan Bank (FHLB) of New York stock has no readily determinablefair value and can only be sold back to the FHLB at cost. Therefore, the carrying value represents its fair value.
Premiums and discounts are amortized to interest income over the life of the related securities using the interestmethod. Net realized gains or losses on sales of investment securities available-for-sale, and unrealized lossvaluation adjustments considered other than temporary, if any, on securities classified as either available-for-sale orheld-to-maturity are reported separately in the statements of operations. The cost of securities sold is determined onthe specific identification method.
Impairment of Investment Securities
The Group evaluates its securities available-for-sale and held-to-maturity for impairment. An impairment charge inthe consolidated statements of operations is recognized when the decline in the fair value of investments below theircost basis is judged to be other-than-temporary. The Group considers various factors in determining whether itshould recognize an impairment charge, including, but not limited to the length of time and extent to which the fairvalue has been less than its cost basis, and the Group’s intent and ability to hold the investment for a period of timesufficient to allow for any anticipated recovery in fair value. For debt securities, the Group also considers, amongother factors, the debtors repayment ability on its bond obligations and its cash and capital generation ability. For theyear ended December 31, 2006, the Group charged to operations approximately $2.5 million on available-for-salesecurities with other than temporary impairments. No such charges were recorded during 2007 or for periods priorto 2006 presented in these financial statements.
Derivative Financial Instruments
As part of the Group’s asset and liability management, the Group may use option agreements and interest ratecontracts, which include interest rate swaps to hedge various exposures or to modify interest rate characteristics ofvarious statement of financial condition accounts.
The Group follows Statement of Financial Accounting Standards (“SFAS”) No. 133, “Accounting for DerivativeInstruments and Hedging Activities,” as amended (refer to Note 9), which establishes accounting and reportingstandards for derivative instruments, including certain derivative instruments embedded in other contracts, and forhedging activities. The statement requires that all derivative instruments be recognized as assets and liabilities atfair value. If certain conditions are met, the derivative may qualify for hedge accounting treatment and bedesignated as one of the following types of hedges: (a) hedge of the exposure to changes in the fair value of arecognized asset or liability or an unrecognized firm commitment (“fair value hedge”); (b) a hedge of the exposureto variability of cash flows of a recognized asset, liability or forecasted transaction (“cash flow hedge”) or (c) ahedge of foreign currency exposure (“foreign currency hedge”).
In the case of a qualifying fair value hedge, changes in the value of the derivative instruments that have been highlyeffective are recognized in current period earnings along with the change in value of the designated hedged item. Inthe case of a qualifying cash flow hedge, changes in the value of the derivative instruments that have been highlyeffective are recognized in other comprehensive income, until such time as those earnings are affected by thevariability of the cash flows of the underlying hedged item. In either a fair value hedge or a cash flow hedge, netearnings may be impacted to the extent the changes in the fair value of the derivative instruments do not perfectlyoffset changes in the fair value or cash flows of the hedged items. If the derivative is not designated as a hedginginstrument, the changes in fair value of the derivative are recorded in earnings.
Certain contracts contain embedded derivatives. When the embedded derivative possesses economic character-istics that are not clearly and closely related to the economic characteristics of the host contract, it is bifurcated andcarried at fair value.
F-13
NOTES TO CONSOLIDATED FINANCIAL STATEMENTS — (Continued)
The Group uses several pricing models that consider current fair value and contractual prices for the underlyingfinancial instruments as well as time value and yield curve or volatility factors underlying the positions to derive thefair value of certain derivatives contracts.
Off-Balance Sheet Instruments
In the ordinary course of business, the Group enters into off-balance sheet instruments consisting of commitments toextend credit and commitments under credit card arrangements, further discussed in Note 14 to the consolidatedfinancial statements. Such financial instruments are recorded in the financial statements when they are funded orrelated fees are incurred or received. The Group periodically evaluates the credit risks inherent in these commit-ments, and establishes allowances for such risks if and when these are deemed necessary.
Mortgage Banking Activities and Loans Held-For-Sale
The residential mortgage loans reported as held-for-sale are stated at the lower-of-cost-or-market, cost beingdetermined on the outstanding loan balance less unearned income, and fair value determined in the aggregate. Netunrealized losses are recognized through a valuation allowance by charges to income. Realized gains or losses onthese loans are determined using the specific identification method. Loans held-for-sale include all conformingmortgage loans originated and purchased, which from time to time the Group sells to other financial institutions orsecuritizes conforming mortgage loans into Government National Mortgage Association (GNMA), FederalNational Mortgage Association (FNMA) and Federal Home Loan Mortgage Corporation (FHLMC) pass-throughcertificates.
Prior to December 31, 2005, servicing rights on mortgage loans originated and held by the Group were sold toanother financial institution. Upon their sale, a portion of the accounting basis of the mortgage loansheld-for-investment was allocated to the mortgage servicing rights (“MSRs”) based upon the relative fair valuesof the mortgage loans and the MSRs, which results in a discount to the mortgage loans held for investment. Thatdiscount is accreted using the interest method as an adjustment to yield on the mortgage loans over the estimated lifeof the related loans. When related loans are sold or collected any unamortized discount is recognized as income. In2006, the Group entered into a sub-servicing agreement with a local institution to service GNMA, FNMA andFHLMC pools that it issues and its mortgage loan portfolio at a fixed annual cost per loan.
Accounting for Transfers and Servicing of Financial Assets and Extinguishment of Liabilities
The Group recognizes the financial and servicing assets it controls and the liabilities it has incurred, derecognizesfinancial assets when control has been surrendered, and derecognizes liabilities when extinguished.
The Group is not engaged in sales of mortgage loans and mortgage-backed securities subject to recourse provisionsexcept for those provisions that allow for the repurchase of loans as a result of a breach of certain representationsand warranties other than those related to the credit quality of the loans included in the sale transactions.
According to SFAS 140 “Accounting for Transfers and Servicing of Financial Assets and Extinguishments ofLiabilities” (“SFAS 140”), a transfer of financial assets (all or a portion of the financial asset) in which the Groupsurrenders control over these financial assets shall be accounted for as a sale to the extent that consideration, otherthan beneficial interests in the transferred assets, is received in exchange. The Group has surrendered control overtransferred assets if and only if all of the following conditions are met:
a. The transferred assets have been isolated from the Group — put presumptively beyond the reach of theGroup and its creditors even in bankruptcy or other receivership.
b. Each transferee has the right to pledge or exchange the assets it received and no condition both constrainsthe transferee from taking advantage of its rights to pledge or exchange and provided more than a trivialbenefit to the Group.
F-14
NOTES TO CONSOLIDATED FINANCIAL STATEMENTS — (Continued)
c. The Group does not maintain effective control over the transferred assets through either (1) an agreementthat both entitles and obligates the Group to repurchase or redeem them before their maturity or (2) theability to unilaterally cause the holder to return specific assets other than through a cleanup call.
If a transfer of financial assets in exchange for cash or other consideration (other than beneficial interests in thetransferred assets) does not meet the criteria for a sale as described above, the Group would account for the transferas a secured borrowing.
Servicing assets
The Group periodically sells or securitizes loans while retaining the obligation to perform the servicing of suchloans. In addition, the Group may purchase or assume the right to service loans originated by others. Whenever theGroup undertakes an obligation to service a loan, management assesses whether a servicing asset and/or liabilityshould be recognized. A servicing asset is recognized whenever the compensation for servicing is expected to morethan adequately compensate the servicer for performing the servicing. Likewise, a servicing liability would berecognized in the event that servicing fees to be received are not expected to adequately compensate the Group forits expected cost. Servicing assets are presented on as other assets in the consolidated statements of condition.
Upon adoption of SFAS No. 156 “Accounting for Servicing of Financial Assets — an Amendment of FASBStatements No. 133 and 140” in January 2007, all separately recognized servicing assets are initially recognized atfair value. For subsequent measurement of servicing rights, the Group has elected the amortization method withperiodic testing for impairment. Under the amortization method, servicing assets are amortized in proportion to, andover the period of, estimated servicing income and assessed for impairment based on fair value at each reportingperiod. Contractual servicing fees, as well as fair value adjustments, and impairment losses, if any, are reported inbanking service revenues in the consolidated statements of operations. Loan servicing fees, which are based on apercentage of the principal balances of the loans serviced, are credited to income as loan payments are collected.
The fair value of servicing rights is estimated by using a cash flow valuation model which calculates the presentvalue of estimated future net servicing cash flows, taking into consideration actual and expected loan prepaymentrates, discount rates, servicing costs, and other economic factors, which are determined based on current marketconditions. For purposes of evaluating and measuring impairment of capitalized servicing assets that are accountedunder the amortization method, the amount of impairment recognized, if any, is the amount by which the capitalizedservicing assets per stratum exceed their estimated fair value.
Prior to 2006, the total cost of loans to be sold with servicing assets retained was allocated to the servicing assets andthe loans (without servicing assets), based on their relative fair values. Servicing assets were amortized inproportion to, and over the period of, estimated net servicing income.
Loans and Allowance for Loan Losses
Loans that management has the intent and ability to hold for the foreseeable future or until maturity or pay-off arereported at their outstanding unpaid principal balances adjusted for charge-offs, the allowance for loan losses,unamortized discount related to MSR sold and any deferred fees or costs on originated loans. Interest income isaccrued on the unpaid principal balance. Loan origination fees and costs and premiums and discounts on loanspurchased are deferred and amortized over the estimated life of the loans as an adjustment of their yield throughinterest income using a method that approximates the interest method.
Interest recognition is discontinued when loans are 90 days or more in arrears on principal and/or interest based oncontractual terms, except for collateralized residential mortgage loans for which recognition is discontinued whenthey become 365 days or more past due based on contractual terms and are then written down, if necessary, based onthe specific evaluation of the collateral underlying the loan. Loans for which the recognition of interest income hasbeen discontinued are designated as non-accruing. Collections are accounted for on the cash method thereafter, untilqualifying to return to accrual status. Such loans are not reinstated to accrual status until interest is received on acurrent basis and other factors indicative of doubtful collection cease to exist.
F-15
NOTES TO CONSOLIDATED FINANCIAL STATEMENTS — (Continued)
The Group follows a systematic methodology to establish and evaluate the adequacy of the allowance for loan lossesto provide for inherent losses in the loan portfolio. This methodology includes the consideration of factors such aseconomic conditions, portfolio risk characteristics, prior loss experience, and results of periodic credit reviews ofindividual loans. The provision for loan losses charged to current operations is based on such methodology. Loanlosses are charged and recoveries are credited to the allowance for loan losses.
Larger commercial loans that exhibit potential or observed credit weaknesses are subject to individual review andgrading. Where appropriate, allowances are allocated to individual loans based on management’s estimate of theborrower’s ability to repay the loan given the availability of collateral, other sources of cash flow and legal optionsavailable to the Group.
Included in the review of individual loans are those that are impaired, as provided in SFAS No. 114, “Accounting byCreditors for Impairment of a Loan.” A loan is considered impaired when, based on current information and events,it is probable that the Group will be unable to collect the scheduled payments of principal or interest when dueaccording to the contractual terms of the loan agreement. Impaired loans are measured based on the present value ofexpected future cash flows discounted at the loan’s effective interest rate, or as a practical expedient, at theobservable market price of the loan or the fair value of the collateral, if the loan is collateral dependent. Loans areindividually evaluated for impairment, except large groups of small balance homogeneous loans that are collec-tively evaluated for impairment under the provisions of SFAS No. 5, “Accounting for Contingencies”, as amended,and loans that are recorded at fair value or at the lower of cost or market. The Group measures for impairment allcommercial loans over $250,000 and over 90-days past due. The portfolios of mortgages and consumer loans areconsidered homogeneous, and are evaluated collectively for impairment.
The Group, using a rating system, applies an overall allowance percentage to each loan portfolio category based onhistorical credit losses adjusted for current conditions and trends. This delinquency-based calculation is the startingpoint for management’s systematic determination of the required level of the allowance for loan losses. Other dataconsidered in this determination includes: the overall historical loss trends and other information includingunderwriting standards and economic trends.
Loan loss ratios and credit risk categories are updated quarterly and are applied in the context of GAAP and theimportance of depository institutions having prudent, conservative, but not excessive loan allowances that fallwithin an acceptable range of estimated losses. While management uses current available information in estimatingprobable loan losses, factors beyond the Group’s control, such as factors affecting general economic conditions mayrequire future changes to the allowance.
Premises and Equipment
Premises and equipment are carried at cost less accumulated depreciation. Depreciation is provided using thestraight-line method over the estimated useful life of each type of asset. Amortization of leasehold improvements iscomputed using the straight-line method over the terms of the leases or estimated useful lives of the improvements,whichever is shorter.
Long-lived assets and identifiable intangibles, except for financial instruments, are reviewed for impairmentwhenever events or changes in circumstances indicate that the carrying amount of an asset may not be recoverable.In performing the review for recoverability, an estimate is made of the future cash flows expected to result from theuse of the asset and its eventual disposition. If the sum of the expected future cash flows (undiscounted and withoutinterest charges) is less than the carrying amount of the asset, an impairment loss is recognized if the fair value isless than the carrying amount of the related asset. Otherwise, an impairment loss is not recognized. There were nosuch impairment losses in periods presented in the accompanying consolidated financial statements.
Foreclosed Real Estate
Foreclosed real estate is initially recorded at the lower of the related loan balance or the fair value of the real estate atthe date of foreclosure. At the time properties are acquired in full or partial satisfaction of loans, any excess of the
F-16
NOTES TO CONSOLIDATED FINANCIAL STATEMENTS — (Continued)
loan balance over the estimated fair value of the property is charged against the allowance for loan losses. Afterforeclosure, these properties are carried at the lower of cost or fair value less estimated costs to sell based on recentappraised values or options to purchase the foreclosed property. Any excess of the carrying value over the estimatedfair value, less estimated costs to sell, is charged to operations. The costs and expenses associated to holding theseproperties in portfolio are expensed as incurred.
Income Taxes
In preparing the consolidated financial statements, the Group is required to estimate income taxes. This involves anestimate of current income tax expense together with an assessment of temporary differences resulting fromdifferences between the carrying amounts of assets and liabilities for financial reporting purposes and the amountsused for income tax purposes. The determination of current income tax expense involves estimates and assumptionsthat require the Group to assume certain positions based on its interpretation of current tax regulations. Changes inassumptions affecting estimates may be required in the future and estimated tax assets or liabilities may need to beincreased or decreased accordingly. The accrual for tax contingencies is adjusted in light of changing facts andcircumstances, such as the progress of tax audits, case law and emerging legislation. When particular matters arise,a number of years may elapse before such matters are audited and finally resolved. Favorable resolution of suchmatters could be recognized as a reduction to the Group’s effective rate in the year of resolution. Unfavorablesettlement of any particular issue could increase the effective rate and may require the use of cash in the year ofresolution.
The determination of deferred tax expense or benefit is based on changes in the carrying amounts of assets andliabilities that generate temporary differences. The carrying value of the Group’s net deferred tax assets assumesthat the Group will be able to generate sufficient future taxable income based on estimates and assumptions. If theseestimates and related assumptions change in the future, the Group may be required to record valuation allowancesagainst its deferred tax assets resulting in additional income tax expense in the consolidated statements ofoperations.
Management evaluates the realizability of the deferred tax assets on a regular basis and assesses the need for avaluation allowance. A valuation allowance is established when management believes that it is more likely than notthat some portion of its deferred tax assets will not be realized. Changes in valuation allowance from period toperiod are included in the Group’s tax provision in the period of change.
In addition to valuation allowances, the Group establishes accruals for certain tax contingencies when, despite thebelief that Group’s tax return positions are fully supported, the Group believes that certain positions are likely to bechallenged. The tax contingency accruals are adjusted in light of changing facts and circumstances, such as theprogress of tax audits, case law and emerging legislation. The Group’s tax contingency accruals are reflected asincome tax payable as a component of accrued expenses and other liabilities.
Effective at the beginning of the first quarter of 2007, the Group adopted the provisions of Financial AccountingStandard Board (“FASB”) Interpretation No. 48 (“FIN 48”), “Accounting for Uncertainty in Income Taxes — aninterpretation of FASB Statement No. 109.” FIN 48 contains a two-step approach to recognizing and measuringuncertain tax positions accounted for in accordance with SFAS No. 109, “Accounting for Income Taxes.” The firststep is to evaluate the tax position for recognition by determining if the weight of available evidence indicates that itis more likely than not that the position will be sustained on audit, including resolution of related appeals orlitigation processes, if any. The second step is to measure the tax benefit as the largest amount that is more than 50%likely of being realized upon ultimate settlement. The Group’s policy to include interest and penalties related tounrecognized tax benefits within the provision for taxes on the consolidated statements of operations did not changeas a result of implementing the provisions of FIN 48. No adjustments resulted from the implementation of FIN 48.
Equity-Based Compensation Plans
On April 25, 2007, the Board of Directors (the “Board”) formally adopted the Oriental Financial Group Inc. 2007Omnibus Performance Incentive Plan (the “Omnibus Plan”), which was subsequently approved at the annual
F-17
NOTES TO CONSOLIDATED FINANCIAL STATEMENTS — (Continued)
meeting of stockholders held on June 27, 2007. The Omnibus Plan provides for equity-based compensationincentives through the grant of stock options, stock appreciation rights, restricted stock, restricted stock units anddividend equivalents, as well as equity-based performance awards.
The purpose of the Omnibus Plan is to provide flexibility to the Group to attract, retain and motivate directors,officers, and key employees through the grant of awards based on performance and to adjust its compensationpractices to the best compensation practice and corporate governance trends as they develop from time to time. TheOmnibus Plan is further intended to motivate high levels of individual performance coupled with increasedshareholder returns. Therefore, awards under the Omnibus Plan (each, an “Award”) are intended to be based uponthe recipient’s individual performance, level of responsibility and potential to make significant contributions to theGroup. Generally, the Omnibus Plan will terminate as of (a) the date when no more of the Group’s shares ofcommon stock are available for issuance under the Omnibus Plan, or, if earlier, (b) the date the Omnibus Plan isterminated by the Group’s Board.
The Compensation Committee of the Group’s Board, or such other committee as the Board may designate (the“Committee”), has full authority to interpret and administer the Omnibus Plan in order to carry out its provisionsand purposes. The Committee has the authority to determine those persons eligible to receive an Award and toestablish the terms and conditions of any Award. The Committee may delegate, subject to such terms or conditionsor guidelines as it shall determine, to any employee or group of employees any portion of its authority and powersunder the Omnibus Plan with respect to participants who are not directors or executive officers subject to thereporting requirements under Section 16(a) of the Securities Exchange Act of 1934. Only the Committee mayexercise authority in respect of Awards granted to such participants.
The Omnibus Plan replaced and superseded the Oriental Financial Group Inc. 1996, 1998 and 2000 Incentive StockOption Plans (the “Stock Option Plans”). All outstanding stock options under the Stock Option Plans continue infull force and effect, subject to their original terms and conditions.
Effective July 1, 2005, the Group adopted SFAS No. 123R “Share-Based Payment” (“SFAS 123R”), an amendmentof SFAS No. 123 “Accounting for Stock-Based Compensation” using the modified prospective transition method.SFAS 123R requires measurement of the cost of employee services received in exchange for an award of equityinstruments based on the grant-date fair value of the award with the cost to be recognized over the service period.SFAS No. 123R applies to all awards unvested and granted after this effective date and awards modified,repurchased, or cancelled after that date.
F-18
NOTES TO CONSOLIDATED FINANCIAL STATEMENTS — (Continued)
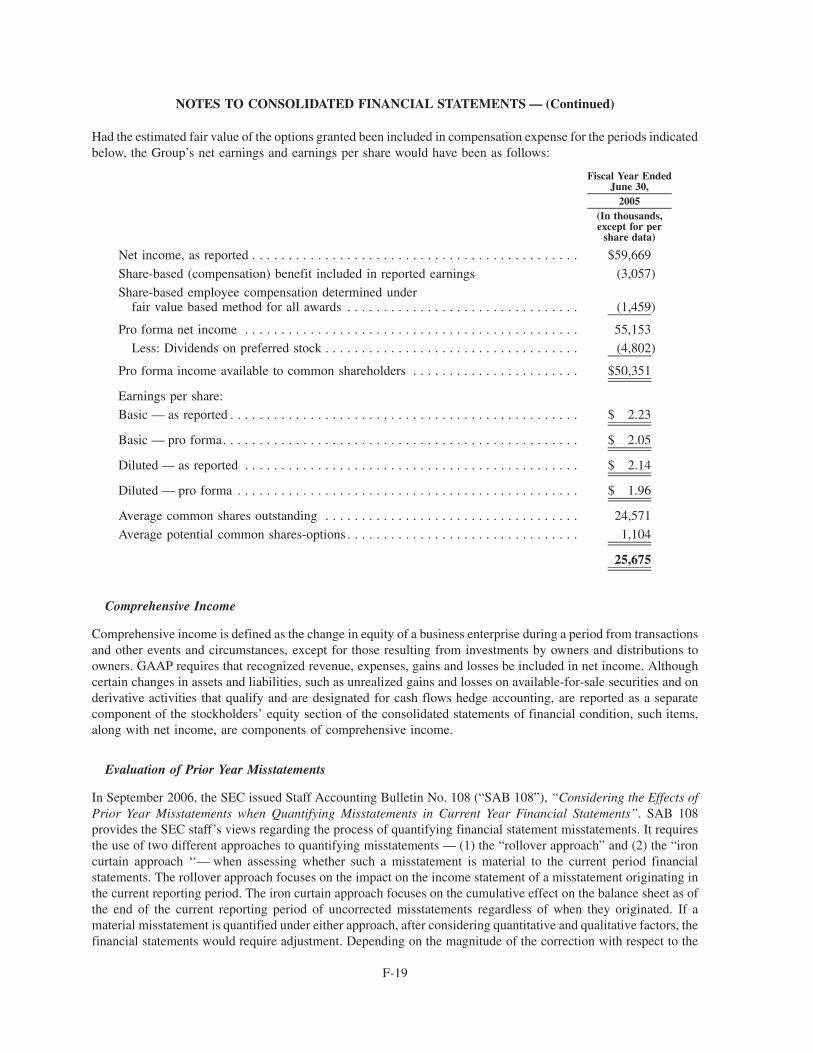
Had the estimated fair value of the options granted been included in compensation expense for the periods indicatedbelow, the Group’s net earnings and earnings per share would have been as follows:
2005
Fiscal Year EndedJune 30,
(In thousands,except for per
share data)
Net income, as reported . . . . . . . . . . . . . . . . . . . . . . . . . . . . . . . . . . . . . . . . . . . . . $59,669
Share-based (compensation) benefit included in reported earnings (3,057)
Share-based employee compensation determined underfair value based method for all awards . . . . . . . . . . . . . . . . . . . . . . . . . . . . . . . . (1,459)
Pro forma net income . . . . . . . . . . . . . . . . . . . . . . . . . . . . . . . . . . . . . . . . . . . . . . 55,153
Less: Dividends on preferred stock . . . . . . . . . . . . . . . . . . . . . . . . . . . . . . . . . . . (4,802)
Pro forma income available to common shareholders . . . . . . . . . . . . . . . . . . . . . . . $50,351
Earnings per share:Basic — as reported . . . . . . . . . . . . . . . . . . . . . . . . . . . . . . . . . . . . . . . . . . . . . . . . $ 2.23
Basic — pro forma. . . . . . . . . . . . . . . . . . . . . . . . . . . . . . . . . . . . . . . . . . . . . . . . . $ 2.05
Diluted — as reported . . . . . . . . . . . . . . . . . . . . . . . . . . . . . . . . . . . . . . . . . . . . . . $ 2.14
Diluted — pro forma . . . . . . . . . . . . . . . . . . . . . . . . . . . . . . . . . . . . . . . . . . . . . . . $ 1.96
Average common shares outstanding . . . . . . . . . . . . . . . . . . . . . . . . . . . . . . . . . . . 24,571
Average potential common shares-options . . . . . . . . . . . . . . . . . . . . . . . . . . . . . . . . 1,104
25,675
Comprehensive Income
Comprehensive income is defined as the change in equity of a business enterprise during a period from transactionsand other events and circumstances, except for those resulting from investments by owners and distributions toowners. GAAP requires that recognized revenue, expenses, gains and losses be included in net income. Althoughcertain changes in assets and liabilities, such as unrealized gains and losses on available-for-sale securities and onderivative activities that qualify and are designated for cash flows hedge accounting, are reported as a separatecomponent of the stockholders’ equity section of the consolidated statements of financial condition, such items,along with net income, are components of comprehensive income.
Evaluation of Prior Year Misstatements
In September 2006, the SEC issued Staff Accounting Bulletin No. 108 (“SAB 108”), “Considering the Effects ofPrior Year Misstatements when Quantifying Misstatements in Current Year Financial Statements”. SAB 108provides the SEC staff’s views regarding the process of quantifying financial statement misstatements. It requiresthe use of two different approaches to quantifying misstatements — (1) the “rollover approach” and (2) the “ironcurtain approach ‘‘— when assessing whether such a misstatement is material to the current period financialstatements. The rollover approach focuses on the impact on the income statement of a misstatement originating inthe current reporting period. The iron curtain approach focuses on the cumulative effect on the balance sheet as ofthe end of the current reporting period of uncorrected misstatements regardless of when they originated. If amaterial misstatement is quantified under either approach, after considering quantitative and qualitative factors, thefinancial statements would require adjustment. Depending on the magnitude of the correction with respect to the
F-19
NOTES TO CONSOLIDATED FINANCIAL STATEMENTS — (Continued)
current period financial statements, changes to financial statements for prior periods could result. SAB 108 waseffective for the Group on January 1, 2006.
The Group had three unrecorded accounting adjustments that were considered in the SAB 108 analysis. The Grouphistorically deferred commissions to certain employees as part of the Bank’s deposit-gathering campaigns, insteadof charging compensation expenses in the year paid. The balance of deferred commission as of January 1, 2006, was$719,000 and was corrected as of January 1, 2006, as a credit to cumulative retained earnings at that date.
The second accounting adjustment was the reversal of a prior year over-accrual of income taxes. As of December 31,2005, utilizing the rollover method to evaluate differences, the Group decided not to correct $589,000 of excessincome taxes provision. Such difference was corrected as of January 1, 2006, against cumulative retained earningsat that date.
The third accounting adjustment was the Group’s method of recognizing interest on a structured note carried asheld-to-maturity investment. The structured note pays interest depending on whether LIBOR is within a range ornot. In the past, the Group had recorded interest on such note on a cash basis instead of using the retrospectiveinterest method required by Financial Accounting Standards Board Emerging Issues Task Force Abstracts IssueNo. 96-12, “Recognition of Interest Income and Balance Sheet Classification of Structured Notes”. As a result ofthe adoption of SAB 108, approximately $1.4 million of interest previously recognized on a cash basis in priorperiods was reversed and recorded as interest income for 2006.
After considering all of the quantitative and qualitative factors, the Group determined that these accountingadjustments had not previously been material to prior periods when measured using the rollover method. Given thatthe effect of correcting these misstatements during 2006 would be material to the Group’s 2006 consolidatedfinancial statements using this dual method, the Group concluded that the cumulative effect adjustment method ofinitially applying the guidance in SAB 108 was appropriate, and adjusted $1.525 million as a cumulative effect onthe beginning retained earnings on the 2006 Consolidated Statements of Changes in Stockholder’s Equity.
Commitments and Contingencies
Liabilities for loss contingencies, arising from claims, assessments, litigation, fines, and penalties and other sourcesare recorded when it is probable that a liability has been incurred and the amount of the assessment can bereasonably estimated. Legal costs incurred in connection with loss contingencies are expensed as incurred.
Reclassifications
Certain amounts in prior years have been reclassified to conform to the presentation adopted in the current year.
New Accounting Pronouncements
SFAS No. 157, “Fair Value Measurements”
In September 2006, FASB issued SFAS No. 157, “Fair Value Measurements”, which defines fair value, establishesa framework for measuring fair value in GAAP, and expands disclosures about fair value measurements. ThisStatement applies under other accounting pronouncements that require or permit fair value measurements, theBoard having previously concluded in those accounting pronouncements that fair value is the relevant measurementattribute. Accordingly, this Statement does not require any new fair value measurements. The changes to currentpractice resulting from the application of this Statement relate to the definition of fair value, the methods used tomeasure fair value, and the expanded disclosures about fair value measurements.
This Statement is effective for financial statements issued for fiscal years beginning after November 15, 2007, andinterim periods within those fiscal years. Earlier application was encouraged, provided that the reporting entity hadnot yet issued financial statements for that fiscal year, including financial statements for an interim period withinthat fiscal year. The Group adopted the provisions of SFAS No. 157 commencing in the first quarter of 2008. Such
F-20
NOTES TO CONSOLIDATED FINANCIAL STATEMENTS — (Continued)
provisions are to be applied prospectively. The Group is currently assessing the impact of SFAS No. 157 on itsconsolidated financial statements, including disclosures.
SFAS No. 159, “The Fair Value Option for Financial Assets and Financial Liabilities, including an amend-ment of FASB Statement No. 115”
On February 15, 2007, FASB issued SFAS No. 159, “The Fair Value Option for Financial assets and FinancialLiabilities, Including an amendment of FASB Statement No. 115”. SFAS No. 159 provides an alternativemeasurement treatment for certain financial assets and financial liabilities, under an instrument-by-instrumentelection, that permits fair value to be used for both initial and subsequent measurement, with changes in fair valuerecognized in earnings. While SFAS No. 159 is effective for the Group beginning January 1, 2008, earlier adoptionis permitted as of January 1, 2007, provided that the entity also adopts all of the requirements of SFAS No. 157. TheGroup adopted the provisions of SFAS No. 159 in January 2008, but decided not to apply the fair value option forany of its financial assets and liabilities, other than those required by SFAS 115.
SFAS No. 141R, “Business Combinations”
In December 2007, the FASB issued SFAS No. 141R, “Business Combinations.” SFAS No. 141R will significantlychange the accounting for business combinations. Under SFAS No. 141R, an acquiring entity will be required torecognize all the assets acquired and liabilities assumed in a transaction at the acquisition-date fair value withlimited exceptions. The statement will also require all acquisition-related costs to be expensed as they are incurred.SFAS No. 141R is required to be applied to business combinations for which the acquisition date is on or after thebeginning of the first annual reporting period beginning on or after December 15, 2008, with earlier adoption beingprohibited
The Group is currently evaluating the effect, if any, of the adoption of SFAS 141R on its consolidated financialstatements, including disclosures.
F-21
NOTES TO CONSOLIDATED FINANCIAL STATEMENTS — (Continued)
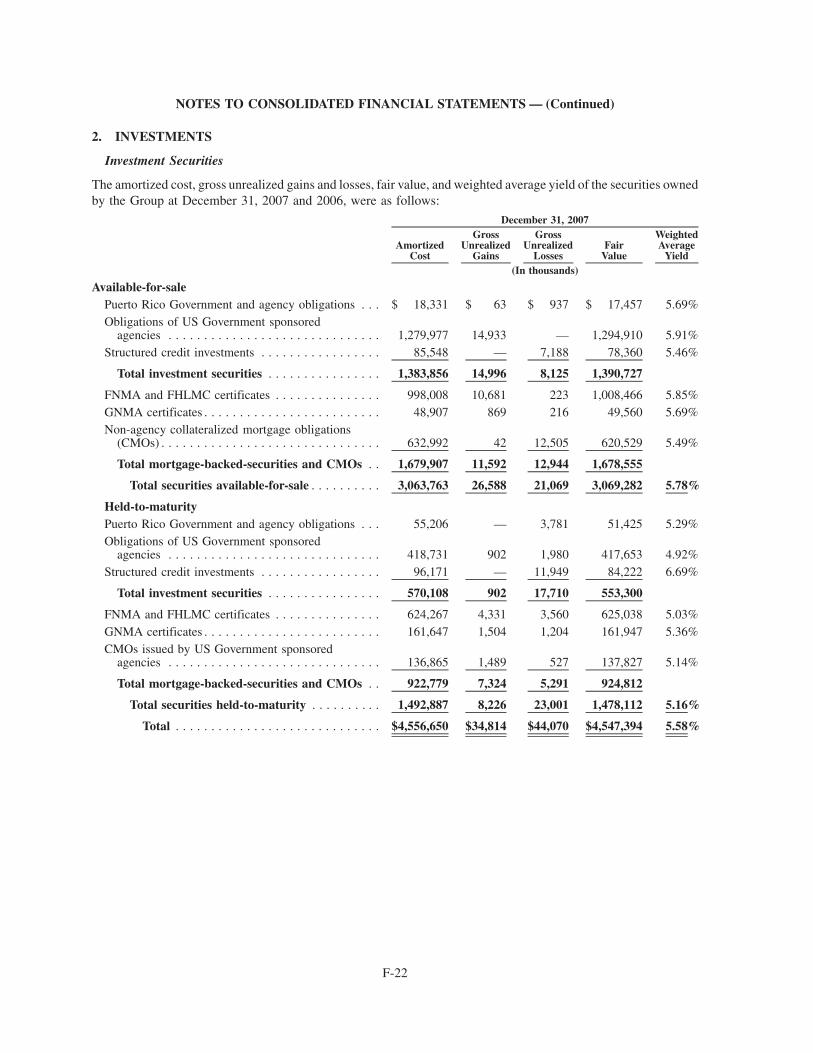
2. INVESTMENTS
Investment Securities
The amortized cost, gross unrealized gains and losses, fair value, and weighted average yield of the securities ownedby the Group at December 31, 2007 and 2006, were as follows:
AmortizedCost
GrossUnrealized
Gains
GrossUnrealized
LossesFair
Value
WeightedAverage
Yield
December 31, 2007
(In thousands)
Available-for-salePuerto Rico Government and agency obligations . . . $ 18,331 $ 63 $ 937 $ 17,457 5.69%Obligations of US Government sponsored
agencies . . . . . . . . . . . . . . . . . . . . . . . . . . . . . . 1,279,977 14,933 — 1,294,910 5.91%Structured credit investments . . . . . . . . . . . . . . . . . 85,548 — 7,188 78,360 5.46%
Total investment securities . . . . . . . . . . . . . . . . 1,383,856 14,996 8,125 1,390,727
FNMA and FHLMC certificates . . . . . . . . . . . . . . . 998,008 10,681 223 1,008,466 5.85%GNMA certificates . . . . . . . . . . . . . . . . . . . . . . . . . 48,907 869 216 49,560 5.69%Non-agency collateralized mortgage obligations
(CMOs) . . . . . . . . . . . . . . . . . . . . . . . . . . . . . . . 632,992 42 12,505 620,529 5.49%
Total mortgage-backed-securities and CMOs . . 1,679,907 11,592 12,944 1,678,555
Total securities available-for-sale . . . . . . . . . . 3,063,763 26,588 21,069 3,069,282 5.78%
Held-to-maturityPuerto Rico Government and agency obligations . . . 55,206 — 3,781 51,425 5.29%Obligations of US Government sponsored
agencies . . . . . . . . . . . . . . . . . . . . . . . . . . . . . . 418,731 902 1,980 417,653 4.92%Structured credit investments . . . . . . . . . . . . . . . . . 96,171 — 11,949 84,222 6.69%
Total investment securities . . . . . . . . . . . . . . . . 570,108 902 17,710 553,300
FNMA and FHLMC certificates . . . . . . . . . . . . . . . 624,267 4,331 3,560 625,038 5.03%GNMA certificates . . . . . . . . . . . . . . . . . . . . . . . . . 161,647 1,504 1,204 161,947 5.36%CMOs issued by US Government sponsored
agencies . . . . . . . . . . . . . . . . . . . . . . . . . . . . . . 136,865 1,489 527 137,827 5.14%
Total mortgage-backed-securities and CMOs . . 922,779 7,324 5,291 924,812
Total securities held-to-maturity . . . . . . . . . . 1,492,887 8,226 23,001 1,478,112 5.16%
Total . . . . . . . . . . . . . . . . . . . . . . . . . . . . . $4,556,650 $34,814 $44,070 $4,547,394 5.58%
F-22
NOTES TO CONSOLIDATED FINANCIAL STATEMENTS — (Continued)
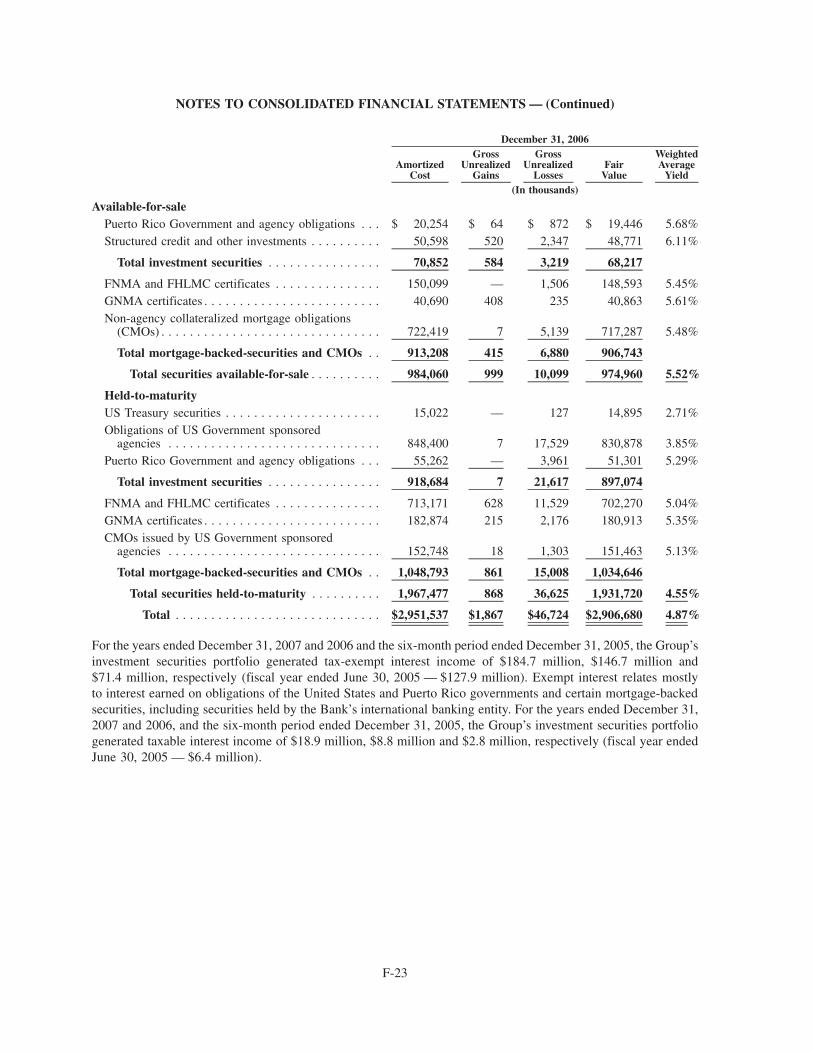
AmortizedCost
GrossUnrealized
Gains
GrossUnrealized
LossesFair
Value
WeightedAverage
Yield
December 31, 2006
(In thousands)
Available-for-salePuerto Rico Government and agency obligations . . . $ 20,254 $ 64 $ 872 $ 19,446 5.68%Structured credit and other investments . . . . . . . . . . 50,598 520 2,347 48,771 6.11%
Total investment securities . . . . . . . . . . . . . . . . 70,852 584 3,219 68,217
FNMA and FHLMC certificates . . . . . . . . . . . . . . . 150,099 — 1,506 148,593 5.45%GNMA certificates . . . . . . . . . . . . . . . . . . . . . . . . . 40,690 408 235 40,863 5.61%Non-agency collateralized mortgage obligations
(CMOs) . . . . . . . . . . . . . . . . . . . . . . . . . . . . . . . 722,419 7 5,139 717,287 5.48%
Total mortgage-backed-securities and CMOs . . 913,208 415 6,880 906,743
Total securities available-for-sale . . . . . . . . . . 984,060 999 10,099 974,960 5.52%
Held-to-maturityUS Treasury securities . . . . . . . . . . . . . . . . . . . . . . 15,022 — 127 14,895 2.71%Obligations of US Government sponsored
agencies . . . . . . . . . . . . . . . . . . . . . . . . . . . . . . 848,400 7 17,529 830,878 3.85%Puerto Rico Government and agency obligations . . . 55,262 — 3,961 51,301 5.29%
Total investment securities . . . . . . . . . . . . . . . . 918,684 7 21,617 897,074
FNMA and FHLMC certificates . . . . . . . . . . . . . . . 713,171 628 11,529 702,270 5.04%GNMA certificates . . . . . . . . . . . . . . . . . . . . . . . . . 182,874 215 2,176 180,913 5.35%CMOs issued by US Government sponsored
agencies . . . . . . . . . . . . . . . . . . . . . . . . . . . . . . 152,748 18 1,303 151,463 5.13%
Total mortgage-backed-securities and CMOs . . 1,048,793 861 15,008 1,034,646
Total securities held-to-maturity . . . . . . . . . . 1,967,477 868 36,625 1,931,720 4.55%
Total . . . . . . . . . . . . . . . . . . . . . . . . . . . . . $2,951,537 $1,867 $46,724 $2,906,680 4.87%
For the years ended December 31, 2007 and 2006 and the six-month period ended December 31, 2005, the Group’sinvestment securities portfolio generated tax-exempt interest income of $184.7 million, $146.7 million and$71.4 million, respectively (fiscal year ended June 30, 2005 — $127.9 million). Exempt interest relates mostlyto interest earned on obligations of the United States and Puerto Rico governments and certain mortgage-backedsecurities, including securities held by the Bank’s international banking entity. For the years ended December 31,2007 and 2006, and the six-month period ended December 31, 2005, the Group’s investment securities portfoliogenerated taxable interest income of $18.9 million, $8.8 million and $2.8 million, respectively (fiscal year endedJune 30, 2005 — $6.4 million).
F-23
NOTES TO CONSOLIDATED FINANCIAL STATEMENTS — (Continued)
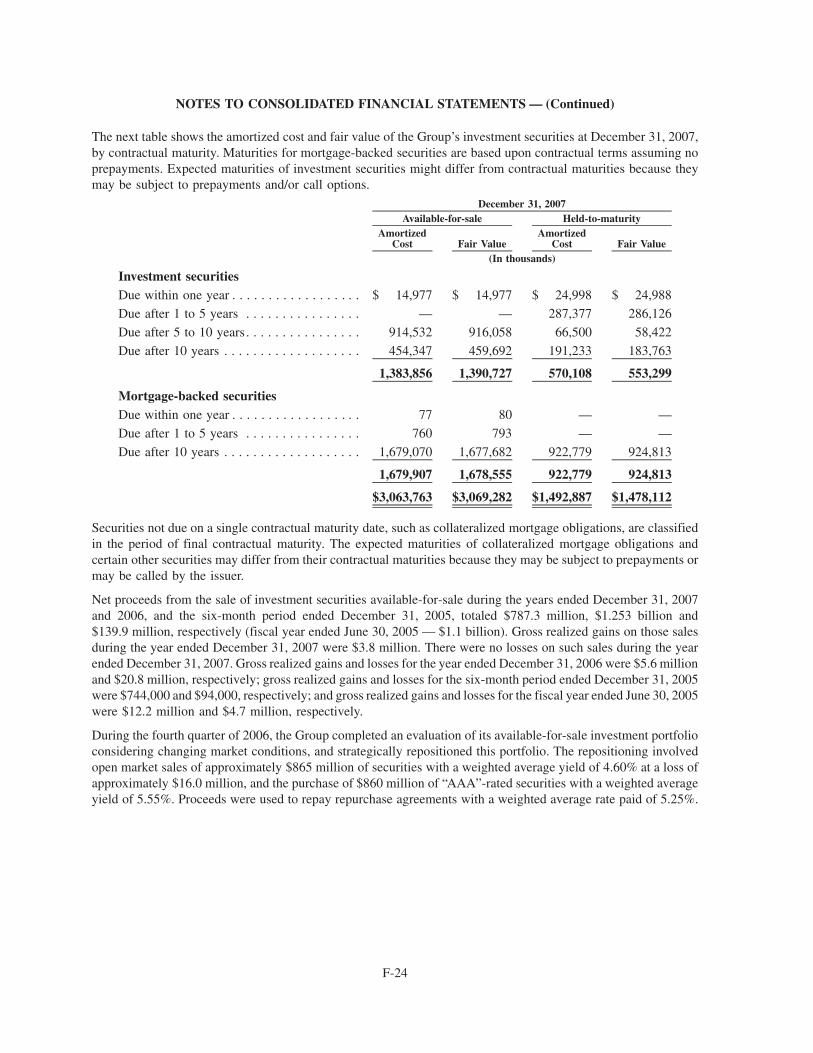
The next table shows the amortized cost and fair value of the Group’s investment securities at December 31, 2007,by contractual maturity. Maturities for mortgage-backed securities are based upon contractual terms assuming noprepayments. Expected maturities of investment securities might differ from contractual maturities because theymay be subject to prepayments and/or call options.
AmortizedCost Fair Value
AmortizedCost Fair Value
Available-for-sale Held-to-maturityDecember 31, 2007
(In thousands)
Investment securitiesDue within one year . . . . . . . . . . . . . . . . . . $ 14,977 $ 14,977 $ 24,998 $ 24,988Due after 1 to 5 years . . . . . . . . . . . . . . . . — — 287,377 286,126
Due after 5 to 10 years. . . . . . . . . . . . . . . . 914,532 916,058 66,500 58,422
Due after 10 years . . . . . . . . . . . . . . . . . . . 454,347 459,692 191,233 183,763
1,383,856 1,390,727 570,108 553,299
Mortgage-backed securitiesDue within one year . . . . . . . . . . . . . . . . . . 77 80 — —
Due after 1 to 5 years . . . . . . . . . . . . . . . . 760 793 — —
Due after 10 years . . . . . . . . . . . . . . . . . . . 1,679,070 1,677,682 922,779 924,813
1,679,907 1,678,555 922,779 924,813
$3,063,763 $3,069,282 $1,492,887 $1,478,112
Securities not due on a single contractual maturity date, such as collateralized mortgage obligations, are classifiedin the period of final contractual maturity. The expected maturities of collateralized mortgage obligations andcertain other securities may differ from their contractual maturities because they may be subject to prepayments ormay be called by the issuer.
Net proceeds from the sale of investment securities available-for-sale during the years ended December 31, 2007and 2006, and the six-month period ended December 31, 2005, totaled $787.3 million, $1.253 billion and$139.9 million, respectively (fiscal year ended June 30, 2005 — $1.1 billion). Gross realized gains on those salesduring the year ended December 31, 2007 were $3.8 million. There were no losses on such sales during the yearended December 31, 2007. Gross realized gains and losses for the year ended December 31, 2006 were $5.6 millionand $20.8 million, respectively; gross realized gains and losses for the six-month period ended December 31, 2005were $744,000 and $94,000, respectively; and gross realized gains and losses for the fiscal year ended June 30, 2005were $12.2 million and $4.7 million, respectively.
During the fourth quarter of 2006, the Group completed an evaluation of its available-for-sale investment portfolioconsidering changing market conditions, and strategically repositioned this portfolio. The repositioning involvedopen market sales of approximately $865 million of securities with a weighted average yield of 4.60% at a loss ofapproximately $16.0 million, and the purchase of $860 million of “AAA”-rated securities with a weighted averageyield of 5.55%. Proceeds were used to repay repurchase agreements with a weighted average rate paid of 5.25%.
F-24
NOTES TO CONSOLIDATED FINANCIAL STATEMENTS — (Continued)
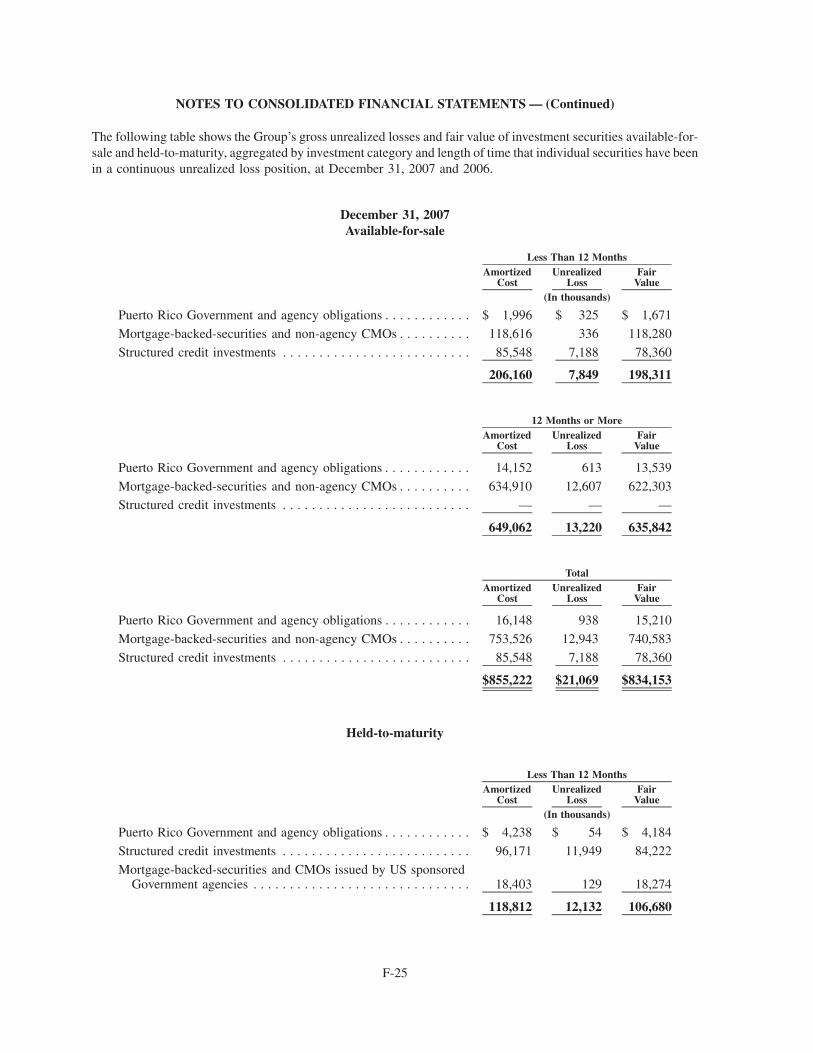
The following table shows the Group’s gross unrealized losses and fair value of investment securities available-for-sale and held-to-maturity, aggregated by investment category and length of time that individual securities have beenin a continuous unrealized loss position, at December 31, 2007 and 2006.
December 31, 2007Available-for-sale
AmortizedCost
UnrealizedLoss
FairValue
Less Than 12 Months
(In thousands)
Puerto Rico Government and agency obligations . . . . . . . . . . . . $ 1,996 $ 325 $ 1,671
Mortgage-backed-securities and non-agency CMOs . . . . . . . . . . 118,616 336 118,280
Structured credit investments . . . . . . . . . . . . . . . . . . . . . . . . . . 85,548 7,188 78,360
206,160 7,849 198,311
AmortizedCost
UnrealizedLoss
FairValue
12 Months or More
Puerto Rico Government and agency obligations . . . . . . . . . . . . 14,152 613 13,539
Mortgage-backed-securities and non-agency CMOs . . . . . . . . . . 634,910 12,607 622,303Structured credit investments . . . . . . . . . . . . . . . . . . . . . . . . . . — — —
649,062 13,220 635,842
AmortizedCost
UnrealizedLoss
FairValue
Total
Puerto Rico Government and agency obligations . . . . . . . . . . . . 16,148 938 15,210
Mortgage-backed-securities and non-agency CMOs . . . . . . . . . . 753,526 12,943 740,583
Structured credit investments . . . . . . . . . . . . . . . . . . . . . . . . . . 85,548 7,188 78,360
$855,222 $21,069 $834,153
Held-to-maturity
AmortizedCost
UnrealizedLoss
FairValue
Less Than 12 Months
(In thousands)
Puerto Rico Government and agency obligations . . . . . . . . . . . . $ 4,238 $ 54 $ 4,184
Structured credit investments . . . . . . . . . . . . . . . . . . . . . . . . . . 96,171 11,949 84,222
Mortgage-backed-securities and CMOs issued by US sponsoredGovernment agencies . . . . . . . . . . . . . . . . . . . . . . . . . . . . . . 18,403 129 18,274
118,812 12,132 106,680
F-25
NOTES TO CONSOLIDATED FINANCIAL STATEMENTS — (Continued)
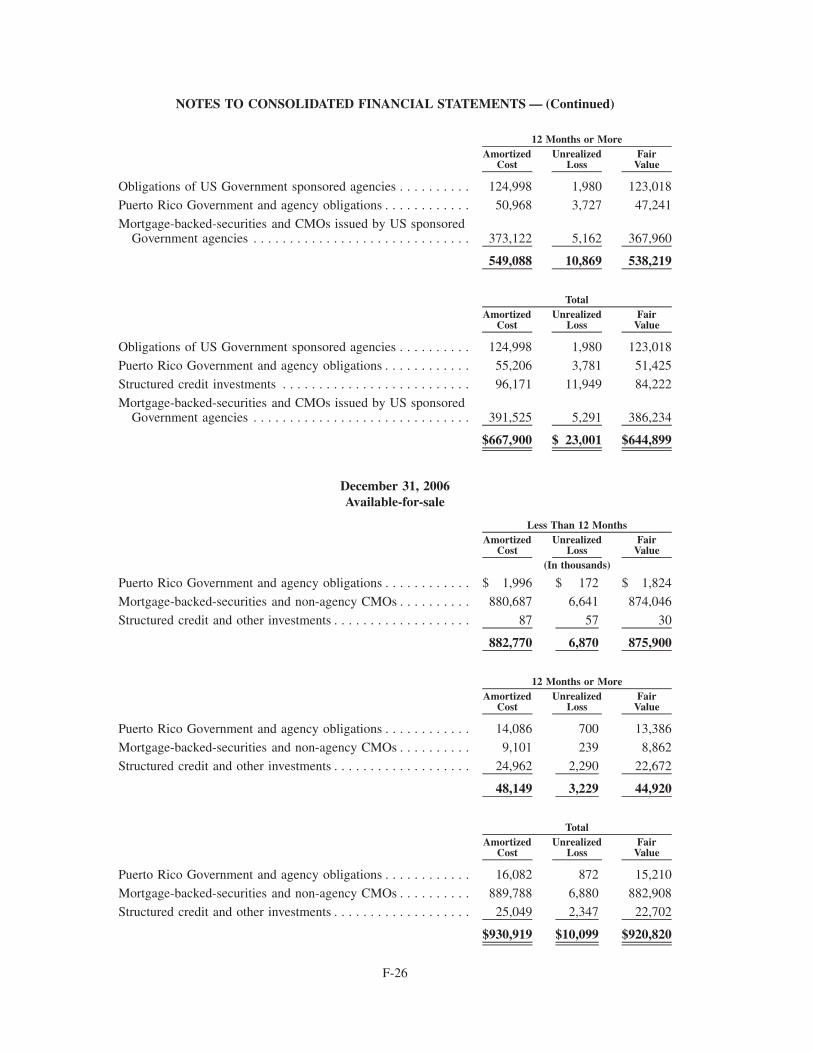
AmortizedCost
UnrealizedLoss
FairValue
12 Months or More
Obligations of US Government sponsored agencies . . . . . . . . . . 124,998 1,980 123,018
Puerto Rico Government and agency obligations . . . . . . . . . . . . 50,968 3,727 47,241
Mortgage-backed-securities and CMOs issued by US sponsoredGovernment agencies . . . . . . . . . . . . . . . . . . . . . . . . . . . . . . 373,122 5,162 367,960
549,088 10,869 538,219
AmortizedCost
UnrealizedLoss
FairValue
Total
Obligations of US Government sponsored agencies . . . . . . . . . . 124,998 1,980 123,018
Puerto Rico Government and agency obligations . . . . . . . . . . . . 55,206 3,781 51,425
Structured credit investments . . . . . . . . . . . . . . . . . . . . . . . . . . 96,171 11,949 84,222
Mortgage-backed-securities and CMOs issued by US sponsoredGovernment agencies . . . . . . . . . . . . . . . . . . . . . . . . . . . . . . 391,525 5,291 386,234
$667,900 $ 23,001 $644,899
December 31, 2006Available-for-sale
AmortizedCost
UnrealizedLoss
FairValue
Less Than 12 Months
(In thousands)
Puerto Rico Government and agency obligations . . . . . . . . . . . . $ 1,996 $ 172 $ 1,824
Mortgage-backed-securities and non-agency CMOs . . . . . . . . . . 880,687 6,641 874,046
Structured credit and other investments . . . . . . . . . . . . . . . . . . . 87 57 30
882,770 6,870 875,900
AmortizedCost
UnrealizedLoss
FairValue
12 Months or More
Puerto Rico Government and agency obligations . . . . . . . . . . . . 14,086 700 13,386
Mortgage-backed-securities and non-agency CMOs . . . . . . . . . . 9,101 239 8,862
Structured credit and other investments . . . . . . . . . . . . . . . . . . . 24,962 2,290 22,672
48,149 3,229 44,920
AmortizedCost
UnrealizedLoss
FairValue
Total
Puerto Rico Government and agency obligations . . . . . . . . . . . . 16,082 872 15,210
Mortgage-backed-securities and non-agency CMOs . . . . . . . . . . 889,788 6,880 882,908
Structured credit and other investments . . . . . . . . . . . . . . . . . . . 25,049 2,347 22,702
$930,919 $10,099 $920,820
F-26
NOTES TO CONSOLIDATED FINANCIAL STATEMENTS — (Continued)
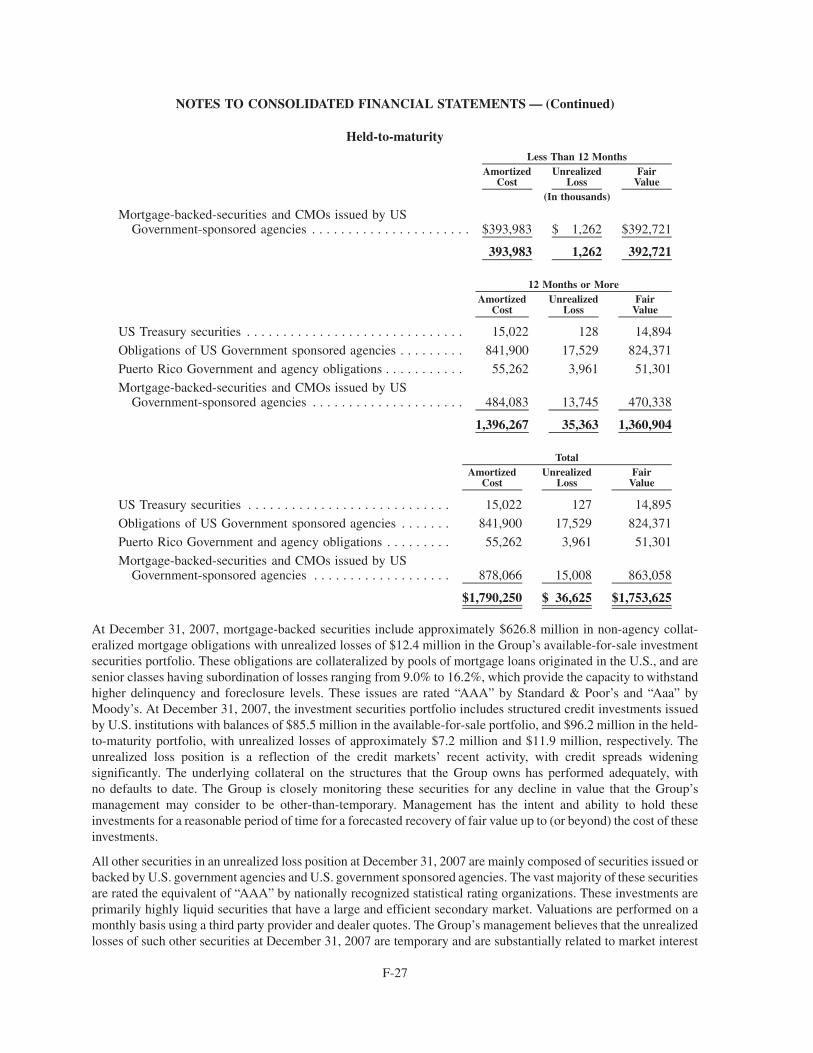
Held-to-maturity
AmortizedCost
UnrealizedLoss
FairValue
Less Than 12 Months
(In thousands)
Mortgage-backed-securities and CMOs issued by USGovernment-sponsored agencies . . . . . . . . . . . . . . . . . . . . . . $393,983 $ 1,262 $392,721
393,983 1,262 392,721
AmortizedCost
UnrealizedLoss
FairValue
12 Months or More
US Treasury securities . . . . . . . . . . . . . . . . . . . . . . . . . . . . . . 15,022 128 14,894
Obligations of US Government sponsored agencies . . . . . . . . . 841,900 17,529 824,371
Puerto Rico Government and agency obligations . . . . . . . . . . . 55,262 3,961 51,301
Mortgage-backed-securities and CMOs issued by USGovernment-sponsored agencies . . . . . . . . . . . . . . . . . . . . . 484,083 13,745 470,338
1,396,267 35,363 1,360,904
AmortizedCost
UnrealizedLoss
FairValue
Total
US Treasury securities . . . . . . . . . . . . . . . . . . . . . . . . . . . . 15,022 127 14,895
Obligations of US Government sponsored agencies . . . . . . . 841,900 17,529 824,371
Puerto Rico Government and agency obligations . . . . . . . . . 55,262 3,961 51,301
Mortgage-backed-securities and CMOs issued by USGovernment-sponsored agencies . . . . . . . . . . . . . . . . . . . 878,066 15,008 863,058
$1,790,250 $ 36,625 $1,753,625
At December 31, 2007, mortgage-backed securities include approximately $626.8 million in non-agency collat-eralized mortgage obligations with unrealized losses of $12.4 million in the Group’s available-for-sale investmentsecurities portfolio. These obligations are collateralized by pools of mortgage loans originated in the U.S., and aresenior classes having subordination of losses ranging from 9.0% to 16.2%, which provide the capacity to withstandhigher delinquency and foreclosure levels. These issues are rated “AAA” by Standard & Poor’s and “Aaa” byMoody’s. At December 31, 2007, the investment securities portfolio includes structured credit investments issuedby U.S. institutions with balances of $85.5 million in the available-for-sale portfolio, and $96.2 million in the held-to-maturity portfolio, with unrealized losses of approximately $7.2 million and $11.9 million, respectively. Theunrealized loss position is a reflection of the credit markets’ recent activity, with credit spreads wideningsignificantly. The underlying collateral on the structures that the Group owns has performed adequately, withno defaults to date. The Group is closely monitoring these securities for any decline in value that the Group’smanagement may consider to be other-than-temporary. Management has the intent and ability to hold theseinvestments for a reasonable period of time for a forecasted recovery of fair value up to (or beyond) the cost of theseinvestments.
All other securities in an unrealized loss position at December 31, 2007 are mainly composed of securities issued orbacked by U.S. government agencies and U.S. government sponsored agencies. The vast majority of these securitiesare rated the equivalent of “AAA” by nationally recognized statistical rating organizations. These investments areprimarily highly liquid securities that have a large and efficient secondary market. Valuations are performed on amonthly basis using a third party provider and dealer quotes. The Group’s management believes that the unrealizedlosses of such other securities at December 31, 2007 are temporary and are substantially related to market interest
F-27
NOTES TO CONSOLIDATED FINANCIAL STATEMENTS — (Continued)
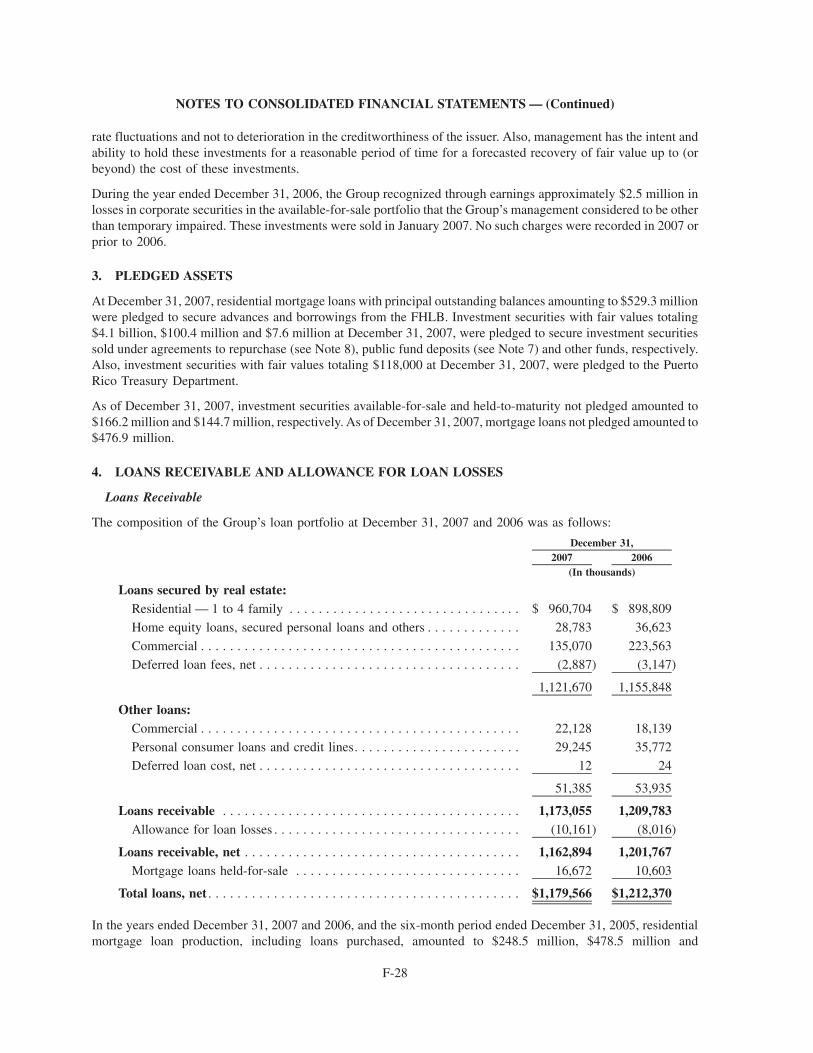
rate fluctuations and not to deterioration in the creditworthiness of the issuer. Also, management has the intent andability to hold these investments for a reasonable period of time for a forecasted recovery of fair value up to (orbeyond) the cost of these investments.
During the year ended December 31, 2006, the Group recognized through earnings approximately $2.5 million inlosses in corporate securities in the available-for-sale portfolio that the Group’s management considered to be otherthan temporary impaired. These investments were sold in January 2007. No such charges were recorded in 2007 orprior to 2006.
3. PLEDGED ASSETS
At December 31, 2007, residential mortgage loans with principal outstanding balances amounting to $529.3 millionwere pledged to secure advances and borrowings from the FHLB. Investment securities with fair values totaling$4.1 billion, $100.4 million and $7.6 million at December 31, 2007, were pledged to secure investment securitiessold under agreements to repurchase (see Note 8), public fund deposits (see Note 7) and other funds, respectively.Also, investment securities with fair values totaling $118,000 at December 31, 2007, were pledged to the PuertoRico Treasury Department.
As of December 31, 2007, investment securities available-for-sale and held-to-maturity not pledged amounted to$166.2 million and $144.7 million, respectively. As of December 31, 2007, mortgage loans not pledged amounted to$476.9 million.
4. LOANS RECEIVABLE AND ALLOWANCE FOR LOAN LOSSES
Loans Receivable
The composition of the Group’s loan portfolio at December 31, 2007 and 2006 was as follows:
2007 2006December 31,
(In thousands)
Loans secured by real estate:Residential — 1 to 4 family . . . . . . . . . . . . . . . . . . . . . . . . . . . . . . . . $ 960,704 $ 898,809
Home equity loans, secured personal loans and others . . . . . . . . . . . . . 28,783 36,623
Commercial . . . . . . . . . . . . . . . . . . . . . . . . . . . . . . . . . . . . . . . . . . . . 135,070 223,563
Deferred loan fees, net . . . . . . . . . . . . . . . . . . . . . . . . . . . . . . . . . . . . (2,887) (3,147)
1,121,670 1,155,848
Other loans:Commercial . . . . . . . . . . . . . . . . . . . . . . . . . . . . . . . . . . . . . . . . . . . . 22,128 18,139
Personal consumer loans and credit lines. . . . . . . . . . . . . . . . . . . . . . . 29,245 35,772Deferred loan cost, net . . . . . . . . . . . . . . . . . . . . . . . . . . . . . . . . . . . . 12 24
51,385 53,935
Loans receivable . . . . . . . . . . . . . . . . . . . . . . . . . . . . . . . . . . . . . . . . . 1,173,055 1,209,783Allowance for loan losses . . . . . . . . . . . . . . . . . . . . . . . . . . . . . . . . . . (10,161) (8,016)
Loans receivable, net . . . . . . . . . . . . . . . . . . . . . . . . . . . . . . . . . . . . . . 1,162,894 1,201,767Mortgage loans held-for-sale . . . . . . . . . . . . . . . . . . . . . . . . . . . . . . . 16,672 10,603
Total loans, net . . . . . . . . . . . . . . . . . . . . . . . . . . . . . . . . . . . . . . . . . . . $1,179,566 $1,212,370
In the years ended December 31, 2007 and 2006, and the six-month period ended December 31, 2005, residentialmortgage loan production, including loans purchased, amounted to $248.5 million, $478.5 million and
F-28
NOTES TO CONSOLIDATED FINANCIAL STATEMENTS — (Continued)
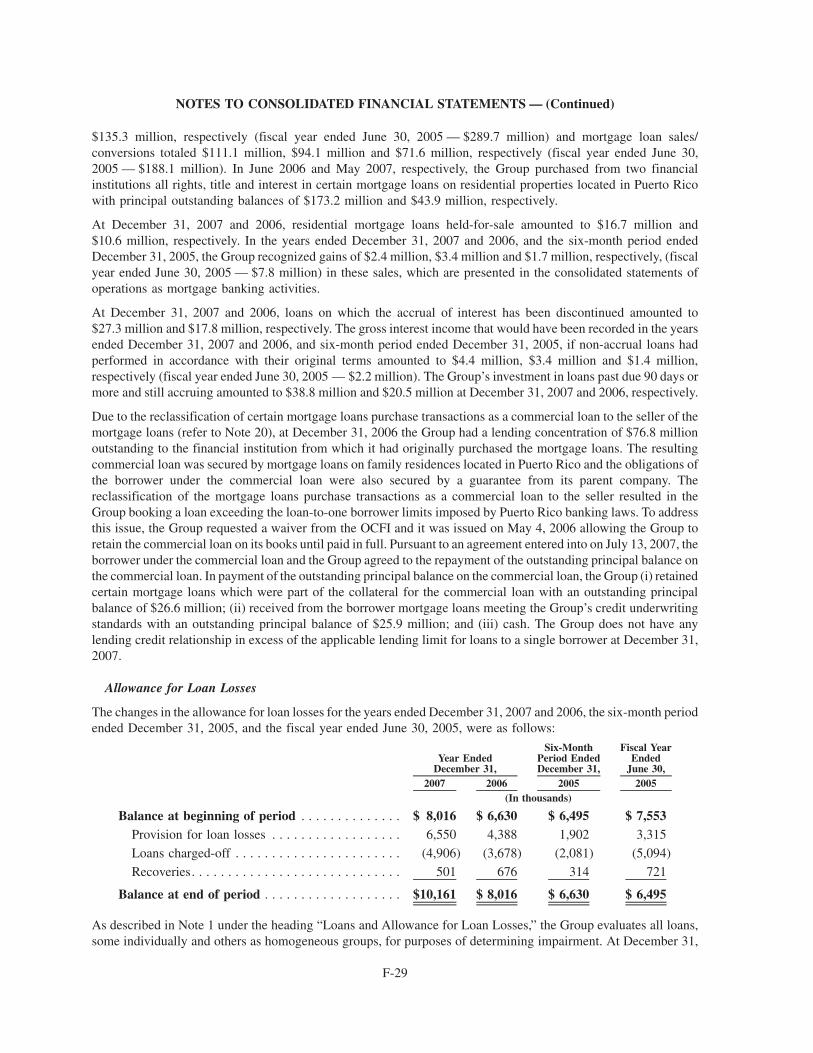
$135.3 million, respectively (fiscal year ended June 30, 2005 — $289.7 million) and mortgage loan sales/conversions totaled $111.1 million, $94.1 million and $71.6 million, respectively (fiscal year ended June 30,2005 — $188.1 million). In June 2006 and May 2007, respectively, the Group purchased from two financialinstitutions all rights, title and interest in certain mortgage loans on residential properties located in Puerto Ricowith principal outstanding balances of $173.2 million and $43.9 million, respectively.
At December 31, 2007 and 2006, residential mortgage loans held-for-sale amounted to $16.7 million and$10.6 million, respectively. In the years ended December 31, 2007 and 2006, and the six-month period endedDecember 31, 2005, the Group recognized gains of $2.4 million, $3.4 million and $1.7 million, respectively, (fiscalyear ended June 30, 2005 — $7.8 million) in these sales, which are presented in the consolidated statements ofoperations as mortgage banking activities.
At December 31, 2007 and 2006, loans on which the accrual of interest has been discontinued amounted to$27.3 million and $17.8 million, respectively. The gross interest income that would have been recorded in the yearsended December 31, 2007 and 2006, and six-month period ended December 31, 2005, if non-accrual loans hadperformed in accordance with their original terms amounted to $4.4 million, $3.4 million and $1.4 million,respectively (fiscal year ended June 30, 2005 — $2.2 million). The Group’s investment in loans past due 90 days ormore and still accruing amounted to $38.8 million and $20.5 million at December 31, 2007 and 2006, respectively.
Due to the reclassification of certain mortgage loans purchase transactions as a commercial loan to the seller of themortgage loans (refer to Note 20), at December 31, 2006 the Group had a lending concentration of $76.8 millionoutstanding to the financial institution from which it had originally purchased the mortgage loans. The resultingcommercial loan was secured by mortgage loans on family residences located in Puerto Rico and the obligations ofthe borrower under the commercial loan were also secured by a guarantee from its parent company. Thereclassification of the mortgage loans purchase transactions as a commercial loan to the seller resulted in theGroup booking a loan exceeding the loan-to-one borrower limits imposed by Puerto Rico banking laws. To addressthis issue, the Group requested a waiver from the OCFI and it was issued on May 4, 2006 allowing the Group toretain the commercial loan on its books until paid in full. Pursuant to an agreement entered into on July 13, 2007, theborrower under the commercial loan and the Group agreed to the repayment of the outstanding principal balance onthe commercial loan. In payment of the outstanding principal balance on the commercial loan, the Group (i) retainedcertain mortgage loans which were part of the collateral for the commercial loan with an outstanding principalbalance of $26.6 million; (ii) received from the borrower mortgage loans meeting the Group’s credit underwritingstandards with an outstanding principal balance of $25.9 million; and (iii) cash. The Group does not have anylending credit relationship in excess of the applicable lending limit for loans to a single borrower at December 31,2007.
Allowance for Loan Losses
The changes in the allowance for loan losses for the years ended December 31, 2007 and 2006, the six-month periodended December 31, 2005, and the fiscal year ended June 30, 2005, were as follows:
2007 2006 2005 2005
Year EndedDecember 31,
Six-MonthPeriod EndedDecember 31,
Fiscal YearEnded
June 30,
(In thousands)
Balance at beginning of period . . . . . . . . . . . . . . $ 8,016 $ 6,630 $ 6,495 $ 7,553Provision for loan losses . . . . . . . . . . . . . . . . . . 6,550 4,388 1,902 3,315
Loans charged-off . . . . . . . . . . . . . . . . . . . . . . . (4,906) (3,678) (2,081) (5,094)
Recoveries. . . . . . . . . . . . . . . . . . . . . . . . . . . . . 501 676 314 721
Balance at end of period . . . . . . . . . . . . . . . . . . . $10,161 $ 8,016 $ 6,630 $ 6,495
As described in Note 1 under the heading “Loans and Allowance for Loan Losses,” the Group evaluates all loans,some individually and others as homogeneous groups, for purposes of determining impairment. At December 31,
F-29
NOTES TO CONSOLIDATED FINANCIAL STATEMENTS — (Continued)
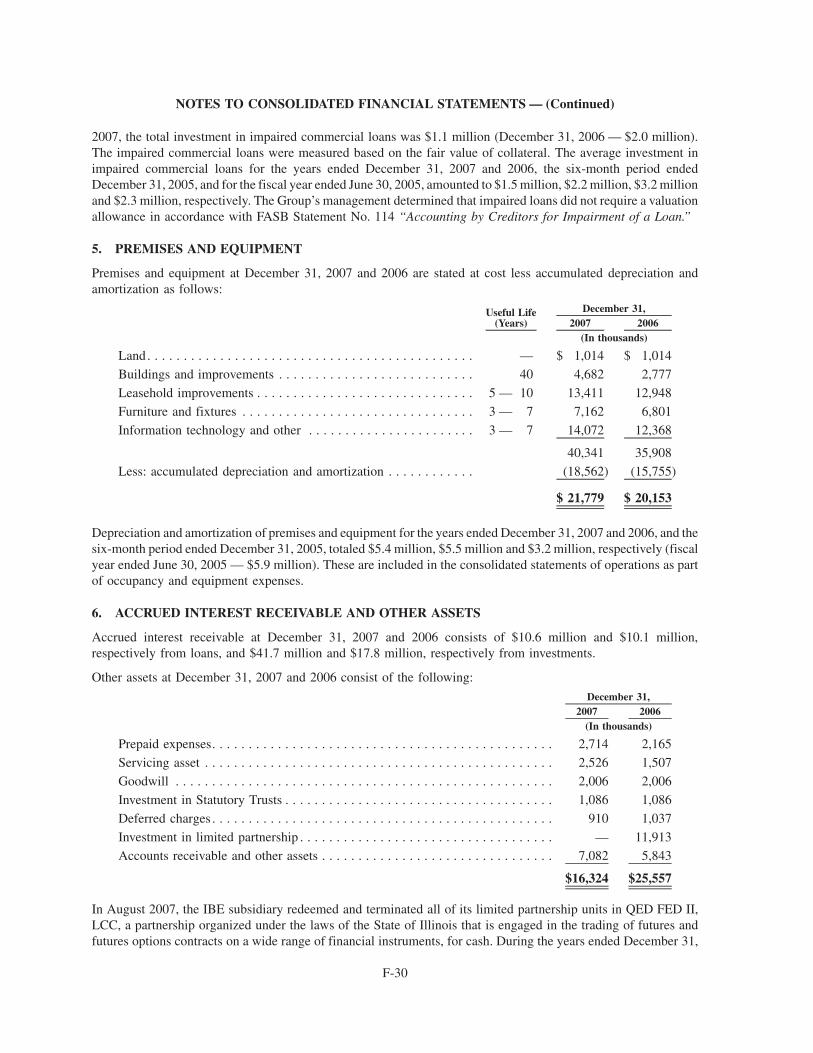
2007, the total investment in impaired commercial loans was $1.1 million (December 31, 2006 — $2.0 million).The impaired commercial loans were measured based on the fair value of collateral. The average investment inimpaired commercial loans for the years ended December 31, 2007 and 2006, the six-month period endedDecember 31, 2005, and for the fiscal year ended June 30, 2005, amounted to $1.5 million, $2.2 million, $3.2 millionand $2.3 million, respectively. The Group’s management determined that impaired loans did not require a valuationallowance in accordance with FASB Statement No. 114 “Accounting by Creditors for Impairment of a Loan.”
5. PREMISES AND EQUIPMENT
Premises and equipment at December 31, 2007 and 2006 are stated at cost less accumulated depreciation andamortization as follows:
Useful Life(Years) 2007 2006
December 31,
(In thousands)
Land. . . . . . . . . . . . . . . . . . . . . . . . . . . . . . . . . . . . . . . . . . . . . — $ 1,014 $ 1,014
Buildings and improvements . . . . . . . . . . . . . . . . . . . . . . . . . . . 40 4,682 2,777
Leasehold improvements . . . . . . . . . . . . . . . . . . . . . . . . . . . . . . 5 — 10 13,411 12,948
Furniture and fixtures . . . . . . . . . . . . . . . . . . . . . . . . . . . . . . . . 3 — 7 7,162 6,801
Information technology and other . . . . . . . . . . . . . . . . . . . . . . . 3 — 7 14,072 12,368
40,341 35,908
Less: accumulated depreciation and amortization . . . . . . . . . . . . (18,562) (15,755)
$ 21,779 $ 20,153
Depreciation and amortization of premises and equipment for the years ended December 31, 2007 and 2006, and thesix-month period ended December 31, 2005, totaled $5.4 million, $5.5 million and $3.2 million, respectively (fiscalyear ended June 30, 2005 — $5.9 million). These are included in the consolidated statements of operations as partof occupancy and equipment expenses.
6. ACCRUED INTEREST RECEIVABLE AND OTHER ASSETS
Accrued interest receivable at December 31, 2007 and 2006 consists of $10.6 million and $10.1 million,respectively from loans, and $41.7 million and $17.8 million, respectively from investments.
Other assets at December 31, 2007 and 2006 consist of the following:
2007 2006December 31,
(In thousands)
Prepaid expenses. . . . . . . . . . . . . . . . . . . . . . . . . . . . . . . . . . . . . . . . . . . . . . . 2,714 2,165
Servicing asset . . . . . . . . . . . . . . . . . . . . . . . . . . . . . . . . . . . . . . . . . . . . . . . . 2,526 1,507
Goodwill . . . . . . . . . . . . . . . . . . . . . . . . . . . . . . . . . . . . . . . . . . . . . . . . . . . . 2,006 2,006
Investment in Statutory Trusts . . . . . . . . . . . . . . . . . . . . . . . . . . . . . . . . . . . . . 1,086 1,086
Deferred charges . . . . . . . . . . . . . . . . . . . . . . . . . . . . . . . . . . . . . . . . . . . . . . . 910 1,037
Investment in limited partnership . . . . . . . . . . . . . . . . . . . . . . . . . . . . . . . . . . . — 11,913
Accounts receivable and other assets . . . . . . . . . . . . . . . . . . . . . . . . . . . . . . . . 7,082 5,843
$16,324 $25,557
In August 2007, the IBE subsidiary redeemed and terminated all of its limited partnership units in QED FED II,LCC, a partnership organized under the laws of the State of Illinois that is engaged in the trading of futures andfutures options contracts on a wide range of financial instruments, for cash. During the years ended December 31,
F-30
NOTES TO CONSOLIDATED FINANCIAL STATEMENTS — (Continued)
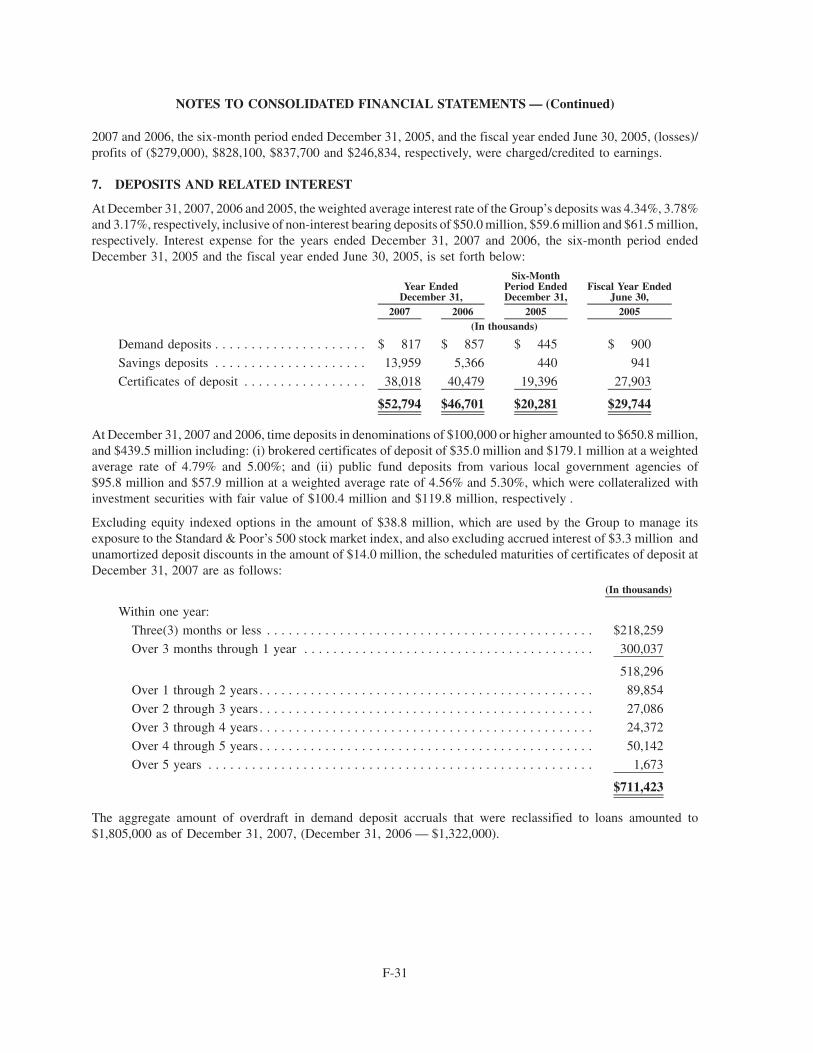
2007 and 2006, the six-month period ended December 31, 2005, and the fiscal year ended June 30, 2005, (losses)/profits of ($279,000), $828,100, $837,700 and $246,834, respectively, were charged/credited to earnings.
7. DEPOSITS AND RELATED INTEREST
At December 31, 2007, 2006 and 2005, the weighted average interest rate of the Group’s deposits was 4.34%, 3.78%and 3.17%, respectively, inclusive of non-interest bearing deposits of $50.0 million, $59.6 million and $61.5 million,respectively. Interest expense for the years ended December 31, 2007 and 2006, the six-month period endedDecember 31, 2005 and the fiscal year ended June 30, 2005, is set forth below:
2007 2006 2005 2005
Year EndedDecember 31,
Six-MonthPeriod EndedDecember 31,
Fiscal Year EndedJune 30,
(In thousands)
Demand deposits . . . . . . . . . . . . . . . . . . . . . $ 817 $ 857 $ 445 $ 900
Savings deposits . . . . . . . . . . . . . . . . . . . . . 13,959 5,366 440 941
Certificates of deposit . . . . . . . . . . . . . . . . . 38,018 40,479 19,396 27,903
$52,794 $46,701 $20,281 $29,744
At December 31, 2007 and 2006, time deposits in denominations of $100,000 or higher amounted to $650.8 million,and $439.5 million including: (i) brokered certificates of deposit of $35.0 million and $179.1 million at a weightedaverage rate of 4.79% and 5.00%; and (ii) public fund deposits from various local government agencies of$95.8 million and $57.9 million at a weighted average rate of 4.56% and 5.30%, which were collateralized withinvestment securities with fair value of $100.4 million and $119.8 million, respectively .
Excluding equity indexed options in the amount of $38.8 million, which are used by the Group to manage itsexposure to the Standard & Poor’s 500 stock market index, and also excluding accrued interest of $3.3 million andunamortized deposit discounts in the amount of $14.0 million, the scheduled maturities of certificates of deposit atDecember 31, 2007 are as follows:
(In thousands)
Within one year:
Three(3) months or less . . . . . . . . . . . . . . . . . . . . . . . . . . . . . . . . . . . . . . . . . . . . . $218,259
Over 3 months through 1 year . . . . . . . . . . . . . . . . . . . . . . . . . . . . . . . . . . . . . . . . 300,037
518,296
Over 1 through 2 years . . . . . . . . . . . . . . . . . . . . . . . . . . . . . . . . . . . . . . . . . . . . . . 89,854
Over 2 through 3 years . . . . . . . . . . . . . . . . . . . . . . . . . . . . . . . . . . . . . . . . . . . . . . 27,086
Over 3 through 4 years . . . . . . . . . . . . . . . . . . . . . . . . . . . . . . . . . . . . . . . . . . . . . . 24,372
Over 4 through 5 years . . . . . . . . . . . . . . . . . . . . . . . . . . . . . . . . . . . . . . . . . . . . . . 50,142
Over 5 years . . . . . . . . . . . . . . . . . . . . . . . . . . . . . . . . . . . . . . . . . . . . . . . . . . . . . 1,673
$711,423
The aggregate amount of overdraft in demand deposit accruals that were reclassified to loans amounted to$1,805,000 as of December 31, 2007, (December 31, 2006 — $1,322,000).
F-31
NOTES TO CONSOLIDATED FINANCIAL STATEMENTS — (Continued)
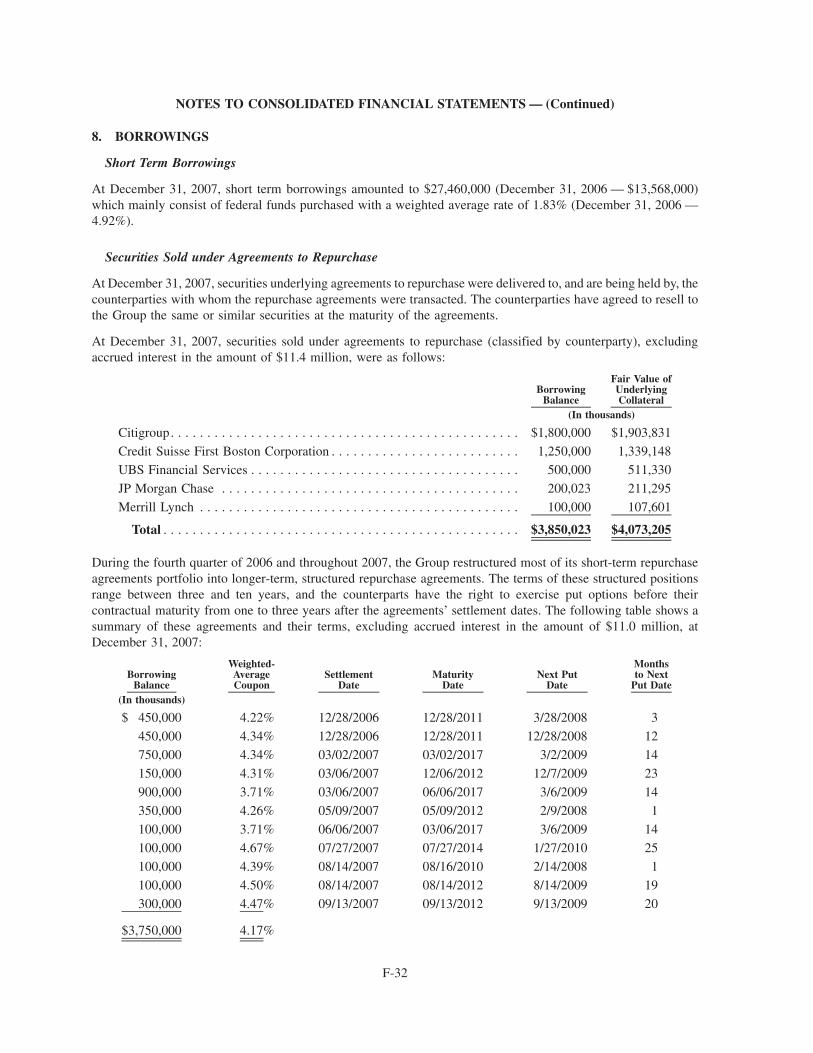
8. BORROWINGS
Short Term Borrowings
At December 31, 2007, short term borrowings amounted to $27,460,000 (December 31, 2006 — $13,568,000)which mainly consist of federal funds purchased with a weighted average rate of 1.83% (December 31, 2006 —4.92%).
Securities Sold under Agreements to Repurchase
At December 31, 2007, securities underlying agreements to repurchase were delivered to, and are being held by, thecounterparties with whom the repurchase agreements were transacted. The counterparties have agreed to resell tothe Group the same or similar securities at the maturity of the agreements.
At December 31, 2007, securities sold under agreements to repurchase (classified by counterparty), excludingaccrued interest in the amount of $11.4 million, were as follows:
BorrowingBalance
Fair Value ofUnderlyingCollateral
(In thousands)
Citigroup. . . . . . . . . . . . . . . . . . . . . . . . . . . . . . . . . . . . . . . . . . . . . . . . $1,800,000 $1,903,831
Credit Suisse First Boston Corporation . . . . . . . . . . . . . . . . . . . . . . . . . . 1,250,000 1,339,148UBS Financial Services . . . . . . . . . . . . . . . . . . . . . . . . . . . . . . . . . . . . . 500,000 511,330
JP Morgan Chase . . . . . . . . . . . . . . . . . . . . . . . . . . . . . . . . . . . . . . . . . 200,023 211,295
Merrill Lynch . . . . . . . . . . . . . . . . . . . . . . . . . . . . . . . . . . . . . . . . . . . . 100,000 107,601
Total . . . . . . . . . . . . . . . . . . . . . . . . . . . . . . . . . . . . . . . . . . . . . . . . . $3,850,023 $4,073,205
During the fourth quarter of 2006 and throughout 2007, the Group restructured most of its short-term repurchaseagreements portfolio into longer-term, structured repurchase agreements. The terms of these structured positionsrange between three and ten years, and the counterparts have the right to exercise put options before theircontractual maturity from one to three years after the agreements’ settlement dates. The following table shows asummary of these agreements and their terms, excluding accrued interest in the amount of $11.0 million, atDecember 31, 2007:
BorrowingBalance
Weighted-AverageCoupon
SettlementDate
MaturityDate
Next PutDate
Monthsto Next
Put Date(In thousands)
$ 450,000 4.22% 12/28/2006 12/28/2011 3/28/2008 3
450,000 4.34% 12/28/2006 12/28/2011 12/28/2008 12
750,000 4.34% 03/02/2007 03/02/2017 3/2/2009 14
150,000 4.31% 03/06/2007 12/06/2012 12/7/2009 23
900,000 3.71% 03/06/2007 06/06/2017 3/6/2009 14
350,000 4.26% 05/09/2007 05/09/2012 2/9/2008 1
100,000 3.71% 06/06/2007 03/06/2017 3/6/2009 14
100,000 4.67% 07/27/2007 07/27/2014 1/27/2010 25
100,000 4.39% 08/14/2007 08/16/2010 2/14/2008 1
100,000 4.50% 08/14/2007 08/14/2012 8/14/2009 19
300,000 4.47% 09/13/2007 09/13/2012 9/13/2009 20
$3,750,000 4.17%
F-32
NOTES TO CONSOLIDATED FINANCIAL STATEMENTS — (Continued)
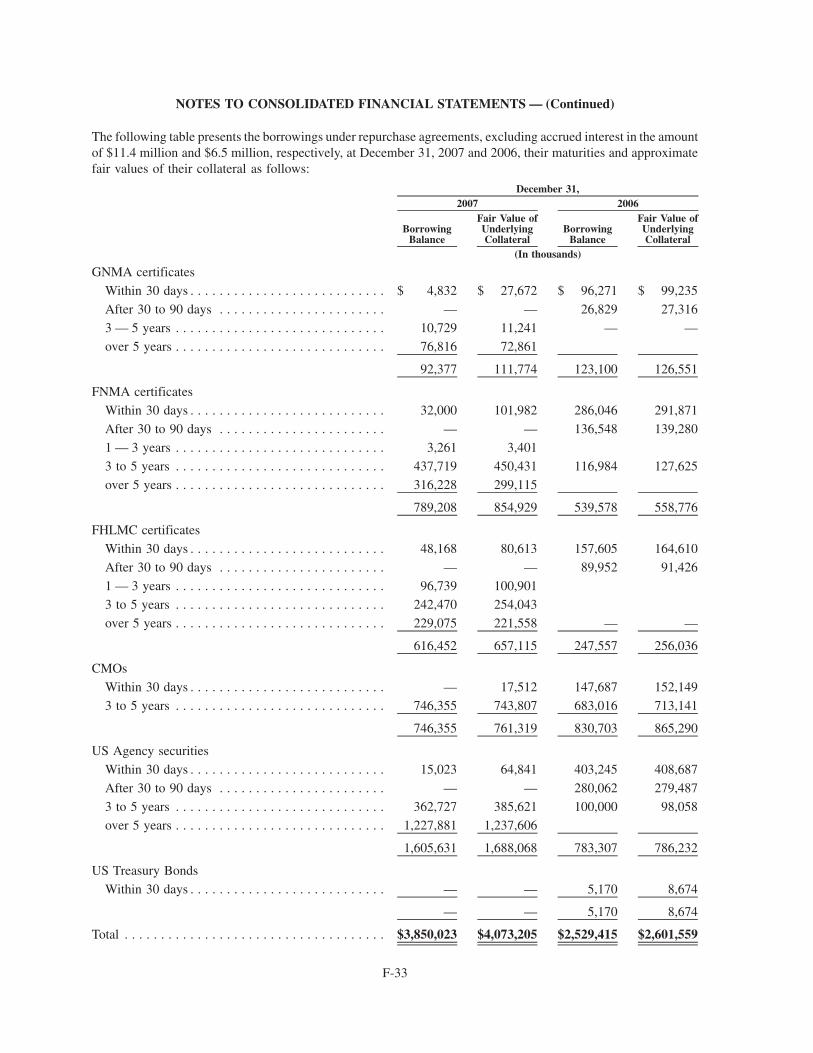
The following table presents the borrowings under repurchase agreements, excluding accrued interest in the amountof $11.4 million and $6.5 million, respectively, at December 31, 2007 and 2006, their maturities and approximatefair values of their collateral as follows:
BorrowingBalance
Fair Value ofUnderlyingCollateral
BorrowingBalance
Fair Value ofUnderlyingCollateral
2007 2006December 31,
(In thousands)
GNMA certificates
Within 30 days . . . . . . . . . . . . . . . . . . . . . . . . . . . $ 4,832 $ 27,672 $ 96,271 $ 99,235
After 30 to 90 days . . . . . . . . . . . . . . . . . . . . . . . — — 26,829 27,316
3 — 5 years . . . . . . . . . . . . . . . . . . . . . . . . . . . . . 10,729 11,241 — —
over 5 years . . . . . . . . . . . . . . . . . . . . . . . . . . . . . 76,816 72,861
92,377 111,774 123,100 126,551
FNMA certificates
Within 30 days . . . . . . . . . . . . . . . . . . . . . . . . . . . 32,000 101,982 286,046 291,871
After 30 to 90 days . . . . . . . . . . . . . . . . . . . . . . . — — 136,548 139,280
1 — 3 years . . . . . . . . . . . . . . . . . . . . . . . . . . . . . 3,261 3,401
3 to 5 years . . . . . . . . . . . . . . . . . . . . . . . . . . . . . 437,719 450,431 116,984 127,625
over 5 years . . . . . . . . . . . . . . . . . . . . . . . . . . . . . 316,228 299,115
789,208 854,929 539,578 558,776
FHLMC certificates
Within 30 days . . . . . . . . . . . . . . . . . . . . . . . . . . . 48,168 80,613 157,605 164,610
After 30 to 90 days . . . . . . . . . . . . . . . . . . . . . . . — — 89,952 91,426
1 — 3 years . . . . . . . . . . . . . . . . . . . . . . . . . . . . . 96,739 100,901
3 to 5 years . . . . . . . . . . . . . . . . . . . . . . . . . . . . . 242,470 254,043
over 5 years . . . . . . . . . . . . . . . . . . . . . . . . . . . . . 229,075 221,558 — —
616,452 657,115 247,557 256,036
CMOs
Within 30 days . . . . . . . . . . . . . . . . . . . . . . . . . . . — 17,512 147,687 152,149
3 to 5 years . . . . . . . . . . . . . . . . . . . . . . . . . . . . . 746,355 743,807 683,016 713,141
746,355 761,319 830,703 865,290
US Agency securities
Within 30 days . . . . . . . . . . . . . . . . . . . . . . . . . . . 15,023 64,841 403,245 408,687
After 30 to 90 days . . . . . . . . . . . . . . . . . . . . . . . — — 280,062 279,487
3 to 5 years . . . . . . . . . . . . . . . . . . . . . . . . . . . . . 362,727 385,621 100,000 98,058
over 5 years . . . . . . . . . . . . . . . . . . . . . . . . . . . . . 1,227,881 1,237,606
1,605,631 1,688,068 783,307 786,232
US Treasury Bonds
Within 30 days . . . . . . . . . . . . . . . . . . . . . . . . . . . — — 5,170 8,674
— — 5,170 8,674
Total . . . . . . . . . . . . . . . . . . . . . . . . . . . . . . . . . . . . $3,850,023 $4,073,205 $2,529,415 $2,601,559
F-33
NOTES TO CONSOLIDATED FINANCIAL STATEMENTS — (Continued)
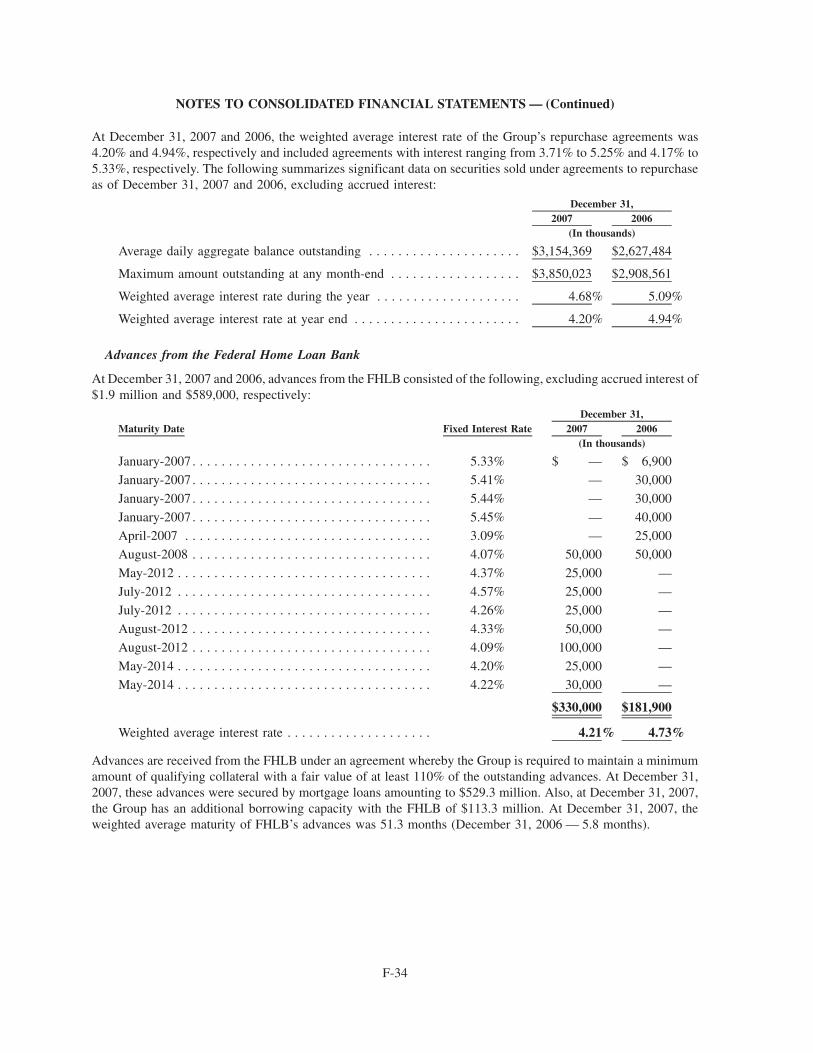
At December 31, 2007 and 2006, the weighted average interest rate of the Group’s repurchase agreements was4.20% and 4.94%, respectively and included agreements with interest ranging from 3.71% to 5.25% and 4.17% to5.33%, respectively. The following summarizes significant data on securities sold under agreements to repurchaseas of December 31, 2007 and 2006, excluding accrued interest:
2007 2006December 31,
(In thousands)
Average daily aggregate balance outstanding . . . . . . . . . . . . . . . . . . . . . $3,154,369 $2,627,484
Maximum amount outstanding at any month-end . . . . . . . . . . . . . . . . . . $3,850,023 $2,908,561
Weighted average interest rate during the year . . . . . . . . . . . . . . . . . . . . 4.68% 5.09%
Weighted average interest rate at year end . . . . . . . . . . . . . . . . . . . . . . . 4.20% 4.94%
Advances from the Federal Home Loan Bank
At December 31, 2007 and 2006, advances from the FHLB consisted of the following, excluding accrued interest of$1.9 million and $589,000, respectively:
Maturity Date Fixed Interest Rate 2007 2006December 31,
(In thousands)
January-2007 . . . . . . . . . . . . . . . . . . . . . . . . . . . . . . . . . 5.33% $ — $ 6,900
January-2007 . . . . . . . . . . . . . . . . . . . . . . . . . . . . . . . . . 5.41% — 30,000
January-2007 . . . . . . . . . . . . . . . . . . . . . . . . . . . . . . . . . 5.44% — 30,000
January-2007 . . . . . . . . . . . . . . . . . . . . . . . . . . . . . . . . . 5.45% — 40,000April-2007 . . . . . . . . . . . . . . . . . . . . . . . . . . . . . . . . . . 3.09% — 25,000
August-2008 . . . . . . . . . . . . . . . . . . . . . . . . . . . . . . . . . 4.07% 50,000 50,000
May-2012 . . . . . . . . . . . . . . . . . . . . . . . . . . . . . . . . . . . 4.37% 25,000 —
July-2012 . . . . . . . . . . . . . . . . . . . . . . . . . . . . . . . . . . . 4.57% 25,000 —
July-2012 . . . . . . . . . . . . . . . . . . . . . . . . . . . . . . . . . . . 4.26% 25,000 —
August-2012 . . . . . . . . . . . . . . . . . . . . . . . . . . . . . . . . . 4.33% 50,000 —
August-2012 . . . . . . . . . . . . . . . . . . . . . . . . . . . . . . . . . 4.09% 100,000 —
May-2014 . . . . . . . . . . . . . . . . . . . . . . . . . . . . . . . . . . . 4.20% 25,000 —
May-2014 . . . . . . . . . . . . . . . . . . . . . . . . . . . . . . . . . . . 4.22% 30,000 —
$330,000 $181,900
Weighted average interest rate . . . . . . . . . . . . . . . . . . . . 4.21% 4.73%
Advances are received from the FHLB under an agreement whereby the Group is required to maintain a minimumamount of qualifying collateral with a fair value of at least 110% of the outstanding advances. At December 31,2007, these advances were secured by mortgage loans amounting to $529.3 million. Also, at December 31, 2007,the Group has an additional borrowing capacity with the FHLB of $113.3 million. At December 31, 2007, theweighted average maturity of FHLB’s advances was 51.3 months (December 31, 2006 — 5.8 months).
F-34
NOTES TO CONSOLIDATED FINANCIAL STATEMENTS — (Continued)
During 2007, the Group restructured most of its FHLB advances portfolio into longer-term, structured advances.The terms of these advances range between five and seven years, and the FHLB has the right to exercise put optionsbefore the contractual maturity of the advances from six months to one year after the advances’ settlement dates.The following table shows a summary of these advances and their terms, excluding accrued interest in the amount of$1.7 million, at December 31, 2007:
BorrowingBalance
Weighted-AverageCoupon
SettlementDate
MaturityDate
Next PutDate
Monthsto Next
Put Date(In thousands)
$ 25,000,000 4.37% 05/04/2007 05/04/2012 2/5/2008 1
25,000,000 4.20% 05/08/2007 05/08/2014 2/8/2008 1
30,000,000 4.22% 05/11/2007 05/11/2014 2/13/2008 1
25,000,000 4.57% 07/24/2007 07/24/2012 1/24/2008 1
25,000,000 4.26% 07/30/2007 07/30/2012 1/30/2008 1
50,000,000 4.33% 08/10/2007 08/10/2012 8/10/2008 7
100,000,000 4.09% 08/16/2007 08/16/2012 8/16/2008 8
$280,000,000 4.24%
Term Notes
At December 31, 2006, there were term notes outstanding in the amount of $15.0 million, with a floating rate duequarterly at 4.98%, which matured on March 27, 2007, and which were secured by investment securities with fairvalue amounting to $15.5 million. There were no term notes outstanding as of December 31, 2007.
Subordinated Capital Notes
Subordinated capital notes amounted to $36.1 million at December 31, 2007 and 2006.
In October 2001 and August 2003, the Statutory Trust I and the Statutory Trust II, respectively, special purposeentities of the Group, were formed for the purpose of issuing trust redeemable preferred securities. In December2001 and September 2003, $35.0 million of trust redeemable preferred securities were each issued by the StatutoryTrust I and the Statutory Trust II, respectively, as part of pooled underwriting transactions. Pooled underwritinginvolves participating with other bank holding companies in issuing the securities through a special purpose poolingvehicle created by the underwriters.
The proceeds from these issuances were used by the Statutory Trust I and the Statutory Trust II to purchase a likeamount of floating rate junior subordinated deferrable interest debentures (“subordinated capital notes”) issued bythe Group. The call provision of the subordinated capital notes purchased by the Statutory Trust I was exercised bythe Group in December 2006 and the Group recorded a $915,000 loss related to the write-off of unamortizedissuance costs of the notes. The second one, has a par value of $36.1 million, bears interest based on 3 monthsLIBOR plus 295 basis points (December 31, 2007 and 2006 — 7.94% and 8.31%, respectively;), payable quarterly,and matures on September 17, 2033. Statutory Trust II may be called at par after five years (on September 17, 2008).The trust redeemable preferred security has the same maturity and call provisions as the subordinated capital notes.The subordinated deferrable interest debentures issued by the Group are accounted for as a liability denominated assubordinated capital notes on the consolidated statements of financial condition.
The subordinated capital note is treated as Tier 1 capital for regulatory purposes. Under Federal Reserve Boardrules, restricted core capital elements, which are qualifying trust preferred securities, qualifying cumulativeperpetual preferred stock (and related surplus) and certain minority interests in consolidated subsidiaries, arelimited in the aggregate to no more than 25% of a bank holding company’s core capital elements (includingrestricted core capital elements), net of goodwill less any associated deferred tax liability.
F-35
NOTES TO CONSOLIDATED FINANCIAL STATEMENTS — (Continued)
The aggregate contractual maturities of long-term borrowings for each of the five years subsequent to December 31,2007, are: $177.5 million in 2008, none in 2009, $100.0 million in 2010, $900.0 million in 2011, and $3.1 billion in2012 and thereafter.
9. DERIVATIVE ACTIVITIES
The Group may use various derivative instruments as part of its asset and liability management. These transactionsinvolve both credit and market risks. The notional amounts are amounts on which calculations, payments, and thevalue of the derivatives are based. Notional amounts do not represent direct credit exposures. Direct credit exposureis limited to the net difference between the calculated amounts to be received and paid, if any. The actual risk of lossis the cost of replacing, at market, these contracts in the event of default by the counterparties. The Group controlsthe credit risk of its derivative financial instrument agreements through credit approvals, limits, monitoringprocedures and, when necessary, collateral.
Derivative instruments are generally negotiated over-the-counter (“OTC”) contracts. Negotiated OTC derivativesare generally entered into between two counterparties that negotiate specific contractual terms, including theunderlying instrument, amount, exercise price and maturity.
The Group generally uses interest rate swaps and options in managing its interest rate risk exposure. Certain swapswere entered into to convert the forecasted rollover of short-term borrowings into fixed rate liabilities for longerperiods and provide protection against increases in short-term interest rates. Under these swaps, the Group paid afixed monthly or quarterly cost and received a floating thirty or ninety-day payment based on LIBOR. Floating ratepayments received from the swap counterparties partially offset the interest payments to be made on the forecastedrollover of short-term borrowings. The Group decided to unwind all of its outstanding interest rate swaps withaggregate notional amounts of $1.1 billion in two separate transactions in July and December 2006.
The Group offers its customers certificates of deposit with an option tied to the performance of the Standard &Poor’s 500 stock market index. At the end of five years depositors receive a return equal to the greater of 15% of theprincipal in the account or 150% of the average increase in the month-end value of the index. The Group uses optionagreements with major broker-dealer companies to manage its exposure to changes in this index. Under the terms ofthe option agreements, the Group receives the average increase in the month-end value of the index in exchange fora fixed premium. The changes in fair value of the option agreements used to manage the exposure in the stockmarket in the certificates of deposit are recorded in earnings in accordance with SFAS No. 133, as amended.
There were no derivatives designated as a hedge as of December 31, 2007 and 2006. Derivatives not designated as ahedge, consist of purchased options used to manage the exposure to the stock market on stock indexed deposits withnotional amounts of $152,530,000 and $131,530,000 as of December 31, 2007 and 2006, respectively; embeddedoptions on stock indexed deposits with notional amounts of $147,073,000 and $122,924,000 as of December 31,2007 and 2006, respectively.
At December 31, 2007, the yearly contractual maturities of derivative instruments were as follows:
Year EndingDecember 31,
Equity IndexedOptions Purchased
Equity IndexedOptions Written
(In thousands)
2008 . . . . . . . . . . . . . . . . . . . . . . . . . . . . . . . . . . . . . . . . . . . . . 35,700 33,308
2009 . . . . . . . . . . . . . . . . . . . . . . . . . . . . . . . . . . . . . . . . . . . . . 22,085 20,870
2010 . . . . . . . . . . . . . . . . . . . . . . . . . . . . . . . . . . . . . . . . . . . . . 9,045 8,647
2011 . . . . . . . . . . . . . . . . . . . . . . . . . . . . . . . . . . . . . . . . . . . . . 21,415 20,825
2012 . . . . . . . . . . . . . . . . . . . . . . . . . . . . . . . . . . . . . . . . . . . . . 64,285 63,423
152,530 147,073
For the years ended December 31, 2007 and 2006, the six-month period ended December 31, 2005 and for the fiscalyear ended June 30, 2005, net interest (income) expense on interest rate swaps amounted to ($773,000),
F-36
NOTES TO CONSOLIDATED FINANCIAL STATEMENTS — (Continued)
($8.5 million), ($1.3 million) and $10.1 million, respectively, which represent -0.36%, -4.5%, -2% and 10%,respectively, of the total interest expense recorded for such periods. The average net interest rate of the interest rateswaps during the years ended December 31, 2007 and 2006, the six-month period ended December 31, 2005 and thefiscal year ended June 30, 2005 , was -0.02%, -0.32%, -0.11% and 1.14% , respectively.
Gains (losses) credited (charged) to earnings and reflected as “Derivatives” in the consolidated statements ofoperations for the years ended December 31, 2007 and 2006 and the six-month period ended December 31, 2005and for the fiscal year ended June 30, 2005 amounted to $11.0 million, $3.2 million, $1.3 million and ($2.8 million),respectively. During the year ended December 31, 2007, an $8.2 million gain was recognized due to the eliminationof forecasted transactions on the cash flow hedges of interest rate swaps that were terminated in 2006, which gainswere previously included in other comprehensive income.
At December 31, 2007 and 2006, the purchased options used to manage the exposure to the stock market on stockindexed deposits amounted to $40.7 million and $34.2 million, respectively; the options sold to customersembedded in the certificates of deposit represented a liability of $ $38.8 million and $32.2 million, respectively,recorded in deposits. Also, in a separate transaction during the fourth quarter of 2007, the Group entered into aninterest-rate swap to manage its interest rate risk exposure, with a notional amount of $300.0 million, which wassubsequently terminated in December 2007, resulting in a gain of approximately $1.6 million.
10. EMPLOYEE BENEFIT PLAN
The Group has a cash or deferred arrangement profit sharing plan qualified under Section 1165(e) of the Puerto RicoInternal Revenue Code of 1994, as amended (the “Puerto Rico Code”) and the Section 401(a) and (e) of the UnitedStates Revenue Code of 1986, as amended (the “U.S. Code”), covering all full-time employees of the Group whohave six months of service and are age twenty-one or older. Under this plan, participants may contribute each yearfrom 2% to 10% of their compensation, as defined in the Puerto Rico Code and U.S. Code, up to a specified amount.The Group contributes 80 cents for each dollar contributed by an employee, up to $832 per employee. The Group’smatching contribution is invested in shares of its common stock. The plan is entitled to acquire and hold qualifiedemployer securities as part of its investment of the trust assets pursuant to ERISA Section 407. For the years endedDecember 31, 2007 and 2006 and the six-month period ended December 31, 2005, the Group contributed 17,216,12,787 and 2,700, respectively, (fiscal year ended June 30, 2005 — 8,807) shares of its common stock with a fairvalue of approximately $204,200, $168,200 and $39,000, respectively (fiscal year ended June 30, 2005 —$196,800) at the time of contribution. The Group’s contribution becomes 100% vested once the employeecompletes three years of service.
Also, the Group offers to its senior management a non-qualified deferred compensation plan, where executives candefer taxable income. Both the employer and the employee have flexibility because non-qualified plans are notsubject to ERISA contribution limits nor are they subject to discrimination tests in terms of who must be included inthe plan. Under this plan, the employee’s current taxable income is reduced by the amount being deferred. Fundsdeposited in a deferred compensation plan can accumulate without current income tax to the individual. Taxes aredue when the funds are withdrawn, at the current income tax rate which may be lower than the individual’s currenttax bracket.
F-37
NOTES TO CONSOLIDATED FINANCIAL STATEMENTS — (Continued)
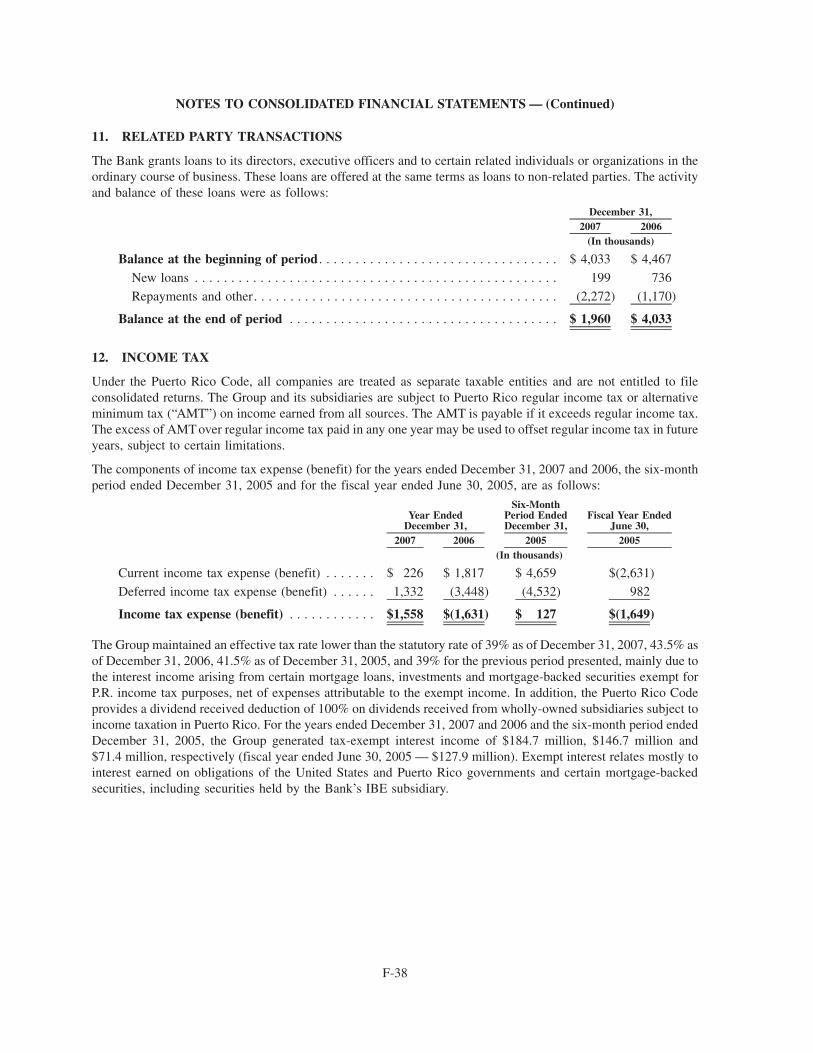
11. RELATED PARTY TRANSACTIONS
The Bank grants loans to its directors, executive officers and to certain related individuals or organizations in theordinary course of business. These loans are offered at the same terms as loans to non-related parties. The activityand balance of these loans were as follows:
2007 2006December 31,
(In thousands)
Balance at the beginning of period . . . . . . . . . . . . . . . . . . . . . . . . . . . . . . . . . $ 4,033 $ 4,467
New loans . . . . . . . . . . . . . . . . . . . . . . . . . . . . . . . . . . . . . . . . . . . . . . . . . . 199 736
Repayments and other. . . . . . . . . . . . . . . . . . . . . . . . . . . . . . . . . . . . . . . . . . (2,272) (1,170)
Balance at the end of period . . . . . . . . . . . . . . . . . . . . . . . . . . . . . . . . . . . . . $ 1,960 $ 4,033
12. INCOME TAX
Under the Puerto Rico Code, all companies are treated as separate taxable entities and are not entitled to fileconsolidated returns. The Group and its subsidiaries are subject to Puerto Rico regular income tax or alternativeminimum tax (“AMT”) on income earned from all sources. The AMT is payable if it exceeds regular income tax.The excess of AMT over regular income tax paid in any one year may be used to offset regular income tax in futureyears, subject to certain limitations.
The components of income tax expense (benefit) for the years ended December 31, 2007 and 2006, the six-monthperiod ended December 31, 2005 and for the fiscal year ended June 30, 2005, are as follows:
2007 2006 2005 2005
Year EndedDecember 31,
Six-MonthPeriod EndedDecember 31,
Fiscal Year EndedJune 30,
(In thousands)
Current income tax expense (benefit) . . . . . . . $ 226 $ 1,817 $ 4,659 $(2,631)
Deferred income tax expense (benefit) . . . . . . 1,332 (3,448) (4,532) 982
Income tax expense (benefit) . . . . . . . . . . . . $1,558 $(1,631) $ 127 $(1,649)
The Group maintained an effective tax rate lower than the statutory rate of 39% as of December 31, 2007, 43.5% asof December 31, 2006, 41.5% as of December 31, 2005, and 39% for the previous period presented, mainly due tothe interest income arising from certain mortgage loans, investments and mortgage-backed securities exempt forP.R. income tax purposes, net of expenses attributable to the exempt income. In addition, the Puerto Rico Codeprovides a dividend received deduction of 100% on dividends received from wholly-owned subsidiaries subject toincome taxation in Puerto Rico. For the years ended December 31, 2007 and 2006 and the six-month period endedDecember 31, 2005, the Group generated tax-exempt interest income of $184.7 million, $146.7 million and$71.4 million, respectively (fiscal year ended June 30, 2005 — $127.9 million). Exempt interest relates mostly tointerest earned on obligations of the United States and Puerto Rico governments and certain mortgage-backedsecurities, including securities held by the Bank’s IBE subsidiary.
F-38
NOTES TO CONSOLIDATED FINANCIAL STATEMENTS — (Continued)
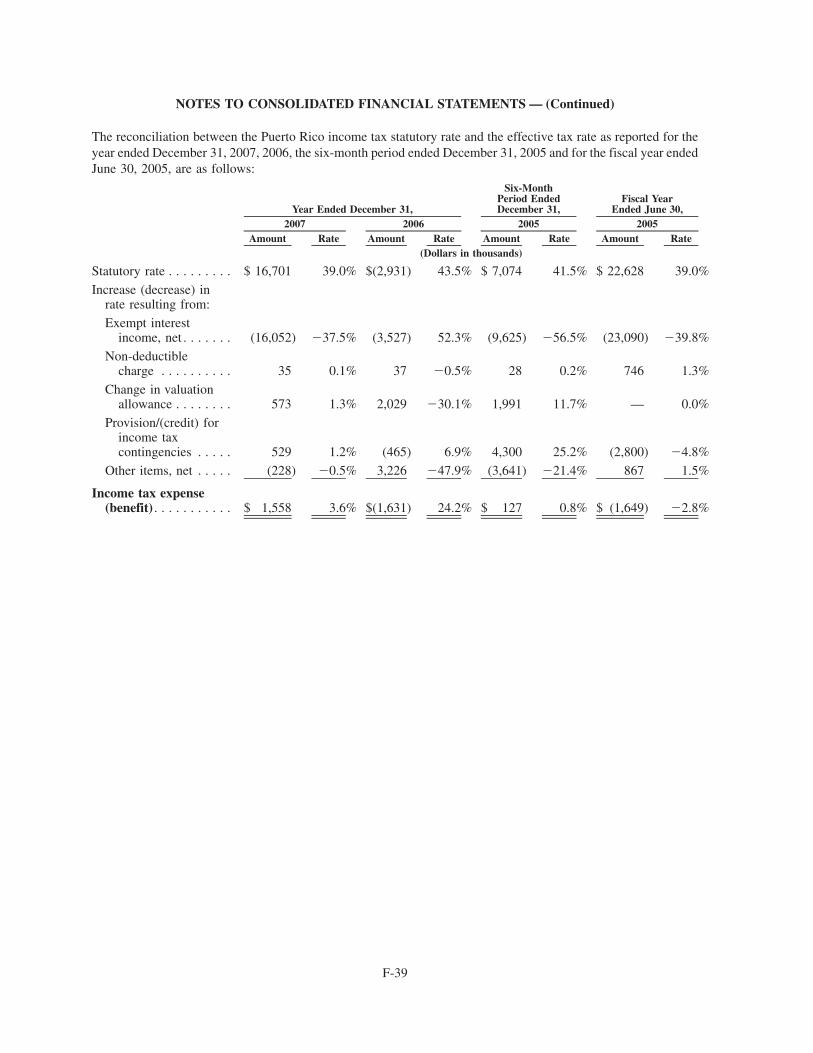
The reconciliation between the Puerto Rico income tax statutory rate and the effective tax rate as reported for theyear ended December 31, 2007, 2006, the six-month period ended December 31, 2005 and for the fiscal year endedJune 30, 2005, are as follows:
Amount Rate Amount Rate Amount Rate Amount Rate2007 2006 2005 2005
Year Ended December 31,
Six-MonthPeriod EndedDecember 31,
Fiscal YearEnded June 30,
(Dollars in thousands)
Statutory rate . . . . . . . . . $ 16,701 39.0% $(2,931) 43.5% $ 7,074 41.5% $ 22,628 39.0%
Increase (decrease) inrate resulting from:
Exempt interestincome, net . . . . . . . (16,052) �37.5% (3,527) 52.3% (9,625) �56.5% (23,090) �39.8%
Non-deductiblecharge . . . . . . . . . . 35 0.1% 37 �0.5% 28 0.2% 746 1.3%
Change in valuationallowance . . . . . . . . 573 1.3% 2,029 �30.1% 1,991 11.7% — 0.0%
Provision/(credit) forincome taxcontingencies . . . . . 529 1.2% (465) 6.9% 4,300 25.2% (2,800) �4.8%
Other items, net . . . . . (228) �0.5% 3,226 �47.9% (3,641) �21.4% 867 1.5%
Income tax expense(benefit) . . . . . . . . . . . $ 1,558 3.6% $(1,631) 24.2% $ 127 0.8% $ (1,649) �2.8%
F-39
NOTES TO CONSOLIDATED FINANCIAL STATEMENTS — (Continued)
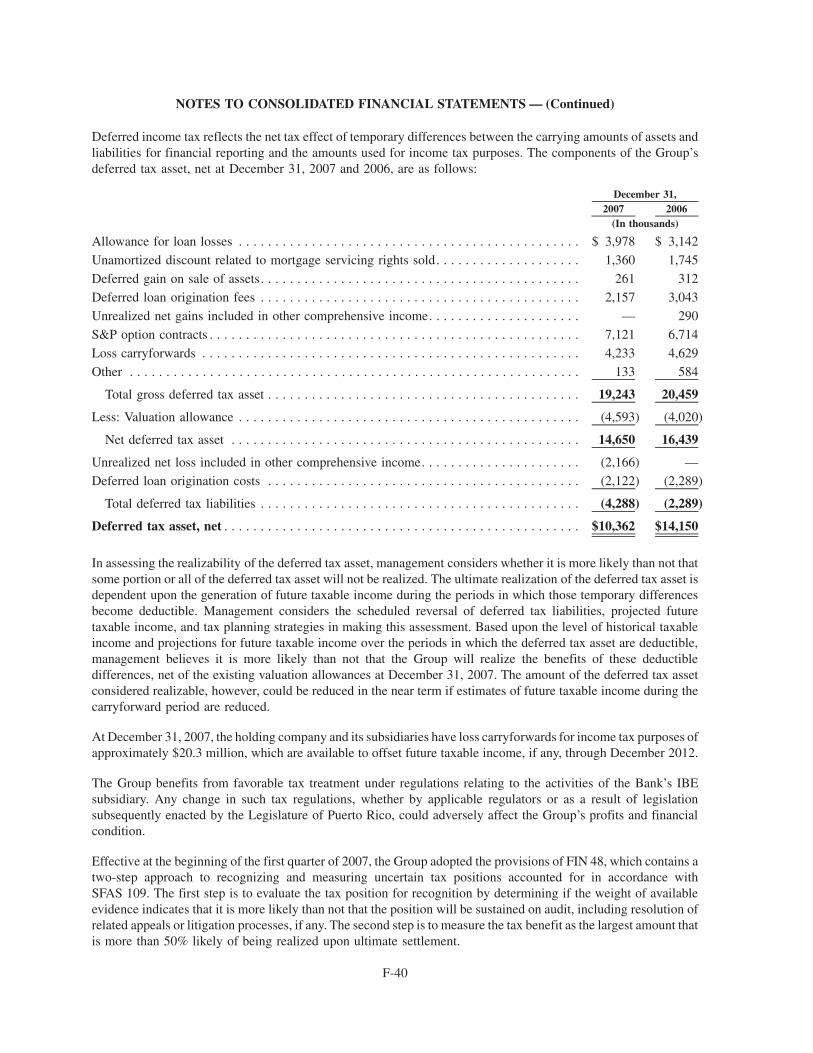
Deferred income tax reflects the net tax effect of temporary differences between the carrying amounts of assets andliabilities for financial reporting and the amounts used for income tax purposes. The components of the Group’sdeferred tax asset, net at December 31, 2007 and 2006, are as follows:
2007 2006December 31,
(In thousands)
Allowance for loan losses . . . . . . . . . . . . . . . . . . . . . . . . . . . . . . . . . . . . . . . . . . . . . . . $ 3,978 $ 3,142
Unamortized discount related to mortgage servicing rights sold. . . . . . . . . . . . . . . . . . . . 1,360 1,745
Deferred gain on sale of assets. . . . . . . . . . . . . . . . . . . . . . . . . . . . . . . . . . . . . . . . . . . . 261 312
Deferred loan origination fees . . . . . . . . . . . . . . . . . . . . . . . . . . . . . . . . . . . . . . . . . . . . 2,157 3,043
Unrealized net gains included in other comprehensive income. . . . . . . . . . . . . . . . . . . . . — 290
S&P option contracts . . . . . . . . . . . . . . . . . . . . . . . . . . . . . . . . . . . . . . . . . . . . . . . . . . . 7,121 6,714
Loss carryforwards . . . . . . . . . . . . . . . . . . . . . . . . . . . . . . . . . . . . . . . . . . . . . . . . . . . . 4,233 4,629
Other . . . . . . . . . . . . . . . . . . . . . . . . . . . . . . . . . . . . . . . . . . . . . . . . . . . . . . . . . . . . . . 133 584
Total gross deferred tax asset . . . . . . . . . . . . . . . . . . . . . . . . . . . . . . . . . . . . . . . . . . . 19,243 20,459
Less: Valuation allowance . . . . . . . . . . . . . . . . . . . . . . . . . . . . . . . . . . . . . . . . . . . . . . . (4,593) (4,020)
Net deferred tax asset . . . . . . . . . . . . . . . . . . . . . . . . . . . . . . . . . . . . . . . . . . . . . . . . 14,650 16,439
Unrealized net loss included in other comprehensive income. . . . . . . . . . . . . . . . . . . . . . (2,166) —
Deferred loan origination costs . . . . . . . . . . . . . . . . . . . . . . . . . . . . . . . . . . . . . . . . . . . (2,122) (2,289)
Total deferred tax liabilities . . . . . . . . . . . . . . . . . . . . . . . . . . . . . . . . . . . . . . . . . . . . (4,288) (2,289)
Deferred tax asset, net . . . . . . . . . . . . . . . . . . . . . . . . . . . . . . . . . . . . . . . . . . . . . . . . . $10,362 $14,150
In assessing the realizability of the deferred tax asset, management considers whether it is more likely than not thatsome portion or all of the deferred tax asset will not be realized. The ultimate realization of the deferred tax asset isdependent upon the generation of future taxable income during the periods in which those temporary differencesbecome deductible. Management considers the scheduled reversal of deferred tax liabilities, projected futuretaxable income, and tax planning strategies in making this assessment. Based upon the level of historical taxableincome and projections for future taxable income over the periods in which the deferred tax asset are deductible,management believes it is more likely than not that the Group will realize the benefits of these deductibledifferences, net of the existing valuation allowances at December 31, 2007. The amount of the deferred tax assetconsidered realizable, however, could be reduced in the near term if estimates of future taxable income during thecarryforward period are reduced.
At December 31, 2007, the holding company and its subsidiaries have loss carryforwards for income tax purposes ofapproximately $20.3 million, which are available to offset future taxable income, if any, through December 2012.
The Group benefits from favorable tax treatment under regulations relating to the activities of the Bank’s IBEsubsidiary. Any change in such tax regulations, whether by applicable regulators or as a result of legislationsubsequently enacted by the Legislature of Puerto Rico, could adversely affect the Group’s profits and financialcondition.
Effective at the beginning of the first quarter of 2007, the Group adopted the provisions of FIN 48, which contains atwo-step approach to recognizing and measuring uncertain tax positions accounted for in accordance withSFAS 109. The first step is to evaluate the tax position for recognition by determining if the weight of availableevidence indicates that it is more likely than not that the position will be sustained on audit, including resolution ofrelated appeals or litigation processes, if any. The second step is to measure the tax benefit as the largest amount thatis more than 50% likely of being realized upon ultimate settlement.
F-40
NOTES TO CONSOLIDATED FINANCIAL STATEMENTS — (Continued)
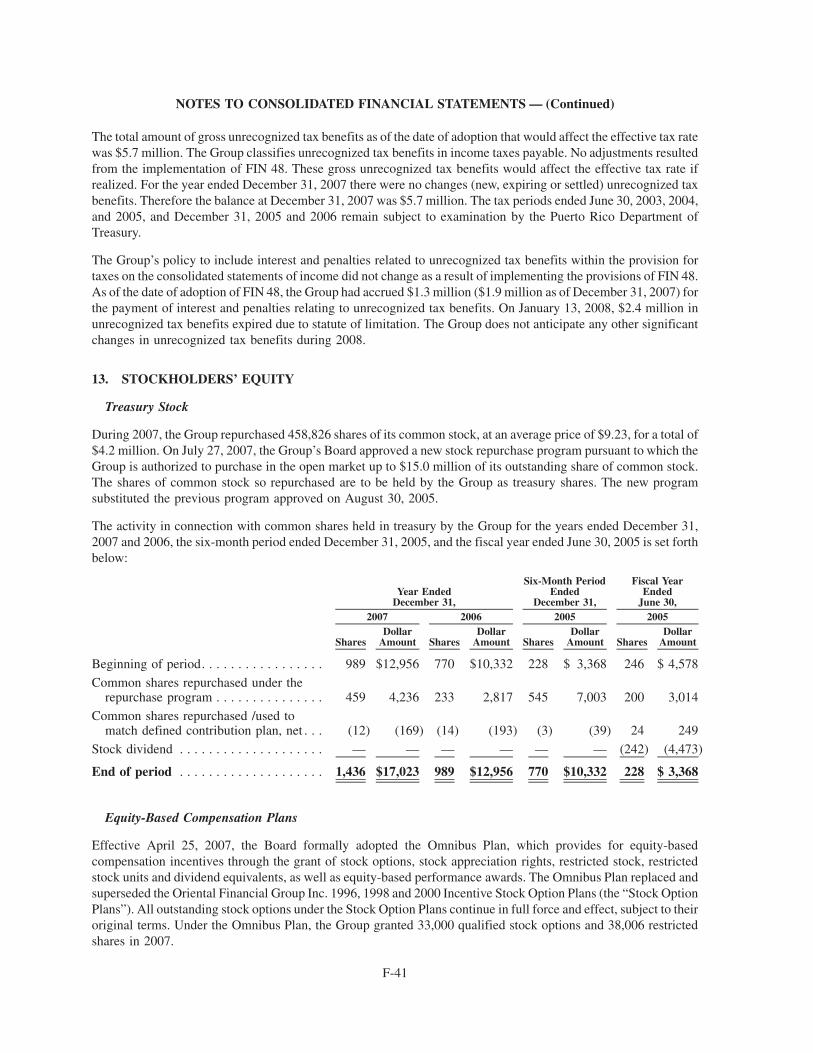
The total amount of gross unrecognized tax benefits as of the date of adoption that would affect the effective tax ratewas $5.7 million. The Group classifies unrecognized tax benefits in income taxes payable. No adjustments resultedfrom the implementation of FIN 48. These gross unrecognized tax benefits would affect the effective tax rate ifrealized. For the year ended December 31, 2007 there were no changes (new, expiring or settled) unrecognized taxbenefits. Therefore the balance at December 31, 2007 was $5.7 million. The tax periods ended June 30, 2003, 2004,and 2005, and December 31, 2005 and 2006 remain subject to examination by the Puerto Rico Department ofTreasury.
The Group’s policy to include interest and penalties related to unrecognized tax benefits within the provision fortaxes on the consolidated statements of income did not change as a result of implementing the provisions of FIN 48.As of the date of adoption of FIN 48, the Group had accrued $1.3 million ($1.9 million as of December 31, 2007) forthe payment of interest and penalties relating to unrecognized tax benefits. On January 13, 2008, $2.4 million inunrecognized tax benefits expired due to statute of limitation. The Group does not anticipate any other significantchanges in unrecognized tax benefits during 2008.
13. STOCKHOLDERS’ EQUITY
Treasury Stock
During 2007, the Group repurchased 458,826 shares of its common stock, at an average price of $9.23, for a total of$4.2 million. On July 27, 2007, the Group’s Board approved a new stock repurchase program pursuant to which theGroup is authorized to purchase in the open market up to $15.0 million of its outstanding share of common stock.The shares of common stock so repurchased are to be held by the Group as treasury shares. The new programsubstituted the previous program approved on August 30, 2005.
The activity in connection with common shares held in treasury by the Group for the years ended December 31,2007 and 2006, the six-month period ended December 31, 2005, and the fiscal year ended June 30, 2005 is set forthbelow:
SharesDollar
Amount SharesDollar
Amount SharesDollar
Amount SharesDollar
Amount
2007 2006 2005 2005
Year EndedDecember 31,
Six-Month PeriodEnded
December 31,
Fiscal YearEnded
June 30,
Beginning of period. . . . . . . . . . . . . . . . . 989 $12,956 770 $10,332 228 $ 3,368 246 $ 4,578
Common shares repurchased under therepurchase program . . . . . . . . . . . . . . . 459 4,236 233 2,817 545 7,003 200 3,014
Common shares repurchased /used tomatch defined contribution plan, net . . . (12) (169) (14) (193) (3) (39) 24 249
Stock dividend . . . . . . . . . . . . . . . . . . . . — — — — — — (242) (4,473)
End of period . . . . . . . . . . . . . . . . . . . . 1,436 $17,023 989 $12,956 770 $10,332 228 $ 3,368
Equity-Based Compensation Plans
Effective April 25, 2007, the Board formally adopted the Omnibus Plan, which provides for equity-basedcompensation incentives through the grant of stock options, stock appreciation rights, restricted stock, restrictedstock units and dividend equivalents, as well as equity-based performance awards. The Omnibus Plan replaced andsuperseded the Oriental Financial Group Inc. 1996, 1998 and 2000 Incentive Stock Option Plans (the “Stock OptionPlans”). All outstanding stock options under the Stock Option Plans continue in full force and effect, subject to theiroriginal terms. Under the Omnibus Plan, the Group granted 33,000 qualified stock options and 38,006 restrictedshares in 2007.
F-41
NOTES TO CONSOLIDATED FINANCIAL STATEMENTS — (Continued)
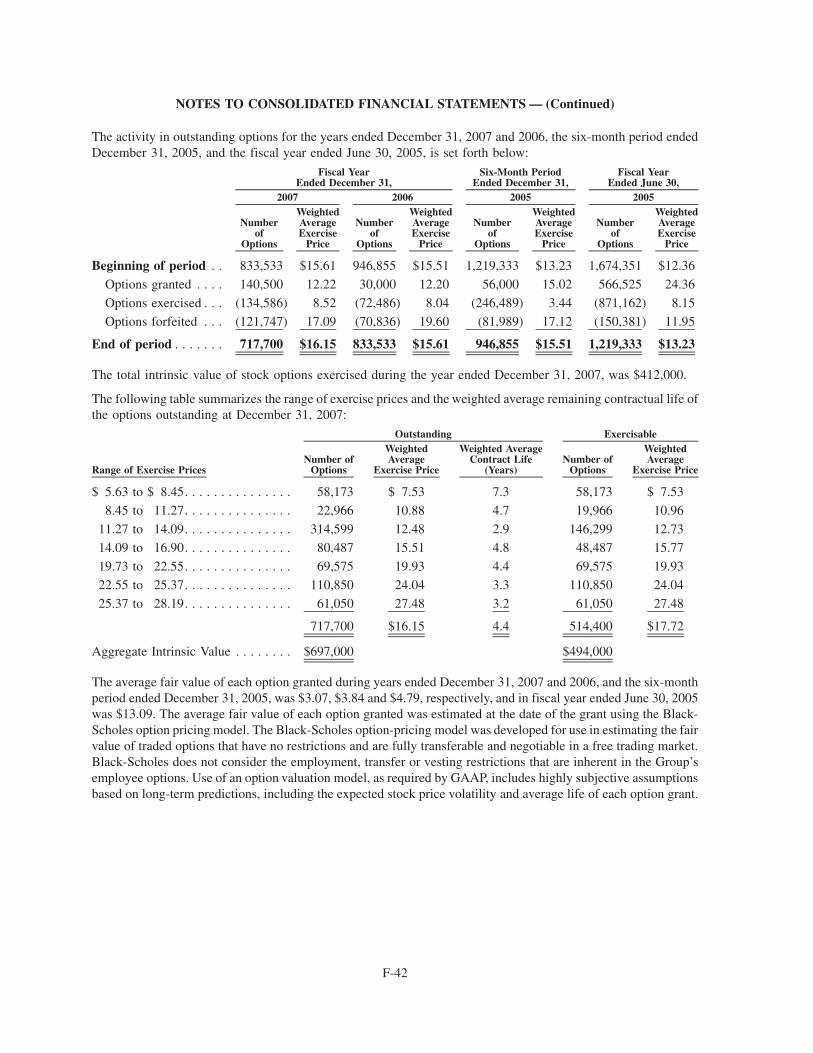
The activity in outstanding options for the years ended December 31, 2007 and 2006, the six-month period endedDecember 31, 2005, and the fiscal year ended June 30, 2005, is set forth below:
Numberof
Options
WeightedAverageExercise
Price
Numberof
Options
WeightedAverageExercise
Price
Numberof
Options
WeightedAverageExercise
Price
Numberof
Options
WeightedAverageExercise
Price
2007 2006 2005 2005
Six-Month PeriodEnded December 31,
Fiscal YearEnded December 31,
Fiscal YearEnded June 30,
Beginning of period . . 833,533 $15.61 946,855 $15.51 1,219,333 $13.23 1,674,351 $12.36
Options granted . . . . 140,500 12.22 30,000 12.20 56,000 15.02 566,525 24.36
Options exercised . . . (134,586) 8.52 (72,486) 8.04 (246,489) 3.44 (871,162) 8.15
Options forfeited . . . (121,747) 17.09 (70,836) 19.60 (81,989) 17.12 (150,381) 11.95
End of period . . . . . . . 717,700 $16.15 833,533 $15.61 946,855 $15.51 1,219,333 $13.23
The total intrinsic value of stock options exercised during the year ended December 31, 2007, was $412,000.
The following table summarizes the range of exercise prices and the weighted average remaining contractual life ofthe options outstanding at December 31, 2007:
Range of Exercise PricesNumber of
Options
WeightedAverage
Exercise Price
Weighted AverageContract Life
(Years)Number of
Options
WeightedAverage
Exercise Price
Outstanding Exercisable
$ 5.63 to $ 8.45. . . . . . . . . . . . . . . 58,173 $ 7.53 7.3 58,173 $ 7.53
8.45 to 11.27. . . . . . . . . . . . . . . 22,966 10.88 4.7 19,966 10.96
11.27 to 14.09. . . . . . . . . . . . . . . 314,599 12.48 2.9 146,299 12.73
14.09 to 16.90. . . . . . . . . . . . . . . 80,487 15.51 4.8 48,487 15.77
19.73 to 22.55. . . . . . . . . . . . . . . 69,575 19.93 4.4 69,575 19.93
22.55 to 25.37. . . . . . . . . . . . . . . 110,850 24.04 3.3 110,850 24.04
25.37 to 28.19. . . . . . . . . . . . . . . 61,050 27.48 3.2 61,050 27.48
717,700 $16.15 4.4 514,400 $17.72
Aggregate Intrinsic Value . . . . . . . . $697,000 $494,000
The average fair value of each option granted during years ended December 31, 2007 and 2006, and the six-monthperiod ended December 31, 2005, was $3.07, $3.84 and $4.79, respectively, and in fiscal year ended June 30, 2005was $13.09. The average fair value of each option granted was estimated at the date of the grant using the Black-Scholes option pricing model. The Black-Scholes option-pricing model was developed for use in estimating the fairvalue of traded options that have no restrictions and are fully transferable and negotiable in a free trading market.Black-Scholes does not consider the employment, transfer or vesting restrictions that are inherent in the Group’semployee options. Use of an option valuation model, as required by GAAP, includes highly subjective assumptionsbased on long-term predictions, including the expected stock price volatility and average life of each option grant.
F-42
NOTES TO CONSOLIDATED FINANCIAL STATEMENTS — (Continued)
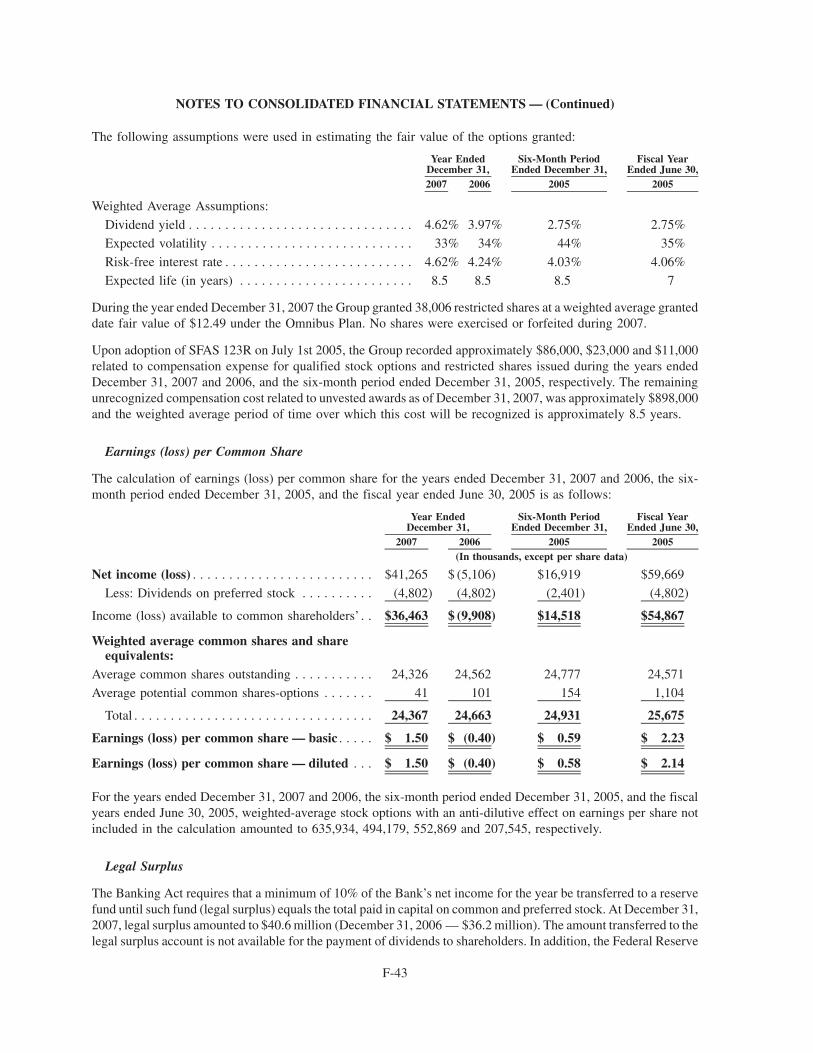
The following assumptions were used in estimating the fair value of the options granted:
2007 2006 2005 2005
Year EndedDecember 31,
Six-Month PeriodEnded December 31,
Fiscal YearEnded June 30,
Weighted Average Assumptions:
Dividend yield . . . . . . . . . . . . . . . . . . . . . . . . . . . . . . . 4.62% 3.97% 2.75% 2.75%
Expected volatility . . . . . . . . . . . . . . . . . . . . . . . . . . . . 33% 34% 44% 35%
Risk-free interest rate . . . . . . . . . . . . . . . . . . . . . . . . . . 4.62% 4.24% 4.03% 4.06%
Expected life (in years) . . . . . . . . . . . . . . . . . . . . . . . . 8.5 8.5 8.5 7
During the year ended December 31, 2007 the Group granted 38,006 restricted shares at a weighted average granteddate fair value of $12.49 under the Omnibus Plan. No shares were exercised or forfeited during 2007.
Upon adoption of SFAS 123R on July 1st 2005, the Group recorded approximately $86,000, $23,000 and $11,000related to compensation expense for qualified stock options and restricted shares issued during the years endedDecember 31, 2007 and 2006, and the six-month period ended December 31, 2005, respectively. The remainingunrecognized compensation cost related to unvested awards as of December 31, 2007, was approximately $898,000and the weighted average period of time over which this cost will be recognized is approximately 8.5 years.
Earnings (loss) per Common Share
The calculation of earnings (loss) per common share for the years ended December 31, 2007 and 2006, the six-month period ended December 31, 2005, and the fiscal year ended June 30, 2005 is as follows:
2007 2006 2005 2005
Year EndedDecember 31,
Six-Month PeriodEnded December 31,
Fiscal YearEnded June 30,
(In thousands, except per share data)
Net income (loss) . . . . . . . . . . . . . . . . . . . . . . . . . $41,265 $ (5,106) $16,919 $59,669
Less: Dividends on preferred stock . . . . . . . . . . (4,802) (4,802) (2,401) (4,802)
Income (loss) available to common shareholders’ . . $36,463 $ (9,908) $14,518 $54,867
Weighted average common shares and shareequivalents:
Average common shares outstanding . . . . . . . . . . . 24,326 24,562 24,777 24,571
Average potential common shares-options . . . . . . . 41 101 154 1,104
Total . . . . . . . . . . . . . . . . . . . . . . . . . . . . . . . . . 24,367 24,663 24,931 25,675
Earnings (loss) per common share — basic . . . . . $ 1.50 $ (0.40) $ 0.59 $ 2.23
Earnings (loss) per common share — diluted . . . $ 1.50 $ (0.40) $ 0.58 $ 2.14
For the years ended December 31, 2007 and 2006, the six-month period ended December 31, 2005, and the fiscalyears ended June 30, 2005, weighted-average stock options with an anti-dilutive effect on earnings per share notincluded in the calculation amounted to 635,934, 494,179, 552,869 and 207,545, respectively.
Legal Surplus
The Banking Act requires that a minimum of 10% of the Bank’s net income for the year be transferred to a reservefund until such fund (legal surplus) equals the total paid in capital on common and preferred stock. At December 31,2007, legal surplus amounted to $40.6 million (December 31, 2006 — $36.2 million). The amount transferred to thelegal surplus account is not available for the payment of dividends to shareholders. In addition, the Federal Reserve
F-43
NOTES TO CONSOLIDATED FINANCIAL STATEMENTS — (Continued)
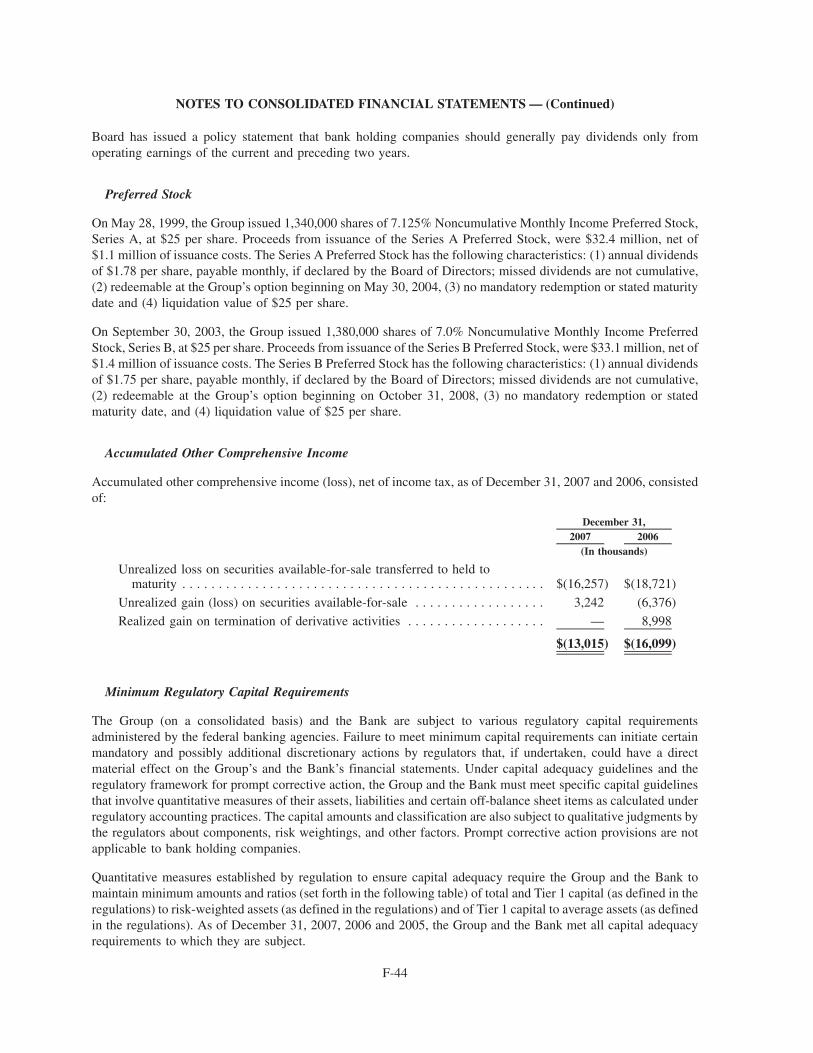
Board has issued a policy statement that bank holding companies should generally pay dividends only fromoperating earnings of the current and preceding two years.
Preferred Stock
On May 28, 1999, the Group issued 1,340,000 shares of 7.125% Noncumulative Monthly Income Preferred Stock,Series A, at $25 per share. Proceeds from issuance of the Series A Preferred Stock, were $32.4 million, net of$1.1 million of issuance costs. The Series A Preferred Stock has the following characteristics: (1) annual dividendsof $1.78 per share, payable monthly, if declared by the Board of Directors; missed dividends are not cumulative,(2) redeemable at the Group’s option beginning on May 30, 2004, (3) no mandatory redemption or stated maturitydate and (4) liquidation value of $25 per share.
On September 30, 2003, the Group issued 1,380,000 shares of 7.0% Noncumulative Monthly Income PreferredStock, Series B, at $25 per share. Proceeds from issuance of the Series B Preferred Stock, were $33.1 million, net of$1.4 million of issuance costs. The Series B Preferred Stock has the following characteristics: (1) annual dividendsof $1.75 per share, payable monthly, if declared by the Board of Directors; missed dividends are not cumulative,(2) redeemable at the Group’s option beginning on October 31, 2008, (3) no mandatory redemption or statedmaturity date, and (4) liquidation value of $25 per share.
Accumulated Other Comprehensive Income
Accumulated other comprehensive income (loss), net of income tax, as of December 31, 2007 and 2006, consistedof:
2007 2006December 31,
(In thousands)
Unrealized loss on securities available-for-sale transferred to held tomaturity . . . . . . . . . . . . . . . . . . . . . . . . . . . . . . . . . . . . . . . . . . . . . . . . . . $(16,257) $(18,721)
Unrealized gain (loss) on securities available-for-sale . . . . . . . . . . . . . . . . . . 3,242 (6,376)
Realized gain on termination of derivative activities . . . . . . . . . . . . . . . . . . . — 8,998
$(13,015) $(16,099)
Minimum Regulatory Capital Requirements
The Group (on a consolidated basis) and the Bank are subject to various regulatory capital requirementsadministered by the federal banking agencies. Failure to meet minimum capital requirements can initiate certainmandatory and possibly additional discretionary actions by regulators that, if undertaken, could have a directmaterial effect on the Group’s and the Bank’s financial statements. Under capital adequacy guidelines and theregulatory framework for prompt corrective action, the Group and the Bank must meet specific capital guidelinesthat involve quantitative measures of their assets, liabilities and certain off-balance sheet items as calculated underregulatory accounting practices. The capital amounts and classification are also subject to qualitative judgments bythe regulators about components, risk weightings, and other factors. Prompt corrective action provisions are notapplicable to bank holding companies.
Quantitative measures established by regulation to ensure capital adequacy require the Group and the Bank tomaintain minimum amounts and ratios (set forth in the following table) of total and Tier 1 capital (as defined in theregulations) to risk-weighted assets (as defined in the regulations) and of Tier 1 capital to average assets (as definedin the regulations). As of December 31, 2007, 2006 and 2005, the Group and the Bank met all capital adequacyrequirements to which they are subject.
F-44
NOTES TO CONSOLIDATED FINANCIAL STATEMENTS — (Continued)
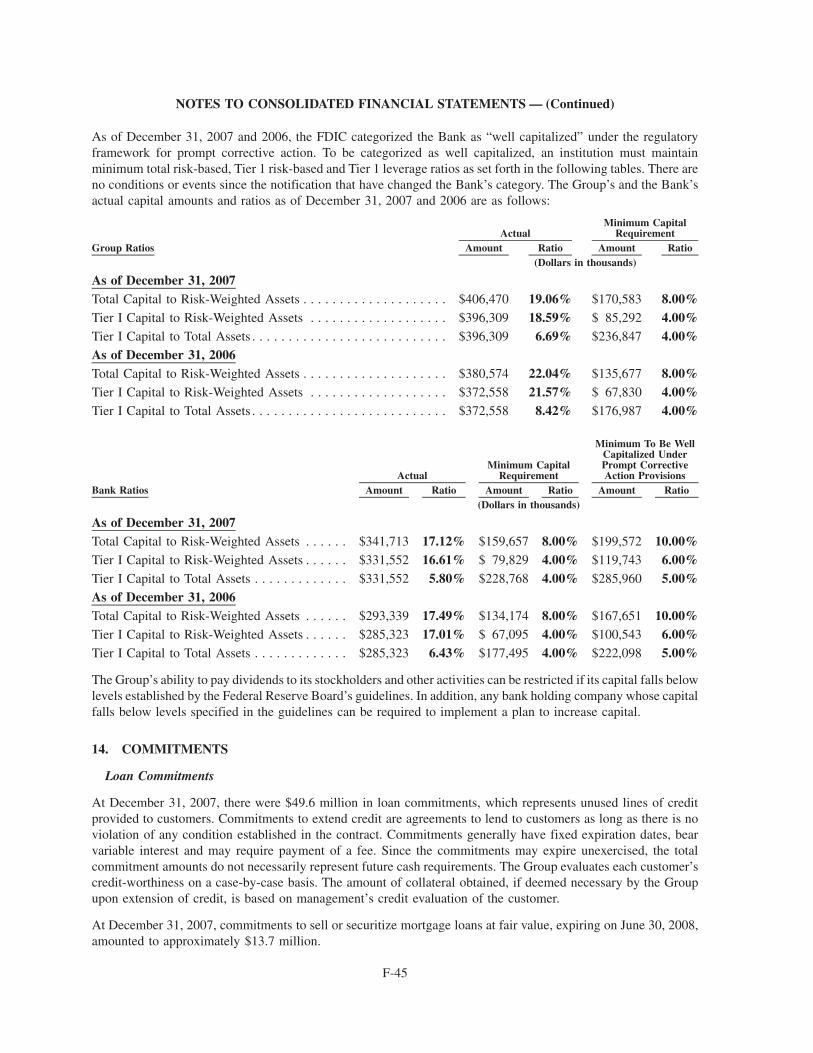
As of December 31, 2007 and 2006, the FDIC categorized the Bank as “well capitalized” under the regulatoryframework for prompt corrective action. To be categorized as well capitalized, an institution must maintainminimum total risk-based, Tier 1 risk-based and Tier 1 leverage ratios as set forth in the following tables. There areno conditions or events since the notification that have changed the Bank’s category. The Group’s and the Bank’sactual capital amounts and ratios as of December 31, 2007 and 2006 are as follows:
Group Ratios Amount Ratio Amount RatioActual
Minimum CapitalRequirement
(Dollars in thousands)
As of December 31, 2007Total Capital to Risk-Weighted Assets . . . . . . . . . . . . . . . . . . . . $406,470 19.06% $170,583 8.00%Tier I Capital to Risk-Weighted Assets . . . . . . . . . . . . . . . . . . . $396,309 18.59% $ 85,292 4.00%Tier I Capital to Total Assets . . . . . . . . . . . . . . . . . . . . . . . . . . . $396,309 6.69% $236,847 4.00%As of December 31, 2006Total Capital to Risk-Weighted Assets . . . . . . . . . . . . . . . . . . . . $380,574 22.04% $135,677 8.00%Tier I Capital to Risk-Weighted Assets . . . . . . . . . . . . . . . . . . . $372,558 21.57% $ 67,830 4.00%Tier I Capital to Total Assets . . . . . . . . . . . . . . . . . . . . . . . . . . . $372,558 8.42% $176,987 4.00%
Bank Ratios Amount Ratio Amount Ratio Amount RatioActual
Minimum CapitalRequirement
Minimum To Be WellCapitalized UnderPrompt CorrectiveAction Provisions
(Dollars in thousands)
As of December 31, 2007Total Capital to Risk-Weighted Assets . . . . . . $341,713 17.12% $159,657 8.00% $199,572 10.00%Tier I Capital to Risk-Weighted Assets . . . . . . $331,552 16.61% $ 79,829 4.00% $119,743 6.00%Tier I Capital to Total Assets . . . . . . . . . . . . . $331,552 5.80% $228,768 4.00% $285,960 5.00%As of December 31, 2006Total Capital to Risk-Weighted Assets . . . . . . $293,339 17.49% $134,174 8.00% $167,651 10.00%Tier I Capital to Risk-Weighted Assets . . . . . . $285,323 17.01% $ 67,095 4.00% $100,543 6.00%Tier I Capital to Total Assets . . . . . . . . . . . . . $285,323 6.43% $177,495 4.00% $222,098 5.00%
The Group’s ability to pay dividends to its stockholders and other activities can be restricted if its capital falls belowlevels established by the Federal Reserve Board’s guidelines. In addition, any bank holding company whose capitalfalls below levels specified in the guidelines can be required to implement a plan to increase capital.
14. COMMITMENTS
Loan Commitments
At December 31, 2007, there were $49.6 million in loan commitments, which represents unused lines of creditprovided to customers. Commitments to extend credit are agreements to lend to customers as long as there is noviolation of any condition established in the contract. Commitments generally have fixed expiration dates, bearvariable interest and may require payment of a fee. Since the commitments may expire unexercised, the totalcommitment amounts do not necessarily represent future cash requirements. The Group evaluates each customer’scredit-worthiness on a case-by-case basis. The amount of collateral obtained, if deemed necessary by the Groupupon extension of credit, is based on management’s credit evaluation of the customer.
At December 31, 2007, commitments to sell or securitize mortgage loans at fair value, expiring on June 30, 2008,amounted to approximately $13.7 million.
F-45
NOTES TO CONSOLIDATED FINANCIAL STATEMENTS — (Continued)
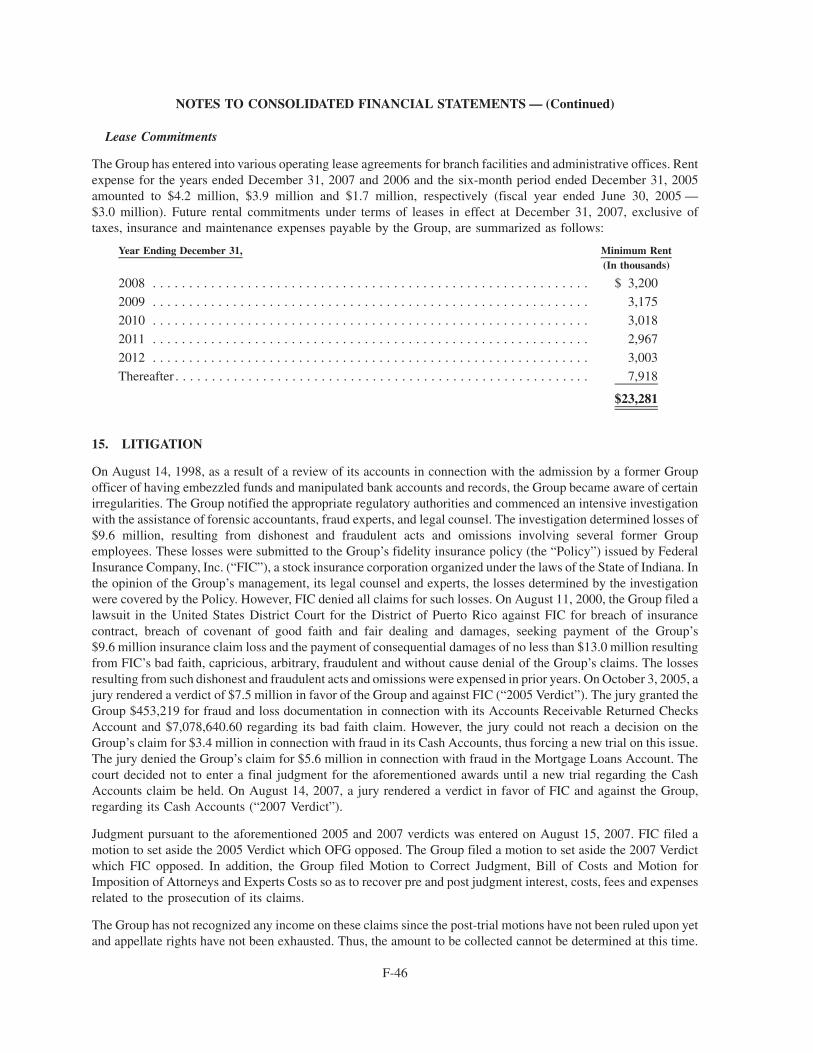
Lease Commitments
The Group has entered into various operating lease agreements for branch facilities and administrative offices. Rentexpense for the years ended December 31, 2007 and 2006 and the six-month period ended December 31, 2005amounted to $4.2 million, $3.9 million and $1.7 million, respectively (fiscal year ended June 30, 2005 —$3.0 million). Future rental commitments under terms of leases in effect at December 31, 2007, exclusive oftaxes, insurance and maintenance expenses payable by the Group, are summarized as follows:
Year Ending December 31, Minimum Rent(In thousands)
2008 . . . . . . . . . . . . . . . . . . . . . . . . . . . . . . . . . . . . . . . . . . . . . . . . . . . . . . . . . . . . $ 3,200
2009 . . . . . . . . . . . . . . . . . . . . . . . . . . . . . . . . . . . . . . . . . . . . . . . . . . . . . . . . . . . . 3,175
2010 . . . . . . . . . . . . . . . . . . . . . . . . . . . . . . . . . . . . . . . . . . . . . . . . . . . . . . . . . . . . 3,018
2011 . . . . . . . . . . . . . . . . . . . . . . . . . . . . . . . . . . . . . . . . . . . . . . . . . . . . . . . . . . . . 2,967
2012 . . . . . . . . . . . . . . . . . . . . . . . . . . . . . . . . . . . . . . . . . . . . . . . . . . . . . . . . . . . . 3,003
Thereafter . . . . . . . . . . . . . . . . . . . . . . . . . . . . . . . . . . . . . . . . . . . . . . . . . . . . . . . . . 7,918
$23,281
15. LITIGATION
On August 14, 1998, as a result of a review of its accounts in connection with the admission by a former Groupofficer of having embezzled funds and manipulated bank accounts and records, the Group became aware of certainirregularities. The Group notified the appropriate regulatory authorities and commenced an intensive investigationwith the assistance of forensic accountants, fraud experts, and legal counsel. The investigation determined losses of$9.6 million, resulting from dishonest and fraudulent acts and omissions involving several former Groupemployees. These losses were submitted to the Group’s fidelity insurance policy (the “Policy”) issued by FederalInsurance Company, Inc. (“FIC”), a stock insurance corporation organized under the laws of the State of Indiana. Inthe opinion of the Group’s management, its legal counsel and experts, the losses determined by the investigationwere covered by the Policy. However, FIC denied all claims for such losses. On August 11, 2000, the Group filed alawsuit in the United States District Court for the District of Puerto Rico against FIC for breach of insurancecontract, breach of covenant of good faith and fair dealing and damages, seeking payment of the Group’s$9.6 million insurance claim loss and the payment of consequential damages of no less than $13.0 million resultingfrom FIC’s bad faith, capricious, arbitrary, fraudulent and without cause denial of the Group’s claims. The lossesresulting from such dishonest and fraudulent acts and omissions were expensed in prior years. On October 3, 2005, ajury rendered a verdict of $7.5 million in favor of the Group and against FIC (“2005 Verdict”). The jury granted theGroup $453,219 for fraud and loss documentation in connection with its Accounts Receivable Returned ChecksAccount and $7,078,640.60 regarding its bad faith claim. However, the jury could not reach a decision on theGroup’s claim for $3.4 million in connection with fraud in its Cash Accounts, thus forcing a new trial on this issue.The jury denied the Group’s claim for $5.6 million in connection with fraud in the Mortgage Loans Account. Thecourt decided not to enter a final judgment for the aforementioned awards until a new trial regarding the CashAccounts claim be held. On August 14, 2007, a jury rendered a verdict in favor of FIC and against the Group,regarding its Cash Accounts (“2007 Verdict”).
Judgment pursuant to the aforementioned 2005 and 2007 verdicts was entered on August 15, 2007. FIC filed amotion to set aside the 2005 Verdict which OFG opposed. The Group filed a motion to set aside the 2007 Verdictwhich FIC opposed. In addition, the Group filed Motion to Correct Judgment, Bill of Costs and Motion forImposition of Attorneys and Experts Costs so as to recover pre and post judgment interest, costs, fees and expensesrelated to the prosecution of its claims.
The Group has not recognized any income on these claims since the post-trial motions have not been ruled upon yetand appellate rights have not been exhausted. Thus, the amount to be collected cannot be determined at this time.
F-46
NOTES TO CONSOLIDATED FINANCIAL STATEMENTS — (Continued)

In addition, the Group and its subsidiaries are defendants in a number of legal proceedings incidental to theirbusiness. The Group is vigorously contesting such claims. Based upon a review by legal counsel and thedevelopment of these matters to date, Management is of the opinion that the ultimate aggregate liability, ifany, resulting from these claims will not have a material adverse effect on the Group’s financial condition or resultsof operations.
16. FAIR VALUE OF FINANCIAL INSTRUMENTS
The reported fair values of financial instruments are based on either quoted market prices for identical orcomparable instruments or estimated based on assumptions concerning the amount and timing of estimated futurecash flows and assumed discount rates reflecting varying degrees of risk. Accordingly, the fair values may notrepresent the actual values of the financial instruments that could have been realized as of year-end or that will berealized in the future.
The fair value estimates are made at a point in time based on the type of financial instruments and related relevantmarket information. Quoted market prices are used for financial instruments in which an active market exists.However, because no market exists for a portion of the Group’s financial instruments, fair value estimates are basedon judgments regarding the amount and timing of estimated future cash flows, assumed discount rates reflectingvarying degrees of risk, and other factors. Because of the uncertainty inherent in estimating fair values, theseestimates may vary from the values that would have been used had a ready market for these financial instrumentsexisted.
These estimates are subjective in nature and involve uncertainties and matters of significant judgment and,therefore, cannot be determined with precision. Changes in assumptions could affect these fair value estimates. Thefair value estimates do not take into consideration the value of future business and the value of assets and liabilitiesthat are not financial instruments. Other significant tangible and intangible assets that are not considered financialinstruments are the value of long-term customer relationships of the retail deposits, and premises and equipment.
F-47
NOTES TO CONSOLIDATED FINANCIAL STATEMENTS — (Continued)
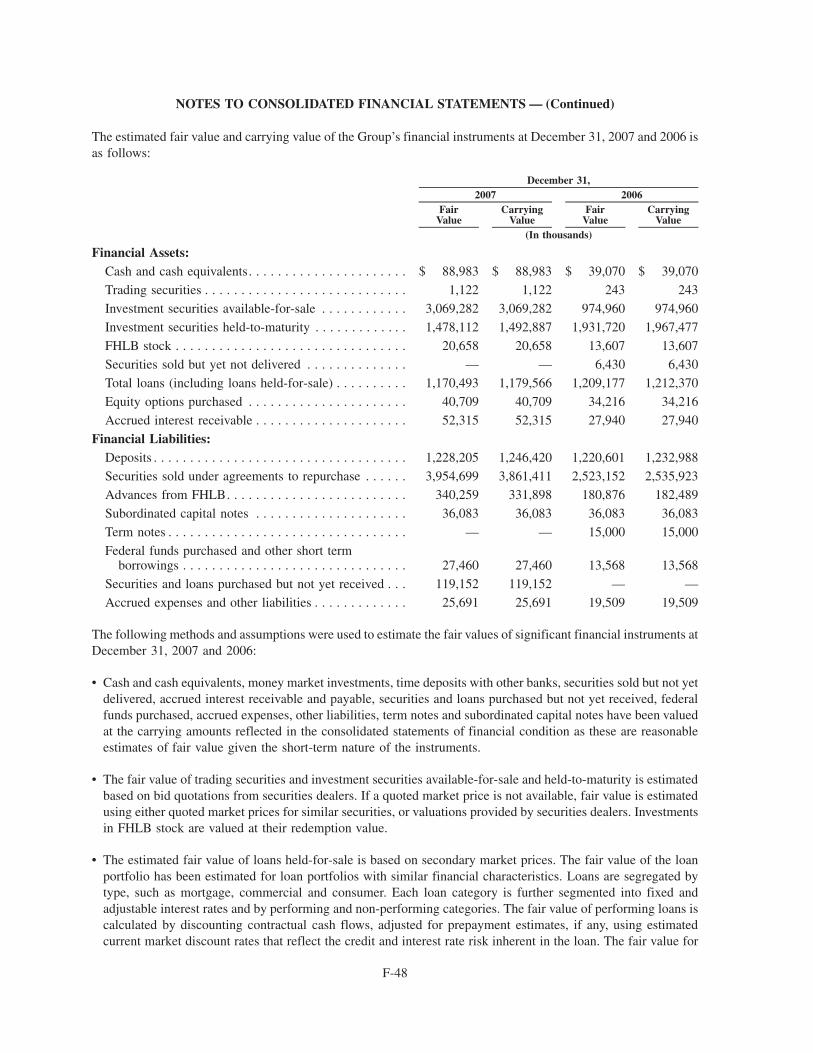
The estimated fair value and carrying value of the Group’s financial instruments at December 31, 2007 and 2006 isas follows:
FairValue
CarryingValue
FairValue
CarryingValue
2007 2006December 31,
(In thousands)
Financial Assets:Cash and cash equivalents. . . . . . . . . . . . . . . . . . . . . . $ 88,983 $ 88,983 $ 39,070 $ 39,070
Trading securities . . . . . . . . . . . . . . . . . . . . . . . . . . . . 1,122 1,122 243 243
Investment securities available-for-sale . . . . . . . . . . . . 3,069,282 3,069,282 974,960 974,960
Investment securities held-to-maturity . . . . . . . . . . . . . 1,478,112 1,492,887 1,931,720 1,967,477
FHLB stock . . . . . . . . . . . . . . . . . . . . . . . . . . . . . . . . 20,658 20,658 13,607 13,607
Securities sold but yet not delivered . . . . . . . . . . . . . . — — 6,430 6,430
Total loans (including loans held-for-sale) . . . . . . . . . . 1,170,493 1,179,566 1,209,177 1,212,370
Equity options purchased . . . . . . . . . . . . . . . . . . . . . . 40,709 40,709 34,216 34,216
Accrued interest receivable . . . . . . . . . . . . . . . . . . . . . 52,315 52,315 27,940 27,940
Financial Liabilities:Deposits . . . . . . . . . . . . . . . . . . . . . . . . . . . . . . . . . . . 1,228,205 1,246,420 1,220,601 1,232,988
Securities sold under agreements to repurchase . . . . . . 3,954,699 3,861,411 2,523,152 2,535,923
Advances from FHLB. . . . . . . . . . . . . . . . . . . . . . . . . 340,259 331,898 180,876 182,489
Subordinated capital notes . . . . . . . . . . . . . . . . . . . . . 36,083 36,083 36,083 36,083
Term notes . . . . . . . . . . . . . . . . . . . . . . . . . . . . . . . . . — — 15,000 15,000
Federal funds purchased and other short termborrowings . . . . . . . . . . . . . . . . . . . . . . . . . . . . . . . 27,460 27,460 13,568 13,568
Securities and loans purchased but not yet received . . . 119,152 119,152 — —
Accrued expenses and other liabilities . . . . . . . . . . . . . 25,691 25,691 19,509 19,509
The following methods and assumptions were used to estimate the fair values of significant financial instruments atDecember 31, 2007 and 2006:
• Cash and cash equivalents, money market investments, time deposits with other banks, securities sold but not yetdelivered, accrued interest receivable and payable, securities and loans purchased but not yet received, federalfunds purchased, accrued expenses, other liabilities, term notes and subordinated capital notes have been valuedat the carrying amounts reflected in the consolidated statements of financial condition as these are reasonableestimates of fair value given the short-term nature of the instruments.
• The fair value of trading securities and investment securities available-for-sale and held-to-maturity is estimatedbased on bid quotations from securities dealers. If a quoted market price is not available, fair value is estimatedusing either quoted market prices for similar securities, or valuations provided by securities dealers. Investmentsin FHLB stock are valued at their redemption value.
• The estimated fair value of loans held-for-sale is based on secondary market prices. The fair value of the loanportfolio has been estimated for loan portfolios with similar financial characteristics. Loans are segregated bytype, such as mortgage, commercial and consumer. Each loan category is further segmented into fixed andadjustable interest rates and by performing and non-performing categories. The fair value of performing loans iscalculated by discounting contractual cash flows, adjusted for prepayment estimates, if any, using estimatedcurrent market discount rates that reflect the credit and interest rate risk inherent in the loan. The fair value for
F-48
NOTES TO CONSOLIDATED FINANCIAL STATEMENTS — (Continued)
significant non-performing loans is based on specific evaluations of discounted expected future cash flows fromthe loans or its collateral using current appraisals and market rates.
• The fair value of demand deposits and savings accounts is the amount payable on demand at the reporting date.The fair value of fixed-maturity certificates of deposit is based on the discounted value of the contractual cashflows, using estimated current market discount rates for deposits of similar remaining maturities.
• For short-term borrowings, the carrying amount is considered a reasonable estimate of fair value. The fair value oflong-term borrowings is based on the discounted value of the contractual cash flows, using current estimatedmarket discount rates for borrowings with similar terms and remaining maturities and put dates.
• The fair value of interest rate swaps and equity index option contracts were estimated by management based onthe present value of expected future cash flows using discount rates of the swap yield curve. These fair valuesrepresent the estimated amount the Group would receive or pay to terminate the contracts taking into account thecurrent interest rates and the current creditworthiness of the counterparties.
• The fair value of commitments to extend credit and unused lines of credit is based on fees currently charged toenter into similar agreements, taking into account the remaining terms of the agreements and the counterparties’credit standings.
17. SEGMENT REPORTING
The Group segregates its businesses into the following major reportable segments of business: Banking, Treasuryand Financial Services. Management established the reportable segments based on the internal reporting used toevaluate performance and to assess where to allocate resources. Other factors such as the Group’s organization,nature of its products, distribution channels and economic characteristics of the products were also considered in thedetermination of the reportable segments. The Group measures the performance of these reportable segments basedon pre-established goals of different financial parameters such as net income, net interest income, loan production,and fees generated.
Banking includes the Bank’s branches and mortgage banking, with traditional banking products such as depositsand mortgage, commercial and consumer loans. The mortgage banking activities are carried out by the Bank’smortgage banking division and Oriental Mortgage Corporation, the Bank’s mortgage lending subsidiary, whoseprincipal activity is to originate and purchase mortgage loans for the Group’s own portfolio. The Group originatesFederal Housing Administration (“FHA”)-insured and Veterans Administration (“VA”)-guaranteed mortgages thatare primarily securitized for issuance of Government National Mortgage Association (“GNMA”) mortgage-backedsecurities which can be resold to individual or institutional investors in the secondary market. Conventional loansthat meet the underwriting requirements for sale or exchange under standard Federal National Mortgage Asso-ciation (the “FNMA”) or the Federal Home Loan Mortgage Corporation (the “FHLMC”) programs are referred toas conforming mortgage loans and are also securitized for issuance of FNMA or FHLMC mortgage-backedsecurities. Through December 2005, the Group outsourced the securitization of GNMA, FNMA and FHLMCmortgage-backed securities. In 2006 and after FNMA’s approval for the Group to sell FNMA-conformingconventional mortgage loans directly in the secondary market, the Group became an approved seller of FNMA,as well as FHLMC, mortgage loans for issuance of FNMA and FHLMC mortgage-backed securities. The Group isalso an approved issuer of GNMA mortgage-backed securities. The Group outsourced to a third party the sub-servicing of the GNMA, FNMA and FHLMC pools that it issues and its mortgage loan portfolio.
Treasury activities encompass all of the Group’s treasury-related functions and investment banking business. TheGroup’s investment portfolio consists of mortgage-backed securities, collateralized mortgage obligations, bothnon-agency and those issued by U.S. Government agencies, U.S. Treasury notes, U.S. Government agency bonds,P.R. Government obligations, structured credit investments and money market instruments. Mortgage-backedsecurities, the largest component, consist principally of pools of residential mortgage loans that are made toconsumers and then resold in the form of certificates in the secondary market, the payment of interest and principalof which is guaranteed by GNMA, FNMA or FHLMC.
F-49
NOTES TO CONSOLIDATED FINANCIAL STATEMENTS — (Continued)
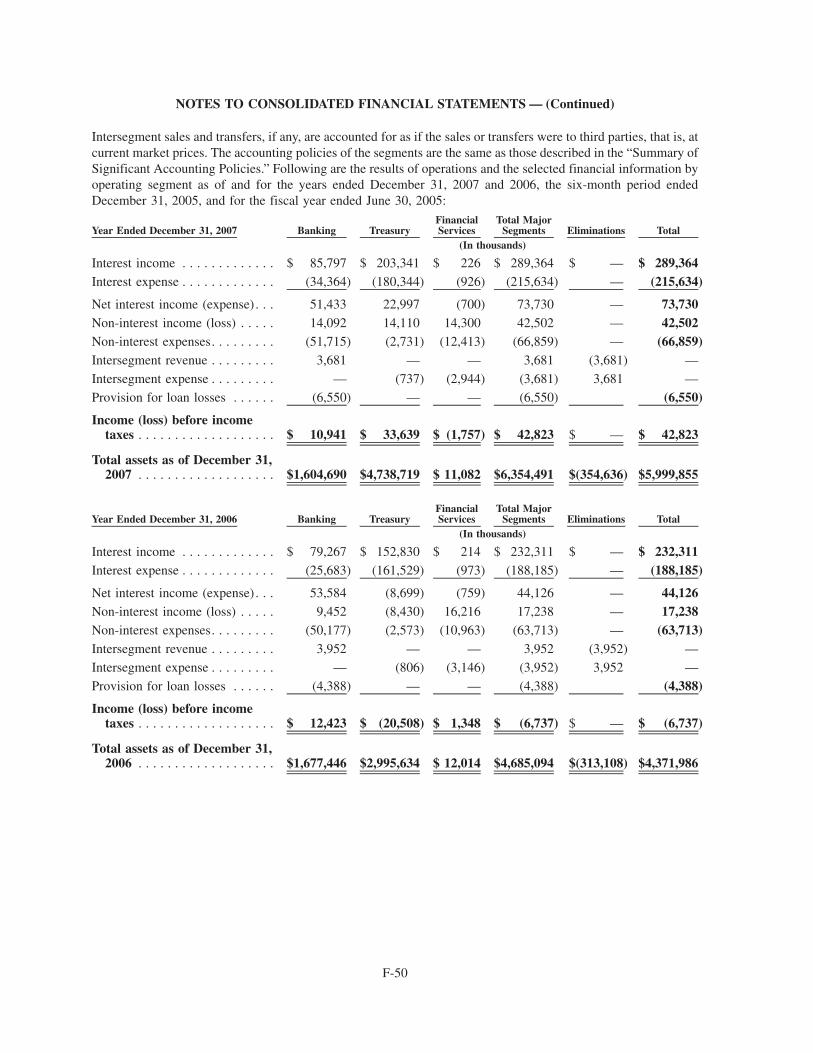
Intersegment sales and transfers, if any, are accounted for as if the sales or transfers were to third parties, that is, atcurrent market prices. The accounting policies of the segments are the same as those described in the “Summary ofSignificant Accounting Policies.” Following are the results of operations and the selected financial information byoperating segment as of and for the years ended December 31, 2007 and 2006, the six-month period endedDecember 31, 2005, and for the fiscal year ended June 30, 2005:
Year Ended December 31, 2007 Banking TreasuryFinancialServices
Total MajorSegments Eliminations Total
(In thousands)
Interest income . . . . . . . . . . . . . $ 85,797 $ 203,341 $ 226 $ 289,364 $ — $ 289,364Interest expense . . . . . . . . . . . . . (34,364) (180,344) (926) (215,634) — (215,634)
Net interest income (expense) . . . 51,433 22,997 (700) 73,730 — 73,730Non-interest income (loss) . . . . . 14,092 14,110 14,300 42,502 — 42,502Non-interest expenses. . . . . . . . . (51,715) (2,731) (12,413) (66,859) — (66,859)Intersegment revenue . . . . . . . . . 3,681 — — 3,681 (3,681) —
Intersegment expense . . . . . . . . . — (737) (2,944) (3,681) 3,681 —
Provision for loan losses . . . . . . (6,550) — — (6,550) (6,550)
Income (loss) before incometaxes . . . . . . . . . . . . . . . . . . . $ 10,941 $ 33,639 $ (1,757) $ 42,823 $ — $ 42,823
Total assets as of December 31,2007 . . . . . . . . . . . . . . . . . . . $1,604,690 $4,738,719 $ 11,082 $6,354,491 $(354,636) $5,999,855
Year Ended December 31, 2006 Banking TreasuryFinancialServices
Total MajorSegments Eliminations Total
(In thousands)
Interest income . . . . . . . . . . . . . $ 79,267 $ 152,830 $ 214 $ 232,311 $ — $ 232,311Interest expense . . . . . . . . . . . . . (25,683) (161,529) (973) (188,185) — (188,185)
Net interest income (expense) . . . 53,584 (8,699) (759) 44,126 — 44,126Non-interest income (loss) . . . . . 9,452 (8,430) 16,216 17,238 — 17,238Non-interest expenses. . . . . . . . . (50,177) (2,573) (10,963) (63,713) — (63,713)Intersegment revenue . . . . . . . . . 3,952 — — 3,952 (3,952) —
Intersegment expense . . . . . . . . . — (806) (3,146) (3,952) 3,952 —
Provision for loan losses . . . . . . (4,388) — — (4,388) (4,388)
Income (loss) before incometaxes . . . . . . . . . . . . . . . . . . . $ 12,423 $ (20,508) $ 1,348 $ (6,737) $ — $ (6,737)
Total assets as of December 31,2006 . . . . . . . . . . . . . . . . . . . $1,677,446 $2,995,634 $ 12,014 $4,685,094 $(313,108) $4,371,986
F-50
NOTES TO CONSOLIDATED FINANCIAL STATEMENTS — (Continued)
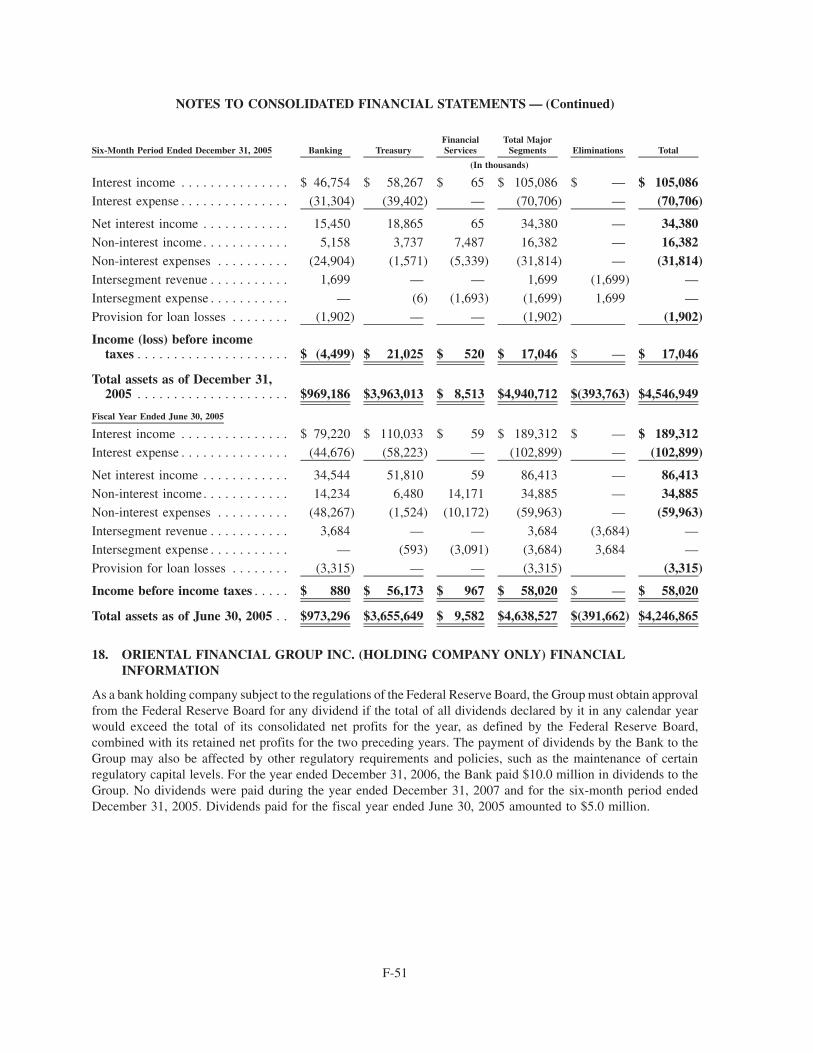
Six-Month Period Ended December 31, 2005 Banking TreasuryFinancialServices
Total MajorSegments Eliminations Total
(In thousands)
Interest income . . . . . . . . . . . . . . . $ 46,754 $ 58,267 $ 65 $ 105,086 $ — $ 105,086Interest expense . . . . . . . . . . . . . . . (31,304) (39,402) — (70,706) — (70,706)
Net interest income . . . . . . . . . . . . 15,450 18,865 65 34,380 — 34,380Non-interest income. . . . . . . . . . . . 5,158 3,737 7,487 16,382 — 16,382Non-interest expenses . . . . . . . . . . (24,904) (1,571) (5,339) (31,814) — (31,814)Intersegment revenue . . . . . . . . . . . 1,699 — — 1,699 (1,699) —
Intersegment expense . . . . . . . . . . . — (6) (1,693) (1,699) 1,699 —
Provision for loan losses . . . . . . . . (1,902) — — (1,902) (1,902)
Income (loss) before incometaxes . . . . . . . . . . . . . . . . . . . . . $ (4,499) $ 21,025 $ 520 $ 17,046 $ — $ 17,046
Total assets as of December 31,2005 . . . . . . . . . . . . . . . . . . . . . $969,186 $3,963,013 $ 8,513 $4,940,712 $(393,763) $4,546,949
Fiscal Year Ended June 30, 2005
Interest income . . . . . . . . . . . . . . . $ 79,220 $ 110,033 $ 59 $ 189,312 $ — $ 189,312Interest expense . . . . . . . . . . . . . . . (44,676) (58,223) — (102,899) — (102,899)
Net interest income . . . . . . . . . . . . 34,544 51,810 59 86,413 — 86,413Non-interest income. . . . . . . . . . . . 14,234 6,480 14,171 34,885 — 34,885Non-interest expenses . . . . . . . . . . (48,267) (1,524) (10,172) (59,963) — (59,963)Intersegment revenue . . . . . . . . . . . 3,684 — — 3,684 (3,684) —
Intersegment expense . . . . . . . . . . . — (593) (3,091) (3,684) 3,684 —
Provision for loan losses . . . . . . . . (3,315) — — (3,315) (3,315)
Income before income taxes . . . . . $ 880 $ 56,173 $ 967 $ 58,020 $ — $ 58,020
Total assets as of June 30, 2005 . . $973,296 $3,655,649 $ 9,582 $4,638,527 $(391,662) $4,246,865
18. ORIENTAL FINANCIAL GROUP INC. (HOLDING COMPANY ONLY) FINANCIALINFORMATION
As a bank holding company subject to the regulations of the Federal Reserve Board, the Group must obtain approvalfrom the Federal Reserve Board for any dividend if the total of all dividends declared by it in any calendar yearwould exceed the total of its consolidated net profits for the year, as defined by the Federal Reserve Board,combined with its retained net profits for the two preceding years. The payment of dividends by the Bank to theGroup may also be affected by other regulatory requirements and policies, such as the maintenance of certainregulatory capital levels. For the year ended December 31, 2006, the Bank paid $10.0 million in dividends to theGroup. No dividends were paid during the year ended December 31, 2007 and for the six-month period endedDecember 31, 2005. Dividends paid for the fiscal year ended June 30, 2005 amounted to $5.0 million.
F-51
NOTES TO CONSOLIDATED FINANCIAL STATEMENTS — (Continued)
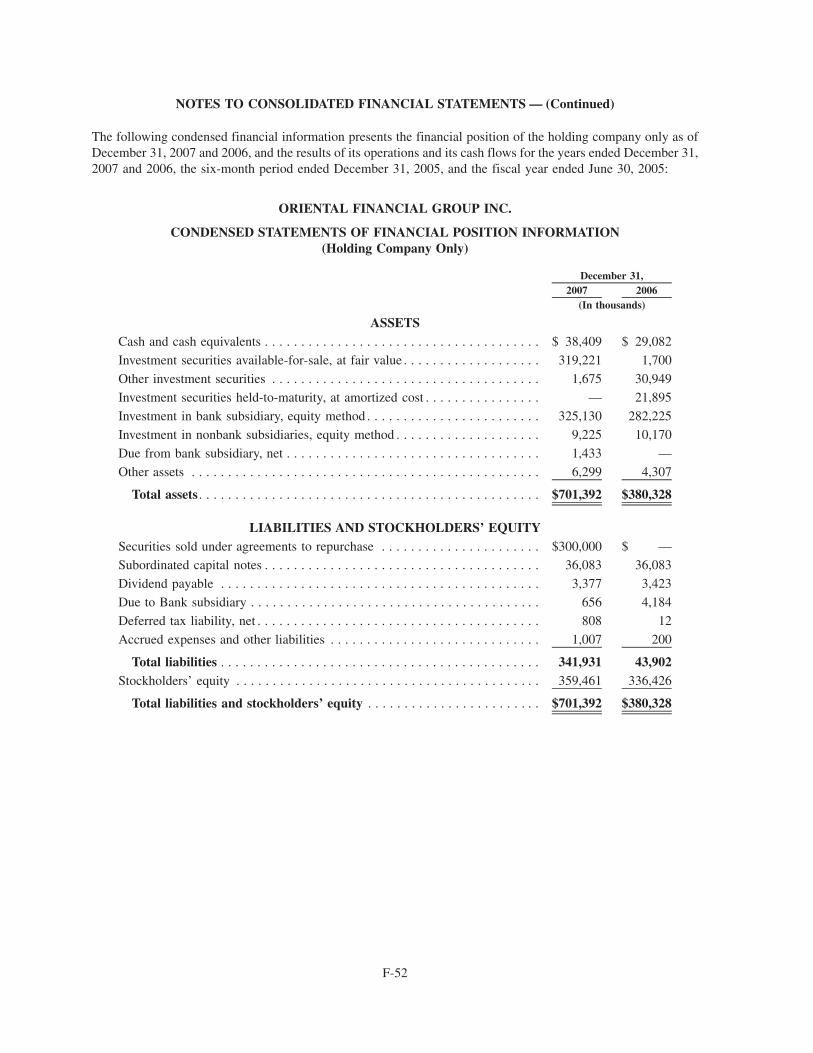
The following condensed financial information presents the financial position of the holding company only as ofDecember 31, 2007 and 2006, and the results of its operations and its cash flows for the years ended December 31,2007 and 2006, the six-month period ended December 31, 2005, and the fiscal year ended June 30, 2005:
ORIENTAL FINANCIAL GROUP INC.
CONDENSED STATEMENTS OF FINANCIAL POSITION INFORMATION(Holding Company Only)
2007 2006December 31,
(In thousands)
ASSETSCash and cash equivalents . . . . . . . . . . . . . . . . . . . . . . . . . . . . . . . . . . . . . . $ 38,409 $ 29,082
Investment securities available-for-sale, at fair value . . . . . . . . . . . . . . . . . . . 319,221 1,700
Other investment securities . . . . . . . . . . . . . . . . . . . . . . . . . . . . . . . . . . . . . 1,675 30,949
Investment securities held-to-maturity, at amortized cost . . . . . . . . . . . . . . . . — 21,895
Investment in bank subsidiary, equity method . . . . . . . . . . . . . . . . . . . . . . . . 325,130 282,225
Investment in nonbank subsidiaries, equity method . . . . . . . . . . . . . . . . . . . . 9,225 10,170
Due from bank subsidiary, net . . . . . . . . . . . . . . . . . . . . . . . . . . . . . . . . . . . 1,433 —
Other assets . . . . . . . . . . . . . . . . . . . . . . . . . . . . . . . . . . . . . . . . . . . . . . . . 6,299 4,307
Total assets . . . . . . . . . . . . . . . . . . . . . . . . . . . . . . . . . . . . . . . . . . . . . . . $701,392 $380,328
LIABILITIES AND STOCKHOLDERS’ EQUITYSecurities sold under agreements to repurchase . . . . . . . . . . . . . . . . . . . . . . $300,000 $ —Subordinated capital notes . . . . . . . . . . . . . . . . . . . . . . . . . . . . . . . . . . . . . . 36,083 36,083
Dividend payable . . . . . . . . . . . . . . . . . . . . . . . . . . . . . . . . . . . . . . . . . . . . 3,377 3,423
Due to Bank subsidiary . . . . . . . . . . . . . . . . . . . . . . . . . . . . . . . . . . . . . . . . 656 4,184
Deferred tax liability, net . . . . . . . . . . . . . . . . . . . . . . . . . . . . . . . . . . . . . . . 808 12
Accrued expenses and other liabilities . . . . . . . . . . . . . . . . . . . . . . . . . . . . . 1,007 200
Total liabilities . . . . . . . . . . . . . . . . . . . . . . . . . . . . . . . . . . . . . . . . . . . . 341,931 43,902Stockholders’ equity . . . . . . . . . . . . . . . . . . . . . . . . . . . . . . . . . . . . . . . . . . 359,461 336,426
Total liabilities and stockholders’ equity . . . . . . . . . . . . . . . . . . . . . . . . $701,392 $380,328
F-52
NOTES TO CONSOLIDATED FINANCIAL STATEMENTS — (Continued)
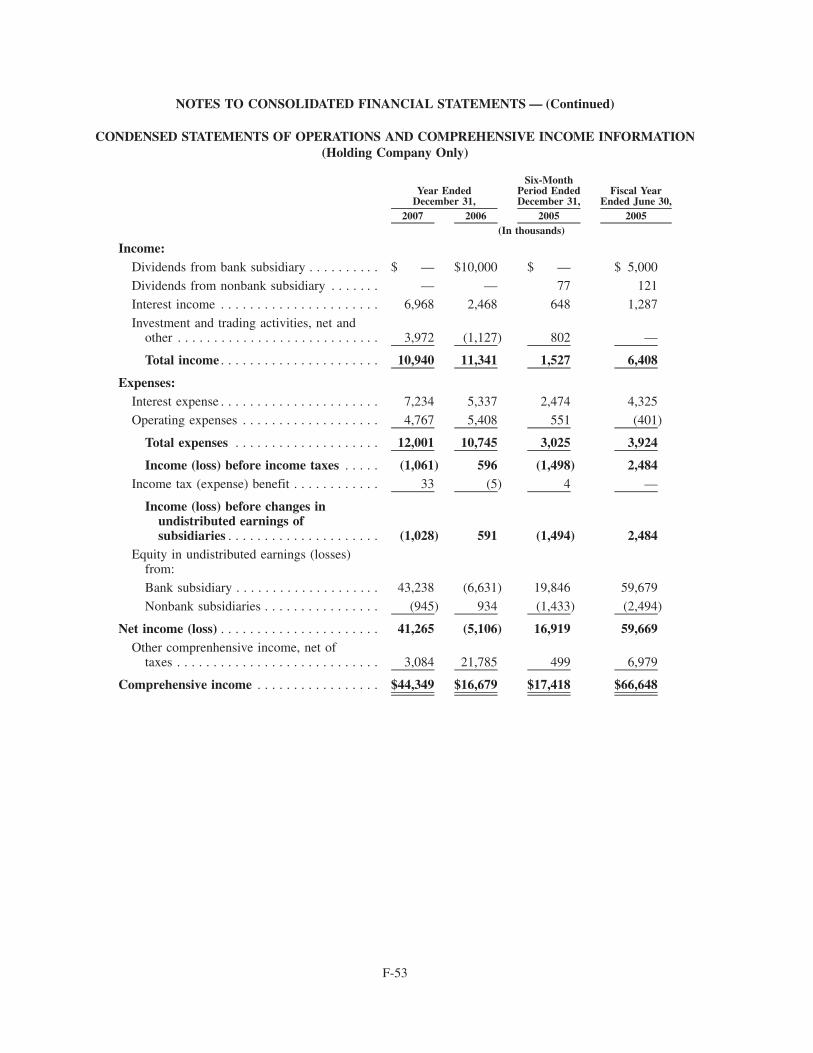
CONDENSED STATEMENTS OF OPERATIONS AND COMPREHENSIVE INCOME INFORMATION(Holding Company Only)
2007 2006 2005 2005
Year EndedDecember 31,
Six-MonthPeriod EndedDecember 31,
Fiscal YearEnded June 30,
(In thousands)
Income:Dividends from bank subsidiary . . . . . . . . . . $ — $10,000 $ — $ 5,000
Dividends from nonbank subsidiary . . . . . . . — — 77 121
Interest income . . . . . . . . . . . . . . . . . . . . . . 6,968 2,468 648 1,287
Investment and trading activities, net andother . . . . . . . . . . . . . . . . . . . . . . . . . . . . 3,972 (1,127) 802 —
Total income . . . . . . . . . . . . . . . . . . . . . . 10,940 11,341 1,527 6,408
Expenses:Interest expense . . . . . . . . . . . . . . . . . . . . . . 7,234 5,337 2,474 4,325
Operating expenses . . . . . . . . . . . . . . . . . . . 4,767 5,408 551 (401)
Total expenses . . . . . . . . . . . . . . . . . . . . 12,001 10,745 3,025 3,924
Income (loss) before income taxes . . . . . (1,061) 596 (1,498) 2,484Income tax (expense) benefit . . . . . . . . . . . . 33 (5) 4 —
Income (loss) before changes inundistributed earnings ofsubsidiaries . . . . . . . . . . . . . . . . . . . . . (1,028) 591 (1,494) 2,484
Equity in undistributed earnings (losses)from:
Bank subsidiary . . . . . . . . . . . . . . . . . . . . 43,238 (6,631) 19,846 59,679
Nonbank subsidiaries . . . . . . . . . . . . . . . . (945) 934 (1,433) (2,494)
Net income (loss) . . . . . . . . . . . . . . . . . . . . . . 41,265 (5,106) 16,919 59,669Other comprenhensive income, net of
taxes . . . . . . . . . . . . . . . . . . . . . . . . . . . . 3,084 21,785 499 6,979
Comprehensive income . . . . . . . . . . . . . . . . . $44,349 $16,679 $17,418 $66,648
F-53
NOTES TO CONSOLIDATED FINANCIAL STATEMENTS — (Continued)
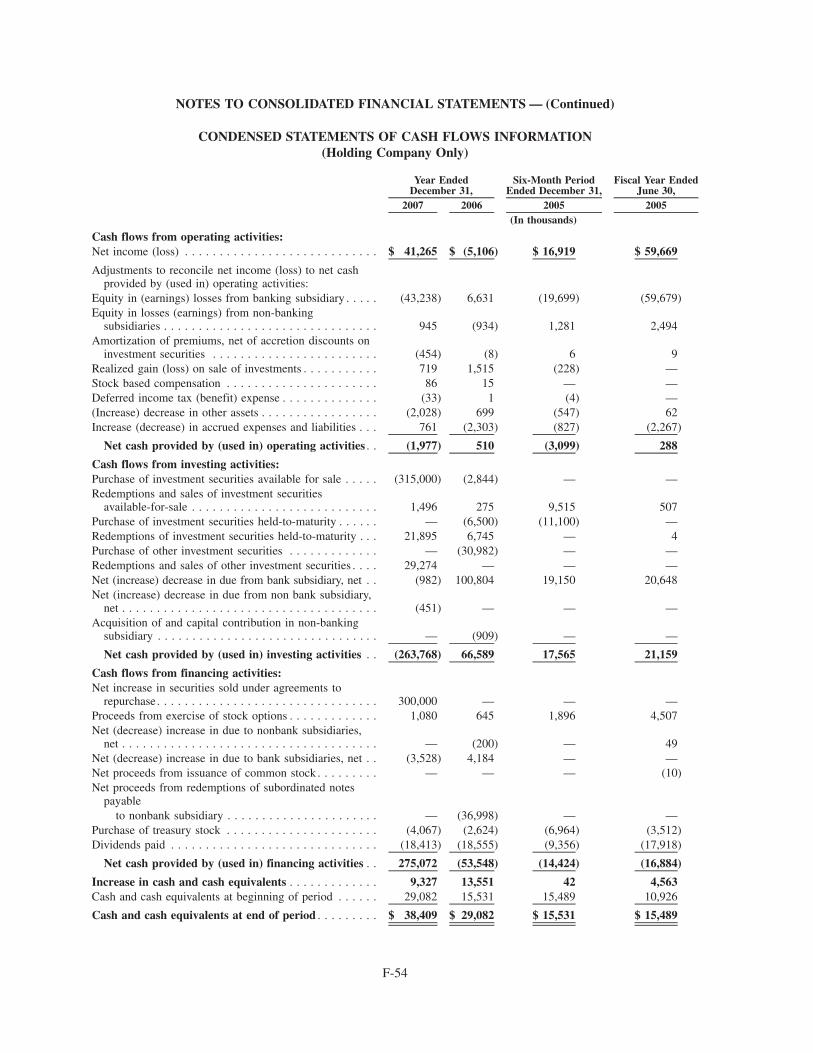
CONDENSED STATEMENTS OF CASH FLOWS INFORMATION(Holding Company Only)
2007 2006 2005 2005
Six-Month PeriodEnded December 31,
Fiscal Year EndedJune 30,
Year EndedDecember 31,
(In thousands)
Cash flows from operating activities:Net income (loss) . . . . . . . . . . . . . . . . . . . . . . . . . . . . $ 41,265 $ (5,106) $ 16,919 $ 59,669
Adjustments to reconcile net income (loss) to net cashprovided by (used in) operating activities:
Equity in (earnings) losses from banking subsidiary . . . . . (43,238) 6,631 (19,699) (59,679)Equity in losses (earnings) from non-banking
subsidiaries . . . . . . . . . . . . . . . . . . . . . . . . . . . . . . . 945 (934) 1,281 2,494Amortization of premiums, net of accretion discounts on
investment securities . . . . . . . . . . . . . . . . . . . . . . . . (454) (8) 6 9Realized gain (loss) on sale of investments . . . . . . . . . . . 719 1,515 (228) —Stock based compensation . . . . . . . . . . . . . . . . . . . . . . 86 15 — —Deferred income tax (benefit) expense . . . . . . . . . . . . . . (33) 1 (4) —(Increase) decrease in other assets . . . . . . . . . . . . . . . . . (2,028) 699 (547) 62Increase (decrease) in accrued expenses and liabilities . . . 761 (2,303) (827) (2,267)
Net cash provided by (used in) operating activities . . (1,977) 510 (3,099) 288
Cash flows from investing activities:Purchase of investment securities available for sale . . . . . (315,000) (2,844) — —Redemptions and sales of investment securities
available-for-sale . . . . . . . . . . . . . . . . . . . . . . . . . . . 1,496 275 9,515 507Purchase of investment securities held-to-maturity . . . . . . — (6,500) (11,100) —Redemptions of investment securities held-to-maturity . . . 21,895 6,745 — 4Purchase of other investment securities . . . . . . . . . . . . . — (30,982) — —Redemptions and sales of other investment securities . . . . 29,274 — — —Net (increase) decrease in due from bank subsidiary, net . . (982) 100,804 19,150 20,648Net (increase) decrease in due from non bank subsidiary,
net . . . . . . . . . . . . . . . . . . . . . . . . . . . . . . . . . . . . . (451) — — —Acquisition of and capital contribution in non-banking
subsidiary . . . . . . . . . . . . . . . . . . . . . . . . . . . . . . . . — (909) — —
Net cash provided by (used in) investing activities . . (263,768) 66,589 17,565 21,159
Cash flows from financing activities:Net increase in securities sold under agreements to
repurchase . . . . . . . . . . . . . . . . . . . . . . . . . . . . . . . . 300,000 — — —Proceeds from exercise of stock options . . . . . . . . . . . . . 1,080 645 1,896 4,507Net (decrease) increase in due to nonbank subsidiaries,
net . . . . . . . . . . . . . . . . . . . . . . . . . . . . . . . . . . . . . — (200) — 49Net (decrease) increase in due to bank subsidiaries, net . . (3,528) 4,184 — —Net proceeds from issuance of common stock . . . . . . . . . — — — (10)Net proceeds from redemptions of subordinated notes
payableto nonbank subsidiary . . . . . . . . . . . . . . . . . . . . . . — (36,998) — —
Purchase of treasury stock . . . . . . . . . . . . . . . . . . . . . . (4,067) (2,624) (6,964) (3,512)Dividends paid . . . . . . . . . . . . . . . . . . . . . . . . . . . . . . (18,413) (18,555) (9,356) (17,918)
Net cash provided by (used in) financing activities . . 275,072 (53,548) (14,424) (16,884)
Increase in cash and cash equivalents . . . . . . . . . . . . . 9,327 13,551 42 4,563Cash and cash equivalents at beginning of period . . . . . . 29,082 15,531 15,489 10,926
Cash and cash equivalents at end of period . . . . . . . . . $ 38,409 $ 29,082 $ 15,531 $ 15,489
F-54
NOTES TO CONSOLIDATED FINANCIAL STATEMENTS — (Continued)
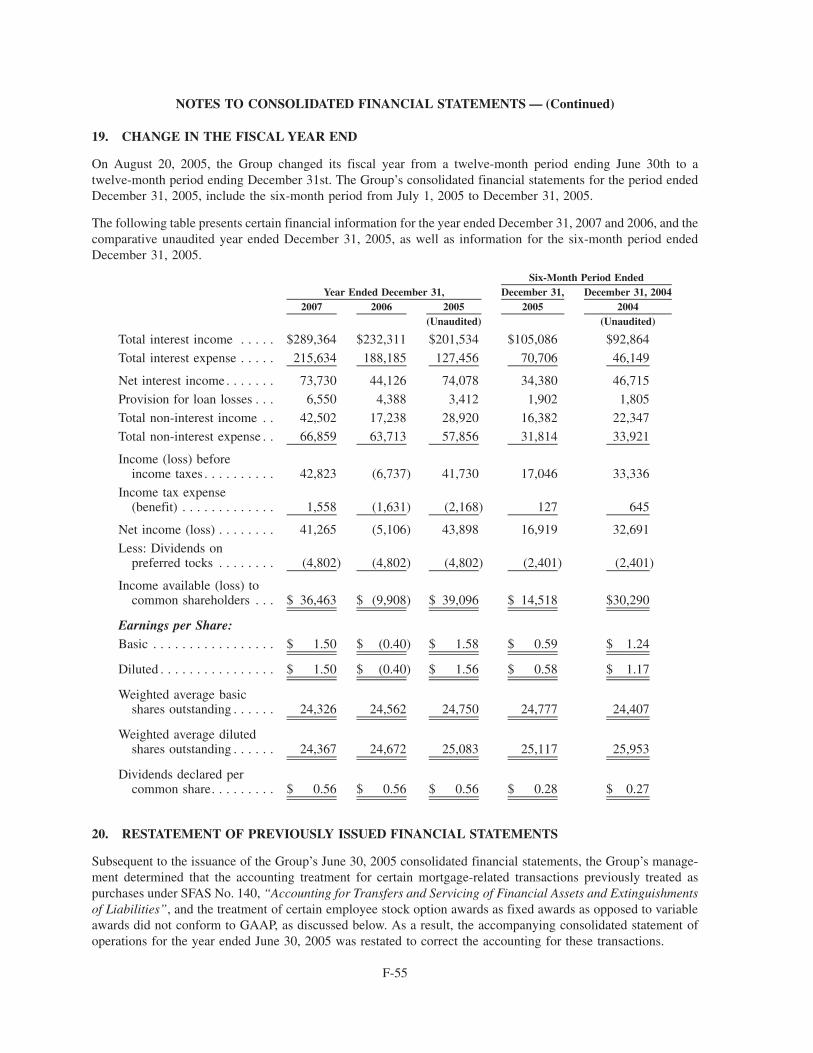
19. CHANGE IN THE FISCAL YEAR END
On August 20, 2005, the Group changed its fiscal year from a twelve-month period ending June 30th to atwelve-month period ending December 31st. The Group’s consolidated financial statements for the period endedDecember 31, 2005, include the six-month period from July 1, 2005 to December 31, 2005.
The following table presents certain financial information for the year ended December 31, 2007 and 2006, and thecomparative unaudited year ended December 31, 2005, as well as information for the six-month period endedDecember 31, 2005.
2007 2006 2005 2005 2004December 31, December 31, 2004Year Ended December 31,
Six-Month Period Ended
(Unaudited) (Unaudited)
Total interest income . . . . . $289,364 $232,311 $201,534 $105,086 $92,864
Total interest expense . . . . . 215,634 188,185 127,456 70,706 46,149
Net interest income . . . . . . . 73,730 44,126 74,078 34,380 46,715
Provision for loan losses . . . 6,550 4,388 3,412 1,902 1,805
Total non-interest income . . 42,502 17,238 28,920 16,382 22,347
Total non-interest expense . . 66,859 63,713 57,856 31,814 33,921
Income (loss) beforeincome taxes . . . . . . . . . . 42,823 (6,737) 41,730 17,046 33,336
Income tax expense(benefit) . . . . . . . . . . . . . 1,558 (1,631) (2,168) 127 645
Net income (loss) . . . . . . . . 41,265 (5,106) 43,898 16,919 32,691
Less: Dividends onpreferred tocks . . . . . . . . (4,802) (4,802) (4,802) (2,401) (2,401)
Income available (loss) tocommon shareholders . . . $ 36,463 $ (9,908) $ 39,096 $ 14,518 $30,290
Earnings per Share:Basic . . . . . . . . . . . . . . . . . $ 1.50 $ (0.40) $ 1.58 $ 0.59 $ 1.24
Diluted . . . . . . . . . . . . . . . . $ 1.50 $ (0.40) $ 1.56 $ 0.58 $ 1.17
Weighted average basicshares outstanding . . . . . . 24,326 24,562 24,750 24,777 24,407
Weighted average dilutedshares outstanding . . . . . . 24,367 24,672 25,083 25,117 25,953
Dividends declared percommon share. . . . . . . . . $ 0.56 $ 0.56 $ 0.56 $ 0.28 $ 0.27
20. RESTATEMENT OF PREVIOUSLY ISSUED FINANCIAL STATEMENTS
Subsequent to the issuance of the Group’s June 30, 2005 consolidated financial statements, the Group’s manage-ment determined that the accounting treatment for certain mortgage-related transactions previously treated aspurchases under SFAS No. 140, “Accounting for Transfers and Servicing of Financial Assets and Extinguishmentsof Liabilities”, and the treatment of certain employee stock option awards as fixed awards as opposed to variableawards did not conform to GAAP, as discussed below. As a result, the accompanying consolidated statement ofoperations for the year ended June 30, 2005 was restated to correct the accounting for these transactions.
F-55
NOTES TO CONSOLIDATED FINANCIAL STATEMENTS — (Continued)
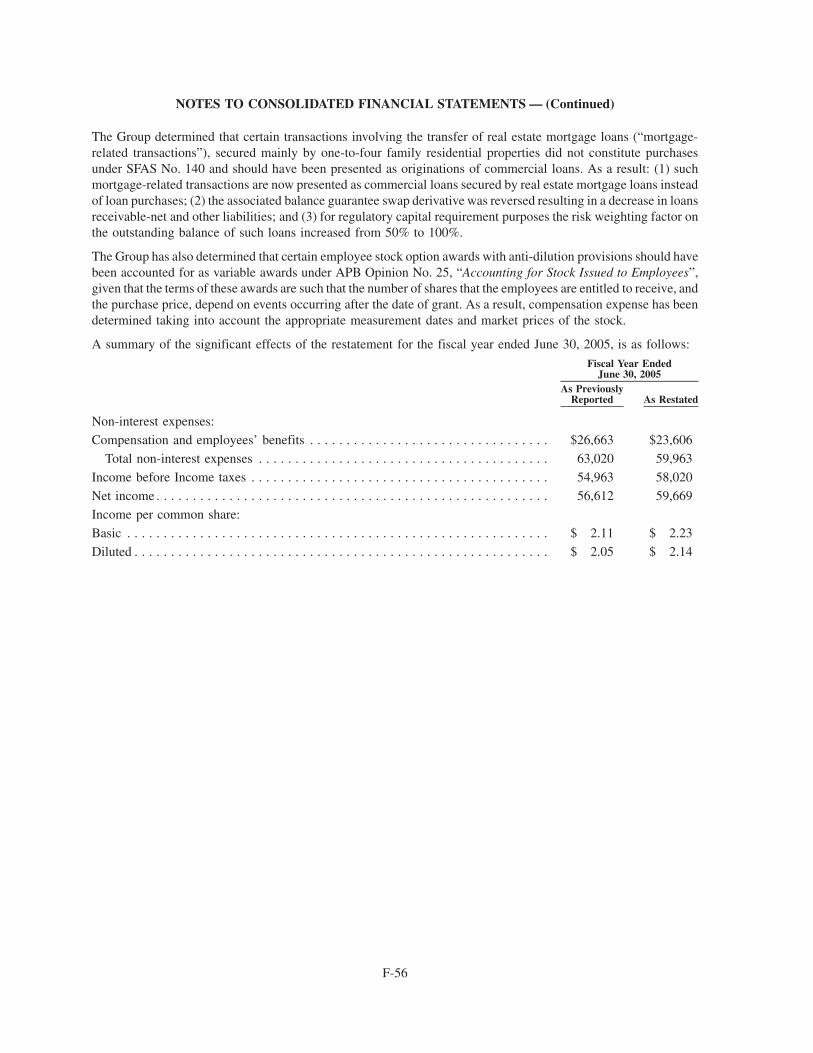
The Group determined that certain transactions involving the transfer of real estate mortgage loans (“mortgage-related transactions”), secured mainly by one-to-four family residential properties did not constitute purchasesunder SFAS No. 140 and should have been presented as originations of commercial loans. As a result: (1) suchmortgage-related transactions are now presented as commercial loans secured by real estate mortgage loans insteadof loan purchases; (2) the associated balance guarantee swap derivative was reversed resulting in a decrease in loansreceivable-net and other liabilities; and (3) for regulatory capital requirement purposes the risk weighting factor onthe outstanding balance of such loans increased from 50% to 100%.
The Group has also determined that certain employee stock option awards with anti-dilution provisions should havebeen accounted for as variable awards under APB Opinion No. 25, “Accounting for Stock Issued to Employees”,given that the terms of these awards are such that the number of shares that the employees are entitled to receive, andthe purchase price, depend on events occurring after the date of grant. As a result, compensation expense has beendetermined taking into account the appropriate measurement dates and market prices of the stock.
A summary of the significant effects of the restatement for the fiscal year ended June 30, 2005, is as follows:
As PreviouslyReported As Restated
Fiscal Year EndedJune 30, 2005
Non-interest expenses:
Compensation and employees’ benefits . . . . . . . . . . . . . . . . . . . . . . . . . . . . . . . . . $26,663 $23,606
Total non-interest expenses . . . . . . . . . . . . . . . . . . . . . . . . . . . . . . . . . . . . . . . . 63,020 59,963
Income before Income taxes . . . . . . . . . . . . . . . . . . . . . . . . . . . . . . . . . . . . . . . . . 54,963 58,020
Net income . . . . . . . . . . . . . . . . . . . . . . . . . . . . . . . . . . . . . . . . . . . . . . . . . . . . . . 56,612 59,669
Income per common share:
Basic . . . . . . . . . . . . . . . . . . . . . . . . . . . . . . . . . . . . . . . . . . . . . . . . . . . . . . . . . . $ 2.11 $ 2.23
Diluted . . . . . . . . . . . . . . . . . . . . . . . . . . . . . . . . . . . . . . . . . . . . . . . . . . . . . . . . . $ 2.05 $ 2.14
F-56
NOTES TO CONSOLIDATED FINANCIAL STATEMENTS — (Continued)
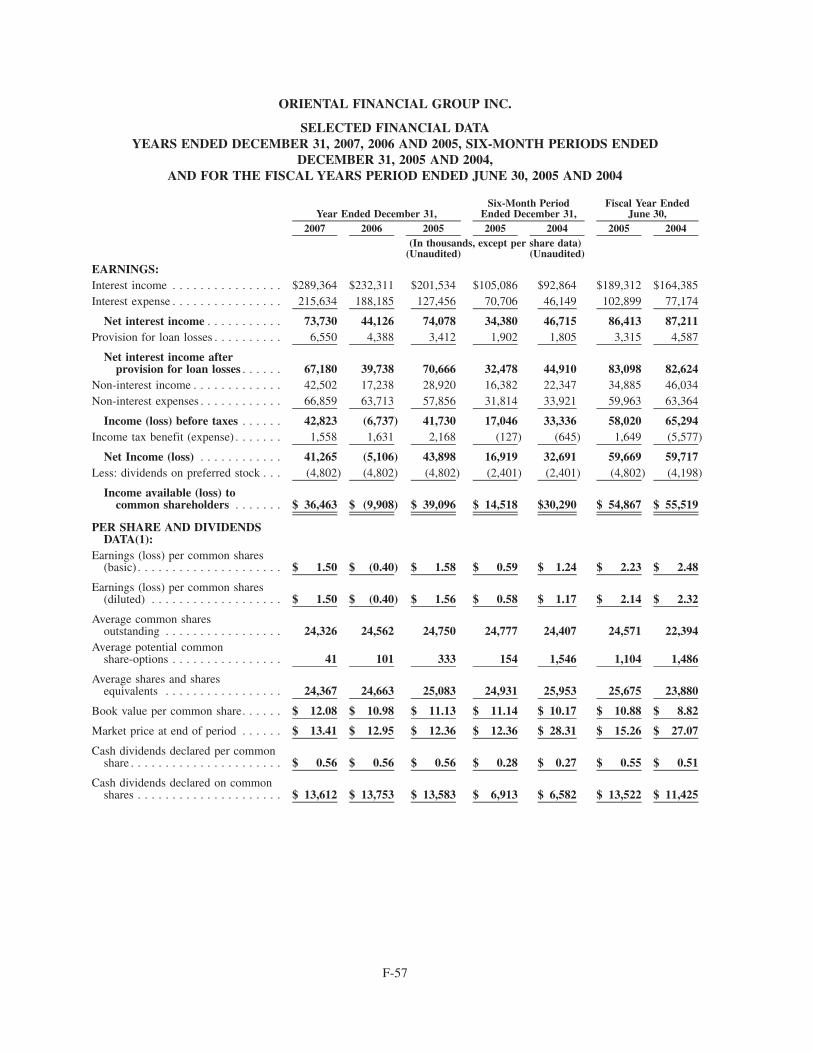
ORIENTAL FINANCIAL GROUP INC.
SELECTED FINANCIAL DATAYEARS ENDED DECEMBER 31, 2007, 2006 AND 2005, SIX-MONTH PERIODS ENDED
DECEMBER 31, 2005 AND 2004,AND FOR THE FISCAL YEARS PERIOD ENDED JUNE 30, 2005 AND 2004
2007 2006 2005 2005 2004 2005 2004Year Ended December 31,
Six-Month PeriodEnded December 31,
Fiscal Year EndedJune 30,
(In thousands, except per share data)(Unaudited) (Unaudited)
EARNINGS:Interest income . . . . . . . . . . . . . . . . $289,364 $232,311 $201,534 $105,086 $92,864 $189,312 $164,385Interest expense . . . . . . . . . . . . . . . . 215,634 188,185 127,456 70,706 46,149 102,899 77,174
Net interest income . . . . . . . . . . . 73,730 44,126 74,078 34,380 46,715 86,413 87,211Provision for loan losses . . . . . . . . . . 6,550 4,388 3,412 1,902 1,805 3,315 4,587
Net interest income afterprovision for loan losses . . . . . . 67,180 39,738 70,666 32,478 44,910 83,098 82,624
Non-interest income . . . . . . . . . . . . . 42,502 17,238 28,920 16,382 22,347 34,885 46,034Non-interest expenses . . . . . . . . . . . . 66,859 63,713 57,856 31,814 33,921 59,963 63,364
Income (loss) before taxes . . . . . . 42,823 (6,737) 41,730 17,046 33,336 58,020 65,294Income tax benefit (expense) . . . . . . . 1,558 1,631 2,168 (127) (645) 1,649 (5,577)
Net Income (loss) . . . . . . . . . . . . 41,265 (5,106) 43,898 16,919 32,691 59,669 59,717Less: dividends on preferred stock . . . (4,802) (4,802) (4,802) (2,401) (2,401) (4,802) (4,198)
Income available (loss) tocommon shareholders . . . . . . . $ 36,463 $ (9,908) $ 39,096 $ 14,518 $30,290 $ 54,867 $ 55,519
PER SHARE AND DIVIDENDSDATA(1):
Earnings (loss) per common shares(basic) . . . . . . . . . . . . . . . . . . . . . $ 1.50 $ (0.40) $ 1.58 $ 0.59 $ 1.24 $ 2.23 $ 2.48
Earnings (loss) per common shares(diluted) . . . . . . . . . . . . . . . . . . . $ 1.50 $ (0.40) $ 1.56 $ 0.58 $ 1.17 $ 2.14 $ 2.32
Average common sharesoutstanding . . . . . . . . . . . . . . . . . 24,326 24,562 24,750 24,777 24,407 24,571 22,394
Average potential commonshare-options . . . . . . . . . . . . . . . . 41 101 333 154 1,546 1,104 1,486
Average shares and sharesequivalents . . . . . . . . . . . . . . . . . 24,367 24,663 25,083 24,931 25,953 25,675 23,880
Book value per common share. . . . . . $ 12.08 $ 10.98 $ 11.13 $ 11.14 $ 10.17 $ 10.88 $ 8.82
Market price at end of period . . . . . . $ 13.41 $ 12.95 $ 12.36 $ 12.36 $ 28.31 $ 15.26 $ 27.07
Cash dividends declared per commonshare . . . . . . . . . . . . . . . . . . . . . . $ 0.56 $ 0.56 $ 0.56 $ 0.28 $ 0.27 $ 0.55 $ 0.51
Cash dividends declared on commonshares . . . . . . . . . . . . . . . . . . . . . $ 13,612 $ 13,753 $ 13,583 $ 6,913 $ 6,582 $ 13,522 $ 11,425
F-57
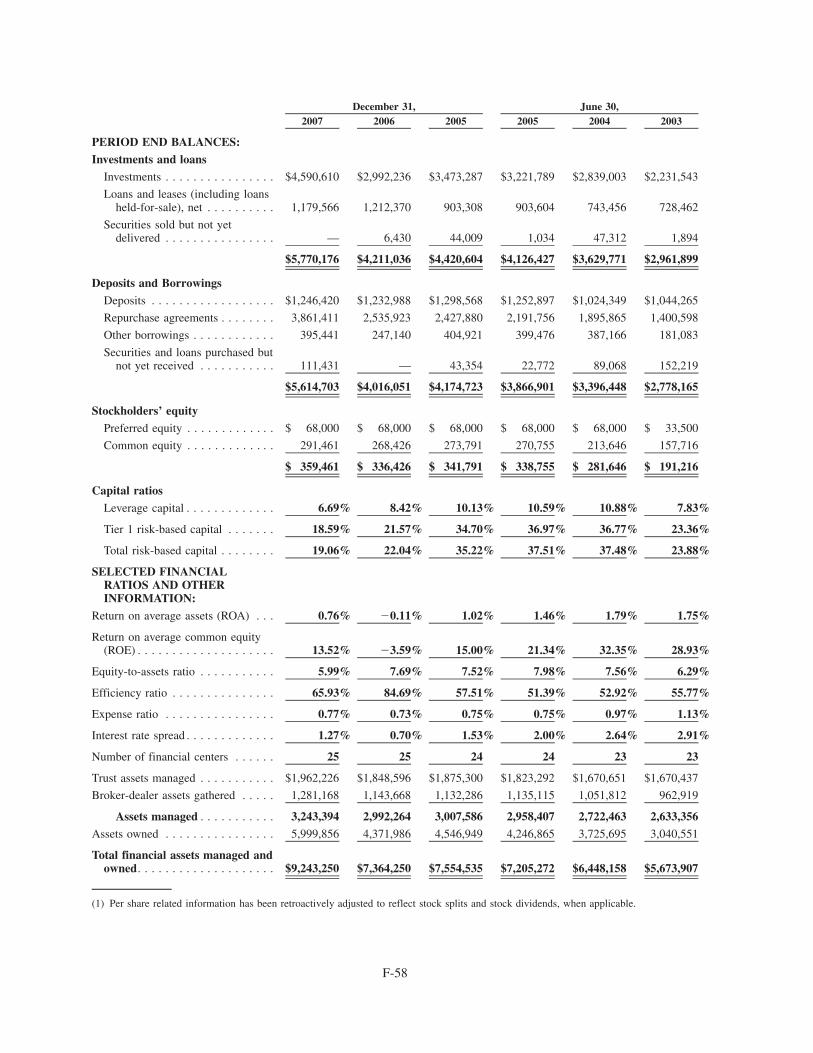
2007 2006 2005 2005 2004 2003December 31, June 30,
PERIOD END BALANCES:
Investments and loans
Investments . . . . . . . . . . . . . . . . $4,590,610 $2,992,236 $3,473,287 $3,221,789 $2,839,003 $2,231,543
Loans and leases (including loansheld-for-sale), net . . . . . . . . . . 1,179,566 1,212,370 903,308 903,604 743,456 728,462
Securities sold but not yetdelivered . . . . . . . . . . . . . . . . — 6,430 44,009 1,034 47,312 1,894
$5,770,176 $4,211,036 $4,420,604 $4,126,427 $3,629,771 $2,961,899
Deposits and Borrowings
Deposits . . . . . . . . . . . . . . . . . . $1,246,420 $1,232,988 $1,298,568 $1,252,897 $1,024,349 $1,044,265
Repurchase agreements . . . . . . . . 3,861,411 2,535,923 2,427,880 2,191,756 1,895,865 1,400,598
Other borrowings . . . . . . . . . . . . 395,441 247,140 404,921 399,476 387,166 181,083
Securities and loans purchased butnot yet received . . . . . . . . . . . 111,431 — 43,354 22,772 89,068 152,219
$5,614,703 $4,016,051 $4,174,723 $3,866,901 $3,396,448 $2,778,165
Stockholders’ equity
Preferred equity . . . . . . . . . . . . . $ 68,000 $ 68,000 $ 68,000 $ 68,000 $ 68,000 $ 33,500
Common equity . . . . . . . . . . . . . 291,461 268,426 273,791 270,755 213,646 157,716
$ 359,461 $ 336,426 $ 341,791 $ 338,755 $ 281,646 $ 191,216
Capital ratios
Leverage capital . . . . . . . . . . . . . 6.69% 8.42% 10.13% 10.59% 10.88% 7.83%
Tier 1 risk-based capital . . . . . . . 18.59% 21.57% 34.70% 36.97% 36.77% 23.36%
Total risk-based capital . . . . . . . . 19.06% 22.04% 35.22% 37.51% 37.48% 23.88%
SELECTED FINANCIALRATIOS AND OTHERINFORMATION:
Return on average assets (ROA) . . . 0.76% �0.11% 1.02% 1.46% 1.79% 1.75%
Return on average common equity(ROE) . . . . . . . . . . . . . . . . . . . . 13.52% �3.59% 15.00% 21.34% 32.35% 28.93%
Equity-to-assets ratio . . . . . . . . . . . 5.99% 7.69% 7.52% 7.98% 7.56% 6.29%
Efficiency ratio . . . . . . . . . . . . . . . 65.93% 84.69% 57.51% 51.39% 52.92% 55.77%
Expense ratio . . . . . . . . . . . . . . . . 0.77% 0.73% 0.75% 0.75% 0.97% 1.13%
Interest rate spread . . . . . . . . . . . . . 1.27% 0.70% 1.53% 2.00% 2.64% 2.91%
Number of financial centers . . . . . . 25 25 24 24 23 23
Trust assets managed . . . . . . . . . . . $1,962,226 $1,848,596 $1,875,300 $1,823,292 $1,670,651 $1,670,437
Broker-dealer assets gathered . . . . . 1,281,168 1,143,668 1,132,286 1,135,115 1,051,812 962,919
Assets managed . . . . . . . . . . . 3,243,394 2,992,264 3,007,586 2,958,407 2,722,463 2,633,356
Assets owned . . . . . . . . . . . . . . . . 5,999,856 4,371,986 4,546,949 4,246,865 3,725,695 3,040,551
Total financial assets managed andowned. . . . . . . . . . . . . . . . . . . . $9,243,250 $7,364,250 $7,554,535 $7,205,272 $6,448,158 $5,673,907
(1) Per share related information has been retroactively adjusted to reflect stock splits and stock dividends, when applicable.
F-58
MANAGEMENT’S DISCUSSION AND ANALYSISOF FINANCIAL CONDITION AND RESULTS OF OPERATIONS
FOR THE YEAR ENDED DECEMBER 31, 2007
OVERVIEW OF FINANCIAL PERFORMANCE
The following discussion of our financial condition and results of operations should be read in conjunction withItem 6, “Selected Financial Data,” and our consolidated financial statements and related notes in Item 8. Thisdiscussion and analysis contains forward-looking statements. Please see “Forward Looking Statements” and “RiskFactors” for discussions of the uncertainties, risks and assumptions associated with these statements.
On August 30, 2005, the Group’s Board of Directors amended Section 1 of Article IX of the Group’s bylaws tochange its fiscal year-end from June 30 to December 31. As a result of the change in fiscal year end, the followingcomparative periods are presented for purposes of discussion of results of operations:
• Year ended December 31, 2007 compared to year ended December 31, 2006;
• Year ended December 31, 2006 compared to year ended December 31, 2005 (unaudited); and
• Six-month period ended December 31, 2005 compared to six-month period ended December 31, 2004(unaudited).
Comparison of the years ended December 31, 2007 and 2006:
The Group’s mix of businesses and products generates both the interest income traditionally associated with abanking institution and non-interest income traditionally associated with a financial services institution (generatedby such businesses as securities brokerage, fiduciary services, investment banking, insurance and pensionadministration). Although all of these businesses, to varying degrees, are affected by interest rate and financialmarkets fluctuations and other external factors, the Group’s commitment is to continue producing a balanced andgrowing revenue stream.
Major highlights for the year ended December 31, 2007 follows:
• Return on assets (ROA) and common equity (ROE) for 2007 were 0.76% and 13.52%, respectively, a significantimprovement from negative returns of -0.11% and -3.59%, respectively, last year.
• Net interest margin for 2007 increased to 1.51%, up 53 basis points from last year.
• Book value per common share of $12.08 as of December 31, 2007, represents an increase of 10.0% from last year.
Favorable results achieved in the year ended December 31, 2007 continue to reflect the success of strategies theGroup has been pursuing. These strategies included:
1. The decision to adopt conservative lending policies starting several years ago in light of weakening economicconditions in Puerto Rico.
2. The repositioning of Oriental’s investment portfolio and related funding to improve margins, in line with whatthe Group correctly anticipated would be a more positively sloped yield curve.
3. Growing Oriental’s franchise with the objective of integrating the delivery of banking and financial services tomid and high-net worth clients, building recurring non-interest revenues, closely monitoring non-interestexpenses, and strengthening the Group’s management team.
For the year ended December 31, 2007, net income available to common shareholders was $36.5 million, comparedwith net loss to common shareholders of $9.9 million reported in the same period of 2006. Earnings available tocommon shareholders per diluted share were $1.50, compared to a loss per diluted share of $0.40 reported for 2006.Results for the fourth quarter and year ended December 31, 2006 included $20.7 million, or $0.87 per share, inlosses and write-offs, the majority of which related to the sale of lower yielding securities stemming from therepositioning of the available-for-sale securities portfolio that led to a sizeable increase in net interest income in2007.
F-59
Return on common equity (ROE) and return on assets (ROA) for the year ended December 31, 2007 were 13.52%and 0.76%, respectively, from (3.59%) and (0.11%), respectively, in the same period of 2006.
Net interest income represented 63.4% of the Group’s total revenues (defined as net interest income plus non-interest income) in the year ended December 31, 2007. During the year ended December 31, 2007, net interestincome was $73.7 million, an increase of 67.1% from the $44.1 million recorded for the same period of 2006.Higher interest income on increased investment securities and loan volume and average yields was partially offsetby higher volume and interest rates on borrowings. Interest rate spread for the year ended December 31, 2007 was1.27% compared to 0.70% in the same period of 2006. At December 31, 2007 average interest earning assetsincreased 9.36% to $4.900 billion, compared to $4.481 billion at December 31, 2006, reflecting a 8.57% increase ininvestments from $3.426 billion to $3.719 billion.
The provision for loan losses for the year ended December 31, 2007 increased 49.3% to $6.6 million from$4.4 million for the same period of 2006, reflecting higher allowance requirements related to increased mortgageand commercial loan business in the period and local economic conditions. For the quarters ended December 31,2007 and 2006, the provision for loan losses was $2.5 million and $1.5 million, respectively, an increase of 69.1%.Based on an analysis of the credit quality and the composition of the Group’s loan portfolio, managementdetermined that the provision for loan losses for the year ended December 31, 2007 was adequate in order tomaintain the allowance for loan losses at an appropriate level.
Non-interest income for 2007 reflects financial service revenue growth of 7.9% to $17.3 million in 2007, compared to$16.0 million in 2006, due to the Group’s success in expanding its business in corporate and personal trusts, retirement,wealth management, and asset protection services for mid and high net worth customers. As a result, trust assets managedincreased 6.1% year-over-year, to $2.0 billion at December 31, 2007, and broker-dealer assets gathered increased 12.0%year-over-year, to $1.3 billion. Refer to Table 2 for additional information on the Group’s non-interest income.
Non-interest expenses for the year ended December 31, 2007 increased 4.9% to $66.9 million, compared to$63.7 million for the same period of 2006. Effective cost control has enabled the Group to restrain the growth ofoverhead costs. Refer to Table 3 for additional information on the Group’s non-interest expenses.
Total Group financial assets (including assets managed by the trust department, the retirement plan administrationsubsidiary, and securities broker-dealer subsidiary) increased 25.5% to $9.243 billion as of December 31, 2007,compared to $7.366 billion as of December 31, 2006. Assets managed by the Group’s trust department, theretirement plan administration subsidiary, and the securities broker-dealer subsidiary increased to $3.243 billionfrom $2.992 billion as of December 31, 2006, an increase of 8.4%. The Group’s assets owned totaled $6.000 billionas of December 31, 2007, an increase of 37.2%, compared to $4.372 billion as of December 31, 2006, mainly as aresult of an increase in the investment securities portfolio, which increased 53.4% or $1.598 billion.
On the liability side, total deposits increased 1.1%, from $1.233 billion at December 31, 2006, to $1.246 billion atDecember 31, 2007, mainly from increases in savings accounts. Total borrowings increased 53.0%, from$2.783 billion at December 31, 2006, to $4.257 billion at December 31, 2007, mainly from increased securitiessold under agreements to repurchase to finance the increase in investments.
Stockholders’ equity as of December 31, 2007 was $359.5 million, an increase of 6.8% from $336.4 million as ofDecember 31, 2006. The Group’s capital ratios remain significantly above regulatory capital requirements. AtDecember 31, 2007, the Tier 1 Leverage Capital Ratio was 6.69%, Tier 1 Risk-Based Capital Ratio was 18.59%, andTotal Risk-Based Capital Ratio was 19.06%.
Comparison of the years ended December 31, 2006 and 2005:
During the fourth quarter of 2006, the Group completed a review of its available-for-sale (“AFS”) investmentportfolio in light of asset/liability management considerations and changing market conditions, and has strate-gically repositioned this portfolio. The repositioning involved open market sales of approximately $865 million ofsecurities with a weighted average yield of 4.60% at a loss of approximately $16.0 million which is included as non-interest income in the accompanying consolidated financial statements. Following the sale, $860 million of triple-Asecurities at a weighted average yield of 5.55% were purchased and classified as AFS. As part of this repositioning,the Group entered into a $900 million, 5-year structured repurchase agreement ($450 million non-put 1-year and
F-60
$450 million non-put 2-years) with a weighted average rate paid of 4.52%. Proceeds were used to repay repurchaseagreements with a weighted average rate paid of 5.25%. In February 2007, the Group continued its strategicrepositioning of the repurchase agreements portfolio, restructuring an additional $1 billion of short-term borrow-ings, with a weighted average rate being paid of approximately 5.35%, into 10-year, non-put 2-year structuredrepurchased agreements, priced at 95 basis points under 90-day LIBOR (for a current rate of 4.40%).
For the year ended December 31, 2006, net loss to common shareholders was $9.9 million compared with netincome available to common stockholders of $39.1 million reported in the same period of 2005. Loss per dilutedshare was $0.40, compared to earnings per diluted share of $1.56 reported for the same period of 2005.
Return on common equity (ROE) and return on assets (ROA) for the year ended December 31, 2006 were (3.59%)and (0.11%), respectively, from 15.00% and 1.02%, respectively, in the same period of 2005.
Net interest income represented 71.9% of the Group’s total revenues (defined as net interest income plus non-interestincome) in the year ended December 31, 2006. During the year ended December 31, 2006, net interest income was$44.1 million, a decrease of 40.4% from the $74.1 million recorded for the same period of 2005. Higher interest incomeon increased investment securities and loan volume and average yields was offset by higher volume and interest rates onborrowings. Interest rate spread for the year ended December 31, 2006 was 0.70% compared to 1.53% in the same periodof 2005. At December 31, 2006 average interest earning assets increased 7.32% to $4.481 billion, compared to$4.175 billion at December 31, 2005, reflecting a 4.12% increase in investments from $3.290 billion to $3.426 billion,which consisted mainly of AAA-rated mortgage-backed securities and U.S. government and agency obligations.
The provision for loan losses for the year ended December 31, 2006 increased 28.6% to $4.4 million from $3.4 millionfor the same period of 2005, reflecting higher allowance requirements related to increased mortgage and commercialloan business in the period. For the quarters ended December 31, 2006 and 2005, the provision for loan losses was$1.5 million and $1.0 million, respectively, an increase of 54.6%. Based on an analysis of the credit quality and thecomposition of the Group’s loan portfolio, management determined that the provision for loan losses for the yearended December 31, 2006 was adequate in order to maintain the allowance for loan losses at an appropriate level.
Non-interest income for 2006 reflects increases in revenues from financial and banking services and investmentbanking activities, despite the challenging economic environment in Puerto Rico.
Non-interest expenses for the year ended December 31, 2006 increased 10.0% to $63.7 million, compared to$57.9 million for the same period of 2005. Non-interest expenses in the fourth quarter of 2006 includedapproximately $1.8 million primarily for a supplemental pension payment and charitable contributions made inrecognition of the Group’s former Chairman, President, and CEO enhancing the value of Oriental over the course ofhis 19 years of leadership. Excluding this amount, non-interest expenses for 2006 would have been $61.9 million.The 2005 expenses of $57.9 million reflected a $6.3 million reduction in non-cash compensation related to thevariable accounting for certain employee stock options. Excluding this non-cash adjustment, total non-interestexpenses for the year ended December 31, 2005 would have been $64.2 million.
Total Group financial assets (including assets managed by the trust department, the retirement plan administrationsubsidiary, and securities broker-dealer subsidiary) decreased 2.5% to $7.366 billion as of December 31, 2006,compared to $7.555 billion as of December 31, 2005. Assets managed by the Group’s trust department, theretirement plan administration subsidiary, and the securities broker-dealer subsidiary decreased to $2.992 billionfrom $3.008 billion as of December 31, 2005, a decrease of 0.5%. The Group’s assets owned totaled $4.374 billionas of December 31, 2006, a decrease of 3.8%, compared from $4.547 billion as of December 31, 2005, mainly as aresult of a decrease in the investment securities portfolio, which decreased by 13.9% or $481.1 million.
On the liability side, total deposits decreased by 5.1%, from $1.299 billion at December 31, 2005, to $1.233 billionat December 31, 2006, mainly from decreases in certificates of deposit, partially offset by increased savingsaccounts. Total borrowings decreased 1.8%, from $2.833 billion at December 31, 2005, to $2.782 billion atDecember 31, 2006, mainly from repayments of repurchase agreements and the redemption of the Statutory Trust Isubordinated capital notes in December 2006.
Stockholders’ equity as of December 31, 2006 was $336.4 million, a slight decrease of 1.6% from $341.8 million asof December 31, 2005. As discussed in Note 1 of the accompanying consolidated financial statements, the Group
F-61
adopted SAB 108. As part of the initial implementation, the Group adjusted $1.525 million as an accumulated effecton the beginning retained earnings. The net effect of these adjustments in the consolidated statement of operationsfor the year ended December 31, 2006 was to increase the previously reported net loss by $93,000 with no effect onper share data. The Group’s capital ratios remain significantly above regulatory capital requirements. AtDecember 31, 2006, the Tier 1 Leverage Capital Ratio was 8.42%, Tier 1 Risk-Based Capital Ratio was21.57%, and Total Risk-Based Capital Ratio was 22.04%.
Comparison of the six-month periods ended December 31, 2005 and December 31, 2004:
For the six-month period ended December 31, 2005, net income available to common shareholders was$14.5 million, a decrease of 52.1% compared with $30.3 million reported in the same period of 2004. Earningsper diluted share decreased 50.4% to $0.58, compared to $1.17 per share reported for the same period of 2004.
Return on common equity (ROE) and return on assets (ROA) for the six-month period ended December 31, 2005were 11.54% and 0.77%, respectively, which represent a decrease of 53.4% in ROE, from 24.78% in the sameperiod of 2004, and a decrease of 53.4% in ROA, from 1.65% in the same period of 2004.
Net interest income represented approximately 68% of the Group’s total revenues in the six-month period endedDecember 31, 2005. During such six-month period, net interest income was $34.4 million, a decrease of 26.4% fromthe $46.7 million recorded for the same period of 2004. Higher interest income on increased investment securitiesvolume was offset by lower average yields on such investments and higher interest rates on borrowings. Interest ratespread for the six-month period ended December 31, 2005 was 1.33% compared to 2.27% in the same period of2004. At December 31, 2005, average interest earning assets increased 12.7% to $4.277 billion, compared to $3.796at December 31, 2004, reflecting a 12.5% increase in investments from $2.984 to $3.358 billion, which consistedmainly of AAA-rated mortgage-backed securities and U.S. government and agency obligations.
The provision for loan losses for the six-month period ended December 31, 2005 increased 5.4% to $1.9 millionfrom $1.8 million for the same period of 2004, reflecting higher allowance requirements related to the increase ofcommercial and consumer loan business in that period. Based on an analysis of the credit quality and thecomposition of the Group’s loan portfolio, management determined that the provision for loan losses was adequatein order to maintain the allowance for loan losses at an appropriate level.
Non-interest income represented approximately 32.3% of the Group’s total revenues in the six-month period endedDecember 31, 2005. For such six-month period, non-interest income decreased 26.7% to $16.4 million from$22.3 million for the same period of 2004. Performance in such period of 2005 reflects increases in banking servicerevenues, partially offset by decreases in revenues from financial services, investment banking activities, as well asmortgage banking and securities activities.
Total non-interest banking and financial services revenues decreased 19.4% to $13.7 million in the six-monthperiod ended December 31, 2005, compared to $17.0 million for the same period of 2004. Banking service revenuesincreased 16.5% to $4.5 million compared to $3.9 million for the comparable period of 2004. Financial servicerevenues decreased 1.4% to $7.5 million compared to $7.6 million for the same period of 2004.
For the six-month period ended December 31, 2005, mortgage-banking revenues were $1.7 million, reflecting adecrease of 69.2% when compared with $5.5 million for the same period of 2004. Such decrease in mortgage revenuesresulted from reduced sales of whole-loans in the open market, which resulted in lower gains on such transactions.
Non-interest expenses for the six-month period ended December 31, 2005 decreased 6.2% to $31.8 million, comparedto $33.9 million for the same period of 2004, reflecting tight cost controls. The decrease was mainly due to reductionsin compensation and employee benefits, as well as in advertising and business promotion and electronic bankingcharges. Professional and service fees increased 11.6% for such period of 2005, compared to the corresponding 2004period, in part due to the impact of the compliance requirements of the Sarbanes-Oxley Act of 2002. The Group’sefficiency ratio in the six-month period ended December 31, 2005 was 66.12%, compared to 53.24% for the same six-month period of 2004. The Group computes its efficiency ratio by dividing operating expenses by the sum of netinterest income and recurring non-interest income, but excluding gains on sale of investment securities.
F-62
Total Group financial assets (including assets managed by the trust department, the retirement plan administrationsubsidiary, and securities broker-dealer subsidiary) increased 5.3% to $7.554 billion as of December 31, 2005,compared to $7.173 billion as of December 31, 2004. Assets managed by the Group’s trust department, theretirement plan administration subsidiary, and the securities broker-dealer subsidiary decreased to $3.008 billionfrom $3.009 billion as of December 31, 2004. The Group’s assets owned reached $4.547 billion as of December 31,2005, an increase of 9.2%, compared to $4.164 billion as of December 31, 2004. Major contributors to this increasewere the investment securities portfolio, which increased by 5.4% or $176.7 million, along with the loan portfolio,which increased by $135.4 million or 17.6%.
On the liability side, total deposits increased by 21.8%, from $1.066 billion at December 31, 2004, to $1.299 billionat December 31, 2005. Total borrowings increased 3.8%, from $2.729 billion at December 31, 2004, to$2.833 billion at December 31, 2005.
The Group continued strengthening its capital base during 2005. Stockholders’ equity as of December 31, 2005 was$341.8 million, an increase of 7.4% from $318.1 million as of December 31, 2004. This increase reflects the impactof earnings retention.
F-63
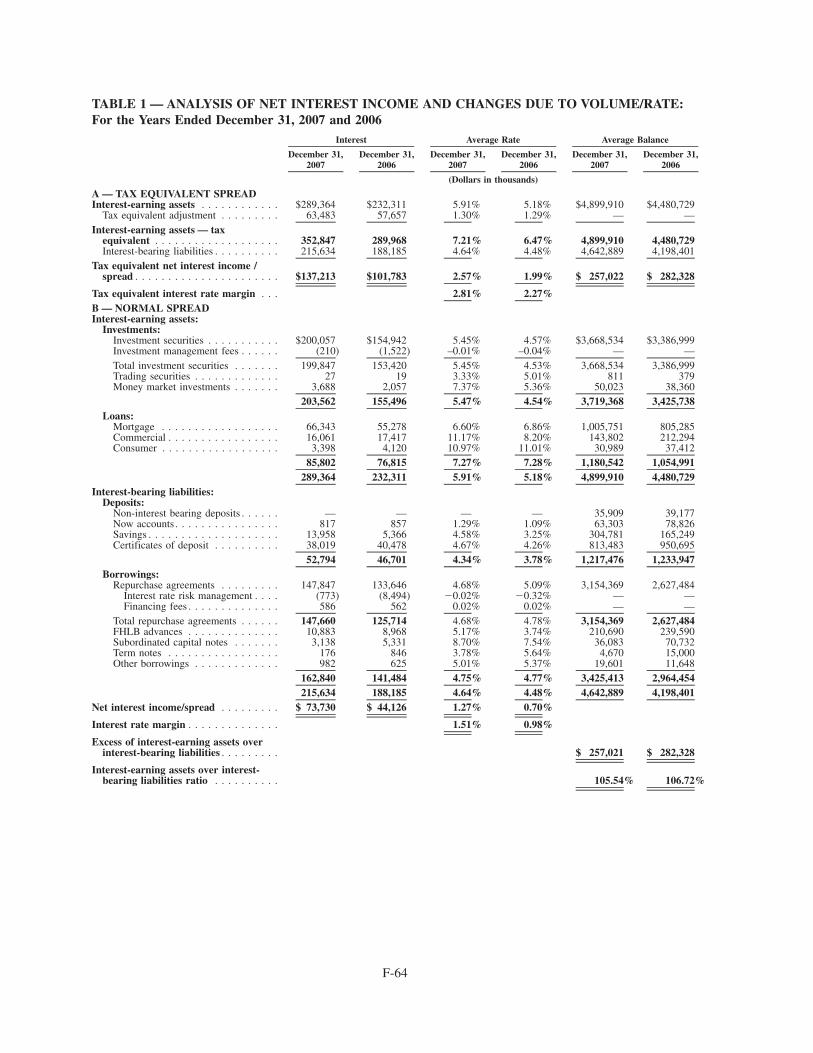
TABLE 1 — ANALYSIS OF NET INTEREST INCOME AND CHANGES DUE TO VOLUME/RATE:For the Years Ended December 31, 2007 and 2006
December 31,2007
December 31,2006
December 31,2007
December 31,2006
December 31,2007
December 31,2006
Interest Average Rate Average Balance
(Dollars in thousands)
A — TAX EQUIVALENT SPREADInterest-earning assets . . . . . . . . . . . . $289,364 $232,311 5.91% 5.18% $4,899,910 $4,480,729
Tax equivalent adjustment . . . . . . . . . 63,483 57,657 1.30% 1.29% — —Interest-earning assets — tax
equivalent . . . . . . . . . . . . . . . . . . . 352,847 289,968 7.21% 6.47% 4,899,910 4,480,729Interest-bearing liabilities . . . . . . . . . . 215,634 188,185 4.64% 4.48% 4,642,889 4,198,401
Tax equivalent net interest income /spread . . . . . . . . . . . . . . . . . . . . . . $137,213 $101,783 2.57% 1.99% $ 257,022 $ 282,328
Tax equivalent interest rate margin . . . 2.81% 2.27%B — NORMAL SPREADInterest-earning assets:
Investments:Investment securities . . . . . . . . . . . $200,057 $154,942 5.45% 4.57% $3,668,534 $3,386,999Investment management fees . . . . . . (210) (1,522) –0.01% –0.04% — —Total investment securities . . . . . . . 199,847 153,420 5.45% 4.53% 3,668,534 3,386,999Trading securities . . . . . . . . . . . . . 27 19 3.33% 5.01% 811 379Money market investments . . . . . . . 3,688 2,057 7.37% 5.36% 50,023 38,360
203,562 155,496 5.47% 4.54% 3,719,368 3,425,738Loans:
Mortgage . . . . . . . . . . . . . . . . . . 66,343 55,278 6.60% 6.86% 1,005,751 805,285Commercial . . . . . . . . . . . . . . . . . 16,061 17,417 11.17% 8.20% 143,802 212,294Consumer . . . . . . . . . . . . . . . . . . 3,398 4,120 10.97% 11.01% 30,989 37,412
85,802 76,815 7.27% 7.28% 1,180,542 1,054,991289,364 232,311 5.91% 5.18% 4,899,910 4,480,729
Interest-bearing liabilities:Deposits:
Non-interest bearing deposits . . . . . . — — — — 35,909 39,177Now accounts. . . . . . . . . . . . . . . . 817 857 1.29% 1.09% 63,303 78,826Savings . . . . . . . . . . . . . . . . . . . . 13,958 5,366 4.58% 3.25% 304,781 165,249Certificates of deposit . . . . . . . . . . 38,019 40,478 4.67% 4.26% 813,483 950,695
52,794 46,701 4.34% 3.78% 1,217,476 1,233,947Borrowings:
Repurchase agreements . . . . . . . . . 147,847 133,646 4.68% 5.09% 3,154,369 2,627,484Interest rate risk management . . . . (773) (8,494) �0.02% �0.32% — —Financing fees . . . . . . . . . . . . . . 586 562 0.02% 0.02% — —
Total repurchase agreements . . . . . . 147,660 125,714 4.68% 4.78% 3,154,369 2,627,484FHLB advances . . . . . . . . . . . . . . 10,883 8,968 5.17% 3.74% 210,690 239,590Subordinated capital notes . . . . . . . 3,138 5,331 8.70% 7.54% 36,083 70,732Term notes . . . . . . . . . . . . . . . . . 176 846 3.78% 5.64% 4,670 15,000Other borrowings . . . . . . . . . . . . . 982 625 5.01% 5.37% 19,601 11,648
162,840 141,484 4.75% 4.77% 3,425,413 2,964,454215,634 188,185 4.64% 4.48% 4,642,889 4,198,401
Net interest income/spread . . . . . . . . . $ 73,730 $ 44,126 1.27% 0.70%
Interest rate margin . . . . . . . . . . . . . . 1.51% 0.98%
Excess of interest-earning assets overinterest-bearing liabilities . . . . . . . . . $ 257,021 $ 282,328
Interest-earning assets over interest-bearing liabilities ratio . . . . . . . . . . 105.54% 106.72%
F-64
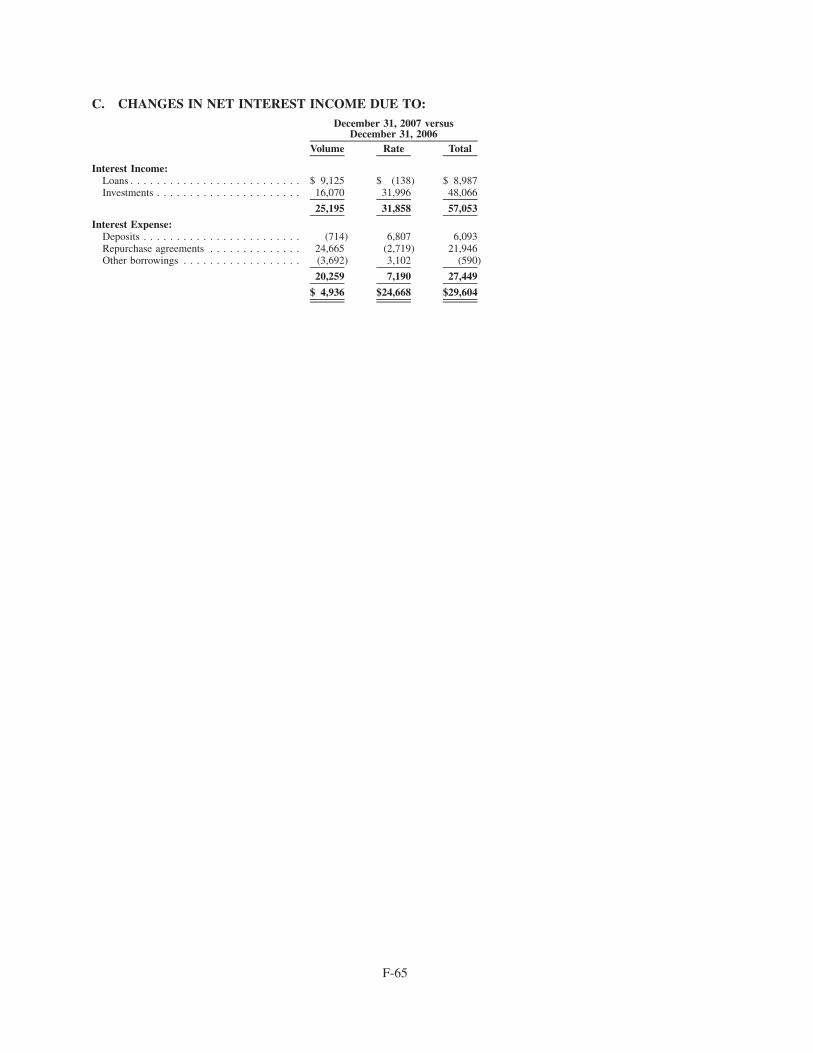
C. CHANGES IN NET INTEREST INCOME DUE TO:
Volume Rate Total
December 31, 2007 versusDecember 31, 2006
Interest Income:Loans . . . . . . . . . . . . . . . . . . . . . . . . . . $ 9,125 $ (138) $ 8,987Investments . . . . . . . . . . . . . . . . . . . . . . 16,070 31,996 48,066
25,195 31,858 57,053
Interest Expense:Deposits . . . . . . . . . . . . . . . . . . . . . . . . (714) 6,807 6,093Repurchase agreements . . . . . . . . . . . . . . 24,665 (2,719) 21,946Other borrowings . . . . . . . . . . . . . . . . . . (3,692) 3,102 (590)
20,259 7,190 27,449
$ 4,936 $24,668 $29,604
F-65
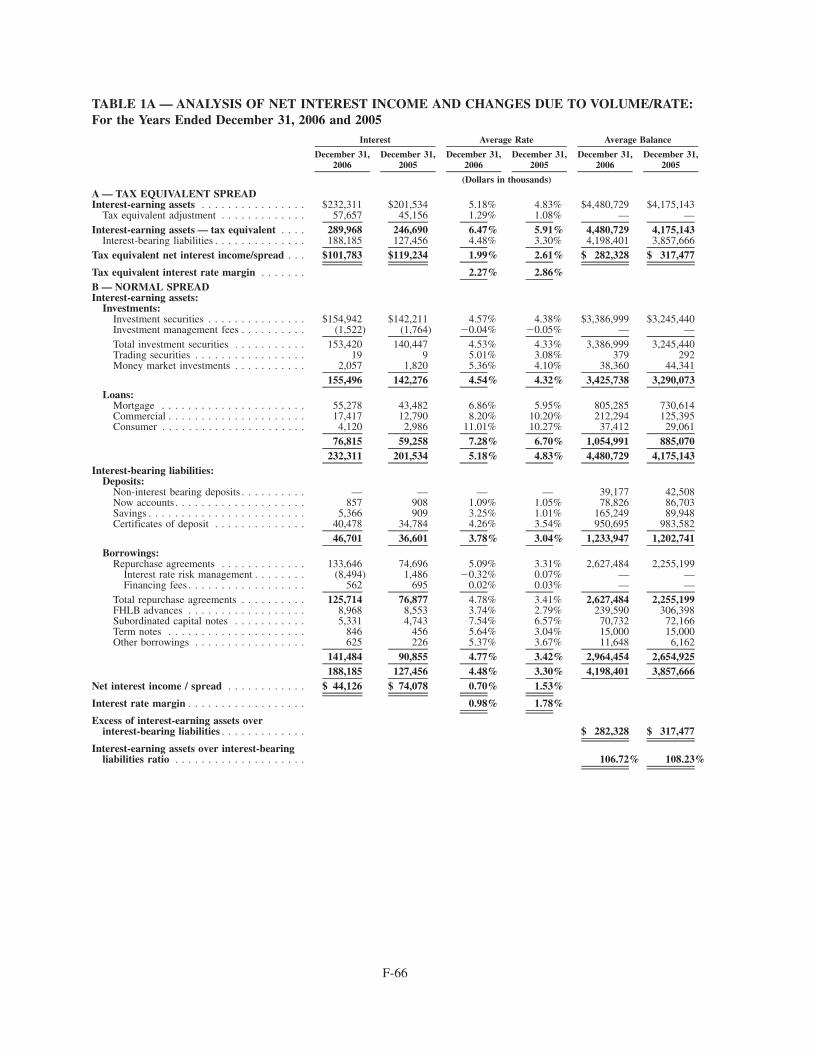
TABLE 1A — ANALYSIS OF NET INTEREST INCOME AND CHANGES DUE TO VOLUME/RATE:For the Years Ended December 31, 2006 and 2005
December 31,2006
December 31,2005
December 31,2006
December 31,2005
December 31,2006
December 31,2005
Interest Average Rate Average Balance
(Dollars in thousands)
A — TAX EQUIVALENT SPREADInterest-earning assets . . . . . . . . . . . . . . . . $232,311 $201,534 5.18% 4.83% $4,480,729 $4,175,143
Tax equivalent adjustment . . . . . . . . . . . . . 57,657 45,156 1.29% 1.08% — —Interest-earning assets — tax equivalent . . . . 289,968 246,690 6.47% 5.91% 4,480,729 4,175,143
Interest-bearing liabilities . . . . . . . . . . . . . . 188,185 127,456 4.48% 3.30% 4,198,401 3,857,666Tax equivalent net interest income/spread . . . $101,783 $119,234 1.99% 2.61% $ 282,328 $ 317,477
Tax equivalent interest rate margin . . . . . . . 2.27% 2.86%B — NORMAL SPREADInterest-earning assets:
Investments:Investment securities . . . . . . . . . . . . . . . $154,942 $142,211 4.57% 4.38% $3,386,999 $3,245,440Investment management fees . . . . . . . . . . (1,522) (1,764) �0.04% �0.05% — —Total investment securities . . . . . . . . . . . 153,420 140,447 4.53% 4.33% 3,386,999 3,245,440Trading securities . . . . . . . . . . . . . . . . . 19 9 5.01% 3.08% 379 292Money market investments . . . . . . . . . . . 2,057 1,820 5.36% 4.10% 38,360 44,341
155,496 142,276 4.54% 4.32% 3,425,738 3,290,073Loans:
Mortgage . . . . . . . . . . . . . . . . . . . . . . 55,278 43,482 6.86% 5.95% 805,285 730,614Commercial . . . . . . . . . . . . . . . . . . . . . 17,417 12,790 8.20% 10.20% 212,294 125,395Consumer . . . . . . . . . . . . . . . . . . . . . . 4,120 2,986 11.01% 10.27% 37,412 29,061
76,815 59,258 7.28% 6.70% 1,054,991 885,070232,311 201,534 5.18% 4.83% 4,480,729 4,175,143
Interest-bearing liabilities:Deposits:
Non-interest bearing deposits . . . . . . . . . . — — — — 39,177 42,508Now accounts. . . . . . . . . . . . . . . . . . . . 857 908 1.09% 1.05% 78,826 86,703Savings . . . . . . . . . . . . . . . . . . . . . . . . 5,366 909 3.25% 1.01% 165,249 89,948Certificates of deposit . . . . . . . . . . . . . . 40,478 34,784 4.26% 3.54% 950,695 983,582
46,701 36,601 3.78% 3.04% 1,233,947 1,202,741Borrowings:
Repurchase agreements . . . . . . . . . . . . . 133,646 74,696 5.09% 3.31% 2,627,484 2,255,199Interest rate risk management . . . . . . . . (8,494) 1,486 �0.32% 0.07% — —Financing fees . . . . . . . . . . . . . . . . . . 562 695 0.02% 0.03% — —
Total repurchase agreements . . . . . . . . . . 125,714 76,877 4.78% 3.41% 2,627,484 2,255,199FHLB advances . . . . . . . . . . . . . . . . . . 8,968 8,553 3.74% 2.79% 239,590 306,398Subordinated capital notes . . . . . . . . . . . 5,331 4,743 7.54% 6.57% 70,732 72,166Term notes . . . . . . . . . . . . . . . . . . . . . 846 456 5.64% 3.04% 15,000 15,000Other borrowings . . . . . . . . . . . . . . . . . 625 226 5.37% 3.67% 11,648 6,162
141,484 90,855 4.77% 3.42% 2,964,454 2,654,925188,185 127,456 4.48% 3.30% 4,198,401 3,857,666
Net interest income / spread . . . . . . . . . . . . $ 44,126 $ 74,078 0.70% 1.53%
Interest rate margin . . . . . . . . . . . . . . . . . . 0.98% 1.78%
Excess of interest-earning assets overinterest-bearing liabilities . . . . . . . . . . . . . $ 282,328 $ 317,477
Interest-earning assets over interest-bearingliabilities ratio . . . . . . . . . . . . . . . . . . . . 106.72% 108.23%
F-66
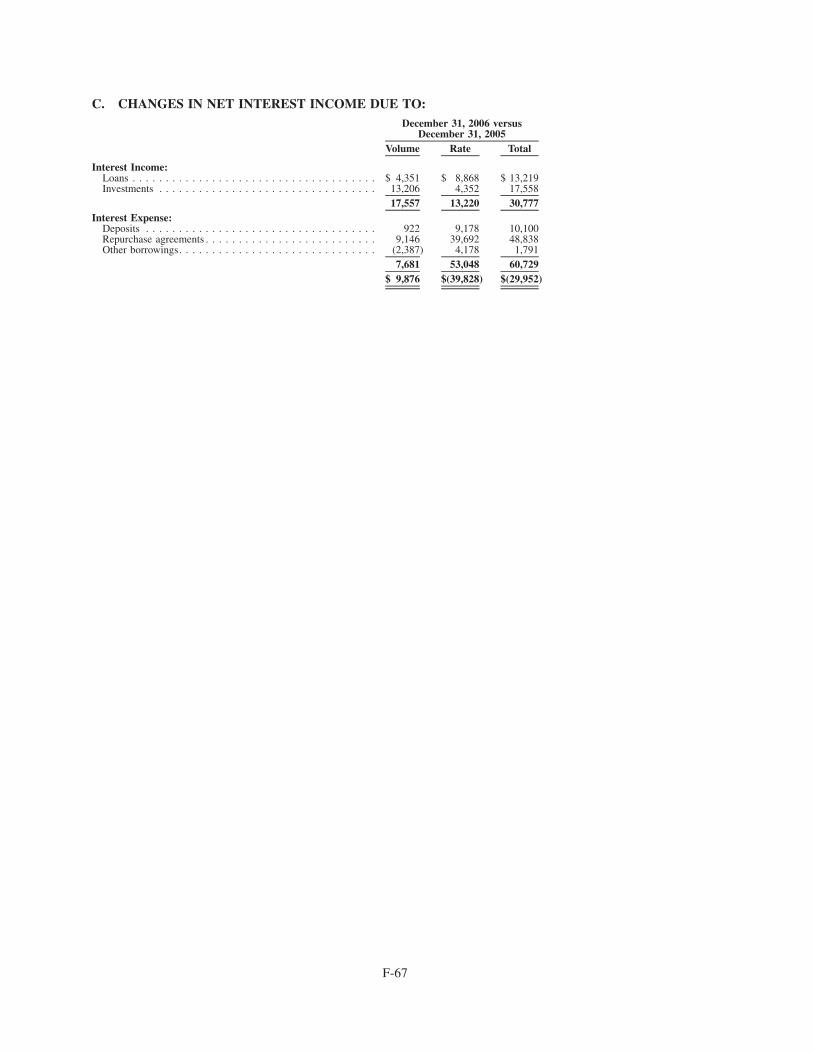
C. CHANGES IN NET INTEREST INCOME DUE TO:
Volume Rate Total
December 31, 2006 versusDecember 31, 2005
Interest Income:Loans . . . . . . . . . . . . . . . . . . . . . . . . . . . . . . . . . . . . . $ 4,351 $ 8,868 $ 13,219Investments . . . . . . . . . . . . . . . . . . . . . . . . . . . . . . . . . 13,206 4,352 17,558
17,557 13,220 30,777Interest Expense:
Deposits . . . . . . . . . . . . . . . . . . . . . . . . . . . . . . . . . . . 922 9,178 10,100Repurchase agreements . . . . . . . . . . . . . . . . . . . . . . . . . . 9,146 39,692 48,838Other borrowings. . . . . . . . . . . . . . . . . . . . . . . . . . . . . . (2,387) 4,178 1,791
7,681 53,048 60,729$ 9,876 $(39,828) $(29,952)
F-67
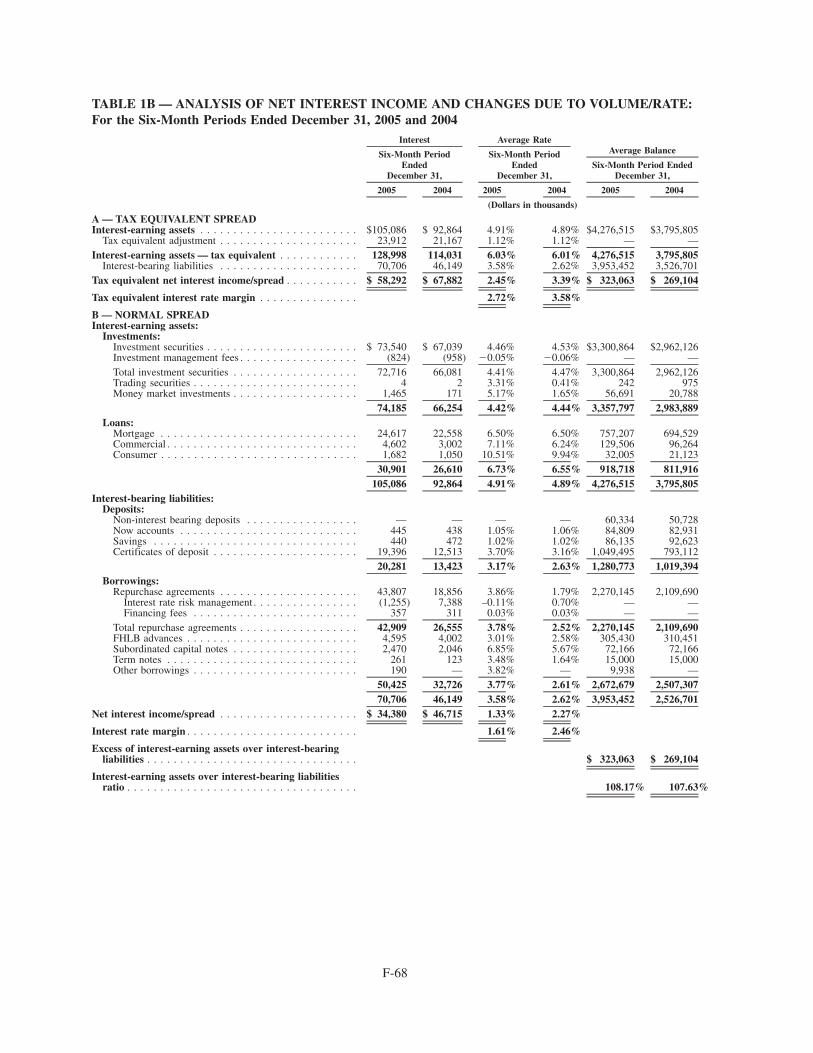
TABLE 1B — ANALYSIS OF NET INTEREST INCOME AND CHANGES DUE TO VOLUME/RATE:For the Six-Month Periods Ended December 31, 2005 and 2004
2005 2004 2005 2004 2005 2004
Six-Month PeriodEnded
December 31,
Interest
Six-Month PeriodEnded
December 31,
Average Rate
Six-Month Period EndedDecember 31,
Average Balance
(Dollars in thousands)
A — TAX EQUIVALENT SPREADInterest-earning assets . . . . . . . . . . . . . . . . . . . . . . . . $105,086 $ 92,864 4.91% 4.89% $4,276,515 $3,795,805
Tax equivalent adjustment . . . . . . . . . . . . . . . . . . . . . 23,912 21,167 1.12% 1.12% — —Interest-earning assets — tax equivalent . . . . . . . . . . . . 128,998 114,031 6.03% 6.01% 4,276,515 3,795,805
Interest-bearing liabilities . . . . . . . . . . . . . . . . . . . . . 70,706 46,149 3.58% 2.62% 3,953,452 3,526,701Tax equivalent net interest income/spread . . . . . . . . . . . $ 58,292 $ 67,882 2.45% 3.39% $ 323,063 $ 269,104
Tax equivalent interest rate margin . . . . . . . . . . . . . . . 2.72% 3.58%
B — NORMAL SPREADInterest-earning assets:
Investments:Investment securities . . . . . . . . . . . . . . . . . . . . . . . $ 73,540 $ 67,039 4.46% 4.53% $3,300,864 $2,962,126Investment management fees . . . . . . . . . . . . . . . . . . (824) (958) �0.05% �0.06% — —Total investment securities . . . . . . . . . . . . . . . . . . . 72,716 66,081 4.41% 4.47% 3,300,864 2,962,126Trading securities . . . . . . . . . . . . . . . . . . . . . . . . . 4 2 3.31% 0.41% 242 975Money market investments . . . . . . . . . . . . . . . . . . . 1,465 171 5.17% 1.65% 56,691 20,788
74,185 66,254 4.42% 4.44% 3,357,797 2,983,889Loans:
Mortgage . . . . . . . . . . . . . . . . . . . . . . . . . . . . . . 24,617 22,558 6.50% 6.50% 757,207 694,529Commercial . . . . . . . . . . . . . . . . . . . . . . . . . . . . . 4,602 3,002 7.11% 6.24% 129,506 96,264Consumer . . . . . . . . . . . . . . . . . . . . . . . . . . . . . . 1,682 1,050 10.51% 9.94% 32,005 21,123
30,901 26,610 6.73% 6.55% 918,718 811,916105,086 92,864 4.91% 4.89% 4,276,515 3,795,805
Interest-bearing liabilities:Deposits:
Non-interest bearing deposits . . . . . . . . . . . . . . . . . — — — — 60,334 50,728Now accounts . . . . . . . . . . . . . . . . . . . . . . . . . . . 445 438 1.05% 1.06% 84,809 82,931Savings . . . . . . . . . . . . . . . . . . . . . . . . . . . . . . . 440 472 1.02% 1.02% 86,135 92,623Certificates of deposit . . . . . . . . . . . . . . . . . . . . . . 19,396 12,513 3.70% 3.16% 1,049,495 793,112
20,281 13,423 3.17% 2.63% 1,280,773 1,019,394Borrowings:
Repurchase agreements . . . . . . . . . . . . . . . . . . . . . 43,807 18,856 3.86% 1.79% 2,270,145 2,109,690Interest rate risk management . . . . . . . . . . . . . . . . (1,255) 7,388 –0.11% 0.70% — —Financing fees . . . . . . . . . . . . . . . . . . . . . . . . . 357 311 0.03% 0.03% — —
Total repurchase agreements . . . . . . . . . . . . . . . . . . 42,909 26,555 3.78% 2.52% 2,270,145 2,109,690FHLB advances . . . . . . . . . . . . . . . . . . . . . . . . . . 4,595 4,002 3.01% 2.58% 305,430 310,451Subordinated capital notes . . . . . . . . . . . . . . . . . . . 2,470 2,046 6.85% 5.67% 72,166 72,166Term notes . . . . . . . . . . . . . . . . . . . . . . . . . . . . . 261 123 3.48% 1.64% 15,000 15,000Other borrowings . . . . . . . . . . . . . . . . . . . . . . . . . 190 — 3.82% — 9,938 —
50,425 32,726 3.77% 2.61% 2,672,679 2,507,30770,706 46,149 3.58% 2.62% 3,953,452 2,526,701
Net interest income/spread . . . . . . . . . . . . . . . . . . . . . $ 34,380 $ 46,715 1.33% 2.27%
Interest rate margin . . . . . . . . . . . . . . . . . . . . . . . . . . 1.61% 2.46%
Excess of interest-earning assets over interest-bearingliabilities . . . . . . . . . . . . . . . . . . . . . . . . . . . . . . . . $ 323,063 $ 269,104
Interest-earning assets over interest-bearing liabilitiesratio . . . . . . . . . . . . . . . . . . . . . . . . . . . . . . . . . . . 108.17% 107.63%
F-68
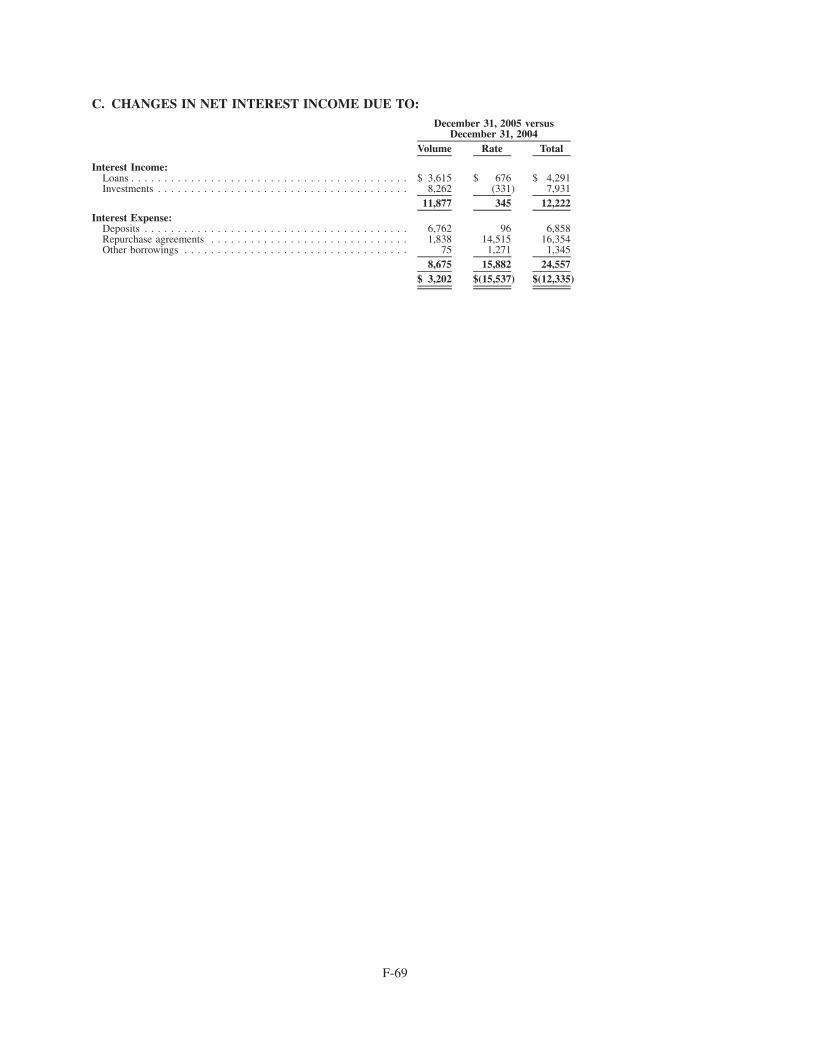
C. CHANGES IN NET INTEREST INCOME DUE TO:
Volume Rate Total
December 31, 2005 versusDecember 31, 2004
Interest Income:Loans . . . . . . . . . . . . . . . . . . . . . . . . . . . . . . . . . . . . . . . . . . $ 3,615 $ 676 $ 4,291Investments . . . . . . . . . . . . . . . . . . . . . . . . . . . . . . . . . . . . . . 8,262 (331) 7,931
11,877 345 12,222Interest Expense:
Deposits . . . . . . . . . . . . . . . . . . . . . . . . . . . . . . . . . . . . . . . . 6,762 96 6,858Repurchase agreements . . . . . . . . . . . . . . . . . . . . . . . . . . . . . . 1,838 14,515 16,354Other borrowings . . . . . . . . . . . . . . . . . . . . . . . . . . . . . . . . . . 75 1,271 1,345
8,675 15,882 24,557$ 3,202 $(15,537) $(12,335)
F-69
Net Interest Income
Comparison of the years ended December 31, 2007 and 2006:
Net interest income is affected by the difference between rates earned on the Group’s interest-earning assets andrates paid on its interest-bearing liabilities (interest rate spread) and the relative amounts of its interest-earningassets and interest-bearing liabilities (interest rate margin). As further discussed in the Risk Management section ofthis report, the Group monitors the composition and repricing of its assets and liabilities to maintain its net interestincome at adequate levels. Table 1 shows the major categories of interest-earning assets and interest-bearingliabilities, their respective interest income, expenses, yields and costs, and their impact on net interest income due tochanges in volume and rates for the years ended December 31, 2007 and 2006.
Net interest income increased 67.1% to $73.7 million in the year ended December 31, 2007, from $44.1 million inthe same period of 2006. This increase was due to a positive volume variance of $25.2 million, and a positive ratevariance of $31.9 million, as average interest earning assets increased 9.36% to $4.900 billion as of December 31,2007, from $4.481 billion as of December 31, 2006. The interest rate margin increased 53 basis points to 1.51% forthe year ended December 31, 2007, from 0.98% for the same period of 2006. The interest rate spread increased53 basis points to 1.27% for the year ended December 31, 2007, from 0.70% for the same period of 2006, due to a73 basis point increase in the average yield of interest earning assets to 5.91% from 5.18%, offset by a 16 basis pointincrease in the average cost of funds to 4.64% from 4.48%. Overall improvement was due to the repositioning of theGroup’s investment portfolio and related funding to improve margin in line with what the Group correctlyanticipated would be a more positively sloped yield curve.
Interest income increased 24.6% to $289.4 million for the year ended December 31, 2007, as compared to$232.3 million for the period of 2006, reflecting the increase in the average balance of interest earning assets andyields. Interest income is generated by investment securities, which accounted for 70.3% of total interest income,and from loans, which accounted for 29.7% of total interest income. Interest income from investments increased30.9% to $203.6 million, due to an 8.6% increase in the average balance of investments, which grew to$3.719 billion from $3.426 billion, and by 93 basis point increase in yield from 4.54% to 5.47%. Interest incomefrom loans increased 11.7% to $85.8 million, mainly due to a 11.9% increase in the average balance of loans, whichgrew to $1.181 billion from $1.655 billion. Yields remained constant at 7.27% in 2007 and 7.28% in 2006.
Interest expense increased 14.6%, to $215.6 million for year ended December 31, 2007, from $188.2 million for thesame period of 2006, due to a 16 basis point increase in the average cost of retail and wholesale funds, to 4.64% for2007, from 4.48% for the same period of 2006. The increase is due to higher average interest-bearing liabilities whichgrew to $4.643 billion, from $4.198 billion, year over year, in order to fund the growth of the Group’s investment andloan portfolios. The average cost of retail deposits increased 56 basis points, to 4.34% for the year ended December 31,2007, from 3.78% for the same period of 2006, and the average cost of wholesale funding sources decreased 2 basispoints, to 4.75%, from 4.77%, specifically reflected in repurchase agreements, which decreased 10 basis points, to4.68% from 4.78% due to the strategic repositioning of the repurchase agreements portfolio.
Comparison of the years ended December 31, 2006 and 2005:
Table 1A shows the major categories of interest-earning assets and interest-bearing liabilities, their respectiveinterest income, expenses, yields and costs, and their impact on net interest income due to changes in volume andrates for the years ended December 31, 2006 and 2005.
Net interest income decreased 40.4% to $44.1 million in the year ended December 31, 2006, from $74.1 million in thesame period of 2005. This decrease was due to a positive volume variance of $9.9 million, offset by a negative ratevariance of $39.8 million, as average interest earning assets increased 7.32% to $4.481 billion as of December 31,2006, from $4.175 billion as of December 31, 2005, while the interest rate margin declined 80 basis points to 0.98%for the year ended December 31, 2006, from 1.78% for the same period of 2005. The interest rate spread declined83 basis points to 0.70% for the year ended December 31, 2006, from 1.53% for the same period of 2005, due to a35 basis point increase in the average yield of interest earning assets to 5.18% from 4.83%, offset by a 118 basis pointincrease in the average cost of funds to 4.48% from 3.30%. The increase in the average yield of interest earning assetswas primarily due to the purchase of securities with higher rates, reflecting market conditions, prepayments of lower
F-70

rate mortgage loans and mortgage-backed securities, and the repricing of adjustable and floating interest ratecommercial loans. The increase in the average cost of funds was primarily due to higher rates paid on repurchaseagreements and other borrowings due to the impact of the increases in short-term borrowing rates.
Interest income increased 15.3% to $232.3 million for the year ended December 31, 2006, as compared to$201.5 million for the period of 2005, reflecting the increase in the average balance of interest earning assets and inyields. Interest income is generated by investment securities, which accounted for 66.7% of total interest income,and from loans, which accounted for 33.3% of total interest income. Interest income from investments increased9.3% to $155.5 million, due to a 4.1% increase in the average balance of investments, which grew to $3.426 billionfrom $3.290 billion, and by an 22 basis point increase in yield from 4.32% to 4.54%. Interest income from loansincreased 29.6% to $76.8 million, mainly due to a 19.2% increase in the average balance of loans, which grew to$1.055 billion from $885 million, and a 58 basis point increase in yield from 6.70% to 7.28%.
Interest expense increased 47.6%, to $188.2 million for the year ended December 31, 2006, from $127.5 million forthe same period of 2005, due to a 118 basis point increase in the average cost of retail and wholesale funds, to 4.48%for 2006, from 3.30% for the same period of 2005. The increase is due to higher average interest-bearing liabilitieswhich grew to $4.198 billion, from $3.858 billion, year over year, in order to fund the growth of the Group’sinvestment and loan portfolios. The average cost of retail deposits increased 74 basis points, to 3.78% for the yearended December 31, 2006, from 3.04% for the same period of 2005, and the average cost of wholesale fundingsources increased 135 basis points, to 4.77%, from 3.42%, substantially reflected in repurchase agreements, whichincreased 137 basis points, to 4.78% from 3.41%.
Comparison of the six-month periods ended December 31, 2005 and 2004:
Table 1B shows the major categories of interest-earning assets and interest-bearing liabilities, their respectiveinterest income, expenses, yields and costs, and their impact on net interest income due to changes in volume andrates for the six-month periods ended December 31, 2005 and 2004.
Net interest income decreased 26.4% to $34.4 million in the six-month period ended December 31, 2005, from$46.7 million in the same six-month period of 2004. This decrease was due to a positive volume variance of$3.2 million, offset by a negative rate variance of $15.5 million, as average interest earning assets increased 12.7%to $4.277 billion as of December 31, 2005, from $3.796 billion as of December 31, 2004, while the interest ratemargin declined 85 basis points to 1.61% for the same period of 2005, from 2.46% for the same period of 2004. Theinterest rate spread declined 94 basis points to 1.33% for the six-month period ended December 31, 2005, from2.27% for the same period of 2004, due to a 2 basis point increase in the average yield of interest earning assets to4.91% from 4.89%, in addition to a 96 basis point increase in the average cost of funds to 3.58% from 2.62%. Theincrease in the average yield of interest earning assets was primarily due to the purchase of securities with lowerrates, reflecting market conditions, prepayments of higher rate mortgage loans and mortgage-backed securities, andthe repricing of adjustable and floating interest rate commercial loans. The increase in the average cost of funds wasprimarily due to higher rates paid on repurchase agreements and other borrowings due to the impact of the increasesin short-term borrowing rates.
Interest income increased 13.2% to $105.1 million for the six-month period ended December 31, 2005, as comparedto $92.9 million for the same six-month period of 2004, reflecting a 12.7% increase in the average balance ofinterest earning assets, which grew to $4.277 billion in the six-month period ended December 31, 2005, from$3.796 billion for the same period of 2004, with an increase in yield to 4.91% from 4.89%. Interest income isgenerated by investment securities, which accounted for 70.6% of total interest income, and from loans, whichaccounted for 29.4% of total interest income. Interest income from investments increased 12.0% to $74.2 million,due to a 12.5% increase in the average balance of investments, which grew to $3.358 billion, partially offset by a2 basis point decline in yield from 4.44% to 4.42%. The increase in investments reflects a 21.5% increase inU.S. government and agency obligations, which grew to $1.251 billion as of December 31, 2005, from$819.0 million as of December 31, 2004. Interest income from loans increased 16.1% to $30.9 million, mainlydue to a 13.2% increase in the average balance of loans, which grew to $918.7 million, in addition to an 18 basispoint increase in yield from 6.55% to 6.73%. Total loans remained approximately at the same level comparingDecember 31, 2005 to June 30, 2005 at $903 million.
F-71
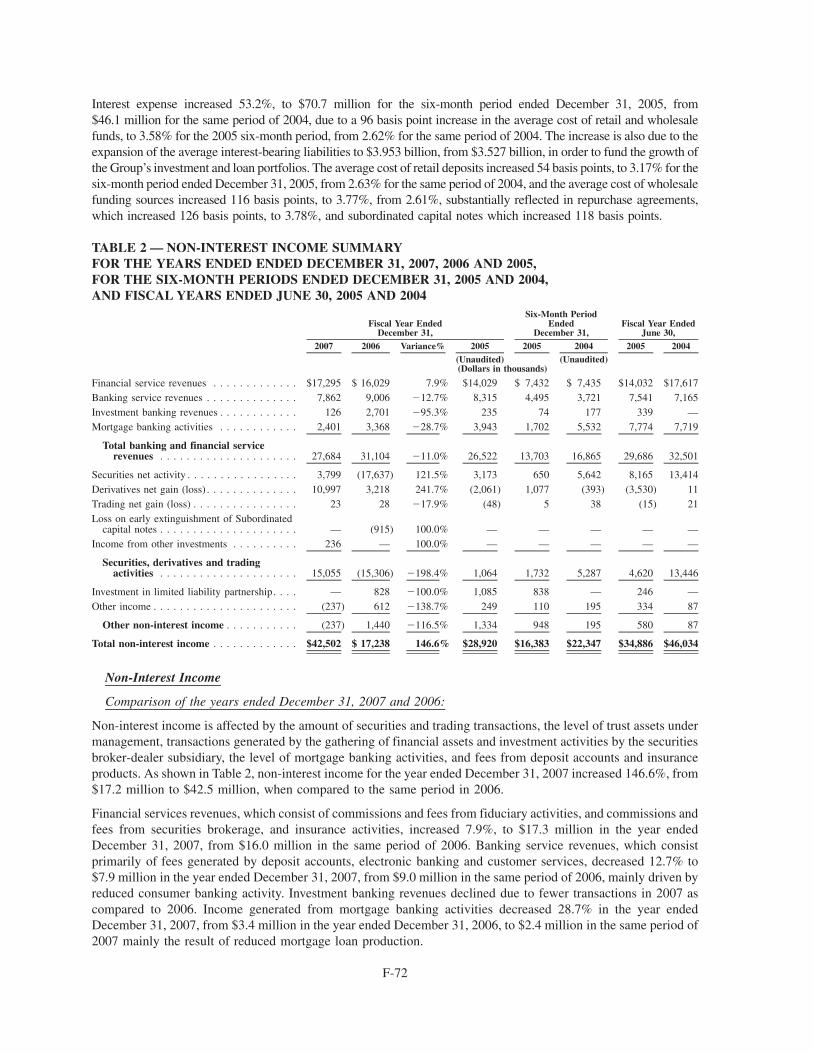
Interest expense increased 53.2%, to $70.7 million for the six-month period ended December 31, 2005, from$46.1 million for the same period of 2004, due to a 96 basis point increase in the average cost of retail and wholesalefunds, to 3.58% for the 2005 six-month period, from 2.62% for the same period of 2004. The increase is also due to theexpansion of the average interest-bearing liabilities to $3.953 billion, from $3.527 billion, in order to fund the growth ofthe Group’s investment and loan portfolios. The average cost of retail deposits increased 54 basis points, to 3.17% for thesix-month period ended December 31, 2005, from 2.63% for the same period of 2004, and the average cost of wholesalefunding sources increased 116 basis points, to 3.77%, from 2.61%, substantially reflected in repurchase agreements,which increased 126 basis points, to 3.78%, and subordinated capital notes which increased 118 basis points.
TABLE 2 — NON-INTEREST INCOME SUMMARYFOR THE YEARS ENDED ENDED DECEMBER 31, 2007, 2006 AND 2005,FOR THE SIX-MONTH PERIODS ENDED DECEMBER 31, 2005 AND 2004,AND FISCAL YEARS ENDED JUNE 30, 2005 AND 2004
2007 2006 Variance% 2005 2005 2004 2005 2004
Six-Month PeriodEnded
December 31,Fiscal Year Ended
December 31,Fiscal Year Ended
June 30,
(Unaudited) (Unaudited)(Dollars in thousands)
Financial service revenues . . . . . . . . . . . . . $17,295 $ 16,029 7.9% $14,029 $ 7,432 $ 7,435 $14,032 $17,617Banking service revenues . . . . . . . . . . . . . . 7,862 9,006 �12.7% 8,315 4,495 3,721 7,541 7,165Investment banking revenues . . . . . . . . . . . . 126 2,701 �95.3% 235 74 177 339 —Mortgage banking activities . . . . . . . . . . . . 2,401 3,368 �28.7% 3,943 1,702 5,532 7,774 7,719
Total banking and financial servicerevenues . . . . . . . . . . . . . . . . . . . . . 27,684 31,104 �11.0% 26,522 13,703 16,865 29,686 32,501
Securities net activity . . . . . . . . . . . . . . . . . 3,799 (17,637) 121.5% 3,173 650 5,642 8,165 13,414Derivatives net gain (loss) . . . . . . . . . . . . . . 10,997 3,218 241.7% (2,061) 1,077 (393) (3,530) 11Trading net gain (loss) . . . . . . . . . . . . . . . . 23 28 �17.9% (48) 5 38 (15) 21Loss on early extinguishment of Subordinated
capital notes . . . . . . . . . . . . . . . . . . . . . — (915) 100.0% — — — — —Income from other investments . . . . . . . . . . 236 — 100.0% — — — — —
Securities, derivatives and tradingactivities . . . . . . . . . . . . . . . . . . . . . 15,055 (15,306) �198.4% 1,064 1,732 5,287 4,620 13,446
Investment in limited liability partnership. . . . — 828 �100.0% 1,085 838 — 246 —Other income . . . . . . . . . . . . . . . . . . . . . . (237) 612 �138.7% 249 110 195 334 87
Other non-interest income . . . . . . . . . . . (237) 1,440 �116.5% 1,334 948 195 580 87
Total non-interest income . . . . . . . . . . . . . $42,502 $ 17,238 146.6% $28,920 $16,383 $22,347 $34,886 $46,034
Non-Interest Income
Comparison of the years ended December 31, 2007 and 2006:
Non-interest income is affected by the amount of securities and trading transactions, the level of trust assets undermanagement, transactions generated by the gathering of financial assets and investment activities by the securitiesbroker-dealer subsidiary, the level of mortgage banking activities, and fees from deposit accounts and insuranceproducts. As shown in Table 2, non-interest income for the year ended December 31, 2007 increased 146.6%, from$17.2 million to $42.5 million, when compared to the same period in 2006.
Financial services revenues, which consist of commissions and fees from fiduciary activities, and commissions andfees from securities brokerage, and insurance activities, increased 7.9%, to $17.3 million in the year endedDecember 31, 2007, from $16.0 million in the same period of 2006. Banking service revenues, which consistprimarily of fees generated by deposit accounts, electronic banking and customer services, decreased 12.7% to$7.9 million in the year ended December 31, 2007, from $9.0 million in the same period of 2006, mainly driven byreduced consumer banking activity. Investment banking revenues declined due to fewer transactions in 2007 ascompared to 2006. Income generated from mortgage banking activities decreased 28.7% in the year endedDecember 31, 2007, from $3.4 million in the year ended December 31, 2006, to $2.4 million in the same period of2007 mainly the result of reduced mortgage loan production.
F-72
Revenues from securities, derivatives and trading activities for the year ended December 31, 2007 reflects theGroup’s previously disclosed net gain of approximately $11 million from the July 2006 unwinding of interest rateswaps that had been used to hedge rising interest costs of short-term repurchase agreements. This gain was includedin other comprehensive income, and was being recognized into earnings as a reduction of interest expense onremaining short-term borrowings. The repurchase agreements restructuring, however, significantly reduced theGroup’s short-term borrowings during the March 2007 quarter, eliminating the forecasted transactions that theswaps were intended to hedge. As a result, Oriental recognized the remaining balance of $8.2 million (equal to$0.33 per basic and fully diluted share) of the gain as non-interest income in the quarter ended March 31, 2007.Revenues from securities, derivatives and trading activities in the year ended December 31, 2006 reflects the$16.0 million loss incurred with respect to the repositioning of the investment securities portfolio.
Comparison of the years ended December 31, 2006 and 2005:
Non-interest income is affected by the amount of securities and trading transactions, the level of trust assets undermanagement, transactions generated by the gathering of financial assets and investment activities by the securitiesbroker-dealer subsidiary, the level of mortgage banking activities, and fees from deposit accounts and insuranceproducts. As shown in Table 2, non-interest income for the year ended December 31, 2006 decreased 40.4%, from$28.9 million to $17.2 million, when compared to the same period in 2005.
Income generated from mortgage banking activities decreased 14.6% in the year ended December 31, 2006, from$3.9 million in the year ended December 31, 2005, to $3.4 million in the same period of 2006. Financial servicesrevenues, which consist of commissions and fees from fiduciary activities, and commissions and fees fromsecurities brokerage, and insurance activities, increased 14.3%, to $16.0 million in the year ended December 31,2006, from $14.0 million in the same period of 2005. Banking service revenues, which consist primarily of feesgenerated by deposit accounts, electronic banking and customer services, continued with an increase of 8.3% to$9.0 million in the year ended December 31, 2006, from $8.3 million in the same period of 2005, mainly driven bythe strategy of strengthening the Group’s banking franchise by expanding our ability to attract deposits and buildrelationships with individual, professional and commercial customers through aggressive marketing and theexpansion of the Group’s sales force.
Revenues from securities, derivatives and trading activities in the year ended December 31, 2006 reflects the$16.0 million loss incurred with respect to the repositioning of the investment securities portfolio partially offset byincreased gains on derivatives instruments due to a positive variance in the mark-to-market of such positions.
Comparison of the six-month periods ended December 31, 2005 and 2004:
As shown in Table 2, non-interest income for the six-month period ended December 31, 2005 decreased 26.7%,from $22.3 million to $16.4 million, when compared to the same period in 2004. Income generated from mortgagebanking activities decreased 69.2% in the six-month period ended December 31, 2005, from $5.5 million in the six-month period ended December 31, 2004, to $1.7 million in the same period of 2005.
Financial services revenues decreased 0.3% and 2.7%, respectively, to $4.1 million and $3.4 million in the six-month period ended December 31, 2005, from $4.1 million and $3.5 million in the same period of 2004. Decreasefor the period reflected the temporarily reduced market for public finance activities in Puerto Rico which affectsrevenues from brokerage and investment banking activities in the local retail public finance market.
Banking service revenues increased 16.5% to $4.5 million in the six-month period ended December 31, 2005, from$3.9 million in the same period of 2004.
Revenues from securities, derivatives and trading activities decreased 63.9% in the six-month period endedDecember 31, 2005 due to a net gain of $1.9 million in the 2005 six-month period from a net gain of $5.3 in the sameperiod of 2004. The reduction in securities net activity, which was principally due to the Group’s strategy ofretaining a higher amount of profitable investment securities to obtain recurring interest income, offset the positiveresults in derivatives activity, which reflected a net gain of $5,000 during the six-month period ended December 31,2005, compared to a $322,000 net loss in the same period of 2004.
F-73
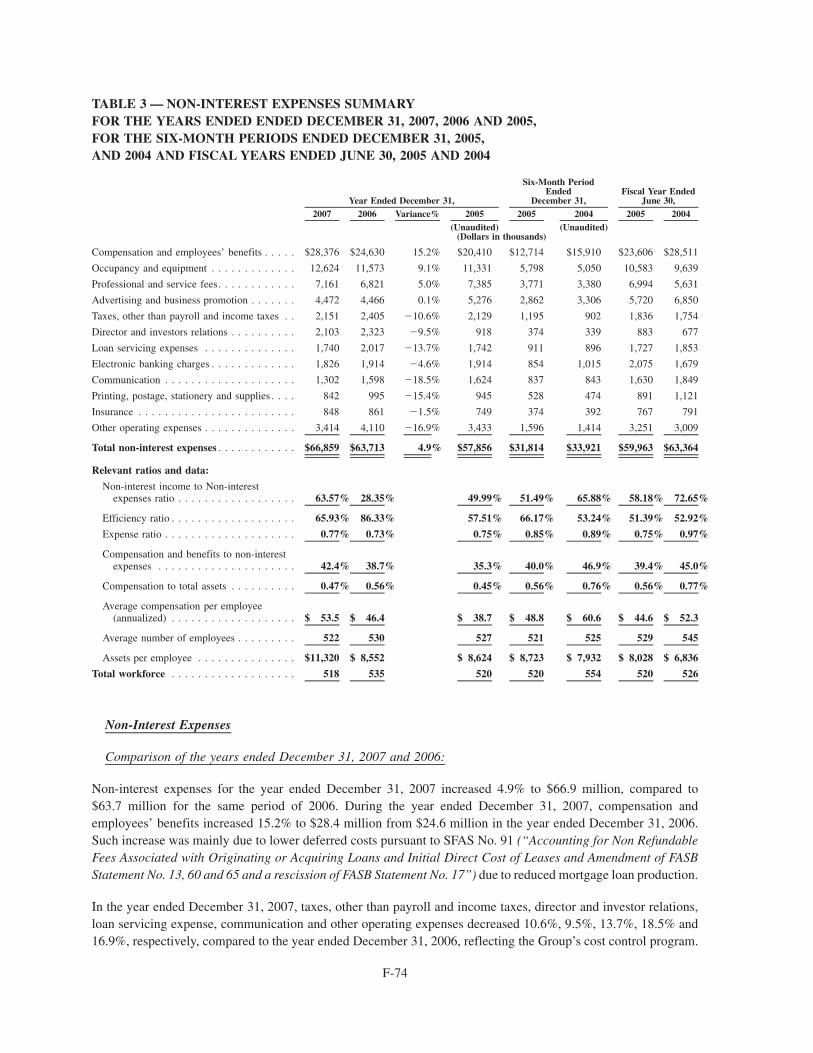
TABLE 3 — NON-INTEREST EXPENSES SUMMARYFOR THE YEARS ENDED ENDED DECEMBER 31, 2007, 2006 AND 2005,FOR THE SIX-MONTH PERIODS ENDED DECEMBER 31, 2005,AND 2004 AND FISCAL YEARS ENDED JUNE 30, 2005 AND 2004
2007 2006 Variance% 2005 2005 2004 2005 2004Year Ended December 31,
Six-Month PeriodEnded
December 31,Fiscal Year Ended
June 30,
(Unaudited) (Unaudited)(Dollars in thousands)
Compensation and employees’ benefits . . . . . $28,376 $24,630 15.2% $20,410 $12,714 $15,910 $23,606 $28,511
Occupancy and equipment . . . . . . . . . . . . . 12,624 11,573 9.1% 11,331 5,798 5,050 10,583 9,639
Professional and service fees. . . . . . . . . . . . 7,161 6,821 5.0% 7,385 3,771 3,380 6,994 5,631
Advertising and business promotion . . . . . . . 4,472 4,466 0.1% 5,276 2,862 3,306 5,720 6,850
Taxes, other than payroll and income taxes . . 2,151 2,405 �10.6% 2,129 1,195 902 1,836 1,754
Director and investors relations . . . . . . . . . . 2,103 2,323 �9.5% 918 374 339 883 677
Loan servicing expenses . . . . . . . . . . . . . . 1,740 2,017 �13.7% 1,742 911 896 1,727 1,853
Electronic banking charges . . . . . . . . . . . . . 1,826 1,914 �4.6% 1,914 854 1,015 2,075 1,679
Communication . . . . . . . . . . . . . . . . . . . . 1,302 1,598 �18.5% 1,624 837 843 1,630 1,849
Printing, postage, stationery and supplies . . . . 842 995 �15.4% 945 528 474 891 1,121
Insurance . . . . . . . . . . . . . . . . . . . . . . . . 848 861 �1.5% 749 374 392 767 791
Other operating expenses . . . . . . . . . . . . . . 3,414 4,110 �16.9% 3,433 1,596 1,414 3,251 3,009
Total non-interest expenses . . . . . . . . . . . . $66,859 $63,713 4.9% $57,856 $31,814 $33,921 $59,963 $63,364
Relevant ratios and data:
Non-interest income to Non-interestexpenses ratio . . . . . . . . . . . . . . . . . . 63.57% 28.35% 49.99% 51.49% 65.88% 58.18% 72.65%
Efficiency ratio . . . . . . . . . . . . . . . . . . . 65.93% 86.33% 57.51% 66.17% 53.24% 51.39% 52.92%
Expense ratio . . . . . . . . . . . . . . . . . . . . 0.77% 0.73% 0.75% 0.85% 0.89% 0.75% 0.97%
Compensation and benefits to non-interestexpenses . . . . . . . . . . . . . . . . . . . . . 42.4% 38.7% 35.3% 40.0% 46.9% 39.4% 45.0%
Compensation to total assets . . . . . . . . . . 0.47% 0.56% 0.45% 0.56% 0.76% 0.56% 0.77%
Average compensation per employee(annualized) . . . . . . . . . . . . . . . . . . . $ 53.5 $ 46.4 $ 38.7 $ 48.8 $ 60.6 $ 44.6 $ 52.3
Average number of employees . . . . . . . . . 522 530 527 521 525 529 545
Assets per employee . . . . . . . . . . . . . . . $11,320 $ 8,552 $ 8,624 $ 8,723 $ 7,932 $ 8,028 $ 6,836
Total workforce . . . . . . . . . . . . . . . . . . . 518 535 520 520 554 520 526
Non-Interest Expenses
Comparison of the years ended December 31, 2007 and 2006:
Non-interest expenses for the year ended December 31, 2007 increased 4.9% to $66.9 million, compared to$63.7 million for the same period of 2006. During the year ended December 31, 2007, compensation andemployees’ benefits increased 15.2% to $28.4 million from $24.6 million in the year ended December 31, 2006.Such increase was mainly due to lower deferred costs pursuant to SFAS No. 91 (“Accounting for Non RefundableFees Associated with Originating or Acquiring Loans and Initial Direct Cost of Leases and Amendment of FASBStatement No. 13, 60 and 65 and a rescission of FASB Statement No. 17”) due to reduced mortgage loan production.
In the year ended December 31, 2007, taxes, other than payroll and income taxes, director and investor relations,loan servicing expense, communication and other operating expenses decreased 10.6%, 9.5%, 13.7%, 18.5% and16.9%, respectively, compared to the year ended December 31, 2006, reflecting the Group’s cost control program.
F-74
Comparison of the years ended December 31, 2006 and 2005:
Non-interest expenses for the year ended December 31, 2006 increased 10.1% to $63.7 million, compared to$57.9 million for the same period of 2005. Non-interest expenses in the fourth quarter of 2006 includedapproximately $1.8 million primarily for a supplemental pension payment and charitable contributions made inrecognition of the Group’s former Chairman, President, and CEO enhancing the value of Oriental over the course ofhis 19 years of leadership. Excluding this amount, non-interest expenses for 2006 would have been $61.5 million.The 2005 expenses of $57.9 million reflected a $6.3 million reduction in non-cash compensation related to thevariable accounting for certain employee stock options. Excluding this non-cash adjustment, total non-interestexpenses for the year ended December 31, 2005 would have been $64.1 million.
During the year ended December 31, 2006, the cost of advertising and business promotions decreased 15.4% to$4.4 million from $5.3 million in the year ended December 31, 2005. Such reduction was mainly due to the Group’scontinued use of more selective promotional campaigns to enhance the market recognition of new and existingproducts, to increase fee-based revenues, and to strengthen the banking and financial services franchise.
In the year ended December 31, 2006, professional and service fees decreased 7.6%, from $7.4 million in 2005 to$6.8 million in 2006. The decrease was due to the effect of reviews performed by advisors in specific operationalareas to improve financial and operational performance and expenses associated with SOX implementation andadditional audit fees related to the change in the Group’s fiscal year incurred during 2005.
Comparison of the six-month periods ended December 31, 2005 and 2004:
Non-interest expenses in the six-month period ended December 31, 2005 decreased 6.2%, from $33.9 million in thesix-month period ended December 31, 2004 to $31.8 million in the same period of 2005. The decrease in non-interestexpenses was mainly the result of a 20.1% reduction in compensation and employee benefits expense from the six-month period ended December 31, 2004 to the comparative 2005 period, from $15.9 million to $12.7 million,respectively. The reduction was mainly due to the recording of compensation expense for the six-month period endedDecember 31, 2004 of $3.2 million as a result of the application of the variable accounting to outstanding optionsgranted to certain employees. No such expense was required for the six-month period ended December 31, 2005.
The increment in non-interest expenses, other than in compensation and employees’ benefits, during the com-parative six-month periods reflects the Group’s expansion and improvement of the Group’s sales capabilities,including additional experienced lenders, marketing, enhancing branch distribution and support risk managementprocesses. Also, these results include expenses for new technology for the implementation of PeopleSoft enterprisesoftware to increase efficiencies, and cost of documentation and testing required by SOX regarding management’sassessment of internal control over financial reporting. Consequently, expenses have been pared in other areas,consistent with management’s goal of limiting expense growth to those areas that directly contribute to increase theefficiency, service quality and profitability of the Group.
Occupancy and equipment expenses increased 14.8%, from $5.1 million in the six-month period endedDecember 31, 2004 to $5.8 million in the six-month period ended December 31, 2005, due to higher depreciationresulting from upgrading technology, infrastructure in our financial centers in order to improve efficiency and theacceleration of leasehold improvements amortization due to the move to new facilities in May 2006.
During the six-month period ended December 31, 2005, the cost of advertising and business promotions decreased20.5% to $2.9 million versus $3.3 million in the six-month period ended December 31, 2004. Such activity wasmainly due to management’s strategy of redistributing the marketing expenses for the 2005 six-month period endedDecember 31, as the Group continued its selective promotional campaign.
In the six-month period ended December 31, 2005, professional and service fees increased 11.6%, from $3.4 millionin the six-month period ended December 31 2004 to $3.8 million in the 2005 six-month period. The increase in theperiod was due to the effect of reviews performed by advisors in specific operational areas to improve financial andoperational performance and expenses associated with SOX implementation.
The aggregate decrease in communication, electronic banking charges and insurance is principally due to effectivecost controls without affecting the general growth in the Group’s business activities, products and services.
F-75
The rise in taxes other than payroll and income taxes, and other operating expenses is principally due to the generalgrowth in the Group’s business activities, products and services offered.
Provision for Loan Losses
Comparison of the years ended December 31, 2007 and 2006:
The provision for loan losses for the year ended December 31, 2007 totaled $6.6 million, a 49.3% increase from the$4.4 million reported for 2006, which is in line with the increase in non-performing loans of the Group. Based on ananalysis of the credit quality and the composition of the Group’s loan portfolio, management determined that theprovision for 2007 was adequate in order to maintain the allowance for loan losses at an adequate level.
Net credit losses increased 46.8% during 2007 primarily due to increased net credit losses from mortgage loans dueto the overall deterioration of the economy in Puerto Rico. Recoveries decreased from $677,000 for 2006 to$501,000 for 2007. As result, the recoveries to charge-offs ratio decreased from 18.4% in 2006, to 10.2% in 2007.Mortgage loan charge-offs in 2007 were $2.0 million as compared to $896,000 in 2006. Commercial loans net creditlosses increased to $252,000 in 2007, when compared with $161,000 in 2006. Commercial loans originated by theGroup are mainly collateralized by mortgages.
Net credit losses on consumer loans increased when compared to 2006. In 2007, net credit losses on consumer loanswere $2.1 million, an increase of 7.7% when compared to 2006 in which the Group had net credit losses of$2.0 million.
The Group evaluates all loans, some individually and others as homogeneous groups, for purposes of determiningimpairment. At December 31, 2007, the total investment in impaired commercial loans was $1.1 million. Impairedcommercial loans are measured based on the fair value of collateral. The Group determined that no specificimpairment allowance was required for such loans. The average investment in impaired commercial loans for theyear ended December 31, 2007 amounted to $1.5 million compared to $2.2 million for the year ended December 31,2006.
The Group follows a residential mortgage lending policy, in which more than 90% of its residential mortgageportfolio consists of fixed-rate, fully amortizing, well-documented loans. Furthermore, the Group has never beenactive in negative amortization loans or adjustable-rate mortgage loans, including those with teaser rates, and doesnot originate construction and development loans.
Please refer to the Allowance for Loan Losses and Non-Performing Assets section on Table 8 through Table 12 for amore detailed analysis of the allowances for loan losses, net credit losses and credit quality statistics.
Comparison of the years ended December 31, 2006 and 2005:
The provision for loan losses for the year ended December 31, 2006 totaled $4.4 million, a 28.6% increase from the$3.4 million reported for 2005, which is in line with the Group’s 34.3% growth in loans during 2006. Based on ananalysis of the credit quality and the composition of the Group’s loan portfolio, management determined that theprovision for 2006 was adequate in order to maintain the allowance for loan losses at an adequate level.
The 30.9% reduction in net credit losses during 2006 was primarily due to a $1.4 million decrease in net creditlosses from mortgage loans. Recoveries increased from $597,000 for 2005 to $677,000 for 2006. As result, therecoveries to charge-offs ratio increased from 15.1% in 2005, to 18.4% in 2006.
Mortgage loan charge-offs in 2006 were $896,000 as compared to $2.4 million in 2005. Commercial loans net creditlosses decreased to $161,000 in 2006, when compared from $646,000 in 2005. The commercial lending that theGroup originates is mainly collateralized by mortgages.
Net credit losses on consumer loans increased when compared to 2005. In 2006, net credit losses on consumer loanswere $2.0 million, an increase of 40.9% when compared to 2005 in which the Group had net credit losses of$1.4 million, reflecting the deterioration in consumer lending due to adverse economic conditions in Puerto Rico.
The Group evaluates all loans, some individually and others as homogeneous groups, for purposes of determiningimpairment. At December 31, 2006, the total investment in impaired commercial loans was $2.0 million. Impaired
F-76
commercial loans are measured based on the fair value of collateral. The Group determined that no specificimpairment allowance was required for such loans. The average investment in impaired commercial loans for theyear ended December 31, 2006 amounted to $2.2 million compared to $3.2 million for the six-month period endedDecember 31, 2005.
Please refer to the Allowance for Loan Losses and Non-Performing Assets section on Table 8 through Table 12 for amore detailed analysis of the allowances for loan losses, net credit losses and credit quality statistics.
Comparison of the six-month periods ended December 31, 2005 and 2004:
The provision for loan losses for the six-month period ended December 31, 2005 totaled $1.9 million, a 5.4%increase from the $1.8 million reported for the six-month period ended December 31, 2004. Based on an analysis ofthe credit quality and the composition of the Group’s loan portfolio, management determined that the provision wasadequate in order to maintain the allowance for loan losses at an appropriate level.
The reduction in net credit losses of 1.5% during the six-month period ended December 31, 2005 was primarily dueto a $568,000 decrease in net credit losses from mortgage loans. Recoveries decreased from $438,000 for the six-month period ended December 31, 2004 to $314,000 for the corresponding 2005 six-month period. As result, therecoveries to charge-offs ratio decreased from 19.6% in the six-month period ended December 31, 2004 to 15.1% inthe corresponding 2005 six-month period.
Mortgage loan charge-offs in the six-month period ended December 31, 2005 were $774,000 as compared to$1.2 million in the same period of 2004. Commercial loans net credit losses increased to $164,000 in the 2005 six-month period, when compared to $25,000 in the same period of 2004.
Net credit losses on consumer loans increased when compared with the 2004 period. In the six-month period endedDecember 31, 2005, net credit losses on consumer loans were $974,000, an increase of 70.4% when compared withthe same period of 2004 in which the Group had net credit losses of $571,000.
At December 31, 2005, the total investment in impaired commercial loans was $3.6 million. The Group determinedthat no specific impairment allowance was required for such loans. The average investment in impaired commercialloans for the year ended December 31, 2005 amounted to $3.2 million compared to $2.3 million for the year endedJune 30, 2005.
Income Taxes
The income tax expense was $1.6 million for the year ended December 31, 2007, as compared to a benefit of$1.6 million for 2006. The tax benefit in 2006 takes into account, among other things, the expiration of certain taxcontingencies. Also, the effective income tax rate in 2007 was lower than the 39% statutory tax rate for the Group,due to the high level of tax-advantaged interest income earned on certain investments and loans, net of thedisallowance of related expenses attributable to exempt income. Exempt interest relates principally to interestearned on obligations of the United States and Puerto Rico governments and certain mortgage-backed securities,including securities held by the Group’s international banking entity.
FINANCIAL CONDITION
Assets Owned
At December 31, 2007, the Group’s total assets amounted to $6.000 billion, an increase of 37.2% when compared to$4.372 billion at December 31, 2006, and interest-earning assets reached $5.765 billion, up 37.1%, versus$4.200 billion at December 31, 2006.
As detailed in Table 4, investments are the Group’s largest interest-earning assets component. Investmentsprincipally consist of money market instruments, U.S. government and agency bonds, mortgage-backed securitiesand Puerto Rico government and agency bonds. At December 31, 2007, the investment portfolio increased 53.5% to$4.586 billion, from $2.987 billion as of December 31, 2006, principally as a result of the repositioning of theavailable-for-sale portfolio and the market opportunities taken to improve the Group’s interest margins.
F-77
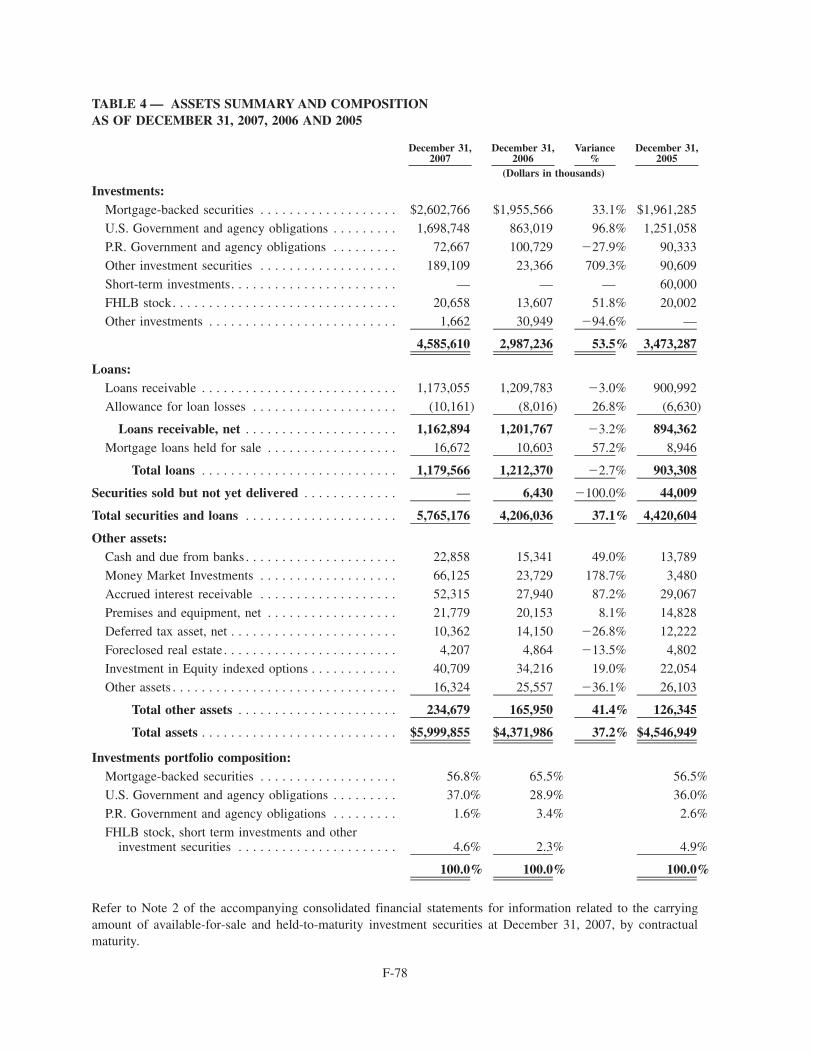
TABLE 4 — ASSETS SUMMARY AND COMPOSITIONAS OF DECEMBER 31, 2007, 2006 AND 2005
December 31,2007
December 31,2006
Variance%
December 31,2005
(Dollars in thousands)
Investments:Mortgage-backed securities . . . . . . . . . . . . . . . . . . . $2,602,766 $1,955,566 33.1% $1,961,285
U.S. Government and agency obligations . . . . . . . . . 1,698,748 863,019 96.8% 1,251,058
P.R. Government and agency obligations . . . . . . . . . 72,667 100,729 �27.9% 90,333
Other investment securities . . . . . . . . . . . . . . . . . . . 189,109 23,366 709.3% 90,609
Short-term investments. . . . . . . . . . . . . . . . . . . . . . . — — — 60,000
FHLB stock. . . . . . . . . . . . . . . . . . . . . . . . . . . . . . . 20,658 13,607 51.8% 20,002Other investments . . . . . . . . . . . . . . . . . . . . . . . . . . 1,662 30,949 �94.6% —
4,585,610 2,987,236 53.5% 3,473,287
Loans:Loans receivable . . . . . . . . . . . . . . . . . . . . . . . . . . . 1,173,055 1,209,783 �3.0% 900,992
Allowance for loan losses . . . . . . . . . . . . . . . . . . . . (10,161) (8,016) 26.8% (6,630)
Loans receivable, net . . . . . . . . . . . . . . . . . . . . . 1,162,894 1,201,767 �3.2% 894,362Mortgage loans held for sale . . . . . . . . . . . . . . . . . . 16,672 10,603 57.2% 8,946
Total loans . . . . . . . . . . . . . . . . . . . . . . . . . . . 1,179,566 1,212,370 �2.7% 903,308
Securities sold but not yet delivered . . . . . . . . . . . . . — 6,430 �100.0% 44,009
Total securities and loans . . . . . . . . . . . . . . . . . . . . . 5,765,176 4,206,036 37.1% 4,420,604
Other assets:Cash and due from banks . . . . . . . . . . . . . . . . . . . . . 22,858 15,341 49.0% 13,789
Money Market Investments . . . . . . . . . . . . . . . . . . . 66,125 23,729 178.7% 3,480
Accrued interest receivable . . . . . . . . . . . . . . . . . . . 52,315 27,940 87.2% 29,067
Premises and equipment, net . . . . . . . . . . . . . . . . . . 21,779 20,153 8.1% 14,828
Deferred tax asset, net . . . . . . . . . . . . . . . . . . . . . . . 10,362 14,150 �26.8% 12,222
Foreclosed real estate . . . . . . . . . . . . . . . . . . . . . . . . 4,207 4,864 �13.5% 4,802
Investment in Equity indexed options . . . . . . . . . . . . 40,709 34,216 19.0% 22,054
Other assets . . . . . . . . . . . . . . . . . . . . . . . . . . . . . . . 16,324 25,557 �36.1% 26,103
Total other assets . . . . . . . . . . . . . . . . . . . . . . 234,679 165,950 41.4% 126,345
Total assets . . . . . . . . . . . . . . . . . . . . . . . . . . . $5,999,855 $4,371,986 37.2% $4,546,949
Investments portfolio composition:Mortgage-backed securities . . . . . . . . . . . . . . . . . . . 56.8% 65.5% 56.5%
U.S. Government and agency obligations . . . . . . . . . 37.0% 28.9% 36.0%
P.R. Government and agency obligations . . . . . . . . . 1.6% 3.4% 2.6%
FHLB stock, short term investments and otherinvestment securities . . . . . . . . . . . . . . . . . . . . . . 4.6% 2.3% 4.9%
100.0% 100.0% 100.0%
Refer to Note 2 of the accompanying consolidated financial statements for information related to the carryingamount of available-for-sale and held-to-maturity investment securities at December 31, 2007, by contractualmaturity.
F-78
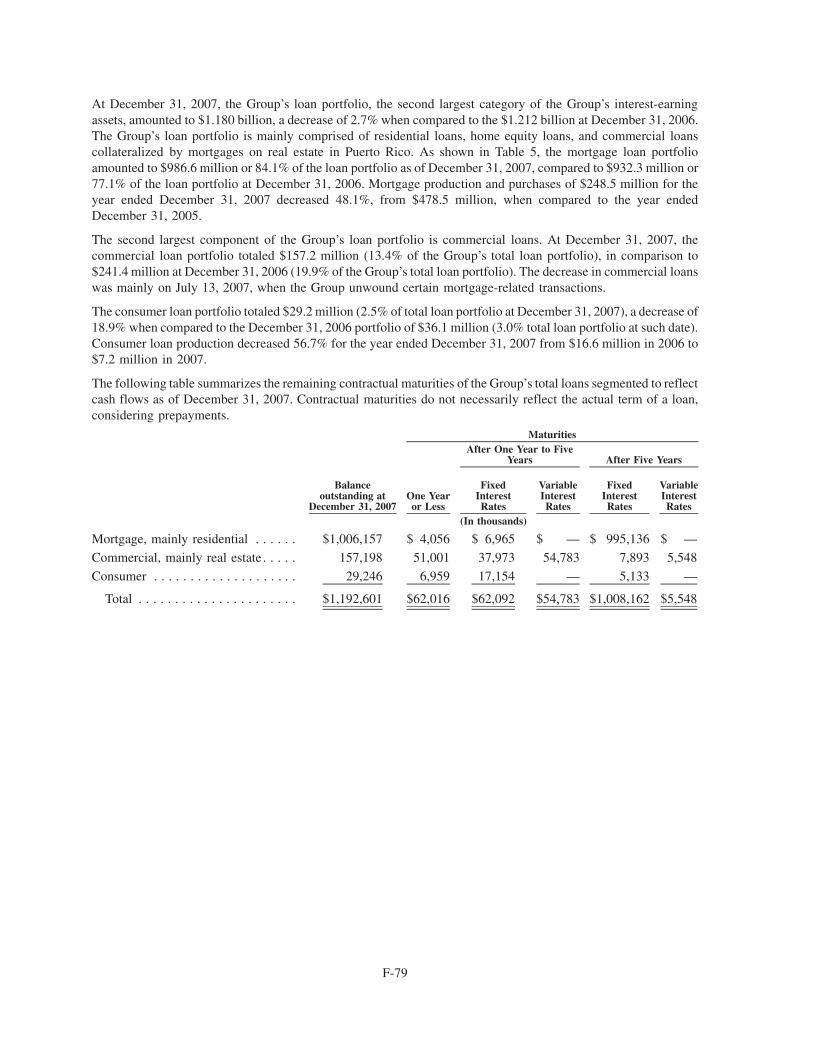
At December 31, 2007, the Group’s loan portfolio, the second largest category of the Group’s interest-earningassets, amounted to $1.180 billion, a decrease of 2.7% when compared to the $1.212 billion at December 31, 2006.The Group’s loan portfolio is mainly comprised of residential loans, home equity loans, and commercial loanscollateralized by mortgages on real estate in Puerto Rico. As shown in Table 5, the mortgage loan portfolioamounted to $986.6 million or 84.1% of the loan portfolio as of December 31, 2007, compared to $932.3 million or77.1% of the loan portfolio at December 31, 2006. Mortgage production and purchases of $248.5 million for theyear ended December 31, 2007 decreased 48.1%, from $478.5 million, when compared to the year endedDecember 31, 2005.
The second largest component of the Group’s loan portfolio is commercial loans. At December 31, 2007, thecommercial loan portfolio totaled $157.2 million (13.4% of the Group’s total loan portfolio), in comparison to$241.4 million at December 31, 2006 (19.9% of the Group’s total loan portfolio). The decrease in commercial loanswas mainly on July 13, 2007, when the Group unwound certain mortgage-related transactions.
The consumer loan portfolio totaled $29.2 million (2.5% of total loan portfolio at December 31, 2007), a decrease of18.9% when compared to the December 31, 2006 portfolio of $36.1 million (3.0% total loan portfolio at such date).Consumer loan production decreased 56.7% for the year ended December 31, 2007 from $16.6 million in 2006 to$7.2 million in 2007.
The following table summarizes the remaining contractual maturities of the Group’s total loans segmented to reflectcash flows as of December 31, 2007. Contractual maturities do not necessarily reflect the actual term of a loan,considering prepayments.
Balanceoutstanding at
December 31, 2007One Yearor Less
FixedInterestRates
VariableInterestRates
FixedInterestRates
VariableInterestRates
After One Year to FiveYears After Five Years
Maturities
(In thousands)
Mortgage, mainly residential . . . . . . $1,006,157 $ 4,056 $ 6,965 $ — $ 995,136 $ —
Commercial, mainly real estate . . . . . 157,198 51,001 37,973 54,783 7,893 5,548
Consumer . . . . . . . . . . . . . . . . . . . . 29,246 6,959 17,154 — 5,133 —
Total . . . . . . . . . . . . . . . . . . . . . . $1,192,601 $62,016 $62,092 $54,783 $1,008,162 $5,548
F-79
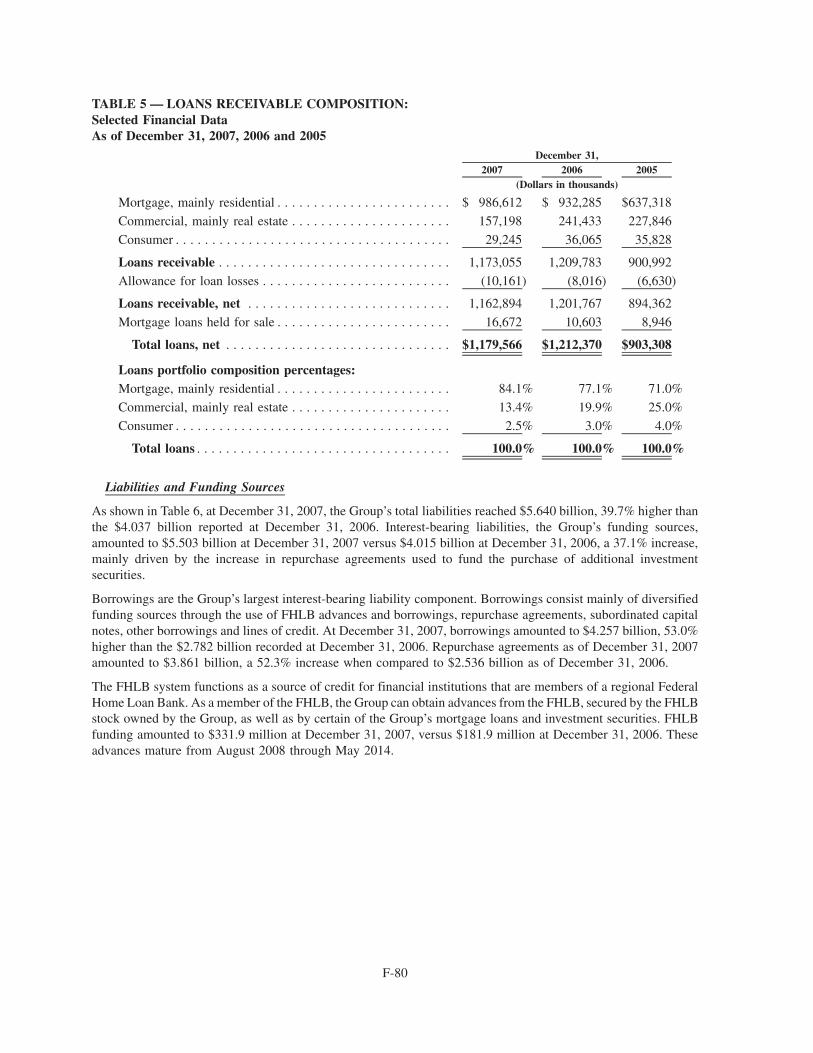
TABLE 5 — LOANS RECEIVABLE COMPOSITION:Selected Financial DataAs of December 31, 2007, 2006 and 2005
2007 2006 2005December 31,
(Dollars in thousands)
Mortgage, mainly residential . . . . . . . . . . . . . . . . . . . . . . . . $ 986,612 $ 932,285 $637,318
Commercial, mainly real estate . . . . . . . . . . . . . . . . . . . . . . 157,198 241,433 227,846
Consumer . . . . . . . . . . . . . . . . . . . . . . . . . . . . . . . . . . . . . . 29,245 36,065 35,828
Loans receivable . . . . . . . . . . . . . . . . . . . . . . . . . . . . . . . . 1,173,055 1,209,783 900,992
Allowance for loan losses . . . . . . . . . . . . . . . . . . . . . . . . . . (10,161) (8,016) (6,630)
Loans receivable, net . . . . . . . . . . . . . . . . . . . . . . . . . . . . 1,162,894 1,201,767 894,362
Mortgage loans held for sale . . . . . . . . . . . . . . . . . . . . . . . . 16,672 10,603 8,946
Total loans, net . . . . . . . . . . . . . . . . . . . . . . . . . . . . . . . $1,179,566 $1,212,370 $903,308
Loans portfolio composition percentages:Mortgage, mainly residential . . . . . . . . . . . . . . . . . . . . . . . . 84.1% 77.1% 71.0%
Commercial, mainly real estate . . . . . . . . . . . . . . . . . . . . . . 13.4% 19.9% 25.0%
Consumer . . . . . . . . . . . . . . . . . . . . . . . . . . . . . . . . . . . . . . 2.5% 3.0% 4.0%
Total loans . . . . . . . . . . . . . . . . . . . . . . . . . . . . . . . . . . . 100.0% 100.0% 100.0%
Liabilities and Funding Sources
As shown in Table 6, at December 31, 2007, the Group’s total liabilities reached $5.640 billion, 39.7% higher thanthe $4.037 billion reported at December 31, 2006. Interest-bearing liabilities, the Group’s funding sources,amounted to $5.503 billion at December 31, 2007 versus $4.015 billion at December 31, 2006, a 37.1% increase,mainly driven by the increase in repurchase agreements used to fund the purchase of additional investmentsecurities.
Borrowings are the Group’s largest interest-bearing liability component. Borrowings consist mainly of diversifiedfunding sources through the use of FHLB advances and borrowings, repurchase agreements, subordinated capitalnotes, other borrowings and lines of credit. At December 31, 2007, borrowings amounted to $4.257 billion, 53.0%higher than the $2.782 billion recorded at December 31, 2006. Repurchase agreements as of December 31, 2007amounted to $3.861 billion, a 52.3% increase when compared to $2.536 billion as of December 31, 2006.
The FHLB system functions as a source of credit for financial institutions that are members of a regional FederalHome Loan Bank. As a member of the FHLB, the Group can obtain advances from the FHLB, secured by the FHLBstock owned by the Group, as well as by certain of the Group’s mortgage loans and investment securities. FHLBfunding amounted to $331.9 million at December 31, 2007, versus $181.9 million at December 31, 2006. Theseadvances mature from August 2008 through May 2014.
F-80
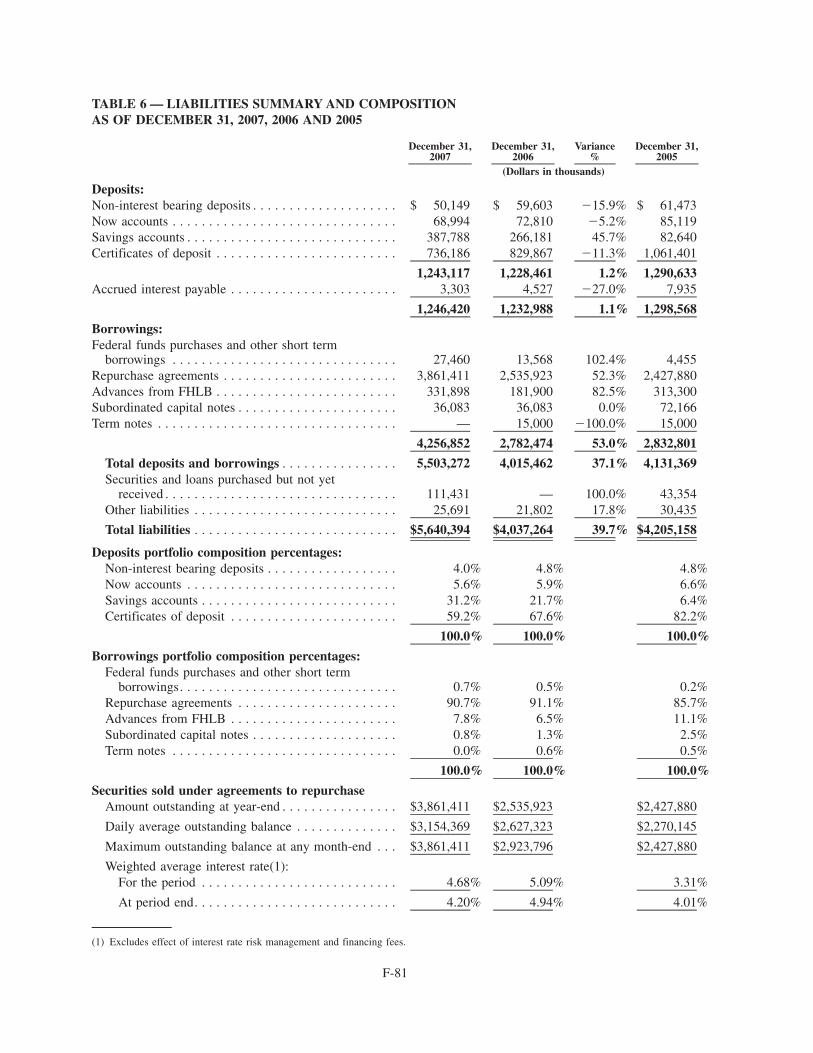
TABLE 6 — LIABILITIES SUMMARY AND COMPOSITIONAS OF DECEMBER 31, 2007, 2006 AND 2005
December 31,2007
December 31,2006
Variance%
December 31,2005
(Dollars in thousands)
Deposits:Non-interest bearing deposits . . . . . . . . . . . . . . . . . . . . $ 50,149 $ 59,603 �15.9% $ 61,473Now accounts . . . . . . . . . . . . . . . . . . . . . . . . . . . . . . . 68,994 72,810 �5.2% 85,119Savings accounts . . . . . . . . . . . . . . . . . . . . . . . . . . . . . 387,788 266,181 45.7% 82,640Certificates of deposit . . . . . . . . . . . . . . . . . . . . . . . . . 736,186 829,867 �11.3% 1,061,401
1,243,117 1,228,461 1.2% 1,290,633Accrued interest payable . . . . . . . . . . . . . . . . . . . . . . . 3,303 4,527 �27.0% 7,935
1,246,420 1,232,988 1.1% 1,298,568
Borrowings:Federal funds purchases and other short term
borrowings . . . . . . . . . . . . . . . . . . . . . . . . . . . . . . . 27,460 13,568 102.4% 4,455Repurchase agreements . . . . . . . . . . . . . . . . . . . . . . . . 3,861,411 2,535,923 52.3% 2,427,880Advances from FHLB . . . . . . . . . . . . . . . . . . . . . . . . . 331,898 181,900 82.5% 313,300Subordinated capital notes . . . . . . . . . . . . . . . . . . . . . . 36,083 36,083 0.0% 72,166Term notes . . . . . . . . . . . . . . . . . . . . . . . . . . . . . . . . . — 15,000 �100.0% 15,000
4,256,852 2,782,474 53.0% 2,832,801
Total deposits and borrowings . . . . . . . . . . . . . . . . 5,503,272 4,015,462 37.1% 4,131,369Securities and loans purchased but not yet
received . . . . . . . . . . . . . . . . . . . . . . . . . . . . . . . . 111,431 — 100.0% 43,354Other liabilities . . . . . . . . . . . . . . . . . . . . . . . . . . . . 25,691 21,802 17.8% 30,435
Total liabilities . . . . . . . . . . . . . . . . . . . . . . . . . . . . $5,640,394 $4,037,264 39.7% $4,205,158
Deposits portfolio composition percentages:Non-interest bearing deposits . . . . . . . . . . . . . . . . . . 4.0% 4.8% 4.8%Now accounts . . . . . . . . . . . . . . . . . . . . . . . . . . . . . 5.6% 5.9% 6.6%Savings accounts . . . . . . . . . . . . . . . . . . . . . . . . . . . 31.2% 21.7% 6.4%Certificates of deposit . . . . . . . . . . . . . . . . . . . . . . . 59.2% 67.6% 82.2%
100.0% 100.0% 100.0%
Borrowings portfolio composition percentages:Federal funds purchases and other short term
borrowings. . . . . . . . . . . . . . . . . . . . . . . . . . . . . . 0.7% 0.5% 0.2%Repurchase agreements . . . . . . . . . . . . . . . . . . . . . . 90.7% 91.1% 85.7%Advances from FHLB . . . . . . . . . . . . . . . . . . . . . . . 7.8% 6.5% 11.1%Subordinated capital notes . . . . . . . . . . . . . . . . . . . . 0.8% 1.3% 2.5%Term notes . . . . . . . . . . . . . . . . . . . . . . . . . . . . . . . 0.0% 0.6% 0.5%
100.0% 100.0% 100.0%
Securities sold under agreements to repurchaseAmount outstanding at year-end . . . . . . . . . . . . . . . . $3,861,411 $2,535,923 $2,427,880
Daily average outstanding balance . . . . . . . . . . . . . . $3,154,369 $2,627,323 $2,270,145
Maximum outstanding balance at any month-end . . . $3,861,411 $2,923,796 $2,427,880
Weighted average interest rate(1):For the period . . . . . . . . . . . . . . . . . . . . . . . . . . . 4.68% 5.09% 3.31%
At period end. . . . . . . . . . . . . . . . . . . . . . . . . . . . 4.20% 4.94% 4.01%
(1) Excludes effect of interest rate risk management and financing fees.
F-81
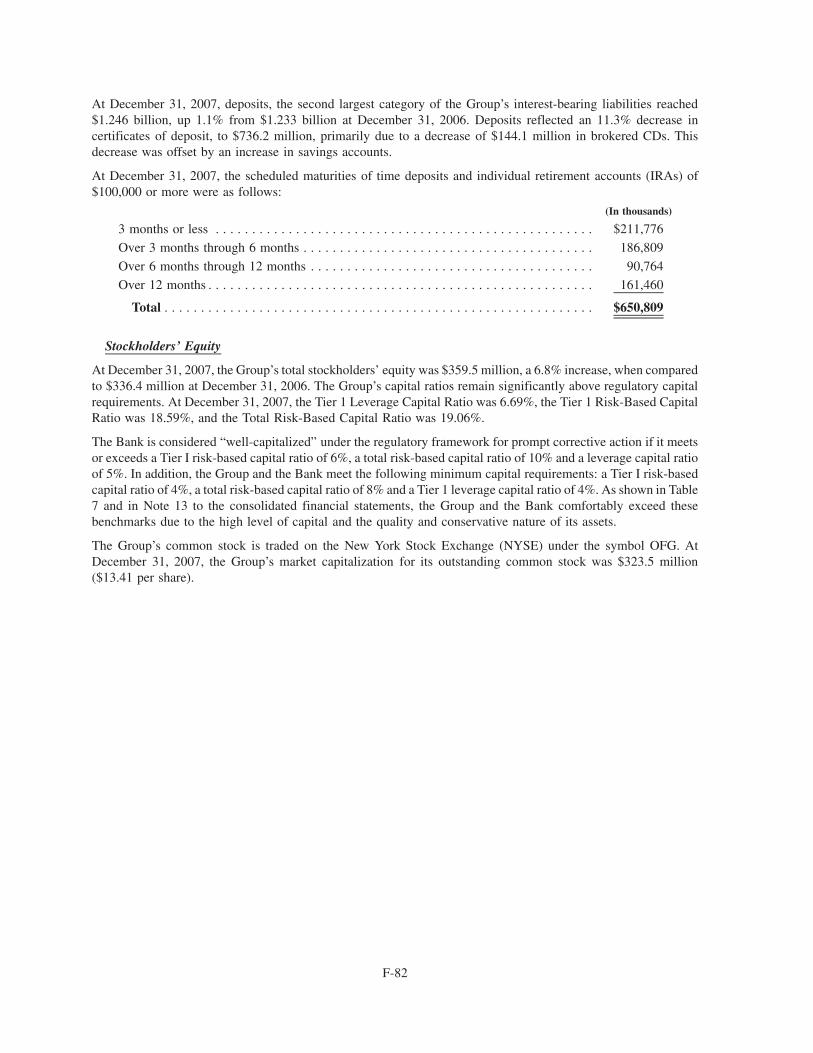
At December 31, 2007, deposits, the second largest category of the Group’s interest-bearing liabilities reached$1.246 billion, up 1.1% from $1.233 billion at December 31, 2006. Deposits reflected an 11.3% decrease incertificates of deposit, to $736.2 million, primarily due to a decrease of $144.1 million in brokered CDs. Thisdecrease was offset by an increase in savings accounts.
At December 31, 2007, the scheduled maturities of time deposits and individual retirement accounts (IRAs) of$100,000 or more were as follows:
(In thousands)
3 months or less . . . . . . . . . . . . . . . . . . . . . . . . . . . . . . . . . . . . . . . . . . . . . . . . . . . . $211,776
Over 3 months through 6 months . . . . . . . . . . . . . . . . . . . . . . . . . . . . . . . . . . . . . . . . 186,809
Over 6 months through 12 months . . . . . . . . . . . . . . . . . . . . . . . . . . . . . . . . . . . . . . . 90,764
Over 12 months . . . . . . . . . . . . . . . . . . . . . . . . . . . . . . . . . . . . . . . . . . . . . . . . . . . . . 161,460
Total . . . . . . . . . . . . . . . . . . . . . . . . . . . . . . . . . . . . . . . . . . . . . . . . . . . . . . . . . . . $650,809
Stockholders’ Equity
At December 31, 2007, the Group’s total stockholders’ equity was $359.5 million, a 6.8% increase, when comparedto $336.4 million at December 31, 2006. The Group’s capital ratios remain significantly above regulatory capitalrequirements. At December 31, 2007, the Tier 1 Leverage Capital Ratio was 6.69%, the Tier 1 Risk-Based CapitalRatio was 18.59%, and the Total Risk-Based Capital Ratio was 19.06%.
The Bank is considered “well-capitalized” under the regulatory framework for prompt corrective action if it meetsor exceeds a Tier I risk-based capital ratio of 6%, a total risk-based capital ratio of 10% and a leverage capital ratioof 5%. In addition, the Group and the Bank meet the following minimum capital requirements: a Tier I risk-basedcapital ratio of 4%, a total risk-based capital ratio of 8% and a Tier 1 leverage capital ratio of 4%. As shown in Table7 and in Note 13 to the consolidated financial statements, the Group and the Bank comfortably exceed thesebenchmarks due to the high level of capital and the quality and conservative nature of its assets.
The Group’s common stock is traded on the New York Stock Exchange (NYSE) under the symbol OFG. AtDecember 31, 2007, the Group’s market capitalization for its outstanding common stock was $323.5 million($13.41 per share).
F-82
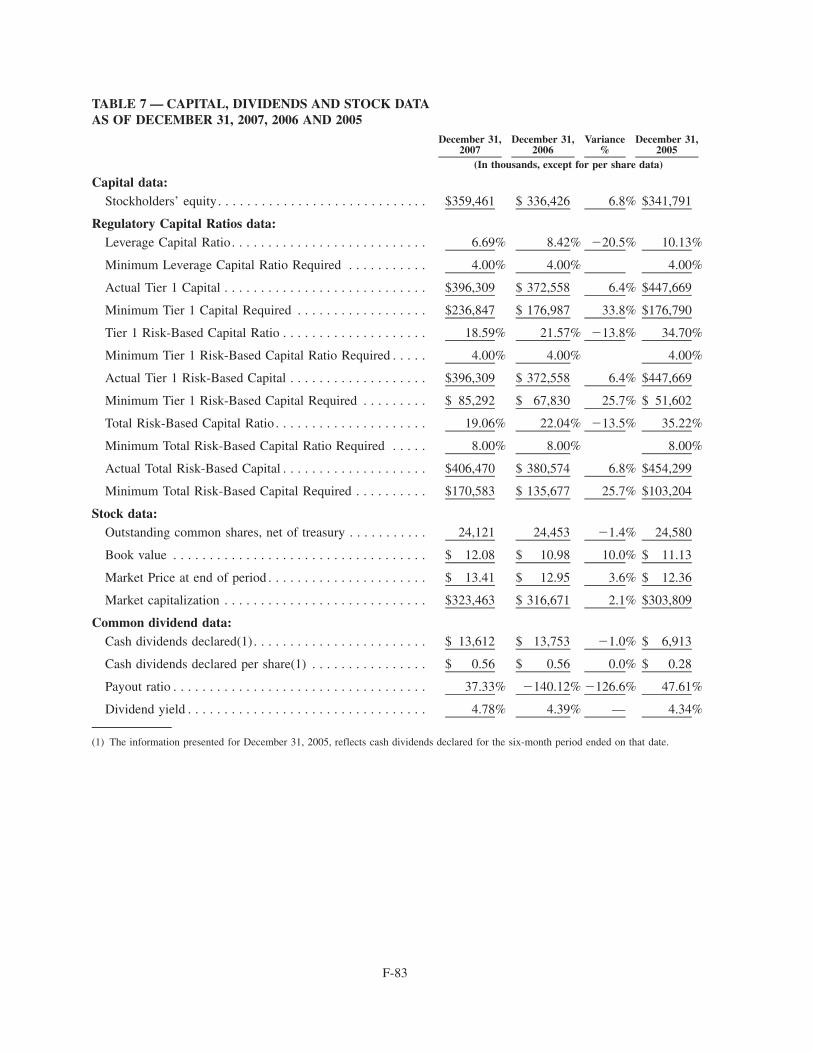
TABLE 7 — CAPITAL, DIVIDENDS AND STOCK DATAAS OF DECEMBER 31, 2007, 2006 AND 2005
December 31,2007
December 31,2006
Variance%
December 31,2005
(In thousands, except for per share data)
Capital data:Stockholders’ equity. . . . . . . . . . . . . . . . . . . . . . . . . . . . . $359,461 $ 336,426 6.8% $341,791
Regulatory Capital Ratios data:Leverage Capital Ratio. . . . . . . . . . . . . . . . . . . . . . . . . . . 6.69% 8.42% �20.5% 10.13%
Minimum Leverage Capital Ratio Required . . . . . . . . . . . 4.00% 4.00% 4.00%
Actual Tier 1 Capital . . . . . . . . . . . . . . . . . . . . . . . . . . . . $396,309 $ 372,558 6.4% $447,669
Minimum Tier 1 Capital Required . . . . . . . . . . . . . . . . . . $236,847 $ 176,987 33.8% $176,790
Tier 1 Risk-Based Capital Ratio . . . . . . . . . . . . . . . . . . . . 18.59% 21.57% �13.8% 34.70%
Minimum Tier 1 Risk-Based Capital Ratio Required . . . . . 4.00% 4.00% 4.00%
Actual Tier 1 Risk-Based Capital . . . . . . . . . . . . . . . . . . . $396,309 $ 372,558 6.4% $447,669
Minimum Tier 1 Risk-Based Capital Required . . . . . . . . . $ 85,292 $ 67,830 25.7% $ 51,602
Total Risk-Based Capital Ratio . . . . . . . . . . . . . . . . . . . . . 19.06% 22.04% �13.5% 35.22%
Minimum Total Risk-Based Capital Ratio Required . . . . . 8.00% 8.00% 8.00%
Actual Total Risk-Based Capital . . . . . . . . . . . . . . . . . . . . $406,470 $ 380,574 6.8% $454,299
Minimum Total Risk-Based Capital Required . . . . . . . . . . $170,583 $ 135,677 25.7% $103,204
Stock data:Outstanding common shares, net of treasury . . . . . . . . . . . 24,121 24,453 �1.4% 24,580
Book value . . . . . . . . . . . . . . . . . . . . . . . . . . . . . . . . . . . $ 12.08 $ 10.98 10.0% $ 11.13
Market Price at end of period . . . . . . . . . . . . . . . . . . . . . . $ 13.41 $ 12.95 3.6% $ 12.36
Market capitalization . . . . . . . . . . . . . . . . . . . . . . . . . . . . $323,463 $ 316,671 2.1% $303,809
Common dividend data:Cash dividends declared(1) . . . . . . . . . . . . . . . . . . . . . . . . $ 13,612 $ 13,753 �1.0% $ 6,913
Cash dividends declared per share(1) . . . . . . . . . . . . . . . . $ 0.56 $ 0.56 0.0% $ 0.28
Payout ratio . . . . . . . . . . . . . . . . . . . . . . . . . . . . . . . . . . . 37.33% �140.12% �126.6% 47.61%
Dividend yield . . . . . . . . . . . . . . . . . . . . . . . . . . . . . . . . . 4.78% 4.39% — 4.34%
(1) The information presented for December 31, 2005, reflects cash dividends declared for the six-month period ended on that date.
F-83
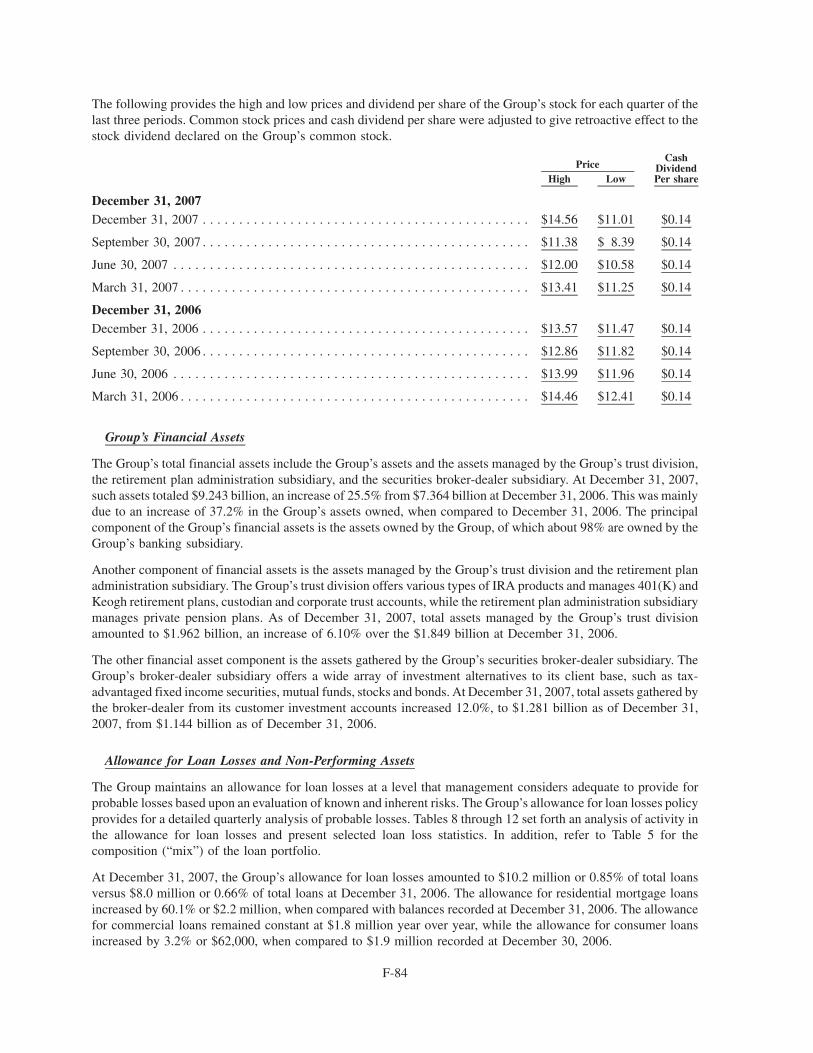
The following provides the high and low prices and dividend per share of the Group’s stock for each quarter of thelast three periods. Common stock prices and cash dividend per share were adjusted to give retroactive effect to thestock dividend declared on the Group’s common stock.
High Low
CashDividendPer share
Price
December 31, 2007December 31, 2007 . . . . . . . . . . . . . . . . . . . . . . . . . . . . . . . . . . . . . . . . . . . . . $14.56 $11.01 $0.14
September 30, 2007 . . . . . . . . . . . . . . . . . . . . . . . . . . . . . . . . . . . . . . . . . . . . . $11.38 $ 8.39 $0.14
June 30, 2007 . . . . . . . . . . . . . . . . . . . . . . . . . . . . . . . . . . . . . . . . . . . . . . . . . $12.00 $10.58 $0.14
March 31, 2007 . . . . . . . . . . . . . . . . . . . . . . . . . . . . . . . . . . . . . . . . . . . . . . . . $13.41 $11.25 $0.14
December 31, 2006December 31, 2006 . . . . . . . . . . . . . . . . . . . . . . . . . . . . . . . . . . . . . . . . . . . . . $13.57 $11.47 $0.14
September 30, 2006 . . . . . . . . . . . . . . . . . . . . . . . . . . . . . . . . . . . . . . . . . . . . . $12.86 $11.82 $0.14
June 30, 2006 . . . . . . . . . . . . . . . . . . . . . . . . . . . . . . . . . . . . . . . . . . . . . . . . . $13.99 $11.96 $0.14
March 31, 2006 . . . . . . . . . . . . . . . . . . . . . . . . . . . . . . . . . . . . . . . . . . . . . . . . $14.46 $12.41 $0.14
Group’s Financial Assets
The Group’s total financial assets include the Group’s assets and the assets managed by the Group’s trust division,the retirement plan administration subsidiary, and the securities broker-dealer subsidiary. At December 31, 2007,such assets totaled $9.243 billion, an increase of 25.5% from $7.364 billion at December 31, 2006. This was mainlydue to an increase of 37.2% in the Group’s assets owned, when compared to December 31, 2006. The principalcomponent of the Group’s financial assets is the assets owned by the Group, of which about 98% are owned by theGroup’s banking subsidiary.
Another component of financial assets is the assets managed by the Group’s trust division and the retirement planadministration subsidiary. The Group’s trust division offers various types of IRA products and manages 401(K) andKeogh retirement plans, custodian and corporate trust accounts, while the retirement plan administration subsidiarymanages private pension plans. As of December 31, 2007, total assets managed by the Group’s trust divisionamounted to $1.962 billion, an increase of 6.10% over the $1.849 billion at December 31, 2006.
The other financial asset component is the assets gathered by the Group’s securities broker-dealer subsidiary. TheGroup’s broker-dealer subsidiary offers a wide array of investment alternatives to its client base, such as tax-advantaged fixed income securities, mutual funds, stocks and bonds. At December 31, 2007, total assets gathered bythe broker-dealer from its customer investment accounts increased 12.0%, to $1.281 billion as of December 31,2007, from $1.144 billion as of December 31, 2006.
Allowance for Loan Losses and Non-Performing Assets
The Group maintains an allowance for loan losses at a level that management considers adequate to provide forprobable losses based upon an evaluation of known and inherent risks. The Group’s allowance for loan losses policyprovides for a detailed quarterly analysis of probable losses. Tables 8 through 12 set forth an analysis of activity inthe allowance for loan losses and present selected loan loss statistics. In addition, refer to Table 5 for thecomposition (“mix”) of the loan portfolio.
At December 31, 2007, the Group’s allowance for loan losses amounted to $10.2 million or 0.85% of total loansversus $8.0 million or 0.66% of total loans at December 31, 2006. The allowance for residential mortgage loansincreased by 60.1% or $2.2 million, when compared with balances recorded at December 31, 2006. The allowancefor commercial loans remained constant at $1.8 million year over year, while the allowance for consumer loansincreased by 3.2% or $62,000, when compared to $1.9 million recorded at December 30, 2006.
F-84
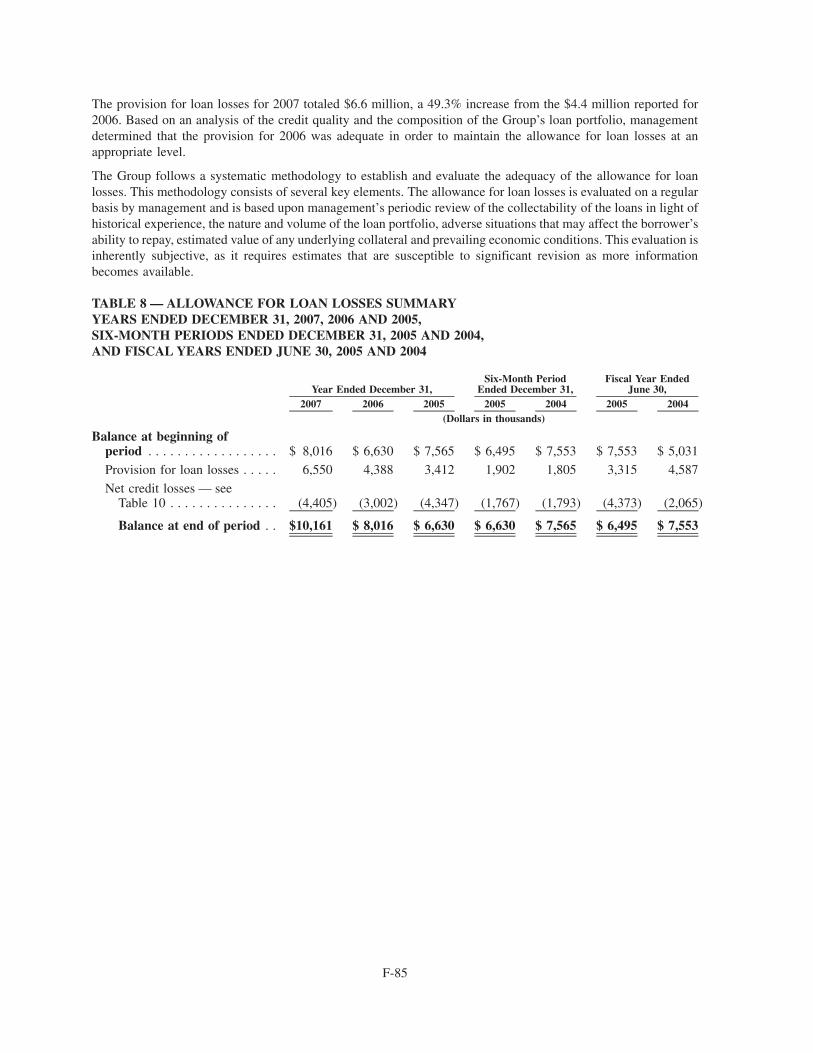
The provision for loan losses for 2007 totaled $6.6 million, a 49.3% increase from the $4.4 million reported for2006. Based on an analysis of the credit quality and the composition of the Group’s loan portfolio, managementdetermined that the provision for 2006 was adequate in order to maintain the allowance for loan losses at anappropriate level.
The Group follows a systematic methodology to establish and evaluate the adequacy of the allowance for loanlosses. This methodology consists of several key elements. The allowance for loan losses is evaluated on a regularbasis by management and is based upon management’s periodic review of the collectability of the loans in light ofhistorical experience, the nature and volume of the loan portfolio, adverse situations that may affect the borrower’sability to repay, estimated value of any underlying collateral and prevailing economic conditions. This evaluation isinherently subjective, as it requires estimates that are susceptible to significant revision as more informationbecomes available.
TABLE 8 — ALLOWANCE FOR LOAN LOSSES SUMMARYYEARS ENDED DECEMBER 31, 2007, 2006 AND 2005,SIX-MONTH PERIODS ENDED DECEMBER 31, 2005 AND 2004,AND FISCAL YEARS ENDED JUNE 30, 2005 AND 2004
2007 2006 2005 2005 2004 2005 2004Year Ended December 31,
Six-Month PeriodEnded December 31,
Fiscal Year EndedJune 30,
(Dollars in thousands)
Balance at beginning ofperiod . . . . . . . . . . . . . . . . . . $ 8,016 $ 6,630 $ 7,565 $ 6,495 $ 7,553 $ 7,553 $ 5,031
Provision for loan losses . . . . . 6,550 4,388 3,412 1,902 1,805 3,315 4,587
Net credit losses — seeTable 10 . . . . . . . . . . . . . . . (4,405) (3,002) (4,347) (1,767) (1,793) (4,373) (2,065)
Balance at end of period . . $10,161 $ 8,016 $ 6,630 $ 6,630 $ 7,565 $ 6,495 $ 7,553
F-85
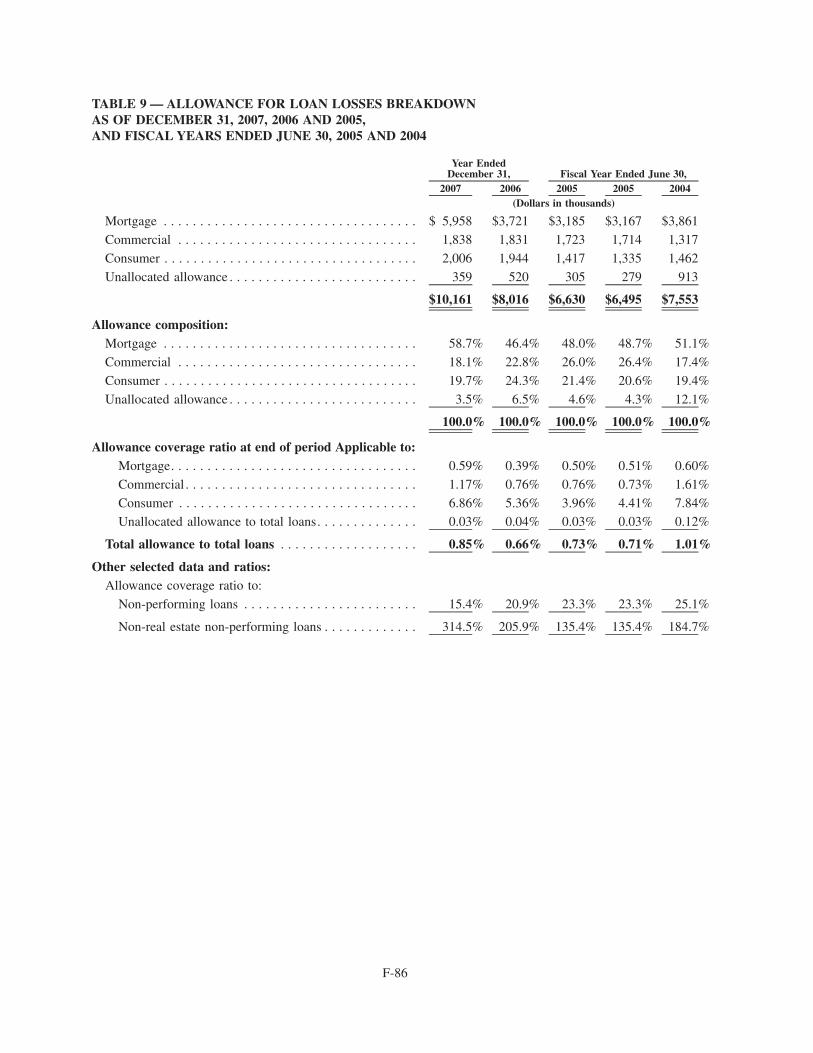
TABLE 9 — ALLOWANCE FOR LOAN LOSSES BREAKDOWNAS OF DECEMBER 31, 2007, 2006 AND 2005,AND FISCAL YEARS ENDED JUNE 30, 2005 AND 2004
2007 2006 2005 2005 2004
Year EndedDecember 31, Fiscal Year Ended June 30,
(Dollars in thousands)
Mortgage . . . . . . . . . . . . . . . . . . . . . . . . . . . . . . . . . . . $ 5,958 $3,721 $3,185 $3,167 $3,861
Commercial . . . . . . . . . . . . . . . . . . . . . . . . . . . . . . . . . 1,838 1,831 1,723 1,714 1,317
Consumer . . . . . . . . . . . . . . . . . . . . . . . . . . . . . . . . . . . 2,006 1,944 1,417 1,335 1,462
Unallocated allowance . . . . . . . . . . . . . . . . . . . . . . . . . . 359 520 305 279 913
$10,161 $8,016 $6,630 $6,495 $7,553
Allowance composition:Mortgage . . . . . . . . . . . . . . . . . . . . . . . . . . . . . . . . . . . 58.7% 46.4% 48.0% 48.7% 51.1%
Commercial . . . . . . . . . . . . . . . . . . . . . . . . . . . . . . . . . 18.1% 22.8% 26.0% 26.4% 17.4%
Consumer . . . . . . . . . . . . . . . . . . . . . . . . . . . . . . . . . . . 19.7% 24.3% 21.4% 20.6% 19.4%
Unallocated allowance . . . . . . . . . . . . . . . . . . . . . . . . . . 3.5% 6.5% 4.6% 4.3% 12.1%
100.0% 100.0% 100.0% 100.0% 100.0%
Allowance coverage ratio at end of period Applicable to:Mortgage. . . . . . . . . . . . . . . . . . . . . . . . . . . . . . . . . . 0.59% 0.39% 0.50% 0.51% 0.60%
Commercial . . . . . . . . . . . . . . . . . . . . . . . . . . . . . . . . 1.17% 0.76% 0.76% 0.73% 1.61%
Consumer . . . . . . . . . . . . . . . . . . . . . . . . . . . . . . . . . 6.86% 5.36% 3.96% 4.41% 7.84%Unallocated allowance to total loans. . . . . . . . . . . . . . 0.03% 0.04% 0.03% 0.03% 0.12%
Total allowance to total loans . . . . . . . . . . . . . . . . . . . 0.85% 0.66% 0.73% 0.71% 1.01%
Other selected data and ratios:Allowance coverage ratio to:
Non-performing loans . . . . . . . . . . . . . . . . . . . . . . . . 15.4% 20.9% 23.3% 23.3% 25.1%
Non-real estate non-performing loans . . . . . . . . . . . . . 314.5% 205.9% 135.4% 135.4% 184.7%
F-86
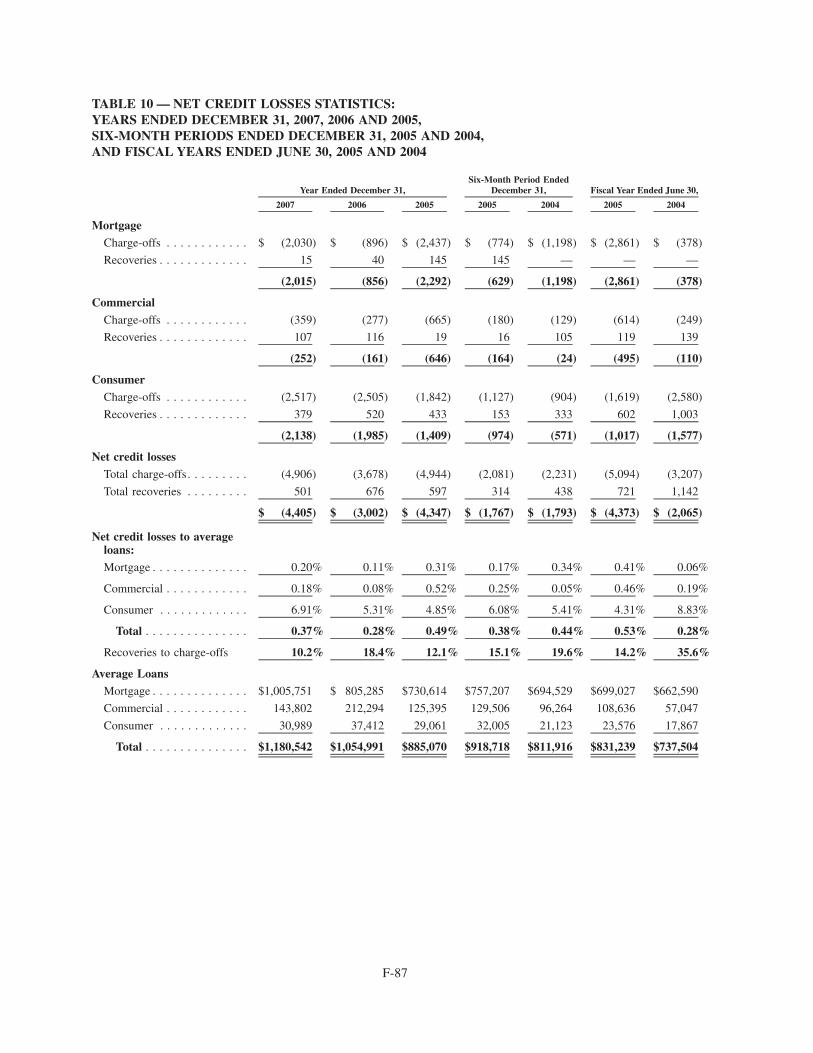
TABLE 10 — NET CREDIT LOSSES STATISTICS:YEARS ENDED DECEMBER 31, 2007, 2006 AND 2005,SIX-MONTH PERIODS ENDED DECEMBER 31, 2005 AND 2004,AND FISCAL YEARS ENDED JUNE 30, 2005 AND 2004
2007 2006 2005 2005 2004 2005 2004
Six-Month Period EndedDecember 31,Year Ended December 31, Fiscal Year Ended June 30,
Mortgage
Charge-offs . . . . . . . . . . . . $ (2,030) $ (896) $ (2,437) $ (774) $ (1,198) $ (2,861) $ (378)
Recoveries . . . . . . . . . . . . . 15 40 145 145 — — —
(2,015) (856) (2,292) (629) (1,198) (2,861) (378)
Commercial
Charge-offs . . . . . . . . . . . . (359) (277) (665) (180) (129) (614) (249)
Recoveries . . . . . . . . . . . . . 107 116 19 16 105 119 139
(252) (161) (646) (164) (24) (495) (110)
Consumer
Charge-offs . . . . . . . . . . . . (2,517) (2,505) (1,842) (1,127) (904) (1,619) (2,580)
Recoveries . . . . . . . . . . . . . 379 520 433 153 333 602 1,003
(2,138) (1,985) (1,409) (974) (571) (1,017) (1,577)
Net credit losses
Total charge-offs. . . . . . . . . (4,906) (3,678) (4,944) (2,081) (2,231) (5,094) (3,207)
Total recoveries . . . . . . . . . 501 676 597 314 438 721 1,142
$ (4,405) $ (3,002) $ (4,347) $ (1,767) $ (1,793) $ (4,373) $ (2,065)
Net credit losses to averageloans:
Mortgage . . . . . . . . . . . . . . 0.20% 0.11% 0.31% 0.17% 0.34% 0.41% 0.06%
Commercial . . . . . . . . . . . . 0.18% 0.08% 0.52% 0.25% 0.05% 0.46% 0.19%
Consumer . . . . . . . . . . . . . 6.91% 5.31% 4.85% 6.08% 5.41% 4.31% 8.83%
Total . . . . . . . . . . . . . . . 0.37% 0.28% 0.49% 0.38% 0.44% 0.53% 0.28%
Recoveries to charge-offs 10.2% 18.4% 12.1% 15.1% 19.6% 14.2% 35.6%
Average Loans
Mortgage . . . . . . . . . . . . . . $1,005,751 $ 805,285 $730,614 $757,207 $694,529 $699,027 $662,590
Commercial . . . . . . . . . . . . 143,802 212,294 125,395 129,506 96,264 108,636 57,047
Consumer . . . . . . . . . . . . . 30,989 37,412 29,061 32,005 21,123 23,576 17,867
Total . . . . . . . . . . . . . . . $1,180,542 $1,054,991 $885,070 $918,718 $811,916 $831,239 $737,504
F-87
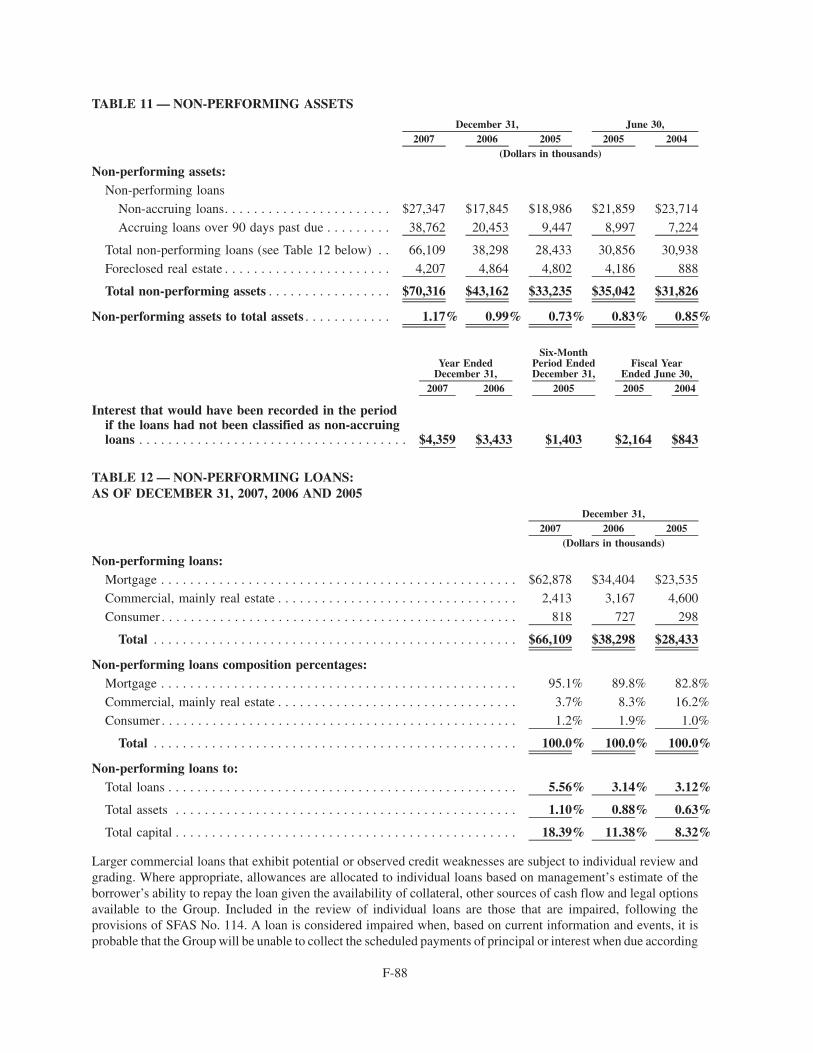
TABLE 11 — NON-PERFORMING ASSETS
2007 2006 2005 2005 2004December 31, June 30,
(Dollars in thousands)
Non-performing assets:Non-performing loans
Non-accruing loans. . . . . . . . . . . . . . . . . . . . . . . $27,347 $17,845 $18,986 $21,859 $23,714
Accruing loans over 90 days past due . . . . . . . . . 38,762 20,453 9,447 8,997 7,224
Total non-performing loans (see Table 12 below) . . 66,109 38,298 28,433 30,856 30,938
Foreclosed real estate . . . . . . . . . . . . . . . . . . . . . . . 4,207 4,864 4,802 4,186 888
Total non-performing assets . . . . . . . . . . . . . . . . . $70,316 $43,162 $33,235 $35,042 $31,826
Non-performing assets to total assets . . . . . . . . . . . . 1.17% 0.99% 0.73% 0.83% 0.85%
2007 2006 2005 2005 2004
Year EndedDecember 31,
Six-MonthPeriod EndedDecember 31,
Fiscal YearEnded June 30,
Interest that would have been recorded in the periodif the loans had not been classified as non-accruingloans . . . . . . . . . . . . . . . . . . . . . . . . . . . . . . . . . . . . . $4,359 $3,433 $1,403 $2,164 $843
TABLE 12 — NON-PERFORMING LOANS:AS OF DECEMBER 31, 2007, 2006 AND 2005
2007 2006 2005December 31,
(Dollars in thousands)
Non-performing loans:Mortgage . . . . . . . . . . . . . . . . . . . . . . . . . . . . . . . . . . . . . . . . . . . . . . . . . $62,878 $34,404 $23,535
Commercial, mainly real estate . . . . . . . . . . . . . . . . . . . . . . . . . . . . . . . . . 2,413 3,167 4,600
Consumer . . . . . . . . . . . . . . . . . . . . . . . . . . . . . . . . . . . . . . . . . . . . . . . . . 818 727 298
Total . . . . . . . . . . . . . . . . . . . . . . . . . . . . . . . . . . . . . . . . . . . . . . . . . . $66,109 $38,298 $28,433
Non-performing loans composition percentages:Mortgage . . . . . . . . . . . . . . . . . . . . . . . . . . . . . . . . . . . . . . . . . . . . . . . . . 95.1% 89.8% 82.8%
Commercial, mainly real estate . . . . . . . . . . . . . . . . . . . . . . . . . . . . . . . . . 3.7% 8.3% 16.2%
Consumer . . . . . . . . . . . . . . . . . . . . . . . . . . . . . . . . . . . . . . . . . . . . . . . . . 1.2% 1.9% 1.0%
Total . . . . . . . . . . . . . . . . . . . . . . . . . . . . . . . . . . . . . . . . . . . . . . . . . . 100.0% 100.0% 100.0%
Non-performing loans to:Total loans . . . . . . . . . . . . . . . . . . . . . . . . . . . . . . . . . . . . . . . . . . . . . . . . 5.56% 3.14% 3.12%
Total assets . . . . . . . . . . . . . . . . . . . . . . . . . . . . . . . . . . . . . . . . . . . . . . . 1.10% 0.88% 0.63%
Total capital . . . . . . . . . . . . . . . . . . . . . . . . . . . . . . . . . . . . . . . . . . . . . . . 18.39% 11.38% 8.32%
Larger commercial loans that exhibit potential or observed credit weaknesses are subject to individual review andgrading. Where appropriate, allowances are allocated to individual loans based on management’s estimate of theborrower’s ability to repay the loan given the availability of collateral, other sources of cash flow and legal optionsavailable to the Group. Included in the review of individual loans are those that are impaired, following theprovisions of SFAS No. 114. A loan is considered impaired when, based on current information and events, it isprobable that the Group will be unable to collect the scheduled payments of principal or interest when due according
F-88
to the contractual terms of the loan agreement. Impaired loans are measured based on the present value of expectedfuture cash flows discounted at the loan’s effective interest rate, or as a practical expedient, at the observable marketprice of the loan or the fair value of the collateral, if the loan is collateral dependent. Loans are individuallyevaluated for impairment, except large groups of small balance, homogeneous loans that are collectively evaluatedfor impairment under the provisions of SFAS No. 5, and for loans that are recorded at fair value or at the lower ofcost or market. The Group measures for impairment all commercial loans over $250,000 and 90 days past due. Theportfolios of residential mortgages and consumer loans are considered homogeneous and are evaluated collectivelyfor impairment.
For loans that are not individually graded, the Group uses a methodology that follows a loan credit risk ratingprocess that involves dividing loans into risk categories. The Group, using an aged-based rating system, applies anoverall allowance percentage to each loan portfolio category based on historical credit losses adjusted for currentconditions and trends. This delinquency-based calculation is the starting point for management’s determination ofthe required level of the allowance for loan losses. Other data considered in this determination includes overallhistorical loss trends and other information, including underwriting standards, economic trends and unusual events.
Loan loss ratios and credit risk categories, are updated quarterly and are applied in the context of GAAP and theJoint Interagency Guidance on the importance of depository institutions having prudent, conservative, but notexcessive loan allowances that fall within an acceptable range of estimated losses. While management usesavailable information in estimating possible loan losses, future changes to the allowance may be necessary based onfactors beyond the Group’s control, such as factors affecting general economic conditions.
An unallocated allowance is established recognizing the estimation risk associated with the aged-based ratingsystem and with the specific allowances. It is based upon management’s evaluation of various macroeconomicconditions, the effects of which are not directly measured in determining the aged-based rating system and thespecific allowances. These conditions include then-existing general economic and business conditions affecting ourkey lending areas; credit quality trends, including trends in non-performing loans expected to result from existingconditions, collateral values, loan volumes and concentrations, seasoning of the loans portfolio, recent lossexperience in particular segments of the portfolio, regulatory examination results, and findings by the Group’smanagement. The evaluation of the inherent loss regarding these conditions involves a higher degree of uncertaintybecause they are not identified with specific problem credits or portfolio segments.
During the year ended December 31, 2007, net credit losses amounted to $4.4 million, a 46.8% increase whencompared to $3.0 million reported for the same period of 2006. The increase was primarily due to a $1.2 million innet credit losses for mortgage loans. Total recoveries decreased from $677,000 in 2006 to $501,000 in 2007. As aresult, the recoveries to charge-offs ratio decreased from 18.4% in 2006, to 10.2% in 2007.
The Group’s non-performing assets include non-performing loans and foreclosed real estate (see Tables 11 and 12).At December 31 2007, the Group’s non-performing assets totaled $70.3 million (1.17% of total assets) versus$43.2 million (0.99% of total assets) at December 31, 2006.
At December 31, 2007, the allowance for loan losses to non-performing loans coverage ratio was 15.4% (20.9% atDecember 31, 2006. Excluding the lesser-risk mortgage loans, the ratio is 314.5% (205.9% at December 31, 2006).
In July 2007, the Group regained control of all the servicing for its outstanding mortgage loans and subcontracted itout to a leading third party servicer. This has enabled the Group to better monitor performance and implementaggressive loss mitigation measures which, it is believed, will help stabilize the level of non-performing residentialmortgage loans in the near future. The Group does not expect the increase in non-performing residential mortgageloans to translate into significantly higher losses as these loans are generally well collateralized with adequateloan-to-value ratios.
The Group follows a conservative residential mortgage lending policy, with more than 90% of its residentialmortgage portfolio consisting of fixed-rate, fully amortizing, fully documented loans that do not have the level ofrisk associated with subprime loans offered by certain major US mortgage loan originators. Furthermore, Orientalhas never been active in negative amortization loans or adjustable rate mortgage loans, including those with teaserrates, and does not originate construction and development loans.
F-89
Detailed information concerning each of the items that comprise non-performing assets follows:
• Mortgage loans — residential mortgage loans are placed in non-accrual status when they become 365 days ormore past due, or earlier if other factors indicate that the collection of principal an interest is doubtful, and arewritten down, if necessary, based on the specific evaluation of the collateral underlying the loan. AtDecember 31, 2007, the Group’s non-performing mortgage loans totaled $62.9 million or 82.8% of the Group’snon-performing loans, compared to $34.4 million or 89.8% at December 31, 2006, and to $23.5 million or 82.8%at December 31, 2005. Non-performing loans in this category are primarily residential mortgage loans. Based onthe value of the underlying collateral and the loan-to-value ratios, management considers that no significantlosses will be incurred on this portfolio.
• Commercial business loans — are placed in non-accrual status when they become 90 days or more past due andare charged-off based on the specific evaluation of the underlying collateral. At December 31, 2007, the Group’snon-performing commercial business loans amounted to $2.4 million or 3.7% of the Group’s non-performingloans, compared to $3.2 million or 8.3% at December 31, 2006, and $4.6 million or 16.2% at December 31, 2005.Most of this portfolio is also collateralized by real estate and no significant losses are expected.
• Consumer loans — are placed in non-accrual status when they become 90 days past due and charged-off whenpayments are delinquent 120 days. At December 31, 2007, the Group’s non-performing consumer loansamounted to $818,000 or 1.2% of the Group’s total non-performing loans, compared to $727,000 or 1.9% atDecember 31, 2006, and $208,000 or 1.0% at December 31, 2005.
• Foreclosed real estate assets — are initially recorded at the lower of the related loan balance or fair value at thedate of foreclosure. Any excess of the loan balance over the fair value of the property is charged against theallowance for loan losses. Subsequently, any excess of the carrying value over the estimated fair value less sellingcosts is charged to operations. Management is actively seeking prospective buyers for these foreclosed properties.Foreclosed real estate amounted to $4.2 million at December 31, 2007, $4.9 million at December 31, 2006 and$4.8 million at December 31, 2005
Contractual Obligations and Commercial Commitments
As disclosed in the notes to the Group’s consolidated financial statements, the Group has certain obligations andcommitments to make future payments under contracts. At December 31, 2007, the aggregate contractualobligations and commercial commitments are:
Total Less than 1 year 1 - 3 years 3 - 5 years After 5 yearsPayments Due by Period
(Dollars in thousands)
CONTRACTUALOBLIGATIONS(1):
Federal funds purchased and othershort term borrowings . . . . . . . . . . $ 27,460 $ 27,460 $ — $ — $ —
Securities sold under agreements torepurchase . . . . . . . . . . . . . . . . . . 3,850,023 100,023 100,000 1,800,000 1,850,000
Advances from FHLB . . . . . . . . . . . . 330,000 50,000 — 225,000 55,000
Subordinated capital notes . . . . . . . . . 36,083 — — — 36,083
Annual rental commitments undernoncancelable operating leases. . . . 23,281 3,200 6,193 5,970 7,918
Total . . . . . . . . . . . . . . . . . . . . . . $4,266,847 $180,683 $106,193 $2,030,970 $1,949,001
(1) Excluding accrued interest.
Such commitments will be funded in the normal course of business from the Bank’s principal sources of funds. AtDecember 31, 2006 the Bank had $612.4 million in certificates of deposit that mature during the following twelvemonths.
F-90
Impact of Inflation and Changing Prices
The financial statements and related data presented herein have been prepared in accordance with U.S. generallyaccepted accounting principles in the United States of America which require the measurement of financial positionand operating results in terms of historical dollars without considering changes in the relative purchasing power ofmoney over time due to inflation.
Unlike most industrial companies, virtually all of the assets and liabilities of a financial institution are monetary innature. As a result, interest rates have a more significant impact on a financial institution’s performance than theeffects of general levels of inflation. Interest rates do not necessarily move in the same direction or with the samemagnitude as the prices of goods and services since such prices are affected by inflation.
RISK MANAGEMENT
Background
The Group’s risk management policies are established by its Board of Directors (the “Board”), implemented bymanagement, through the adoption of a risk management program, which is overseen and monitored by the ChiefRisk Officer and the Risk Management Committee (RMC). During 2007, the Group continued to refine andenhance its risk management program by strengthening policies, processes and procedures necessary to maintaineffective risk management.
All aspects of the Group’s business activities are susceptible to risk. Consequently, risk identification andmonitoring are essential to risk management. As more fully discussed below, the Group’s primary risks exposureinclude, market, interest rate, credit, liquidity, operational and concentration risks.
Market Risk
Market risk is the risk to earnings or capital arising from adverse movements in market rates or prices, such asinterest rates or prices. The Group evaluates market risk together with interest rate risk (See “Interest Rate Risk”below).
The Group’s financial results and capital levels are constantly exposed to market risk. The Board and managementare primarily responsible for ensuring that the market risk assumed by the Group complies with the guidelinesestablished by Board approved policies. The Board has delegated the management of this risk to the Asset andLiability Management Committee (“ALCO”) which is composed of certain executive officers from the business,treasury and finance areas. One of ALCO’s primary goals is to ensure that the market risk assumed by the Group iswithin the parameters established in the policies adopted by the Board.
Interest Rate Risk
Interest rate risk is the exposure of the Group’s earnings or capital to adverse movements in interest rates. It is apredominant market risk in terms of its potential impact on earnings.
The Group manages its asset/liability position in order to limit the effects of changes in interest rates on net interestincome. ALCO is responsible for monitoring compliance with the market risk policies approved by the Board andadopting interest risk management strategies. In that role, ALCO oversees interest rate risk, liquidity managementand other related matters.
In discharging its responsibilities, ALCO examines current and expected conditions in world financial markets,competition and prevailing rates in the local deposit market, liquidity, unrealized gains and losses in securities,recent or proposed changes to the investment portfolio, alternative funding sources and their costs, hedging and thepossible purchase of derivatives such as swaps and caps, and any tax or regulatory issues which may be pertinent tothese areas. ALCO approves funding decisions in light of the Group’s overall growth strategies and objectives.
Each month, the Group performs a net interest income simulation analysis on a consolidated basis to estimate thepotential change in future earnings from projected changes in interest rates. These simulations are carried out over a
F-91
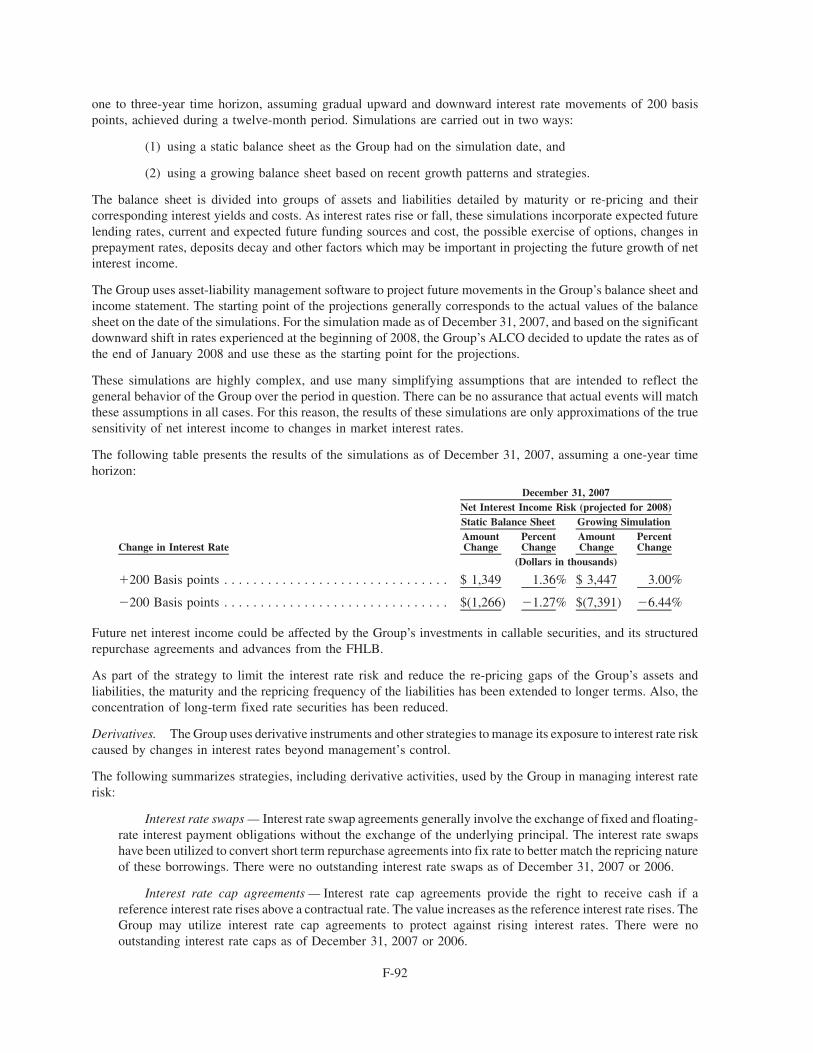
one to three-year time horizon, assuming gradual upward and downward interest rate movements of 200 basispoints, achieved during a twelve-month period. Simulations are carried out in two ways:
(1) using a static balance sheet as the Group had on the simulation date, and
(2) using a growing balance sheet based on recent growth patterns and strategies.
The balance sheet is divided into groups of assets and liabilities detailed by maturity or re-pricing and theircorresponding interest yields and costs. As interest rates rise or fall, these simulations incorporate expected futurelending rates, current and expected future funding sources and cost, the possible exercise of options, changes inprepayment rates, deposits decay and other factors which may be important in projecting the future growth of netinterest income.
The Group uses asset-liability management software to project future movements in the Group’s balance sheet andincome statement. The starting point of the projections generally corresponds to the actual values of the balancesheet on the date of the simulations. For the simulation made as of December 31, 2007, and based on the significantdownward shift in rates experienced at the beginning of 2008, the Group’s ALCO decided to update the rates as ofthe end of January 2008 and use these as the starting point for the projections.
These simulations are highly complex, and use many simplifying assumptions that are intended to reflect thegeneral behavior of the Group over the period in question. There can be no assurance that actual events will matchthese assumptions in all cases. For this reason, the results of these simulations are only approximations of the truesensitivity of net interest income to changes in market interest rates.
The following table presents the results of the simulations as of December 31, 2007, assuming a one-year timehorizon:
Change in Interest RateAmountChange
PercentChange
AmountChange
PercentChange
Static Balance Sheet Growing SimulationNet Interest Income Risk (projected for 2008)
December 31, 2007
(Dollars in thousands)
�200 Basis points . . . . . . . . . . . . . . . . . . . . . . . . . . . . . . . $ 1,349 1.36% $ 3,447 3.00%
�200 Basis points . . . . . . . . . . . . . . . . . . . . . . . . . . . . . . . $(1,266) �1.27% $(7,391) �6.44%
Future net interest income could be affected by the Group’s investments in callable securities, and its structuredrepurchase agreements and advances from the FHLB.
As part of the strategy to limit the interest rate risk and reduce the re-pricing gaps of the Group’s assets andliabilities, the maturity and the repricing frequency of the liabilities has been extended to longer terms. Also, theconcentration of long-term fixed rate securities has been reduced.
Derivatives. The Group uses derivative instruments and other strategies to manage its exposure to interest rate riskcaused by changes in interest rates beyond management’s control.
The following summarizes strategies, including derivative activities, used by the Group in managing interest raterisk:
Interest rate swaps — Interest rate swap agreements generally involve the exchange of fixed and floating-rate interest payment obligations without the exchange of the underlying principal. The interest rate swapshave been utilized to convert short term repurchase agreements into fix rate to better match the repricing natureof these borrowings. There were no outstanding interest rate swaps as of December 31, 2007 or 2006.
Interest rate cap agreements — Interest rate cap agreements provide the right to receive cash if areference interest rate rises above a contractual rate. The value increases as the reference interest rate rises. TheGroup may utilize interest rate cap agreements to protect against rising interest rates. There were nooutstanding interest rate caps as of December 31, 2007 or 2006.
F-92
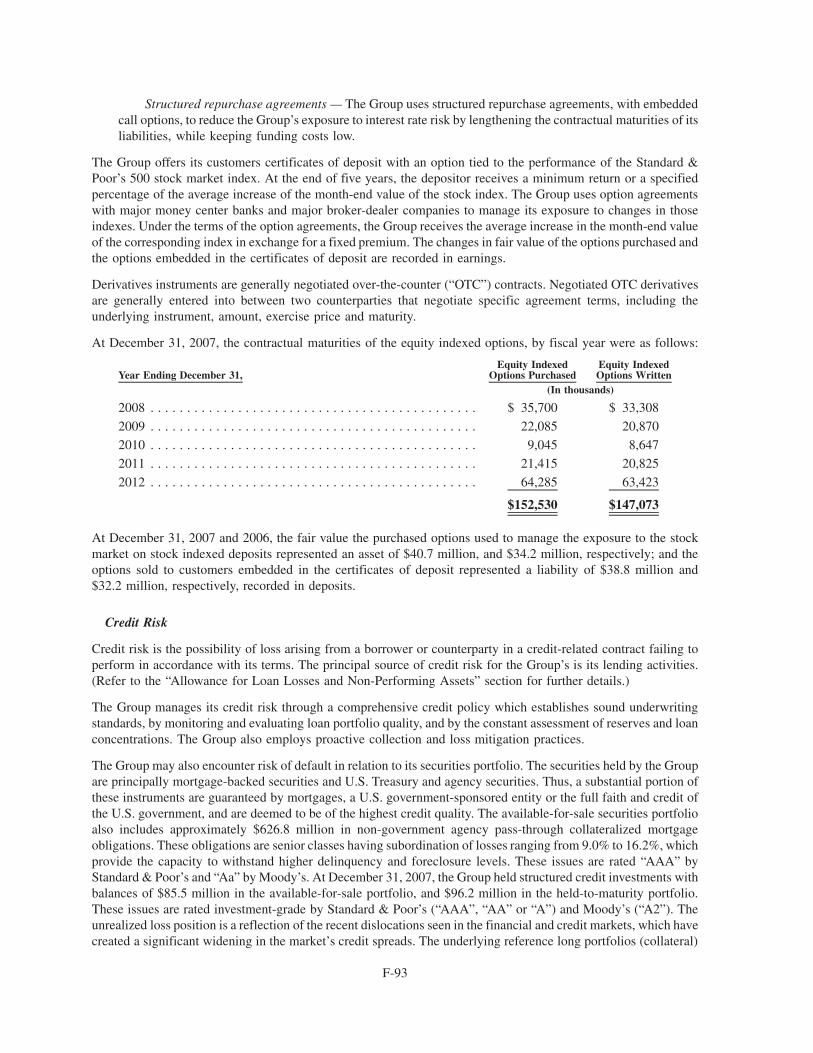
Structured repurchase agreements — The Group uses structured repurchase agreements, with embeddedcall options, to reduce the Group’s exposure to interest rate risk by lengthening the contractual maturities of itsliabilities, while keeping funding costs low.
The Group offers its customers certificates of deposit with an option tied to the performance of the Standard &Poor’s 500 stock market index. At the end of five years, the depositor receives a minimum return or a specifiedpercentage of the average increase of the month-end value of the stock index. The Group uses option agreementswith major money center banks and major broker-dealer companies to manage its exposure to changes in thoseindexes. Under the terms of the option agreements, the Group receives the average increase in the month-end valueof the corresponding index in exchange for a fixed premium. The changes in fair value of the options purchased andthe options embedded in the certificates of deposit are recorded in earnings.
Derivatives instruments are generally negotiated over-the-counter (“OTC”) contracts. Negotiated OTC derivativesare generally entered into between two counterparties that negotiate specific agreement terms, including theunderlying instrument, amount, exercise price and maturity.
At December 31, 2007, the contractual maturities of the equity indexed options, by fiscal year were as follows:
Year Ending December 31,Equity Indexed
Options PurchasedEquity IndexedOptions Written
(In thousands)
2008 . . . . . . . . . . . . . . . . . . . . . . . . . . . . . . . . . . . . . . . . . . . . . $ 35,700 $ 33,308
2009 . . . . . . . . . . . . . . . . . . . . . . . . . . . . . . . . . . . . . . . . . . . . . 22,085 20,870
2010 . . . . . . . . . . . . . . . . . . . . . . . . . . . . . . . . . . . . . . . . . . . . . 9,045 8,647
2011 . . . . . . . . . . . . . . . . . . . . . . . . . . . . . . . . . . . . . . . . . . . . . 21,415 20,825
2012 . . . . . . . . . . . . . . . . . . . . . . . . . . . . . . . . . . . . . . . . . . . . . 64,285 63,423
$152,530 $147,073
At December 31, 2007 and 2006, the fair value the purchased options used to manage the exposure to the stockmarket on stock indexed deposits represented an asset of $40.7 million, and $34.2 million, respectively; and theoptions sold to customers embedded in the certificates of deposit represented a liability of $38.8 million and$32.2 million, respectively, recorded in deposits.
Credit Risk
Credit risk is the possibility of loss arising from a borrower or counterparty in a credit-related contract failing toperform in accordance with its terms. The principal source of credit risk for the Group’s is its lending activities.(Refer to the “Allowance for Loan Losses and Non-Performing Assets” section for further details.)
The Group manages its credit risk through a comprehensive credit policy which establishes sound underwritingstandards, by monitoring and evaluating loan portfolio quality, and by the constant assessment of reserves and loanconcentrations. The Group also employs proactive collection and loss mitigation practices.
The Group may also encounter risk of default in relation to its securities portfolio. The securities held by the Groupare principally mortgage-backed securities and U.S. Treasury and agency securities. Thus, a substantial portion ofthese instruments are guaranteed by mortgages, a U.S. government-sponsored entity or the full faith and credit ofthe U.S. government, and are deemed to be of the highest credit quality. The available-for-sale securities portfolioalso includes approximately $626.8 million in non-government agency pass-through collateralized mortgageobligations. These obligations are senior classes having subordination of losses ranging from 9.0% to 16.2%, whichprovide the capacity to withstand higher delinquency and foreclosure levels. These issues are rated “AAA” byStandard & Poor’s and “Aa” by Moody’s. At December 31, 2007, the Group held structured credit investments withbalances of $85.5 million in the available-for-sale portfolio, and $96.2 million in the held-to-maturity portfolio.These issues are rated investment-grade by Standard & Poor’s (“AAA”, “AA” or “A”) and Moody’s (“A2”). Theunrealized loss position is a reflection of the recent dislocations seen in the financial and credit markets, which havecreated a significant widening in the market’s credit spreads. The underlying reference long portfolios (collateral)
F-93
on the structures are substantively investment grade, they have performed adequately, there have been no defaults todate, and none of our structured credit investments have been downgraded.
Management’s Credit Committee, composed of the Group’s Chief Executive Officer, Chief Credit Risk Officer andother senior executives, has primary responsibility for setting strategies to achieve the Group’s credit risk goals andobjectives. Those goals and objectives are set forth in the Group’s Credit Policy.
Liquidity Risk
Liquidity risk is the risk of the Group not being able to generate sufficient cash from either assets or liabilities tomeet obligations as they become due, without incurring substantial losses. The Group’s cash requirementsprincipally consist of deposit withdrawals, contractual loan funding, repayment of borrowings as they mature,and funding of new and existing investment as required.
Effective liquidity management requires that the Group have sufficient cash available at all times to meet itsfinancial commitments, finance planned growth and have a reasonable safety margin for normal as well asunexpected cash needs. ALCO is responsible for managing the Group’s liquidity risk in accordance with thepolicies adopted by the Board. In discharging its liquidity risk management obligations, ALCO approves operatingand contingency procedures and monitors their implementation. The Group’s Treasurer and CIO is responsible forthe implementation of the liquidity risk management policies adopted by the Board and of the operating andcontingency procedures adopted by ALCO, and for monitoring the Group’s liquidity position on an ongoing basis.Using measures of liquidity developed by the Group’s Treasury Division under several different scenarios, theTreasury Division, ALCO and the Board review the Group’s liquidity position on a daily, monthly and quarterlybasis, respectively.
The Group meets its liquidity management objectives by maintaining (i) liquid assets in the form of investmentsecurities,(ii) sufficient unused borrowing capacity in the national money markets, and achieving (iii) consistentgrowth in core deposits. As of December 31, 2007, the Group had approximately $310.9 million in investmentsavailable to cover liquidity needs. Additional asset-driven liquidity is provided by the availability of loan assets topledge. These sources, in addition to the Group’s 6.69% average equity capital base, provide a stable funding base.
The Group utilizes different sources of funding to help ensure that adequate levels of liquidity are available whenneeded. Diversification of funding sources is of great importance as it protects the Group’s liquidity from marketdisruptions. The principal sources of short-term funds are deposits, securities sold under agreements to repurchase,and lines of credit with the FHLB. ALCO reviews credit availability on a regular basis. The Group securitizes andsells mortgage loans as supplemental source of funding. Long-term certificates of deposit as well as long-termfunding through the issuance of notes have also provided additional funding. The cost of these different alternatives,among other things, is taken into consideration. The Group’s principal uses of funds are the origination of loans andthe repayment of maturing deposit accounts and borrowings.
Operational Risk
Operational risk is the risk of loss from inadequate or failed internal processes, personnel and systems or fromexternal events. All functions, products and services of the Group are susceptible to operational risk.
The Group faces ongoing and emerging risk and regulatory pressure related to the activities that surround thedelivery of banking and financial products. Coupled with external influences such as market conditions, securityrisks, and legal risk, the potential for operational and reputational loss has increased. In order to mitigate and controloperational risk, the Group has developed, and continues to enhance, specific internal controls, policies andprocedures that are designed to identify and manage operational risk at appropriate levels throughout theorganization. The purpose of these policies and procedures is to provide reasonable assurance that the Group’sbusiness operations are functioning within established limits.
The Group classifies operational risk into two major categories: business specific and corporate-wide affecting allbusiness lines. For business specific risks, a risk assessment group works with the various business units to ensureconsistency in policies, processes and assessments. With respect to corporate wide risks, such as informationsecurity, business recovery, legal and compliance, the Group has specialized groups, such as Information Security,
F-94
Corporate Compliance, Information Technology and Operations. These groups assist the lines of business in thedevelopment and implementation of risk management practices specific to the needs of the business groups. Allthese matters are reviewed and discussed in the RMC.
The Group is subject to extensive regulation in the different jurisdictions in which it conducts its business, and thisregulatory scrutiny has been significantly increasing over the last several years. The Group has established andcontinues to enhance procedures based on legal and regulatory requirements that are reasonably designed to ensurecompliance with all applicable statutory and regulatory requirements. The Group has a corporate compliancefunction, headed by a Senior Compliance Officer who reports to the Chief Risk Officer and is responsible for theoversight of regulatory compliance and implementation of an enterprise-wide compliance program.
Concentration Risk
Substantially all of the Group’s business activities and a significant portion of its credit exposure are concentrated inPuerto Rico. As a consequence, the Group’s profitability and financial condition may be adversely affected by anextended economic slowdown, adverse political or economic developments in Puerto Rico or the effects of a naturaldisaster, all of which could result in a reduction in loan originations, an increase in non-performing assets, anincrease in foreclosure losses on mortgage loans, and a reduction in the value of its loans and loan servicingportfolio.
Puerto Rico is currently in a general economic slowdown that has caused a reduction in private sector employmentand consumer spending. Increases in oil prices and other consumer goods and services, coupled with a 7% sales taximplemented in October 2006 as part of a government program of tax and fiscal reforms, have also contributed tothe general economic slowdown.
These economic concerns and uncertainties in the private and public sectors have had an adverse effect in the creditquality of our loan portfolios as delinquency rates have increased in the short-term and may continue to increaseuntil the economy stabilizes. The reduction in consumer spending may continue to impact growth in our otherinterest and non-interest revenue sources.
F-95
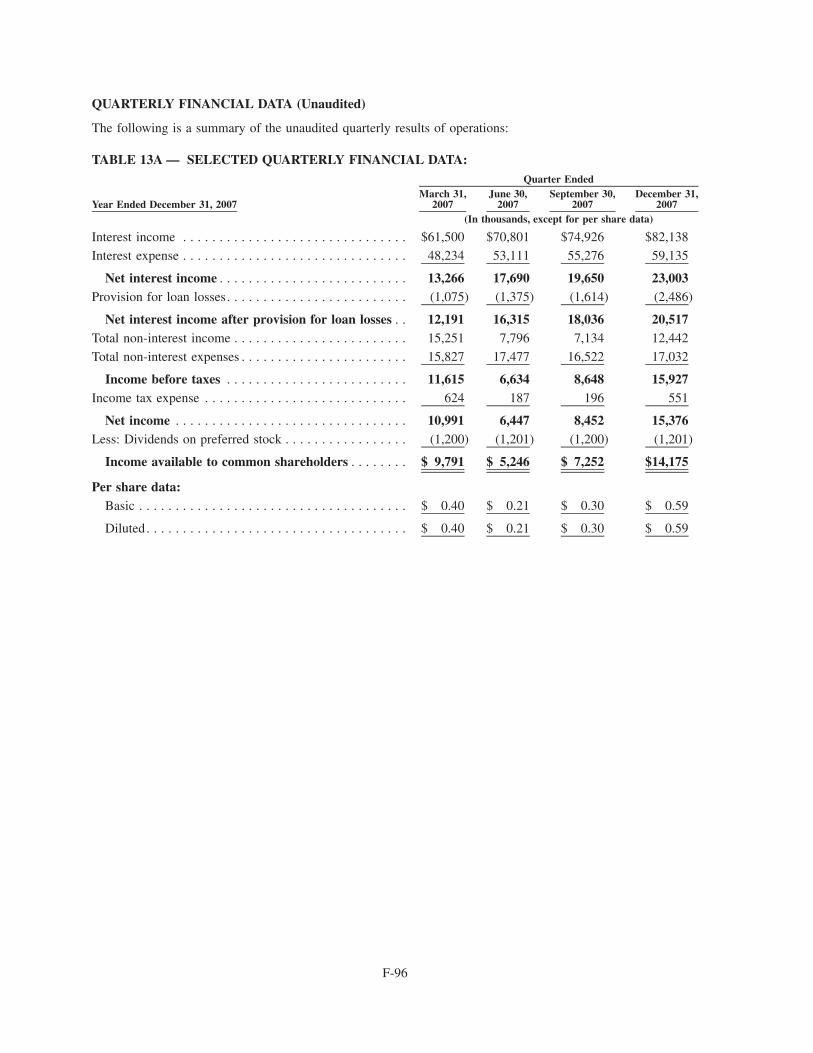
QUARTERLY FINANCIAL DATA (Unaudited)
The following is a summary of the unaudited quarterly results of operations:
TABLE 13A — SELECTED QUARTERLY FINANCIAL DATA:
Year Ended December 31, 2007March 31,
2007June 30,
2007September 30,
2007December 31,
2007
Quarter Ended
(In thousands, except for per share data)
Interest income . . . . . . . . . . . . . . . . . . . . . . . . . . . . . . . $61,500 $70,801 $74,926 $82,138
Interest expense . . . . . . . . . . . . . . . . . . . . . . . . . . . . . . . 48,234 53,111 55,276 59,135
Net interest income . . . . . . . . . . . . . . . . . . . . . . . . . . 13,266 17,690 19,650 23,003Provision for loan losses. . . . . . . . . . . . . . . . . . . . . . . . . (1,075) (1,375) (1,614) (2,486)
Net interest income after provision for loan losses . . 12,191 16,315 18,036 20,517Total non-interest income . . . . . . . . . . . . . . . . . . . . . . . . 15,251 7,796 7,134 12,442
Total non-interest expenses . . . . . . . . . . . . . . . . . . . . . . . 15,827 17,477 16,522 17,032
Income before taxes . . . . . . . . . . . . . . . . . . . . . . . . . 11,615 6,634 8,648 15,927Income tax expense . . . . . . . . . . . . . . . . . . . . . . . . . . . . 624 187 196 551
Net income . . . . . . . . . . . . . . . . . . . . . . . . . . . . . . . . 10,991 6,447 8,452 15,376Less: Dividends on preferred stock . . . . . . . . . . . . . . . . . (1,200) (1,201) (1,200) (1,201)
Income available to common shareholders . . . . . . . . $ 9,791 $ 5,246 $ 7,252 $14,175
Per share data:Basic . . . . . . . . . . . . . . . . . . . . . . . . . . . . . . . . . . . . . $ 0.40 $ 0.21 $ 0.30 $ 0.59
Diluted. . . . . . . . . . . . . . . . . . . . . . . . . . . . . . . . . . . . $ 0.40 $ 0.21 $ 0.30 $ 0.59
F-96
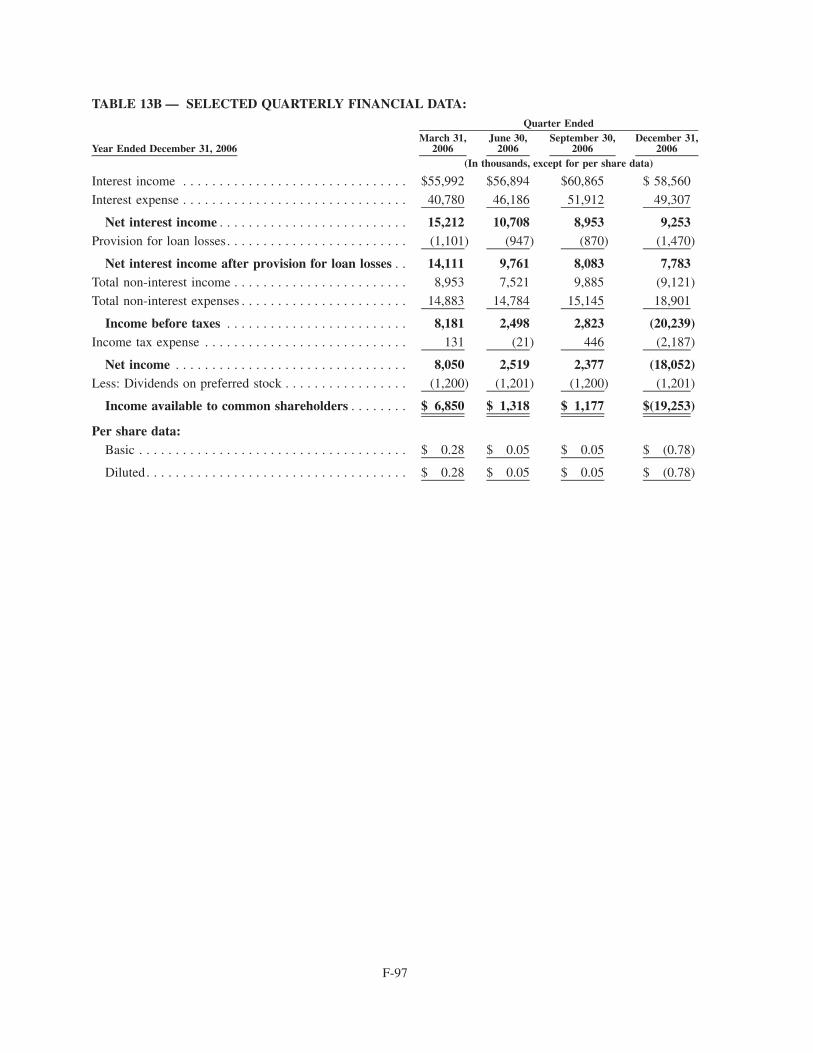
TABLE 13B — SELECTED QUARTERLY FINANCIAL DATA:
Year Ended December 31, 2006March 31,
2006June 30,
2006September 30,
2006December 31,
2006
Quarter Ended
(In thousands, except for per share data)
Interest income . . . . . . . . . . . . . . . . . . . . . . . . . . . . . . . $55,992 $56,894 $60,865 $ 58,560
Interest expense . . . . . . . . . . . . . . . . . . . . . . . . . . . . . . . 40,780 46,186 51,912 49,307
Net interest income . . . . . . . . . . . . . . . . . . . . . . . . . . 15,212 10,708 8,953 9,253Provision for loan losses. . . . . . . . . . . . . . . . . . . . . . . . . (1,101) (947) (870) (1,470)
Net interest income after provision for loan losses . . 14,111 9,761 8,083 7,783Total non-interest income . . . . . . . . . . . . . . . . . . . . . . . . 8,953 7,521 9,885 (9,121)
Total non-interest expenses . . . . . . . . . . . . . . . . . . . . . . . 14,883 14,784 15,145 18,901
Income before taxes . . . . . . . . . . . . . . . . . . . . . . . . . 8,181 2,498 2,823 (20,239)Income tax expense . . . . . . . . . . . . . . . . . . . . . . . . . . . . 131 (21) 446 (2,187)
Net income . . . . . . . . . . . . . . . . . . . . . . . . . . . . . . . . 8,050 2,519 2,377 (18,052)Less: Dividends on preferred stock . . . . . . . . . . . . . . . . . (1,200) (1,201) (1,200) (1,201)
Income available to common shareholders . . . . . . . . $ 6,850 $ 1,318 $ 1,177 $(19,253)
Per share data:Basic . . . . . . . . . . . . . . . . . . . . . . . . . . . . . . . . . . . . . $ 0.28 $ 0.05 $ 0.05 $ (0.78)
Diluted. . . . . . . . . . . . . . . . . . . . . . . . . . . . . . . . . . . . $ 0.28 $ 0.05 $ 0.05 $ (0.78)
F-97
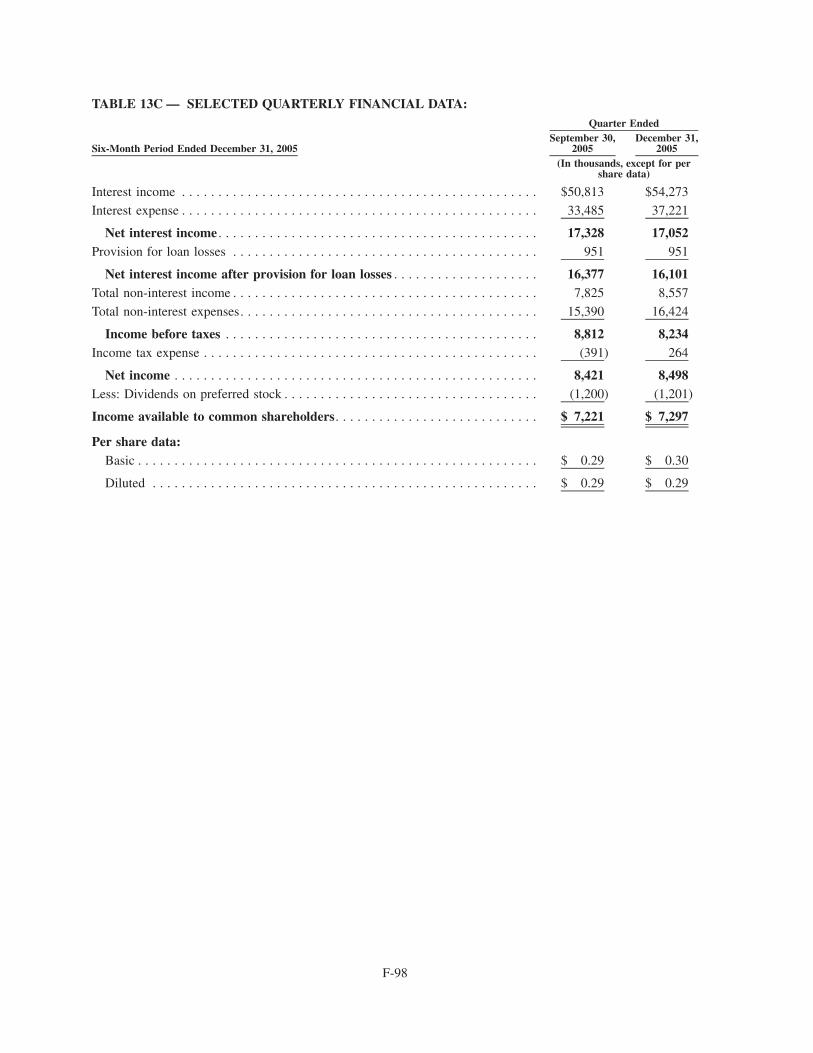
TABLE 13C — SELECTED QUARTERLY FINANCIAL DATA:
Six-Month Period Ended December 31, 2005September 30,
2005December 31,
2005
Quarter Ended
(In thousands, except for pershare data)
Interest income . . . . . . . . . . . . . . . . . . . . . . . . . . . . . . . . . . . . . . . . . . . . . . . . . $50,813 $54,273
Interest expense . . . . . . . . . . . . . . . . . . . . . . . . . . . . . . . . . . . . . . . . . . . . . . . . . 33,485 37,221
Net interest income . . . . . . . . . . . . . . . . . . . . . . . . . . . . . . . . . . . . . . . . . . . . 17,328 17,052Provision for loan losses . . . . . . . . . . . . . . . . . . . . . . . . . . . . . . . . . . . . . . . . . . 951 951
Net interest income after provision for loan losses . . . . . . . . . . . . . . . . . . . . 16,377 16,101Total non-interest income . . . . . . . . . . . . . . . . . . . . . . . . . . . . . . . . . . . . . . . . . . 7,825 8,557
Total non-interest expenses. . . . . . . . . . . . . . . . . . . . . . . . . . . . . . . . . . . . . . . . . 15,390 16,424
Income before taxes . . . . . . . . . . . . . . . . . . . . . . . . . . . . . . . . . . . . . . . . . . . 8,812 8,234Income tax expense . . . . . . . . . . . . . . . . . . . . . . . . . . . . . . . . . . . . . . . . . . . . . . (391) 264
Net income . . . . . . . . . . . . . . . . . . . . . . . . . . . . . . . . . . . . . . . . . . . . . . . . . . 8,421 8,498Less: Dividends on preferred stock . . . . . . . . . . . . . . . . . . . . . . . . . . . . . . . . . . . (1,200) (1,201)
Income available to common shareholders. . . . . . . . . . . . . . . . . . . . . . . . . . . . $ 7,221 $ 7,297
Per share data:Basic . . . . . . . . . . . . . . . . . . . . . . . . . . . . . . . . . . . . . . . . . . . . . . . . . . . . . . . $ 0.29 $ 0.30
Diluted . . . . . . . . . . . . . . . . . . . . . . . . . . . . . . . . . . . . . . . . . . . . . . . . . . . . . $ 0.29 $ 0.29
F-98
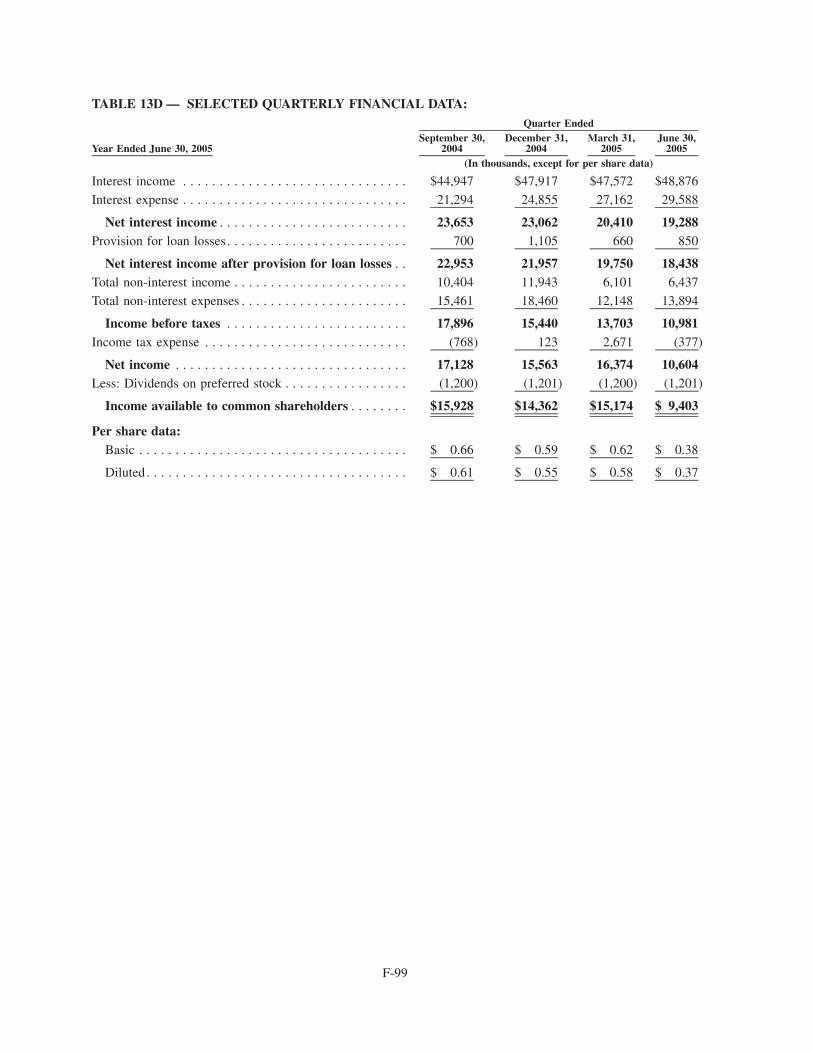
TABLE 13D — SELECTED QUARTERLY FINANCIAL DATA:
Year Ended June 30, 2005September 30,
2004December 31,
2004March 31,
2005June 30,
2005
Quarter Ended
(In thousands, except for per share data)
Interest income . . . . . . . . . . . . . . . . . . . . . . . . . . . . . . . $44,947 $47,917 $47,572 $48,876
Interest expense . . . . . . . . . . . . . . . . . . . . . . . . . . . . . . . 21,294 24,855 27,162 29,588
Net interest income . . . . . . . . . . . . . . . . . . . . . . . . . . 23,653 23,062 20,410 19,288Provision for loan losses. . . . . . . . . . . . . . . . . . . . . . . . . 700 1,105 660 850
Net interest income after provision for loan losses . . 22,953 21,957 19,750 18,438Total non-interest income . . . . . . . . . . . . . . . . . . . . . . . . 10,404 11,943 6,101 6,437
Total non-interest expenses . . . . . . . . . . . . . . . . . . . . . . . 15,461 18,460 12,148 13,894
Income before taxes . . . . . . . . . . . . . . . . . . . . . . . . . 17,896 15,440 13,703 10,981Income tax expense . . . . . . . . . . . . . . . . . . . . . . . . . . . . (768) 123 2,671 (377)
Net income . . . . . . . . . . . . . . . . . . . . . . . . . . . . . . . . 17,128 15,563 16,374 10,604Less: Dividends on preferred stock . . . . . . . . . . . . . . . . . (1,200) (1,201) (1,200) (1,201)
Income available to common shareholders . . . . . . . . $15,928 $14,362 $15,174 $ 9,403
Per share data:Basic . . . . . . . . . . . . . . . . . . . . . . . . . . . . . . . . . . . . . $ 0.66 $ 0.59 $ 0.62 $ 0.38
Diluted. . . . . . . . . . . . . . . . . . . . . . . . . . . . . . . . . . . . $ 0.61 $ 0.55 $ 0.58 $ 0.37
F-99
Critical Accounting Policies
Transfers and Servicing of Financial Assets and Extinguishments of Liabilities
A transfer of financial assets is accounted for as a sale when control over the assets has been surrendered. Controlover transferred assets is deemed to be surrendered when (1) the assets have been isolated from the transferor, (2) thetransferee obtains the right (free of conditions that constrain it from taking advantage of that right) to pledge orexchange the transferred assets, and (3) the transferor does not maintain effective control over the transferred assetsthrough an agreement to repurchase them before maturity. As such, the Group recognizes the financial assets andservicing assets it controls and the liabilities it has incurred. At the same time, it ceases to recognize financial assetswhen control has been surrendered and liabilities when they are extinguished.
Derivative Financial Instruments
As part of the Group’s asset and liability management, the Group uses interest-rate contracts, which includeinterest-rate swaps to hedge various exposures or to modify interest rate characteristics of various statement offinancial condition accounts.
The Group follows Statement of Financial Accounting Standards (“SFAS”) No. 133, “Accounting for DerivativeInstruments and Hedging Activities”, as amended, which establishes accounting and reporting standards forderivative instruments, including certain derivative instruments embedded in other contracts, and for hedgingactivities. The statement requires that all derivative instruments be recognized as assets and liabilities at fair value.If certain conditions are met, the derivative may qualify for hedge accounting treatment and be designated as one ofthe following types of hedges: (a) hedge of the exposure to changes in the fair value of a recognized asset or liabilityor an unrecognized firm commitment (“fair value hedge”); (b) a hedge of the exposure to variability of cash flows ofa recognized asset, liability or forecasted transaction (“cash flow hedge”) or (c) a hedge of foreign currencyexposure (“foreign currency hedge”).
In the case of a qualifying fair value hedge, changes in the value of the derivative instruments that have been highlyeffective are recognized in current period earnings along with the change in value of the designated hedged item. Inthe case of a qualifying cash flow hedge, changes in the value of the derivative instruments that have been highlyeffective are recognized in other comprehensive income, until such time as those earnings are affected by thevariability of the cash flows of the underlying hedged item. In either a fair value hedge or a cash flow hedge, netearnings may be impacted to the extent the changes in the fair value of the derivative instruments do not perfectlyoffset changes in the fair value or cash flows of the hedged items. If the derivative is not designated as a hedginginstrument, the changes in fair value of the derivative are recorded in earnings.
Certain contracts contain embedded derivatives. When the embedded derivative possesses economic characteristicsthat are not clearly and closely related to the economic characteristics of the host contract, it is bifurcated andcarried at fair value.
The Group may use several pricing models that consider current market and contractual prices for the underlyingfinancial instruments as well as time value and yield curve or volatility factors underlying the positions to derive thefair value of certain derivatives contracts.
Allowance for Loan Losses
The allowance for loan losses is established as losses are estimated to have occurred through a provision for loanlosses charged to earnings. Loan losses are charged against the allowance when management believes theuncollectability of a loan balance is confirmed. Subsequent recoveries, if any, are credited to the allowance.
The Group follows a systematic methodology to establish and evaluate the adequacy of the allowance for loanlosses. This methodology consists of several key elements. The allowance for loan losses is evaluated on a regularbasis by management and is based upon management’s periodic review of the collectability of the loans in light ofhistorical experience, the nature and volume of the loan portfolio, adverse situations that may affect the borrower’sability to repay, estimated value of any underlying collateral and prevailing economic conditions. This evaluation is
F-100
inherently subjective, as it requires estimates that are susceptible to significant revision as more informationbecomes available.
Larger commercial loans that exhibit potential or observed credit weaknesses are subject to individual review andgrading. Where appropriate, allowances are allocated to individual loans based on management’s estimate of theborrower’s ability to repay the loan given the availability of collateral, other sources of cash flow and legal optionsavailable to the Group.
Income Taxes
In preparing the consolidated financial statements, the Group is required to estimate income taxes. This involves anestimate of current income tax expense together with an assessment of temporary differences resulting fromdifferences between the carrying amounts of assets and liabilities for financial reporting purposes and the amountsused for income tax purposes. The determination of current income tax expense involves estimates and assumptionsthat require the Group to assume certain positions based on its interpretation of current tax regulations. Changes inassumptions affecting estimates may be required in the future and estimated tax assets or liabilities may need to beincreased or decreased accordingly. The accrual for tax contingencies is adjusted in light of changing facts andcircumstances, such as the progress of tax audits, case law and emerging legislation. The Group’s effective tax rateincludes the impact of tax contingency accruals and changes to such accruals, including related interest andpenalties, as considered appropriate by management. When particular matters arise, a number of years may elapsebefore such matters are audited and finally resolved. Favorable resolution of such matters could be recognized as areduction to the Group’s effective rate in the year of resolution. Unfavorable settlement of any particular issue couldincrease the effective rate and may require the use of cash in the year of resolution.
New Accounting Pronouncements
SFAS No. 157, “Fair Value Measurements”
In September 2006, FASB issued SFAS No. 157, “Fair Value Measurements”, which defines fair value, establishesa framework for measuring fair value in GAAP, and expands disclosures about fair value measurements. ThisStatement applies under other accounting pronouncements that require or permit fair value measurements, theBoard having previously concluded in those accounting pronouncements that fair value is the relevant measurementattribute. Accordingly, this Statement does not require any new fair value measurements. The changes to currentpractice resulting from the application of this Statement relate to the definition of fair value, the methods used tomeasure fair value, and the expanded disclosures about fair value measurements.
This Statement is effective for financial statements issued for fiscal years beginning after November 15, 2007, andinterim periods within those fiscal years. Earlier application was encouraged, provided that the reporting entity hadnot yet issued financial statements for that fiscal year, including financial statements for an interim period withinthat fiscal year. The Group adopted the provisions of SFAS No. 157 commencing in the first quarter of 2008. Suchprovisions are to be applied prospectively. The Group is currently assessing the impact of SFAS No. 157 on itsconsolidated financial statements, including disclosures.
SFAS No. 159, “The Fair Value Option for Financial Assets and Financial Liabilities, including anamendment of FASB Statement No. 115”
On February 15, 2007, the FASB issued SFAS No. 159, “The Fair Value Option for Financial assets and FinancialLiabilities, Including an amendment of FASB Statement No. 115”. SFAS No. 159 provides an alternativemeasurement treatment for certain financial assets and financial liabilities, under an instrument-by-instrumentelection, that permits fair value to be used for both initial and subsequent measurement, with changes in fair valuerecognized in earnings. While SFAS No. 159 is effective for the Group beginning January 1, 2008, earlier adoptionis permitted as of January 1, 2007, provided that the entity also adopts all of the requirements of SFAS No. 157. TheGroup adopted the provisions of SFAS 159 in January 2008, but decided not to apply the fair value option for any ofits financial assets and liabilities, other than those required by SFAS 115.
F-101
SFAS No. 141R, “Business Combinations”
In December 2007, the FASB issued SFAS No. 141R, “Business Combinations.” SFAS No. 141R will significantlychange the accounting for business combinations. Under SFAS No. 141R, an acquiring entity will be required torecognize all the assets acquired and liabilities assumed in a transaction at the acquisition-date fair value withlimited exceptions. The statement will also require all acquisition-related costs to be expensed as they are incurred.SFAS No. 141R is required to be applied to business combinations for which the acquisition date is on or after thebeginning of the first annual reporting period beginning on or after December 15, 2008, with earlier adoption beingprohibited. The Group is currently evaluating the effect, if any, of the adoption of SFAS 141R on its consolidatedfinancial statements, including disclosures.
F-102
Oriental Group Tower
Marginal San Roberto #997
Professional Park
San Juan, PR 00927
Telephone: (787) 771-6800
Transfer Agent and Register
American Stock Transfer & Trust Company
6201 15th Avenue
Brooklyn, NY 11219
Telephone: (718) 921-8275
Dividend Reinvestment Plan
Patrick J. Dunn
Oriental Financial Services
PO Box 195119
San Juan, PR 00919
Telephone: (787) 474-1993
E-mail: [email protected]
Accountants
KPMG LLP
250 Munoz Rivera Avenue, Suite 1100
San Juan, PR 00918
Form 10-K
Annual Report on Form 10-K with
the SEC is available on request from:
www.proxyvote.com
Annual Meeting
The Annual Meeting of Stockholders
will be held June 18, 2008 at 9:30 am
Training Room - 8th Floor
Oriental Tower
Professional Park
Marginal San Roberto #997
San Juan, PR 00927
METROPOLITAN AREA
REGION
Río Piedras – San Roberto
Bayamón
Carolina
Carolina – Plaza Escorial
Hato Rey – Ponce de León Ave.
Hato Rey – Torre Chardón
Las Cumbres
Galería San Patricio
Miramar
EASTERN REGION
Belz Factory Outlet Mall
Caguas Bairoa
Caguas – HIMA
Cayey
Ceiba
Humacao- Pueblo
Humacao- Oriental Center
Las Piedras
Naguabo
San Lorenzo
Yabucoa
WESTERN REGION
Arecibo
Guayama
Mayagüez
Ponce
Our President and CEO has
submitted to the NYSE the
Domestic Company Section 303A
Annual CEO for
2007 regarding our compliance
with the corporate governance
listing standards of the NYSE.
Also, we have with the SEC,
as exhibits 31.1 and 31.2 to our
annual report on Form 10-K for
2007, the Sarbanes-Oxley
Act Section 302 of
both our CEO and CFO regarding
the quality of our public
disclosures.”
DES
IGN
:ID
GRO
UP
/ED
ITO
RIA
LTE
XT:
AN
RED
ER&
CO
MPA
NY
/PR
INTI
NG
:MO
DEL
OFF
SET
PRIN
TIN
G
G E N E R A L I N F O R M A T I O N
ORI_3545_Art_Editorial [inhouse 14 14 4/25/08 5:22:19 PM
www.OrientalOnline.com
B U S I N E S S L I N E S
( N Y S E : O F G )
Banking - Consumer & Commercial
Mortgage
Brokerage
Trust
Insurance
Pension Plans
Oriental Financial Group

Our core value:Supporting our customers’
2 0 0 7 A N N U A L R E P O R T
( N Y S E : O F G ) www.OrientalOnline.com
�nancial aspirations