Embed Size (px)
Citation preview

OUR CONTRIBUTION TO YORKSHIRE
May 2018
An assessment of the impact we have and the value we create for society.

P 2 P 3
FOREWORDAs a finance professional I am drawn to the balance sheet, but I am equally passionate about considering value beyond the traditional financial perspective to help business focus on what really matters to people. That is why I am delighted to publish the findings of our first Total Impact and Value Assessment (TIVA). By looking at a broad range of economic, environmental and social priorities, we are considering our impacts and associated economic value like never before. This new approach is providing fresh insight that is helping us shape our strategy to ensure the resilience of our services, enhance our positive impact on the economy and the environment, and maximise the value we create for society.
Yorkshire Water has a history of trialling innovative accounting and assessment techniques that help towards more sustainable approaches. For example, we piloted Ecosystem Services Assessment with Natural England in 2012 and tested the draft Natural Capital Protocol in 2016. By bringing together these and other techniques, we are working to develop and embed practical approaches that help advance how we monitor, report, manage and improve our impact and add value to the society we serve.
This work is helping us find new opportunities to enhance our positive impact and resulting economic contribution. Throughout this report we share our learning about the needs and opportunities to, for example, further strengthen the resilience of our services for customers, become more inclusive, improve resource efficiency, and reduce environmental damage. In the spirit of transparency and openness, we have also published a full breakdown of our methodology in a separate report available on our website.
The findings from our first TIVA stem from a mix of best practice quantitative techniques, supported by qualitative assessment in parts where further maturity is needed. Whilst techniques continue to develop, I am confident that we and others can start to deploy the latest sustainable accounting approaches to inform decision making that enhances value for customers. In fact, in light of the risks facing the water industry and wider society, I see an imperative for us and others to broaden our understanding of value creation and develop new approaches that can effectively ensure the sustainability of our business and our essential public services.
We publish this report as part of our programme to co-create with our customers and stakeholders the future strategy for Yorkshire Water. To ensure a highly efficient and resilient approach we are collectively considering how to best optimise resources and manage inherent trade-offs to deliver the priorities our customers need and want. Please send us your feedback and ideas to help shape and improve our thinking.
Liz Barber
Group Director of Finance, Regulation and Markets
Trusting this informationThis report is unlike our other publications because we are sharing latest findings from a new approach that we continue to develop and which involves a mix of traditional and innovative analysis techniques. We have taken steps to ensure openness and clarity in this report because we always want to provide you with information you can trust. We summarise these steps on page 11 and you can find an independent expert opinion about the validity of our approach on page 18.
Get in touchWe would welcome your feedback and questions.
Gordon Rogers Head of Sustainability [email protected]
Hannah James Lead Sustainability Advisor [email protected]
CONTENTSSummary Report 2
Foreword 3
What we do 4
What is Total Impact and Value Assessment? 8
Headline results 12
Our conclusions and next steps 16
What others think about our new approach 18
Findings Report 20
Financial capital 21
Manufactured capital 24
Natural capital 27
Human capital 43
Intellectual capital 49
Social capital 52
Conclusions 59
Methodology Report
The methodology and a series of case studies can be found on our website: www.yorkshirewater.co.uk/capitals

SewerEscape
Recycle NutrientsTo The Land
Customer Service Centre
Reservoirs Water Abstractions Boreholes
Water Treatment Works
BusinessesLeaks
Wastewater Treatment Works
Surface Water
Sludge Recycling & Energy Centres
Emergency Relief Overflows
ReturningTreated Water
Homes
LAND MANAGEMENT WATER COLLECTION
WATER TREATMENT
WATER SUPPLY CUSTOMER SERVICE
WASTEWATER COLLECTION
WASTEWATER TREATMENT & RECYCLING
133 9 45
48
2m 140k
611
P 4 P 5
WHAT WE DOWe provide essential water and wastewater services to the people and businesses
of the Yorkshire and Humberside region, playing a key role in the region’s health,
wellbeing and prosperity.
Collecting, treating and supplying around
1.3bn litres of water every day
Investing over £1m every day to maintain
and enhance Yorkshire’s network of pipes,
pumps and treatment works
Managing £1bn of water bills every
year and providing customer service when it’s needed
Note: Statistics in this graphic refer to our position at 31st March 2018
Collecting, treating, and safely returning to
the environment 1bn litres of water
every day
Recycling nutrients and generating energy
from leftover human waste
Led by around 2,800 colleagues using a fleet of over 2,000 vehicles
and increasingly complex technology, delivering for today
and planning for the long-term
1. WE DO LOTS OF GOOD AND WANT TO DO MOREWe think we make a net-positive contribution to society. After all, our services protect public health, sanitation and the environment. Whilst we’re very proud of the enormous positive impact we have, in this report we’re focused on the areas we can and need to do better, because we see an imperative for change to ensure the long term resilience of essential water and wastewater services. Working innovatively and in partnership will help us here.
2. ECONOMIC VALUATION HELPS MAKE BETTER DECISIONSEstimating the economic value of impacts which are not typically considered in financial terms helps us to quantify the impact we have. We’ve focused where we could do meaningful valuation, rather than trying to monetise our ‘total impact’. Where we have done economic valuation, we recognise that this is only an estimate based on the best available information, and in many cases we will not have captured the full impact (either positive or negative). No matter how good the valuation, we know this can only ever be an aid to decision making, and there is no substitute for human and scientific judgement.
3. THIS APPROACH IS DELIVERING REAL BENEFITSUsing the six capitals approach is helping us change for the better by improving our understanding of the risks and dependencies we are managing, and the impacts we have, both positive and negative. By thinking of ‘value’ in the broadest terms, we are moving beyond traditional financial accounting and decision making. The more we have considered this approach, the more we have seen opportunities to go even further. We’re committed to developing and embedding the approach into our standard business processes.
WHAT WE BELIEVE
haManaging 28,000
hectares of land to protect water quality
and enable recreational opportunities that benefit health and
wellbeing

Financial capital
Natural Capital Social Capital
P 6 P 7
WHAT IS TIVA?AN IMPERATIVE FOR CHANGE AND A CONCEPT FOR A NEW APPROACHAt Yorkshire Water we play a key role in the wellbeing and prosperity of the society we serve. By supplying water and taking away wastewater we safeguard people’s wellbeing, underpin the regional economy, maintain critical infrastructure and protect the environment. Whilst we do all this good, we don’t always gets things right first time and we want to do better. We see an imperative for change to further improve our services and to ensure we can affordably sustain them for the growing population for years to come, despite pressures such as climate change and resource constraints. Total Impact and Value Assessment (TIVA) is helping us achieve this goal.
TIVA is the name for our work to enhance our understanding of our impact on customers and the environment, both positive and negative. TIVA goes beyond traditional approaches by applying a mix of best practice accounting, economic and sustainability techniques to quantify our impact throughout our value chain, and where sensible, to put a monetary value on the impact to aid comparison.
This innovative approach is providing a broader view of the risks to our services and the value we create. It is also highlighting opportunities to enhance our impact and value, and the inherent trade-offs that need to be considered when making decisions. We are using this fresh insight to shape our current approach and future strategy to ensure our services are resilient and we are maximising our potential contribution to society, the economy and the environment.
TIVA takes us further in our, and the whole UK water industry’s, work to move from being more internally focused on specific ‘inputs and outputs’ associated with our assets, to having customers at the heart of everything we do, and the ultimate impact we have on people and the environment.
INPUTS OUTPUTS OUTCOMES IMPACT VALUEPRICE
REVIEW 2009
PRICE REVIEW
2019
PRICE REVIEW
2014
EG‘DG5’ (AN INDUSTRY
TERM FOR THE MEASURE OF SEWER FLOODING)
EG‘STRESS, HEALTH
AND DISRUPTION TO CUSTOMERS’
EG‘SEWER
FLOODING INCIDENTS’
THE UNDERLYING CONCEPT
APPLYING THE CONCEPT OF ‘THE CAPITALS’The term ‘financial capital’ has become widely accepted and understood in society, commonly used to refer to a stock of money that can deliver a flow of services that have benefits to people. Sustainability leaders such as Forum for the Future and the International Integrated Reporting Council go beyond convention and expand the concept to recognise other assets (and liabilities) that are important to a healthy and prosperous society.
We have examined our impacts and dependencies across the capitals, assessing a range of economic, environmental and social attributes associated with our activities. By quantifying our negative and positive impacts and value across the capitals we are basing our strategy on a rich understanding so that we can ensure the resilience of our business and public services.
FINANCIAL CAPITAL Our financial health and efficiency
MANUFACTURED CAPITAL Our pipes, treatment works, offices and IT
NATURAL CAPITAL The materials and services we rely on from the environment, especially water
HUMAN CAPITAL Our workforce’s capabilities and wellbeing
INTELLECTUAL CAPITAL Our knowledge and processes
SOCIAL CAPITAL Our relationships and customers’ trust in us
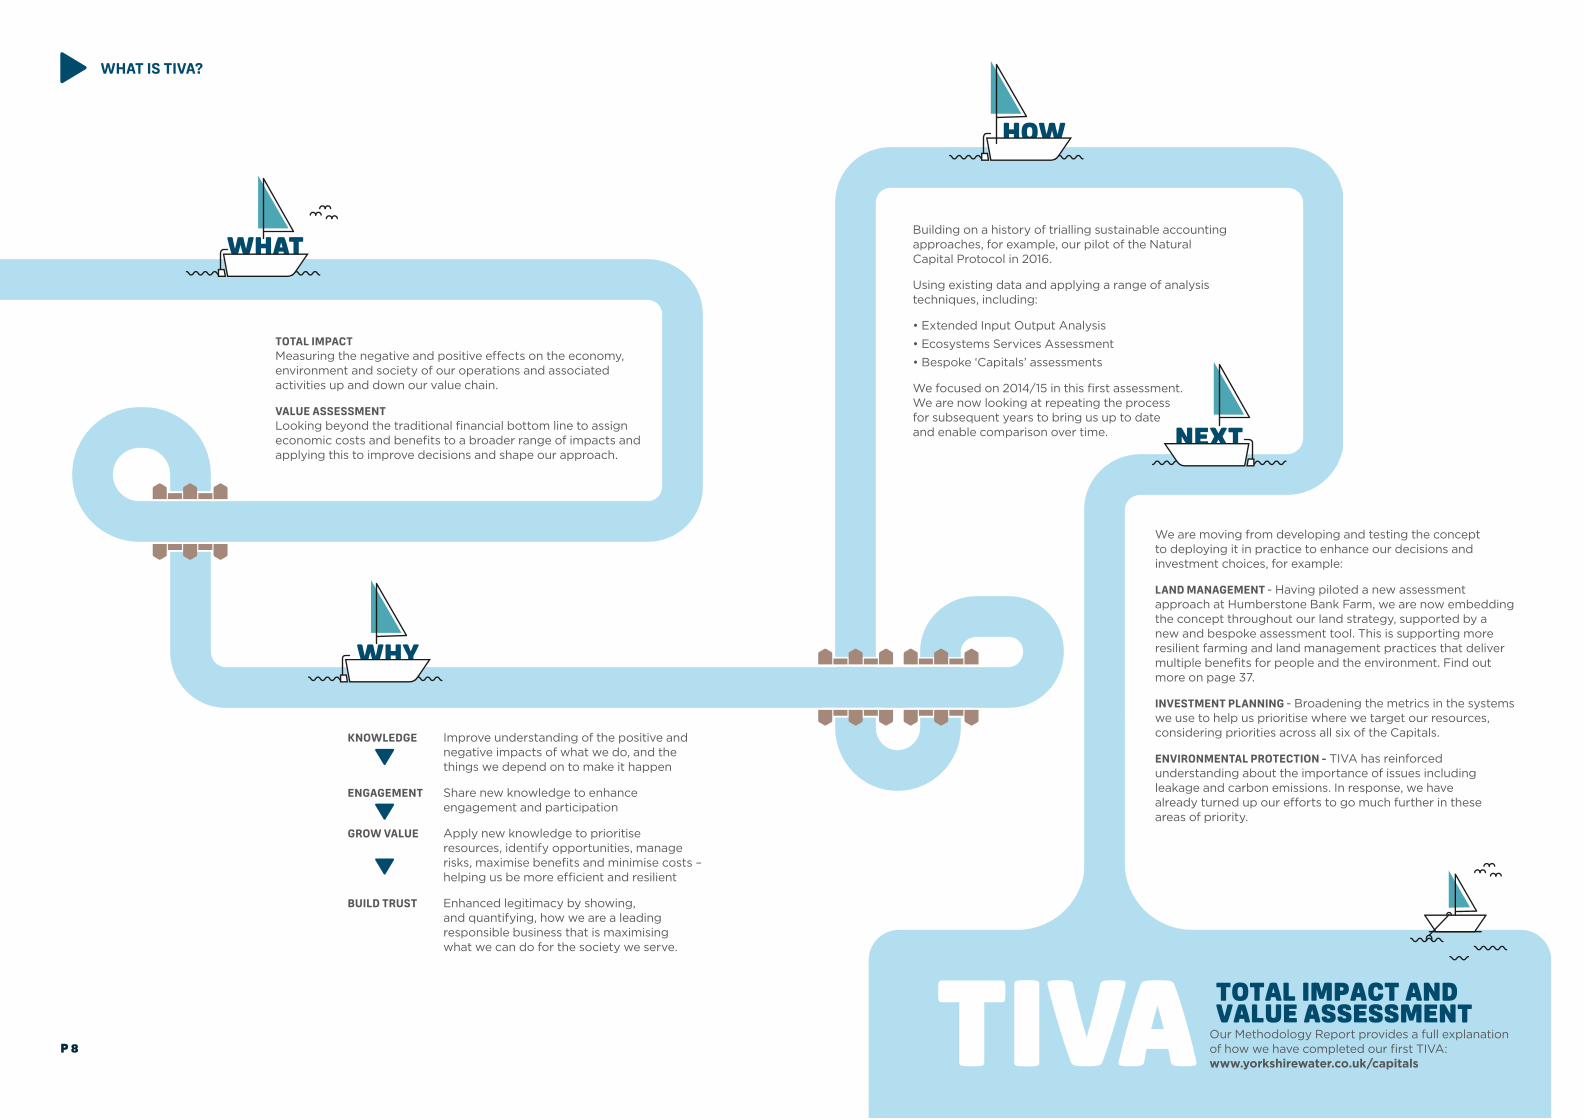
WHAT
WHY
HOW
NEXT
TIVA TOTAL IMPACT ANDVALUE ASSESSMENT
P 8
TOTAL IMPACTMeasuring the negative and positive effects on the economy, environment and society of our operations and associated activities up and down our value chain.
VALUE ASSESSMENTLooking beyond the traditional financial bottom line to assign economic costs and benefits to a broader range of impacts and applying this to improve decisions and shape our approach.
KNOWLEDGE Improve understanding of the positive and negative impacts of what we do, and the things we depend on to make it happen
ENGAGEMENT Share new knowledge to enhance engagement and participation
GROW VALUE Apply new knowledge to prioritise resources, identify opportunities, manage risks, maximise benefits and minimise costs – helping us be more efficient and resilient
BUILD TRUST Enhanced legitimacy by showing, and quantifying, how we are a leading responsible business that is maximising what we can do for the society we serve.
Building on a history of trialling sustainable accounting approaches, for example, our pilot of the Natural Capital Protocol in 2016.
Using existing data and applying a range of analysis techniques, including:
• Extended Input Output Analysis
• Ecosystems Services Assessment
• Bespoke ‘Capitals’ assessments
We focused on 2014/15 in this first assessment. We are now looking at repeating the process for subsequent years to bring us up to date and enable comparison over time.
We are moving from developing and testing the concept to deploying it in practice to enhance our decisions and investment choices, for example:
LAND MANAGEMENT - Having piloted a new assessment approach at Humberstone Bank Farm, we are now embedding the concept throughout our land strategy, supported by a new and bespoke assessment tool. This is supporting more resilient farming and land management practices that deliver multiple benefits for people and the environment. Find out more on page 37.
INVESTMENT PLANNING - Broadening the metrics in the systems we use to help us prioritise where we target our resources, considering priorities across all six of the Capitals.
ENVIRONMENTAL PROTECTION - TIVA has reinforced understanding about the importance of issues including leakage and carbon emissions. In response, we have already turned up our efforts to go much further in these areas of priority.
Our Methodology Report provides a full explanation of how we have completed our first TIVA: www.yorkshirewater.co.uk/capitals
WHAT IS TIVA?

P 10 P 11
CONTEXT AND TERMINOLOGYLOOKING UP AND DOWN OUR VALUE CHAINWe have not only looked at the impacts from our operations. To better understand the ‘total’ impact and value associated with our water and wastewater services we have also considered the impacts in our supply chain and from our customers’ use of our services. We have followed the three categories of impact recognised by The Crown Estate in their leading Total Contribution work – Direct, Indirect and Enabled. You can find out about The Crown Estate’s work at www.thecrownestate.co.uk/our-business/total-contribution
We have varying levels of influence across our value chain and it is difficult to quantify how much ‘responsibility’ we and others have for positive or negative impacts which do not stem directly from our activities. Regardless of any debate about levels of attribution, our work reinforces the importance of working in partnership across all parts of our value chain to increase positive outcomes for society.
In some areas, we have only been able to quantify our direct impacts in this first assessment. This is because data was more readily available and higher quality for activities in our direct control, and also because we wanted to focus first on those areas we can most easily make change. We will look to grow the scope over time as we continue to develop our approach.
THIRD + TIER SUPPLIERS
SECOND TIER SUPPLIERS
FIRST TIER SUPPLIERS
INDIRECT IMPACTS DIRECT IMPACTS ENABLED IMPACTS
TENANTS OF OUR LAND AND PROPERTIES
COMMERCIAL AND INDUSTRIAL CUSTOMERS
HOUSEHOLD CUSTOMERS
THE SCOPE OF TIVA
RECOGNISING ATTRIBUTION & INFLUENCE
Activities carried out by us.
Activities carried out by our customers using our services, or by
our tenants occupying our land.
Activities commissioned by us and carried out within our supply chain.
FOCUSING ON THE YEAR 2014/15In this assessment we have focused on the impacts and associated economic values resulting from our activity in the financial year ending 31 March 2015. Some data has been used from outside this time period where it was the best data available and we could expect minimal difference in the findings. We took this approach because, when we started working on TIVA in 2016, this was the most recent year for which we had a complete dataset.
We are now looking at repeating the process for subsequent years to bring us up to date and enable comparison over time.
THE MATURITY OF OUR ASSESSMENTIn completing our first assessment we have developed a wealth of insight and advanced our thinking using best available data and a mix of traditional and innovative techniques. However, we have more to do to embed a highly mature process that is seamlessly integrated in our decision making processes and alongside our standard financial and performance reporting.
In our work to date we have prioritised the impacts which we feel are most significant for us as a business, for society and for the environment. At the beginning of this process we carried out a materiality study to help us determine which impacts were most important.
Our figures do not represent the entire ‘value’ of nature, people, or society. For example, whilst we might express a value to the company of our colleagues’ wellbeing in terms of reduced sickness rates, this does not reflect the entirety of its importance to individuals and neither does it reflect the total scope of our business interests or responsibilities.
It can be challenging to assign economic values to things which are not usually expressed in financial terms, and to quantify impacts that are not tangible or in your direct control. As a result, our processes have sometimes used assumptions and estimations. To ensure openness and clarity in this report, we have:
Rounded our final figures, where necessary, so as not to imply misleading levels
of accuracy.
Published our detailed methodology in a report accompanying this one.
This can be found at: www.yorkshirewater.
co.uk/capitals
Used confidence ratings to make clear the maturity of each quantified impact and economic valuation. These are captured in the
Methodology Report.
Worked alongside an independent expert, Route2, to support and challenge us.
Their statement on the validity of our approach can be seen on p18.
WE WILL CONTINUE TO ADVANCE AND EMBED OUR APPROACH, UNDERTAKING FURTHER DEVELOPMENT TO HELP US ADDRESS GAPS AND UNCERTAINTIES.

L
DAYS VOLUNTEERED
OUR IMPACTHere we provide a visual summary of the findings of our assessment of our impact in the year 2014/15. The diagram shows examples of the broad nature of our impact.
2,398DIRECT
9,170INDIRECT
7,491ENABLED
JOBS SUPPORTED
21,000HOMES
67 GWH OF RENEWABLE ELECTRICITY GENERATED, ENOUGH TO POWER OVER
FEMALE SENIOR LEADERS CO2 STORED IN OUR LAND
30%APPRENTICESHIPS
LENGTH OF RIVER IMPROVED
22
88km
50,000TONNES
That’s enough to off set the emissions from 200 million miles of car travel.
1.8 Bn litres DIRECT
189 Bn litres
INDIRECT
373 Bn litres
ENABLED
WATER CONSUMPTIONEDUCATION VISITS
15,411 76.6 Bn litres DIRECT
849 work days
DIRECT
28.7 Bn litres ENABLED
1,901 non-work days
ENABLED
LEAKS FROM PIPES
P 13P 12
90,000 tonnes
DIRECT
440,000 tonnes
INDIRECT
100,000 tonnes
ENABLED
CO2E EMISSIONS
In total, that’s enough to fill the Royal Albert Hall around 5,500 times.
In total, that’s enough to fill the Royal Albert Hall around 1,000 times.
INDIRECT IMPACTSActivities commissioned by us and carried out within our supply chain.
DIRECT IMPACTSActivities carried out by us.
ENABLED IMPACTSActivities carried out by our customers using our services, or by our tenants occupying our land.

Intellectual
-£200m
-£100m
£20m
-£20m
Chan
ge in
valu
e of f
ixed
asse
ts
Ener
gy g
ener
ated
Man
ufactured
Bath
ing
wat
er im
prov
emen
ts
Recre
atio
n an
d am
enity
Pollu
tant
s abs
orbe
d on
our
land
CO2 a
bsor
bed
in o
ur la
nd
Wat
er sa
ving
supp
ort
Was
te
Atm
osph
eric
pollu
tion
Leak
age
Natural
Prof
its ('
oper
atin
g su
rplu
s')
Salar
ies a
nd N
atio
nal In
sura
nce
Pens
ion
cont
ribut
ions
Taxe
s and
licen
se p
aym
ents
Fina
ncial
Empl
oyee
enga
gem
ent
Perfo
rman
ce re
view
s
Appr
entic
eshi
ps
Succ
essio
n pr
ogra
mm
es
Healt
h be
nefit
s
Empl
oyee
volu
ntee
ring
Inju
ries
Com
mut
ing
Prot
racte
d pa
id o
verti
me
(Un)
equ
al op
portu
nity
Wag
e inf
latio
n
Staf
f tur
nove
r
Sickn
ess a
bsen
ce
Human
Empl
oyee
train
ing
Publ
ic in
form
atio
n
Know
ledg
e dec
ay
Rese
arch
and
dev
elopm
ent
Social
Finan
cial s
uppo
rt fo
r cus
tom
ers
Char
ity a
nd vo
lunt
eerin
g
Publ
ic ed
ucat
ion
Late
pay
men
ts to
supp
liers
Dire
ct va
lue
Indi
rect
valu
eEn
able
d va
lue
Key
£0m
£100m
£200m
£300m
£0m
CO2e
emiss
ions
£122.4m
£88.0m
£24.3m
£103.1m
£373.8m
£11.6m
£110.0m
£8.3m
£7.2m
£2.8m
£2.3m
-£4.7m
-£6.1m
-£24.7m
-£157.8m
£8.1m
£4.2m
£2.5m
£0.7m
£0.6m
£0.4m
-£0.1m
-£0.1m
-£1.0m
-£1.1m
-£2.1m
-£4.2m
-£6.1m
£4.0m
£2.3m
£0.3m
-£1.2m
-£0.7m
£0.1m
£0.4m
£6.8m
THE ECONOMIC VALUE OF OUR IMPACTThis diagram shows the economic value of our impact in the year 2014/15, where we have been able to estimate this. Whilst we think we have a large net-positive contribution through our impact on health, sanitation and environmental protection, we’re focused on where we’ve been able to do meaningful valuation that will inform our strategic approach. The figures shown in the graph below are the overall net findings which can mask important details in the positive and negative impacts within each area we examined. It is important to note that there are gaps where we have not yet been able to capture our total impact.
THE CAPITALS EXPLAINEDFINANCIAL CAPITAL As a permanent and large company in Yorkshire, we support the regional economy through the salaries we pay, the goods we buy, and the taxes we contribute.
See page 21 to find out more…
MANUFACTURED CAPITAL As well as the enormous value of all the infrastructure we look after on society’s behalf, we’re also generating a large and growing amount of renewable energy.
See page 24 to find out more…
NATURAL CAPITAL We protect and enhance the water environment in Yorkshire, but to do this results in vast carbon emissions, and as a society we all waste lots of water which we are working to change.
See page 27 to find out more…
HUMAN CAPITAL In many ways, our people are priceless as they are so critical to our business. It is an ongoing process to keep our people safe and skilled. Our apprentice programme is helping us in this task, and providing valuable opportunities.
See page 43 to find out more…
INTELLECTUAL CAPITAL Our business runs on the effective deployment of our know-how and we’re always innovating to be more efficient and effective.
See page 49 to find out more…
SOCIAL CAPITAL We manage the other capitals to meet the social imperative for clean, safe water. Our social impact is one of the hardest to quantify and value, so this is an area we’ll focus on in our next phase of work. However, we have examined some indicators of our social capital. Visitors tell us they love our education centres and we recognise the importance of giving back through our charitable giving and volunteering programmes.
See page 52 to find out more…
P 15
INDIRECT IMPACTSActivities commissioned by us and carried out within our supply chain.
DIRECT IMPACTSActivities carried out by us.
ENABLED IMPACTSActivities carried out by our customers using our services, or by our tenants occupying our land.
P 14

OUR CONCLUSIONS AND NEXT STEPSOur assessment shows the broad nature of our net-positive contribution to society, however the headline position hides a wealth of valuable details. Below, we summarise some of the key conclusions we have taken from our work to date, and our plans to carry on developing our capitals approach.
The Findings Report includes more details of our analysis to better understand the positive and negative impacts and dependencies relating to each of the six capitals. This can be found starting on page 20 and it provides more results from our quantification and economic valuation, and some of the insight this provides into our risks and opportunities. We also include a range of case studies to bring to life the practical implications of our new approach and fresh insight we have taken.
APPLYING FRESH INSIGHT TO INFORM PLANS AND HELP CUSTOMERSWe are using TIVA to help enhance understanding of the positive and negative impacts we have on society, the risks facing our business and services, and the trade-offs to be considered when making management decisions. We have already started using this insight to help shape our long term strategy and current activities. We also see opportunities to use this work to engage customers about their contribution, and to help them better understand us so they can shape our plans to suit their priorities.
Expressing impacts in monetary terms, where appropriate to do so, has shed light on the relative scale of impacts and issues on our business and on wider society. For example, we found that employee engagement – not usually expressed as a financial ‘asset’ - had the largest impact on our human capital in the year we examined. Whilst employee engagement has always been considered a priority at Yorkshire Water, this assessment has revealed the true scale of its importance relative to other factors. Similarly, we can see in financial terms that the business value (benefit) of our employee volunteering programmes, from increased engagement and employee wellbeing, is almost seven times the value (cost) of the working time spent by employees on volunteering. More information on this part of our assessment can be found on page 58.
As well as demonstrating some of the potential benefits of economically valuing non-financial impacts, these examples also highlight that valuation, no matter how accurate and comprehensive, can only ever be an aid to decision making. We should never lose sight of the real impacts, no matter what the economic evaluation shows. Economic valuation is not a substitute for human judgment, but it can help us make more informed decisions.
OPPORTUNITIES TO DO MORE We can see a range of opportunities to further grow the value we generate for society and we have already started making changes to deliver improvements. For example, we have been using a new multi-capitals appraisal tool to inform how we best manage our land to deliver more benefits for improved water quality, flood attenuation, recreation, wildlife, carbon, and for local communities. On page 41 we include a case study about how we have piloted this tool at several of our sites to inform new management regimes. We have also begun to use the capitals approach to assess the value of our innovation projects.
We also see options to reduce negative impacts and mitigate risks, particularly those associated with environmental damage and limits. For example, whilst we have greatly improved wastewater treatment to better protect the water environment, this has been achieved through energy intensive and concrete intensive investments that have resulted in a large carbon footprint. In recent years we have reduced our operational emissions, but we are still adding to a substantial legacy of emissions. We recognise the need to do more to reduce emissions, and we are well placed to do this through our potential to generate more renewable energy and increase the rate at which we sequester (or lock-away) carbon in our land.
Our recent commitment to plant one million trees in Yorkshire will have substantial carbon benefits. In addition, the new woodland and associated land management will provide a range of other benefits by helping with flood management, enhancing biodiversity and providing opportunities for recreation.
THE IMPORTANCE OF COLLABORATIONOur assessments show that the biggest impacts, and opportunities to enhance them, are not always in our direct control. We recognise the need to engage and collaborate much more with our supply chain, customers and tenants to collectively grow positive outcomes. For example, there are many benefits to be had by finding new and innovative ways to help customers and suppliers improve their water efficiency, as well as leading by example in our own operations.
FURTHER DEVELOPING OUR APPROACHWe continue to progress our work on TIVA and embed the capitals approach throughout our business. Our immediate focus is the application of our learning in the development of our business plan for 2020 and beyond, ensuring a plan built in the context of a rich understanding of our impact on society, customers and the environment. To help us do this, we are building capitals assessments into our new Decision Making Framework (DMF). We will use this data-driven system to consider the best mix of investment and operational choices based on their impact and value across a broad range of measures, thereby helping maximise societal benefit and more sustainable approaches.
We are committed to publishing our progress and learning as we continue to develop our approach. We aspire to embed the capitals approach throughout our monitoring, reporting and decision making processes to achieve a truly integrated approach which enables the management of non-financial priorities to the same standard as highly respected traditional financial approaches. As part of a growing global movement that recognises the imperative for greater resilience, we embrace this effort in order to help secure our essential public services and grow the long term value we deliver for the society we serve.
PILOT TEST OF THE NATURAL CAPITAL PROTOCOL
FIRST TOTAL IMPACT AND VALUE ASSESSMENT (TIVA)
LAND STRATEGY - APPLYING A BESPOKE CAPITALS ASSESSMENT TOOL TO SHAPE OUR APPROACH TO LAND MANAGEMENT
HUMAN AND INTELLECTUAL CAPITAL ASSESSMENT INFORMING OUR PEOPLE STRATEGY
INVESTMENT STRATEGY - AUTOMATING CAPITALS ASSESSMENT IN OUR NEW DECISION MAKING FRAMEWORK TO SHAPE OUR INVESTMENT CHOICES
EXPANDING AND EMBEDDING THE CAPITALS APPROACH
P 16 P 17
P 18 P 19
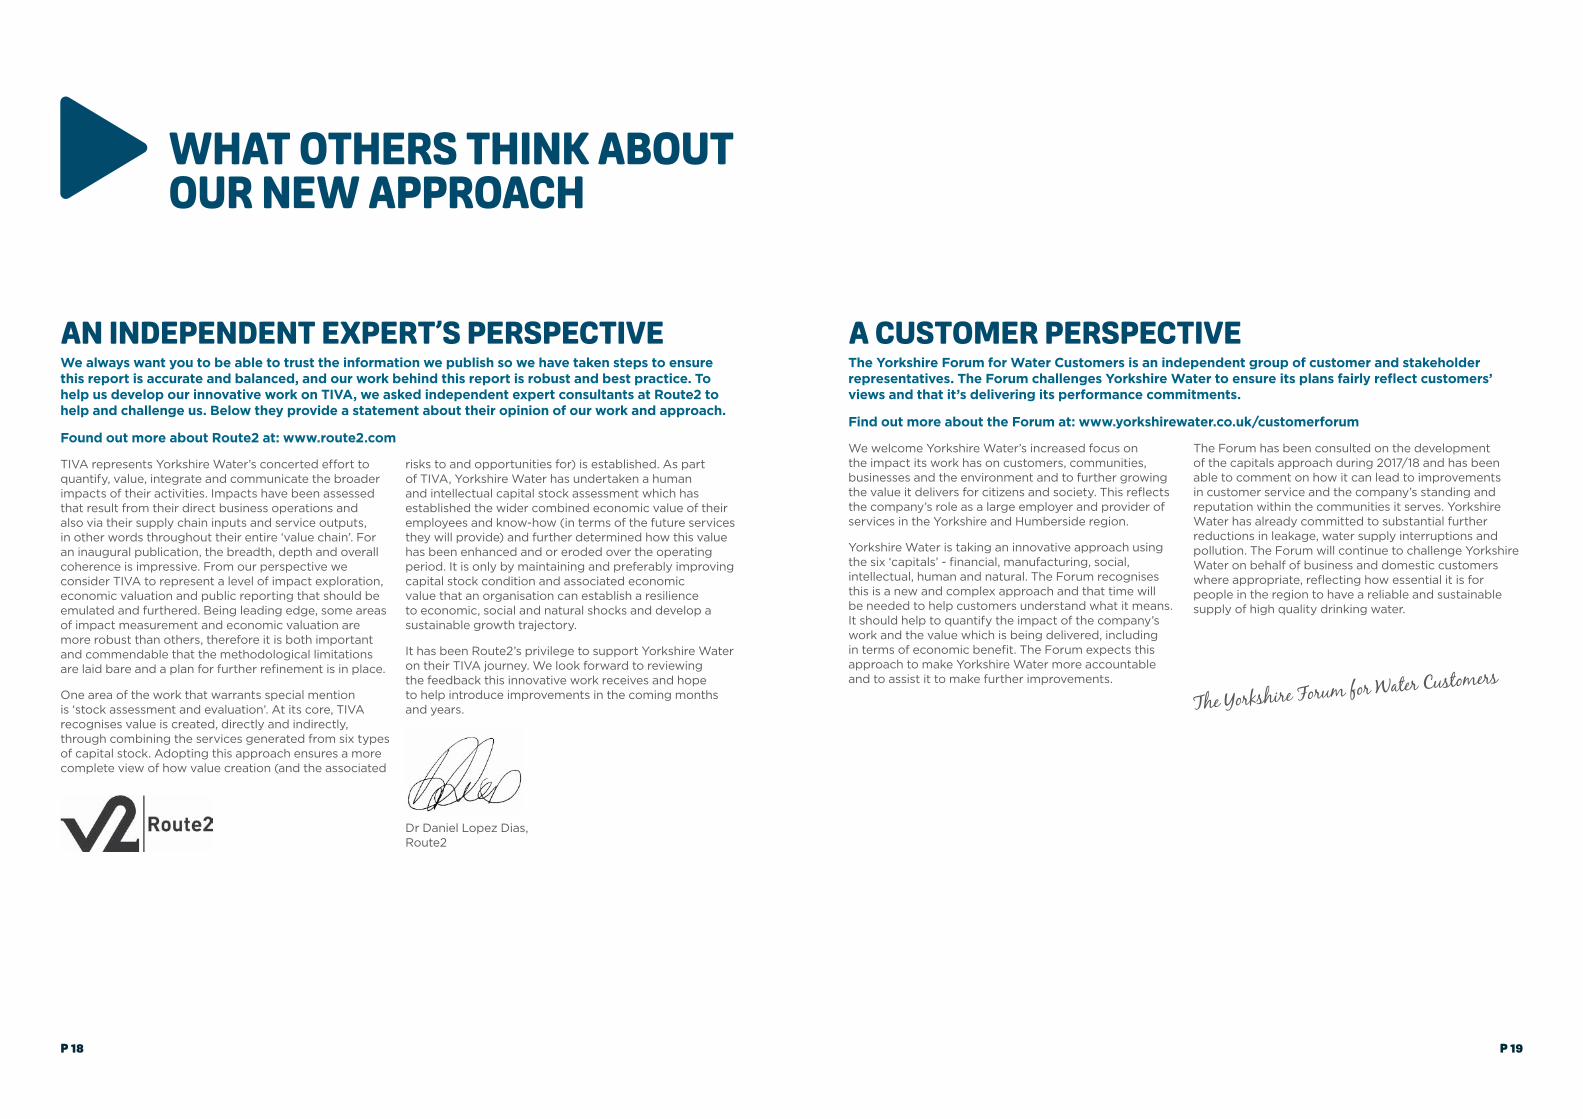
A CUSTOMER PERSPECTIVEThe Yorkshire Forum for Water Customers is an independent group of customer and stakeholder representatives. The Forum challenges Yorkshire Water to ensure its plans fairly reflect customers’ views and that it’s delivering its performance commitments.
Find out more about the Forum at: www.yorkshirewater.co.uk/customerforum
We welcome Yorkshire Water’s increased focus on the impact its work has on customers, communities, businesses and the environment and to further growing the value it delivers for citizens and society. This reflects the company’s role as a large employer and provider of services in the Yorkshire and Humberside region.
Yorkshire Water is taking an innovative approach using the six ‘capitals’ - financial, manufacturing, social, intellectual, human and natural. The Forum recognises this is a new and complex approach and that time will be needed to help customers understand what it means. It should help to quantify the impact of the company’s work and the value which is being delivered, including in terms of economic benefit. The Forum expects this approach to make Yorkshire Water more accountable and to assist it to make further improvements.
The Forum has been consulted on the development of the capitals approach during 2017/18 and has been able to comment on how it can lead to improvements in customer service and the company’s standing and reputation within the communities it serves. Yorkshire Water has already committed to substantial further reductions in leakage, water supply interruptions and pollution. The Forum will continue to challenge Yorkshire Water on behalf of business and domestic customers where appropriate, reflecting how essential it is for people in the region to have a reliable and sustainable supply of high quality drinking water.
AN INDEPENDENT EXPERT’S PERSPECTIVEWe always want you to be able to trust the information we publish so we have taken steps to ensure this report is accurate and balanced, and our work behind this report is robust and best practice. To help us develop our innovative work on TIVA, we asked independent expert consultants at Route2 to help and challenge us. Below they provide a statement about their opinion of our work and approach.
Found out more about Route2 at: www.route2.com
TIVA represents Yorkshire Water’s concerted effort to quantify, value, integrate and communicate the broader impacts of their activities. Impacts have been assessed that result from their direct business operations and also via their supply chain inputs and service outputs, in other words throughout their entire ‘value chain’. For an inaugural publication, the breadth, depth and overall coherence is impressive. From our perspective we consider TIVA to represent a level of impact exploration, economic valuation and public reporting that should be emulated and furthered. Being leading edge, some areas of impact measurement and economic valuation are more robust than others, therefore it is both important and commendable that the methodological limitations are laid bare and a plan for further refinement is in place.
One area of the work that warrants special mention is ‘stock assessment and evaluation’. At its core, TIVA recognises value is created, directly and indirectly, through combining the services generated from six types of capital stock. Adopting this approach ensures a more complete view of how value creation (and the associated
risks to and opportunities for) is established. As part of TIVA, Yorkshire Water has undertaken a human and intellectual capital stock assessment which has established the wider combined economic value of their employees and know-how (in terms of the future services they will provide) and further determined how this value has been enhanced and or eroded over the operating period. It is only by maintaining and preferably improving capital stock condition and associated economic value that an organisation can establish a resilience to economic, social and natural shocks and develop a sustainable growth trajectory.
It has been Route2’s privilege to support Yorkshire Water on their TIVA journey. We look forward to reviewing the feedback this innovative work receives and hope to help introduce improvements in the coming months and years.
Dr Daniel Lopez Dias, Route2
WHAT OTHERS THINK ABOUT OUR NEW APPROACH
The Yorkshire Forum for Water Customers

OUR CONTRIBUTION TO YORKSHIRE
FINDINGS REPORT
FINANCIAL CAPITAL
P 21

WHAT IS FINANCIAL CAPITAL?Financial capital is the common way in which society measures something’s ‘value’. It includes those things with cash value, for example money, stocks and shares or the value on a company’s balance sheet. However, financial capital can not exist without the other five capitals. It is a human-made way of representing parts of the value inherent in the other five capitals.
A widely used measure of an organisations total financial contribution is called Gross Value Added (GVA). GVA examines the salaries paid to staff, the profit made for shareholders and the taxes paid to Government to support society. To understand our total impact and value, we started by looking at our GVA.
WHY IS FINANCIAL CAPITAL IMPORTANT TO YORKSHIRE AND YORKSHIRE WATER?We provide a significant financial contribution to Yorkshire and the wider country. There are a range of benefits produced through the profit, salaries and taxes we pay and enable others to pay. These contribute to public services, support jobs in many other organisations, fund pension schemes and enable investment elsewhere.
Our water and wastewater infrastructure and services underpin Yorkshire’s economy by enabling all other organisations in the region to carry out their activities and employ healthy staff.
Strong financial foundations are critical to our ability to reliably maintain the region’s public water and wastewater infrastructure and our essential services to customers and the environment.
WHAT DOES OUR ASSESSMENT TELL US?We know that financial transparency and legitimacy are essential to a private company delivering essential public services. Whilst we have delivered significant financial efficiency to help keep water bills low for customers at the same time as securing large-scale private investment to modernise infrastructure and improve services, some of our customers and stakeholders question our complex financial structures and levels of profit. We are responding by simplifying our financial arrangements and being even more transparent.
As a large and permanent organisation in Yorkshire, known as an ‘anchor’ organisation, we play an essential role in the region’s economy and social cohesion. As we examine the other capitals through the rest of this document, we have found a wide range of opportunities to further enhance the value we can create for Yorkshire.
THE RESULTS OF OUR IMPACT AND VALUE ASSESSMENT FOR FINANCIAL CAPITAL
DIRECT
DIRECT
DIRECT
£77.7 MILLION
£106.5 MILLION
£122.4 MILLION
£12.1 MILLION
£5.8 MILLION(NOT INCLUDING PENSIONS,
AS UNABLE TO ASSESS)
NOT YET KNOWN
£13.3 MILLION
NOT YET KNOWN
NOT YET KNOWN
TAXES AND LICENSE PAYMENTS
SALARIES, EMPLOYER NATIONAL INSURANCE & PENSION CONTRIBUTIONS
PROFITS (‘OPERATING SURPLUS’)
INDIRECT
INDIRECT
INDIRECT
ENABLED
ENABLED
ENABLED
P 22 P 23
INDIRECT IMPACTSActivities commissioned by us and carried out within our supply chain.
DIRECT IMPACTSActivities carried out by us.
ENABLED IMPACTSActivities carried out by our customers using our services, or by our tenants occupying our land.

WHAT IS MANUFACTURED CAPITAL?Manufactured capital is the human-made physical ‘objects’ owned or controlled by an organisation. This includes physical infrastructure such as buildings and pipes, and goods such as chemicals, tools and vehicles.
WHY IS MANUFACTURED CAPITAL IMPORTANT TO YORKSHIRE AND YORKSHIRE WATER?We are custodians of Yorkshire’s vast and essential water and wastewater infrastructure. We maintain, use and enhance a network of pipes, pumps, treatment works and other infrastructure to provide our high quality and resilient water and wastewater services for customers. It is important that we maintain this infrastructure efficiently and effectively so that the people and businesses of Yorkshire can rely on our services for today and long into the future.
With a replacement value of over £51 billion, the scale of our infrastructure is massive. In this assessment we have examined the annual change in the total value of our infrastructure as an indicator of our effectiveness in maintaining and enhancing it.
Whilst our infrastructure is by far the biggest part of our manufactured capital, another important aspect is our fast-growing capacity to generate energy. We examine this in the case study on page 26.
WHAT DOES OUR ASSESSMENT TELL US?The value of our built assets and infrastructure continues to grow. Whilst part of this growth is to do with inflation, the value is also an indicator of our continued asset maintenance and enhancement. For example, in 2014/15 we renovated, relined or built new, some 96km of water mains, and renovated or replaced 29km of sewers. Our assets and services also support others in growing their manufactured capital.
MANUFACTURED CAPITALDIRECT
£138.2 MILLION £154.2 MILLION £81.4 MILLION
INDIRECT ENABLED
P 24 P 25
THE RESULTS OF OUR IMPACT AND VALUE ASSESSMENT FOR MANUFACTURED CAPITAL
INDIRECT IMPACTSActivities commissioned by us and carried out within our supply chain.
DIRECT IMPACTSActivities carried out by us.
ENABLED IMPACTSActivities carried out by our customers using our services, or by our tenants occupying our land.
CHANGE IN VALUE OF FIXED ASSETS

CASE STUDY
NAT
URAL CAPITAL
GENERATING CLEAN ENERGYAs part of our assessment of our manufactured capital, we have examined our production of increasingly large amounts of low-carbon, renewable electricity and heat. We generate energy by digesting the sewage we collect, and also from wind and hydro turbines and from solar panels. In 2014/15 the energy we generated was worth £14.3 million. Across our estate, we generated over 67 GWh of renewable electricity, enough to power over 21,000 homes.
Our energy generation is valuable for several reasons:
• It is cost efficient and helps to keep water bills low for customers by reducing our need to buy increasingly expensive electricity and gas.
• We are increasing our resilience by having multiple sources of electricity and being less reliant on the national grid.
• We are helping the national grid be more resilient by reducing our demand on it, and by supplying the grid with locally generated electricity when needed.
• It is reducing our carbon footprint, which we discuss in the Natural Capital chapter of this report.
POO POWER!We generate the majority of our energy by digesting the sewage (poo!) we collect and treat. By investing in new energy generation equipment, we have made Esholt treatment works in Bradford almost entirely self-sufficient for its large energy needs. At this site alone, our energy generation is reducing our carbon footprint by 9,000 tonnes of greenhouse gases each year and saving £1.3 million a year in energy purchasing costs – helping us to keep customers’ bills down.
ONGOING INVESTMENTWe have grown our energy generation over recent years, and there is still potential to go much further by using our land, waste and water assets. The capitals approach can help make the case for investment by quantifying the wide range of substantial benefits to be had.
We are nearing completion of a £72 million investment at Knostrop wastewater treatment works in Leeds. This investment is providing a state-of-the-art sewage sludge (poo!) treatment facility that will generate renewable energy. Along with an existing wind turbine on the site, we’ll be able to generate 55% of the sites’ substantial energy needs. That’s the equivalent of providing renewable power to 8,000 homes.
55% OF ENERGY NEEDS GENERATED ON SITE
CO2 REDUCED BY 9,000 TONNES EACH YEAR £1.3 MILLION SAVED EACH YEAR
£72 MILLION INVESTED
ESHOLT WASTEWATER TREATMENT WORKS KNOSTROP WASTEWATER TREATMENT WORKS
P 27

£50m
-£50m
-£100m
-£150m
£100m
£150m
Bath
ing
wat
er im
prov
emen
ts
Dire
ct va
lue
Indi
rect
valu
eEn
able
d va
lue
Key
£
Wat
er sa
ving
supp
ort
Atm
osph
eric
pollu
tion
CO2 a
bsor
bed
on o
ur la
nd
Was
te
Pollu
tant
s abs
orbe
d on
our
land
Recre
atio
n an
d am
enity
Leak
age
CO2e
emiss
ions
£50m
-£50m
-£100m
-£150m
£100m
£150m
Bath
ing
wat
er im
prov
emen
ts
Dire
ct va
lue
Indi
rect
valu
eEn
able
d va
lue
Key
£
Wat
er sa
ving
supp
ort
Atm
osph
eric
pollu
tion
CO2 a
bsor
bed
on o
ur la
nd
Was
te
Pollu
tant
s abs
orbe
d on
our
land
Recre
atio
n an
d am
enity
Leak
age
CO2e
emiss
ions
THE RESULTS OF OUR IMPACT AND VALUE ASSESSMENT FOR NATURAL CAPITAL
WHAT IS NATURAL CAPITAL?Natural capital is the stock of resources in the natural environment that people manage, use and depend on. The term ‘ecosystem services’ is used to describe the wide variety of values which we all derive from the natural world. Ecosystem services can be considered in four themes:
Provisioning services such as water, food and wood
Regulating services such as carbon absorption to regulate the climate
Supporting services such as soil formation and nutrient cycling
Cultural services such as recreation, tourism and spiritual value
WHY IS NATURAL CAPITAL IMPORTANT TO YORKSHIRE AND YORKSHIRE WATER?Yorkshire Water is on the front line of managing natural capital. Water services in Yorkshire both fundamentally rely on natural capital and also have substantial impacts upon it, both good and bad.
Our core duties involve taking large volumes of water from the environment to supply customers, and recycling treated wastewater safely back to the environment. The transport and treatment of water and wastewater relies on large amounts of energy and chemicals produced from different forms of natural capital, and results in a large carbon footprint. Our pipes, pumps and other equipment are all made from materials taken from the environment.
Yorkshire Water are one of the biggest landowners in Yorkshire, with a total land ownership of approximately 28,000 hectares. With our farm tenants, we monitor and manage our land, and work with other land owners, to ensure that enough clean water is always available for us to supply our customers. Understanding how natural and human landscapes, habitats and processes interact, and how we can preserve, maintain and enhance them for future generations, is vital for the sustainability and resilience of our business.
We have examined a wide range of attributes in the natural capital part of our assessment, making it one of the largest parts of our TIVA. The opposite page shows the different measures we have examined to date, with more detail provided through the rest of this chapter.
P 28 P 29
INDIRECT IMPACTSActivities commissioned by us and carried out within our supply chain.
DIRECT IMPACTSActivities carried out by us.
ENABLED IMPACTSActivities carried out by our customers using our services, or by our tenants occupying our land.

SewerEscape
Recycle NutrientsTo The Land
Customer Service Centre
Reservoirs Water Abstractions Boreholes
Water Treatment Works
BusinessesLeaks
Wastewater Treatment Works
Surface Water
Sludge Recycling & Energy Centres
Emergency Relief Overflows
ReturningTreated Water
Homes
LAND MANAGEMENT WATER COLLECTION
WATER TREATMENT
WATER SUPPLY CUSTOMER SERVICE
WASTEWATER COLLECTION
WASTEWATER TREATMENT & RECYCLING
133 9 45
48
2m 140k
611
ha
Immediate Priorities
Long-term Priorities
! !!
THE YORKSHIRE WATER CYCLEAs a water company, water is the most important aspect of natural capital to us. There have been some great advances over recent years, for example better quality and reliability of the water we provide at the tap, as well as cleaner bathing waters along the coast and healthier rivers inland. It is easy to see lots of opportunities to do even better when we look at the way we use water in our operations and as a society. We are working with our customers to carefully manage Yorkshire’s water resources so that we can continue to supply the region with the water it needs – now and in the future.
The quality of water we take from the environment is
getting worse in some areas because of poor
land management
We collect about 1.3 billion litres of
water each day - we want to reduce this
to better protect the environment
We use a lot of energy to treat and
transport water and wastewater - We’re reducing our large carbon footprint
Reducing flood risk is a national priority and we’re playing our part
by investing in the drainage network and
‘slowing the flow’
We need to use more energy and chemicals
to treat poor water quality to the high
standards we supply to customers at their taps, increasing financial and
environmental costs
A resilient mix of water sources in Yorkshire - around 44% from
reservoirs, 35% from rivers and 21% from
boreholes
We’re looking at how we can help industrial
customers use a lower standard of
water where drinking water isn’t needed,
for example in cooling processes
Bathing water quality at
our beaches 10 x excellent
8 x good 1 x sufficient
1 x poor
Human waste is full of nutrients and energy
which can be recycled - We create enough
power to supply 21,000 homes, with more
coming soon
Around a fifth of water is lost through leaks - two thirds is lost from
our network and one third from
customers pipes
Whilst we supply homes with high quality drinking
water, only about 4% is used for drinking - about 30% is used to
flush the toilet
We’ve greatly reduced the pollution from
our sewer network, but there’s more to do with over 170 pollution
incidents in 2014
We collect and treat around 1bn litres of
wastewater each day, helping Yorkshire’s
rivers to be healthier than they’ve been
for decadesP 30
Note: Statistics in the droplets are
based on our impact assessment
of data in 2014/15 and statistics
in the dark blue circles are latest
figures about our assets, correct
at 31st March 2018.
Too many of our customers struggle
to pay their bills, we’re currently providing £6.8m of financial support to those
most in need.
Immediate Priorities
Long-term Priorities
! !!
P 31

WATER USEWe know water is an incredibly precious ‘life giving’ resource that everyone needs to use wisely to ensure everyone always has enough whilst also keeping a healthy natural environment. This is increasingly important because the population is growing and the climate is changing.
WATER SAVED THROUGH BEHAVIOUR CHANGEWe help our customers be more water efficient by offering a wide range of support services and advice. For example, in 2014/15 we:
• Invested £142,500 on education and devices for saving water.
• Gave away 26,439 free water saving packs, including flushsavers, tap aerators, shower regulators and shower timers.
• Sold 1,085 discounted water butts to collect rain water for use in the garden.
We estimated the amount of water we helped others save by using national guidelines about the typical amounts thought to be saved by different household devices. We have recognised that these water savings can be overestimated. Since 2015 we have therefore been measuring our water saving performance in terms of Per Capita Consumption (PCC). Between financial years 2015/16 and 2016/17, we helped customers reduce PCC from an average of 141.7 per person per day to 137.4 per person per day.1.3
BILLION LITRES
1.8 BILLION LITRES
373 BILLION LITRES
189 BILLION LITRES
DIRECT
INDIRECT
ENABLED
ENABLED
WATER CONSUMPTIONWe collect, treat and distribute huge volumes of water, supplying about 1.3 billion litres of clean safe water to our customers every day. We monitor how much water we use ourselves (our ‘direct’ impact) and how much our customers use (our ‘enabled’ impact). We have also estimated how much water is used as a result of the money we spend with our suppliers and contractors (our ‘indirect’ impact). The figures below show estimated annual water consumption for 2014/15.
REDUCING LEAKAGE It is our never-ending job to maintain and enhance Yorkshire’s public water network. We manage around 83,000km of pipes, enough to wrap around the world twice! Despite our extensive and ongoing investments, and our success in reducing leakage by around half since privatisation in 1989, too much water is still lost through leaky pipes and we have assessed the costs and benefits of doing more.
We have recently committed to reducing leakage by a further 40% by 2025. To do this we are recruiting around 50 new leakage inspectors and using new leakage detection technology so that we can find leaks more effectively and then fix them more quickly, reducing the average detection time from 3 days to 3 hours. We’re testing the use of drone technology to identify leaks from the air, and we’ve entered into a partnership to trial satellite technology to help us identify leaks in Halifax and Keighley.
Reducing leakage is not only great news for jobs in Yorkshire, but it will also improve long term security of supply for everyone. It also means less water has to be taken from the environment, and less energy needs to be used in the treatment and distribution process.
DIRECT ENABLEDINDIRECT
76.6 BILLION LITRES
28.7 BILLION LITRES
NOT YET KNOWN
LEAKS FROM TREATMENT WORKS AND THE PUBLIC NETWORK
OUR SUPPLY CHAIN’S LOSS OF WATER
LEAKS FROM CUSTOMERS’ PIPES
P 32 P 33

RETURNING WATER TO THE ENVIRONMENTWe collect and treat around a billion litres of wastewater every day removing pollution and safely recycling it back to the environment. Through our ongoing investment in the region’s wastewater treatment works and network, we have delivered a step change in the quality of Yorkshire’s rivers and coasts such that they are now widely considered to be the healthiest they’ve been since the Industrial Revolution. There are still many pressures facing Yorkshire’s water environment and we want to go further.
The Environment Agency sets minimum standards on what we and others return to the environment to ensure nature is protected, and they prosecute when there has been pollution. In our first total impact assessment we have examined our levels of compliance with the Agency’s standards and our numbers of pollution incidents. These provide an indication of our impact on Yorkshire’s rivers and coasts. In our future assessments we will look at how we might go further in quantifying and valuing our impact.
COMPLIANCE WITH DISCHARGE PERMIT REQUIREMENTSWe operate approximately 600 wastewater treatment works across Yorkshire to safely recycle the waste that people and businesses flush to the sewers, and also surface water that runs off roads and other surfaces to the public sewers. This data is tracked by calendar year so we have looked at 2014 data in our first impact assessment. Two of our 600 treatment works failed to consistently achieve the standards permitted by the Environment Agency. This equates to a compliance rate of 99.32%. This suggests very low levels of environmental harm to rivers and coasts from our treatment works, although we are never complacent.
POLLUTION INCIDENTSThe total number of pollution incidents from our sewer network shows a reducing trend over recent years, albeit fluctuating each year because sewer performance is greatly influenced by the weather. There were four serious pollution incidents from our network in 2014, and 170 lesser but still damaging incidents. We are working to reduce pollution from the sewer network, and we’ve made a commitment to reduce the number of pollution incidents by 40% by 2020.
IMPROVING YORKSHIRE’S RIVERS AND COASTYorkshire Water is continually collaborating and investing to protect and improve Yorkshire’s rivers and coasts, developing an environmental investment programme every five years with our regulators and stakeholders. Between 2015 and 2020 we have committed to improving 440km of river in Yorkshire.
At the coast, in 2014/15, we completed our £110 million investment programme to deliver marked improvements in Yorkshire’s bathing waters. Many factors contribute to bathing water quality, so we ensure a multi-agency approach by working with the Environment Agency, local councils and other key stakeholders through the Yorkshire Bathing Water Partnership.
Yorkshire’s bathing beaches in 2015:10 Excellent 8 Good1 Sufficient 1 Poor
RESILIENCE TO FLOODING - ‘SLOWING THE FLOW’ IN THE CALDER VALLEYToo many communities in Yorkshire, and across the UK, have experienced the damage caused by extreme storms in recent years. We play a critical role in managing flood risk by providing a public drainage network and collaborating with other flood management agencies to support a joined-up approach to both short-term incidents and long-term plans.
Our investments in Yorkshire’s drainage network have greatly reduced the numbers of properties at risk from sewer flooding. We are committed to going even further but it is becoming financially and environmentally unaffordable to only build ever-larger sewers to manage this problem. Whilst substantial investment in the sewer network will always be needed, especially with increasing pressure from the growing population and changing climate, we’re also using new innovative approaches to keep rain water out of the sewers and in the upstream catchments, such as our natural flood management programme in the Calder Valley. We have recently committed to reducing sewer escapes by 40% by 2020, using 8,000 smart devices in our sewers to detect escapes faster.
NATURAL FLOOD MANAGEMENT IN THE CALDER VALLEYCommunities in places like Hebden Bridge and Todmorden live in the steep-sided Calder Valley which has a long history of flooding, and has experienced several flash floods in recent years. We are part of a multi-agency response that includes a pioneering Natural Flood Management plan. Landscape improvements will see the restoration of 43 hectares of blanket bog to keep the moorland like a sponge, and 60 hectares of environmental improvements such as ‘leaky dams’ and wetlands to slow the flow of water.
In partnership with local residents, Treesponsibility, and the White Rose Forest, we are well on our way to planting 200,000 trees as one of a series of measures planned to help slow the flow of water during periods of heavy rainfall. These 200,000 trees are the first of our commitment to plant 1 million trees in Yorkshire over the next ten years.
Alongside this landscape project, over the winter of 2017/18 we have been trialling the reduction of water levels to allow for flood storage in some of our reservoirs above Hebden Bridge. To inform whether a longer-term change to reservoir operation would be appropriate, we have been working with the Environment Agency and Defra to examine if this type of approach is safe, effective and feasible, to understand any potential implications for the environment, and to ensure water supplies are not negatively affected.
CASE STUDY
SLOWING THE FLOW
P 35

BIODIVERSITYBiodiversity means the variety of life. It is an important area for us to consider in our impact assessment because we are both a large land owner and our core operations involve substantial direct interaction with the natural environment when we abstract and recycle water. But biodiversity is also very hard to measure as it is so varied and complex. We are now working towards measuring and monitoring biodiversity across our entire land holdings. Whilst we do not yet have a consistent and holistic way to measure our impact on biodiversity, we are doing lots to protect and enhance it and we have indicators that give valuable insight about our performance, two of which we cover here.
SITES OF SPECIAL SCIENTIFIC INTEREST (SSSI)We own 11,400 hectares of land which is formally designated as Sites of Special Scientific Interest (SSSI) for its ecological importance. Natural England monitors the health status of all SSSIs in the country, from ‘Favourable’ to ‘Destroyed or partially destroyed’. In 2014/15, over 98% of our SSSIs were classed as ‘Favourable’ or ‘Recovering’. We want to ensure our SSSIs are protected for the long term, and we are promoting a number of projects to achieve this. One example of a new approach we are taking is described opposite when we look at our Beyond Nature programme.
TACKLING INVASIVE SPECIESInvasive Non-Native Species (INNS) are causing damage around the world. For us, for example, invasive species can damage our infrastructure and destabilise river banks to exacerbate flooding. We are working to control the spread of INNS using a three tier hierarchy:
PREVENTION – Examples of our action include the surveying of 200 of our sites to identify key pathways by which species can spread and implement interventions. We are also one of eight water companies funding a national DEFRA-led campaign to improve aquatic biosecurity called Check, Clean, Dry.
ERADICATION – Examples of our action include actively supporting, including funding, the Yorkshire Invasive Species Forum which coordinates management programmes across many of Yorkshire’s rivers: over 150km in 2015. We have also funded programmes on the river Esk where there is a realistic chance of invasive species eradication, delivered via partnership with the North York Moors National Park.
MANAGEMENT – Examples of our action include funding biocontrol trials to manage INNS at Gouthwaite SSSI and testing alternative control measures with the University of Leeds. We are also trialling the use of woodland planting to reduce the presence of invasive Himalayan Balsam at our treatment works in Ilkley.
“BEYOND NATURE” OUR NEW APPROACH TO FARM TENANCIES
In 2015, when we first started thinking about the capitals approach, we had an opportunity to consider what this could mean for a key part of our land strategy, our tenanted farms. When one of our multi-generational tenancies at a 900 acre site called Humberstone Bank Farm came to an end, we took the opportunity to consider options for the site using a simple sustainability assessment. This showed that managing the site for nature would deliver the biggest benefits, and we developed a new approach called Beyond Nature.
Beyond Nature is about working in partnership to demonstrate and deliver sustainable farming that generates food and a stable farm business whilst also protecting and enhancing nature, water quality and locking away carbon in the land. A local farmer took over the tenancy at Humberstone and is working with us and other stakeholders to try new approaches. Much of the farm is a blanket bog Site of Special Scientific Interest (SSSI) so it is a priority to protect and restore this part of the farm to store carbon and slow rainwater runoff to act as a natural flood barrier. A wide range of birdlife lives on the land that must also be protected.
More recently, we have extended our Beyond Nature programme to more of our farms, and we’re working to go even further. Each scheme
has a bespoke partnership management plan that reflects local priorities. As part of a new partnership with the National Trust, we’ve started discussions about how we each approach sustainable farm tenancies, how we might learn from each other and influence national best practice.
To inform our wider land management decisions, we have enhanced the simple sustainability assessment that we started with into a repeatable multi-capital land options appraisal tool that can help us consider the best approach for each of our sites, with the support of quantified data on a range of positive and negative impacts relevant to land. We applied and developed this tool at our Little Don site, discussed on page 41.
CASE STUDY
Invasive species: Australian Swamp Stonecrop
Restoration on the River Washburn
Invasive species: Giant Hogweed and Himalayan Balsam
P 36

• Our operations: collecting, treating and distributing water
• The electricity we buy from the National Grid
• Business travel
• CO2 ‘embedded’ in
the materials we use to build infrastructure
• Emissions generated through activities we pay for in the supply chain
• Emissions generated through the use of our services
DIRECT ENABLEDINDIRECT
OUR CARBON FOOTPRINTBurning fuel, using electricity and other activities emit greenhouse gases, such as carbon dioxide which cause climate change. Public water services are carbon intensive, including:
• The energy and chemicals used to treat and transport water and Wastewater.
• The concrete, metal and other materials in our pipes, pumps and treatment works.
• The energy used by customers to heat water for washing and heating.
The substantial and necessary improvements we’ve made over recent decades to the aquatic environment have come at a cost to the atmospheric environment in the form of a large carbon footprint. We’re working to cut our carbon footprint down to size, for example investments in energy efficiency and renewable energy have helped us reduce our operational emissions by about a third in recent years, down to lowest recorded levels in 2016/17. We examine our energy generation on page 26.
We wanted to look beyond our operational emissions in our TIVA by exploring the emissions in our supply chain and on customers use of our services. For this reason, the figures reported here are different to those we report annually on our operational emissions. Our assessment shows the scale of emissions associated with our services, and despite our success in reducing operational emissions, we still have a long way to go. We’re working hard to reduce the emissions embedded in the assets we build, with a commitment to halve them. We’re also looking at how we can lock carbon away in our land by planting more trees and protecting peatlands, we look at this in more detail on the next page.
tCO2e stands for Tonnes of Carbon Dioxide Equivalent.
LOCKING UP POLLUTANTS IN OUR LANDThe vegetation across our land plays an important role in protecting human health by absorbing pollutants and reducing climate change by sequestering carbon dioxide, meaning to lock carbon out of harms way.
Much of our land is carbon-intensive peat moorland which can absorb carbon if suitably managed or release carbon if poorly managed and allowed to erode. As well as the carbon benefits, the protection and restoration of peatlands is an important part of our work to keep Yorkshire’s sources of water clean. With both these benefits in mind, we have been investing in the land we own and working in partnership with other land owners for well over a decade to keep existing stores of carbon locked away and to further increase the amount of carbon sequestered each year.
We also own large areas of woodland, for example around our reservoirs, which are also stores of carbon. Woodland delivers multiple benefits other than carbon, helping to ‘slow the flow’, protect biodiversity and create recreation opportunities. We have been looking at areas we can increase tree planting to deliver more of these benefits. On our land in the Calder Valley for example, we are working with the White Rose Forest partnership to deliver the first stage of our work to plant one million trees in Yorkshire over the next ten years. We examine this case study in more detail on page 35.
Plants also absorb other air pollution which is harmful to human health, including particulate matter (PM), sulphur dioxide and nitrogen oxides. Using information on weather conditions, number of days plants were ‘in leaf’ and the background pollution levels in Yorkshire in 2014/15, we have
estimated the levels of PM pollution sequestered on our land. In 2014/15 we had a net positive impact, with more of these pollutants sequestered on our land (338 tonnes) than we emitted through our operations (49 tonnes).
90,000 tCO2e 440,000 tCO2e 100,000 tCO2e
DIRECT
50,000 TONNES absorbed in our land:
equivalent to over half of our direct emissions
NOT YET KNOWN NOT YET KNOWN
INDIRECT ENABLED
CARBON DIOXIDE ABSORBED IN 2014/15
LOCKING AWAY OTHER POLLUTANTS
P 38

£10
10
1
£10
10
1
£10
10
1
RECREATION ON OUR LAND AND WATERSAs one of Yorkshire’s biggest landowners, we take care of large parts of stunning countryside. Much of this land is open for our customers to explore and enjoy.
Recreation opportunities on our land include anything from a gentle stroll on a well maintained path around one our stunning reservoirs, to a more adventurous trek off the beaten track across beautiful open countryside. Fishing, cycling, mountain biking, canoeing, sailing and horse riding are also available on parts of our land.
In April 2015, a survey recorded 98% visitor satisfaction, with 88% of visitors giving the top rating of ‘very satisfied’ with their visit. Using maps of our land and data from the UK National Ecosystem Assessment and academic research, we have estimated the annual value of our land for recreation and enjoyment as £8.3 million. This value includes, for example, the health and wellbeing benefits received by visitors.
ENSURING EVERYONE CAN ENJOY OUR LANDWe are working to make our land even more appealing to everyone, tackling barriers that restrict access and increasing the range of opportunity in all areas of recreation for all sectors of society. In 2017, we gained the ‘Good Access Scheme’ award from the charity Open Country, in recognition of the work we have done to improve access, including removal of barriers like steps and stiles, and the realignment of paths to avoid steep slopes. We have also partnered with Experience Community, a not-for-profit community group that has helped in identifying improvements, and arranges regular reservoir rambles for groups of wheelchair and Mountain Trike users.
DIRECT
ENABLED
98% VISITOR SATISFACTIONOur visitors’ response to facilities and access on our land.
£8.3 MILLIONRecreation and amenity value people (and society) derive from our land.
ASSESSING FUTURE OPTIONS FOR LITTLE DON RESERVOIRS: USING AN INNOVATIVE CAPITALS VALUATION TOOL
AIMSYorkshire Water owns 28,000 hectares of land, much of which is open to the public. Our goals are to open up our land to everyone, get more people outdoors, protect the environment, and inspire younger generations to enjoy nature and be active outdoors. To help achieve these goals, we are putting the ‘capitals’ at the heart of all our decision making. This capitals approach will enable us to quantify the environmental and social impacts of our actions and to make better decisions for the benefit of our customers.
TOOLAECOM worked with us to develop a tool that allows us to compare the impacts of various land management decisions across the capitals. The tool was developed by a team of economists, ecologists, and social specialists, and draws on the latest scientific evidence to provide a cutting edge approach to measuring and valuing social and environmental impacts.
SITEWe piloted the tool on one of our sites in the ‘Little Don’ area which has a range of existing recreational uses - from water sports to nature watching - and we are using the tool to guide the development of the site into a recreational hub for the whole area. The overall aim of the Little Don scheme is to open up more land for recreation, create better quality recreational opportunities, increase diversity and inclusion, and improve the health and wellbeing of our customers and visitors to our land.
RESULTS The pilot exercise looked at five scenarios for investing in the Little Don site:• Inclusive environment: encouraging all groups to interact
with the environment• Active recreation: planting trees and encouraging sports
such as mountain biking• Active biodiversity: protecting and restoring nature• Sustainable farming: working with farmers to better balance
the needs of the environment• Sustainable forestry: focusing on tree and hedgerow
planting across the majority of the site
Compared against a ‘do-nothing’ scenario, over the next 40 years these options are estimated to generate net benefits of...
IMPLICATIONS The results suggest that encouraging active sports may have the greatest potential benefits, despite having the highest costs. The results also demonstrate that there are pros and cons to each of the options, and that there can be important trade-offs between goals of encouraging visitor diversity, protecting biodiversity, and creating employment opportunities. We have started a discussion with stakeholders in the Little Don area to decide on an approach to managing the site that meets everyone’s goals. Beyond the Little Don site, the capitals tool will be used to help meet our goals across all of our land.
VALUE INDICATORS (£ MILLION) OTHER INDICATORSINCLUSIVE ENVIRONMENT
ACTIVE RECREATION
ACTIVE BIODIVERSITY
SUSTAINABLE FARMING
SUSTAINABLE FORESTRY
£6.6 £4.9 £1.9 £0.8 £2.5
£0.9 £3.8 £0.7 £0.8 £0 1.4 4.4 1.1 1.3 0.1
3 10 1 1 0£4.0 £15.5 £2.0 £2.0 £0.1
-£0.1 -£3.0 -£0.1 £0 -£0.1
NATURAL CAPITAL
SOCIAL CAPITAL
CARBON REMOVED FROM THE ATMOSPHERE tCO2e
QUALITY ADJUSTED LIFE YEARS GENERATED FROM EXERCISE ON SITE (YEARS)
NUMBER OF JOBS CREATEDHUMAN CAPITAL
FINANCIAL / MANUFACTURED CAPITAL
INCLUSIVE ENVIRONMENT
ACTIVE RECREATION
ACTIVE BIODIVERSITY
SUSTAINABLE FARMING
SUSTAINABLE FORESTRY
INCLUSIVE ENVIRONMENT
ACTIVE RECREATION
ACTIVE BIODIVERSITY
SUSTAINABLE FARMING
SUSTAINABLE FORESTRY
NET PRESENT VALUES RELATIVE TO BASELINE (£ MILLION)
£11.5 £21.3 £7.1 £6.2 £2.6
12,000 24,000 10,000 5,000 27,000
P 40
CASE STUDYCASE STUDY

300,000
LANDFILL RECYCLED/TO ENERGY
200,000
100,000
0
350,000
TONNES
250,000
150,000
50,000
DIRECT INDIRECT ENABLED
8%
92%
88%
95%
12%
5%
WASTES AND RESOURCESWe generate and manage a variety of wastes through our operations. Where some see ‘waste’, we see the potential for new products. We have been working to minimise our use of landfill by finding new value through recycling and reuse. In 2014/15 we recorded the following wastes and underutilised resources:
Sludge by-product
from our water
treatment processes,
plus office wastes
and site skips.
Waste generated
as a consequence
of the activities of
our supply chain in
producing the goods
and services that we
purchase, including
that generated by
contractors on our
construction sites.
Sewage sludge
(human waste)
collected from
customers and left
at the end of the
wastewater treatment
process - increasingly
used for renewable
energy generation.
92% of our direct waste was either recycled into new materials, or used to generate energy in 2014/15. We have been consistently achieving our commitment to divert at least 95% of waste from landfill.
A large proportion of the waste generated at our wastewater treatment works is used to generate electricity: see page 26 for a case study on this ‘poo power’!
HUMAN CAPITAL
P 43P 42

EMPL
OYE
E EN
GAGE
MEN
TPE
RFO
RMAN
CE R
EVIE
WS
APPR
ENTI
CESH
IPS
HEA
LTH
BEN
EFIT
S
INJU
RIES
COM
MU
TIN
GPR
OTR
ACTE
D PA
ID O
VERT
IME
(UN
)EQ
UAL
OPP
ORT
UN
ITY
WAG
E IN
FLAT
ION
STAF
F TU
RNO
VER
SICK
NES
S AB
SEN
CE
-£2m
-£4m
-£6m
-£8m£8m
£6m
£4m
£2m
+ -
£ £
SUCC
ESSI
ON
PRO
GRAM
MES
EMPL
OYE
E VO
LUN
TEER
ING
WHAT IS HUMAN CAPITAL?Human capital relates to individual people: their wellbeing, and the value they bring to society. For organisations, human capital encompasses the workforce: quantifying the value of its people’s health, productivity and experience, which in many ways is the organisation. Human capital is not ‘owned’ by an organisation, but essentially ‘leased’ in exchange for salaries and other employment benefits.
Human Capital is closely related to Intellectual Capital, which we examine in the next section.
Whilst it can be useful to monetise the value of human capital to help inform decision making and the business case for investment, this is not about seeing people as a commodity. Quite the opposite, by understanding the value of human capital and the things that affect this value, more effective action can be taken to protect and grow people.
WHY IS HUMAN CAPITAL IMPORTANT TO YORKSHIRE AND YORKSHIRE WATER?Our people are the heart of Yorkshire Water: without them we would not be able to function. Ensuring that we have a safe, healthy and skilled workforce is essential for us to continue providing our services. Additionally, as a large employer in Yorkshire, our approach to human capital has a role to play in social cohesion and we are committed to increasing our diversity to more closely reflect the society we serve.
Assessing our human capital helps us to understand and manage risks and opportunities presented by factors such as an ageing workforce, sickness rates and diversity and inclusion programmes. We have of course been considering and managing these matters for many years, long before the concept of human capital. However, through our work in this area we have now been able to value issues and interventions to aid our decision making.
We worked with consultants Route2 to complete a human and intellectual capital assessment as part of our TIVA. Having quantified a broad range of relevant metrics, the study concluded that our human and intellectual capital was worth just over £1 billion in 2014/15. Here in this publication, we examine some priority areas and case study examples, with the graph opposite showing the changes in different aspects of our human capital in 2014/15.
For this study, we were only able to consider direct impacts for human capital: those for Yorkshire Water only, rather than its contractors and suppliers. We will examine how we might widen our scope to include these in future versions of TIVA.
THE RESULTS OF OUR IMPACT AND VALUE ASSESSMENT FOR HUMAN CAPITAL
P 45P 44
INDIRECT IMPACTSActivities commissioned by us and carried out within our supply chain.
DIRECT IMPACTSActivities carried out by us.
ENABLED IMPACTSActivities carried out by our customers using our services, or by our tenants occupying our land.

Opportunity cost of lack of diversity
-£1.1 MILLIONDIRECT
CASE STUDY
OCCUPATIONAL HEALTH AND SAFETYOur first priority is always people’s safety and wellbeing. The spread and complexity of our operations presents a range of challenges which we manage through our occupational health and safety improvement plan. In recent years, we have reviewed and accelerated our plans following a fatal accident in July 2015, and an increase in injury rates. As a result we have improved our occupational health and safety performance. The quantification provided by our TIVA only serves to reinforce the need for, and value of, our ongoing commitment.
LIFE-SAVING RULESWe have undertaken an extensive programme of engagement with our people and partners to reaffirm the imperative for safety first. In order to further mature our safety culture we have introduced ten life-saving rules (shown in the icons below) and a range of associated training and resources. Through 2017 we spent quality time on each of the new rules in turn, working with everyone in the business to consider what each one means to the individual.
MENTAL HEALTHWe have transformed our occupational health service to provide faster and more effective support when it is needed. We have become far more proactive in our work to support our staff in this area. For example, we now offer accredited mental health first aid training that is available for all staff and mandatory for people managers, and we have made a stress risk assessment mandatory for all colleagues and teams.
-£6.2 MILLION
DIVERSITY AND INCLUSIONYorkshire Water’s commitment to diversity and inclusion (D&I) is summarised in our objective “to be as diverse as the society we serve, inclusive of all”. Ensuring that our workplace is representative of the diversity of our region not only supports social cohesion, it also makes good business sense. Our study shows that despite significant action to be more diverse and inclusive, the lack of diversity in our workplace was valued at a cost of £1.1 million in 2014/15.
In 2014 we set up a D&I group, made up of colleagues from across the business. The group has managed programmes of work on four priority areas, with some highlights provided below.
THE NATIONAL EQUALITY STANDARD (NES)In 2016 we became the first water company to externally verify our compliance with the NES, a benchmark for best practice in equality, diversity and inclusion. The NES provides a framework for continuous improvement, against which we can assess our progress.
Taking female colleagues through our training and mentoring programmes, Pearls and GEMS. Approximately half of the participants have had a promotion or role change within Yorkshire Water since they started on the programme.
Holding a week of engagement events for school girls to support National Women in Engineering Day - with 12 schools in 2015 and 20 schools in 2016.
Working with the Royal Academy of Engineers to promote engineering opportunities in the sector to people from ethnic minorities.
Starting a Talent Programme in 2018, aiming for at least 50% representation from those with black and minority ethnicities.
In 2017 we held our first Black History Month celebrations at Yorkshire Water.
Since 2015 we have worked with The Lighthouse School, hosting work placements for young adults with autism. Five of the seven in the first cohort secured paid roles and two went on to further education.
We have become members of the Business Disability Forum who are supporting us in creating a more inclusive and accessible workplace.
We are working with other companies including Mott McDonald, to share experiences and best practice on representation in engineering.
Our LGBT* working group is planning a walking part in the forthcoming Leeds Pride event.
Our new guidelines on working with transgender colleagues are currently under review and will be published soon.
GEN
DER
ETHN
ICIT
YAB
ILIT
YLG
BT*
DIRECT Cost of sickness absence and injuries in 2014/15
P 47P 46

R&D
*
EMPL
OYE
E TR
AIN
ING
PUBL
IC IN
FORM
ATIO
N
KNO
WLE
DGE
DEC
AY
£4m
£5m
£3m
£2m
£1m
-£1m
£0
+
-
GROWING OUR HUMAN CAPITAL - APPRENTICESHIPS
We manage a range of evolving programmes to help keep our colleagues well trained and continuously developing, and also to ensure we can always recruit the people and skills we need now and into the future. With an ageing workforce and increasingly technical operations, we need to capture existing knowledge and expertise, and develop skills in science, technology, engineering and maths (STEM). Our apprenticeship programme is a critical and growing part of our business.
Apprenticeships are valuable for the individuals on the scheme, for the Company and also for wider society as their increased skills and earning power contribute to the economy. Our assessment found that for every £1 we invested in apprenticeships in 2014/15, there was a payback of £5.57 in the benefits created.
We have been running apprenticeships since 2010 and were recognised for our leading approach in 2015/16 as a Top 100 Apprentice Employer. We are growing our programme to meet business needs, and to utilise the government’s incentive in the Apprentice Levy.
David Stringer joined the company as a Customer Service and Networks apprentice in 2013.
“The highlights of the apprentice scheme so far would be studying for my Diploma in Water Engineering and working alongside the other apprentices. I really enjoy working for Yorkshire Water because it is full of opportunities to learn and there are endless possibilities. It is a company that I can see myself working with for a long time and I see this role as a career not just a job.”
David stayed with Yorkshire Water upon completing his apprenticeship, and is now a Risk and Solution Engineer in our Asset Planning department.
22 Apprentices. Value: £2.5 MILLION
DIRECT
INTELLECTUAL CAPITAL
WHAT IS INTELLECTUAL CAPITAL?Intellectual capital is knowledge and information: our people’s skills and know-how, the data and information we manage and generate as an organisation, and the new innovations that we use and share with society. Intellectual capital is closely related to human capital, since knowledge, skills and experience are often characteristics of, or ‘owned’ by individual people.
WHY IS INTELLECTUAL CAPITAL IMPORTANT TO YORKSHIRE AND YORKSHIRE WATER?We maintain, advance and deploy our knowledge through our people, systems and processes in order to deliver efficient and reliable water and wastewater services. Furthermore, we are continually improving our ways of working and finding quicker, cheaper or better approaches in order to save money and keep bills low for customers whilst delivering and improving the service we offer.
As we explained in the chapter on human capital, we have completed a human and intellectual capital assessment as part of our TIVA. In this publication we examine some priority areas and case study examples, with the graph opposite showing the change in value to some measures of intellectual capital in 2014/15.
For this study, we were only able to consider direct impacts for intellectual capital: those for Yorkshire Water only, rather than its contractors and suppliers. We will examine how we might widen our scope to include these in future versions of TIVA.
*Estimated private value of R&D spending to Yorkshire Water
THE RESULTS OF OUR IMPACT AND VALUE ASSESSMENT FOR INTELLECTUAL CAPITAL
P 49
CASE STUDY

INNOVATING TO GET MORE, WITH LESS - DEVELOPING THE CIRCULAR ECONOMY IN PRACTICE
As part of our ongoing focus on Research and Development we constantly innovate across all areas of our business so that we can continue to deliver high quality services to our customers at an affordable price and without harming the environment. This is increasingly important with the mix of pressures shaping our services, such as the changing climate and growing population.
Our innovation team collaborate with others to develop new ways of working in priority areas of risk or opportunity. In 2014/15 we had 17 partnerships with universities, and spent £5.7 million on research and development. One example of our approach is our vision to make Esholt wastewater treatment works a leading demonstration of the circular economy in practice. Esholt is one of our biggest sites, covering 120 hectares and serving 750,000 people in West Yorkshire. We’re taking a phased approach to create more value from underutilised resources on the site, including sewage, energy, heat, water and land:
1. ENERGY FROM HUMAN WASTEWhilst delivering a major upgrade of the site’s treatment capabilities to better protect river life, we also invested in a range of renewable energy facilities that have the capacity to make the site almost entirely self-sufficient for its large energy needs. Most of the energy is generated by digesting the flow of human waste received at the site.
2. RECOVERING BROWNFIELD LAND AND OLD FILTER MEDIA
Upgrades at the site made redundant 13 hectares of operational land which contained 500,000 tonnes of filter media. The cost of demolishing the old assets on the land and disposing of the filter media was estimated at £20 million. To avoid the financially and environmentally unaffordable approach we investigated alternatives, confirming the filter media could be processed for recycling as an aggregate for use in construction. For example, 25,000 tonnes was used in the development of a nearby train station without a lorry hitting the highway.
3. SUPPORTING GREEN ECONOMIC GROWTH
We’re developing ambitions for the 13 hectares of brownfield land left by the old filter beds to become a site for sustainable light industry that can utilise the treatment works’ waste heat and treated water effluent. And elsewhere on the site we’re developing plans for a range of green growth opportunities, including sustainable housing that can take heat from the works, and a suite of other opportunities.
DEVELOPMENT AND TRAININGWe manage a range of ongoing and evolving programmes to help keep our colleagues appropriately trained and continuously developing. These include technical training, our graduate programme, and leadership training for our people managers, for example. We know that training is not just for new employees or a change in role, so we offer all colleagues a range of training and development opportunities through our online Learning Zone as well as face to face courses and workshops, as well as on-the-job learning and development.
Training helps our people to stay up to date with the skills and knowledge they need to provide an excellent service to our customers. It also has positive impacts on people’s engagement and wellbeing, helping them to progress in their career with us, or elsewhere. In 2014/15, we estimate the value of our training to the Company, our people and society was £2.3 million.
Without regular use or refresher courses, skills and knowledge can deteriorate over time. In 2014/15, we estimate ‘knowledge decay’ to the value of £1.2 million. In some cases this is a natural progression, as people
change roles or as new skills and methods become more relevant. However, it can also indicate a need for more regular training or skills refreshers to keep people up to date, and able to do their jobs effectively and safely.
We have a system that allows colleagues and their managers to maintain a log of the training they have completed and need to complete. The system automatically adds reminders and bookings when refresher courses are needed, to ensure that people’s training is kept up to date.
DIRECT£2.3 MILLIONValue of training
DIRECT£1.2 MILLION
Cost of knowledge decay
P 51
CASE STUDY

SOCIAL CAPITAL
CUSTOMER SATISFACTIONCustomer service is at the heart of everything we do. We continuously monitor our customer satisfaction and work to improve the customer experience with us. The Consumer Council for Water is a statutory consumer body for the water industry in England and Wales. They complete an independent survey of water customer satisfaction each year. We find consistently high levels of satisfaction in this survey, with around 90% of those surveyed reporting satisfaction with our services, and 80% considering our services to be good value for money.
The Service Incentive Mechanism (SIM) is the water industry regulatory measure of customer service, reporting a score out of a maximum possible 100 points through an independent assessment of each UK water company. In 2014/15, our SIM score was 85 out of 100 points. We estimate that this score would have placed us 6th out of the water and wastewater companies.
We strive to be a leader in service across all sectors, not only the water sector. The UK Customer Service Index (UKCSI) is recognised as a leading benchmark of customer service. In the UKCSI we have consistently ranked amongst the best service providers of all the utilities over recent years, and the highest performer of the water companies. Continuing to improve service for our customers is our top priority.
We have been comparing our performance with the other UK water companies across a range of service measures. Whilst we have been improving services year on year and have areas of strength where we lead the industry, we also observed areas where our performance was at or below average. We want to do better for our customers and have recently committed to substantial investment to improve several key areas of service. For example, we will reduce internal sewer flooding incidents by 70% by 2020.
OUR MONTHLY SURVEY OF CUSTOMER PERCEPTIONS
METRIC SCORE OUT OFBrand perception 7.79 10Overall satisfaction 4.51 5Drinking water quality 4.45 5Water supply reliability 4.70 5Value for money ‘Good’ or ‘Very Good’ 87% 100%Met or exceeded expectations 69% 100% (*25% had ‘no opinion’)
2014/15 average results of our monthly surveys of a
representative sample of Yorkshire Water customers
THE RESULTS OF OUR IMPACT AND VALUE ASSESSMENT FOR SOCIAL CAPITAL
P 53
WHAT IS SOCIAL CAPITAL?Social capital is the value of an organisation’s relationships with people, society and other organisations, and the trust placed in it by its customers and suppliers. It also relates to the impacts that an organisation can have on people and society; for example, by providing a valuable service, or through contributions to charities and the local community.
WHY IS SOCIAL CAPITAL IMPORTANT TO YORKSHIRE AND YORKSHIRE WATER?As a private company providing a public service, our social capital is essential – our ‘social license’ to operate is every bit as important as our physical one. It is a top priority for us to be a leader in trust and integrity when public confidence in business is at an all time low. We are doing this by doing the right thing for our customers and other stakeholders, by looking after those in vulnerable circumstances, and by consistently delivering our high quality, highly reliable services.
We also pay close attention to our wider impacts on the region and the world, such as our provision of education and advise on how to use water wisely, and our charitable work with our partner WaterAid which works for a world where everyone has safe water and sanitation.
Social capital is the hardest of the six capitals to measure, with processes still being developed amongst leaders in the capitals approach. In this, our first, total impact and value assessment we have examined a selection of indicators of our social capital that are more readily available. This is an area we are already starting to focus on for further progress in our future assessments.
£6m
£8m
£4m
£2m
£7m
£5m
£3m
£1m
-£1m
£0
+
-
FIN
ANCI
AL S
UPP
ORT
FO
R CU
STO
MER
S
CHAR
ITY
AND
VOLU
NTE
ERIN
G
PUBL
IC E
DU
CATI
ON
LATE
PAY
MEN
TS T
O SU
PPLI
ERS
90% of those surveyed
reporting satisfaction with our services
80%considering our
services to be good value for money

SUPPORTING OUR CUSTOMERSWe understand that people can worry about being able to pay for essential services like water. That is why we keep our water bills amongst the lowest in England. The average water and wastewater bill in Yorkshire is consistently amongst the lowest in the country. To keep them low we have capped any rises in our average bill to no more than the rate of inflation, as measured by the Retail Price Index (RPI), until at least 2020.
We have a number of support schemes in place to help customers who are struggling to pay their water bill, or who need help dealing with arrears. For example, we offer a social tariff called Water Support for those on low incomes. In 2014/15, we provided financial support worth over £6.8m to customers through our different support packages, as summarised below. We have been increasing the number of people we help through these schemes, now at over 28,000 customers each year.
WORKING IN PARTNERSHIPWe recognise the importance of effective partnerships to enhance our impact. We are increasingly working collaboratively with multiple partners in order to deliver greater benefits to society, unlock cost savings, build more inclusive solutions, and enable landscape-scale improvements.
Partnership working is not new to Yorkshire Water. We have worked in partnership for many years, for example sharing resources with the Environment Agency to manage flooding and developing our leading work on peatland restoration with Moors for the Future, Pennine Prospects, the Yorkshire Peat Partnership and many others.
A key area in which we strengthen our effectiveness and resilience through partnership working is flood management. For example, in 2014/15:
• We jointly mapped known flood risks with the Environment Agency, identifying approximately 120 opportunities to be investigated for potential future collaboration;
• We continued to share information and models with the Environment Agency and Lead Local Flood Authorities. For example, providing Sheffield City Council with our new Drainage Area Plan for the city to inform their flood risk management plans;
• We continued to play an active part in the Yorkshire Regional Flood and Coastal Committee;
• As part of the River Hull Advisory Board (established to develop the River Hull Integrated Catchment Strategy for one of the most ‘at-risk’ developed flood plains in England), we undertook Integrated catchment modelling and identified options that could reduce flood risk in the area.
Also in Hull, we are participating in an exciting partnership which is delivering benefits for local communities: the Living With Water Partnership.
We also know that it’s not just paying the bill that can cause worry for some of our customers. Some of our customers are more vulnerable to water supply issues than others, and that circumstances can change quickly for people. We want to make sure that customers always have water when they need it.
Investing in our assets and processes has greatly reduced the amount of time we interrupt a customers water supply, and has reduced the risk of sewer flooding. However, we recognise the consequences when things go wrong and we have committed to going even further in the future. Recognising that there’ll always be extreme events we can’t engineer for, we have also strengthened our emergency response facilities.
SCHEME DESCRIPTIONNUMBER OF CUSTOMERS
WATERSURE Bills are capped at a certain figure for qualifying customers who receive income-based benefit and have either a qualifying medical condition or three or more children under the age of 19 living at home
5,800
WATERSUPPORT Payments toward water bills for customers with a low household income who pay more than £524 a year for their water bill. This scheme commenced in December 2014
760
COMMUNITY TRUST AWARD
Customers in arrears with at least one other ‘priority’ debt (e.g. rent, mortgage, energy) receive an award to pay towards their debt
2,200
RESOLVE Customers with over 12 months of arrears agree a regular payment plan, with awards towards the arrears paid by Yorkshire Water for every three months’ worth of payments made
5,500
DIRECT£6.8M+
Financial support for customers
CASE STUDY
THE LIVING WITH WATER PARTNERSHIPMuch of the City of Hull and the surrounding area sits below sea level and has some of the highest flood risk outside London. Following the extreme storms of 2007, thousands of people and properties felt the impacts of widespread flooding. In response, we have been working with the local authorities and the Environment Agency to develop a multi-agency response. Today, the partnership has matured and is known as the Living With Water Partnership.
Significant progress has already been made, including the completion of Bransholme Pumping Station by Yorkshire Water, reducing the flood risk to 15,000 properties. Featuring six giant Archimedes screw storm water pumps, the new and improved pumping station has around four times greater capacity and can transfer the equivalent of an Olympic swimming pool’s worth of storm water into a storage lagoon in less than two minutes. The Living With Water Partnership is also prioritising sustainable solutions that work in harmony with the environment and provide
benefits to local residents, such as ‘aqua-green’ spaces which soak up water like sponges, then release it slowly, reducing the pressure on storm drains and sewers.
In January 2018, the Partnership and Hull City Council submitted a successful bid for Hull to be one of only five cities around the world to test the City Water Resilience Framework (CWRF) developed by Arup and the Rockefeller Foundation. The CWRF will be a global standard for water, helping cities to identify and manage major water challenges.
P 54
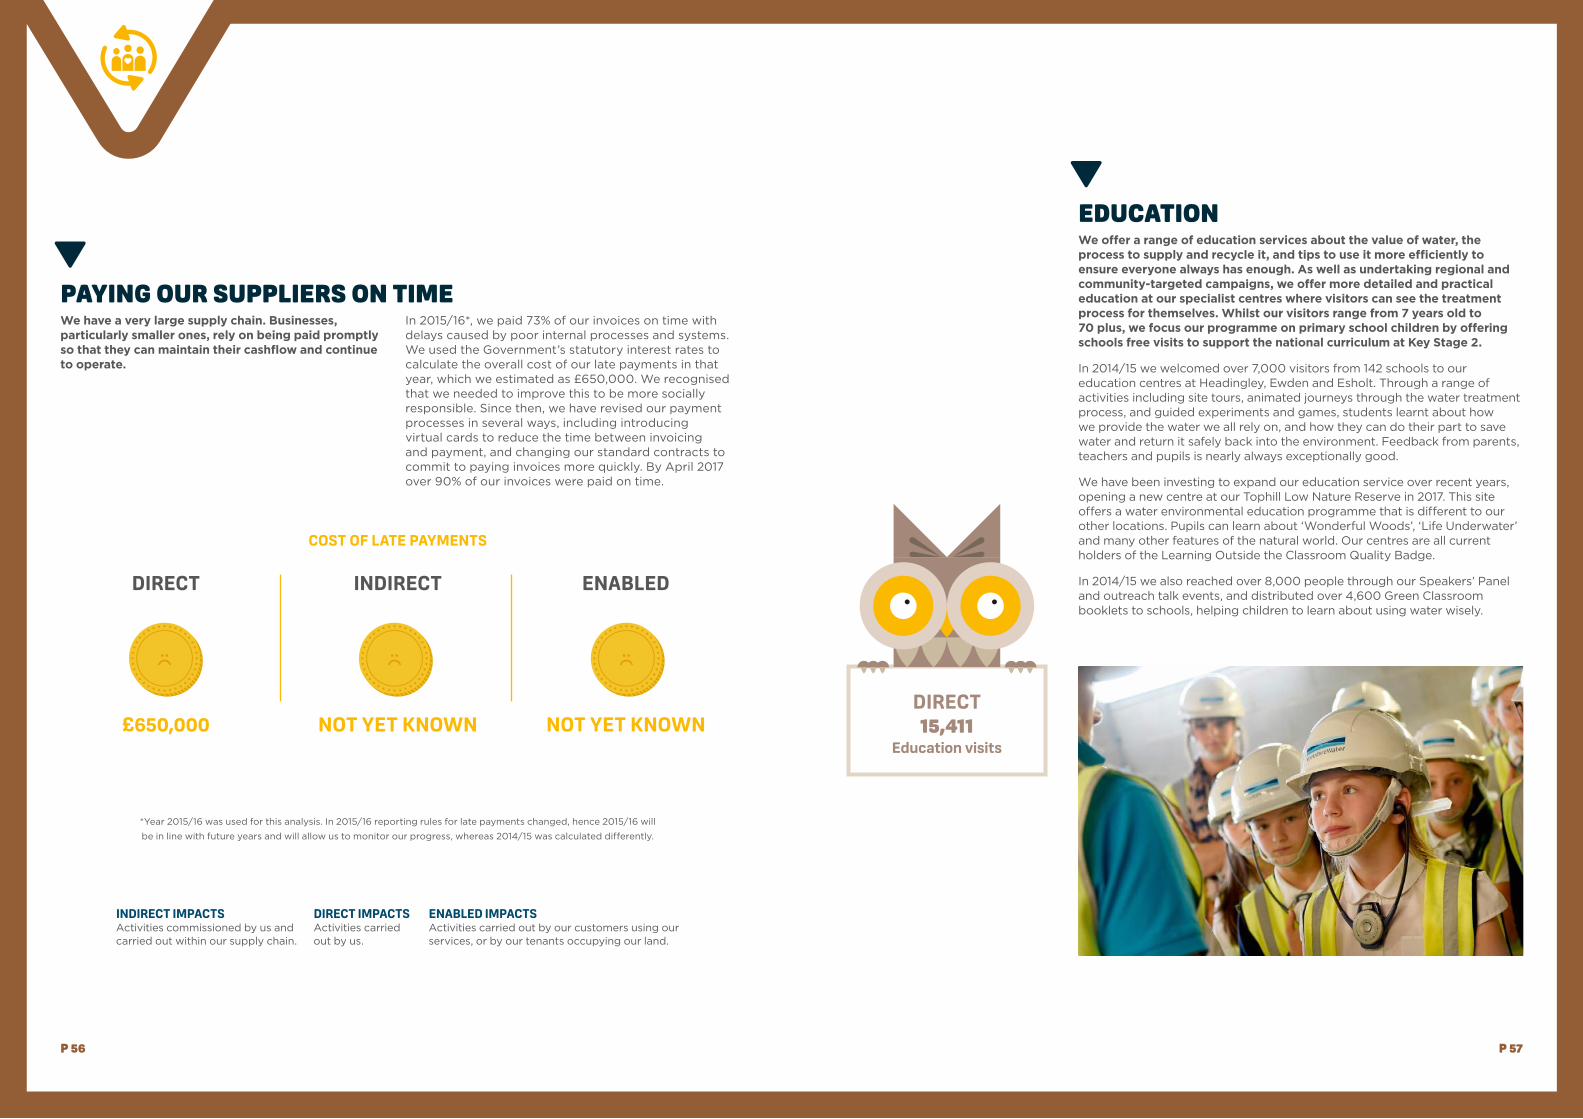
PAYING OUR SUPPLIERS ON TIMEWe have a very large supply chain. Businesses, particularly smaller ones, rely on being paid promptly so that they can maintain their cashflow and continue to operate.
In 2015/16*, we paid 73% of our invoices on time with delays caused by poor internal processes and systems. We used the Government’s statutory interest rates to calculate the overall cost of our late payments in that year, which we estimated as £650,000. We recognised that we needed to improve this to be more socially responsible. Since then, we have revised our payment processes in several ways, including introducing virtual cards to reduce the time between invoicing and payment, and changing our standard contracts to commit to paying invoices more quickly. By April 2017 over 90% of our invoices were paid on time.
EDUCATIONWe offer a range of education services about the value of water, the process to supply and recycle it, and tips to use it more efficiently to ensure everyone always has enough. As well as undertaking regional and community-targeted campaigns, we offer more detailed and practical education at our specialist centres where visitors can see the treatment process for themselves. Whilst our visitors range from 7 years old to 70 plus, we focus our programme on primary school children by offering schools free visits to support the national curriculum at Key Stage 2.
In 2014/15 we welcomed over 7,000 visitors from 142 schools to our education centres at Headingley, Ewden and Esholt. Through a range of activities including site tours, animated journeys through the water treatment process, and guided experiments and games, students learnt about how we provide the water we all rely on, and how they can do their part to save water and return it safely back into the environment. Feedback from parents, teachers and pupils is nearly always exceptionally good.
We have been investing to expand our education service over recent years, opening a new centre at our Tophill Low Nature Reserve in 2017. This site offers a water environmental education programme that is different to our other locations. Pupils can learn about ‘Wonderful Woods’, ‘Life Underwater’ and many other features of the natural world. Our centres are all current holders of the Learning Outside the Classroom Quality Badge.
In 2014/15 we also reached over 8,000 people through our Speakers’ Panel and outreach talk events, and distributed over 4,600 Green Classroom booklets to schools, helping children to learn about using water wisely.
DIRECT
£650,000 NOT YET KNOWN NOT YET KNOWN
COST OF LATE PAYMENTS
INDIRECT ENABLED
*Year 2015/16 was used for this analysis. In 2015/16 reporting rules for late payments changed, hence 2015/16 will
be in line with future years and will allow us to monitor our progress, whereas 2014/15 was calculated differently.
DIRECT15,411
Education visits
P 57P 56
INDIRECT IMPACTSActivities commissioned by us and carried out within our supply chain.
DIRECT IMPACTSActivities carried out by us.
ENABLED IMPACTSActivities carried out by our customers using our services, or by our tenants occupying our land.

CHARITY AND VOLUNTEERINGOur main charity, WaterAid, believes that “Extreme poverty won’t end until everyone, everywhere, has clean water, decent toilets and good hygiene”. They are determined to make this happen within a generation, and work in 36 countries, supported entirely by donations.
Yorkshire Water has set a target to raise £1 million for WaterAid between 2014 and 2019, and we’re on track to beat that target, having raised £824,500 to date. In 2014/15, Yorkshire Water colleagues raised £279,000 for WaterAid through payroll giving, the WaterAid lottery, and a range of activities including our annual WaterCycle and 10k run.
Yorkshire Water staff have plenty of opportunities to help other causes too. Between them, our colleagues devoted 2,750 days to volunteering for various activities, covering literacy, school governance, charity fundraising and environmental volunteering for partners including the RSPB, Canal & Rivers Trust and the Yorkshire Wildlife Trust.
2,750 DAYS VOLUNTEERED
Time and donations worth
£395,000
P 59P 58
CONCLUSIONS1. FOCUSING ON WHAT REALLY
MATTERS TO PEOPLE This is what we have kept at the front of our
minds as we have undertaken our first total impact assessment, and as we continue to develop and embed the capitals approach. By better understanding our positive and negative impact across the six capitals we have gained a rich insight into what we do for the society we serve, and where there may be opportunities and threats in the future.
2. A NET-POSITIVE CONTRIBUTION We have a very strong net-positive impact
through our essential health, sanitation and environmental services. We have identified many opportunities to further enhance our contribution, and we’re going to stay focused on maintaining and growing what we offer to society. We also have to work to maintain the current value we create in the face of a range of pressures like the changing climate, growing population and diminishing finite resources.
3. INFORMING REAL CHANGE Our learning has helped fundamentally shape
our new long term strategy to focus on what matters to people and the environment, and the sustainability of what we do. We’re transforming our approach to land management to deliver multiple benefits, for example through our commitment to plant 1m trees over the next ten years and our partnership approach to farm tenancies called Beyond Nature. We’re also underway in delivering our new commitments to improve core areas of service, including dramatic reductions in leakage and pollution.
4. A DEVELOPING APPROACH The more we have looked, the more potential
we have seen to apply the Capitals approach to broaden and advance our thinking about impact and value. We’ve created new tools to help us do this more quickly and more extensively in the future, helping optimise our plans and investment choices based on a rich view of associated costs and benefits. We will be repeating our strategic-level total impact assessment for the years since 2014/15 so we can see trends over time. As part of this we’ll look to fill gaps and develop the weaker areas in our assessment. Through collaboration with other leaders in this space we want to develop a standardised approach that we and others can repeat annually as a seamless part of our standard public reporting.
5. ONGOING BOARD-LEVEL COMMITMENT
We have set up a new Social Value Board Committee to help us govern, monitor and drive our developing approach, and to ensure our strategy remains focused on delivering for our customers.

Find out moreThe full methodology and a series of case studies can be found on our website: www.yorkshirewater.co.uk/capitals
Get in touchWe would welcome your feedback and questions.
Gordon Rogers Head of Sustainability [email protected]
Hannah James Lead Sustainability Advisor [email protected]