Embed Size (px)
Citation preview
www.nasa.gov
National Aeronautics and Space Administration
Our Atmosphere
The atmosphere is a life-giving blanket of air that surrounds our Earth; it is composed of gases that protect us from the Sun’s intense ultraviolet radiation, allowing life to flourish. Greenhouse gases like carbon dioxide, ozone, and methane are steadily increasing from year to year. These gases trap infrared radiation (heat) emitted from Earth’s surface and atmosphere, causing the atmosphere to warm. Conversely, clouds as well as many tiny suspended liquid or solid particles in the air such as dust, smoke, and pollution—called aerosols—reflect the Sun’s radiative energy, which leads to cooling. This delicate balance of incoming and reflected solar radiation and emitted infrared energy is critical in maintaining the Earth’s climate and sustaining life. Research using computer models and satellite data from NASA’s Earth Observing System enhances our understanding of the physical processes affecting trends in temperature, humidity, clouds, and aerosols and helps us assess the impact of a changing atmosphere on the global climate.
eos.nasa.gov
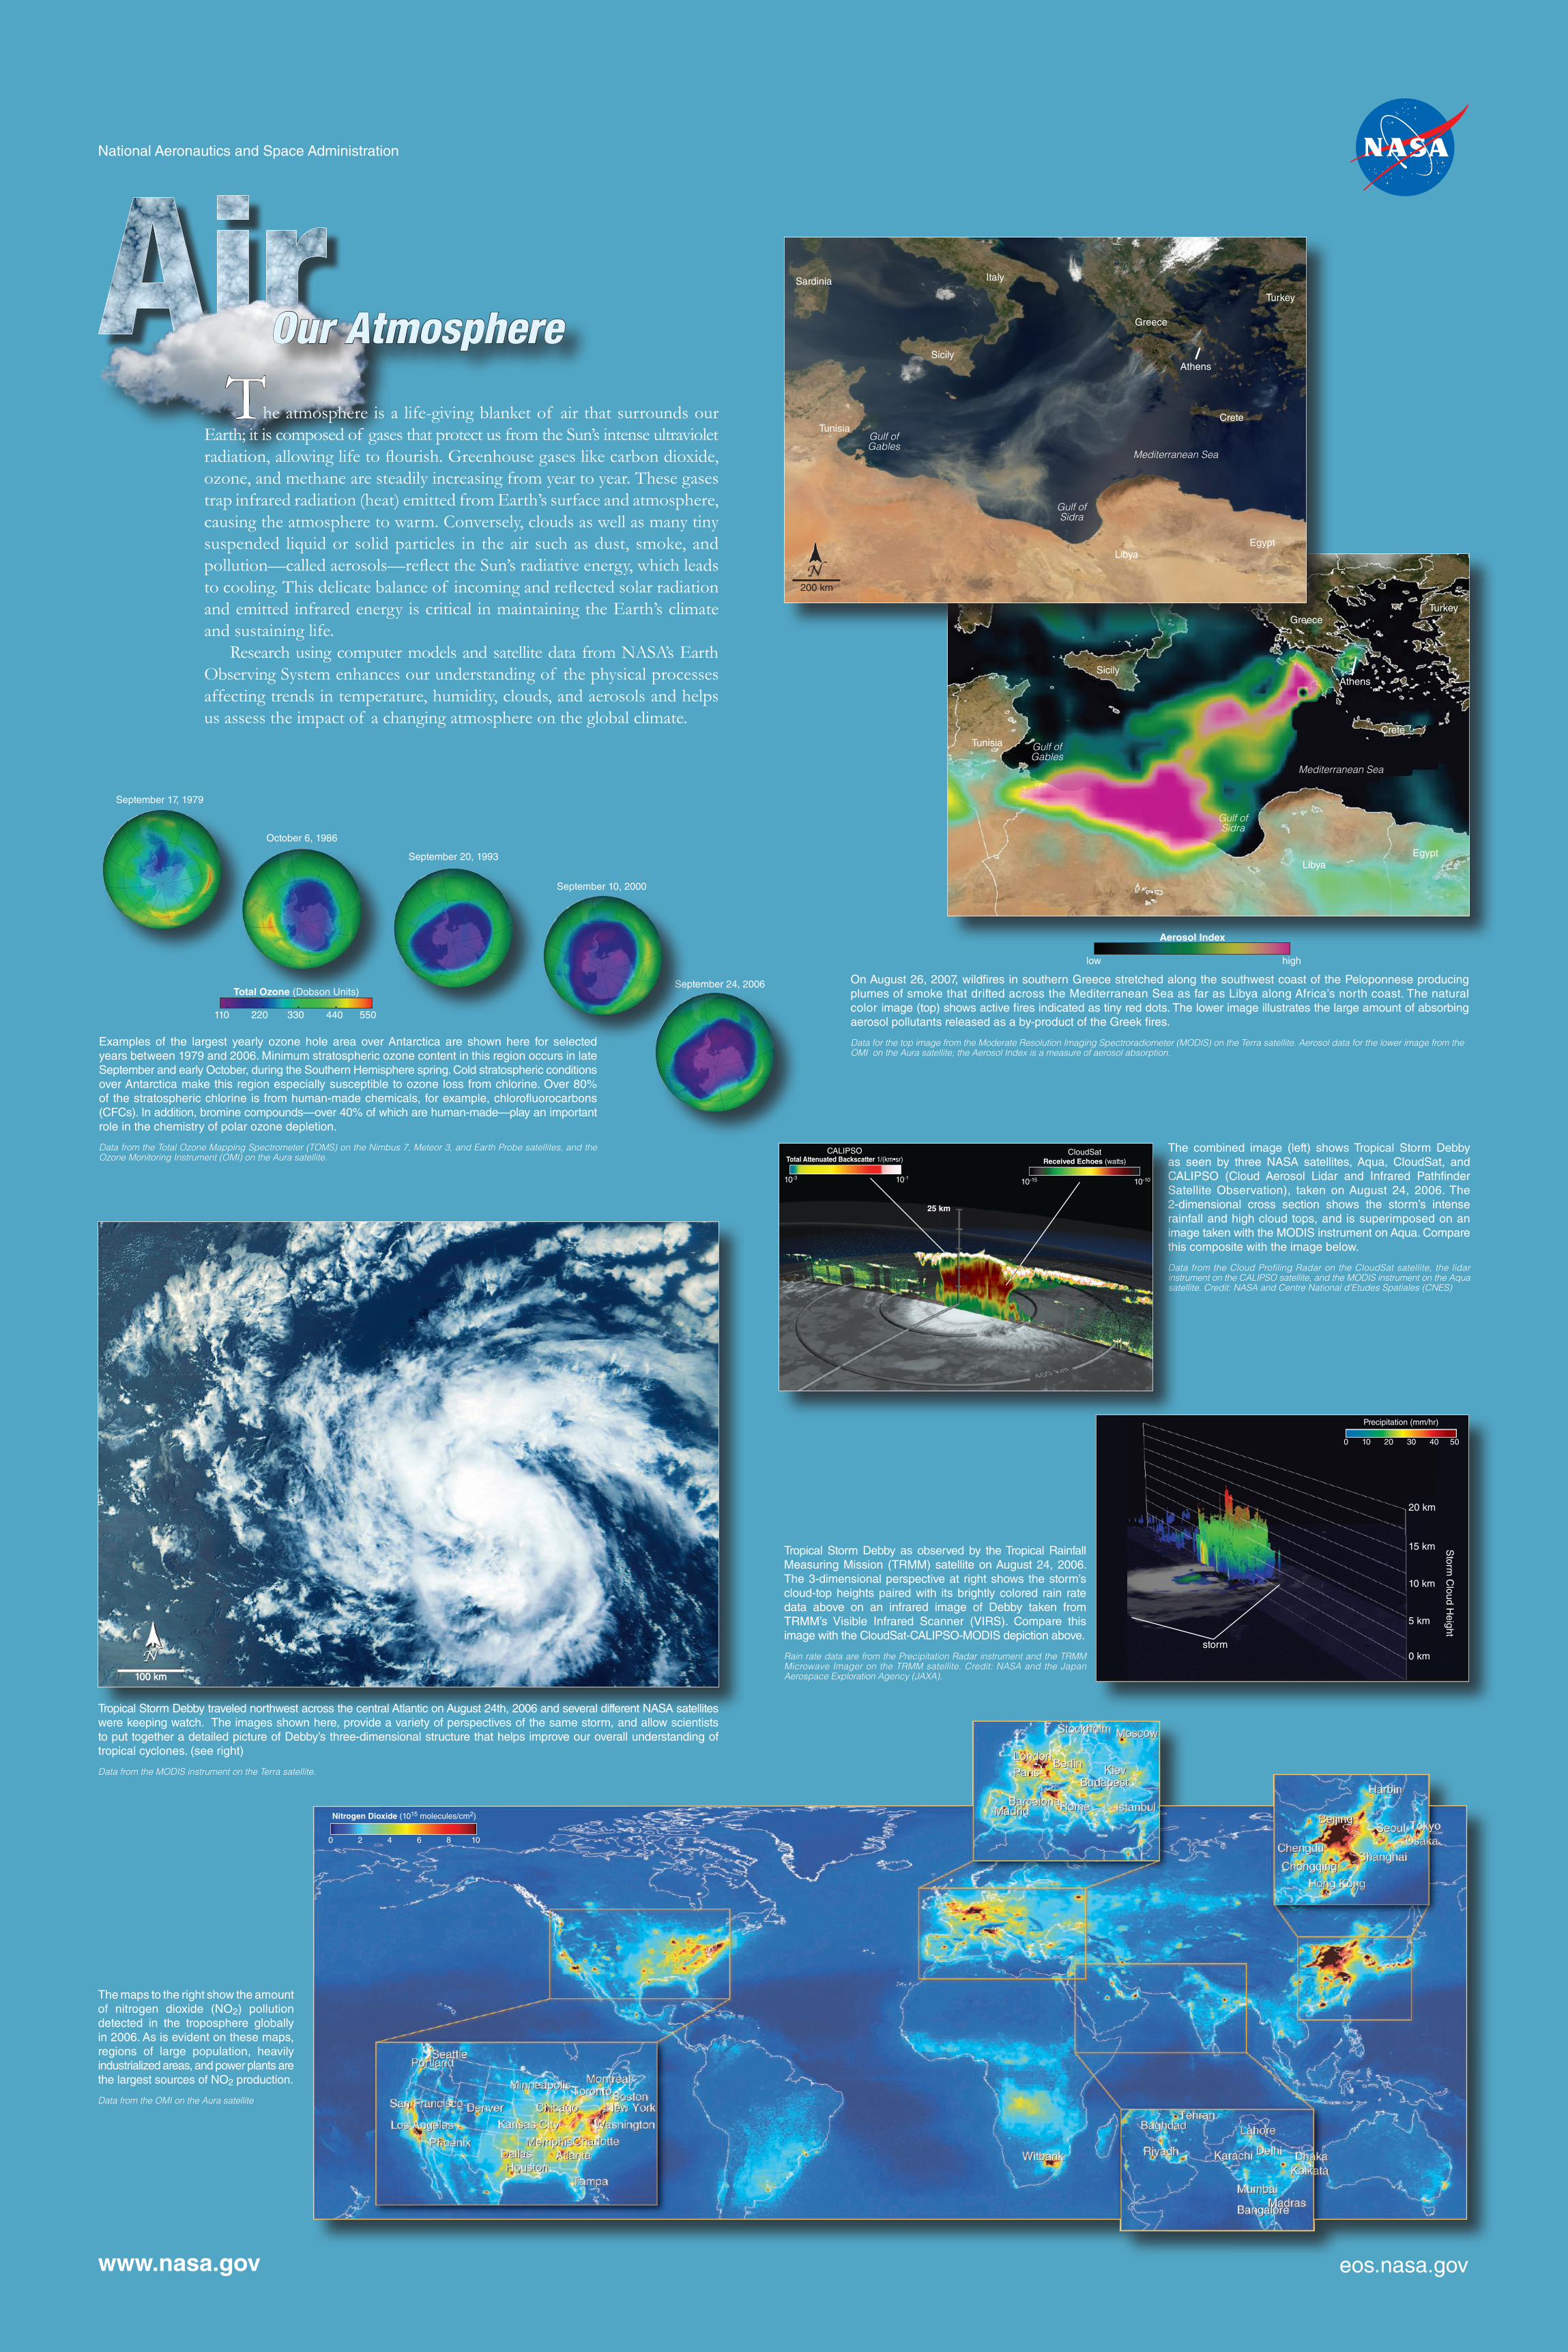
Examples of the largest yearly ozone hole area over Antarctica are shown here for selected years between 1979 and 2006. Minimum stratospheric ozone content in this region occurs in late September and early October, during the Southern Hemisphere spring. Cold stratospheric conditions over Antarctica make this region especially susceptible to ozone loss from chlorine. Over 80% of the stratospheric chlorine is from human-made chemicals, for example, chlorofluorocarbons (CFCs). In addition, bromine compounds—over 40% of which are human-made—play an important role in the chemistry of polar ozone depletion.
Data from the Total Ozone Mapping Spectrometer (TOMS) on the Nimbus 7, Meteor 3, and Earth Probe satellites, and the Ozone Monitoring Instrument (OMI) on the Aura satellite.
Total Ozone (Dobson Units)
110 220 330 440 550
September 17, 1979
October 6, 1986
September 20, 1993
September 24, 2006
September 10, 2000
NN100 km100 km
Tropical Storm Debby traveled northwest across the central Atlantic on August 24th, 2006 and several different NASA satellites were keeping watch. The images shown here, provide a variety of perspectives of the same storm, and allow scientists to put together a detailed picture of Debby’s three-dimensional structure that helps improve our overall understanding of tropical cyclones. (see right)
Data from the MODIS instrument on the Terra satellite.
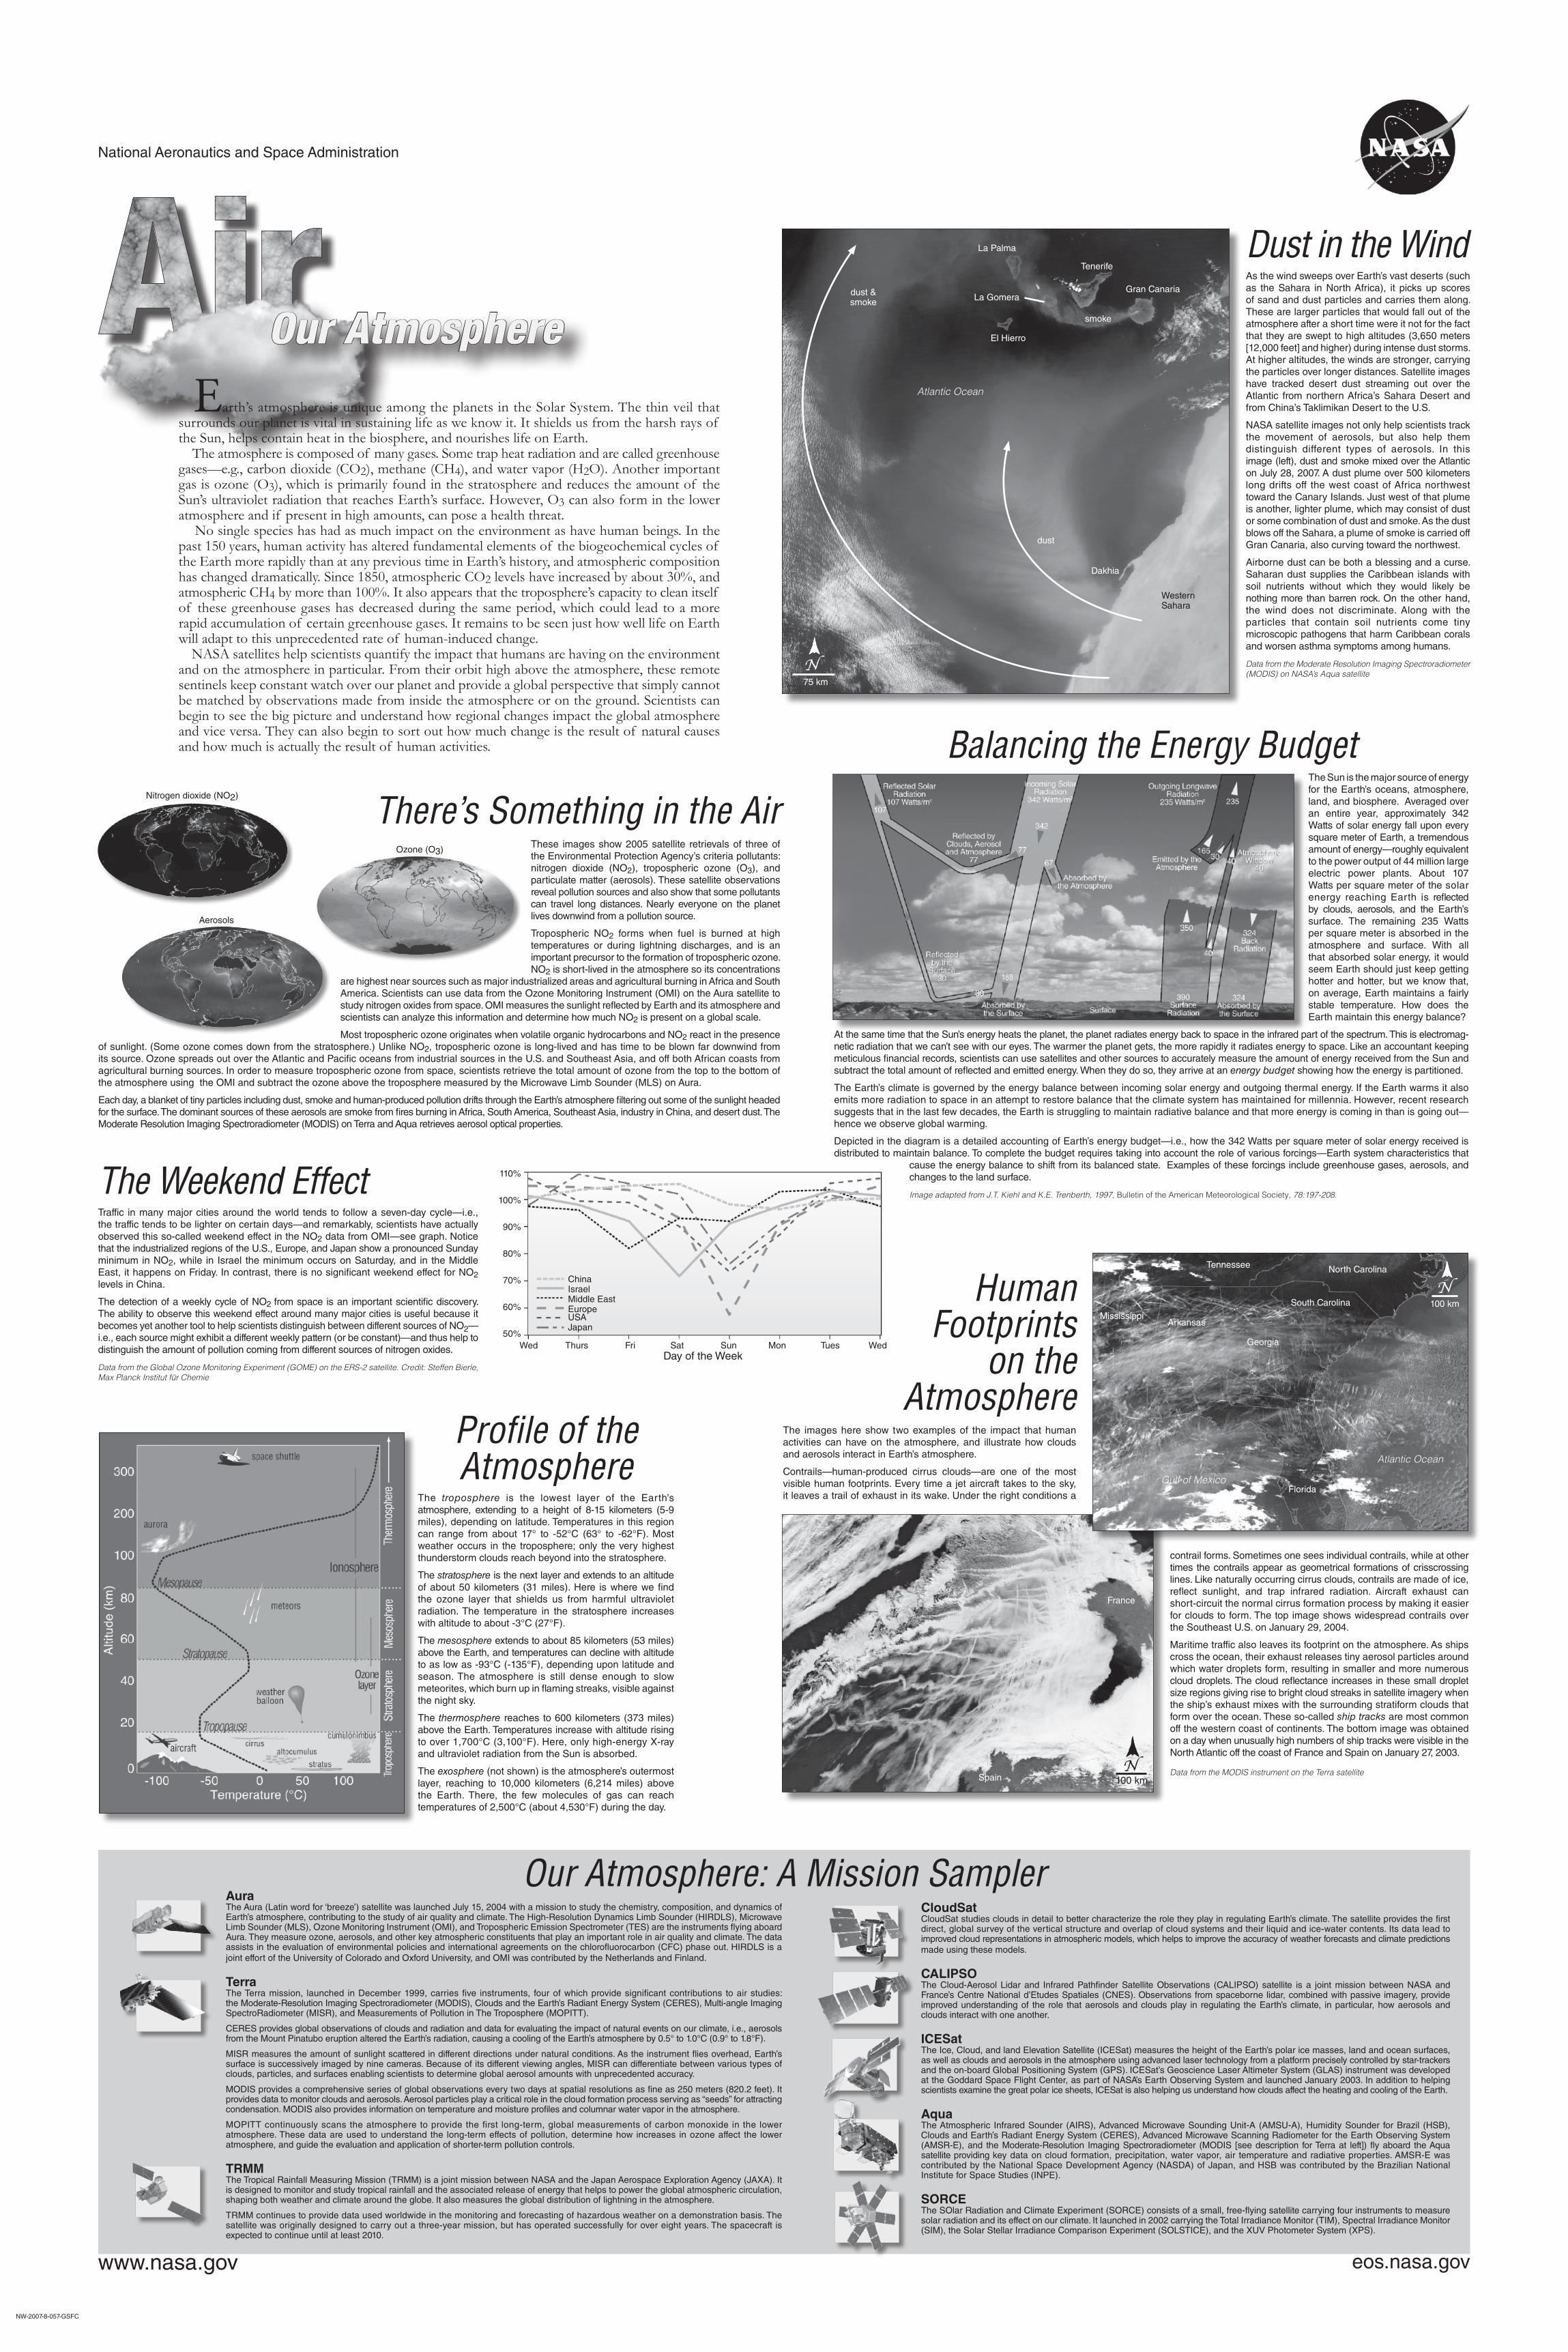
The maps to the right show the amount of nitrogen dioxide (NO2) pollution detected in the troposphere globally in 2006. As is evident on these maps, regions of large population, heavily industrialized areas, and power plants are the largest sources of NO2 production.
Data from the OMI on the Aura satellite
Nitrogen Dioxide (1015 molecules/cm2)
0 2 4 6 8 10
20 km
15 km
10 km
5 km
0 km
Storm
Cloud H
eight
storm
0 10 20 30 40 50
Precipitation (mm/hr)
Tropical Storm Debby as observed by the Tropical Rainfall Measuring Mission (TRMM) satellite on August 24, 2006. The 3-dimensional perspective at right shows the storm’s cloud-top heights paired with its brightly colored rain rate data above on an infrared image of Debby taken from TRMM’s Visible Infrared Scanner (VIRS). Compare this image with the CloudSat-CALIPSO-MODIS depiction above.
Rain rate data are from the Precipitation Radar instrument and the TRMM Microwave Imager on the TRMM satellite. Credit: NASA and the Japan Aerospace Exploration Agency (JAXA).
The combined image (left) shows Tropical Storm Debby as seen by three NASA satellites, Aqua, CloudSat, and CALIPSO (Cloud Aerosol Lidar and Infrared Pathfinder Satellite Observation), taken on August 24, 2006. The 2-dimensional cross section shows the storm’s intense rainfall and high cloud tops, and is superimposed on an image taken with the MODIS instrument on Aqua. Compare this composite with the image below.
Data from the Cloud Profiling Radar on the CloudSat satellite, the lidar instrument on the CALIPSO satellite, and the MODIS instrument on the Aqua satellite. Credit: NASA and Centre National d’Etudes Spatiales (CNES)
25 km
CloudSatReceived Echoes (watts)
10-15 10-10
CALIPSOTotal Attenuated Backscatter 1/(km•sr)
10-3 10-1
On August 26, 2007, wildfires in southern Greece stretched along the southwest coast of the Peloponnese producing plumes of smoke that drifted across the Mediterranean Sea as far as Libya along Africa’s north coast. The natural color image (top) shows active fires indicated as tiny red dots. The lower image illustrates the large amount of absorbing aerosol pollutants released as a by-product of the Greek fires.
Data for the top image from the Moderate Resolution Imaging Spectroradiometer (MODIS) on the Terra satellite. Aerosol data for the lower image from the OMI on the Aura satellite; the Aerosol Index is a measure of aerosol absorption.
N200 km
Libya
Mediterranean Sea
Greece
Athens
Italy
CreteTunisia
Sicily
Gulf ofGables
Egypt
Turkey
Sardinia
LibyaEgypt
Gulf ofGables
Tunisia
Sicily
Turkey
Crete
Mediterranean Sea
Greece
Athens
Gulf ofSidra
Aerosol Index
low high
Gulf ofSidra
www.nasa.gov eos.nasa.gov
AuraThe Aura (Latin word for ‘breeze’) satellite was launched July 15, 2004 with a mission to study the chemistry, composition, and dynamics of Earth’s atmosphere, contributing to the study of air quality and climate. The High-Resolution Dynamics Limb Sounder (HIRDLS), Microwave Limb Sounder (MLS), Ozone Monitoring Instrument (OMI), and Tropospheric Emission Spectrometer (TES) are the instruments flying aboard Aura. They measure ozone, aerosols, and other key atmospheric constituents that play an important role in air quality and climate. The data assists in the evaluation of environmental policies and international agreements on the chlorofluorocarbon (CFC) phase out. HIRDLS is a joint effort of the University of Colorado and Oxford University, and OMI was contributed by the Netherlands and Finland.
TerraThe Terra mission, launched in December 1999, carries five instruments, four of which provide significant contributions to air studies: the Moderate-Resolution Imaging Spectroradiometer (MODIS), Clouds and the Earth’s Radiant Energy System (CERES), Multi-angle Imaging SpectroRadiometer (MISR), and Measurements of Pollution in The Troposphere (MOPITT).
CERES provides global observations of clouds and radiation and data for evaluating the impact of natural events on our climate, i.e., aerosols from the Mount Pinatubo eruption altered the Earth’s radiation, causing a cooling of the Earth’s atmosphere by 0.5° to 1.0°C (0.9° to 1.8°F).
MISR measures the amount of sunlight scattered in different directions under natural conditions. As the instrument flies overhead, Earth’s surface is successively imaged by nine cameras. Because of its different viewing angles, MISR can differentiate between various types of clouds, particles, and surfaces enabling scientists to determine global aerosol amounts with unprecedented accuracy.
MODIS provides a comprehensive series of global observations every two days at spatial resolutions as fine as 250 meters (820.2 feet). It provides data to monitor clouds and aerosols. Aerosol particles play a critical role in the cloud formation process serving as “seeds” for attracting condensation. MODIS also provides information on temperature and moisture profiles and columnar water vapor in the atmosphere.
MOPITT continuously scans the atmosphere to provide the first long-term, global measurements of carbon monoxide in the lower atmosphere. These data are used to understand the long-term effects of pollution, determine how increases in ozone affect the lower atmosphere, and guide the evaluation and application of shorter-term pollution controls.
TRMMThe Tropical Rainfall Measuring Mission (TRMM) is a joint mission between NASA and the Japan Aerospace Exploration Agency (JAXA). It is designed to monitor and study tropical rainfall and the associated release of energy that helps to power the global atmospheric circulation, shaping both weather and climate around the globe. It also measures the global distribution of lightning in the atmosphere.
TRMM continues to provide data used worldwide in the monitoring and forecasting of hazardous weather on a demonstration basis. The satellite was originally designed to carry out a three-year mission, but has operated successfully for over eight years. The spacecraft is expected to continue until at least 2010.
CloudSatCloudSat studies clouds in detail to better characterize the role they play in regulating Earth’s climate. The satellite provides the first direct, global survey of the vertical structure and overlap of cloud systems and their liquid and ice-water contents. Its data lead to improved cloud representations in atmospheric models, which helps to improve the accuracy of weather forecasts and climate predictions made using these models.
CALIPSOThe Cloud-Aerosol Lidar and Infrared Pathfinder Satellite Observations (CALIPSO) satellite is a joint mission between NASA and France’s Centre National d’Etudes Spatiales (CNES). Observations from spaceborne lidar, combined with passive imagery, provide improved understanding of the role that aerosols and clouds play in regulating the Earth’s climate, in particular, how aerosols and clouds interact with one another.
ICESatThe Ice, Cloud, and land Elevation Satellite (ICESat) measures the height of the Earth’s polar ice masses, land and ocean surfaces, as well as clouds and aerosols in the atmosphere using advanced laser technology from a platform precisely controlled by star-trackers and the on-board Global Positioning System (GPS). ICESat’s Geoscience Laser Altimeter System (GLAS) instrument was developed at the Goddard Space Flight Center, as part of NASA’s Earth Observing System and launched January 2003. In addition to helping scientists examine the great polar ice sheets, ICESat is also helping us understand how clouds affect the heating and cooling of the Earth.
AquaThe Atmospheric Infrared Sounder (AIRS), Advanced Microwave Sounding Unit-A (AMSU-A), Humidity Sounder for Brazil (HSB), Clouds and Earth’s Radiant Energy System (CERES), Advanced Microwave Scanning Radiometer for the Earth Observing System (AMSR-E), and the Moderate-Resolution Imaging Spectroradiometer (MODIS [see description for Terra at left]) fly aboard the Aqua satellite providing key data on cloud formation, precipitation, water vapor, air temperature and radiative properties. AMSR-E was contributed by the National Space Development Agency (NASDA) of Japan, and HSB was contributed by the Brazilian National Institute for Space Studies (INPE).
SORCE The SOlar Radiation and Climate Experiment (SORCE) consists of a small, free-flying satellite carrying four instruments to measure solar radiation and its effect on our climate. It launched in 2002 carrying the Total Irradiance Monitor (TIM), Spectral Irradiance Monitor (SIM), the Solar Stellar Irradiance Comparison Experiment (SOLSTICE), and the XUV Photometer System (XPS).
Our Atmosphere: A Mission Sampler
National Aeronautics and Space Administration
Our Atmosphere
NW-2007-8-057-GSFC
Profile of the Atmosphere
The troposphere is the lowest layer of the Earth’s atmosphere, extending to a height of 8-15 kilometers (5-9 miles), depending on latitude. Temperatures in this region can range from about 17° to -52°C (63° to -62°F). Most weather occurs in the troposphere; only the very highest thunderstorm clouds reach beyond into the stratosphere.
The stratosphere is the next layer and extends to an altitude of about 50 kilometers (31 miles). Here is where we find the ozone layer that shields us from harmful ultraviolet radiation. The temperature in the stratosphere increases with altitude to about -3°C (27°F).
The mesosphere extends to about 85 kilometers (53 miles) above the Earth, and temperatures can decline with altitude to as low as -93°C (-135°F), depending upon latitude and season. The atmosphere is still dense enough to slow meteorites, which burn up in flaming streaks, visible against the night sky.
The thermosphere reaches to 600 kilometers (373 miles) above the Earth. Temperatures increase with altitude rising to over 1,700°C (3,100°F). Here, only high-energy X-ray and ultraviolet radiation from the Sun is absorbed.
The exosphere (not shown) is the atmosphere’s outermost layer, reaching to 10,000 kilometers (6,214 miles) above the Earth. There, the few molecules of gas can reach temperatures of 2,500°C (about 4,530°F) during the day.
The Weekend Effect Traffic in many major cities around the world tends to follow a seven-day cycle—i.e., the traffic tends to be lighter on certain days—and remarkably, scientists have actually observed this so-called weekend effect in the NO2 data from OMI—see graph. Notice that the industrialized regions of the U.S., Europe, and Japan show a pronounced Sunday minimum in NO2, while in Israel the minimum occurs on Saturday, and in the Middle East, it happens on Friday. In contrast, there is no significant weekend effect for NO2 levels in China.
The detection of a weekly cycle of NO2 from space is an important scientific discovery. The ability to observe this weekend effect around many major cities is useful because it becomes yet another tool to help scientists distinguish between different sources of NO2—i.e., each source might exhibit a different weekly pattern (or be constant)—and thus help to distinguish the amount of pollution coming from different sources of nitrogen oxides.
Data from the Global Ozone Monitoring Experiment (GOME) on the ERS-2 satellite. Credit: Steffen Bierle, Max Planck Institut für Chemie
Day of the WeekWed Thurs Fri Sat Sun Mon Tues Wed
110%
100%
90%
80%
70%
60%
50%
ChinaIsraelMiddle EastEuropeUSAJapan
There’s Something in the AirThese images show 2005 satellite retrievals of three of the Environmental Protection Agency’s criteria pollutants: nitrogen dioxide (NO2), tropospheric ozone (O3), and particulate matter (aerosols). These satellite observations reveal pollution sources and also show that some pollutants can travel long distances. Nearly everyone on the planet lives downwind from a pollution source.
Tropospheric NO2 forms when fuel is burned at high temperatures or during lightning discharges, and is an important precursor to the formation of tropospheric ozone. NO2 is short-lived in the atmosphere so its concentrations
are highest near sources such as major industrialized areas and agricultural burning in Africa and South America. Scientists can use data from the Ozone Monitoring Instrument (OMI) on the Aura satellite to study nitrogen oxides from space. OMI measures the sunlight reflected by Earth and its atmosphere and scientists can analyze this information and determine how much NO2 is present on a global scale. Most tropospheric ozone originates when volatile organic hydrocarbons and NO2 react in the presence
of sunlight. (Some ozone comes down from the stratosphere.) Unlike NO2, tropospheric ozone is long-lived and has time to be blown far downwind from its source. Ozone spreads out over the Atlantic and Pacific oceans from industrial sources in the U.S. and Southeast Asia, and off both African coasts from agricultural burning sources. In order to measure tropospheric ozone from space, scientists retrieve the total amount of ozone from the top to the bottom of the atmosphere using the OMI and subtract the ozone above the troposphere measured by the Microwave Limb Sounder (MLS) on Aura.
Each day, a blanket of tiny particles including dust, smoke and human-produced pollution drifts through the Earth’s atmosphere filtering out some of the sunlight headed for the surface. The dominant sources of these aerosols are smoke from fires burning in Africa, South America, Southeast Asia, industry in China, and desert dust. The Moderate Resolution Imaging Spectroradiometer (MODIS) on Terra and Aqua retrieves aerosol optical properties.
Nitrogen dioxide (NO2)
Ozone (O3)
Aerosols
Earth’s atmosphere is unique among the planets in the Solar System. The thin veil that surrounds our planet is vital in sustaining life as we know it. It shields us from the harsh rays of the Sun, helps contain heat in the biosphere, and nourishes life on Earth. The atmosphere is composed of many gases. Some trap heat radiation and are called greenhouse gases—e.g., carbon dioxide (CO2), methane (CH4), and water vapor (H2O). Another important gas is ozone (O3), which is primarily found in the stratosphere and reduces the amount of the Sun’s ultraviolet radiation that reaches Earth’s surface. However, O3 can also form in the lower atmosphere and if present in high amounts, can pose a health threat. No single species has had as much impact on the environment as have human beings. In the past 150 years, human activity has altered fundamental elements of the biogeochemical cycles of the Earth more rapidly than at any previous time in Earth’s history, and atmospheric composition has changed dramatically. Since 1850, atmospheric CO2 levels have increased by about 30%, and atmospheric CH4 by more than 100%. It also appears that the troposphere’s capacity to clean itself of these greenhouse gases has decreased during the same period, which could lead to a more rapid accumulation of certain greenhouse gases. It remains to be seen just how well life on Earth will adapt to this unprecedented rate of human-induced change. NASA satellites help scientists quantify the impact that humans are having on the environment and on the atmosphere in particular. From their orbit high above the atmosphere, these remote sentinels keep constant watch over our planet and provide a global perspective that simply cannot be matched by observations made from inside the atmosphere or on the ground. Scientists can begin to see the big picture and understand how regional changes impact the global atmosphere and vice versa. They can also begin to sort out how much change is the result of natural causes and how much is actually the result of human activities.
Dust in the WindAs the wind sweeps over Earth’s vast deserts (such as the Sahara in North Africa), it picks up scores of sand and dust particles and carries them along. These are larger particles that would fall out of the atmosphere after a short time were it not for the fact that they are swept to high altitudes (3,650 meters [12,000 feet] and higher) during intense dust storms. At higher altitudes, the winds are stronger, carrying the particles over longer distances. Satellite images have tracked desert dust streaming out over the Atlantic from northern Africa’s Sahara Desert and from China’s Taklimikan Desert to the U.S.
NASA satellite images not only help scientists track the movement of aerosols, but also help them distinguish different types of aerosols. In this image (left), dust and smoke mixed over the Atlantic on July 28, 2007. A dust plume over 500 kilometers long drifts off the west coast of Africa northwest toward the Canary Islands. Just west of that plume is another, lighter plume, which may consist of dust or some combination of dust and smoke. As the dust blows off the Sahara, a plume of smoke is carried off Gran Canaria, also curving toward the northwest.
Airborne dust can be both a blessing and a curse. Saharan dust supplies the Caribbean islands with soil nutrients without which they would likely be nothing more than barren rock. On the other hand, the wind does not discriminate. Along with the particles that contain soil nutrients come tiny microscopic pathogens that harm Caribbean corals and worsen asthma symptoms among humans.
Data from the Moderate Resolution Imaging Spectroradiometer (MODIS) on NASA’s Aqua satellite
75 km
N
dust
dust &smoke
Atlantic Ocean
Tenerife
Gran CanariaLa Gomera
smoke
La Palma
WesternSahara
Dakhia
El Hierro
The Sun is the major source of energy for the Earth’s oceans, atmosphere, land, and biosphere. Averaged over an entire year, approximately 342 Watts of solar energy fall upon every square meter of Earth, a tremendous amount of energy—roughly equivalent to the power output of 44 million large electric power plants. About 107 Watts per square meter of the solar energy reaching Earth is reflected by clouds, aerosols, and the Earth’s surface. The remaining 235 Watts per square meter is absorbed in the atmosphere and surface. With all that absorbed solar energy, it would seem Earth should just keep getting hotter and hotter, but we know that, on average, Earth maintains a fairly stable temperature. How does the Earth maintain this energy balance?
At the same time that the Sun’s energy heats the planet, the planet radiates energy back to space in the infrared part of the spectrum. This is electromag-netic radiation that we can’t see with our eyes. The warmer the planet gets, the more rapidly it radiates energy to space. Like an accountant keeping meticulous financial records, scientists can use satellites and other sources to accurately measure the amount of energy received from the Sun and subtract the total amount of reflected and emitted energy. When they do so, they arrive at an energy budget showing how the energy is partitioned.
The Earth’s climate is governed by the energy balance between incoming solar energy and outgoing thermal energy. If the Earth warms it also emits more radiation to space in an attempt to restore balance that the climate system has maintained for millennia. However, recent research suggests that in the last few decades, the Earth is struggling to maintain radiative balance and that more energy is coming in than is going out—hence we observe global warming.
Depicted in the diagram is a detailed accounting of Earth’s energy budget—i.e., how the 342 Watts per square meter of solar energy received is distributed to maintain balance. To complete the budget requires taking into account the role of various forcings—Earth system characteristics that
cause the energy balance to shift from its balanced state. Examples of these forcings include greenhouse gases, aerosols, and changes to the land surface.
Image adapted from J.T. Kiehl and K.E. Trenberth, 1997, Bulletin of the American Meteorological Society, 78:197-208.
Balancing the Energy Budget
Human Footprints
on theAtmosphere
The images here show two examples of the impact that human activities can have on the atmosphere, and illustrate how clouds and aerosols interact in Earth’s atmosphere.
Contrails—human-produced cirrus clouds—are one of the most visible human footprints. Every time a jet aircraft takes to the sky, it leaves a trail of exhaust in its wake. Under the right conditions a
contrail forms. Sometimes one sees individual contrails, while at other times the contrails appear as geometrical formations of crisscrossing lines. Like naturally occurring cirrus clouds, contrails are made of ice, reflect sunlight, and trap infrared radiation. Aircraft exhaust can short-circuit the normal cirrus formation process by making it easier for clouds to form. The top image shows widespread contrails over the Southeast U.S. on January 29, 2004.
Maritime traffic also leaves its footprint on the atmosphere. As ships cross the ocean, their exhaust releases tiny aerosol particles around which water droplets form, resulting in smaller and more numerous cloud droplets. The cloud reflectance increases in these small droplet size regions giving rise to bright cloud streaks in satellite imagery when the ship’s exhaust mixes with the surrounding stratiform clouds that form over the ocean. These so-called ship tracks are most common off the western coast of continents. The bottom image was obtained on a day when unusually high numbers of ship tracks were visible in the North Atlantic off the coast of France and Spain on January 27, 2003.
Data from the MODIS instrument on the Terra satelliteN100 km
France
Spain
Atlantic Ocean
Georgia
South Carolina
ArkansasMississippi
Gulf of Mexico
N100 km
Florida
North CarolinaTennessee