Embed Size (px)
Citation preview
ABCDEFG
UNIVERSITY OF OULU P .O. B 00 F I -90014 UNIVERSITY OF OULU FINLAND
A C T A U N I V E R S I T A T I S O U L U E N S I S
S E R I E S E D I T O R S
SCIENTIAE RERUM NATURALIUM
HUMANIORA
TECHNICA
MEDICA
SCIENTIAE RERUM SOCIALIUM
SCRIPTA ACADEMICA
OECONOMICA
EDITOR IN CHIEF
PUBLICATIONS EDITOR
Senior Assistant Jorma Arhippainen
University Lecturer Santeri Palviainen
Docent Hannu Heusala
Professor Olli Vuolteenaho
University Lecturer Hannu Heikkinen
Director Sinikka Eskelinen
Professor Jari Juga
Professor Olli Vuolteenaho
Publications Editor Kirsti Nurkkala
ISBN 978-952-62-0176-4 (Paperback)ISBN 978-952-62-0177-1 (PDF)ISSN 0355-3213 (Print)ISSN 1796-2226 (Online)
U N I V E R S I TAT I S O U L U E N S I SACTAC
TECHNICA
U N I V E R S I TAT I S O U L U E N S I SACTAC
TECHNICA
OULU 2013
C 456
Carlos Héracles Morais de Lima
OPPORTUNISTICRESOURCE AND NETWORK MANAGEMENT IN AUTONOMOUS PACKET ACCESS SYSTEMS
UNIVERSITY OF OULU GRADUATE SCHOOL;UNIVERSITY OF OULU,FACULTY OF TECHNOLOGY,DEPARTMENT OF COMMUNICATIONS ENGINEERING;INFOTECH OULU
C 456
ACTA
Carlos H
éracles Morais de Lim
a
C456etukansi.kesken.fm Page 1 Wednesday, June 26, 2013 11:37 AM

A C T A U N I V E R S I T A T I S O U L U E N S I SC Te c h n i c a 4 5 6
CARLOS HÉRACLES MORAIS DE LIMA
OPPORTUNISTIC RESOURCEAND NETWORK MANAGEMENTIN AUTONOMOUS PACKETACCESS SYSTEMS
Academic dissertation to be presented with the assentof the Doctoral Training Committee of Technologyand Natural Sciences of the University of Oulu forpublic defence in OP-sali (Auditorium L10), Linnanmaa,on 23 August 2013, at 12 noon
UNIVERSITY OF OULU, OULU 2013
Copyright © 2013Acta Univ. Oul. C 456, 2013
Supervised byProfessor Matti Latva-aho
Reviewed byDoctor Alberto RabbachinProfessor Mérouane Debbah
ISBN 978-952-62-0176-4 (Paperback)ISBN 978-952-62-0177-1 (PDF)
ISSN 0355-3213 (Printed)ISSN 1796-2226 (Online)
Cover DesignRaimo Ahonen
JUVENES PRINTTAMPERE 2013
OpponentProfessor Jyri Hämäläinen
Morais de Lima, Carlos Héracles, Opportunistic resource and networkmanagement in autonomous packet access systems. University of Oulu Graduate School; University of Oulu, Faculty of Technology, Department ofCommunications Engineering; Infotech OuluActa Univ. Oul. C 456, 2013University of Oulu, P.O. Box 8000, FI-90014 University of Oulu, Finland
Abstract
This thesis aims to evaluate networking aspects of autonomous packets access systems whendynamically and adaptively performing resource and network management. In this context,Quality of Service (QoS)-aware solutions for resource sharing and control (e.g., channel access,load control, interference management and routing techniques among others) in large-scalewireless networks are envisaged.
We propose and investigate distributed coordination mechanisms for controlling the co-channel interference generated in multi-tier coexistence scenarios consisting of macrocellsunderlaid with short-range small cells. The rationale behind employing such mechanism is toopportunistically reuse resources without compromising ongoing transmissions on the overlaidmacrocells, while still guaranteeing QoS in both tiers. To mitigate the resulting co-channelinterference, the underlaid tiers of small cells use distributed mechanism that relies on minimalsignaling exchange, e.g., the Time Division Duplexing (TDD)-underlay approach which is basedon regular busy tones.
Herein, stochastic geometry is used to model network deployments, while higherorderstatistics through the cumulants concept is utilized to characterize the probability distribution ofthe aggregate interference at the tagged receiver. To conduct our studies, we consider a shadowedfading channel model incorporating log-normal shadowing and Nakagami-m fading. In addition,various network algorithms, such as power control and frequency (re)allocation, are included inthe analytical framework. To evaluate the performance of the proposed solutions, we also deriveclosed-form expressions for the outage probability and average spectral efficiency with respect tothe receiver of interest under various channel conditions and network configurations.
Results show that the analytical framework matches well with numerical results obtained fromMonte Carlo simulations, and that the coordination mechanisms substantially improve theperformance of overlaid macrocell networks, while also benefiting small cells. In contrast to theuncoordinated Frequency Division Duplexing mode, the coordinated TDD-underlay solutionshows a reduction in the outage probability, while the average spectral efficiency increases at highloads. Although more elaborated interference control techniques such as, downlink bitmap anddistributed antennas systems become needed, when the density of uncoordinated small cells in theunderlaid tier gets high.
Keywords: distributed antennas systems, heterogeneous network, interferencemanagement, self-organization, stochastic geometry

Morais de Lima, Carlos Héracles, Opportunistinen resurssien ja verkon hallintaautonomisissa pakettikytkentäisissä järjestelmissä. Oulun yliopiston tutkijakoulu; Oulun yliopisto, Teknillinen tiedekunta, Tietoliikennetekniikanosasto; Infotech OuluActa Univ. Oul. C 456, 2013Oulun yliopisto, PL 8000, 90014 Oulun yliopisto
Tiivistelmä
Tämä väitöskirja pyrkii arvioimaan autonomisia pakettikytkentäisiä järjestelmiä verkon näkö-kulmasta, kun resurssien ja verkon hallinta tapahtuu dynaamisesti ja adaptiivisesti. Tässä yhtey-dessä suunnitellaan QoS-tietoisia ratkaisuja resurssien jakamiseen ja hallintaan (esim. kanavanallokointi, kuorman hallinta, häiriön käsittely ja reititystekniikat) suuren skaalan langattomiinverkkoihin.
Ehdotamme ja tutkimme hajautettuja koordinointimekanismeja monikanavien häiriöiden hal-lintaan monitasoisissa skenaarioissa, jotka koostuvat lyhyen kantaman soluista makrosoluissa.Peruste näille mekanismeille on resurssien opportunistinen uudelleenkäyttö tinkimättä käynnis-sä olevista lähetyksistä suuremmissa makrosoluissa, samalla kun QoS taataan molemman tasonlähetyksissä. Pienentääkseen aiheutuvaa monikanavahäiriöitä, alemman tason pienet solut käyt-tävät hajautettua mekanismia, kuten esimerkiksi säännöllisiin varattu-ääniin perustuvaa TimeDivision Duplexing (TDD) - mekanismia, vähällä signaalien vaihdon määrällä.
Stokastista geometriaa käytetään mallintamaan verkkoja, kun taas korkeamman tason tilastol-lista laskentaa kumulanttimenetelmän käsitteen kautta käytetään kuvaamaan kokonaishäiriöntodennäköisyysjakaumaa merkityssä vastaanottimessa. Käsittelemme varjostuvaa ja häipyvääkanavamallia sisältäen log-normaalin varjostumisen ja Nakagamim häipymisen. Lisäksi sisälly-tämme analyyttiseen työhön monenlaisia verkkoalgoritmeja tehohallintaan ja taajuuden (uudel-leen)allokointiin. Ehdotettujen ratkaisujen tehokkuuden arvioimiseksi johdamme myös suljetutmuodot katkosten todennäköisyyksille ja keskimääräiselle spektrin käytön tehokkuudelle halu-tun vastaanottimen suhteen monissa kanavatiloissa ja verkon kokoonpanoissa.
Tulokset osoittavat, että analyyttisen työn tulokset vastaavat hyvin Monte Carlo - simulaati-oilla saatujen numeeristen tulosten kanssa ja että koordinointimekanismit parantavat makrosolu-verkkojen tehokkuutta merkittävästi, samalla kun myös pienet solut hyötyvät. Toisin kuin koor-dinoimaton Frequency Division Duplexing -toimintatila, koordinoitu TDD-toimintatila pienen-tää katkosten todennäköisyyttä samalla kun keskimääräinen spektrin käytön tehokkuus kasvaasuurella kuormalla. Toisaalta kehittyneemät häiriönhallintatekniikat, kuten alalinkki bittikarttasekä hajautetut antennijärjestelmät, tulevat tarpeelliseksi, kun pienten koordinoimattomattomiensolujen tiheys kasvaa alemmalla tasolla.
Asiasanat: hajautetut antennijärjestelmät, heterogeeninen verkko, häiriönhallinta, itse-organisointi, stokastinen geometria


To my Family

8

Acknowledgements
I would like to express my sincere gratitude to my thesis advisor Prof. Matti Latva-ahofor his guidance, friendship and support during my doctoral studies, as well as forensuring us an appropriate work environment where we could develop our researchactivities and pursue our objects. Besides, I would like to extend my gratitude to thethesis commit, which is composed by Prof. Mérouane Debbah, Dr. Alberto Rabbachinand Prof. Jyri Hämäläinen, for their valuable input, suggestions and comments thatdefinitely contributed to improve the readability and accessibility of this work.
I would like to thank all my CWC colleagues for maintaining a motivationalwork environment with their friendly and supportive attitude, specially Antti Tölli,David Macagnano, Manosha Kapuruhamy, Satya Joshi, Fatih Bayramoglu, and KalleLähetkangas. It has been a great opportunity and rewarding experience to enjoy sucha multi-cultural environment and develop friendship with people from all over theworld. I also would like to thank my friends Kaveh Gaboosi, Qiang Xue, Jani Saloranta,Francesco Pantisano and Mehdi Bennis with whom I worked closely, developed greatfriendship and enjoyed entertaining moments of humor, mainly during our coffe breakswhich were so needed to overcome the natural stress of our research activities. Inparticular, I would like to thank Brett Kaufman, Giuseppe Destino, Hirley Alves andPedro Nardelli whose friendship transcended our work environment and with whomI can find not only company for entertainment, but mainly support during difficultmoments.
Foremost, I would like to thank my wife Gerlândia and son José Carlos for theirpatience, support, encouragement as well as confidence to follow me and face all thechallenges and misfortunes of dwelling on a foreign country. Equally important, Ithank my parents, Maria Salete and José Morais for their life example, unconditionallove and faith on my aspirations, as well as, my siblings, Hérica and Antônio for theirundeniable support. Naturally, I extend my gratitude to relatives and friends back homein Brazil which despite their physical distance remain close with words of support andencouragement.
9

I would like to thank the following Foundations for their initiative to support researchand promote high level education and sciences in Finland: Infotech Oulu DoctoralProgram, Nokia Foundation, Ulla Tuominen Foundation, University of Oulu Foundation,Riitta and Jorma J. Takanen Foundation.
August 2, 2013, Carlos Héracles Morais de Lima
10
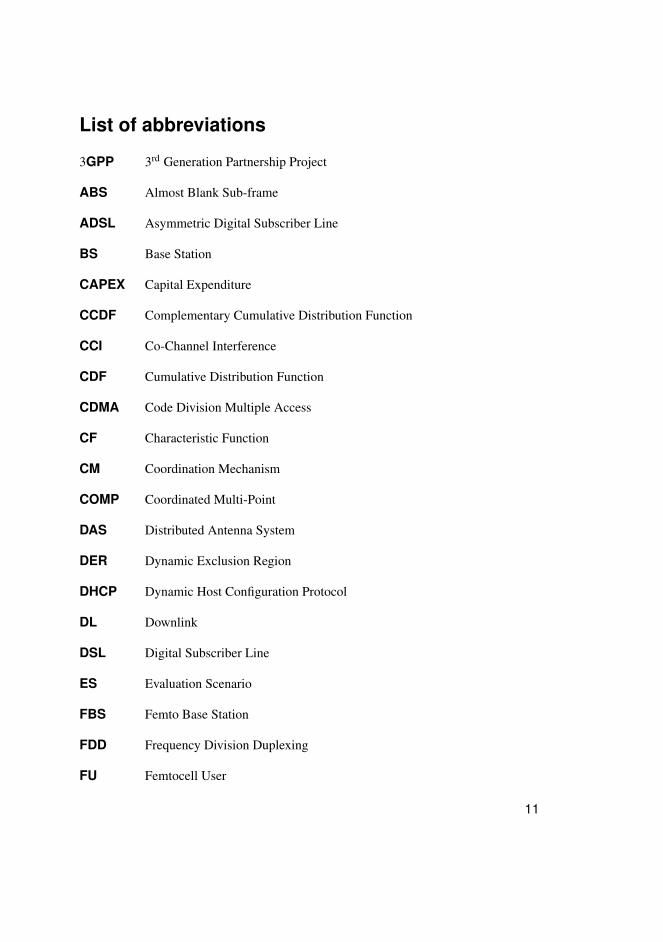
List of abbreviations
3GPP 3rd Generation Partnership Project
ABS Almost Blank Sub-frame
ADSL Asymmetric Digital Subscriber Line
BS Base Station
CAPEX Capital Expenditure
CCDF Complementary Cumulative Distribution Function
CCI Co-Channel Interference
CDF Cumulative Distribution Function
CDMA Code Division Multiple Access
CF Characteristic Function
CM Coordination Mechanism
COMP Coordinated Multi-Point
DAS Distributed Antenna System
DER Dynamic Exclusion Region
DHCP Dynamic Host Configuration Protocol
DL Downlink
DSL Digital Subscriber Line
ES Evaluation Scenario
FBS Femto Base Station
FDD Frequency Division Duplexing
FU Femtocell User
11
HII High Interference Indicator
HetNet Heteronegeous Network
ICIC Inter-Cell Interference Coordination
IMT International Mobile Telecommunications
IP Interference Profile
ITU International Telecommunication Union
LN Log-Normal
LTE Long Term Evolution
LoS Line-of-Sight
MBS Macro Base Station
MGF Moment Generating Function
MIMO Multiple-Input Multiple-Output
MPP Marked Point Process
MU Macrocell User
OPEX Operating Expenditure
PBS Pico Base Station
PC Power Control
PDF Probability Density Function
PPP Poisson Point Process
QoS Quality of Service
RAT Radio Access Technology
R&D Research & Development
REB Range Expansion Bias
12
RE Range Expansion
RNTP Relative Narrowband Transmit Power
RV Random Variable
SF Sub-Frame
SG Stochastic Geometry
SINR Signal-to-Interference plus Noise Ratio
SIR Signal-to-Interference Ratio
SLN Shifted Log-Normal
SON Self-Organizing Network
TAS Transmit Antenna Selection
TCP Transmission Control Protocol
TC Transmission Capacity
TDD Time Division Duplexing
TDMA Time Division Multiple Access
UE User Equipment
UL Uplink
i.i.d. independent and identically distributed
13

14
List of symbols
α Path loss exponent
β Minimum received power at the cell border
∆p Fixed power control step
ηk k th zero of the Hermite polynomial HK (η) of degree K
Γ Random Variable (RV) representing the Signal-to-Interference Ratio (SIR)at the tagged receiver
γth SIR detection threshold
κn (·) nth cumulant of a given RV
λk Density of small cells in the k th tier
ln (·) Logarithm to the base e
logb (·) Logarithm to the base b
O Observation region
R An arbitrary region of area A in R2
Rk k th coordination region
µ Mean value of the distribution Normal(µ, σ2)
ωk The weight associated to the k th root of the Hermite polynomial HK (η)
Ωp Mean squared-envelop
EnY [·] nth partial moment of a given RV
C Location-dependent average channel capacity
Φ Homogeneous Point Process
ψ (m) The Euler psi function
15
ΨZ (ω) Characteristic Function (CF) of a RV Z
ρth Predefined coordination threshold
σ Standard deviation of the distribution Normal(µ, σ2)
Υ1 The event that interferers detect the victim receiver’s beacon signal pbabove the predefined coordination threshold ρth
ϕ Random point belonging to the point process Φ
Φk Marked Point Process (MPP) of Base Stations (BSs) in the k th tier
Φt Thinned Point Process
ζ (2,m) The generalized Riemann zeta function
Bc Clear part of the spectrum in the partial co-channel configuration
Bs Shared part of the spectrum in the partial co-channel configuration
FX (x) Cumulative Distribution Function (CDF) of a RV X
fX (x) Probability Density Function (PDF) of a RV X
HK (·) Hermite polynomial of order K
I0 The modified Bessel function of first kind
j The imaginary unity
K Factor of the Rice distribution
l ( · ) Signal strength decay function
m Shape parameter of the Gamma distribution
p Transmit power
preq Transmit power of the requesting signal
r Separation distance to the tagged receiver
RK The remainder value of the Gauss-Hermite quadrature with the polynomialorder of K
16
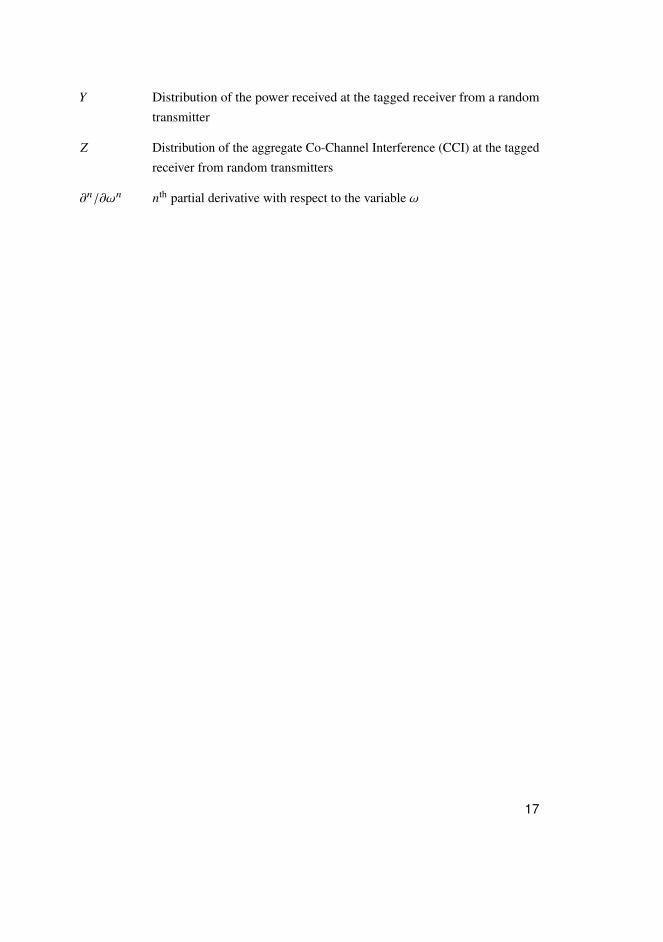
Y Distribution of the power received at the tagged receiver from a randomtransmitter
Z Distribution of the aggregate Co-Channel Interference (CCI) at the taggedreceiver from random transmitters
∂n/∂ωn nth partial derivative with respect to the variable ω
17

18
Contents
AbstractTiivistelmäAcknowledgements 9List of abbreviations 11List of symbols 15Contents 191 Introduction 23
1.1 Self-organizing networks . . . . . . . . . . . . . . . . . . . . . . . . . . . . . . . . . . . . . . . . . . . . . 24
1.2 Related work . . . . . . . . . . . . . . . . . . . . . . . . . . . . . . . . . . . . . . . . . . . . . . . . . . . . . . . . 27
1.3 Thesis objectives and outline . . . . . . . . . . . . . . . . . . . . . . . . . . . . . . . . . . . . . . . . . . 29
2 Statistical modeling and evaluation of random networks 332.1 Preliminaries of Poisson point processes . . . . . . . . . . . . . . . . . . . . . . . . . . . . . . . 35
2.2 General definitions . . . . . . . . . . . . . . . . . . . . . . . . . . . . . . . . . . . . . . . . . . . . . . . . . . . 37
2.3 Propagation channel model . . . . . . . . . . . . . . . . . . . . . . . . . . . . . . . . . . . . . . . . . . . 38
2.4 Network deployment model . . . . . . . . . . . . . . . . . . . . . . . . . . . . . . . . . . . . . . . . . . . 40
2.5 Characteristic function and cumulants . . . . . . . . . . . . . . . . . . . . . . . . . . . . . . . . . . 41
2.6 Approximating of the aggregate CCI . . . . . . . . . . . . . . . . . . . . . . . . . . . . . . . . . . . 42
2.7 Distribution of the aggregate CCI . . . . . . . . . . . . . . . . . . . . . . . . . . . . . . . . . . . . . . 44
2.7.1 Distribution of the aggregate CCI in HetNets with multipletiers of small cells . . . . . . . . . . . . . . . . . . . . . . . . . . . . . . . . . . . . . . . . . . . . . 45
2.8 Performance analysis . . . . . . . . . . . . . . . . . . . . . . . . . . . . . . . . . . . . . . . . . . . . . . . . . 45
2.8.1 SIR and outage probability . . . . . . . . . . . . . . . . . . . . . . . . . . . . . . . . . . . . . 46
2.8.2 Average spectral efficiency . . . . . . . . . . . . . . . . . . . . . . . . . . . . . . . . . . . . . 46
2.9 Numerical results . . . . . . . . . . . . . . . . . . . . . . . . . . . . . . . . . . . . . . . . . . . . . . . . . . . . 47
2.10 Summary and final remarks . . . . . . . . . . . . . . . . . . . . . . . . . . . . . . . . . . . . . . . . . . . 51
3 Coordination mechanism for interference mitigation in multi tierHetNets 533.1 Motivations and related work . . . . . . . . . . . . . . . . . . . . . . . . . . . . . . . . . . . . . . . . . 53
3.2 System model . . . . . . . . . . . . . . . . . . . . . . . . . . . . . . . . . . . . . . . . . . . . . . . . . . . . . . . 55
3.2.1 Two-tier deployment model . . . . . . . . . . . . . . . . . . . . . . . . . . . . . . . . . . . . 55
19
3.3 Coordination mechanisms . . . . . . . . . . . . . . . . . . . . . . . . . . . . . . . . . . . . . . . . . . . . 563.3.1 Discovery of victim users . . . . . . . . . . . . . . . . . . . . . . . . . . . . . . . . . . . . . . 573.3.2 Definition of coordination regions . . . . . . . . . . . . . . . . . . . . . . . . . . . . . . . 57
3.4 Macro-to-femtocell coexistence scenarios . . . . . . . . . . . . . . . . . . . . . . . . . . . . . . 613.4.1 Full interference scenario . . . . . . . . . . . . . . . . . . . . . . . . . . . . . . . . . . . . . . .613.4.2 Full interference with power control . . . . . . . . . . . . . . . . . . . . . . . . . . . . . 623.4.3 Opportunistic power control with discrete levels . . . . . . . . . . . . . . . . . . 633.4.4 DERs . . . . . . . . . . . . . . . . . . . . . . . . . . . . . . . . . . . . . . . . . . . . . . . . . . . . . . . . 643.4.5 DERs with PC . . . . . . . . . . . . . . . . . . . . . . . . . . . . . . . . . . . . . . . . . . . . . . . . 653.4.6 Approximating the aggregate CCI at the tagged MU . . . . . . . . . . . . . . 66
3.5 Femto-to-macrocell coexistence scenarios . . . . . . . . . . . . . . . . . . . . . . . . . . . . . . 693.6 Numerical Results . . . . . . . . . . . . . . . . . . . . . . . . . . . . . . . . . . . . . . . . . . . . . . . . . . . 713.7 Summary and final remarks . . . . . . . . . . . . . . . . . . . . . . . . . . . . . . . . . . . . . . . . . . . 78
4 Coordinated TDD-underlay for self-organizing femtocells in two-tiercoexistence scenarios 794.1 Motivations and related work . . . . . . . . . . . . . . . . . . . . . . . . . . . . . . . . . . . . . . . . . 794.2 System model . . . . . . . . . . . . . . . . . . . . . . . . . . . . . . . . . . . . . . . . . . . . . . . . . . . . . . . 80
4.2.1 Network deployment model . . . . . . . . . . . . . . . . . . . . . . . . . . . . . . . . . . . . 804.3 Coordinated TDD-underlay and network operation . . . . . . . . . . . . . . . . . . . . . . 81
4.3.1 Coordination mechanisms . . . . . . . . . . . . . . . . . . . . . . . . . . . . . . . . . . . . . . 814.4 Evaluation scenarios . . . . . . . . . . . . . . . . . . . . . . . . . . . . . . . . . . . . . . . . . . . . . . . . . 84
4.4.1 Uncoordinated scenarios . . . . . . . . . . . . . . . . . . . . . . . . . . . . . . . . . . . . . . . 854.4.2 Coordinated scenarios . . . . . . . . . . . . . . . . . . . . . . . . . . . . . . . . . . . . . . . . . 864.4.3 Approximating the aggregate CCI . . . . . . . . . . . . . . . . . . . . . . . . . . . . . . . 88
4.5 Numerical results . . . . . . . . . . . . . . . . . . . . . . . . . . . . . . . . . . . . . . . . . . . . . . . . . . . . 884.6 Summary and final remarks . . . . . . . . . . . . . . . . . . . . . . . . . . . . . . . . . . . . . . . . . . . 91
5 Self-organization in LTE systems and advanced techniques 935.1 Motivation and related work . . . . . . . . . . . . . . . . . . . . . . . . . . . . . . . . . . . . . . . . . . 935.2 System model . . . . . . . . . . . . . . . . . . . . . . . . . . . . . . . . . . . . . . . . . . . . . . . . . . . . . . . 94
5.2.1 Network deployment model . . . . . . . . . . . . . . . . . . . . . . . . . . . . . . . . . . . . 955.3 Biased cell association and handover probability . . . . . . . . . . . . . . . . . . . . . . . . 955.4 Network operation . . . . . . . . . . . . . . . . . . . . . . . . . . . . . . . . . . . . . . . . . . . . . . . . . . . 98
5.4.1 Almost blank sub-frame . . . . . . . . . . . . . . . . . . . . . . . . . . . . . . . . . . . . . . . . 995.4.2 Downlink–high interference indicator . . . . . . . . . . . . . . . . . . . . . . . . . . 1005.4.3 Virtual distributed antenna system. . . . . . . . . . . . . . . . . . . . . . . . . . . . . .101
20
5.5 Interference model . . . . . . . . . . . . . . . . . . . . . . . . . . . . . . . . . . . . . . . . . . . . . . . . . . 1025.5.1 Received power from the umbrella MBS . . . . . . . . . . . . . . . . . . . . . . . . 1035.5.2 Aggregate CCI from the underlaid tier of small cells . . . . . . . . . . . . . 1045.5.3 Aggregate CCI from multiple tiers . . . . . . . . . . . . . . . . . . . . . . . . . . . . . 1045.5.4 Aggregate CCI with inter-cell interference coordination . . . . . . . . . . 105
5.6 Numerical results . . . . . . . . . . . . . . . . . . . . . . . . . . . . . . . . . . . . . . . . . . . . . . . . . . . 1065.7 Summary and final remarks . . . . . . . . . . . . . . . . . . . . . . . . . . . . . . . . . . . . . . . . . . 112
6 Conclusions and final remarks 1136.1 Future work . . . . . . . . . . . . . . . . . . . . . . . . . . . . . . . . . . . . . . . . . . . . . . . . . . . . . . . . 115
References 117Appendices 127
21

22
1 Introduction
Over the past few years, the intense demand for high data rates and ubiquitous coverage,as well as the introduction of pervasive devices with high computational power haveleveraged a significant paradigm shift in wireless communications regarding theirdesign, deployment and operation. The traditional centralized and homogeneousstructure of cellular systems has gradually changed to a more dynamic, heterogeneousand infrastructureless configuration in which legacy cellular systems and large scaledeployments of low-power short-range access points coexist in an distributed manner[1, 2]. Equally important, as observed by Authors in [3], even simple administrativetasks become expensive or impractical in these highly dynamic deployments, so thatnew operational methods that minimize the need for (re) configuration with humanintervention are of primary interest. As a result of this process, not only the deploymentand operation of upcoming networks has evolved, but also the previously establishedand widely accepted methods to evaluate how these systems perform have to be updatedaccordingly [2, 4].
The International Telecommunication Union (ITU) radio communication sectorissued the International Mobile Telecommunications (IMT) advanced requirements forthe next generation of mobile phone and internet access services: downlink data ratesof up to 100 Mb/s and 1 Gb/s for mobile and nomadic users, respectively. During thestandardization process of Long Term Evolution (LTE)-Advanced (Release 10), the3rd Generation Partnership Project (3GPP) identified several advanced techniques tomeet such stringent requirements [5]. For instance, carrier aggregation, Downlink (DL)spatial multiplexing using up to eight-layer Multiple-Input Multiple-Output (MIMO),DL intracell Coordinated Multi-Point (COMP) transmission and reception (to mitigateoutages at cell border), Uplink (UL) Spatial Multiplexing using four-layer MIMO.Unfortunately, the above solutions do not provide significant improvements and may notbe always effective, mainly under low Signal-to-Interference plus Noise Ratio (SINR)regime due to the radio channel impairments and Co-Channel Interference (CCI). Thus,Heteronegeous Networks (HetNets) emerged as a viable solution to satisfy the relentlesstraffic demands of upcoming networks in a cost effective manner [6]. Bearing that inmind, this thesis first defines a comprehensive analytical framework and then assess thefeasibility of these self-organizing HetNets in various deployment scenarios.
23
1.1 Self-organizing networks
The ever increasing popularity of pervasive devices, such as smart phones and tablets,has imposed high traffic demand on current and upcoming wireless systems [7]. Usersrelentlessly consume cloud-based services (remote applications, data storage and videosharing) as well as expect seamless connection and high-quality experience. To keep upwith these stringent requirements, next generation wireless systems need to ensure highspectral efficiency with ubiquitous coverage and fairness at cell border. Unfortunately,legacy cellular systems with their rigid infra-structure and centralized coordination fallshort.
Operators have indeed very few options available to meet such requirements: (i)increase the density of macrocell sites, but that hinges on regulatory constraints, thenecessary Capital Expenditure (CAPEX), and the rollout time to deploy new sites;(ii) upgrade the Radio Access Technology (RAT) but that need long Research &Development (R&D) cycles and may not fill the capacity gap completely; or (iii) expandthe radio frequency resources, though spectrum auctions are definitely very expensiveand lingering alternative. In this unfavorable scenario, multi-tier HetNets with very largedeployment of small cells emerges as an enabling concept of the future wireless systems.
In this contribution, we investigate the feasibility of deploying such HetNets tomeet the strict requirements of the next generation of LTE systems [8]. Herein, HetNetsintegrate legacy macrocells with underlaid small cells and inherit their complementaryfeatures [6, 9]. Based on the 3GPP specifications, we construct HetNet structures bydeploying base stations in three distinct levels: femtocells which are characterized byvery low transmit power at 24 dBm and unplanned deployment, picocell which aremainly deployed at hot spot areas and operate in the range of 24 dBm to 33 dBm, andtraditional macrocells which are deployed in regular manner and have large coveragewith transmit power up to 46 dBm [8]. In this way, Base Stations (BSs) of varioustypes populate multi-tier hierarchical deployments and share the common air interface(single carrier usage) wherein CCI management becomes critical for reducing theresulting interference across tiers. We consider a single-Radio Access Technology (RAT)multi-tier architecture (based on LTE specifications) wherein BSs use various channelaccess policies and backhaul architectures to communicate. Fig. 1 illustrates a multi-tierdeployment in which macrocells are underlaid with pico- and femtocells [10]. In thescenarios under study, macrocells ensure coverage over large areas, support high mobilityusers and reduce handover attempts. Picocells are tailored to smaller and high density
24
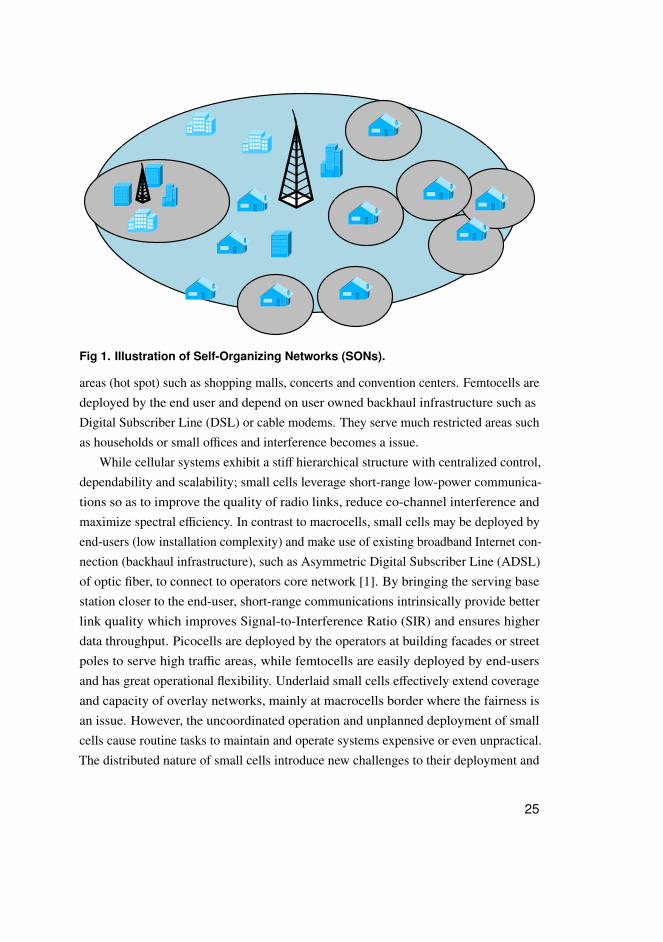
Fig 1. Illustration of Self-Organizing Networks (SONs).
areas (hot spot) such as shopping malls, concerts and convention centers. Femtocells aredeployed by the end user and depend on user owned backhaul infrastructure such asDigital Subscriber Line (DSL) or cable modems. They serve much restricted areas suchas households or small offices and interference becomes a issue.
While cellular systems exhibit a stiff hierarchical structure with centralized control,dependability and scalability; small cells leverage short-range low-power communica-tions so as to improve the quality of radio links, reduce co-channel interference andmaximize spectral efficiency. In contrast to macrocells, small cells may be deployed byend-users (low installation complexity) and make use of existing broadband Internet con-nection (backhaul infrastructure), such as Asymmetric Digital Subscriber Line (ADSL)of optic fiber, to connect to operators core network [1]. By bringing the serving basestation closer to the end-user, short-range communications intrinsically provide betterlink quality which improves Signal-to-Interference Ratio (SIR) and ensures higherdata throughput. Picocells are deployed by the operators at building facades or streetpoles to serve high traffic areas, while femtocells are easily deployed by end-usersand has great operational flexibility. Underlaid small cells effectively extend coverageand capacity of overlay networks, mainly at macrocells border where the fairness isan issue. However, the uncoordinated operation and unplanned deployment of smallcells cause routine tasks to maintain and operate systems expensive or even unpractical.The distributed nature of small cells introduce new challenges to their deployment and
25
operation. Several practical issues which are tackled in this works still hinders theviability of HetNet deployments. The harsh CCI that arise from their uncoordinatedoperation is the main problem to undertake.
To reduce Operating Expenditure (OPEX), self-organization plays a determinantrole by reducing human intervention and quickly coordinating inter-cell operation andadapting to network dynamics and channel impairments. Bell Labs found savingsof about 20% CAPEX and 50% OPEX by employing SONs [11]. Self-organizationplays a determinant role to make HetNets a viable solution, since it provides thefoundation to achieve overall system organization, even though constituent parts workindependently. In fact, self-organization is a much more pervasive phenomena whichappears in natural systems and human interactions. For instance, a school of fishes thatswim in a coordinated manner, or a flock of migratory birds that travel together intoformation. It is possible to identify a set of desirable properties which become prominentacross self-organizing structures. First, the emergent behavior whereby sophisticatedorganization of the overall system is achieved when participants organize themselves byinteracting directly and reacting to changes in their local environments without centralcoordination [3, 12]. And yet self-organizing systems exhibit adaptability to adapt inresponse to system and environmental changes; robustness against failure and damage;and, equally important, scalability whereby the systems stays functional by consideringa very large number of constituent entities.
Despite these principles being commonplace in several areas, telecommunicationsdid not exploit their potential in depth so far. In computer networks, self-organizationprinciples are used to minimize configuration and human intervention facilitating networkoperation and maintenance, and allows for totally decentralized operation: dynamicacquisition of Interference Profile (IP) addresses with Dynamic Host ConfigurationProtocol (DHCP) and autonomous back off with Transmission Control Protocol (TCP).In this contribution self-organization principles are used to established distributedstrategies by which network entities coordinate based on local side-information sothat the overall network operation and performance are improved. Herein, we devisesolutions based on the self-organization concept and on the general guideline that localbehavior rules that achieve global properties.
26
1.2 Related work
In order to tap into the full benefits of large-scale SONs, a number of challenges stillneed to be tackled, including their deployment, operation, automation and maintenance[3, 12]. The design and implementation of self-organizing functionalities in HetNetsis a topic of significant interest as evidenced by the number of recent publications[1, 3, 4, 13–16]. As aforesaid, the CCI generated by standalone small cells can severelycompromise the communication of both tiers [17, 18]. A motive is that small cellsare often deployed by the end-users in an unplanned manner and, as a result, lack anypredefined infrastructure [19]. To further exacerbate this situation, small cells are notnecessarily networked and may operate in a totally uncoordinated fashion. Thus, itbecomes crucial to tackle the interference problem to make multi-tier networks a viablesolution [17, 20].
Since standalone small cells operate independently of the overlaid macrocell network,and of others, conventional (predetermined and centralized) interference managementsolutions like traditional network planning and optimization, are only partially applicableand do not fully exploit variations over time and space [21]. For instance, the dedicatedchannel assignment in [22] provides a straightforward approach to cope with thisuncoordinated interference by simply dividing the whole spectrum in orthogonalfrequency bands and then allocating chunks to each tier such that they do not overlap.Unfortunately, in dense HetNets deployments, each small cell allocates a very limitedbandwidth which severely compromises the achievable performance. Although thedecentralized allocation of radio resources is identified as a promising solution in severalrecent publications [23–27], its implementation still constitutes a technical challengedue to its inherent synchronization and signaling exchange issues. Lópes-Pérez et al.
in [17] have discussed self-configuration and self-optimization concepts as feasibletechnologies to allow femtocells to sense changes and adapt their parameters accordingly.Along the same lines, Rangan in [18] proposes a distributed solution in which femtocellsselect their transmit powers so as to control their aggregate interference at the taggedreceiver, while still maximizing their throughput. Actually, the author addresses theinterference problem in a way similar to ours, by studying the combined effect of powercontrol and spectrum (re)partitioning for interference avoidance.
In [28], the busy tone concept is used to devise an adaptive technique to mitigateinter-cellular interference in Time Division Duplexing (TDD) networks using TimeDivision Multiple Access (TDMA) scheme. Furthermore, authors in [29] first identify
27
the CCI as the key challenge for uncoordinated communication in wireless networks, andthen use what is called busy burst to establish exclusion regions around receivers in orderto avoid conflicting allocations. As an alternative to the typical spectrum partitioningsolutions, the TDD-underlay concept is proposed in [30] to take advantage of thenatural traffic asymmetry between the DL and UL, as well as the user spatial diversity.The TDD-underlay concept incorporates a distributed mechanism which dynamicallycoordinates inter-cell time-slot allocation to avoid strong interference from nearbyconflicting transmitters [18, 28]. Time-multiplexed communicating links operating inuniversal frequency reuse are still exposed to the CCI generated by dominant interfererstransmitting in an uncoordinated manner.
In [21], the self-organization concept is used to devise cognitive radio resourcemanagement schemes to mitigate cross-tier interference and guarantee users Qualityof Service (QoS) in distinct heterogeneous deployments scenarios. Traditionally,such cognitive solutions are used to enable unlicensed users (secondary system) todynamically share the spectrum with the primary system. The motivations are twofold:(i) the unceasing demand for radio spectrum and (ii) the inefficient usage of the licensedbands by primary systems over time and space as evidenced in [31]. In such systems, theaccurate detection of free space, i.e, transmission opportunities, is crucial to avoid extrainterference to the primary system. In [32], Authors develop a stochastic frameworkto show that the aggregate interference in spectrum sensing cognitive networks ischaracterized by the radio channel, as well as the transmit power, sensitivity and densityof cognitive radios. The opportunistic spectrum usage is also investigated in [33],wherein it is shown that the harmful interference generated by secondary radios dependson the cognitive solution to accurately detect and rapidly react to varying spectrumusage.
Lately, the small cell concept emerge as promising, cost-effective approach to tacklethe stringent requirements of the next generation of wireless systems by providingunprecedented spectrum efficiency and coverage. However, small cells are randomlyinstalled by end-users and lack predefined infrastructure (unplanned deployment) aswell as operate in an uncoordinated and decentralized manner. As a result, small cellnetworks cause severe interference towards the legacy cellular systems (primary) andcompromise the overall network sustainability. Then, it comes with no surprise thatthe concept of cognitive radios is applicable to small cells deployments as well. Forinstance, Quek et al. propose a cognitive hybrid division duplex scheme whereby themacrocell tier performs Frequency Division Duplexing (FDD) in a pair of frequency
28
bands, while the underlaid tier of cognitive small cells simultaneously operate in TDDon the same bands [34].
More recently, the Range Expansion Bias (REB) concept is discussed within 3GPPas a baseline solution to boost the offloading potential of heterogeneous deployments.In that regard, Authors in [35] investigate the cell range expansion and interferencemitigation in heterogeneous networks. Following the same lines, Güvenç instigates thecapacity and fairness of heterogeneous networks with range expansion and interferencecoordination [13]. In [16], Jo et al. use the Stochastic Geometry (SG) framework toassess how the biased cell association procedure performs in heterogeneous networks bymeans of the outage probability.
Hereafter, we present our contributions in the perspective of the available solutions.We recall that the (re) use of spectral resources to achieve high data rates bringsabout harsh CCI, which is doubtlessly a critical source of degradation in interference-limited scenarios and largely depends on the local interactions among communicatingnodes and their relative disposition [20]. In such systems, to cope with interference,accurate models are also needed during the several stages of the design, developmentand deployment of protocols and algorithms. Equally important, new investigativetechniques which capture the dynamics and distributed nature of such systems areintroduced so as to properly identify problems and provide reliable figures-of-merit ofthe achievable performance.
1.3 Thesis objectives and outline
The objective in this thesis is to appropriately represent multi-tier HetNets usingstatistical tools such as stochastic geometry and higher order statistics, as well aseffectively devise self-organizing solutions to cope with their unplanned deployment anduncoordinated operation in a distributed manner. The results presented in this thesisare contemplated in three journal papers [36–38] and conference papers [39–42]. Theframework introduced herein is also used to analyze the performance of relay selectionalgorithms and multi-hop network routing in [43–47].
As discussed in [4], computer simulations used to be the typical approach toevaluate the performance of cellular systems owing to their regular infrastructure.Unfortunately, it becomes significantly more complex to model the irregularity oflarge-scale HetNets and evaluate their performance through simulations [48]. In theheterogeneous scenarios under consideration, legacy cellular systems coexist with
29
several tiers of small cells which are deployed without any predefine infra structure andexhibit distinct communication capabilities such as transmit power, antenna structure andbackhaul capability. Recently, stochastic geometry and the concept of random patternshave been used to represent the spatial interactions between communicating nodeswith great success. With this analytical approach, models are surprisingly tractable andclosely captures the main performance trends of HetNets [10, 49, 50].
By employing the stochastic geometry principles, we initially construct practicalnetwork deployment models and establish an analytical framework in Chapter 2 so as toassess the performance of HetNets consisting of legacy macrocells underlaid with tiersof self-organizing small cells. The Evaluation Scenarios (ESs) are defined by configuringnetwork parameters across tiers, for example density of transmitters, transmit power,scheduling policy and SIR threshold (QoS requirement) among others. This frameworkconsider multi-tier deployments of HetNets wherein femto-, pico- and legacy macrocellscoexist in a self-organizing framework. Higher order statistics are used through thecumulants concept to recover the distributions of the power received from the transmitterof interest and aggregate interference. The impact of the Radio Channel impairmentson the transmission of the user of interest and interfering links is captured as well.Thereafter, self-organization principles are applied to the HetNets under study in orderto devise distributed strategies to partition the meager radio resources across tiers andmanage the resulting interference.
In Chapter 3, Coordination Mechanisms (CMs) are implemented to reduce theuncoordinated interference from the underlaid tier of small cells. The CMs are distributedstrategies to control the co-channel interference generated by standalone femtocells intwo-tier coexistence scenarios consisting of macrocells underlaid with short-range smallcells. The rationale behind employing such mechanism is to opportunistically reuseresources without compromising ongoing transmissions on the overlaid macrocell, whilestill guaranteeing QoS in both tiers. Interference Avoidance Techniques are also used inconjunction with the CMs so as to improve the performance of the scenarios under study[51].
The concept of TDD is investigated in Chapter 4 as an alternative to underlay short-range femtocells on the Uplink of legacy macrocell deployments. The TDD-underlaystrategy takes advantage of the natural spatial diversity of users locations as well as thetraffic asymmetry between the DL and UL of cellular systems. To mitigate the resultingco-channel interference, the underlaid femtocell tier uses a distributed mechanism whichis based on regular busy tones and relies on minimal signaling exchange.
30
In Chapter 5, Range Expansion Bias is employed to improve spatial reuse and balanceload between tiers of the heterogeneous scenarios under study. Almost Blank Sub-frame(ABS) is also considered as the baseline Inter-Cell Interference Coordination (ICIC)technique to cope with the resulting CCI. Thereafter, a soft bitmap indicator, similar tothe DL-High Interference Indicator (HII), is used to identify the dominant interferersand improve the SIR at the receiver of interest. We then investigate the concept of virtualDistributed Antenna System (DAS) which is yet another self-organization solutionto mitigate interference and improve the received signal at the receiver of interest.In Chapter 6 we draw general conclusions, make our final remarks and provide ourperspective about futures directions to enhance the proposed self-organizing solutions.
31

32
2 Statistical modeling and evaluation ofrandom networks
Aiming at properly modeling and evaluating the performance of Heteronegeous Networks(HetNets), a mathematical framework based on stochastic geometry is introduced.Traditionally, simulations are the common approach to model and evaluate cellularsystems in which homogeneous Base Stations (BSs) are deployed in predefined locationsover a regular hexagonal grid. Conversely, multi-tier HetNets exhibit irregular structureswith intricate network dynamics so that accurate simulations become a complicated taskor even impractical. In that regard, random spatial models offer a tractable approachwhich closely captures the operational trends and achievable performance of HetNets.Generally speaking, spatial point processes are a natural approach to model and analyzerandom point patterns. For instance, point processes are used in statistical ecology tomodel locations of trees and bird nests, in astrostatistics to study the relative dispositionof stars and galaxies, in stereology to provide spatial interpretations of planar sectionsof materials and tissues, and in wireless systems to account for effect of the randomdistribution of communicating nodes in the network performance [52–56].
Lately, stochastic geometry principles have been used to address several openproblems in wireless communicating systems. To begin, Authors in [57] addressthe multihop transmission problem in direct-sequence spread spectrum packet radionetworks by modeling interferers as a random Poisson field and then deriving theoptimum transmission range as a function of the processing gain, the backgroundnoise power spectral density, and the degree of error-correction coding. In similarCode Division Multiple Access (CDMA) networks, stochastic geometry is used inconjunction with the queueing theory to model spatial traffic patterns, recover thedistribution of the aggregate interference and evaluate the system performance in termsof the outage probability [58]. The performance trends of spectrum sharing schemes inCDMA systems are investigated in [59] using Poisson field of interferers and recoveringthe outage probability with respect to the tagged receiver.
In the context of multihop ad-hoc networks, Baccelli et al. use mathematical toolsstemming from stochastic geometry to identify a tradeoff between the spatial densityof communications and the range of each transmission [60]. The Poisson shot noisefield theory is also used in [61] to establish the “Opportunistic Aloha” protocol which
33
– instead of tossing a coin – evaluates the channel quality of active links and selectsthe stations with good channels conditions to transmit next. The stochastic theory isalso used in the context of cognitive radio networks. For instance, the benefits of ofemploying spectrum sensing are assessed in [32] by modeling the secondary tier asa homogeneous spatial Poisson point process and then characterizing the aggregateinterference at the primary user for distinct sensing policies and radio channel conditions.
When modeling random access networks, terminals are typically scattered over thedeployment area following a known random process which matches well the physicalphenomena and leads to analytically tractable results [62]. In wireless networks whereinno interferer dominates, the central limit theorem applies and the Gaussian randomprocess is commonly used to model the aggregate interference [62]. However, indeployment scenarios with dominant interferers, the central limit theorem is violatedand the density function of the aggregate interference exhibits heavy tail. As discussedin [20], if we assume nodes to be distributed in the plane according to a homogeneousPoisson Point Process (PPP) as well as the interference components at the receiver ofinterest to follow a distance dependent attenuation function and sum incoherently; then,the aggregate interference can be modeled as a shot noise process whose distributionfollows a α-stable.
In fact, the stable distributions are heavy-tailed and generalize the Gaussian distri-bution. Symmetric α-stable distributions are introduced as a convenient formulationto model the aggregate interference of a large number of terminals distributed in theplane according to a Poisson point process (Non-Gaussian Random Processes) [63].In [62], Win et. al consider random networks where nodes are scattered followinga 2 dimensional Poisson process and the propagation effects (multipath fading andshadowing) follow a spherically symmetric distribution. Therein, it is shown that thedistribution of the aggregate interference amplitude has a symmetric stable distribution(skewness parameter equal to zero), while the distribution of the aggregate interfer-ence power follows a skewed stable distribution. Similarly, Pinto et al. work withan analytical framework which models the interference distribution generated by aPoisson field of interferers using skewed stable distributions in [64, 65]. In addition,the channel capacity of the tagged link when subject to both network interference andnoise is characterized and the concept of spectrum outage probability is introducedto characterize the aggregate interference from combined radio-frequency emissionsgenerated in a wireless network. The opportunistic spectrum access is also studied in[33] where the aggregate interference at the primary user is modeled using the theory of
34
truncated-stable distributions which constitute and alternative statistical model to theaggregate interference in more realistic scenarios.
Weber et al. introduced the Transmission Capacity (TC) metric [66] as the productof the maximum spatial density of successful transmissions given an outage constraint,and evaluate the performance of ad hoc networks under various configuration parameters:Power Control (PC) in narrowband fading scenarios [67], fractional PC in decentralizedwireless networks [68], and successive interference cancellation [69]. Along thesame lines, Authors compare the successive interference cancellation against the jointdetection using the TC framework in [70]. In a series of papers Andrews et al. assessedthe performance of two-tier HetNets [71] under various network configurations. TheAuthors develop an interference avoidance strategy for the Uplink (UL) of two-tierfemtocell networks and then analyze the resulting system capacity using TC metric [50].The spectrum sharing problem is revisited in [10, 72]. And yet Distributed AntennaSystem (DAS) with random layout and distinct antenna selection schemes are addressedin [73], as well as how to improve coverage in multi-antenna two-tier networks [74].
In [75], Stüber emphasizes that the system performance depends on the assumptionsmade about the receiver front-end and propagation environment. The shadowed fadingscenario with multipath fading superimposed on shadowing is typically encountered indense urban areas (congested downtown) with stationary or slow moving terminals[75, 76]. In these scenarios, it is quite convenient to model the radio channel asa composite distribution of the squared envelope due to Nakagami-m fading andLog-Normal (LN) shadowing. Indeed, the Nakagami-m distribution is mathematicallytractable and can closely approximate a Rice distribution in Line-of-Sight (LoS)scenarios. Herein, stochastic geometry is used to model coexistence scenarios whereinlegacy macrocell sites are underlaid with multiple tiers of self-organizing small cells andincorporating the shadowed fading channel as random marks independent of independentof nodes positions [77]. In preparation for the description and performance analysis ofthe proposed solutions, we first present our assumptions, make definitions and introducea benchmark scenario to carry out derivations.
2.1 Preliminaries of Poisson point processes
In this section we introduce mathematical tools from the stochastic geometry theorywhich are needed to develop our framework in the subsequent sections. To begin with,the spatial Poisson process is defined as [52].
35
Definition 1. (Spatial Poisson process) A spatial Poisson process with uniform intensity
λ > 0, is a point process in R2 such that: (i) for every bounded closet set B, the count
N (B) =∑ϕ∈Φ 1B (ϕ) follows a Poisson distribution with mean given by λλ2 (B),
where λ2 (·) yields the Lebesgue measure and the indicator function 1B (ϕ) is defined as
1B (ϕ) =
1, if ϕ ∈ B ,
0, otherwise;(1)
and (ii) if B1 . . .Bk are disjoint regions, then N (B1) , . . . , N (Bk ) are independent.
In this thesis, we are interested in homogeneous Poisson processes where λ is aconstant. A homogeneous random process exhibit stochastic properties which areunchanged under translation or rotation of S [78].
Equally important, the concept of a “typical” node of the process is central toderive our performance metrics and requires calculating event probabilities conditionalon having a point of the process at a specific position. Generally speaking, thetypical node is selected following a procedure whereby any other point of the processis selected with equal probability. For instance, by employing the concept of atypical node one computes the nearest-neighbor distance distribution which yields thedistance from a point of the process Φ to the nearest other point of the same process,i.e., Pr
[dist (ϕ,Φ\ϕ) ≤ r |ϕ ∈ Φ
], where \ denotes the set exclusion operator. The
Slivnyak’s theorem is actually used to formalize this notion of assuming a point of theprocess dwelling in an arbitrary location [79].
Theorem 1. Consider that the Poisson point process Φ has property Y and that it
contains a point at ϕ; then,
Pr[Φ has propertyY | ϕ
]= Pr
[Φ ∪ ϕ has propertyY | ϕ
], (2)
Proof. See [80, Section 4.4]
Intuitively, (2) suggests that the Palm distribution for a stationary Poisson pointprocess corresponds to that of the original process together with an adjoined point inϕ. The Palm probability is then used to compute the distribution conditional on thepresence of this typical node [80].
In addition, the Campbell theorem allows us to compute summations of the form∑ϕ∈Φ f (ϕ), where f (·) is a real-valued function on the state space of the arbitrary
Poisson process Φ.
36
Theorem 2. Consider a spatial Poisson process Φ on space S ⊂ R2 with mean measure
µ and a measurable function f : S → R. Then, the sum∑ϕ∈Φ f (ϕ) is absolutely
convergent with probability if and only if∫S
min[| f (x) |, 1
]µ (dx) < ∞. And if the
above condition holds, we have
E[eθ
∑ϕ∈Φ f(ϕ)
]= exp
∫S
[eθ f (x) − 1
]µ (dx)
, (3)
for any real or complex θ.
Proof. See [78, Section 3.2]
This theorem is useful to compute the mean values of point process characteristicsand statistical estimators. From (3), we obtain the characteristic function of the randomprocess Φ by setting θ = −1 and f (ϕ) ≥ 0 [78],
E[e−
∑ϕ∈Φ f(ϕ)
]= exp
−
∫S
[1 − e− f (x)
]µ (dx)
. (4)
The Marked Poisson point process Φ is another important concept that needs to beformalized as well.
Definition 2. (Marked point process) A Marked Point Process (MPP) on the space S ⊂
R2 with marks on a spaceM is a point process Φ onS×M such that NΦ
(K × M) < ∞almost surely for all compact set K ⊂ S. In other words, the projected process of points
without marks is locally finite.
Generally speaking, it corresponds to labeling every point of the original processwith additional information denoted “marks”. Formally, a marked point corresponds to apair (ϕ,m) where ϕ ∈ Φ and m is its respective mark.
2.2 General definitions
Definition 3. (Tagged receiver) The user of interest who is taken as the reference to
compute the aggregate Co-Channel Interference (CCI) and the respective performance
metrics. The Slivnyak’s theorem [78, 80] is used to obtain average performance
quantities conditional on the presence of the “tagged” receiver at the origin. In other
words, Palm distributions and the related Campbell’s theorem are used to characterize a
37
random pattern with respect to a typical point of the process, so that network-wide
performance metrics can be characterized by the average behavior of this tagged node
[52, 56].
Definition 4. (Observation region) An annular region around the tagged receiver over
which we account for the aggregate interference. The observation region is denoted by
O and defined by the minimum and maximum radii Rm and RM , respectively.
Definition 5. (Partial moment of a random variable) Let Y be a continuous Ran-
dom Variable (RV) with Probability Density Function (PDF) given by fY (y); then,
EnY
[ym , yM
]=
∫ yM
ymyn fY (y) dy denotes its nth partial moment with ym and yM indi-
cating the lower and upper integration limits, respectively.
After making the above definitions, we can introduce the system models whichare used throughout this thesis, namely the propagation radio channel along with thenetwork deployment model.
2.3 Propagation channel model
Radio links are degraded by deterministic path loss and shadowed fading, which isassumed to be independent over distinct network entities and positions. The shadowedfading consists of small- and large-scale fading which are mutually independent andmultiplicative phenomena of the wireless radio channels [20, 63, 81]. The path lossrepresents the attenuations suffered by a signal (electromagnetic wave) traveling fromthe transmitter to the receiver and depends on frequency, antenna height, relative distancebetween peers and topography. Large-scale fading is a random manifestation cased byprominent obstructions (in comparison to the carrier wavelength) of the terrain such asbuildings, hills, walls, towers, billboards, etc.. Experimental observations have shownthat this effect follows a LN distribution and make the local mean to vary slowly overdistances of several tens of wavelengths. Small-scale fading is caused by the signalpropagating through multiple paths. As a result, multiple replicas of the transmittedsignal combine either in constructive or destructive manner at the receiver front-endwhat causing high envelop fluctuations [82, 83].
38
Here, we describe the path loss attenuation by means of an unbounded path lossmodel with signal strength decay function r−α , where α is the path loss exponent –a minimal separation distance of 1 m between communicating pairs so as to avoidthe unbounded path loss model singularity at 0 [84]. The shadowed fading modelcombines the random effects of the LN shadowing and Nakagami-m fading. Thereceived squared-envelop due to multi-path fading and shadowing is represented by aRV X ∈ R+ with Cumulative Distribution Function (CDF) and PDF denoted by FX (x)and fX (x), respectively.
An arbitrary interferer disrupts the communication of the tagged receiver with acomponent given by
Y = p r−α x , (5)
where p yields this interferer transmitted power, r is the separation distance from itsposition to the tagged receiver, and x yields the corresponding shadowed fading.
We consider LoS scenarios with a dominant multipath component or specularcondition. In these scenarios, the magnitude of the received complex envelop at any timehas Rician distribution [75] whose PDF includes the modified Bessel function I0 [85].To model this radio propagation environment, we use the Nakagami-m fading which ismathematically convenient and closely approximate the Rician distribution. In fact,there is a direct relation between the Rice factor K and the Nakagami shape factor m.
K ≈√
m2 − m + m − 1. (6)
The composite distribution of the received squared-envelop due to the shadowed fadinghas a Gamma-LN distribution with PDF [75],
fX (x) =
∞∫0
(mω
)m xm−1
Γ(m)exp
(−
mω
x)
ξ√
2πσωexp
−(ξ lnω − µΩp
)2
2σ2Ωp
dω, (7)
where m is the shape parameter of the Gamma distribution, ξ = ln (10) /10, Ωp isthe mean squared-envelop, µΩp
and σΩpis the mean and standard deviation of Ωp ,
respectively.Ho et al. show in [86] that a composite Gamma–LN distribution can be approximated
by a single LN distribution with location and scale parameters (in logarithmic scale)given by
µdB = ξ[ψ (m) − ln (m)
]+ µΩp
, (8)
39
σ2dB = ξ2ζ (2,m) + σ2
Ωp, (9)
where ψ (m) is the Euler psi function and ζ (2,m) is the generalized Riemann zetafunction [85]. In what follows, we use this single LN approximation to characterize theradio channel attenuations in various evaluation scenarios.
2.4 Network deployment model
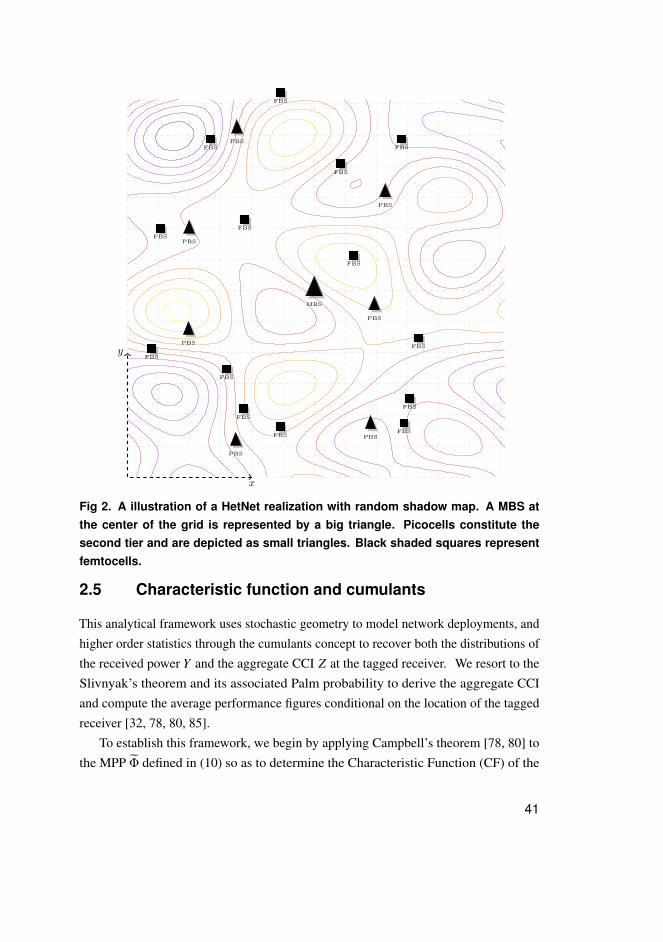
A HetNet consisting of umbrella Macro Base Stations (MBSs) and underlaid tiersof self-organizing small cells is modeled. We assume that MBSs follow centralizedcoordination and spectrum allocation such that inter macrocell interference is mitigated,for example, using fractional frequency reuse [15]. In these scenarios, small cellsare uniformly scattered over the network area. In every transmission interval, eachserving BS schedules a single user terminal. The set of associated user terminals arealso uniformly distributed within the transmission range of their serving cells. Nodescommunicate using antennas with omni directional radiation pattern and fixed power.The macrocell tier transmits at a maximum power of 46 dBm, picocells use 30 dBm andfemtocells at 24 dBm. Fig. 2 shows a realization of the network deployment wheremacrocells are underlaid with two tiers small cells.
In this network configuration, positions of small cells in the k th tier constitute ahomogeneous PPP Φk with density λk in R2. The number of small cells belongingto the k th tier in an arbitrary region R of area A is a Poisson RV with parameter λk A
[78]. Additionally, the fading effect is incorporated into the model as a random markassociated with each point of Φk . By virtue of the Marking theorem [52, 78], theresulting process,
Φk = (ϕk , x) ; ϕk ∈ Φk , (10)
corresponds to a MPP on the product space R2 × R+ with intensity λk fX (x) [78],whose random points ϕ represent transmitters locations and belong to the stationarypoint process Φk . It is worth noticing that a MPP Φk as defined above is also aPoisson process, since each point of the original process Φk is marked independentlyof the others Similarly, Baccelli et al. use a MPP to represent the multidimensionaldependence between radio links, medium access protocol, Signal-to-InterferenceRatio (SIR) threshold and channel impairments [61, 87]. In the following, we combinethe above system models to represent particular network configurations as well asaddress specific problems regarding their operation and interoperability between tiers.
40
x
y
MBS
PBS
FBS
FBS
PBS
FBS
FBS
PBS
FBS
FBS
PBS
FBS
FBS
PBS
FBS
FBS
PBS
FBS
FBS
PBSFBS
FBS
Fig 2. A illustration of a HetNet realization with random shadow map. A MBS atthe center of the grid is represented by a big triangle. Picocells constitute thesecond tier and are depicted as small triangles. Black shaded squares representfemtocells.
2.5 Characteristic function and cumulants
This analytical framework uses stochastic geometry to model network deployments, andhigher order statistics through the cumulants concept to recover both the distributions ofthe received power Y and the aggregate CCI Z at the tagged receiver. We resort to theSlivnyak’s theorem and its associated Palm probability to derive the aggregate CCIand compute the average performance figures conditional on the location of the taggedreceiver [32, 78, 80, 85].
To establish this framework, we begin by applying Campbell’s theorem [78, 80] tothe MPP Φ defined in (10) so as to determine the Characteristic Function (CF) of the
41
distribution of the aggregate CCI. Hereafter, there is no loss of generality in assumingonly one tier of small cells to derive the statistics of the aggregate CCI.
Definition 6. Let Z =∑
(ϕ,x)∈Φ Y be a RV representing the aggregate CCI generated
by the interfering process Φ, and j =√−1 be the imaginary unity; then, the function
Ψ : R→ C defined as,
ΨZ (ω) = E[e jωZ
], (11)
is called the CF of Z.
As observed in [88], the CF corresponds to the Fourier transform of the PDF of theRV Z .
As observed by Resnik et al. in [89], the fact that the CF always exist poses as itsmain advantage. The nth cumulant is obtained by computing higher order derivatives of(11) as presented in our next proposition [85].
Proposition 1. Let Z be a RV, ΨZ (ω) its CF, and n ∈ N. Provided that the nth moment
exists and is finite. Then, ΨZ (ω) is differentiable n times and
κn =1jn
[∂n
∂ωnlnΨZ (ω)
]ω=0. (12)
Proof. See [89, Section 9.4].
2.6 Approximating of the aggregate CCI
The total interference perceived by the tagged receiver is the result of the summationof independent LN RVs, each of which represents a distinct interference contributionfrom every single interferer currently transmitting [75, 76, 90]. The interferencecontributions of interferers within a given tier are assumed to be identically distributed.Unfortunately, there is no general closed-form expression for the PDF of the sum of LNRVs, though a plethora of analytical approximations have been suggested in the literature[91–93] and references thereof. In [39] the total interference perceived by the taggedreceiver is approximated using a flexible method introduced in [94], which uses theMoment Generating Function (MGF) of a single “equivalent” LN RV to approximate thesummation of the individual components. Another option is to approximate its density
42
function using series expansion in terms of higher order cumulants. For example, in [95]the Gram-Charlier series method is used. In [58], Chan et al. first identifies a noticeableskewness in the distribution of the aggregate interference to the right (positively skewed)and then uses the Edgeworth expansion of the characteristic function utilizing higherorder cumulants. The Edgeworth expansion is the Taylor expansion of the characteristicfunction of the aggregate interference at the user of interest [85]. Note that the thirdcumulant controls the amount of skewness of the probability distribution. In the contextof spectrum-sensing cognitive wireless networks, the Edgeworth expansion of thecharacteristic function is also used the aggregate interference generated by the secondarynodes [32]. And yet an alternative to approximate the distribution is based on estimatingthe parameters of an equivalent known distribution by means of the moments of theactual distribution.
Motivated by the fact that the distribution of Z is heavy-tailed and positivelyskewed [32, 58, 94, 96], we use simple yet accurate LN and Shifted Log-Normal (SLN)approximations whose parameters are estimated using the cumulants of the aggregateCCI as presented next. We first relate the moments of the LN distribution to thecumulants of the aggregate CCI as follows,
µ = ln
κ21√
κ21 + κ2
, and σ2 = ln
1 +κ2
κ21
. (13)
where µ is the mean and σ is the standard deviation of the distribution, Normal(µ, σ2)in the logarithm scale.
In [97], the SLN distribution is introduced to approximate the distribution of thenumber of packets that a typical costumer need to buy to obtain the complete set –without considering the swapping of cards between friends. Similar to the approach ofGhasemi et al. in [32], we adapt the above approximation to characterize the interferenceusing a SLN RV Z , whose PDF with shifting parameter δ is given by,
fZ (z) =1
σ (z − δ)√
2πexp
− [ln (z − δ) − µ
]2
2σ2
, z > δ. (14)
The parameters of the density function in (14) are computed as follows [97]
σ2 = ln τ, µ =12
ln[
κ2
τ (τ − 1)
], and
δ = κ1 −
√κ2
τ − 1, (15)
43
where τ =(ν +√ν2 − 1
)1/3+
(ν −√ν2 − 1
)1/3− 1, ν = 1 +
ς2
2and ς =
κ3
(κ2)3/2 .
2.7 Distribution of the aggregate CCI
In this section, we apply the above framework to recover the CCI distribution experiencedby the tagged receiver in the reference scenario. We consider the setup and networkoperation of Sections 2.3 and 2.4. Fig. 2 illustrates the reference scenario wherea macrocell is underlaid with two tiers of randomly deployed small cells. In ourinvestigations, this scenario corresponds to the worst case wherein small cells transmitwith fixed power p in a totally uncoordinated way.
Proposition 2. Consider the MPP Φ; then, the nth cumulant of the aggregate CCI
perceived by the tagged Macrocell User (MU) in OMU is given by,
κn(Φ)
=2πλ pn
nα − 2
(R2−αnm − R2−αn
M
)EnX[0,∞] . (16)
Proof. We start from (11) to derive the CF of the aggregate CCI perceived by the taggedMU as
ΨZ (ω) = exp
2π
∞∫0
RM∫Rm
[exp
(jwpr−α x
)− 1
]λ fX (x) rdrdx
. (17)
By substituting (17) in (12), and after integrating with respect to r, we write the nth
cumulant of the aggregate CCI Z as
κn(Φ)
=2πλpn
nα − 2
(R2−αnm − R2−αn
M
) ∞∫0
xn fX (x)dx. (18)
Recalling that EnX [0,∞] =
∫ ∞0 xn fX (x)dx, we turn our attention to the case where
transmissions are affected by the shadowed fading, and so from Section 2.3, EnX [0,∞] =
enµ+ 12 n
2σ2which gives (16).
44
2.7.1 Distribution of the aggregate CCI in HetNets withmultiple tiers of small cells
We now account for the combined effect of interferers in multiple tiers of small cells.For each tier, Φk represents the corresponding MPP combining the random position ofinterferers and radio channel effects. It is also assumed that transmitters of distinct tierare independently and randomly scattered over the network deployment area. In thismulti-tier configuration, the cumulants of the aggregate CCI perceived by the taggedMU is computed using the following proposition.
Proposition 3. Consider a HetNet deployment scenario with K and that the MPP Φk
represents the random field of interferers of the k th tier; then, the nth cumulant of the
aggregate CCI perceived by this tagged MU in OMU is,
κn(Φ1 + · · · + ΦK−1
)= κn
(Φ1
)+ · · · + κn
(ΦK−1
). (19)
Proof. Since transmitters in each such tier are assumed to be independently scattered aswell as randomly marked with shadowed fading, the resulting K MPPs still Poissonand also independent [78]. Thus, we use the cumulants additivity property to obtain(19).
With Proposition 3, we neglect the interference from co-tier transmitters and accountfor the contribution of interferers in the other K − 1 interfering tiers. In Chapter 3, weaddress scenarios where the tagged receiver is also interfered by co-tier transmissions.
2.8 Performance analysis
With regard to the tagged receiver, the performance of the evaluation scenarios is assessedby means of the outage probability and average channel capacity. The scenarios understudy are interference limited and hence the thermal noise is negligible in comparison tothe resulting CCI [81, 98]. As explained in the following section, by expressing both thedesired signal power and interference component using LN RVs, the density function ofthe ratio is determined in a straightforward manner [99].
45
2.8.1 SIR and outage probability
The outage probability is given by Pr[Γ < γth
]where the RV Γ represents the SIR
distribution of the tagged receiver, and γth is the corresponding SIR detection threshold.
Theorem 3. Let V0 and V be Normal RVs (in logarithmic scale) representing the power
received from the desired transmitter and the aggregate CCI at the tagged receiver,
respectively. Under the assumption of the shadowed fading with composite Gamma-LN
distribution, the SIR at the tagged receiver is
Γ ∼ Normal(µV0 − µV , σ
2V0
+ σ2V
), (20)
and the outage probability is given by
Pr[Γ < γth
]= Q
[(µΓ − γth) /σΓ
], (21)
where µΓ = µV0 − µV and σΓ =√σ2V0
+ σ2V
.
Proof. The SIR distribution is given by the quotient of two independent LN RVs,namely, eV0 which is the received power from the target transmitter, and eV which is anequivalent LN RV approximating the aggregate CCI at the tagged receiver. Hence, themultiplicative reproductive property of LN RVs is applied to obtain the SIR distribution[90].
2.8.2 Average spectral efficiency
We now evaluate how the two-tier coexistence scenarios perform in terms of the location-dependent average channel capacity of the tagged receiver [100]. By using the analyticalframework previously established, and assuming that all users are allocated on the samebandwidth W , we initially recover the SIR distribution of the tagged receiver, and thencompute the corresponding capacity.
Theorem 4. Under the assumption of the shadowed fading channel regime, the average
channel capacity of the tagged receiver is given as,
C ' WK∑k=1
ωk√π
log2
1 + exp
ηk√2σ + µ
ξ
. (22)
46
Proof. To compute the location-dependent average channel capacity,
C = W
∞∫0
log2 (1 + γ) fΓ (γ) dγ, (23)
we use the PDF of the SIR with respect to the tagged receiver, which is indicated byfΓ (γ). The Gauss-Hermite quadrature [85] with the substitution η = (ξ ln γ − µ)/
√2σ
are used to obtain (22).
+∞∫−∞
e−η2
f (η) dη =
K∑k=1
ωk f (ηk ) + RK , (24)
where ηk is the k th zero of the Hermite polynomial HK (η) of degree K , ωk is thecorresponding weight of the function f ( · ) at the k th abscissa, and RK is the remaindervalue. K corresponds to the number of sample points which are used to approximatef (η) [85, 94].
2.9 Numerical results
In this section, we use this analytical framework to assess the performance of a HetNetin which the umbrella macrocell is underlaid with two tiers of small cells. We assumethat MBSs follow centralized coordination and spectrum allocation such that intermacrocell interference is mitigated, for example, using fractional frequency reuse[15]. In this example, the picocells (femtocells) randomly deployed within an annularobservation region which is defined by Rm = 25 m (Rm = 5 m) and RM = 250 m andoperate with a fixed power level of 30 dBm (24 dBm). The radio channel is affected bypath loss with exponent α = 3, LN shadowing with standard deviation σ = 6 dB, andNakagami-m fading with shape parameter m = 16 which corresponds to a Rician channelwith parameter K = 14.8 dB. Picocells (femtocells) are uniformly scattered over thenetwork deployment area following a homogeneous PPP with density λ = 10−4PBS/m2
(10−3FBS/m2). The user of interest is connected to the overlay macrocell whichtransmits at 43 dBm.
After computing the cumulants of the actual distribution of the aggregate CCI using(12), our next step is to recover the distribution of the interference itself. To do that, weuse equivalent LN (13) and SLN (15) RVs. By using the analytical framework of Section2.5, the distributions of the aggregate CCI is calculated for each one the Evaluation
47
10−4
10−3
10−2
10−1
100
-60 -50 -40 -30 -20 -10
CC
DF
Aggregate CCI (dBm)
Aggregate CCI at the Tagged Receiver
SimulationLN Approx.SLN Approx.
PBS + FBS
PBS
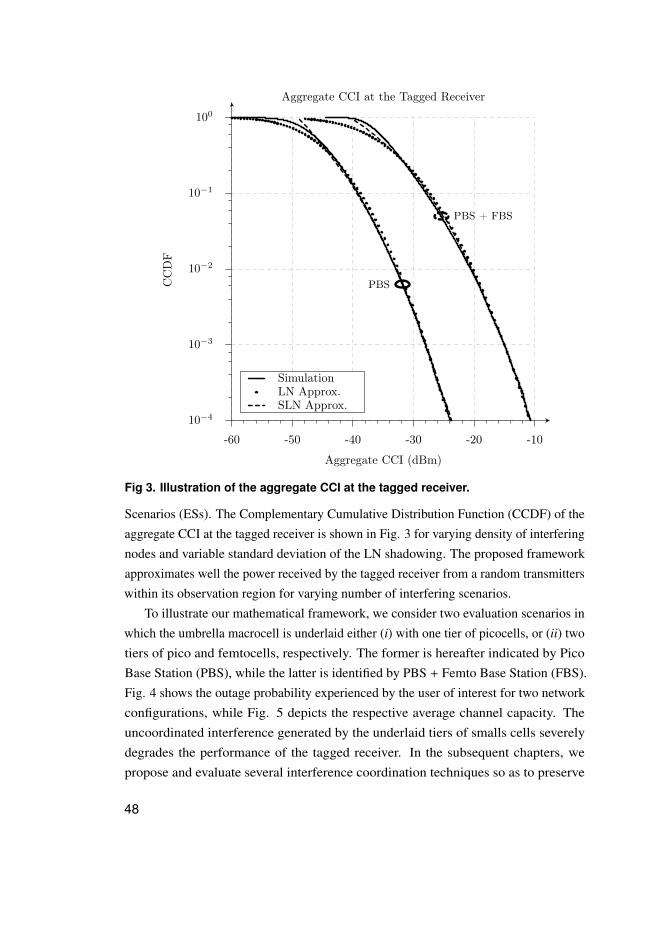
Fig 3. Illustration of the aggregate CCI at the tagged receiver.
Scenarios (ESs). The Complementary Cumulative Distribution Function (CCDF) of theaggregate CCI at the tagged receiver is shown in Fig. 3 for varying density of interferingnodes and variable standard deviation of the LN shadowing. The proposed frameworkapproximates well the power received by the tagged receiver from a random transmitterswithin its observation region for varying number of interfering scenarios.
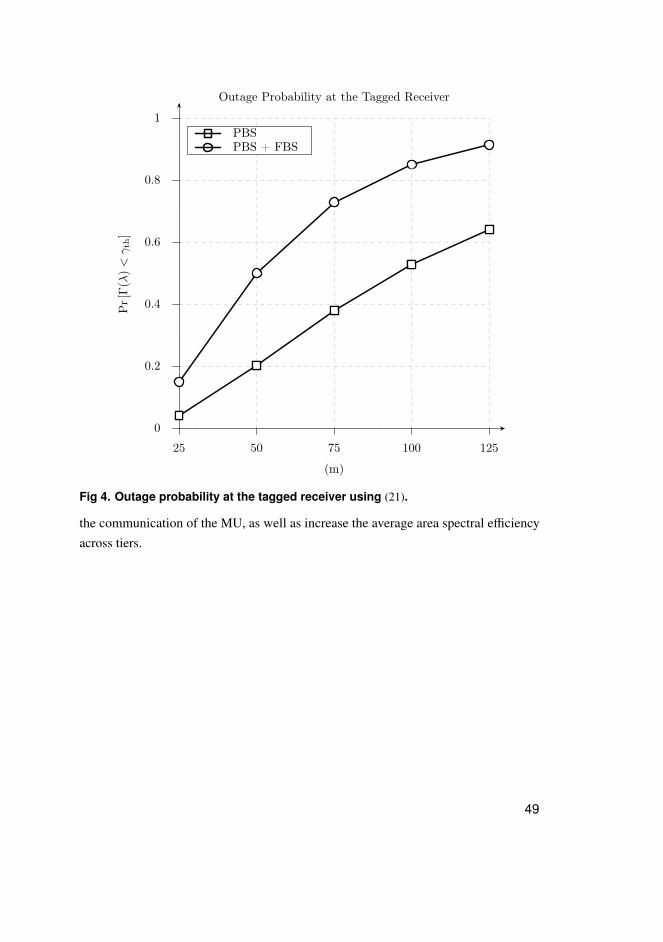
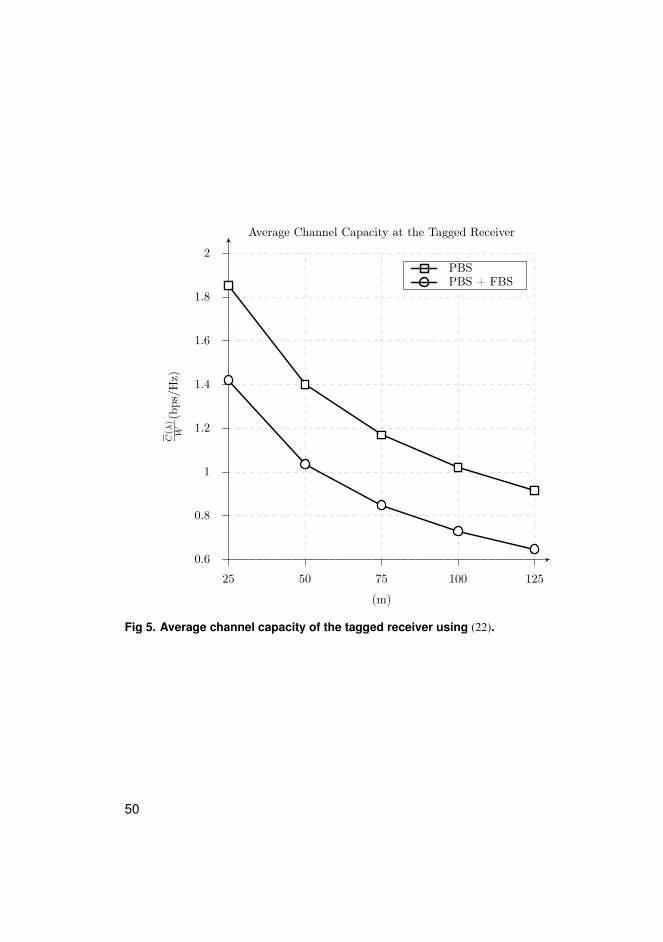
To illustrate our mathematical framework, we consider two evaluation scenarios inwhich the umbrella macrocell is underlaid either (i) with one tier of picocells, or (ii) twotiers of pico and femtocells, respectively. The former is hereafter indicated by PicoBase Station (PBS), while the latter is identified by PBS + Femto Base Station (FBS).Fig. 4 shows the outage probability experienced by the user of interest for two networkconfigurations, while Fig. 5 depicts the respective average channel capacity. Theuncoordinated interference generated by the underlaid tiers of smalls cells severelydegrades the performance of the tagged receiver. In the subsequent chapters, wepropose and evaluate several interference coordination techniques so as to preserve
48
0
0.2
0.4
0.6
0.8
1
25 50 75 100 125
Pr
[Γ(λ
)<γth
]
(m)
Outage Probability at the Tagged Receiver
PBSPBS + FBS
Fig 4. Outage probability at the tagged receiver using (21).
the communication of the MU, as well as increase the average area spectral efficiencyacross tiers.
49
0.6
0.8
1
1.2
1.4
1.6
1.8
2
25 50 75 100 125
C(λ
)W
(bps/Hz)
(m)
Average Channel Capacity at the Tagged Receiver
PBSPBS + FBS
Fig 5. Average channel capacity of the tagged receiver using (22).
50
2.10 Summary and final remarks
We formalize a stochastic framework to model and evaluate how multi-tier HetNetsperform in various network configurations and radio channel propagation environments.The radio channel is represented by an equivalent LN RV which closely approximatesthe shadowed fading channel with Nakagami-m fading and LN shadowing. Thisframework resorts to stochastic geometry to model random network deployments.Higher order statistics are used to capture the effect of radio channel dynamics. Then,the resulting performance is assessed by means of the outage probability and averagechannel capacity with respect to the tagged receiver. In the following chapters weextend this framework to incorporate the operational effect of self-organizing solutionswhich coordinate concurrent transmissions and mitigate interference in more elaboratedHetNet deployments.
51

52
3 Coordination mechanism for interferencemitigation in multi tier HetNets
We propose and investigate distributed coordination mechanisms for controlling theco-channel interference generated by standalone femtocells in two-tier coexistencescenarios consisting of macrocells underlaid with short-range small cells. The rationalebehind employing such mechanism is to opportunistically reuse resources withoutcompromising ongoing transmissions on the overlaid macrocell, while still guaranteeingQuality of Service (QoS) in both tiers. Following the framework of Chapter 2, stochasticgeometry is used to model network deployments, while higher-order statistics throughthe cumulants concept is utilized to characterize the probability distribution of theaggregate interference at the tagged receiver. We consider the shadowed fading channelmodel incorporating Nakagami-m and Log-Normal (LN) shadowing. In addition, thecumulant-based framework is extended to incorporate the effect of various networkalgorithms, such as power control and frequency (re)allocation. To evaluate how theproposed solutions perform, we also update the expressions of the outage probabilityand average channel capacity with respect to the tagged receiver. Results show that thecoordination mechanisms substantially improve the performance of overlaid macrocellnetworks, while benefiting femtocells as well.
3.1 Motivations and related work
In order to have better link quality, higher spatial reuse, and greater utilization ofspectrum resources, Heteronegeous Networks (HetNets) consisting of macro andfemtocell tiers represent an inexpensive alternative for improving the capacity of cellularsystems [19, 71]. Unfortunately, the Co-Channel Interference (CCI) generated bystandalone femtocells can severely compromise simultaneous transmissions on bothtiers [17, 18]. A motive is that Femto Base Stations (FBSs) are randomly deployedby end-users and lack any predefined infrastructure [19]. To further exacerbate thesituation, standalone FBSs are not networked and operate in a totally uncoordinatedmanner. Thus, it becomes crucial to tackle the interference problem to make two-tiernetworks viable [17, 20].
Since standalone femtocells operate independently of the overlaid macrocell network,
53
and of other femtocells, conventional (pre-determined and centralized) interferencemanagement solutions like traditional network planning and optimization, are onlypartially applicable and do not fully exploit variations over time and space [22]. Forinstance, Authors in [23] identify the decentralized allocation of radio resources as apromising solution, but its implementation still constitutes a technical challenge due toits inherent synchronization and signaling exchange issues. Additionally, Lópes-Pérezet al. in [17] discuss self-configuration and self-optimization concepts as feasibletechnologies to allow femtocells to sense changes and adapt their parameters accordingly.Along the same lines, Rangan et al. in [18] proposes a distributed solution in whichfemtocells select their transmit powers so as to control their aggregate interference atthe tagged receiver, while still maximizing their achievable throughput. Therein, theinterference problem is addressed in a way similar to ours, by studying the combinedeffect of power control and spectrum (re)partitioning for interference avoidance purposes.In [28], the busy tone concept is used to devise an adaptive technique to mitigateinter-cellular interference in Time Division Duplexing (TDD) networks using TimeDivision Multiple Access (TDMA)-based schemes. Furthermore, Authors in [29] firstidentify the CCI as the key challenge for uncoordinated communication in wirelessnetworks, and then use what is called busy burst to establish exclusion regions aroundreceivers in order to avoid conflicting allocations.
With the same reasoning, we also understand that adaptive solutions that change theallocation of radio resources in response to local knowledge of network dynamics andchannel variations are more advantageous when used in conjunction with self-organizingfemtocells [39]. Indeed, we extend previous results [10, 50, 101], where static guardzones are used to avoid interference, by considering dynamic exclusion regions whereincoordinating femtocells employ distinct strategies and algorithms to autonomously(re)use available resources, while still avoiding interference. In this work, we thusemphasize opportunistic strategies aiming at reducing CCI generated by self-organizingfemtocells, as well as attaining adequate utilization of Downlink (DL) radio resources inboth tiers. Since the excessive signaling overhead could render any distributed solutionunfeasible, another important point is that the proposed mechanism relies solely onthe feedback from the receiver of interest, and very little if any explicit coordinationis required between coordinating femtocells and the overlaid macrocell tier. In otherwords, our mechanism does not require the X2 interface to operate [102].
54
3.2 System model
Until further notice, we use here the network deployment and propagation radio channelmodels of Sections 2.3 and 2.4, respectively.
3.2.1 Two-tier deployment model
We particularize the deployment of Section 2.4 to assess the DL of two-tier HetNetswherein Macro Base Stations (MBSs) are underlaid with standalone FBSs in closedaccess mode. FBSs are uniformly scattered over the network deployment area, while asingle reference MBS models the overlaid tier. Each femtocell schedules a randomFemtocell User (FU) in every transmission interval, whereas the serving macrocellschedules a Macrocell User (MU) during the same time – we assume that only oneMU is active per macrocell per transmission interval. Using the formulation of Section2.4, active femtocells constitute a homogeneous Poisson Point Process (PPP) Φ withdensity λ in R2 so that the number of active femtocells in an arbitrary region R of areaA is a Poisson Random Variable (RV) with parameter λA [78]. Additionally, the fadingeffect is associated with each point of Φ as a random mark [32]. The resulting processis defined as the Marked Point Process (MPP) Φ on the product space R2 × R+ withintensity λ fX (x).
Φ = (ϕ, x) ; ϕ ∈ Φ , (25)
where the points ϕ represent femtocells locations and belong to the stationary pointprocess Φ.
In [22], the 3rd Generation Partnership Project (3GPP) standardization body definesthe partial co-channel configuration to accommodate two-tier networks operating in theFrequency Division Duplexing (FDD) mode whereby the available spectrum is dividedinto clear and shared parts as illustrated in Fig. 6. By this configuration, the macrocelltier can operate on both parts, whereas the standalone femtocells can only use frequencybands in the shared part only. Herein, we introduce a dynamic implementation of thepartial co-channel configuration which equally splits the spectrum into two parts, butassigns distinct priorities to intending transmitters in the clear part instead of preventingfemtocells from transmitting altogether, so that the macrocell tier has always precedenceover FBSs. In other words, to improve the frequency reuse, while still protecting themacrocell tier, the underlaid femtocells can operate in the clear part provided that no MU
55
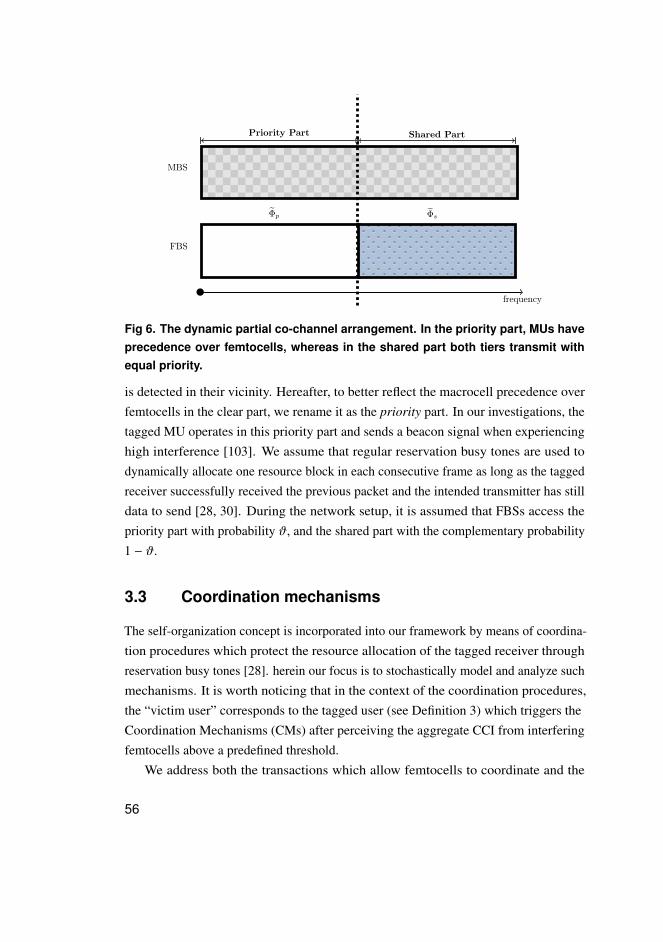
frequency
Priority Part
MBS
FBS
Φp Φs
Shared Part
Fig 6. The dynamic partial co-channel arrangement. In the priority part, MUs haveprecedence over femtocells, whereas in the shared part both tiers transmit withequal priority.
is detected in their vicinity. Hereafter, to better reflect the macrocell precedence overfemtocells in the clear part, we rename it as the priority part. In our investigations, thetagged MU operates in this priority part and sends a beacon signal when experiencinghigh interference [103]. We assume that regular reservation busy tones are used todynamically allocate one resource block in each consecutive frame as long as the taggedreceiver successfully received the previous packet and the intended transmitter has stilldata to send [28, 30]. During the network setup, it is assumed that FBSs access thepriority part with probability ϑ, and the shared part with the complementary probability1 − ϑ.
3.3 Coordination mechanisms
The self-organization concept is incorporated into our framework by means of coordina-tion procedures which protect the resource allocation of the tagged receiver throughreservation busy tones [28]. herein our focus is to stochastically model and analyze suchmechanisms. It is worth noticing that in the context of the coordination procedures,the “victim user” corresponds to the tagged user (see Definition 3) which triggers theCoordination Mechanisms (CMs) after perceiving the aggregate CCI from interferingfemtocells above a predefined threshold.
We address both the transactions which allow femtocells to coordinate and the
56
underlying procedures that are used to manage interference. A triggering criterion, whichis based on the co-channel carrier received signal strength indicator [22], initializesthe mechanism: only if sensing the aggregate CCI above a predefined threshold, thevictim MU issues an in-band requesting signal to advertise its presence to surroundingFBSs. The victim user momentarily interrupt its reception and transmit the requestingsignal that surrounding interferers detect [18, 29]. Note that alternative performanceindicators such as the packet loss and packet delay are equally applicable to trigger thecoordination mechanism. By detecting the victim user’s request, interfering FBSs adjusttheir resource allocation to manage the CCI in a distributed manner. In this contribution,we focus on the interactions that follow the triggering event as described next.
3.3.1 Discovery of victim users
The discovery of victim users plays a crucial role in our coordination procedures, so thatinterfering FBSs coordinate only if they sense the requesting signal of the victim receiver.For a given coordination threshold, the victim MU controls the power level of therequesting signal to keep the coordination range small and restrict the coordination setto the dominant interferers, while still allowing femtocells that are located farther awayto reuse the spectrum. Hence, the victim user intentionally transmits the reference signalwith low power (0 dBm in our investigations). Recall that the victim user transmitsthe requesting signal over the same channel used for payload communication whichcharacterizes in-band signaling. With respect to the tagged MU, consider an arbitraryinterferer with the instantaneous shadowed fading x and separation distance r m; then,the event that this interfering femtocell detects the requesting signal above the predefinedcoordination threshold ρth is formulated as follows,
r−α x ≥ %th , (26)
where %th = ρth/preq and preq is the transmit power of the requesting signal.
3.3.2 Definition of coordination regions
femtocells are independently split into two distinct groups based on the power level ofthe requesting signal relative to the coordination threshold. Notice that each such groupcan take distinct and independent actions to reduce the CCI. Any FBS that has alreadytriggered the coordination procedure ignores further requests that may occur while
57
transactions related to the first one are still ongoing. There is no loss of generality inassuming the MU that carries out the coordination procedures is in the priority part.
The following indicator function,
1(r−α x
)=
1, if r−α x ≥ %th
0, otherwise,(27)
defines the first coordination region, which is denoted by R1, and is composed ofFBSs that do detect the victim receiver in their vicinity. In accordance with thenotation of Section 3.2.1, femtocells within this region constitute a MPP denotedby Φp ,1 =
(ϕ, x) ∈ Φp | r−α x ≥ %th
. Similarly, femtocells in R2, which do not
detect the victim MU, form the process Φp ,2 =(ϕ, x) ∈ Φp | r−α x < %th
. Notice
that the coordination regions R1 and R2 are disjoint and statistically independent byconstruction, therefore it follows immediately from the Superposition theorem [78] thatΦp = Φp ,1 ∪ Φp ,2.
To conduct our investigations in a more intelligible way, we separate the coex-istence scenarios into two categories which depend on the interaction levels amongFBSs, namely, uncoordinated and coordinated. In the former standalone FBSs workindependently and do not cooperate, whereas in the latter case, self-organizing FBSscoordinate their operation to better manage the aggregate interference. We now haveenough information to properly characterize the interference scenarios encounteredthroughout this work by defining the Interference Profiles (IPs) in Table 1. Each IP isdescribed by its field of interferers, frequency group and victim user.
In this chapter, we define three uncoordinated evaluation scenarios which dependon the tagged receiver type and the partial co-channel arrangement. When the userof interest connects to the reference MBS, its transmissions are disrupted by the IP1composed of non-coordinating femtocells within the observation region OMU andbelonging to the point process Φp . Fig. 7 illustrates this reference scenario and shows arealization of the CM with the resulting sets of interfering FBSs within the independentregions R1 and R2. Similarly, two uncoordinated IPs are established with respect to thetagged femtocell user and the respective frequency part selected for transmission. Sincethe tagged FU uses the priority part in the IP2, it is interfered by other femtocells of theprocess Φp within OFU and the reference MBS as well. In the IP3, the tagged FU usesthe shared part and is interfered by co-channel femtocells in Φs . When the femtocellsoperate with the CMs, we define four distinct evaluation scenarios. With respect to thetagged MU, the IP4 is composed of the detecting femtocells of the process Φp ,1, while
58
Table 1. Description of the interference profiles.
Victim user Priority Part Shared PartUncoordinated ScenariosMU IP1: accounts for the interfer-
ence that is caused by femto-cells within OMU and belongingto the point process Φp with in-tensity ϑλ fX (x).
Not considered.
FU IP2: is jointly caused by otherfemtocells dwelling in OFU thatare in Φp , and also by the serv-ing MBS in Φm .
IP3: is generated by femtocellswithin OFU that are members ofthe point process Φs with density(1 − ϑ) λ fX (x).
Coordinated ScenariosMU IP4: is generated by femtocells
that after coordinating are in R1
of OMU , and then constitute apoint process Φp ,1.IP5: is caused by femtocellswithin OMU that do not detectthe victim MU, and constitute thepoint process Φp ,2.
Not considered.
FU IP6: is jointly generated by thefemtocells in the process Φp ,1
that remain in the same fre-quency allocation of the taggedMU after coordinating, and bythe serving MBS in Φm .
IP7: generated by femtocells thatswitch to the shared part Φp ,2
after coordination, and by thefemtocells originally in that fre-quency group and in the pointprocess Φs .
59
−100
−50
0
50
100
−100 −50 0 50 100
Y(m
)
X (m)
Coordination Regions
Non-Coord. FBSCoord. FBS
r0
R0
MUFU
Fig 7. Illustration of the coordination regions in the priority part. The shaded cir-cles represent interferers inside R1, while the unshaded circles identify interfererswithin R2. The black shaded square identifies the tagged MU at the origin, and theunshaded one identifies the tagged FU. The dashed circle with the tagged FU atthe center depicts the femtocell observation region with radius R0 and located r0
meters away from the tagged MU.
the IP5 is characterized by the femtocells which do not detect the victim user. Whenevaluating the tagged FU, we consider either the IP6 in which the reference MBS andco-channel femtocells in the priority part interferer with the user of interest, or the IP7which is generated by the femtocells within the shared part after the coordination.
60
3.4 Macro-to-femtocell coexistence scenarios
The framework of Section 2.5 is now used to assess the CMs in practical deploymentsregarding various channels, and also the set of algorithms that femtocells employ tomanage their utilization of resources. We investigate the CCI experienced by the victimMU in the priority part for two reasons: first, given the restriction of space, we focuson the most challenging scenario; second, it is reasonable to assume that under highinterference MUs migrate to the priority part [22]. Afterward, we analyze the impact ofthe CMs on the underlaid tier with regard to both parts.
3.4.1 Full interference scenario
The IP1 is equivalent to the reference scenario of Section 2.7; however, we repeat thecumulants derivation for sake of completeness and to maintain our notation consistent.IP1 is an uncoordinated scenario and corresponds to the worst case in our investigations.In what follows, we consider the setup of Section 3.2, the process Φp , and that allfemtocells transmit with fixed power p.
Proposition 4. Consider the IP1; then, the nth cumulant of the aggregate CCI perceived
by the tagged MU in OMU with respect to Φp is given by,
κn(Φp
)=
2πϑλ pn
nα − 2
(R2−αnm − R2−αn
M
)EnX[0,∞] . (28)
Proof. We start from (11) to derive the Characteristic Function (CF) of the aggregateCCI perceived by the tagged MU as
ΨZp(ω) = exp
2π
∞∫0
RM∫Rm
[exp
(jwpr−α x
)− 1
]ϑλ fX (x) rdr dx
, (29)
where Zp =∑
(ϕ,x)∈ΦpY . After substituting (29) in (12) and integrating with respect to
r , we write the nth cumulant as
κn(Φp
)=
2πϑλpn
nα − 2
(R2−αnm − R2−αn
M
) ∞∫0
xn fX (x)dx. (30)
Recalling that EnX [0,∞] =
∫ ∞0 xn fX (x)dx, we turn our attention to the case where
transmissions are affected by the shadowed fading, and so from (13), EnX [0,∞] =
enµ+ 12 n
2σ2which gives (28).
61
3.4.2 Full interference with power control
This is also an uncoordinated scenario, but now femtocells carry out the standard PowerControl (PC) algorithm to fully compensates for channel attenuations of their desiredusers [104]. We assume that femtocells schedule a random user in every transmissioninterval, FUs are uniformly distributed within the transmission range of serving cells,and the transmit power is set as a function of the distance between transmitter andreceiver pairs, but independently of the interference at that receiver.
Lemma 1. Under the assumptions given above, the nth partial moment of the distribution
of the femtocells transmit power is,
EnP
[pm , pM
]=
2βn
d2M− d2
m
×d2+nαM
− d2+nαm
2 + nα, (31)
where dM = (pM/β)1/α is the radio range of FBSs, such that the received power at the
desired user is β, pm and pM are the minimum and maximum FBSs transmit powers,
respectively, and dm = 1 m is the minimum distance between an FU and its serving
FBS.
Proof. See Appendix 1.
Next, we extend Proposition 4 to incorporate the PC algorithm into our analyticalframework.
Proposition 5. Under the assumptions of Proposition 4, and with femtocells using the
standard PC algorithm, the nth cumulant of the aggregate CCI perceived by the tagged
MU in OMU with respect to Φp becomes
κn(Φp
)=
2πϑλ EnP
[pm , pM
]nα − 2
(R2−αnm − R2−αn
M
)EnX [0,∞] . (32)
Proof. In this case, the CF assumes the following form
ΨZp(ω) = exp
2π
∞∫0
RM∫Rm
pM∫pm
[exp
(jwpr−α x
)− 1
]ϑλ fX (x) fP (p) rdr dp dx
, (33)
where fP (p) is the Probability Density Function (PDF) of the distribution of interferingfemtocells transmit power given in Lemma 1. By repeating the mathematical treatmentto get (30), and using (31), the resulting nth cumulant in (32) is obtained.
62
3.4.3 Opportunistic power control with discrete levels
In this coordinated scenario, FBSs do not fully compensate for the channel attenuationsof their desired users (as in the previous case), but alternatively adjust their transmitpower using a fixed step ∆p depending on their relative distance to the tagged receiverwhich is estimated from the requesting signal strength. Coordinating femtocells thenreduce the aggregate CCI by simply maintaining their transmit power levels below apredefined upper limit. In line with this model, 3GPP suggests halting the FBSs pilotchannel temporarily to avoid interfering with a nearby MU [22].
To simplify our formulation, we use arbitrary power levels, which are not optimizedto specific channel and network dynamics, but still provide valuable insight into theachievable gains of such adaptive interference avoidance technique. Femtocells need lesssignaling exchange to implement this solution, though link quality of already connectedFUs may be degraded. From Fig. 7, one can observe that FBSs in R1 are most likely tobe the closest interferers, and because of that, they reduce their transmit power to a levelp′ < p. Femtocells in R2, which have not sensed the victim user, maintain their samepower level p. After including the concepts of coordination regions, and discrete powerlevels in our mathematical framework, we derive the CF for each one of the coordinationregions in the following.
First coordination region
As femtocells in this region do detect the victim user, they decrease their transmit powerby a predefined value ∆p to reduce the interference. In our investigations, we considerfixed ∆p equal to −3 and −6 dB.
Proposition 6. Consider the IP4, then, the nth cumulant of the aggregate CCI perceived
by the tagged MU in OMU with respect to Φp ,1 has the following form.
κn(Φp ,1
)=
2πϑλ (p′)n
nα − 2
(R2−αnm − R2−αn
M
)EnX
[%M ,∞
]− %
n− 2α
th E2α
X
[%m , %M
]+ R2−nα
m EnX
[%m , %M
], (34)
where p′ = p + ∆p, %m = %thRαm and %M = %thRαM
.
Proof. See Appendix 2.
63
Second coordination region
FBSs in this region do not detect a request from the victim user, and hence keeptransmitting at the standard power level (p dBm).
Proposition 7. Consider the IP5; then, the nth cumulant of the aggregate CCI perceived
by the tagged MU in OMU with respect to Φp ,2 has the following form.
κn(Φp ,2
)=
2πϑλ pn
nα − 2
(R2−αnm − R2−αn
M
)EnX
[−∞, %m
]+ %
n− 2α
th E2α
X
[%m , %M
]− R2−nα
M EnX
[%m , %M
]. (35)
Proof. See Appendix 3.
Aggregate CCI at the tagged MU
To compute the total CCI perceived by the tagged MU, we need to account for thecombined effect from both interfering regions, R1 and R2 as follows.
Theorem 5. Consider the IPs4, 5, and the MPP Φp on the priority part; then, the nth
cumulant of the aggregate CCI perceived by the tagged MU in OMU is,
κn(Φp ,1 + Φp ,2
)= κn
(Φp ,1
)+ κn
(Φp ,2
). (36)
Proof. Since the coordination regions are independently marked, the resulting processin each region is also independent, and still Poisson [78]. Therefore, we can use theadditivity property of cumulants to readily obtain (36).
3.4.4 Dynamic Exclusion Regions (DERs)
Femtocells dynamically establish exclusion regions based on the power strength ofthe requesting signal from the victim user and on the coordination threshold. Aftercoordinating, FBSs employ spectrum (re)allocation to reduce interference and vacate thepriority part altogether. Next, we characterize the interference from each coordinationregion and the aggregate interference that both regions together impose on the taggedreceiver.
64
First coordination region
Whenever the victim user is detected, femtocells leave all frequency bands in the prioritypart currently allocated to that receiver. During the next frame, femtocells in R1 donot interfere with the tagged receiver in the reserved resource block and, as a result,constitute a dynamic exclusion region around the victim user. Thus, the aggregateinterference at the tagged receiver is generated only by the remaining femtocells that donot listen to the requesting signal, i.e., κn
(Φp ,1
)= 0.
Second coordination region
Femtocells dwelling in R2 do not detect the presence of the victim user. The nth
cumulant of the interference contribution of femtocells in this region is computed usingProposition 7.
Aggregate CCI at the tagged MU
For the reason that interfering femtocells dwelling in R1 switch to non-overlappingallocations, the aggregate CCI includes only the interference components from femtocellsin R2. That fact is reflected in the following corollary that disregards the contribution ofinterferers in R1 on the computation of the resulting nth cumulant of the aggregate CCI.
Corollary 1. When the DER strategy is used, κn(Φp ,1
)= 0 and, as a result, (36) in
Theorem 5 readily simplifies to
κn(Φp ,1 + Φp ,2
)= κn
(Φp ,2
). (37)
3.4.5 DERs with PC
This solution combines the benefits of the PC algorithm with that of the interferenceavoidance provided by DER. Similar to the default implementation of the DERmechanism, femtocells located inside the exclusion region, which corresponds to the R1,switch to non-overlapping frequency allocations. Interferers in R2 which do not detectthe victim user’s beacon do not change their transmission scheme and continue to usethe standard PC algorithm to compensate for the channel attenuations of their desired
65
FUs.
First coordination region
As previously said, this strategy relies on DERs to coordinate, and so femtocells in R1
do not contribute to the aggregate interference, meaning that κn(Φp ,1
)= 0 as well.
Second coordination region
Femtocells in this region do not detect the victim user, but use PC to manage theirinterference contribution. By combining Propositions 5 and 7, we obtain the nextcorollary as an immediate result.
Corollary 2. Under the assumptions of Propositions 7, and with femtocells employing
the standard PC algorithm, the nth cumulant of the total interference caused by the
femtocells in R2 under a shadowed fading channel regime is given as
κn(Φp ,2
)=
2πϑλ EnP
[pm , pM
]nα − 2
(R2−αnm − R2−αn
M
)EnX
[−∞, %m
]+ %
n− 2α
th E2α
X
[%m , %M
]− R2−nα
M EnX
[%m , %M
]. (38)
Aggregate CCI at the tagged MU
Similar to the result of Section 3.4.4, Corollary 1 yields the nth cumulant of the aggregateCCI perceived by the tagged MU when DER is used in conjunction with the PCalgorithm.
3.4.6 Approximating the aggregate CCI at the tagged MU
Figs. 8 and 9 compare the Complementary Cumulative Distribution Function (CCDF)of the aggregate CCI from Monte Carlo simulations with those from the LN and ShiftedLog-Normal (SLN) approximations. In this example, the macrocell observation regionis determined with Rm = 1 m and RM = 100 m. Additionally, we set a high density ofinterferers with λ = 0.1 FBS/m2 and ϑ = 50% as the probability that femtocells choosethe priority part. The radio channel is affected by path loss with exponent α = 3, LNshadowing with σdB = 6 dB, as well as Nakagami fading with shape factor of m = 2 in
66
10−4
10−3
10−2
10−1
100
-35 -27.5 -20 -12.5 -5 2.5 10
CC
DF
CCI (dBm)
Aggregate CCI at the Tagged MU
SimulationSLN approx.LN approx.
Full interference
PC
Discrete PC
DER
DER + PC
Fig 8. CCDF of the aggregate CCI at the tagged MU under shadowed fading withσdB = 6 dB and m = 2 (corresponds to a Rician factor K = 3.8dB).
Fig. 8 and m = 16 shown in Fig. 9. In the full interference case, all FBSs transmit withat fixed power level p = 20 dBm and the serving MBS transmit with 43 dBm. In thePC with fixed levels, femtocells dwelling in the first coordination region transmit withp′ = p − 6 dB. When using PC with full compensation, femtocells control their transmitpower to fully compensate for the average value of the desired receivers’ large-scalefading.
As can be seen from Figs. 8 and 9, both the LN and SLN approximations matchwell with the Monte Carlo simulation results, though the proposed approximations workslightly better with lower fading variance (m = 16). In the uncoordinated scenarios, ahigh fading variance (m = 2) worsens the interference perceived by the tagged receiver.However, in the coordinated case, a high fading variance causes more femtocellsto detect the requesting signal, and consequently reduces the aggregate CCI at thetagged receiver. PC indeed provides gains, because less power is radiated, even in the
67
10−4
10−3
10−2
10−1
100
-35 -27.5 -20 -12.5 -5 2.5 10
CC
DF
CCI (dBm)
Aggregate CCI at the Tagged MU
SimulationSLN approx.LN approx.
Full interference
PC
Discrete PC
DER
DER + PC
Fig 9. CCDF of the aggregate CCI at the tagged MU under shadowed fading withσdB = 6 dB and m = 16 (corresponds to a Rician factor K = 14.8dB).
uncoordinated scenarios where femtocells do not cooperate with each other. By usingPC with fixed power levels, the dominant interferers lower their radiated power, whichfurther reduces the aggregate interference. In the coordinated scenarios, a coordinationthreshold of ρth = −40 dBm and an MU requesting power of preq = 0 dBm are used.Comparing the aggregate CCI of uncoordinated scenarios with that of the coordinatedones, we observe that the two-tier networks under study benefit most from avoidingdominant interferers through the CMs. Like the uncoordinated scenarios, it is alsopossible to achieve even greater gains by employing PC in conjunction with DERs inthe coordinated deployments.
68
3.5 Femto-to-macrocell coexistence scenarios
To evaluate how the CMs impact the underlaid femtocell tier, we assess the femtocellobservation region (see Definition 4), which is illustrated in Fig. 7. The tagged MUstill triggers the coordination procedure, but now the performance is evaluated withrespect to the tagged FU. We approximate the CCI at the tagged FU by first computingthe coordination probability of femtocells inside OFU , and thereafter by using thatprobability to perform independent p-thinning [52]. Generally speaking, a thinningoperation establishes a deletion rule by which points of an original process Φ are eitherdeleted or retained thus yielding a thinned point process such that Φt ⊂ Φ. Accordingto an independent p-thinning each point of Φ is deleted with probability 1 − p and itsdeletion is independent of the locations and possible deletions of any other point of theoriginal point process [80]. As an outcome of the coordination procedure, the servingfemtocell of the tagged FU, hereafter denoted by the tagged femtocell, may end up intwo distinct spectrum allocations: if in IP6, it remains in the same spectrum allocationof the victim MU, or if in IP7, it switches to a non-overlapping resource allocation inthe shared part.
Coordination probability
Since interfering femtocells coordinate with respect to the origin of the coordinatesystem, where the tagged MU is positioned, it becomes difficult to evaluate a simpleexpression for the aggregate CCI by translating the reference to the tagged FU. Dueto that, we propose a simplification that is motivated by the fact that, in this work,transceivers have antennas with omni directional radiation pattern, and that for computingthe interference only the relative distances matter. To use this simplification, we beginwith the coordination probability of femtocells inside the observation region, and usethat probability to independently thin the MPP.
Lemma 2. Consider the MPP Φ in R2 with intensity λ fX (x), and the set of points ϕ
uniformly distributed in a bounded regionW ⊂ R2. Let C be a bounded set, which
corresponds to the dynamic coordination region, and the event r−α x ≥ %th means that a
coordinating femtocell is inside C ⊆ W , then the probability of this event is,
Pr ϕ ∈ C =λ2(C ∩W )λ2(W )
, (39)
where λ2( · ) is the Lebesgue measure of the enclosed region [80].
69
Proof. From geometric probability [105], we know that if the geometric size of the wholedomain equals, for instance, λ2(W ), the size of a partition of it equals λ2(C ∩W ),and a favorable event means hitting C, then the probability of this event is defined to be(39).
The total area of OFU is simply πR20 , where R0 is the radius of this observation
region and is equal to the separation distance between the origin (where the tagged MUis located) and the tagged femtocell receiver. The region encompassing the subset ofpoints of the MPP Φ that are inside OFU and that detect the requesting signal from thevictim MU is
λ2(C ∩W ) =
rM∫rm
θM∫θm
∞∫rα %th
fX (x) r dr dθ dx
=
rM∫rm
θM∫θm
[1 − FX
(rα %th
)]r dr dθ, (40)
where r0 is the distance from the center of OFU to the tagged MU, rm = r0 cos θ −√R2
0 − r20 sin2 θ, rM = r0 cos θ +
√R2
0 − r20 sin2 θ, θm = − sin−1
(R0r0
)and θM =
sin−1(R0r0
). Notice that the distance from the origin to a victim FU should be greater
than or equal to the radius of the femtocell observation region R0.
CCI approximation
To compute the nth cumulant of the aggregate CCI at the tagged FU, we perform anindependent p-thinning of Φ within OFU by which each point ϕ has a probabilityPr ϕ ∈ C of suffering deletion [80]. In the sequel, we show how to compute the nth
cumulant of the interference perceived by the tagged FU depending on the outcome ofthe coordination procedures.
1. The tagged femtocell remains in the priority part: the tagged FU is exposed to theIP6, as defined in Table 1. To account for the serving MBS interference, we model aprocess Φm with a single point, and relate its nth cumulant to the moments of a LNdistribution through the logarithm generating function [90]. It is worthy mentioningthat for conducting this study, we neglect other-macrocell interference, and onlyconsider the serving MBS interference. The interfering femtocells are assumed in a
70
process with intensity Pr ϕ ∈ C ϑλ fX (x), hence we can employ Proposition 4 toapproximate the corresponding nth cumulant.
2. The tagged femtocell switches to the shared part: the tagged FU is exposed to theIP7. The process of switching femtocells has intensity (1 − Pr ϕ ∈ C) ϑλ fX (x),and we approximate its nth cumulant as in the previous case.
Fig. 10 shows the CCDF of the aggregate CCI at the tagged FU for the frequencygroups with and without priority. In the priority part, the serving MBS dominates theinterference, so that the DL performance of those femtocells located too close to themacrocell antenna is severely deteriorated. When this interference condition occur,femtocells can use interference cancellation techniques, such as successive interferencecancellation [69], or smart antennas [106], to suppress macrocell interference. Althoughthe distance to the serving MBS is what matters for those femtocells which remainin the priority part, the separation distance to tagged MU becomes determinant forthe femtocells that migrate to the shared frequencies, since more or less interferingfemtocells coordinate depending on the distance to the victim user.
3.6 Numerical Results
The numerical results in this section are generated with the same assumptions andconfiguration parameters of Section 3.4. In addition, high densities of interferingFBS are considered to highlight gains that are achieved with the proposed CMs. Weare aware that in actual deployments a victim receiver may be subject to less severeinterference (lower number of surrounding femtocells), and that such density scalesdown the performance results.
The analytical framework previously established in Chapter 2 is used to assess thebenefits of coordinating standalone femtocells in the two. In our investigations, theperformance of the multi-tier coexistence scenarios scenarios is evaluated in terms ofthe outage probability and average spectral efficiency of the tagged link as defined inSection 2.8. We evaluate the DL performance with regard to the tagged receiver in termsof the outage probability and average channel capacity, when both are functions of thedensity of interfering femtocells and the desired signal strength.
Fig. 11 shows the outage probability for increasing d – separation distance betweenthe tagged MU receiver and its serving MBS. The QoS, in terms of outage probability,experienced by a tagged MU significantly degrades by considering its serving MBS
71
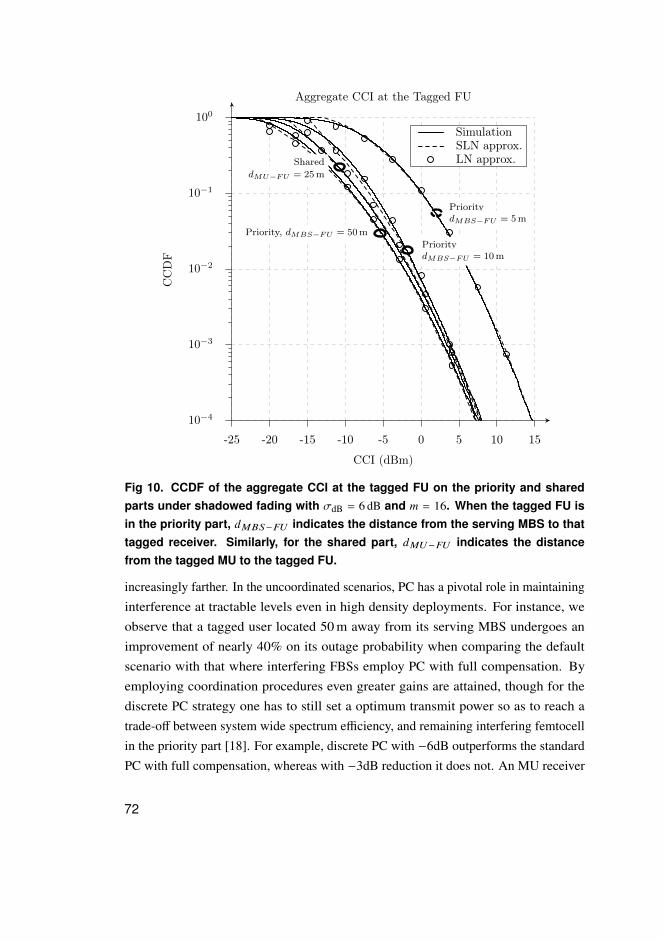
10−4
10−3
10−2
10−1
100
-25 -20 -15 -10 -5 0 5 10 15
CC
DF
CCI (dBm)
Aggregate CCI at the Tagged FU
SimulationSLN approx.LN approx.
PrioritydMBS−FU = 5m
PrioritydMBS−FU = 10m
Priority, dMBS−FU = 50m
ShareddMU−FU = 25m
Fig 10. CCDF of the aggregate CCI at the tagged FU on the priority and sharedparts under shadowed fading with σdB = 6 dB and m = 16. When the tagged FU isin the priority part, dMBS−FU indicates the distance from the serving MBS to thattagged receiver. Similarly, for the shared part, dMU−FU indicates the distancefrom the tagged MU to the tagged FU.
increasingly farther. In the uncoordinated scenarios, PC has a pivotal role in maintaininginterference at tractable levels even in high density deployments. For instance, weobserve that a tagged user located 50 m away from its serving MBS undergoes animprovement of nearly 40% on its outage probability when comparing the defaultscenario with that where interfering FBSs employ PC with full compensation. Byemploying coordination procedures even greater gains are attained, though for thediscrete PC strategy one has to still set a optimum transmit power so as to reach atrade-off between system wide spectrum efficiency, and remaining interfering femtocellin the priority part [18]. For example, discrete PC with −6dB outperforms the standardPC with full compensation, whereas with −3dB reduction it does not. An MU receiver
72
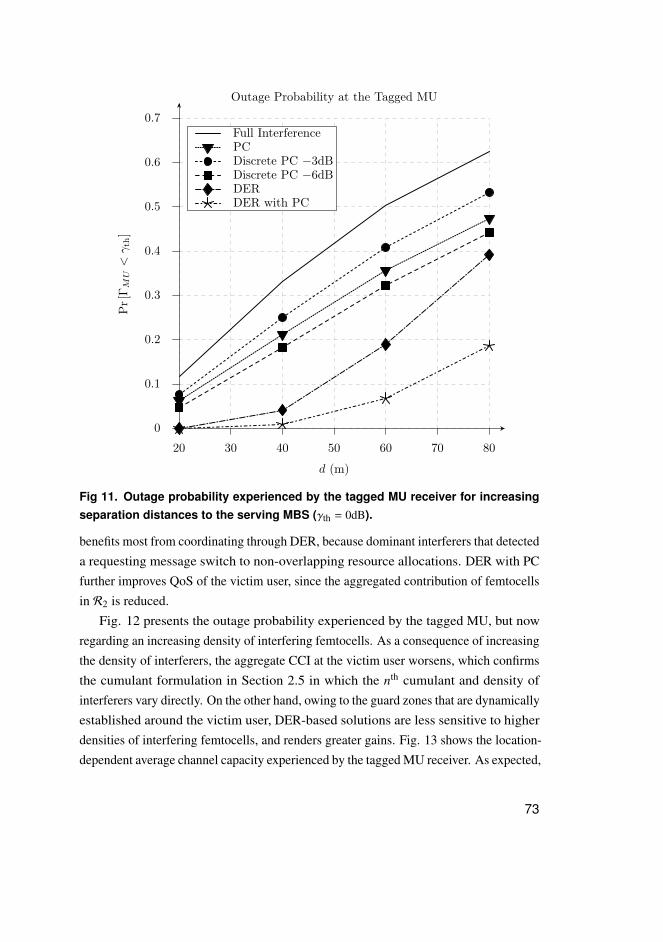
0
0.1
0.2
0.3
0.4
0.5
0.6
0.7
20 30 40 50 60 70 80
Pr
[ΓM
U<γth
]
d (m)
Outage Probability at the Tagged MU
Full InterferencePCDiscrete PC −3dBDiscrete PC −6dBDERDER with PC
Fig 11. Outage probability experienced by the tagged MU receiver for increasingseparation distances to the serving MBS (γth = 0dB).
benefits most from coordinating through DER, because dominant interferers that detecteda requesting message switch to non-overlapping resource allocations. DER with PCfurther improves QoS of the victim user, since the aggregated contribution of femtocellsin R2 is reduced.
Fig. 12 presents the outage probability experienced by the tagged MU, but nowregarding an increasing density of interfering femtocells. As a consequence of increasingthe density of interferers, the aggregate CCI at the victim user worsens, which confirmsthe cumulant formulation in Section 2.5 in which the nth cumulant and density ofinterferers vary directly. On the other hand, owing to the guard zones that are dynamicallyestablished around the victim user, DER-based solutions are less sensitive to higherdensities of interfering femtocells, and renders greater gains. Fig. 13 shows the location-dependent average channel capacity experienced by the tagged MU receiver. As expected,
73
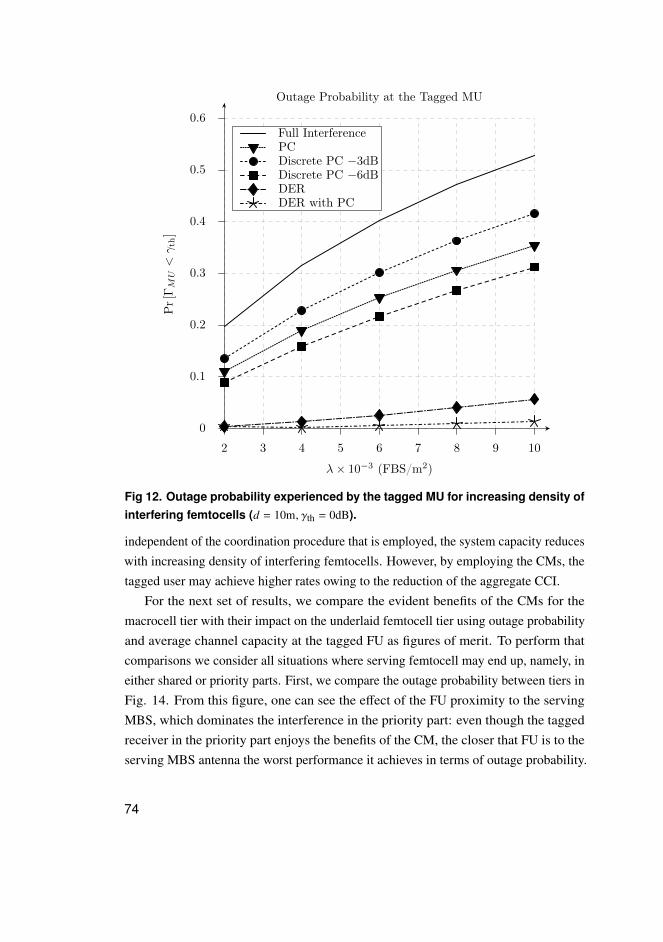
0
0.1
0.2
0.3
0.4
0.5
0.6
2 3 4 5 6 7 8 9 10
Pr
[ΓM
U<γth
]
λ× 10−3 (FBS/m2)
Outage Probability at the Tagged MU
Full InterferencePCDiscrete PC −3dBDiscrete PC −6dBDERDER with PC
Fig 12. Outage probability experienced by the tagged MU for increasing density ofinterfering femtocells (d = 10m, γth = 0dB).
independent of the coordination procedure that is employed, the system capacity reduceswith increasing density of interfering femtocells. However, by employing the CMs, thetagged user may achieve higher rates owing to the reduction of the aggregate CCI.
For the next set of results, we compare the evident benefits of the CMs for themacrocell tier with their impact on the underlaid femtocell tier using outage probabilityand average channel capacity at the tagged FU as figures of merit. To perform thatcomparisons we consider all situations where serving femtocell may end up, namely, ineither shared or priority parts. First, we compare the outage probability between tiers inFig. 14. From this figure, one can see the effect of the FU proximity to the servingMBS, which dominates the interference in the priority part: even though the taggedreceiver in the priority part enjoys the benefits of the CM, the closer that FU is to theserving MBS antenna the worst performance it achieves in terms of outage probability.
74
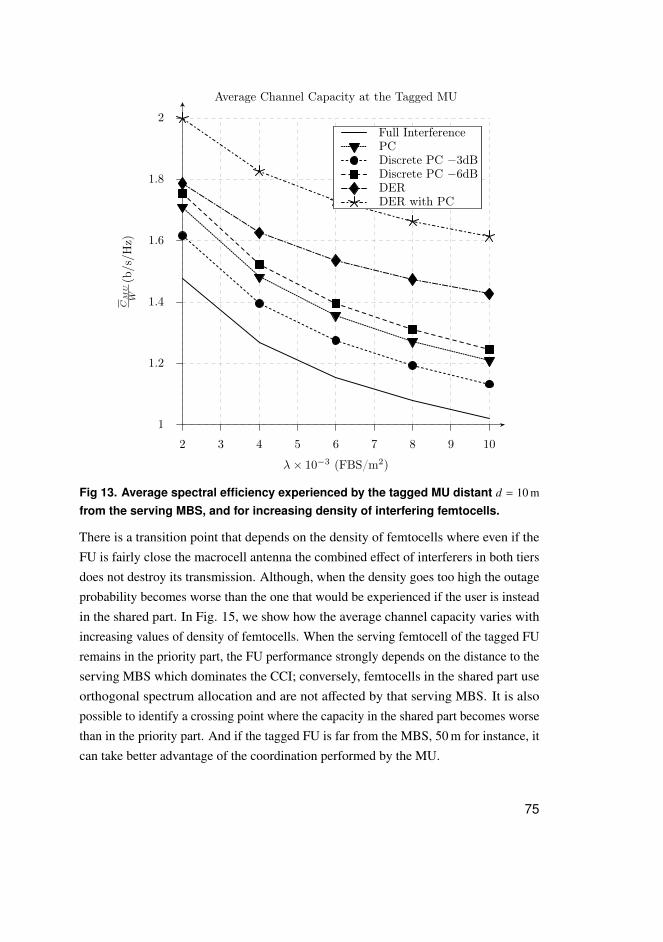
1
1.2
1.4
1.6
1.8
2
2 3 4 5 6 7 8 9 10
CM
U
W(b/s/H
z)
λ× 10−3 (FBS/m2)
Average Channel Capacity at the Tagged MU
Full InterferencePCDiscrete PC −3dBDiscrete PC −6dBDERDER with PC
Fig 13. Average spectral efficiency experienced by the tagged MU distant d = 10 m
from the serving MBS, and for increasing density of interfering femtocells.
There is a transition point that depends on the density of femtocells where even if theFU is fairly close the macrocell antenna the combined effect of interferers in both tiersdoes not destroy its transmission. Although, when the density goes too high the outageprobability becomes worse than the one that would be experienced if the user is insteadin the shared part. In Fig. 15, we show how the average channel capacity varies withincreasing values of density of femtocells. When the serving femtocell of the tagged FUremains in the priority part, the FU performance strongly depends on the distance to theserving MBS which dominates the CCI; conversely, femtocells in the shared part useorthogonal spectrum allocation and are not affected by that serving MBS. It is alsopossible to identify a crossing point where the capacity in the shared part becomes worsethan in the priority part. And if the tagged FU is far from the MBS, 50 m for instance, itcan take better advantage of the coordination performed by the MU.
75
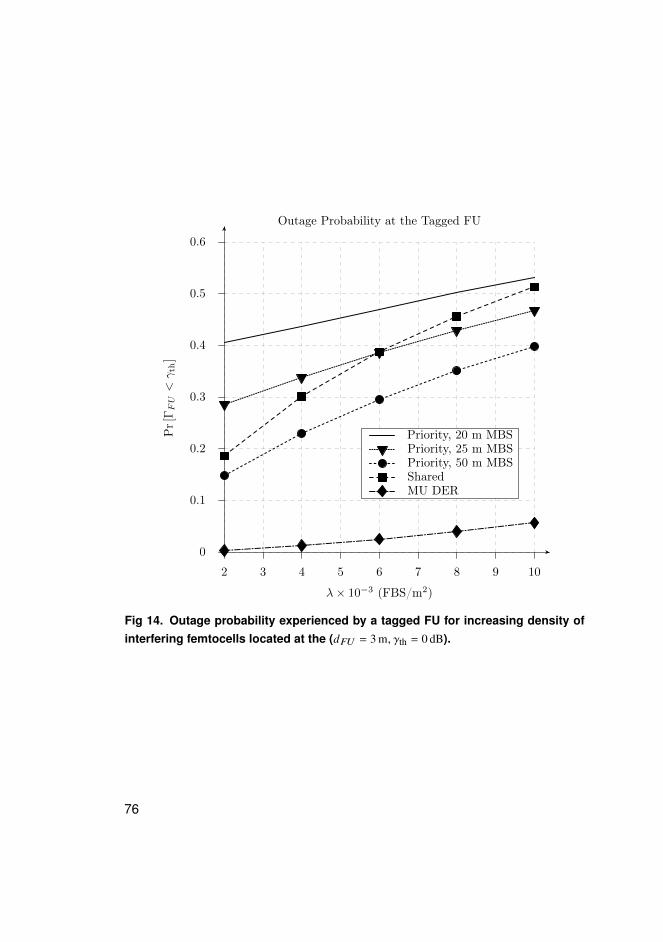
0
0.1
0.2
0.3
0.4
0.5
0.6
2 3 4 5 6 7 8 9 10
Pr
[ΓFU<γth
]
λ× 10−3 (FBS/m2)
Outage Probability at the Tagged FU
Priority, 20 m MBSPriority, 25 m MBSPriority, 50 m MBSSharedMU DER
Fig 14. Outage probability experienced by a tagged FU for increasing density ofinterfering femtocells located at the (dFU = 3 m, γth = 0 dB).
76
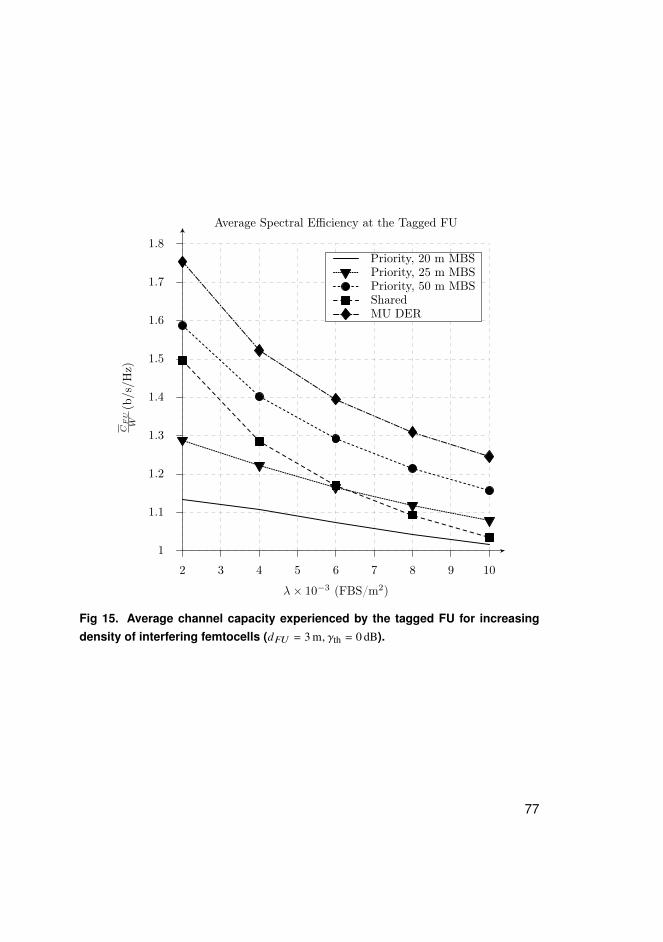
1
1.1
1.2
1.3
1.4
1.5
1.6
1.7
1.8
2 3 4 5 6 7 8 9 10
CF
U
W(b/s/H
z)
λ× 10−3 (FBS/m2)
Average Spectral Efficiency at the Tagged FU
Priority, 20 m MBSPriority, 25 m MBSPriority, 50 m MBSSharedMU DER
Fig 15. Average channel capacity experienced by the tagged FU for increasingdensity of interfering femtocells (dFU = 3 m, γth = 0 dB).
77
3.7 Summary and final remarks
in this chapter, Coordination Mechanisms are assessed in the DL of macrocell-to-femtocoexistence scenarios. We investigate self-organizing deployments where standalonefemtocells operate autonomously. The analytical framework of Chapter 2 is used toapproximate the aggregate interference at the tagged receiver. Numerical results obtainedwith Monte Carlo simulations corroborate the accuracy of the proposed framework. Weconsider two evaluation scenarios, namely, the coordinated and uncoordinated cases,which depend on the coordination levels of femtocells. The coordinated scenariosemploying CMs substantially outperform the operation of an uncoordinated deploymentof femtocells. Results show that the CMs are indeed a promising strategy to cope withinterference and opportunistically reuse radio resources on both tiers. As a result ofusing such distributed strategies, spectral efficiency is substantially increased in thehierarchical scenarios under study. The concept of extending the range of cooperationby repeating a victim user’s reference message among femtocells that have not detectedit initially is considered for further study [32]. We consider a PC algorithm which fullycompensates for the desired user’s channel attenuation, but the idea of fractional PC canbe also used to further reduce femtocell’s transmit power. In addition, the optimizationof the investigated solutions constitute an interesting aspect of the problem under study.For instance, one can combine stochastic geometry with a distributed optimizationframework, such as game theory in a way similar to [107] where authors study themobile association problem through spatial SINR games.
78
4 Coordinated TDD-underlay forself-organizing femtocells in two-tiercoexistence scenarios
The Time Division Duplexing (TDD) concept is investigated as an alternative to underlayshort-range small cells on the Uplink of legacy macrocells. To cope with the resultingco-channel interference across tiers, small cells use a distributed mechanism which isbased on regular busy tones and requires minimal signaling exchange. The frameworkof Chapter 2 is adapted to the TDD-underlay scenarios so as to properly capture networkdynamics as well as reflect channel variations on the achievable performance. In thatregard, we investigate how the fading correlation between data and signaling channelsaffect the proposed coordination strategies. After recovering the distribution of theco-channel interference using the Log-Normal (LN) approximation, we evaluate thesystem performance in terms of the outage probability and average channel capacitywith respect to the receiver of interest. Monte Carlo simulations are used to corroboratethe analytical results as well.
4.1 Motivations and related work
Lately, the concept of small cells emerged as a promising solution to achieve thestringent requirements of the next generation of cellular systems owing to the intrinsicbetter link quality of short range communications. In this context, small cells constitutean inexpensive alternative to provide better indoor coverage, fairness at cell border andoffloading of the overlaid macrocells [19, 71]. However, the unplanned deployment anduncoordinated operation of such small cells leads to harsh Co-Channel Interference (CCI)across tiers [36].
To deal with the interference problem in two-tier Heteronegeous Networks (HetNets),various solutions have been proposed. For instance, López–Pérez et al. first characterizethe cross-tier interference problem and then provide a comprehensive summary ofcandidate solutions wherein the use of dynamic spectrum allocation in conjunctionwith self-configuration and optimization of femtocells play a determinant role [17].Similarly, a sub-band scheduling and interference cancellation mechanism is proposed
79
in [18] by which the macrocell bandwidth is partitioned and femtocells use load-spillageto control their power across the sub-bands. As an alternative to the typical spectrumpartitioning solutions, the TDD-underlay concept is proposed in [30] to take advantageof the natural traffic asymmetry between the Downlink (DL) and Uplink (UL), as wellas the natural user spatial diversity. Unfortunately, time-multiplexed links operating inuniversal frequency reuse are still exposed to the CCI generated by dominant interfererstransmitting in an uncoordinated manner. Thus, we augment the TDD-underlay conceptby incorporating a distributed mechanism which dynamically coordinates inter-celltime-slot allocation to avoid strong interference from nearby conflicting transmitters[18, 28].
Hence, we propose coordination strategies which consist of a decision criterion(whether to coordinate or not) and an interference avoidance algorithm. According tothe adopted policy, short-range femtocells then coordinate their transmissions withco-channel interferers by means of regular busy tones. Additionally, we evaluate thetwo-tier coexistence scenarios considering a practical radio channel propagation modelwhich includes path loss attenuation, shadowing and multi-path fading.
4.2 System model
To properly characterize the TDD-underlay evaluation scenarios, we update the prop-agation radio channel and deployment models of Sections 2.3 and 2.4 as presentednext.
4.2.1 Network deployment model
Using the framework introduced in Chapter 3, we model two-tier HetNets with smallcells underlaid in the UL of a reference Macro Base Station (MBS) through the TDDmode [77]. The locations of femtocells in the underlaid tier (unplanned deployment)constitute the homogeneous Poisson Point Process (PPP) Φ with density λ (Femto BaseStations (FBSs)/m2) in R2 at any given time instant. From Section 2.4, recall that aMarked Point Process (MPP) on the product space R2 × R+ with intensity λ fX (x) isobtained by associating the fading effect with each point of Φ [32] as
Φ = (ϕ, x) ; ϕ ∈ Φ , (41)
80
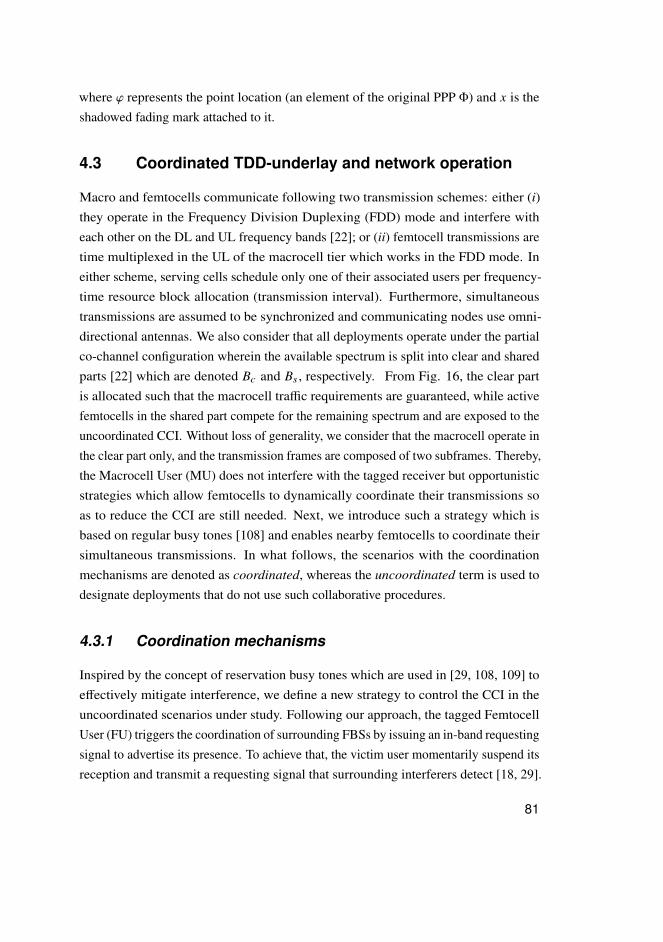
where ϕ represents the point location (an element of the original PPP Φ) and x is theshadowed fading mark attached to it.
4.3 Coordinated TDD-underlay and network operation
Macro and femtocells communicate following two transmission schemes: either (i)they operate in the Frequency Division Duplexing (FDD) mode and interfere witheach other on the DL and UL frequency bands [22]; or (ii) femtocell transmissions aretime multiplexed in the UL of the macrocell tier which works in the FDD mode. Ineither scheme, serving cells schedule only one of their associated users per frequency-time resource block allocation (transmission interval). Furthermore, simultaneoustransmissions are assumed to be synchronized and communicating nodes use omni-directional antennas. We also consider that all deployments operate under the partialco-channel configuration wherein the available spectrum is split into clear and sharedparts [22] which are denoted Bc and Bs , respectively. From Fig. 16, the clear partis allocated such that the macrocell traffic requirements are guaranteed, while activefemtocells in the shared part compete for the remaining spectrum and are exposed to theuncoordinated CCI. Without loss of generality, we consider that the macrocell operate inthe clear part only, and the transmission frames are composed of two subframes. Thereby,the Macrocell User (MU) does not interfere with the tagged receiver but opportunisticstrategies which allow femtocells to dynamically coordinate their transmissions soas to reduce the CCI are still needed. Next, we introduce such a strategy which isbased on regular busy tones [108] and enables nearby femtocells to coordinate theirsimultaneous transmissions. In what follows, the scenarios with the coordinationmechanisms are denoted as coordinated, whereas the uncoordinated term is used todesignate deployments that do not use such collaborative procedures.
4.3.1 Coordination mechanisms
Inspired by the concept of reservation busy tones which are used in [29, 108, 109] toeffectively mitigate interference, we define a new strategy to control the CCI in theuncoordinated scenarios under study. Following our approach, the tagged FemtocellUser (FU) triggers the coordination of surrounding FBSs by issuing an in-band requestingsignal to advertise its presence. To achieve that, the victim user momentarily suspend itsreception and transmit a requesting signal that surrounding interferers detect [18, 29].
81
t
f
MBSDL
MBSDL
TDD
FBS
Partial Co-ChannelConfiguration
MBS UL
TDD FBS
Fig 16. The dynamic partial co-channel configuration. Small cells are TDD-underlaid in the UL of macrocells with partial co-channel configuration [22].
Different from the original busy burst solution whereby detecting transmitters estimatetheir interference parcel from the received feedback; herein, surrounding femtocells onlyuse the busy tone as an indication of the nearby victim receiver presence. To reduce thelikelihood that multiple simultaneous requests trigger the coordination procedure, aninterference margin can be introduced in order to reduce the sensitivity of potentialinterferers to the triggering criterion. The beacon power is maintained low so as toideally restrict the group of detecting femtocells to the dominant set of interferers. It isalso worth noting that any FBS that has already triggered the coordination procedureignores further requests that may occur while transactions related to the first one are stillafoot.
Transmitters use distinct Coordination Mechanisms (CMs) to control their CCIparcel which is inflicted on the macrocell tier and themselves. The tagged femtocellreceiver initiates the coordination procedure by experiencing the aggregate CCI above apredefined triggering threshold [103]. The network performance is assessed providedthat the triggering criterion has been already satisfied. Potential interferers use thetagged receiver requesting beacon to decide about their participation in the upcomingcoordination procedure.
In a distributed manner, interferers employ two distinct decision criteria, namely,CM1 and CM2. By following the former, potential interferers coordinate based solelyon the received signal strength of the coordination beacon. With the latter, potentialinterferers alternatively use the received beacon to estimate their channel gain to thetagged receiver and then use their intending transmit power to compute the interference
82
they would cause on that receiver similar to the busy burst solution introduced in [28].In fact, surrounding interferers do not coordinate only by detecting the victim receiver,but use the received beacon to estimate if their interference component is above thecoordination threshold ρth. Notice that the channel gain between each such interferer andthe tagged receiver is assumed to be perfectly estimated (this is important to guaranteethat the coordination criterion of CM2 encompasses the one of CM1).
In the CM1, the event that surrounding interferers detect the coordination beacon ofthe user of interest pb above the predefined coordination threshold ρth is denoted by
Υ1 =pbR−αX ≥ ρth
. (42)
where R represents the distribution of the distance separating interferers from the taggedreceiver and X is the distribution of the shadowed fading. From the event in (42), weintroduce the following indicator function,
1Υ1
(pbr−α x
)=
1, if pbr−α x ∈ Υ1
0, otherwise,(43)
which defines the first coordination region denoted by R1, and is composed of FBSsthat do detect the victim receiver in their vicinity (under the assumptions of Υ1). Inaccordance with the formulation of Section 4.2.1, femtocells within this region constitutea MPP denoted by Φ1 =
(ϕ, x) ∈ Φ | pbr−α x ≥ ρth
. Similarly, femtocells which do
not detect the victim MU form a process Φ2 =(ϕ, x) ∈ Φ | pbr−α x < ρth
in R2,. The
coordination regions R1 and R2 are disjoint and statistically independent by construction,therefore it follows immediately from the Superposition theorem [78] that Φ = Φ1 ∪ Φ2.
Similarly, the detection event of the strategy CM2 is defined as
Υ2 =PR−αX ≥ ρth , pbR−αX ≥ ρth
. (44)
where P yields the potential interferer’s transmit power Random Variable (RV). Finally,we specify the coordination regions for the event Υ2 using (44) as in the previous case.
Considering two distinct realizations of the HetNet under study, Fig. 17 comparesthe random sets of non-coordinating small cells (in R2) which are obtained using eachcoordination criteria at a time. It is worth noticing that after coordinating, the taggedreceiver is only interfered by active transmitters in R2, since nodes in R1 switch tonon-conflicting resource allocations.
83
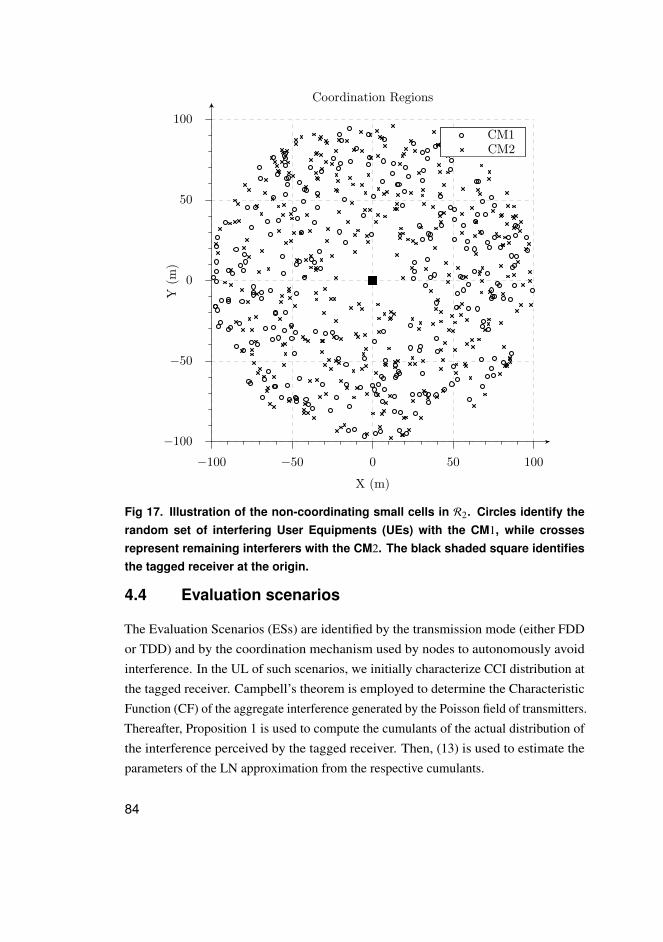
−100
−50
0
50
100
−100 −50 0 50 100
Y(m
)
X (m)
Coordination Regions
CM1CM2
Fig 17. Illustration of the non-coordinating small cells in R2. Circles identify therandom set of interfering User Equipments (UEs) with the CM1, while crossesrepresent remaining interferers with the CM2. The black shaded square identifiesthe tagged receiver at the origin.
4.4 Evaluation scenarios
The Evaluation Scenarios (ESs) are identified by the transmission mode (either FDDor TDD) and by the coordination mechanism used by nodes to autonomously avoidinterference. In the UL of such scenarios, we initially characterize CCI distribution atthe tagged receiver. Campbell’s theorem is employed to determine the CharacteristicFunction (CF) of the aggregate interference generated by the Poisson field of transmitters.Thereafter, Proposition 1 is used to compute the cumulants of the actual distribution ofthe interference perceived by the tagged receiver. Then, (13) is used to estimate theparameters of the LN approximation from the respective cumulants.
84
4.4.1 Uncoordinated scenarios
Co-channel transmitters use Bs without exchanging any information about their intendingtransmissions. We first address the UL performance of the two-tier HetNet in the FDDconfiguration, and the TDD-underlay mode afterward.
FDD mode
We name this uncoordinated deployment as ES1. FUs transmit in the FDD mode lackingany sort of coordination with other co-channel transmitters in surrounding femtocells.As a consequence, communicating links are exposed to the highest interference levels.The resulting interference caused by interferers within O and belonging to the pointprocess Φ as defined by (41). The respective cumulants are derived by following amathematical treatment similar to the full interference case in Section 3.4.1 (on page 61).Our next corollary gives the nth cumulant of the aggregate CCI at the tagged receiver inthe configuration of the ES1.
Corollary 3. Consider the ES1; then, the nth cumulant of the aggregate CCI perceived
by the tagged receiver within O and with respect to Φ is given by,
κn(Φ)
=2πλ pn
nα − 2
(Rm
2−αn − RM2−αn
)EnX[0,∞] . (45)
TDD-underlay mode
This is an uncoordinated deployment as well, though FUs are now time multiplexed inthe UL of the macrocell tier (see Fig. 16). The tagged receiver operates in the first of thetwo slots which compose the UL frame structure [30]. This scenarios is designated byES2 and the aggregate interference is caused by transmitters which operate in the firsttime slot within O and belong to the point process Φ with intensity ϑλ fX (x). Hence,by observing that transmitters independently access either slot with equal probability(ϑ = 50 %) and that all interfering nodes communicate with the fixed transmit power p,we extend the result of (45) to derive the cumulants for the uncoordinated TDD-underlaycase as follows.
Corollary 4. Under the assumption of the ES2, the nth cumulant of the aggregate CCI
85
perceived by the tagged receiver within O and with respect to Φ is given by,
κn(Φ)
=2πϑλ pn
nα − 2
(Rm
2−αn − RM2−αn
)EnX[0,∞] . (46)
4.4.2 Coordinated scenarios
We discuss coordinated scenarios wherein self-organizing femtocells coordinate withnearby potential interferers so as to reduce the overall CCI. When operating in the FDDmode, femtocells use the strategy CM1 only, while in the TDD-underlay configurationthe femtocell tier benefits from both criteria as described in Section 4.3.
FDD mode and CM1
In this scenario, which is denoted by ES3, femtocells coordinate using the CM1 giventhat Υ1 is satisfied. In the FDD mode, UL and DL operate over distinct frequencybands which gives rise to uncorrelated fading between beacon and data (signaling andcommunication) channels. Data and signaling channels have shadowed fading withcomposite Gamma and LN distributions (see Section 2.3) and are represented by theindependent and identically distributed (i.i.d.) RVs X and Y , respectively. The remainingCCI at the tagged receiver is characterized by and its nth cumulant is,
Proposition 8. Consider the ES3 with FDD mode and CM1 as described above; then,
the nth cumulant of the aggregate CCI perceived by the tagged receiver in O with respect
to Φ2 has the following form,
κn(Φ2
)=
2πϑλ pn EnX [0,∞]
nα − 2
(R2−αnm − R2−αn
M
)FY
(Rαm %th
)+ %
n− 2α
th E2α −n
Y
[Rαm %th , RαM %th ,
]− R2−nα
M
[FY
(RαM %th
)− FY
(RαM %th
)] .
(47)
where %th =ρthpb
is the normalized coordination threshold.
Proof. See Appendix 4.
86
TDD-underlay and CM1
We characterize the ES4 where femtocells still follow the coordination criterion Υ1 asshown in (42). However, recall that the coordination is carried out through in-bandsignaling exchange so that data and signaling channels are fully correlated (channelreciprocity) in the TDD configuration. As described in Section 4.3, non-detectingfemtocells of Φ2 in R2 constitute the remaining set of interferers.
Proposition 9. Consider the Interference Profile (IP)4, then the nth cumulant of the
aggregate CCI perceived by the tagged receiver in O with respect to Φ2 has the following
form,
κn(Φ2
)=
2πϑλ pn
nα − 2
(R2−αnm − R2−αn
M
)EnX
[−∞, %m
]+ %
n− 2α
thE
2α
X
[%m , %M
]− R2−nα
M EnX
[%m , %M
] . (48)
Proof. See Appendix 5.
TDD-underlay and CM2
This scenario is represented by the ES5 wherein transmitters decide whether or not tocoordinate based on their interference contribution to the aggregate CCI at the taggedreceiver [28]. Conditional Υ2, the coordination procedure is carried out in the twofollowing steps. After detecting the tagged receiver, intending transmitters rely onthe channel reciprocity and use the received beacon strength to estimate their channelattenuation to that victim receiver. Thereafter, transmitters adapt their link to meet theminimum requirement of their desired receivers and still being able to transmit togetherwith the tagged link. The standard Power Control (PC) algorithm is used by FUs toadjust their power so as to compensate for the desired receiver channel attenuations[104]. We assume that FUs are uniformly distributed within the transmission range ofserving cells which schedule a random user in every transmission interval. The transmitpower is set as a function of the distance between transmitter and receiver peers, butindependently of the interference at the latter. Using our previous result in Lemma 1, thenth cumulant of the resulting aggregate CCI is written as follows,
Proposition 10. Consider the IP5, then the nth cumulant of the aggregate CCI perceived
87
by the tagged receiver in O with respect to Φ2 has the following form,
κn(Φ2
)=
2πϑλnα − 2
[T1 + T2 − T3
](49)
where T1, T2 and T3 are derived in Appendix 6.
Proof. See Appendix 6.
4.4.3 Approximating the aggregate CCI
For each one the evaluation scenarios, the analytical framework of Section 2.5 is usedto recover the respective aggregate CCI. In this example, the observation region isdetermined with Rm = 1 m and RM = 100 m. The density of interferers is λ = 0.05FBS/m2. In the TDD-underlay mode, femtocells choose either slot with equal probabilityϑ = 50%. The radio channel is affected by path loss with exponent α = 3, LN shadowingwith σdB = 6 dB, and Nakagami fading with shape factor either m = 16. FUs transmitat fixed power level of p = 20 dBm. With the standard PC algorithm, transmitterscontrol their power to fully compensate for the average value of the desired receivers’large-scale fading.
Fig. 18 compares the Complementary Cumulative Distribution Function (CCDF) ofthe aggregate CCI from Monte Carlo simulations with those from the LN approximation.As can be seen from these figures, the LN approximation matches well with thesimulation results. In the coordinated scenarios, a coordination threshold of ρth =
−40dBm and requesting power of pb = 0 dBm are used. Comparing the aggregateCCI of uncoordinated scenarios with that of the coordinated ones, we observe thatthe two-tier networks under study benefit most from avoiding dominant interferersthrough the coordination strategies. In fact, the coordinated cases provide gains due tothe formation of dynamic exclusion regions around the tagged receiver
4.5 Numerical results
Using the same assumptions and configuration parameters given above in Section4.4.3, we assess how the CM perform in terms of outage probability and averagechannel capacity. In Fig. 19, we use Theorem 3 to plot the outage probability for anincreasing density of FUs. The uncoordinated scenarios present the poorest performance,while in the time-multiplexing scenario the tagged receiver experiences slightly better
88
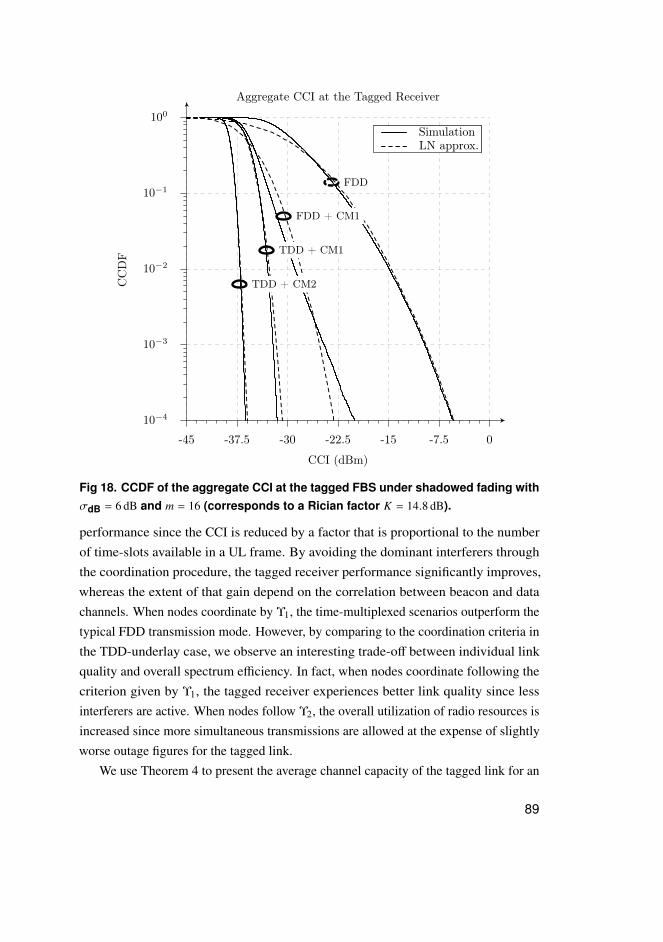
10−4
10−3
10−2
10−1
100
-45 -37.5 -30 -22.5 -15 -7.5 0
CC
DF
CCI (dBm)
Aggregate CCI at the Tagged Receiver
SimulationLN approx.
FDD
FDD + CM1
TDD + CM1
TDD + CM2
Fig 18. CCDF of the aggregate CCI at the tagged FBS under shadowed fading withσdB = 6 dB and m = 16 (corresponds to a Rician factor K = 14.8 dB).
performance since the CCI is reduced by a factor that is proportional to the numberof time-slots available in a UL frame. By avoiding the dominant interferers throughthe coordination procedure, the tagged receiver performance significantly improves,whereas the extent of that gain depend on the correlation between beacon and datachannels. When nodes coordinate by Υ1, the time-multiplexed scenarios outperform thetypical FDD transmission mode. However, by comparing to the coordination criteria inthe TDD-underlay case, we observe an interesting trade-off between individual linkquality and overall spectrum efficiency. In fact, when nodes coordinate following thecriterion given by Υ1, the tagged receiver experiences better link quality since lessinterferers are active. When nodes follow Υ2, the overall utilization of radio resources isincreased since more simultaneous transmissions are allowed at the expense of slightlyworse outage figures for the tagged link.
We use Theorem 4 to present the average channel capacity of the tagged link for an
89
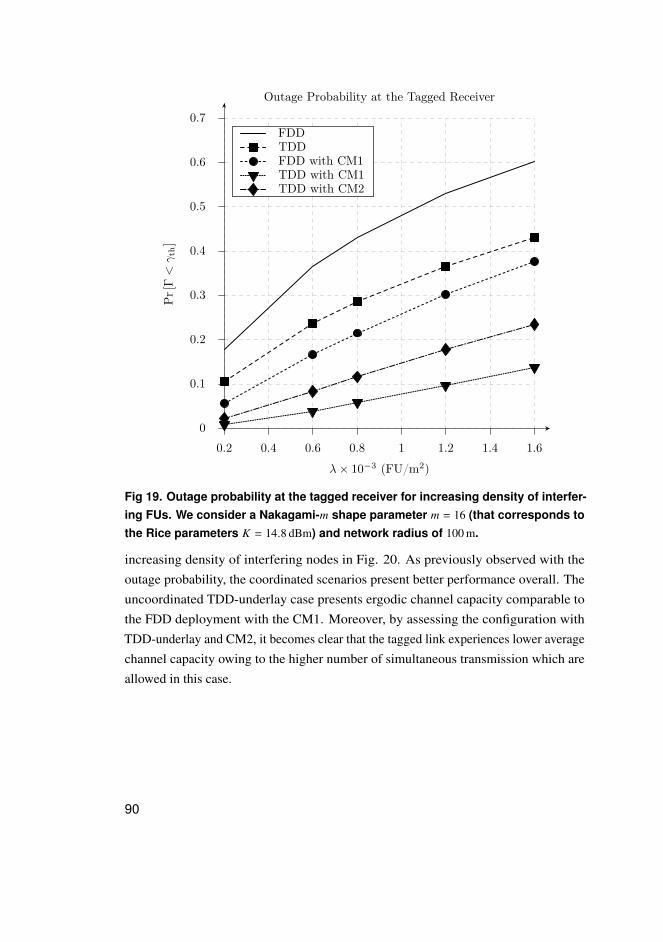
0
0.1
0.2
0.3
0.4
0.5
0.6
0.7
0.2 0.4 0.6 0.8 1 1.2 1.4 1.6
Pr
[Γ<γth
]
λ× 10−3 (FU/m2)
Outage Probability at the Tagged Receiver
FDDTDDFDD with CM1TDD with CM1TDD with CM2
Fig 19. Outage probability at the tagged receiver for increasing density of interfer-ing FUs. We consider a Nakagami-m shape parameter m = 16 (that corresponds tothe Rice parameters K = 14.8 dBm) and network radius of 100 m.
increasing density of interfering nodes in Fig. 20. As previously observed with theoutage probability, the coordinated scenarios present better performance overall. Theuncoordinated TDD-underlay case presents ergodic channel capacity comparable tothe FDD deployment with the CM1. Moreover, by assessing the configuration withTDD-underlay and CM2, it becomes clear that the tagged link experiences lower averagechannel capacity owing to the higher number of simultaneous transmission which areallowed in this case.
90
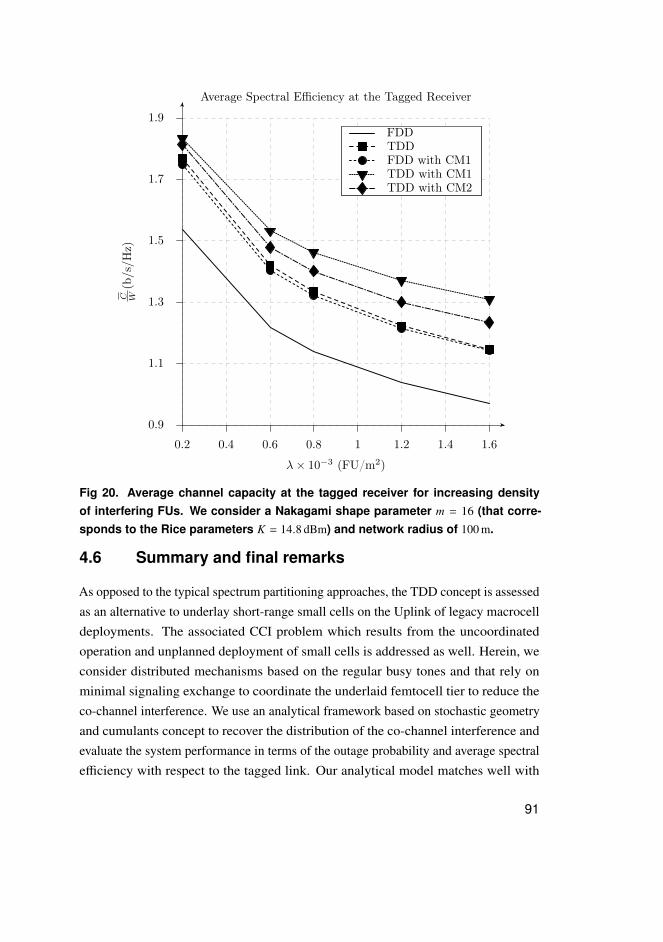
0.9
1.1
1.3
1.5
1.7
1.9
0.2 0.4 0.6 0.8 1 1.2 1.4 1.6
C W(b/s/H
z)
λ× 10−3 (FU/m2)
Average Spectral Efficiency at the Tagged Receiver
FDDTDDFDD with CM1TDD with CM1TDD with CM2
Fig 20. Average channel capacity at the tagged receiver for increasing densityof interfering FUs. We consider a Nakagami shape parameter m = 16 (that corre-sponds to the Rice parameters K = 14.8 dBm) and network radius of 100 m.
4.6 Summary and final remarks
As opposed to the typical spectrum partitioning approaches, the TDD concept is assessedas an alternative to underlay short-range small cells on the Uplink of legacy macrocelldeployments. The associated CCI problem which results from the uncoordinatedoperation and unplanned deployment of small cells is addressed as well. Herein, weconsider distributed mechanisms based on the regular busy tones and that rely onminimal signaling exchange to coordinate the underlaid femtocell tier to reduce theco-channel interference. We use an analytical framework based on stochastic geometryand cumulants concept to recover the distribution of the co-channel interference andevaluate the system performance in terms of the outage probability and average spectralefficiency with respect to the tagged link. Our analytical model matches well with
91
numerical results obtained using Monte Carlo simulations. When compared to theuncoordinated Frequency Division Duplexing deployment, the outage probability of theevaluation scenarios with the coordinated TDD-underlay solution is reduced by nearly80 %, while the average spectral efficiency increases by approximately 90 % at highloads.
92
5 Self-organization in Long TermEvolution (LTE) systems and advancedtechniques
We assess the self-organizing Heteronegeous Networks (HetNets) composed of legacymacrocells and self-organizing picocells. Aiming to improve coverage, cell-edgethroughput and overall system capacity, self-organizing solutions, such as rangeexpansion bias, almost blank subframe and distributed antenna systems are considered.We use stochastic geometry to model network deployments and the cumulants concept tocharacterize the probability distribution of the received power and aggregate interferenceat the user of interest. A shadowed fading channel model incorporating log-normalshadowing and Nakagami-m fading is used. The formulation of Section 2.8 is then usedto evaluate the performance of such self-organizing networks in terms of their outageprobability and average channel capacity with respect to the tagged receiver. MonteCarlo simulations are also used to valiadte analytical results.
5.1 Motivation and related work
Targeting at upcoming releases, the 3rd Generation Partnership Project (3GPP) standard-ization body has focused on enhancing the end-user satisfaction and performance ofLTE systems by adopting new deployments strategies and concepts such as HetNets andself-organization. In fact, legacy cellular systems with predefined structure and central-ized coordination cannot keep up with the stringent requirements of next generationwireless systems, which demand high spectral efficiency and ubiquitous coverage withfairness at cell border. For instance, LTE-Advanced aims at peak data rates up to 1 Gbpswhich contrasts with current LTE systems which deliver at most 100 Mbps or evenAsymmetric Digital Subscriber Line (ADSL) technology over cooper landlines that cantransmit at 24 Mbps only. Operators have indeed very few options available to meetsuch requirements: increase the density of macrocell sites, but that hinges on regulatorystudies and approval; upgrade Radio Access Technology (RAT) which takes time and donot fill the capacity gap completely; or expand the radio spectrum resource, but that isdefinitely a very expensive and lingering alternative.
93
In this context, heterogeneous deployments which underlay legacy macrocells withlow-cost, -power and -complexity small cells emerge as a promising and inexpensivealternative to meet these strict requirements. Future networks indeed benefit fromself-organization in several situations, for example, to cope with the uncertainties ofrandom networks wherein moving nodes need to communicate over volatile wirelesschannels; and to dynamically reconfigure and maintain infrastructureless deploymentsof small cells with large amount of nodes in which traditional and centralized methodsbecome costly or even unfeasible. In order to tap into the full benefits of large-scaleSelf-Organizing Networks (SONs), a number of challenges still need to be tackled,including their deployment, operation, automation and maintenance [3, 12].
The design and implementation of self-organizing functionalities in HetNets is atopic of significant interest as evidenced by the number of recent publications [1, 3, 4, 13–16]. For instance, the self-organization concept is used to devise cognitive radio resourcemanagement schemes to mitigate cross-tier interference and guarantee users Quality ofService (QoS) in distinct heterogeneous deployments scenarios [21]. More recently,the Range Expansion Bias (REB) concept is discussed within 3GPP as a baselinesolution to boost the offloading potential of heterogeneous deployments. In that regard,Authors in [35] investigate the cell range expansion and interference mitigation inheterogeneous networks. Following the same lines, Güvenç instigates the capacity andfairness of heterogeneous networks with range expansion and interference coordination[13]. In [16], Jo et al. use the Stochastic Geometry (SG) framework to assess howthe biased cell association procedure performs in heterogeneous networks by meansof the outage probability. Moreover, in [110] Hosseini et al. introduce the reversedTime Division Duplexing (TDD) scheme and compare the trade off between deployingmassive Multiple-Input Multiple-Output (MIMO) or dense deployment of small cellsin a time based network architecture. Authors evaluate the above system in terms ofthe achievable throughout considering the needed overhead for channel training andestimation of the interference covariance matrix for downlink precoding.
5.2 System model
In preparation for the description of the evaluation scenarios and their performanceanalysis, we first introduce our system models and configuration parameters.
94
5.2.1 Network deployment model
In this section, the Downlink (DL) of a heterogeneous networks consisting of anumbrella Macro Base Station (MBS) and an underlaid tier of self-organizing smallcells is modeled. We assume that MBSs follow centralized coordination and spectrumallocation such that the inter macrocell interference is mitigated, for example, usingfractional frequency reuse [15]. In these scenarios, picocells are uniformly scatteredover the network area, while both tiers operate in TDD mode and share the wholespectrum. In every Sub-Frame (SF), each serving Base Station (BS) schedules a singleuser terminal and interference coordination are implemented in the time-domain. Theset of associated user terminals are also uniformly distributed within the transmissionrange of their serving cells. Nodes communicate using antennas with omni directionalradiation pattern and fixed power. The macrocell tier transmits at a maximum power of46 dBm and picocells use 30 dBm.
Form the framer work of Chapter 2, we know that active picocells constitute ahomogeneous Poisson Point Process (PPP) Φ with density λ in R2. The number ofpicocells in an arbitrary region R of area A is a Poisson Random Variable (RV) withparameter λA [78]. Additionally, we assume the fading effect as a random markassociated with each point of Φ so that the resulting process,
Φ = (ϕ, x) ; ϕ ∈ Φ , (50)
corresponds to a Marked Point Process (MPP) on the product space R2 × R+, whoserandom points ϕ belong to the stationary point process Φ and denote transmitterslocations.
5.3 Biased cell association and handover probability
Following the standard handover procedure [111], the tagged Macrocell User (MU) istransferred to the underlaid picocell tier only if the pilot signal of the target Pico BaseStation (PBS) is strictly higher than the umbrella MBS1 as follows,
Y P > Y M +Ω, (51)
where the RV Y P refers to the power received from the target PBS, Y M yields the powerreceived from the umbrella MBS and Ω is the handover hysteresis to avoid the ping-pong
1We consider that migrating MUs are not affected by the ping-pong effect and that the predefine triggeringtime has already elapsed [112].
95
effect [112].However, in most circumstances, the umbrella MBS overpowers the underlaid tier
which shrinks the coverage of the small cells and compromises the expected gains ofspatial and frequency reuse [13, 35]. In such large-scale heterogeneous deployments,transceivers have various communication capabilities and the restrictive nature of thetypical handover procedure worsen the load unbalance problem across tiers. To alleviatethis problem, 3GPP suggests adding a positive bias ∆REB to the picocells receivedpower so that the rate of MUs handovers to the underlaid tier increases [35] as givennext
Y P + ∆REB > Y M +Ω. (52)
Indeed, the REB prompt the macrocell offloading and improves the spectral efficiencyby relaxing the standard association criteria used by MUs. Unfortunately, by doing so,MUs within the expanded region of picocells do not actually connect to the strongest BSsand are exposed to high interference levels from the macrocell tier. Fig. 21 illustratesthe operation of the REB concept in heterogeneous scenarios composed of an umbrellamacrocell and underlaid picocells. The coverage area of the target picocell is artificiallyincreased by the positive bias ∆REB as indicated by the handover criterion in (52). As aresult, MUs are offloaded to the picocell tier more often and unburden the umbrellamacrocell.
From (52), we derive the probability that the tagged MU within the coverage of theumbrella MBS is offloaded to the target PBS. The Log-Normal (LN) approximation in(13) is used here to recover the distribution of the received power at the tagged receiver.
Proposition 11. Consider the observation region O centered at the tagged receiver and
the biased cell association as described above; then, the probability that the tagged
receiver connects to the target PBS is given by,
Pr[Y M < Y P + δ
]'
K∑k=1
ωk
2√π
g (ηk ), (53)
where δ = ∆REB − Ω, ηk is the k th zero of the Hermite polynomial HK (η) of degree
K, ωk is the corresponding weight of the function g ( · ) at the k th abscissa and
g (η) = 1 + Erf[−µM+µP+
√2ησP√
2σM
].
Proof. See Appendix 7.
96
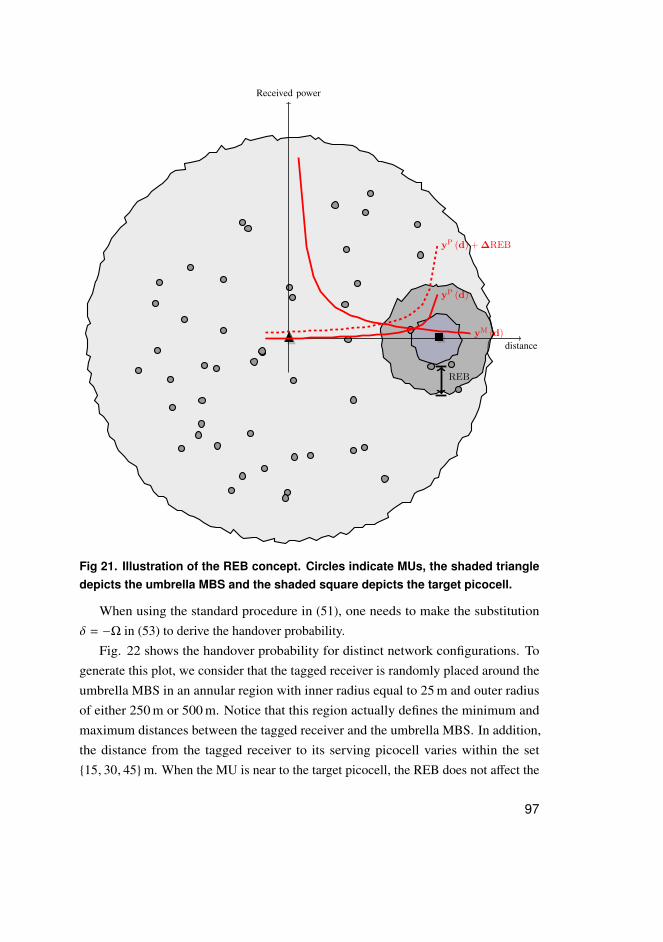
REB
distance
Received power
yM pdq
yP pdq ` !REB
yP pdq
Fig. 1. Illustration of the REB! concept. Circles indicate MU!s, the shaded triangle depicts the umbrella MBS! and the shadedsquare depicts the target picocell.
Fig 21. Illustration of the REB concept. Circles indicate MUs, the shaded triangledepicts the umbrella MBS and the shaded square depicts the target picocell.
When using the standard procedure in (51), one needs to make the substitutionδ = −Ω in (53) to derive the handover probability.
Fig. 22 shows the handover probability for distinct network configurations. Togenerate this plot, we consider that the tagged receiver is randomly placed around theumbrella MBS in an annular region with inner radius equal to 25 m and outer radiusof either 250 m or 500 m. Notice that this region actually defines the minimum andmaximum distances between the tagged receiver and the umbrella MBS. In addition,the distance from the tagged receiver to its serving picocell varies within the set15, 30, 45m. When the MU is near to the target picocell, the REB does not affect the
97
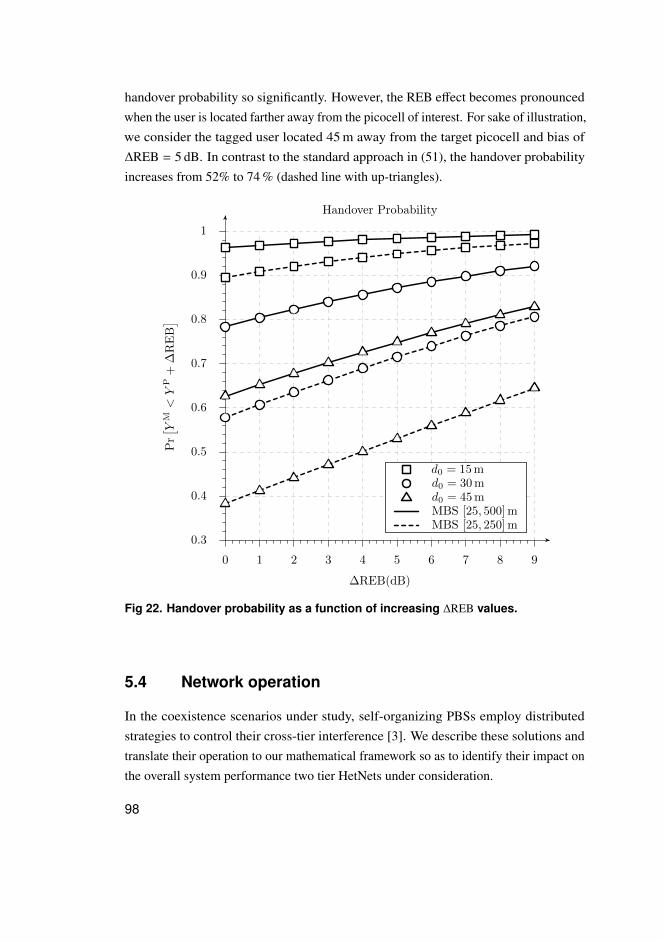
handover probability so significantly. However, the REB effect becomes pronouncedwhen the user is located farther away from the picocell of interest. For sake of illustration,we consider the tagged user located 45 m away from the target picocell and bias of∆REB = 5 dB. In contrast to the standard approach in (51), the handover probabilityincreases from 52% to 74 % (dashed line with up-triangles).
0.3
0.4
0.5
0.6
0.7
0.8
0.9
1
0 1 2 3 4 5 6 7 8 9
Pr[ Y
M<
YP
+∆
RE
B]
∆REB(dB)
Handover Probability
d0 = 15 md0 = 30 md0 = 45 mMBS [25, 500] mMBS [25, 250] m
Fig 22. Handover probability as a function of increasing ∆REB values.
5.4 Network operation
In the coexistence scenarios under study, self-organizing PBSs employ distributedstrategies to control their cross-tier interference [3]. We describe these solutions andtranslate their operation to our mathematical framework so as to identify their impact onthe overall system performance two tier HetNets under consideration.
98
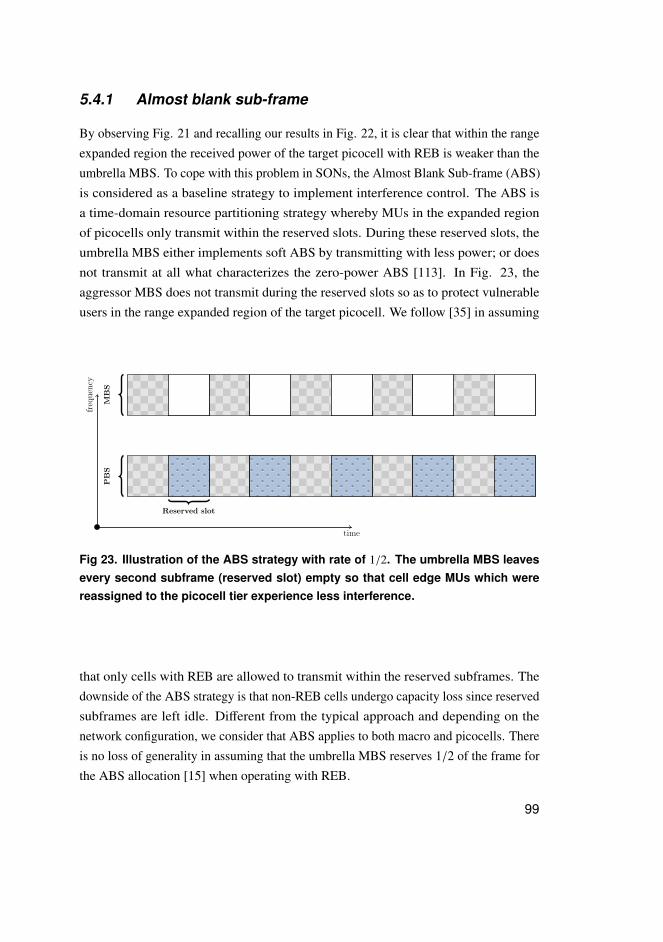
5.4.1 Almost blank sub-frame
By observing Fig. 21 and recalling our results in Fig. 22, it is clear that within the rangeexpanded region the received power of the target picocell with REB is weaker than theumbrella MBS. To cope with this problem in SONs, the Almost Blank Sub-frame (ABS)is considered as a baseline strategy to implement interference control. The ABS isa time-domain resource partitioning strategy whereby MUs in the expanded regionof picocells only transmit within the reserved slots. During these reserved slots, theumbrella MBS either implements soft ABS by transmitting with less power; or doesnot transmit at all what characterizes the zero-power ABS [113]. In Fig. 23, theaggressor MBS does not transmit during the reserved slots so as to protect vulnerableusers in the range expanded region of the target picocell. We follow [35] in assuming
time
freq
uenc
y
MB
SP
BS
Reserved slot
Fig 23. Illustration of the ABS strategy with rate of 1/2. The umbrella MBS leavesevery second subframe (reserved slot) empty so that cell edge MUs which werereassigned to the picocell tier experience less interference.
that only cells with REB are allowed to transmit within the reserved subframes. Thedownside of the ABS strategy is that non-REB cells undergo capacity loss since reservedsubframes are left idle. Different from the typical approach and depending on thenetwork configuration, we consider that ABS applies to both macro and picocells. Thereis no loss of generality in assuming that the umbrella MBS reserves 1/2 of the frame forthe ABS allocation [15] when operating with REB.
99
5.4.2 Downlink–high interference indicator
To avoid the inherent capacity loss of the ABS strategy, we also investigate distributedstrategies that rely on the autonomous coordination of nearby BSs. Inspired by the busytones concept [28] and the interference mitigation technique in [114], we consider theutilization of DL channel measurements for the coordination of interfering picocells. Abitmap indicator which is similar to the Relative Narrowband Transmit Power (RNTP)indicator in Release 8 is used to identify dominant interferers [115]. The taggedMU identifies potential interferers by monitoring their pilot signal and reporting themeasurements to its serving BS. After acquiring this measurement report, the serving BSthen coordinates by exchanging the interference bitmap with the surrounding picocellsvia the X2 interface. The updating period of the DL-High Interference Indicator (HII)messages is a configurable parameter which is comparable to the handover procedure[116].
Within our mathematical framework, the tagged receiver uses the interferencethreshold ρth to identify potential interferers in its vicinity. Since our network operatesin TDD mode, we assume that the channels for measurements and data transmissionsare fully correlated. Furthermore, the channel gain between active interferers and thetagged receiver are assumed to be perfectly estimated by the receiver of interest.
Under the above assumptions, the set of dominant interferers is identified by thefollowing indicator function,
1Φ
(pbr−α x
)=
1, if pbr−α x ≥ ρth
0, otherwise,(54)
which defines the first coordination region denoted by R1, and where pb is the transmitpower of the reference signal of surrounding picocells.
In accordance with the formulation of Section 5.2.1, picocells within this regionconstitute a MPP which is denoted by Φ1 =
(ϕ, x) ∈ Φ | pbr−α x ≥ ρth
. Similarly,
picocells in R2, which are not detected by the MU of interest, form the processΦ2 = Φ\Φ1. Recall that the coordination regions R1 and R2 are disjoint and statisticallyindependent by construction, therefore it follows immediately from the Superpositiontheorem [78] that Φ = Φ1 ∪ Φ2. Fig. 24 illustrates the resulting coordination regions byfollowing the criterion in (54). It is worth noticing that after coordinating, the taggedreceiver is only interfered by active transmitters in R2, since nodes in R1 switch tonon-conflicting resource allocation.
100
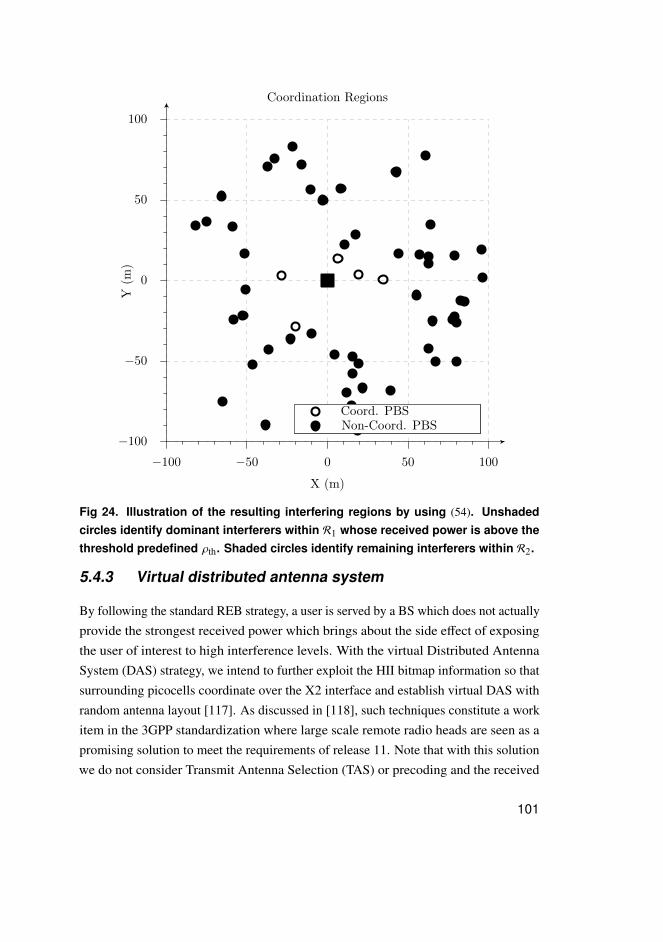
−100
−50
0
50
100
−100 −50 0 50 100
Y(m
)
X (m)
Coordination Regions
Coord. PBSNon-Coord. PBS
Fig 24. Illustration of the resulting interfering regions by using (54). Unshadedcircles identify dominant interferers within R1 whose received power is above thethreshold predefined ρth. Shaded circles identify remaining interferers within R2.
5.4.3 Virtual distributed antenna system
By following the standard REB strategy, a user is served by a BS which does not actuallyprovide the strongest received power which brings about the side effect of exposingthe user of interest to high interference levels. With the virtual Distributed AntennaSystem (DAS) strategy, we intend to further exploit the HII bitmap information so thatsurrounding picocells coordinate over the X2 interface and establish virtual DAS withrandom antenna layout [117]. As discussed in [118], such techniques constitute a workitem in the 3GPP standardization where large scale remote radio heads are seen as apromising solution to meet the requirements of release 11. Note that with this solutionwe do not consider Transmit Antenna Selection (TAS) or precoding and the received
101
signals of the serving DAS coherently add at the user of interest. Instead of consideringthe REB, the tagged MU uses the aggregate received power from the serving groupwhich belongs to Φ1. Similar to the coordinated multipoints strategy, this solutionrequires the user data to be available at all coordinating picocells which in its turnrequires extra singling exchange and more elaborated backhaul infrastructure [119].Our strategy is similar to the maximum ratio transmission [73] by which all antennaelements transmit the same information and the aggregate received power is∑
(ϕ,x)∈Φ1
Y P(ϕ, x) , (55)
where Y P(ϕ, x) yields the received power from the picocell at ϕ with shadowed fading x.In what follows, we initially extend the analytical framework presented in [36] to
evaluate how these distributed strategies perform in heterogeneous networks composedof self-organizing small cells and legacy macrocells. Thereafter, the performance of theSON is evaluated in terms of Signal-to-Interference Ratio (SIR), outage probability andaverage spectral efficiency as shown in Section 2.8.
5.5 Interference model
Under the assumptions of Section 5.2 and with respect to the tagged receiver, wenow use our analytical framework to derive the probability distributions of the desiredsignal and the resulting aggregate Co-Channel Interference (CCI) for each one of theEvaluation Scenarios (ESs) described next. Each ES characterizes a particular networkconfiguration, in which macro and picocells employ distributed strategies to mitigate thecross-tier interference. The following list summarizes the evaluation scenarios underconsideration.
– ES1: the tagged MU connects to the umbrella MBS and experiences full interferencefrom the underlaid picocell tier.
– ES2: the tagged MU connects to the target PBS with REB, but no Inter-Cell Interfer-ence Coordination (ICIC) strategy, such as ABS, is carried out. As a result, the userof interest which dwells in the Range Expansion (RE) region of the serving picocell issubject to high interference levels from the umbrella macrocell.
– ES3: the tagged MU connects to the target PBS with REB, and the umbrella MBSimplements the ABS scheme with rate 1/2.
– ES4: the tagged MU connects to the target PBS, and the surrounding picocells
102
coordinate based on the DL-HII bitmap [116], although the umbrella MBS stillinterferes. This configuration is particularly relevant when the density of small cellsnearby the tagged receiver is high, or there are multiple tiers of interfering small cells,such as femtocells.
– ES5: based on the DL-HII bitmap, the strongest picocells coordinate so as toimplement a virtual DAS. However, the umbrella MBS and small cells in R2 stillinterfere with the user of interest. It is assumed that the picocells coordinate throughthe X2 interface. However, picocells can also coordinate over the air interface forexample using the coordination mechanism introduced in [36].
5.5.1 Received power from the umbrella MBS
In this section, we initially derive the Characteristic Function (CF) [32, 85, 90] of the RVwhich describes the power received from a random transmitter within O and thereafterparticularize it to the umbrella MBS case. By considering the communication model ofSection 5.2.1, we write the CF of the power received at the tagged MU from a randomtransmitter within its observation region as follows.
Proposition 12. Let Y = R−αX be a RV describing the power received at the tagged
receiver from a random transmitter in O with R varying from Rm to RM and X following
the Gamma-LN distribution as described in Section 5.2. Then, the CF of Y is
ΨY (ω) =2
R2M− R2
m
EX [R (ω)], (56)
where R (ω) =∫ RM
Rmexp ( jωpr−α x)rdr and EX [ · ] yields the expectation of the en-
closed expression over the RV X.
Proof. See Appendix 8.
It is worthy noting that (56) is a general formulation which characterizes thedistribution of any random transmitter within the reception range of the tagged receiverincluding the umbrella MBSs and small cells in the underlaid tier.
Thereafter, by taking the nth derivative of the CF as given in (12), the correspondingcumulant κn is obtained.
Proposition 13. Consider the CF of the power received from a transmitter randomly
103
deployed within the observation region O; then, the nth cumulant of Y is given by
κn =1jn
n∑k=0
g(k ) (β0) · Bn ,k[β1 , β2 , . . . , β(n−k+1)
], (57)
where g (u) = ln (u), Bn ,k[β1 , β2 , . . . , β(n−k+1)
]is the partial Bell polynomial [120]
and βn = jnpn ×R2−nα
m −R2−nαM
nα−2 EX [xn].
Proof. See Appendix 9.
5.5.2 Aggregate CCI from the underlaid tier of small cells
This scenario represents our default configuration in which the umbrella MBS serves thetagged receiver, whereas the underlaid picocell tier is the only source of interference.A careful observation reveals that this scenario is equivalent to the Full Interferencescenario described in Section 3.4.1. Therefore, we can apply Proposition 4 to derive thenth cumulant of the distribution of the aggregate CCI at the tagged receiver with respectto the MPP Φ [32, 36] as given next.
Corollary 5. Consider the ES1; then, the nth cumulant of the aggregate CCI perceived
by the tagged MU within O and with respect to Φ is given by,
κn(Φ)
=2πλ pn
nα − 2
(R2−αnm − R2−αn
M
)EnX[0,∞] . (58)
The aggregate CCI from the underlaid tier of picocells is computed with respect to alimited region of the total field of interfering nodes (from Rm to RM ). To account for theneglected interference parcel beyond RM , one needs to change in (32) the upper limit ofintegration with respect to r until∞. For instance, considering α = 3, Rm = 5 m andRM = 250 m, the aggregate interference from the region beyond RM = 250 m (towards∞) represents only 2% of the aggregate interference, whereas for an observation regionwithin Rm = 25 m and RM = 500 m the neglected region contributes with 5% of thetotal interference.
5.5.3 Aggregate CCI from multiple tiers
the additivity property of cumulants is used to compute the aggregate CCI in HetNetswith multiple tiers [121]. In order to apply this property, we observe that the interference
104
components from distinct tiers are assumed to be independent. Then, Proposition 3 (inpage 45) is applied as follows.
Corollary 6. Consider the two tier deployment scenario where an umbrella MBS is
underlaid with self-organizing small cells; then, the nth cumulant of the aggregate CCI
perceived by the tagged MU in O is,
κn = κMn + κP
n . (59)
5.5.4 Aggregate CCI with inter-cell interference coordination
As shown in Section 5.4.2, picocells use the DL-HII bitmap to self-organize into twocoordination regions R1 and R2. Herein, we derive the cumulants of the aggregate CCIgenerated by each such region with respect to the tagged receiver. Small cells that aredetected by the tagged receiver within R1 decrease their transmit power by a predefinedvalue, i.e., p′ = p + ∆p so as to reduce their interference towards the user of interest. Inthe following we use Proposition 6 to compute the cumulants of the dominant interferingpicocells belonging to MPP Φ1 are identified.
Corollary 7. Consider the network operation of Section 5.4.2; then, the nth cumulant of
the aggregate CCI perceived by the tagged MU in O with respect to Φ1 is written as,
κn(Φ1
)=
2πλ (p′)n
nα − 2
(R2−αnm − R2−αn
M
)EnX
[%M ,∞
]− %
n− 2α
th E2α
X
[%m , %M
]+ R2−nα
m EnX
[%m , %M
]. (60)
During the coordination mechanism, the tagged receiver does not detect the picocellswithin R2 which contribute to the aggregate interference with transmit power p dBm.Therefore, the distribution of the remaining interference is similar to the case 7 andthe corresponding the respective cumulants are characterized using the followingformulation.
Corollary 8. Consider the network operation of Section 5.4.2; then, the nth cumulant of
the aggregate CCI perceived by the tagged MU in O with respect to Φ2 has the following
105
form,
κn(Φ2
)=
2πλ pn
nα − 2
(R2−αnm − R2−αn
M
)EnX
[−∞, %m
]+ %
n− 2α
th E2α
X
[%m , %M
]− R2−nα
M EnX
[%m , %M
]. (61)
5.6 Numerical results
By using the analytical framework of Section 2.5, the distributions of the received power,aggregate CCI and the resulting SIR are calculated for each one the ESs. The outageprobability and average channel capacity are also used to evaluate how the systemperforms with biased cell association and interference coordination techniques.
Fig. 25 compares the Cumulative Distribution Function (CDF) of the picocellreceived power at the tagged receiver (Y P) from Monte Carlo simulations with thoseobtained wusing the LN approximation. In this example, the annular observation regionis defined by Rm = 5 m and RM = 75 m and picocells operate with a fixed power level of30 dBm. The radio channel is affected by path loss with exponent α = 3, LN shadowingwith standard deviation σ = 6, 8, 10 and 12 dB, and Nakagami fading with shapeparameter m = 16 which corresponds to a Rician channel with parameter K = 14.8 dB(see relation (6)). The proposed framework approximates well the power received by thetagged receiver from a random picocell within its observation region for varying numberof interfering scenarios.
Similarly, Fig. 26 shows the CDF of the distribution of the power received from theumbrella macrocell at the tagged receiver (Y M). The umbrella MBS transmits at 43 dBm.As can be seen, our LN model matches well the simulation results in the macrocellconfiguration. In addition, the LN approximation is tighter for larger σ (standarddeviation), when the resulting shadowing dominates the variation of the received powerdistribution.
Fig. 27 compares the Complementary Cumulative Distribution Function (CCDF)of the aggregate CCI from Monte Carlo simulations with those from the proposedLN approximation. Our approximation matches well with the simulation results forthe evaluation scenarios under study. An annular observation region with Rm = 25 mand RM = 250 m is considered. Picocells operate with a fixed power level of 30 dBmand constitute a Poisson field of interferers with intensity λ = 10−5 PBS/m2 (about
106
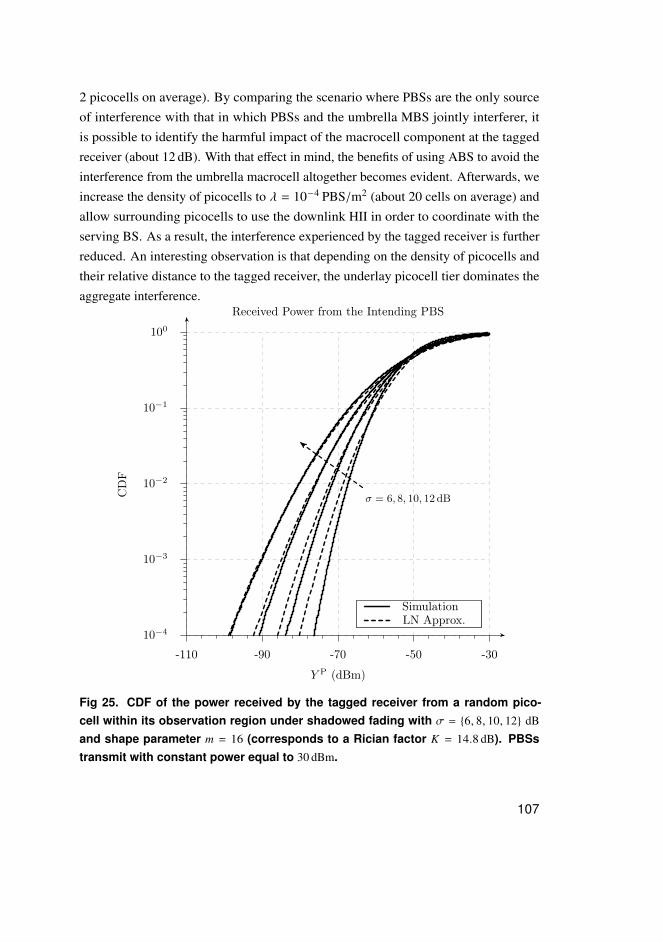
2 picocells on average). By comparing the scenario where PBSs are the only sourceof interference with that in which PBSs and the umbrella MBS jointly interferer, itis possible to identify the harmful impact of the macrocell component at the taggedreceiver (about 12 dB). With that effect in mind, the benefits of using ABS to avoid theinterference from the umbrella macrocell altogether becomes evident. Afterwards, weincrease the density of picocells to λ = 10−4 PBS/m2 (about 20 cells on average) andallow surrounding picocells to use the downlink HII in order to coordinate with theserving BS. As a result, the interference experienced by the tagged receiver is furtherreduced. An interesting observation is that depending on the density of picocells andtheir relative distance to the tagged receiver, the underlay picocell tier dominates theaggregate interference.
10−4
10−3
10−2
10−1
100
-110 -90 -70 -50 -30
CD
F
Y P (dBm)
Received Power from the Intending PBS
SimulationLN Approx.
σ = 6, 8, 10, 12 dB
Fig 25. CDF of the power received by the tagged receiver from a random pico-cell within its observation region under shadowed fading with σ = 6, 8, 10, 12 dB
and shape parameter m = 16 (corresponds to a Rician factor K = 14.8 dB). PBSstransmit with constant power equal to 30 dBm.
107
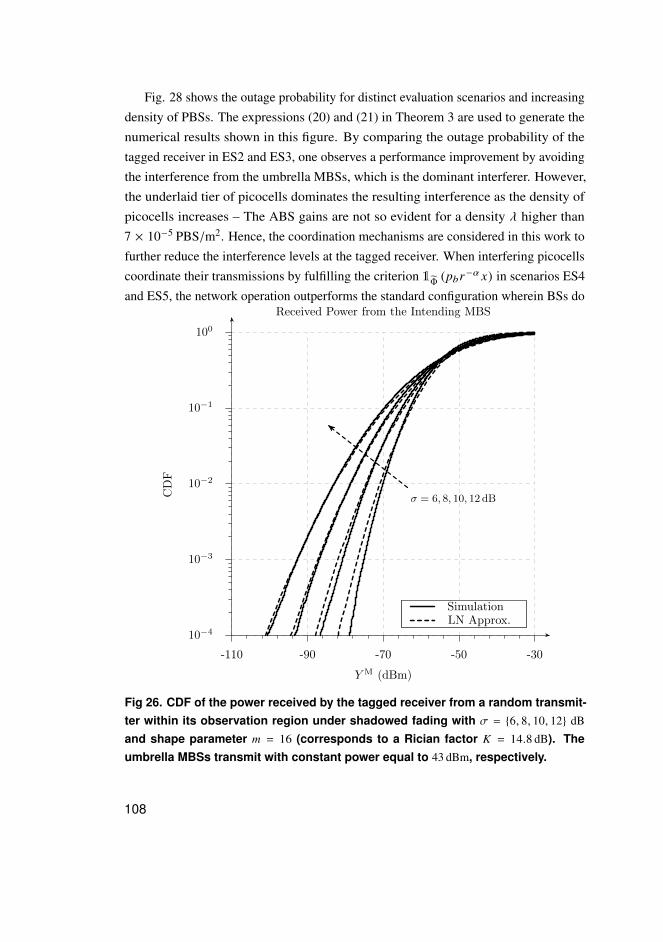
Fig. 28 shows the outage probability for distinct evaluation scenarios and increasingdensity of PBSs. The expressions (20) and (21) in Theorem 3 are used to generate thenumerical results shown in this figure. By comparing the outage probability of thetagged receiver in ES2 and ES3, one observes a performance improvement by avoidingthe interference from the umbrella MBSs, which is the dominant interferer. However,the underlaid tier of picocells dominates the resulting interference as the density ofpicocells increases – The ABS gains are not so evident for a density λ higher than7 × 10−5 PBS/m2. Hence, the coordination mechanisms are considered in this work tofurther reduce the interference levels at the tagged receiver. When interfering picocellscoordinate their transmissions by fulfilling the criterion 1
Φ(pbr−α x) in scenarios ES4
and ES5, the network operation outperforms the standard configuration wherein BSs do
10−4
10−3
10−2
10−1
100
-110 -90 -70 -50 -30
CD
F
Y M (dBm)
Received Power from the Intending MBS
SimulationLN Approx.
σ = 6, 8, 10, 12 dB
Fig 26. CDF of the power received by the tagged receiver from a random transmit-ter within its observation region under shadowed fading with σ = 6, 8, 10, 12 dB
and shape parameter m = 16 (corresponds to a Rician factor K = 14.8 dB). Theumbrella MBSs transmit with constant power equal to 43 dBm, respectively.
108
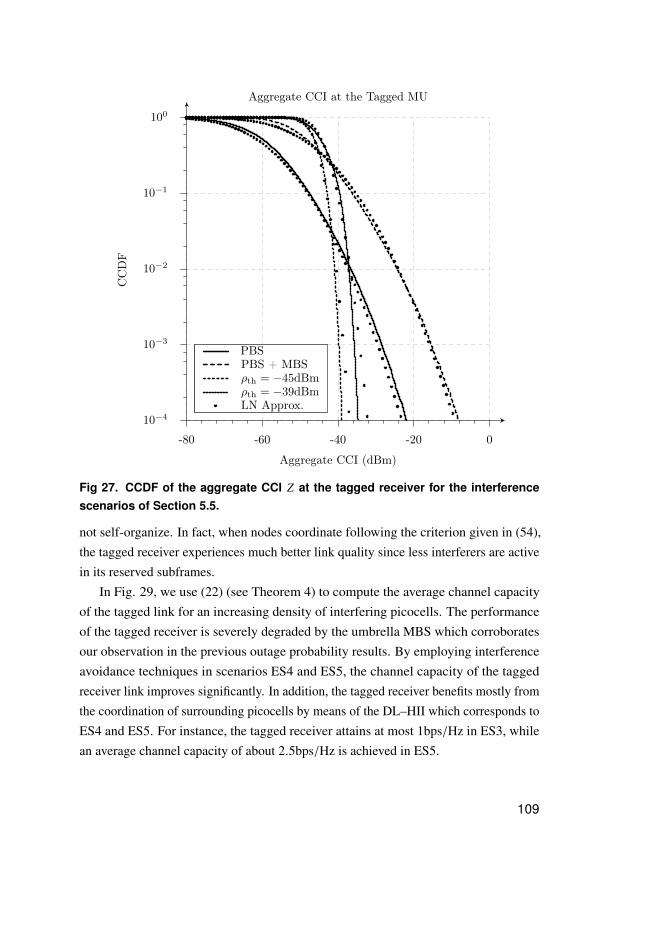
10−4
10−3
10−2
10−1
100
-80 -60 -40 -20 0
CC
DF
Aggregate CCI (dBm)
Aggregate CCI at the Tagged MU
PBSPBS + MBSρth = −45dBmρth = −39dBmLN Approx.
Fig 27. CCDF of the aggregate CCI Z at the tagged receiver for the interferencescenarios of Section 5.5.
not self-organize. In fact, when nodes coordinate following the criterion given in (54),the tagged receiver experiences much better link quality since less interferers are activein its reserved subframes.
In Fig. 29, we use (22) (see Theorem 4) to compute the average channel capacityof the tagged link for an increasing density of interfering picocells. The performanceof the tagged receiver is severely degraded by the umbrella MBS which corroboratesour observation in the previous outage probability results. By employing interferenceavoidance techniques in scenarios ES4 and ES5, the channel capacity of the taggedreceiver link improves significantly. In addition, the tagged receiver benefits mostly fromthe coordination of surrounding picocells by means of the DL–HII which corresponds toES4 and ES5. For instance, the tagged receiver attains at most 1bps/Hz in ES3, whilean average channel capacity of about 2.5bps/Hz is achieved in ES5.
109
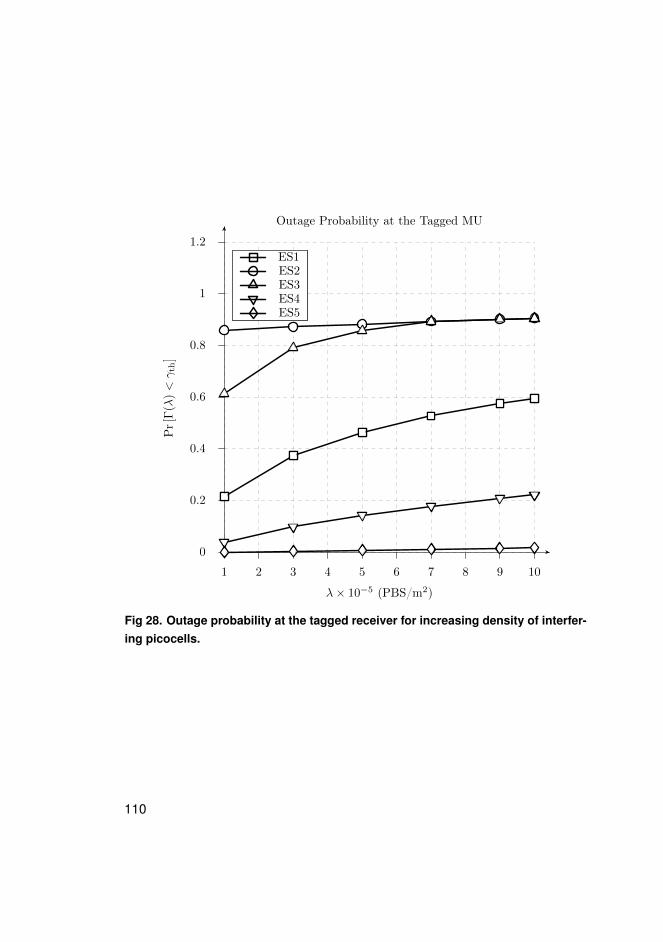
0
0.2
0.4
0.6
0.8
1
1.2
1 2 3 4 5 6 7 8 9 10
Pr
[Γ(λ
)<γth
]
λ× 10−5 (PBS/m2)
Outage Probability at the Tagged MU
ES1ES2ES3ES4ES5
Fig 28. Outage probability at the tagged receiver for increasing density of interfer-ing picocells.
110
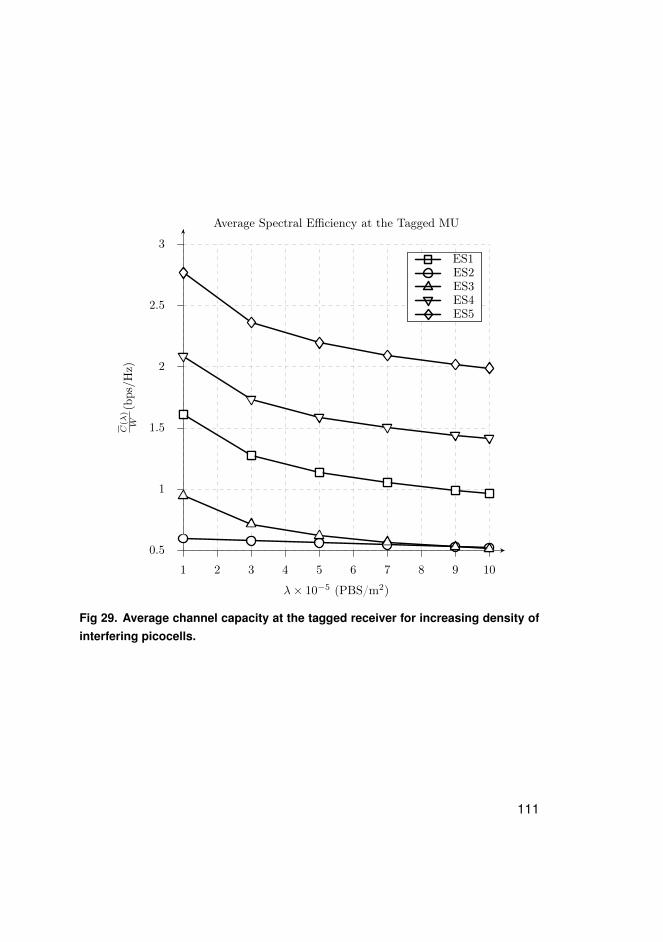
0.5
1
1.5
2
2.5
3
1 2 3 4 5 6 7 8 9 10
C(λ
)W
(bps/Hz)
λ× 10−5 (PBS/m2)
Average Spectral Efficiency at the Tagged MU
ES1ES2ES3ES4ES5
Fig 29. Average channel capacity at the tagged receiver for increasing density ofinterfering picocells.
111
5.7 Summary and final remarks
In this paper, we investigate the problem of co-channel interference in heterogeneousnetworks composed of self-organizing small cells and legacy macrocells. An analyticalframework which resorts to stochastic geometry and higher-order statistics throughthe concept of cumulants is introduced in order to characterize network dynamicsand channel variations. We use this framework to recover the distribution of the CCIand to evaluate the system performance in terms of outage probability and averagespectral efficiency of the tagged link. For the scenarios under study, results show thatour analytical model matches well with numerical results obtained using Monte Carlosimulations. Aiming to reduce the co-channel interference generated at the underlaid tier,picocells coordinate their transmissions using the DL-HII incurring minimum overhead.Finally, by employing the concept of virtual DASs, the user of interest not only benefitsfrom reduced interference, but also from the maximum ratio transmission among theserving picocells. We also observed that by simply using almost blank subframes theaggregate interference at the tagged receiver is reduced by about 12dB. Although moreelaborated interference control techniques such as, downlink bitmap and distributedantennas systems become needed, when the density of picocells in the underlaid tiergets high.
112
6 Conclusions and final remarks
In this thesis, the feasibility of self-organizing Heteronegeous Networks (HetNets) undervarious network configurations and radio channel regimes has been considered. In viewof our observations, HetNets constitute an inexpensive alternative to reduce CapitalExpenditure (CAPEX), while still meeting the stringent requirements of upcomingsystems, improving cell border user experience, increasing spectral efficiency andfilling in coverage holes. Equally important, self-organizing solutions reduce OperatingExpenditure (OPEX) by limiting human intervention and allowing small cells toautonomously coordinate their transmissions across tiers and control the resultinginter-tier Co-Channel Interference (CCI) in a distributed way.
It is also observed that the traditional evaluation methods based solely on computersimulations with Base Stations (BSs) scattered in a regular structure over hexagonalgrid does not fully capture the dynamics of Self-Organizing Networks (SONs) [122].Moreover, the unplanned deployment and uncoordinated operation of small cells makethe performance evaluation of such HetNets a challenge undertaking. Thus, we initiallyintroduced an analytical framework which resorts to the stochastic geometry to modelrandom network deployments and capture the spatial interaction between communicatingnodes. It is worth noting that this framework is used to capture the interworking overdistinct tiers and assess their performance as well. Using the concept of Marked PointProcess (MPP), multidimensional random patterns which combine spatial disposition ofnodes with radio channel impairments are generated. A shadowed fading channel modelwhich combines Nakagami-m fading with Log-Normal (LN) shadowing was used tomodel channel impairments in our studies. Using this framework we are able to modelthe operation of network algorithms and capture their impact on the performance ofnodes communicating over the air interface. In that regard, various network algorithmswere incorporated into the model such as power control, frequency partitioning, antennasstructures with random layout; as well as the effect of the correlation between data andcontrol channels on the Coordination Mechanisms (CMs). We then characterized thescenarios under study in terms of the received power of the desired transmitter, resultingaggregate CCI, outage probability and average channel capacity conditional on thetagged receiver.
Thereafter, the performance of the HetNets with distinct network configurations and
113
transmission modes were investigated. We initially established the CMs which allowsmall cells to coordinate their transmissions either over the air interface (in Chapters 3and 4) or through a wired backhaul (in Chapter 5). In a totally distributed way, the CMsenable nearby small cells to become aware of each other and dynamically coordinatetheir transmissions so as to reduce the CCI. After incorporating the operation of standardnetwork algorithms into our framework, we introduced new self organizing solutionswhich significantly improve the performance of two-tier networks, namely, opportunisticPower Control (PC) with discrete power levels and Dynamic Exclusion Region (DER).Results showed that the CMs are indeed a promising strategy to cope with interferenceand opportunistically reuse radio resources on both tiers. Hence, the spectral efficiencyis substantially increased in the heterogeneous scenarios under study.
Subsequently, the feasibility of using the Time Division Duplexing (TDD) mode tounderlay tiers of small cells on the Uplink (UL) of legacy macrocells was investigated.In this study, two coordination criteria were considered: a small cell coordinates if(Υ1) the received power level of the beacon from the tagged receiver is above thecoordination threshold; or (Υ2) conditional on the previous criterion, the interferencecontribution of a given BS on the tagged receiver needs to be above that threshold aswell. When compared to the uncoordinated Frequency Division Duplexing deployment,results show that the outage probability of the evaluation scenarios with the coordinatedTDD-underlay solution is reduced by nearly 80 %, while the average spectral efficiencyincreases by approximately 90 % at high loads.
Thereafter, advanced solutions were considered to enable SONs to offload theumbrella macrocell and to improve the spectral efficiency on both tiers were considered.The biased cell association was initially assessed through the corresponding handoverprobability. To cope with the resulting interference, standard Inter-Cell InterferenceCoordination (ICIC) network algorithms were modeled and their performance wasassessed: Almost Blank Sub-frame (ABS), binary bitmap indicator, and spectrumrepartitioning. We then introduced the Downlink (DL)-High Interference Indicator (HII)which was implemented through a soft map (reflecting the interferers power) and virtualDistributed Antenna System (DAS) solution. It was observed that by simply usingalmost blank subframes the aggregate interference at the tagged receiver is reducedby about 12 dB. Although more elaborated interference control techniques such as,downlink bitmap and distributed antennas systems become needed, when the density ofpicocells in the underlaid tier gets high.
114
6.1 Future work
An interesting alternative to further develop the CMs study is to incorporate the conceptof the cooperative range expansion [32] by allowing small cells to forward the victimuser’s coordination request among other cells that have not detected it initially. Inaddition, the optimization of the CM parameters in order to improve the achievableperformance also constitute a compelling aspect of the problem under study. Forinstance, by combining stochastic framework with distributed optimization methods,such as game theory it becomes possible to investigate the benefits of strategic decisionmaking. As an example, authors study the mobile association problem through spatialSignal-to-Interference plus Noise Ratio (SINR) games in [107].
In our investigations we considered fully loaded heterogeneous systems wheresmall cells always schedule a random user within their communication range in everytransmission interval. However, partially loaded systems where the number of scheduledusers is a Random Variable (RV) which also depend on the traffic distribution create newopportunities to study heterogeneous systems with variable service class requirementsand distinct link adaptation algorithms [20].
With regard to the TDD-underlay concept, we initially developed interferenceavoidance techniques using the distinct CM criteria. Using that criteria, more elabo-rated transmission strategies, for example, cooperative diversity techniques are alsoapplicable so that nearby small cells which are tagged as potential interferers can alsocooperate through distributed antenna structures to improve overall network capacity. Inthat respect, distributed antennas systems were evaluated on the Frequency DivisionDuplexing (FDD) mode and significant results were obtained. However, only maximumtransmission ratio is employed in the transmitter side. On the receiver side, diversitycombining techniques – such as selection, equal gain or maximal ratio combining –which are triggered by victim users and rely on the CMs introduced here are possible.Moreover, precoding which exploit multiple antenna systems on both transmitter andreceiver ends are applicable as well.
Another plausible extension is to take into effect the temporal and spatial correlationson the outage probability and achievable capacity so that distinct dispositions ofcommunicating nodes over time and space effect the overall network performance.Hence, the analysis of the aggregate interference (incorporating multipath fadingand correlated LN RVs) generated by the multi-tier HetNet becomes a more evolvedproblem. In that regard, geometry-inclusive models which combine the stochastic
115
profile of radio channels with the variations due to the geometry of the problem (spatialdistribution of points) are particularly interesting. Moreover, both directional antennasand precoding techniques for multi-stream transmissions constitute appealing directionsfor future development as well. In addition, the interference modeling for a finitenumber of interferers, non-homogeneous Poisson fields of interferers, and 3 dimensionalspace become relevant within specific contexts which establish reasonable grounds toinvestigate more practical constraints on the deployment of self-organizing HetNets.
116
References
1. Akhtman J & Hanzo L (2010) Heterogeneous networking: An enabling paradigmfor ubiquitous wireless communications. Proceedings of the IEEE 98(2): 135–138.
2. Ghosh A, Mangalvedhe N, Ratasuk R, Mondal B, Cudak M, Visotsky E, ThomasT, Andrews J, Xia P, Jo H, Dhillon H & Novlan T (2012) Heterogeneous cellularnetworks: From theory to practice. IEEE Commun. Mag. 50(6): 54–64.
3. Prehofer C & Bettstetter C (2005) Self-organization in communication networks:principles and design paradigms. IEEE Commun. Mag. 43(7): 78–85.
4. Mukherjee S (2012) Distribution of downlink sinr in heterogeneous cellularnetworks. IEEE J. Sel. Areas Commun. 30(3): 575–585.
5. Ghosh A, Ratasuk R, Mondal B, Mangalvedhe N & Thomas T (2010) Lte-advanced:next-generation wireless broadband technology. IEEE Commun. Mag. 17(3):10–22.
6. López-Pérez D, Güvenç I, de la Roche G, Kountouris M, Quek T & Zhang J(2011) Enhanced intercell interference coordination challenges in heterogeneousnetworks. IEEE Wireless Commun. Mag. 18(3): 22–30.
7. Ericsson (2012) Heterogeneous networks – meeting mobile broadband expectationswith maximum efficiency. White paper, Ericsson.
8. Damnjanovic A, Montojo J, Wei Y, Ji T, Luo T, Vajapeyam M, Yoo T, Song O &Malladi D (2011) A survey on 3GPP heterogeneous networks. IEEE WirelessCommun. Mag. 18(3): 10–21.
9. ping Yeh S, Talwar S, Wu G, Himayat N & Johnsson K (2011) Capacity andcoverage enhancement in heterogeneous networks. IEEE Wireless Commun. Mag.18(3): 32–38.
10. Chandrasekhar V & Andrews JG (2009) Spectrum allocation in tiered cellularnetworks. IEEE Trans. Commun. 57(10): 3059–3068.
11. Alcatel-Lucent (2010) Alcatel-lucent small cell solution: Where small is the nextbig thing. White paper, Alcatel-Lucent.
12. Aliu O, Imran A, Imran M & Evans B (2012) A survey of self organisation infuture cellular networks. IEEE Commun. Surveys Tuts. IEEE early access articles.
13. Güvenç I (2011) Capacity and fairness analysis of heterogeneous networks withrange expansion and interference coordination. IEEE Commun. Lett. 15(10):
117
1084–1087.14. Mukherjee S & Güvenç I (2011) Effects of range expansion and interference
coordination on capacity and fairness in heterogeneous networks. In: 45thAsilomar Conference on Signals, Systems and Computers, pp. 1855–1859.
15. López-Pérez D, Chu X & Güvenç I (2012) On the expanded region of picocells inheterogeneous networks. IEEE J. Sel. Areas Commun. 6(3): 281–294.
16. Jo HS, Sang YJ, Xia P & Andrews JG (2011) Outage probability for heterogeneouscellular networks with biased cell association. In: IEEE Globecom. Houston, TX,USA.
17. López-Pérez D, Valcarce A, de la Roche G & Zhang J (2009) OFDMA femtocells:A roadmap on interference avoidance. IEEE Commun. Mag. 47(9): 41–48.
18. Rangan S (2010) Femto-macro cellular interference control with subband schedul-ing and interference cancelation. In: Globecom.
19. Claussen H, Ho L & Samuel L (2008) An overview of the femtocell concept. BellLabs Tech. Journal 13(1): 221–245.
20. Cardieri P (2010) Modeling interference in wireless ad hoc networks. IEEECommun. Surveys Tuts. 12(4): 551 –572.
21. Lien SY, Lin YY & Chen KC (2011) Cognitive and game-theoretical radio resourcemanagement for autonomous femtocells with qos guarantees. IEEE Trans. WirelessCommun. 10(7): 2196–2206.
22. 3GPP (2009) Home Node B radio frequency RF requirements (FDD). Technicalreport, TR25.967, version 9.0.0 release 9.
23. Chandrasekhar V & Andrews JG (2007) Uplink capacity and interference avoid-ance for two-tier cellular networks. In: Globecom.
24. Park S, Seo W, Kim Y, Lim S & Hong D (2010) Beam subset selection strategyfor interference reduction in two-tier femtocell networks. IEEE Trans. WirelessCommun. 9(11): 3440–3449.
25. Tseng Y & Huang C (2012) Analysis of femto base station network deployment.IEEE Trans. Veh. Technol. 61(2): 748–757.
26. Jo HS, Sang YJ, Xia P & Andrews JG (2012) Heterogeneous cellular networkswith flexible cell association: A comprehensive downlink sinr analysis. IEEETrans. Wireless Commun. 11(10): 3484–3495.
27. Wang L & Kuo GS (2012) Mathematical modeling for network selection inheterogeneous wireless networks – a tutorial. IEEE Commun. Surveys Tuts.Available in IEEE early access.
118
28. Omiyi P, Haas H & Auer G (2007) Analysis of TDD cellular interference mitigationusing busy-bursts. IEEE Trans. Wireless Commun. 6(7): 2721–2731.
29. Sinanovic S, Auer G & Haas H (2010) Power control and interference awarenessusing busy bursts. In: IEEE Globecom.
30. Bharucha Z & Haas H (2008) Application of the TDD underlay concept to homeNodeB scenario. In: 67th IEEE Vehicular Technology Conference (VTC). Calgary,Canada.
31. Force FSPT (2002) Report of the spectrum efficiency working group. Technicalreport, FCC. URI: www.fcc.gov/sptf/files/SEWGFinalReport1.pdf .
32. Ghasemi A & Sousa ES (2008) Interference aggregation in spectrum-sensingcognitive wireless networks. IEEE J. Sel. Areas Commun. 2(1): 41–56.
33. Rabbachin A, Quek TQ, Shin H & Win MZ (2011) Cognitive network interference.IEEE J. Sel. Areas Commun. 29(2): 480–493.
34. Quek T, Soh YS & Kountouris M (2012) Hybrid division duplex for cognitivesmall cell networks. In: WPMC. Taipei, Taiwan.
35. Okino K, Nakayama T, Yamazaki C, Sato H & Kusano Y (2011) Pico cell rangeexpansion with interference mitigation toward LTE-A heterogeneous networks. In:ICC Workshops, pp. 1–5. Kyoto, Japan.
36. de Lima CHM, Bennis M & Latva-aho M (2012) Coordination mechanisms forself-organizing femtocells in two-tier coexistence scenarios. IEEE Trans. WirelessCommun. 11(6).
37. de Lima CHM, Bennis M & Latva-aho M (2013) Statistical analysis of self-organizing heterogeneous networks with biased cell association and interferenceavoidance. IEEE Trans. Veh. Technol. 62(6).
38. de Lima CHM, Bennis M & Latva-aho M (2013) Coordinated TDD-underlay forself-organizing femtocells in two-tier co-existence scenarios. EURASIP Journalon Wireless Commun. and Networking .
39. de Lima CHM, Bennis M, Ghaboosi K & Latva-aho M (2010) On interferenceanalysis of self-organized femtocells in indoor deployment. In: Globecom.
40. de Lima CHM, Bennis M, Ghaboosi K & Latva-aho M (2010) A stochasticassociation mechanism for macro-to-femtocell handover. In: IEEE 44th AsilomarConference on Signals, Systems and Computers. Pacific Grove, USA.
41. de Lima CHM, Bennis M, Ghaboosi K & Latva-aho M (2010) Interferencemanagement for self-organized femtocells towards green networks. In: 21stAnnual IEEE International Symposium on Personal, Indoor and Mobile Radio
119
Communications. Istanbul, Turkey.42. de Lima CHM, Bennis M & Latva-aho M (2011) Coordination mechanisms for
stand-alone femtocells in self-organizing deployments. In: Globecom. Houston,TX, USA.
43. de Lima CHM & de Abreu GTF (2008) Clusterization for robust geographicrouting in wireless sensor networks. In: IEEE Wireless Communications &Networking Conference.
44. de Lima CHM & de Abreu GTF (2008) Game-theoretical relay selection strategyfor geographic routing in multi-hop WSNs. In: IEEE 5th Workshop on Positioning,Navigation and Communication.
45. de Lima CHM & de Abreu GTF (2008) Auction-based relay selection algorithm forposition-centric routing. In: 11th Wireless Personal Multimedia CommunicationsSymposium 2008 (WPMC’08).
46. de Lima CHM & de Abreu GTF (2009) Contention-based geographic forwardingstrategies for position-centric routing. In: IEEE 6th Workshop on Positioning,Navigation and Communication 2009 (WPNC’09).
47. de Lima CHM & de Abreu GTF (2009) Analysis of contention-based relayselection mechanisms in autonomous multi-hop networks. In: IEEE InformationTheory Workshop on Networking and Information Theory. Volos, Greece.
48. Wang H & Reed M (2011) A novel tractable framework to analyse heterogeneouscellular networks. In: IEEE Globecom.
49. Chandrasekhar V, Muharemovic T, Shen Z, Andrews JG & Gatherer A (2009)Power control in two-tier femtocell networks. IEEE Trans. Wireless Commun.8(8).
50. Chandrasekhar V & Andrews JG (2009) Uplink capacity and interference avoid-ance for two-tier femtocell networks. IEEE Trans. Wireless Commun. 8(7).
51. Yang K (2012) Interference management in lte wireless networks [industryperspectives]. IEEE Wireless Commun. Mag. 19(3): 8–9.
52. Baddeley A, Bárány I, Schneider R & Weil W (2006) Stochastic Geometry.Springer.
53. Illian J, Penttinen A, Stoyan H & Stoyan D (2004) Statistical Analysis andModelling of Spatial Point Patterns. Wiley-Interscience.
54. Baccelli F & Btaszczyszyn B (2009) Stochastic Geometry and Wireless Networks– Theory, volume 1 of Foundations and Trends in Networking. NoW – The essenceof knowledge.
120
55. Baccelli F & Btaszczyszyn B (2009) Stochastic Geometry and Wireless Networks– Applications, volume 2 of Foundations and Trends in Networking. NoW – Theessence of knowledge.
56. Andrews J, Ganti R, Haenggi M, Jindal N & Weber S (2010) A primer on spatialmodeling and analysis in wireless networks. IEEE Commun. Mag. 48(11):156–163.
57. Sousa ES & Silvester JA (1990) Optimum transmission ranges in a direct-sequencespread-spectrum multihop packet radio network. IEEE J. Sel. Areas Commun.8(5): 762–771.
58. Chan CC & Hanly SV (2001) Calculating the outage probability in a CDMAnetwork with spatial poisson traffic. IEEE Trans. Veh. Technol. 50(1).
59. Menon R, Buehrer R & Reed J (2005) Outage probability based comparison ofunderlay and overlay spectrum sharing techniques. In: IEEE DySPAN. Baltimore,MD, USA.
60. Baccelli F, Blaszczyszyn B & Muhlethaler P (2006) An aloha protocol for multihopmobile wireless networks. IEEE Trans. Inf. Theory 52(2): 421–436.
61. Baccelli F, Btaszczyszyn B & Mühlethaler P (2009) Stochastic analysis of spatialand opportunistic ALOHA. IEEE J. Sel. Areas Commun. 27(7): 1105–1119.
62. Win MZ, Pinto PC & Shepp LA (2009) A mathematical theory of networkinterference and its applications. Proc. IEEE 97(2): 205–230.
63. Ilow J & Hatzinakos D (1998) Analytic alpha-stable noise modeling in a poissonfield of interferers or scatterers. IEEE Trans. Signal Process. 46(6): 1601–1611.
64. Pinto PC & Win MZ (2010) Communication in a poisson field of interferers–part I:Interference distribution and error probability. IEEE Trans. Wireless Commun.9(7): 2176–2186.
65. Pinto PC & Win MZ (2010) Communication in a poisson field of interferers-partII: Channel capacity and interference spectrum. IEEE Trans. Wireless Commun.9(7): 2187–2195.
66. Weber S, Yang X, Andrews J & de Veciana G (2005) Transmission capacity ofwireless ad hoc networks with outage constraints. IEEE Trans. Inf. Theory 51(12):4091–4102.
67. Weber SP, Andrews JG & Jindal N (2007) The effect of fading, channel inversion,and threshold scheduling on ad hoc networks. IEEE Trans. Inf. Theory 53(11):4127–4149.
68. Jindal N, Weber S & Andrews JG (2008) Fractional power control for decentralized
121
wireless networks. IEEE Trans. Wireless Commun. 7(12): 5482–5492.69. Weber SP, Andrews JG, Yang X & de Veciana G (2007) Transmission capacity of
wireless ad hoc networks with successive interference cancellation. IEEE Trans.Inf. Theory 53(8): 2799–2814.
70. Blomer J & Jindal N (2009) Transmission capacity of wireless ad hoc networks:Successive interference cancellation vs. joint detection. In: ICC. Dresden,Germany.
71. Chandrasekhar V, Andrews JG & Gatherer A (2008) Femtocell networks: a survey.IEEE Commun. Mag. 46(9): 59–67.
72. Lee J, Andrews J & Hong D (2012) Spectrum-sharing transmission capacity withinterference cancellation. IEEE Trans. Commun. Available in IEEE early access.
73. Zhang J & Andrews JG (2008) Distributed antenna systems with randomness.IEEE Trans. Wireless Commun. 8(9): 3636–3646.
74. Chandrasekhar V, Kountouris M & Andrews J (2009) Coverage in multi-antennatwo-tier networks. IEEE Trans. Wireless Commun. 8(10): 5314–5327.
75. Stüber GL (2011) Principles of mobile communication. Springer, 3 edition.76. Simon MK & Alouini MS (2004) Digital Communication over Fading Channels.
Wiley-IEEE Press, 2 edition.77. Xia P, Chandrasekhar V & Andrews JG (2010) Open vs. closed access femtocells
in the uplink. IEEE Trans. Wireless Commun. .78. Kingman JFC (1993) Poisson Processes. Oxford University Press.79. Baccelli F & Bremaud P (2003) Elements of Queueing Theory. Springer, 2 edition.80. Stoyan D, Kendall WS & Mecke J (1995) Stochastic Geometry and Its Applications.
Wiley-Blackwell, 2 edition.81. Alouini MS & Goldsmith AJ (1999) Area spectral efficiency of cellular mobile
radio systems. IEEE Trans. Wireless Commun. 48(4): 1047–1066.82. Sklar B (1997) Rayleigh fading channels in mobile digital communication systems
Part I characterization. IEEE Commun. Mag. 35(7): 90–100.83. Sklar B (1997) Rayleigh fading channels in mobile digital communication systems
Part II mitigation. IEEE Commun. Mag. 35(9): 148–155.84. Inaltekin H, Chiang M, Poor HV & Wicker SB (2009) On unbounded path-loss
models: Effects of singularity on wireless network performance. IEEE J. Sel.Areas Commun. 27(7): 1078–1092.
85. Abramowitz M & Stegun IA (1965) Handbook of Mathematical Functions withFormulas, Graphs, and Mathematical Tables. Dover, 9 edition.
122
86. Ho MJ & Stüber GL (1995) Capacity and power control for CDMA microcells.ACM Journal on Wireless Networks 1(3): 355–363.
87. Baccelli F, Btaszczyszyn B & Mühlethaler P (2006) An ALOHA protocol formultihop mobile wireless networks. IEEE Trans. Inf. Theory 52(2): 421–436.
88. Shankar PM (2011) Fading and Shadowing in Wireless Systems. Springer.89. Resnick S (1999) A Probability Path. Birkhäuser Boston.90. Dale M (1979) The Algebra of Random Variable. Wiley & Sons Inc.91. Beaulieu NC & Xie Q (2004) An optimal lognormal approximation to lognormal
sum distributions. IEEE Trans. Veh. Technol. 53(2): 479–489.92. Felton L (1960) An optimal lognormal approximation to lognormal sum distribu-
tions. IRE Transactions on Communications Systems 8(1): 57–67.93. Filho JCSS, Cardieri P & Yacoub MD (2005) Simple accurate lognormal approxi-
mation to lognormal sums. Electronics Letters 41(18): 5–6.94. Wu J, Mehta NB & Zhang J (2005) A flexible lognormal sum approximation
method. In: Globecom, pp. 3413–3417. St. Louis, MO.95. Schleher DC (1977) Generalized gram-charlier series with application to the sum
of log-normal variates. IEEE Trans. Inf. Theory 23(2): 275–280.96. Mehta NB, Wu J, Molisch AF & Zhang J (2007) Approximating a sum of random
variables with a lognormal. IEEE Trans. Wireless Commun. 6(7): 2690–2699.97. Read KLQ (1998) A lognormal approximation for the collector’s problem. The
American Statistician 52(2).98. Weber S, Andrews J & Jindal N (2010) An overview of the transmission capacity
of wireless networks. IEEE Trans. Commun. 58(12): 3593–3604.99. Sowerby K & Williamson A (1987) Outage probability calculations for a mobile
radio system having multiple rayleigh interferers. Electron. Lett. 23(11): 600–601.100. Lee WCY (1990) Estimate of channel capacity in rayleigh fading environment.
IEEE Trans. Veh. Technol. 39(3): 187–189.101. Hasan A & Andrews JG (2007) The guard zone in wireless ad hoc networks. IEEE
Trans. Wireless Commun. 6(3): 897–906.102. 3GPP (2011) Service requirements for HNB and HeNB. Technical report,
TS22.220, version 11.1.0 release 11.103. Sinanovic S, Burchardt H, Serafimovski N, Auer G & Haas H (2009) Local
information busy burst thresholding. In: IEEE International Conference onCommunications, pp. 1–6.
104. 3GPP (2011) Radio resource control (RRC); protocol specification. Technical
123
report, TS25.331, version 10.5.0 release 10.105. Solomon H (1978) Geometric Probability. Society for Industrial and Applied
Mathematics.106. Tsoulos GV (ed.) (2001) Adaptive Antennas for Wireless Communications.
Wiley-IEEE Press.107. Altman E, Kumar A, Singh C & Sundaresan R (2009) Spatial SINR games
combining base station placement and mobile association. In: IEEE INFOCOM,pp. 1629–1637.
108. Haas H, Nguyen V, Omiyi P, Nedev N & Auer G (2006) Interference AwareMedium Access in Cellular OFDMA/TDD Networks. In: 2006 IEEE InternationalConference on Communications, pp. 1778–1783.
109. Sinanovic S, Auer G & Haas H (2010) Interference analysis of busy burst enabledinterference avoidance. In: IEEE Globecom.
110. Hosseini K, Hoydis J, ten Brink S & Debbah M (2013) Massive MIMO and smallcells: How to densify heterogeneous networks. In: IEEE ICC. Budapest, Hungary.
111. Dimou K, Wang M, Yang Y, Kazmi M, Larmo A, Pettersson J, Muller W & TimnerY (2009) Handover within 3GPP LTE: Design principles and performance. In:IEEE VTC 2009–Fall, pp. 1–5. Anchorage, Alaska, USA.
112. 3GPP (2012) Handover procedures. Technical report, TS23.009, version 11.2.0release 11.
113. 3GPP (2012) Evolved universal terrestrial radio access network X2 applicationprotocol (X2AP). Technical report, TS36.423, version 11.2.0 release 11.
114. WG4 GTR (2009) Interference mitigation for HeNBs by channel measurements.Tr, Institute for information industry and Colier coorporation, TSG-RAN WG4#52bis.
115. Sesia S, Toufik I & Baker M (eds.) (2009) LTE, The UMTS Long Term Evolution:From Theory to Practice. Wiley.
116. Bharucha Z, Saul A, Auer G & Haas H (2010) Dynamic resource partitioningfor downlink femto-to-macro-cell interference avoidance. EURASIP Journal onWireless Communications and Networking 2010.
117. Boccardi F, Clerckx B, Ghosh A, Hardouin E, Jö andngren G, Kusume K,Onggosanusi E & Tang Y (2012) Multiple-antenna techniques in LTE-advanced.IEEE Commun. Mag. 50(3): 114–121.
118. 3GPP (2011) Coordinated multi-point operation for lte. Work item description,Samsung, TSG-RAN WG1 #53bis.
124
119. Zhang J & Andrews JG (2010) Adaptive spatial intercell interference cancellationin multicell wireless networks. IEEE J. Sel. Areas Commun. 28(9): 1455–1468.
120. Bell ET (1934) Exponential polynomials. The Annals of Mathematics 35(2):258–277.
121. Kendall MG (1945) The Advanced Theory of Statistics, volume 1. Charles Griffin& Company Limited, 2 edition.
122. ElSawy H, Hossain E & Haenggi M (2013) Stochastic geometry for modeling,analysis, and design of multi-tier and cognitive cellular wireless networks: Asurvey. IEEE Commun. Surveys Tuts. .
125

126
Appendix 1 Proof of Lemma 1
In our studies the PC fully compensates for the desired channel attenuations (channelinversion), so P = βRα , where P and R are RVs representing the Femto Base Stations(FBSs) transmit power and the distance to a random user within range, respectively.The density function of R is fR (r) = 2r/(r2
M− r2
m ), where the radii rm and rMdefine an annular region centered at a serving femtocell. Thereby, after using thestandard procedure of the change of variates in probability theory, we have fP (p) =
1αβ1/α p−1+1/α fR
[(p/β)1/α
], which yields the distribution of FBSs transmit power.
After computing EnP
[pm , pM
]=
∫ pM
pmpn fP (p) dp, we obtain the nth partial moment of
the distribution of the femtocells transmit power in (31).
127

128
Appendix 2 Proof of Proposition 6
By using the indicator function in (27), we write the Characteristic Function (CF) of theaggregate CCI for the R1 as,
ΨZp ,1 (ω) = exp
2π
∞∫0
RM∫Rm
[exp
(jwp′r−α x
)− 1
]ϑλ fX (x) 1
(r−α x ≥ %th
)rdr dx
.
(62)
And from (12) the nth cumulant is,
κn = 2πϑλ
∞∫0
min[RM ,(x/%th)1/α
]∫Rm
(p′)nr1−nα xn fX (x)dr dx
= 2πϑλ
∞∫
%M
RM∫Rm
(p′)nr1−nα xn fX (x)dr dx +
%M∫%m
(x/%th)1/α∫Rm
(p′)nr1−nα xn fX (x)dr dx
,(63)
where %m = %thRαm and %M = %thRαM
. By integrating (63) with respect to r , we obtain
κn =2πϑλ (p′)n
nα − 2
(R2−αnm − R2−αn
M
) ∞∫%M
xn fX (x)dx +
%M∫%m
[xnR2−nα
m − x2α %
n− 2α
th
]fX (x)dx
.
(64)
Finally, we compute the partial moments of the approximating LN RV X byrepeatedly applying Definition 5, and by using the change of variable X = eµ+σZ , whereZ ∼ Normal (0, 1), along with the substitutions %M =
ln %M−µσ and %m =
ln %m−µσ .
EX
[%M ,∞, n
]= enµ+ n2σ2
2 Q[%M − nσ
], (65)
EX
[%m , %M ,
2α
]= e
2µα + 2σ2
α2
(Q
[%m −
2σα
]− Q
[%M −
2σα
]), (66)
EX
[%m , %M , n
]= enµ+ n2σ2
2(Q
[%m − nσ
]− Q
[%M − nσ
]), (67)
where Q[u] = 1√2π
∫ ∞u
e−v22 dv. And by replacing the above expressions in (63), (34)
results.
129

130
Appendix 3 Proof of Proposition 7
For computing the nth cumulant of the aggregate interference for interfering femtocellsin R2, we, once again, begin formulating the corresponding CF as
ΨZp ,2 (ω) = exp
2π
∞∫0
RM∫Rm
[exp
(jwpr−α x
)− 1
]ϑλ fX (x) 1
(r−α x < %th
)rdr dx
.
(68)
The nth cumulant is then given by
κn = 2πϑλ
∞∫0
RM∫max
[Rm ,(x/%th)1/α
]pnr1−nα xn fX (x)dr dx
= 2πϑλ
%m∫0
RM∫Rm
pnr1−nα xn fX (x)dr dx +
%M∫%m
RM∫(x/%th)1/α
pnr1−nα xn fX (x)dr dx
.(69)
Similar to the derivation of (64), we first integrate with respect to r and obtain
κn =2πϑλ pn
nα − 2
(R2−αnm − R2−αn
M
) %m∫−∞
xn fX (x)dx +
%M∫%m
[x
2α %
n− 2α
th − xnR2−nαM
]fX (x)dx
.
(70)
And after computing the following partial moment, we obtain (35).
EnX
[−∞, %m
]= enµ+ n2σ2
2(1 − Q
[%m − nσ
]). (71)
131

132
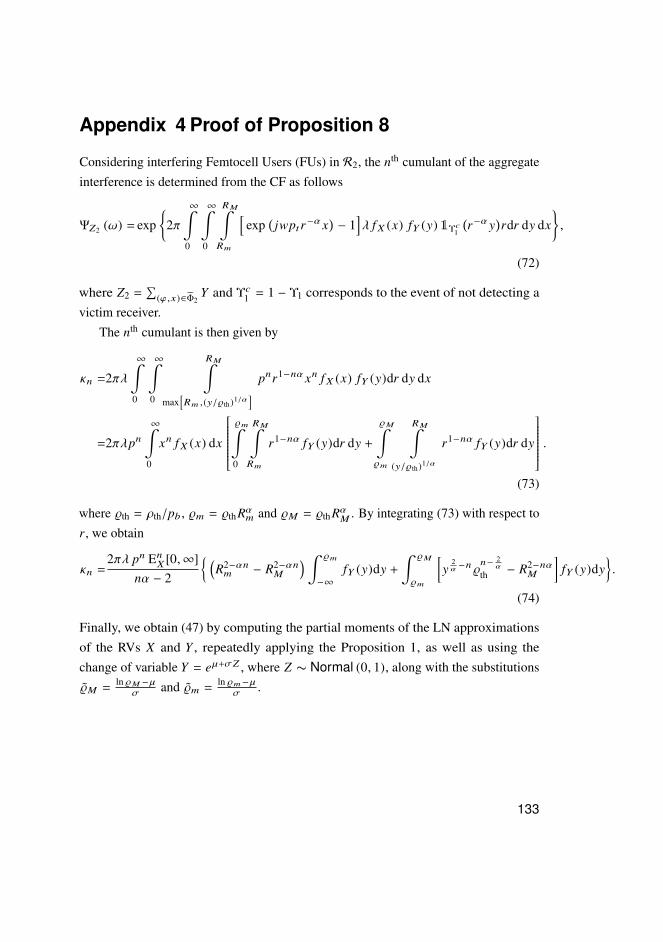
Appendix 4 Proof of Proposition 8
Considering interfering Femtocell Users (FUs) in R2, the nth cumulant of the aggregateinterference is determined from the CF as follows
ΨZ2 (ω) = exp
2π
∞∫0
∞∫0
RM∫Rm
[exp
(jwptr−α x
)− 1
]λ fX (x) fY (y) 1Υc
1
(r−α y
)rdr dy dx
,
(72)
where Z2 =∑
(ϕ,x)∈Φ2Y and Υc
1 = 1 − Υ1 corresponds to the event of not detecting avictim receiver.
The nth cumulant is then given by
κn =2πλ
∞∫0
∞∫0
RM∫max
[Rm ,(y/%th)1/α
] pnr1−nα xn fX (x) fY (y)dr dy dx
=2πλpn
∞∫0
xn fX (x) dx
%m∫0
RM∫Rm
r1−nα fY (y)dr dy +
%M∫%m
RM∫(y/%th)1/α
r1−nα fY (y)dr dy
.(73)
where %th = ρth/pb , %m = %thRαm and %M = %thRαM
. By integrating (73) with respect tor , we obtain
κn =2πλ pn En
X [0,∞]nα − 2
(R2−αnm − R2−αn
M
) ∫ %m
−∞
fY (y)dy +
∫ %M
%m
[y
2α −n %
n− 2α
th − R2−nαM
]fY (y)dy
.
(74)
Finally, we obtain (47) by computing the partial moments of the LN approximationsof the RVs X and Y , repeatedly applying the Proposition 1, as well as using thechange of variable Y = eµ+σZ , where Z ∼ Normal (0, 1), along with the substitutions%M =
ln %M−µσ and %m =
ln %m−µσ .
133

134
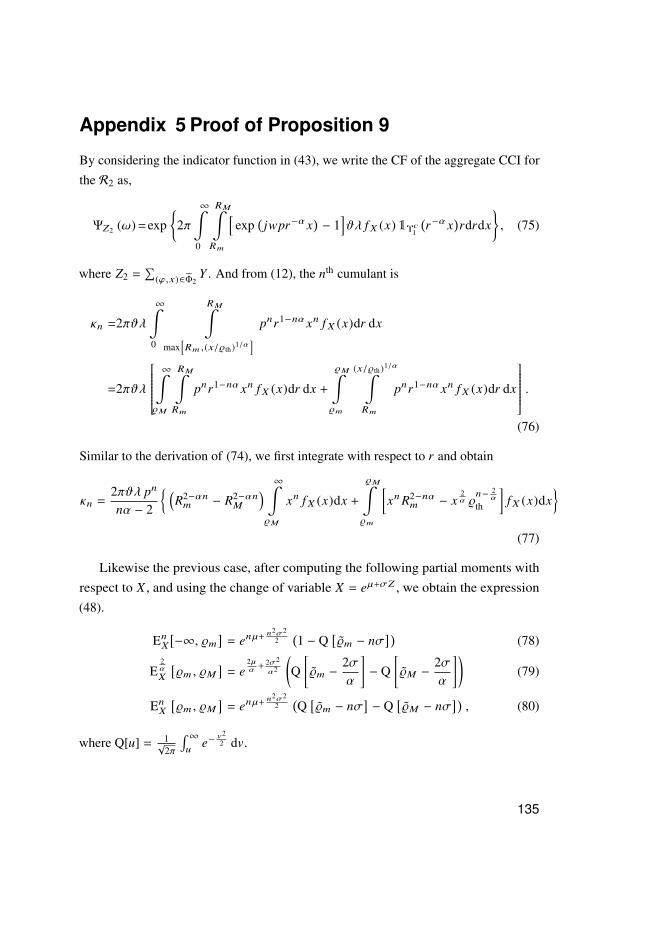
Appendix 5 Proof of Proposition 9
By considering the indicator function in (43), we write the CF of the aggregate CCI forthe R2 as,
ΨZ2 (ω) =exp
2π
∞∫0
RM∫Rm
[exp
(jwpr−α x
)− 1
]ϑλ fX (x) 1Υc
1
(r−α x
)rdrdx
, (75)
where Z2 =∑
(ϕ,x)∈Φ2Y . And from (12), the nth cumulant is
κn =2πϑλ
∞∫0
RM∫max
[Rm ,(x/%th)1/α
] pnr1−nα xn fX (x)dr dx
=2πϑλ
∞∫
%M
RM∫Rm
pnr1−nα xn fX (x)dr dx +
%M∫%m
(x/%th)1/α∫Rm
pnr1−nα xn fX (x)dr dx
.(76)
Similar to the derivation of (74), we first integrate with respect to r and obtain
κn =2πϑλ pn
nα − 2
(R2−αnm − R2−αn
M
) ∞∫%M
xn fX (x)dx +
%M∫%m
[xnR2−nα
m − x2α %
n− 2α
th
]fX (x)dx
(77)
Likewise the previous case, after computing the following partial moments withrespect to X , and using the change of variable X = eµ+σZ , we obtain the expression(48).
EnX
[−∞, %m
]= enµ+ n2σ2
2(1 − Q
[%m − nσ
])(78)
E2α
X
[%m , %M
]= e
2µα + 2σ2
α2
(Q
[%m −
2σα
]− Q
[%M −
2σα
])(79)
EnX
[%m , %M
]= enµ+ n2σ2
2(Q
[%m − nσ
]− Q
[%M − nσ
]), (80)
where Q[u] = 1√2π
∫ ∞u
e−v22 dv.
135

136
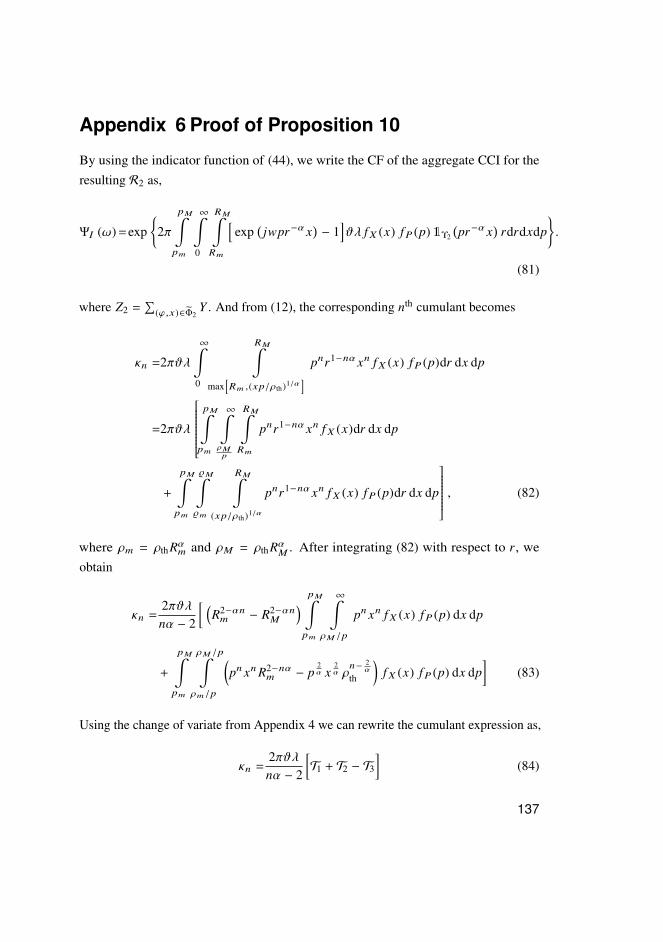
Appendix 6 Proof of Proposition 10
By using the indicator function of (44), we write the CF of the aggregate CCI for theresulting R2 as,
ΨI (ω) =exp
2π
pM∫pm
∞∫0
RM∫Rm
[exp
(jwpr−α x
)− 1
]ϑλ fX (x) fP (p) 1Υ2
(pr−α x
)rdrdxdp
.
(81)
where Z2 =∑
(ϕ,x)∈Φ2Y . And from (12), the corresponding nth cumulant becomes
κn =2πϑλ
∞∫0
RM∫max
[Rm ,(xp/ρth)1/α
] pnr1−nα xn fX (x) fP (p)dr dx dp
=2πϑλ
pM∫
pm
∞∫ρMp
RM∫Rm
pnr1−nα xn fX (x)dr dx dp
+
pM∫pm
%M∫%m
RM∫(xp/ρth)1/α
pnr1−nα xn fX (x) fP (p)dr dx dp
, (82)
where ρm = ρthRαm and ρM = ρthRαM
. After integrating (82) with respect to r, weobtain
κn =2πϑλnα − 2
[ (R2−αnm − R2−αn
M
) pM∫pm
∞∫ρM /p
pn xn fX (x) fP (p) dx dp
+
pM∫pm
ρM /p∫ρm/p
(pn xnR2−nα
m − p2α x
2α ρ
n− 2α
th
)fX (x) fP (p) dx dp
](83)
Using the change of variate from Appendix 4 we can rewrite the cumulant expression as,
κn =2πϑλnα − 2
[T1 + T2 − T3
](84)
137
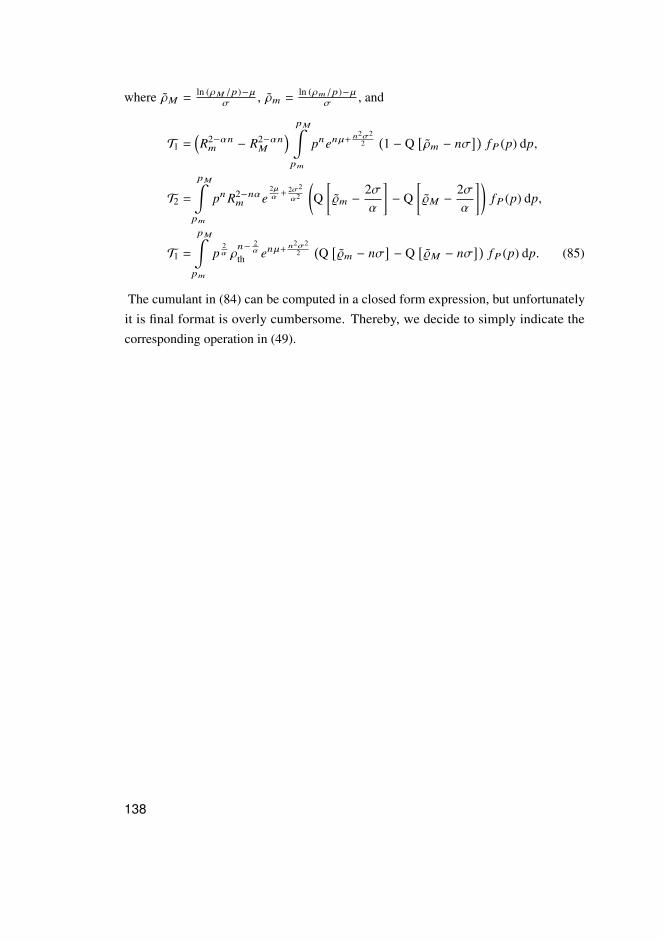
where ρM =ln (ρM /p)−µ
σ , ρm =ln (ρm/p)−µ
σ , and
T1 =(R2−αnm − R2−αn
M
) pM∫pm
pnenµ+ n2σ22
(1 − Q
[ρm − nσ
])fP (p) dp,
T2 =
pM∫pm
pnR2−nαm e
2µα + 2σ2
α2
(Q
[%m −
2σα
]− Q
[%M −
2σα
])fP (p) dp,
T1 =
pM∫pm
p2α ρ
n− 2α
th enµ+ n2σ22
(Q
[%m − nσ
]− Q
[%M − nσ
])fP (p) dp. (85)
The cumulant in (84) can be computed in a closed form expression, but unfortunatelyit is final format is overly cumbersome. Thereby, we decide to simply indicate thecorresponding operation in (49).
138
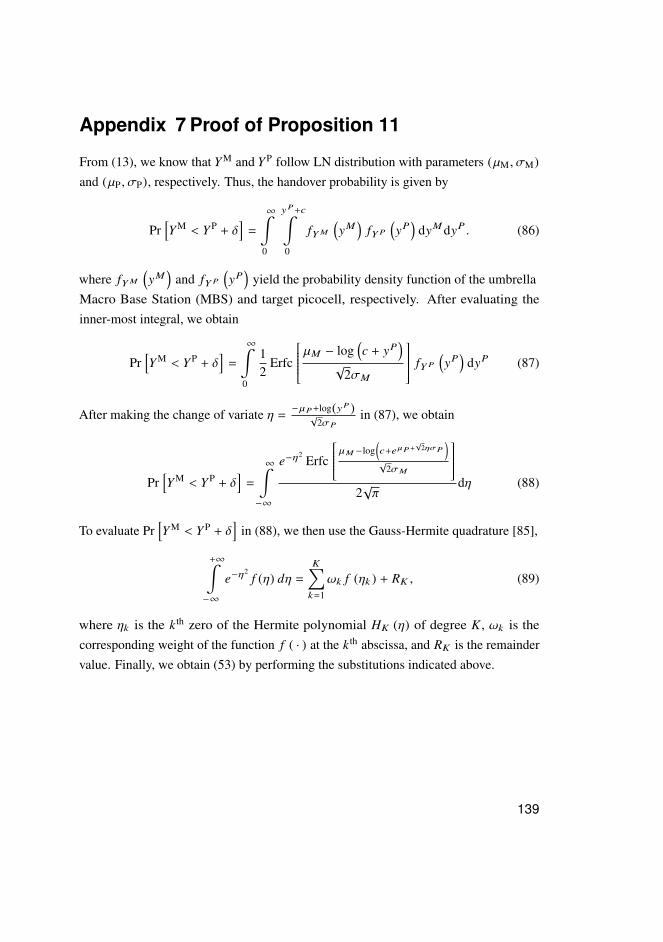
Appendix 7 Proof of Proposition 11
From (13), we know that Y M and Y P follow LN distribution with parameters (µM , σM)and (µP , σP), respectively. Thus, the handover probability is given by
Pr[Y M < Y P + δ
]=
∞∫0
yP+c∫0
fYM
(yM
)fY P
(yP
)dyMdyP . (86)
where fYM
(yM
)and fY P
(yP
)yield the probability density function of the umbrella
Macro Base Station (MBS) and target picocell, respectively. After evaluating theinner-most integral, we obtain
Pr[Y M < Y P + δ
]=
∞∫0
12
Erfc
µM − log(c + yP
)√
2σM
fY P
(yP
)dyP (87)
After making the change of variate η =−µP+log(yP )√
2σP
in (87), we obtain
Pr[Y M < Y P + δ
]=
∞∫−∞
e−η2
Erfc
µM−log(c+eµP+
√2ησP
)√
2σM
2√π
dη (88)
To evaluate Pr[Y M < Y P + δ
]in (88), we then use the Gauss-Hermite quadrature [85],
+∞∫−∞
e−η2
f (η) dη =
K∑k=1
ωk f (ηk ) + RK , (89)
where ηk is the k th zero of the Hermite polynomial HK (η) of degree K , ωk is thecorresponding weight of the function f ( · ) at the k th abscissa, and RK is the remaindervalue. Finally, we obtain (53) by performing the substitutions indicated above.
139

140
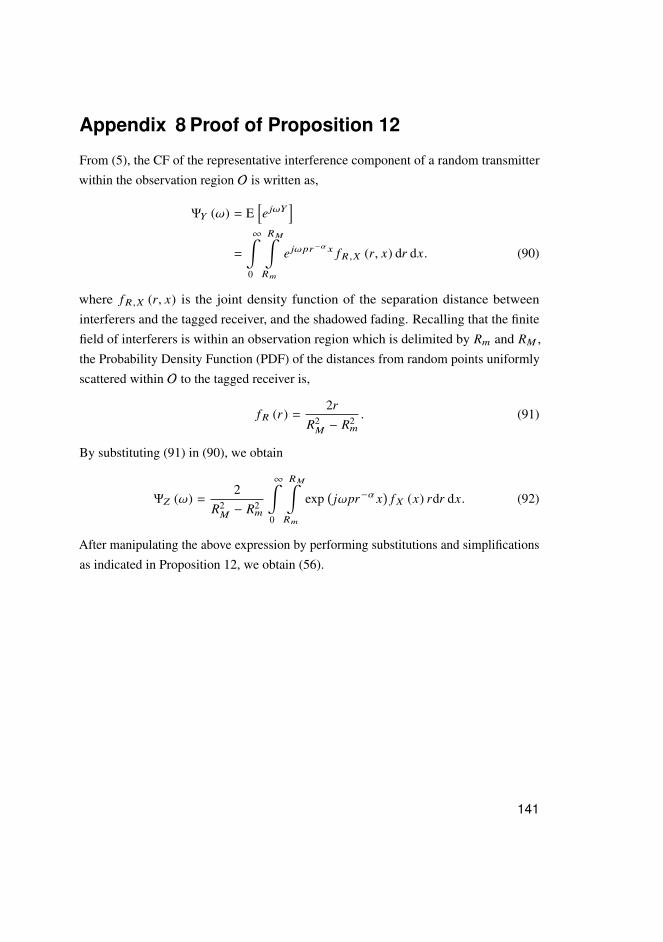
Appendix 8 Proof of Proposition 12
From (5), the CF of the representative interference component of a random transmitterwithin the observation region O is written as,
ΨY (ω) = E[e jωY
]=
∞∫0
RM∫Rm
e jωpr−α x fR ,X (r, x) dr dx. (90)
where fR ,X (r, x) is the joint density function of the separation distance betweeninterferers and the tagged receiver, and the shadowed fading. Recalling that the finitefield of interferers is within an observation region which is delimited by Rm and RM ,the Probability Density Function (PDF) of the distances from random points uniformlyscattered within O to the tagged receiver is,
fR (r) =2r
R2M− R2
m
. (91)
By substituting (91) in (90), we obtain
ΨZ (ω) =2
R2M− R2
m
∞∫0
RM∫Rm
exp(jωpr−α x
)fX (x) rdr dx. (92)
After manipulating the above expression by performing substitutions and simplificationsas indicated in Proposition 12, we obtain (56).
141

142
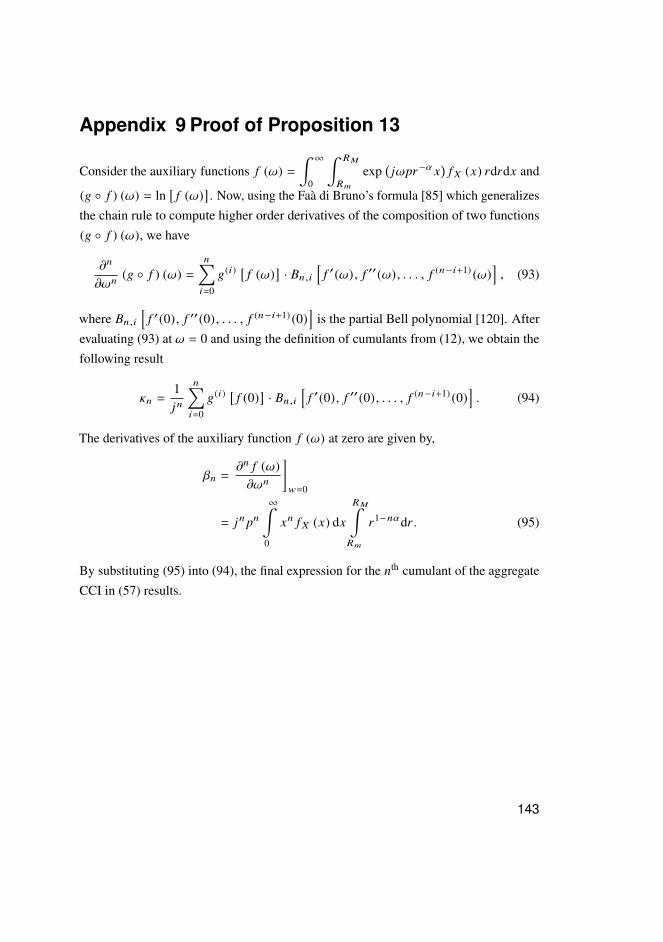
Appendix 9 Proof of Proposition 13
Consider the auxiliary functions f (ω) =
∫ ∞
0
∫ RM
Rm
exp(jωpr−α x
)fX (x) rdrdx and
(g f ) (ω) = ln[
f (ω)]. Now, using the Faà di Bruno’s formula [85] which generalizes
the chain rule to compute higher order derivatives of the composition of two functions(g f ) (ω), we have
∂n
∂ωn(g f ) (ω) =
n∑i=0
g(i) [f (ω)
]· Bn ,i
[f ′(ω), f ′′(ω), . . . , f (n−i+1) (ω)
], (93)
where Bn ,i
[f ′(0), f ′′(0), . . . , f (n−i+1) (0)
]is the partial Bell polynomial [120]. After
evaluating (93) at ω = 0 and using the definition of cumulants from (12), we obtain thefollowing result
κn =1jn
n∑i=0
g(i) [f (0)
]· Bn ,i
[f ′(0), f ′′(0), . . . , f (n−i+1) (0)
]. (94)
The derivatives of the auxiliary function f (ω) at zero are given by,
βn =∂n f (ω)∂ωn
]w=0
= jnpn
∞∫0
xn fX (x) dx
RM∫Rm
r1−nαdr . (95)
By substituting (95) into (94), the final expression for the nth cumulant of the aggregateCCI in (57) results.
143
A C T A U N I V E R S I T A T I S O U L U E N S I S
Book orders:Granum: Virtual book storehttp://granum.uta.fi/granum/
S E R I E S C T E C H N I C A
440. Distanont, Anyanitha (2012) Knowledge transfer in requirements engineering incollaborative product development
441. Keskinarkaus, Anja (2012) Digital watermarking techniques for printed images
442. Sorsa, Aki (2013) Prediction of material properties based on non-destructiveBarkhausen noise measurement
443. Sangi, Pekka (2013) Object motion estimation using block matching withuncertainty analysis
444. Duan, Guoyong (2013) Three-dimensional effects and surface breakdownaddressing efficiency and reliability problems in avalanche bipolar junctiontransistors
445. Hirvonen-Kantola, Sari (2013) Eheyttäminen, kestävä kehittely ja yhteyttäminen :integroivaa kaupunkikehitystyötä Vantaalla
446. Hannu, Jari (2013) Embedded mixed-signal testing on board and system level
447. Sonkki, Marko (2013) Wideband and multi-element antennas for mobileapplications
448. Saarinen, Tuomas (2013) Temporal and spatial variation in the status of acidrivers and potential prevention methods of AS soil-related leaching in peatlandforestry
449. Pirinen, Rauno (2013) Towards regional development by Higher EducationInstitutions : an empirical study of a University of Applied Sciences
450. Mäkinen, Liisa (2013) Improvement of resource efficiency in deinked pulp mill
451. Guo, Yimo (2013) Image and video analysis by local descriptors and deformableimage registration
452. Pantisano, Francesco (2013) Cooperative interference and radio resourcemanagement in self-organizing small cell networks
453. Ojanperä, Tiia (2013) Cross-layer optimized video streaming in heterogeneouswireless networks
454. Pietikäinen, Martti (2013) Metalli- ja elektroniikkateollisuus Oulun eteläisenalueella : kehitys koulutuksen ja teknologian näkökulmasta
455. Pitkäaho, Satu (2013) Catalytic oxidation of chlorinated volatile organiccompounds, dichloromethane and perchloroethylene : new knowledge for theindustrial CVOC emission abatement
C456etukansi.kesken.fm Page 2 Wednesday, June 26, 2013 11:37 AM
ABCDEFG
UNIVERSITY OF OULU P .O. B 00 F I -90014 UNIVERSITY OF OULU FINLAND
A C T A U N I V E R S I T A T I S O U L U E N S I S
S E R I E S E D I T O R S
SCIENTIAE RERUM NATURALIUM
HUMANIORA
TECHNICA
MEDICA
SCIENTIAE RERUM SOCIALIUM
SCRIPTA ACADEMICA
OECONOMICA
EDITOR IN CHIEF
PUBLICATIONS EDITOR
Senior Assistant Jorma Arhippainen
University Lecturer Santeri Palviainen
Docent Hannu Heusala
Professor Olli Vuolteenaho
University Lecturer Hannu Heikkinen
Director Sinikka Eskelinen
Professor Jari Juga
Professor Olli Vuolteenaho
Publications Editor Kirsti Nurkkala
ISBN 978-952-62-0176-4 (Paperback)ISBN 978-952-62-0177-1 (PDF)ISSN 0355-3213 (Print)ISSN 1796-2226 (Online)
U N I V E R S I TAT I S O U L U E N S I SACTAC
TECHNICA
U N I V E R S I TAT I S O U L U E N S I SACTAC
TECHNICA
OULU 2013
C 456
Carlos Héracles Morais de Lima
OPPORTUNISTICRESOURCE AND NETWORK MANAGEMENT IN AUTONOMOUS PACKET ACCESS SYSTEMS
UNIVERSITY OF OULU GRADUATE SCHOOL;UNIVERSITY OF OULU,FACULTY OF TECHNOLOGY,DEPARTMENT OF COMMUNICATIONS ENGINEERING;INFOTECH OULU
C 456
ACTA
Carlos H
éracles Morais de Lim
aC456etukansi.kesken.fm Page 1 Wednesday, June 26, 2013 11:37 AM