Embed Size (px)
Citation preview
Other-Regarding Preferences: A Selective Survey of Experimental Results*
David J. Cooper Florida State University
John H. Kagel
Ohio State University
11/14/2014
*Research support from the National Science Foundation grants SES-0451981 and SES-0924764 are gratefully acknowledged as are the comments and feedback we have received from the experimental economics community. Any opinions, findings, and conclusions or recommendations in this material are those of the authors and do not necessarily reflect the views of the National Science Foundation.
Table of Contents
Introduction. 1-2
I. Where Things Stood Circa 1995. 2-7
II. Models of Other Regarding Preferences, Theory and Tests
A. Outcome-Based Social Preference Models 7-11 B. Some Initial Tests of the Bolton-Ockenfels and Fehr-Schmidt Models 11-19
C. Social Preferences versus Difference Aversion 19-21
D. Models Incorporating Reciprocity/Intentions of Proposers 21-24
E. Other-Regarding Behavior and Utility Maximization 24-26
F. Learning 26-32
III. Other-Regarding Behavior, Applications and Regularities
A. The Investment/Trust Game 32-34
B. Results from Multilateral Bargaining Experiments 34-37
C. A Second Look at Dictator Games 37-42
D. Procedural Fairness 42-43
E. Diffusion of Responsibility 43-47
F. Group Identity and Social Preferences 47-50
G. Generalizability 50-55
IV. Gift Exchange Experiments
A. An Initial Series of Experiments 56-58
B. Incomplete Contracts 58-60
C. Wage Rigidity 60-61
D. The Effect of Cognitive Ability and the Big Five Personality Characteristics 62-64 in Other Regarding Behavior
E. Why Does Gift Exchange Occur? 64-66
F. Laboratory vs. Field Settings and Real Effort 67-73
G. Summary 73
Conclusions 74-78
References
Introduction There has been an enormous amount of experimental research devoted to “other-
regarding preferences” since the publication of the first Handbook of Experimental Economics
(1995). This literature’s daunting size poses serious problems in terms of developing a survey
since it is necessary to ignore (or only mention in passing) many worthwhile experiments, along
with the flood of results that will no doubt be published shortly after this survey is completed.1
The literature has also yielded a number of theoretical models designed to organize the data – a
search for meaning based on the “facts”2 – making this an area of experimental research where
theories flow directly from the experimental outcomes (as opposed to the more usual case of
experiments designed to test extant theory).
As such one must choose a point of attack to get through the literature – should it be
theory or data driven? The one adopted here is “historical,” using the results of a series of
experiments conducted by different groups, often designed to test the latest theories used to
explain earlier data. We start with a brief review of where things stood at the time the first
Handbook of Experimental Economics (1995) was published. We then introduce the two theory
papers which have had an enormous influence on this literature, Bolton and Ockenfels (2000;
BO) and Fehr and Schmidt (1999; FS). These papers showed how other-regarding preferences
over income inequality could explain a large number of experimental outcomes, usually in small
group bargaining type environments, which the “standard” economic model of strictly selfish
preferences failed to organize. In contrast, the same preferences, under different institutions
(e.g., competitive markets) produced the standard results. All of this was done without the need
to ignore too many “dead rats” (extant results that contradict one or the other of the two models).
This led to a burst of new experiments designed to distinguish between concerns for income
inequality which the BO and FS models focused on and other issues such as intentionality and
efficiency. We then review some of newer models designed to incorporate these experimental
findings, as well experiments responding to these newer theories (e.g., Charness and Rabin,
2002). Much of the focus here will be on bargaining games (especially the ultimatum game)
1 Our apologies in advance for those papers we have neglected. 2 See Roth (1995a) for a proposed classification of experiments according to how they were motivated and to whom they were intended to be persuasive. Under this taxonomy, searching for meaning becomes possible as results of experiments dealing with the effects of variables existing theory has little to say about accumulate, in efforts to explain the observed behavior. One of the interesting aspects of these newer theoretical models is the extent to which pure theorists have become involved in this work.
1
and the dictator game. While most of the literature has focused on models which rely on
modifying players’ utility functions to explain other-regarding behavior, there is also a strand
that uses adaptive learning models for this purpose. We briefly digress to describe these papers
since they not only provide an alternative explanation for some of the experimental results but
also helped to spur the experimental learning literature (see Chapter xx on learning). We devote
a separate section to “gift exchange” experiments, both because they have a different structure
from bargaining and ultimatum games and have recently been the subject of heated debate. It
should be clear by the time we finish this survey that there is no single, all-encompassing model
able to consistently explain all of the experimental results relating to other-regarding preferences,
and that a tractable model of this sort is unlikely to emerge any time soon.
At this point in time there are a number of surveys dealing with the other-regarding
preference literature that the interested reader might wish to consult. Fehr and Schmidt (2006)
and Camerer (2003) cover much of the experimental literature up to their point of publication.
Rotemberg (2006) surveys reciprocity and altruism in the workplace (field data), results of which
are particularly relevant to the gift exchange literature.
I. Where Things Stood Circa 1995.3
Much of the work on other-regarding preferences in 1995 hinged on results from
ultimatum and dictator games. In the ultimatum game two players, 1 and 2, must decide how to
divide a sum of money, k, between them. Player 1 (the Proposer) makes an offer to player 2 (the
Responder), which if accepted is divided as player 1 proposes. However, if player 2 rejects the
offer, both players get nothing. Although there are many Nash equilibria in this game, the
subgame perfect equilibrium outcome in which player 1 offers the minimum amount of money
required (or a small positive amount in case of no minimum requirement) is a natural equilibrium
refinement under the “standard” assumption that players only care about own income. In
contrast to this prediction, Proposers in developed economies typically offer between 40-50% of
the pie, which Responders accept. Smaller shares are usually rejected with sufficient regularity
that Proposers’ income maximizing offer is in the neighborhood of 40-50%.4 The beauty of this
sequential bargaining game is that you get to see the Responder’s choice in every game, and 3 See Roth (1995b) for a detailed survey of results up to this point in time. 4 The typical experimental design is to play the game 10 times with different partners but with roles fixed. In this case one game, chosen at random at the end of the sequence, is selected for payment. Subjects also receive a small show-up fee. For an interesting cross-cultural study of outcomes for ultimatum games in a number of “primitive” cultures see Henrich et al., 2001, 2005).
2
Responders face no game theoretic issues, such as ability to do backward induction or concerns
about strategic uncertainty.5
These initial experiments involved relatively small sums of money – $10-$30. Left
unresolved was the issue of robustness, as one might suspect that with larger sums at stake, the
amount that Responders would require to accept a proposal will go up, but the percentage of the
pie required might well go down. There are effects of this sort, with substantial deviations from
the subgame perfect equilibrium outcome continuing to be observed. For example, Slonim and
Roth (1998) conducted an experiment in the Slovak Republic where modest stakes (by American
standards) had large purchasing power. They compared games in which the amount of money at
stake in terms of local purchasing power equaled $30 in terms of US purchasing power, one-
month’s average wages in the Slovak Republic, or three-month’s average wages. Their data
show rejection rates decreasing as the amount of money at stake increased, falling from 26%
under the smallest stakes to 14% with the largest (pooling over all offers strictly less than half
the pie). Although this decrease may not seem large, it is statistically significant. Learning by
Proposers was more rapid in games with high stakes – subjects who initially made high offers
reduced their offers more rapidly while those who initially made low offers raised them more
quickly than in their other treatments. Nevertheless, the mean share of the money offered
changed very little, averaging 45% of the pie with the smallest stakes to 43% of the pie with the
largest stakes, with median offers staying in the 41-50% range throughout. Cameron (1999)
reports similar results from Indonesia with the amount of money at stake ranging from a day’s
wages to a month’s wages. She found no significant change in Proposer’s behavior with
increased stakes, but observes lower rejection rates in the higher stakes treatments. Controlling
for differences in the distribution of offers, rejection rates were estimated to be 17% lower in the
highest stakes treatment than in the lowest stakes treatment. This experiment ran for only two
rounds, so there is not much that can be said about learning.
Andersen et al. (2011) offer a more extreme variation on stake size, with the highest
stakes being a thousand times higher than the lowest stakes. The instructions for proposers
include language designed to generate an unusually high fraction of low offers, making it easier
to detect changes in the willingness of responders to accept small offers. Their data set indeed
5 See Camerer (2003) for a more detailed survey of ultimatum game studies.
3
contains a high proportion of low offers. As stakes go up, the percentage of the pie offered to
responders decreases but not as much as the stakes increase so that the amount offered actually
increases. Even with large stakes and coaching proposers to make low offers, proposer behavior
is not consistent with the perfect equilibrium. With the highest stakes, rejections largely vanish
(1 of 24 offers is rejected) even though more than three quarters of the proposers offer less than
20% of the pie. To interpret this result, it helps to understand that artificially depressing offers
makes stakes effects look larger since relatively generous offers (which are almost always
accepted under all stakes conditions) become a small portion of the dataset. For example,
suppose we limit the Slonim and Roth data to offers in the bottom quartile (offers less than or
equal to 40% of the pie). The decline in rejection rates now looks much steeper with a drop from
40% with the lowest stakes to 17% with the highest stakes, with Slonim and Roth noting that
rejection rates fall significantly with a large increase in stakes. Leading models of other-
regarding preferences, such as the Rabin (1993) and Bolton and Ockenfels (2000) models
discussed below, predict that rejections will largely vanish as stakes get sufficiently high since
even a small share of the pie results in a large offer. Andersen et al don’t offer a major departure
from the previous literature. They push the literature to its logical extreme, and find results that
are consistent with the existing theoretical and empirical literature.
One of the key questions these ultimatum game results left open was whether the close to
equal splits offered were a result of Proposers “trying to be fair to Responders” or were strategic
responses to anticipated rejections of low offers – the expected payoff maximizing offer in
ultimatum game experiments is typically around 40 - 45% of the pie. To sort out between these
two alternatives, Forsythe et al. (1994) compared ultimatum and “dictator” games. Like the
ultimatum game, the dictator game is a two player game in which player 1 (the dictator) proposes
to split a fixed sum of money with player 2. However, unlike the ultimatum game, in the dictator
game player 1’s proposal is binding, with player 2 having no say in the matter, as both players
receive whatever the dictator proposes. This eliminates any strategic considerations from the
dictator’s offer, and resulted in a dramatic downward shift in offers compared to the ultimatum
game: The modal offer changed from a 50-50 split in the ultimatum to game, to a zero offer in
the dictator game (see Figure 1). None the less, offers in the dictator game were not all zero (or
close to it) as one would expect if own income was all that mattered for dictators, and there was a
4
cluster of equal splits.6 The contrast between dictator and ultimatum game results clearly
indicate that strategic considerations (anticipation of rejection of low offers) underlies the near
equal splits typically reported in ultimatum games. At the same time they suggest some concern
for the well being of others. There have since been a large number of dictator type experiments
designed to sort out between various hypotheses concerning the nature of subjects’ other-
regarding preferences. These are discussed in Section III.F along with experiments
demonstrating the sensitivity of the experimental outcomes to rather modest changes in
experimental procedures.
[Insert Figure 1]
Just as it wasn’t initially clear whether Proposers’ behavior in the ultimatum game was
driven by distributional or strategic concerns, it also wasn’t obvious whether the rejection of
positive offers was due purely to outcomes or reflected a desire to punish unkind actions by
Proposers. Blount (1995) was one of the first to show that intentions matter as she compared
ultimatum games in which human Proposers made offers to games in which it was common
knowledge that the proposals were generated (i) by a computer and (ii) by a “disinterested” third
party. Using the strategy method, she elicited minimum acceptable offers (MAOs) from all
subjects prior to their knowing if they would be randomly assigned to the role of Proposer or
Responder. Figure 2 reports her results, which yield statistically significant differences between
the random treatment and either the standard (“interested party”) treatment or the third-party
treatment, but no significant differences between the latter two treatments.7
[Insert Figure 2]
An interesting sidelight to this paper consists of a third treatment in which she repeats the
exercise under conditions where (i) subjects knew they would be assigned to the role of
Responder and (ii) they were shown the distribution from which offers will be drawn. In this
treatment there was a large, statistically significant, increase in the frequency with which
subjects were willing to accept the lowest possible offers ($1 or less) in the “interested party”
treatment.8 Blount attributes this difference to the fact that subjects knew their role prior to
deciding, and that “…the proposal was contained in an envelope attached to their packet of 6 These results have since been replicated a number of times and make for an interesting classroom exercise for teaching undergraduates. 7 All of Blount’s experiments involved playing a single ultimatum game. 8 The frequency of MAOs of $1 or less went from somewhat less than 35% to over 60% judging from her figures. However, there continue to be significantly lower MAOs between the random and interested party treatments.
5
materials, which led them to reason through the problem in a slightly different manner taking a
much more directly self-interested approach.” (Blount, p. 138).
Much of the post-1995 literature on other-regarding preferences has centered around explicit
models. The roots of all the major models lie in papers written prior to 1995. One thread of the
theory literature focuses on preferences over the distribution of payoffs across players. The idea
that subjects’ utility functions should include a distributional component is a relatively old one.
The earliest example we are aware of that explicitly discusses how subjects’ utility function
ought to be modeled is Ochs and Roth (1989). They study a rich set of alternating offer
bargaining games, and find strong departures from the standard theory of self-regarding
preferences combined with subgame perfection. The most striking feature of their data is the
frequency of disadvantageous counter-offers. When players reject an offer, 81% of their
counter-proposals give them less money than they just turned down. These subjects are actively
taking less money in exchange for a more even distribution of payoffs. Ochs and Roth’s
discussion of these results focuses on how subjects’ utility functions must be modified to capture
this anomalous behavior: “uncontrolled elements of utility include some component that
measures ‘unfairness’ as deviations from equal division … which takes the form of a minimum
percentage.”
Bolton (1991) took the next major step in the development of this literature. He also studies
behavior from a series of alternating offer bargaining games. To organize the anomalous
behavior of subjects, Bolton presents an explicit model of subjects’ utility functions that includes
the proportion of their payoff to the other player’s payoff. This model differs from its better-
known successor, Bolton and Ockenfels’ (2000) ERC model, on a number of technical
dimensions – the functional forms are different, the earlier model is a complete information
model, and the earlier model is not designed to capture aversion to advantageous inequality – but
possibly the most important difference is one of purpose. Bolton (1991) aims to explain
behavior from bargaining games, but Bolton and Ockenfels (2000) have more universal goals,
attempting to explain behavior from a wide variety of games including examples where subjects
don’t seem to exhibit other-regarding behavior.
Rabin (1993) represents a markedly different approach to modeling other-regarding
preferences. Drawing on psychological game theory (Geanakoplos, Pearce, and Stacchetti,
1989; Battigalli and Dufwenberg, 2009), Rabin’s model gives a central role to beliefs. The
6
theory revolves around the concept of “kindness”. Player j’s kindness to Player i is given by the
(normalized) difference between Player i’s expected payoff and an “equitable payoff” as
determined by Player’s i’s beliefs about Player j’s actions and Player j’s beliefs about Player i’s
actions (second order beliefs). Based on this technical definition of kindness, the utility function
then states that players are more willing to be kind to others who they expect to be kind to them.
The critical innovation is that preferences don’t depend solely on outcomes, but also depend on
what other options were available and second order beliefs. The model is elegant in the extreme
and captures important aspects of reciprocity, but is not terribly tractable and can yield
implausible equilibria.9
II. Models of Other-Regarding Preferences, Theory and Tests
A. Outcome-Based Social Preference Models The pioneering work of Fehr and Schmidt (1999) and Bolton and Ockenfels (2000) focused
on models of players concerns about the distribution of payoffs along with their own income to
help explain ultimatum and dictator game outcomes. The real beauty of these two papers is that
through simply adding concerns about the distribution of payoffs to standard concerns about own
income, they were not only able to make sense of dictator and ultimatum game outcomes in
which standard “selfish” economic man fails to be revealed, but also showed, without changing
the structure of preferences, that standard own income maximizing results emerged in different
environments. All of this was done while not needing to ignore much, if anything, in the way of
inconsistent results. Both sets of authors fully recognized that other “fairness” considerations,
particularly intentionality and reciprocity, were likely to play a role in experimental outcomes,
but limited themselves to features needed to organize the main stylized facts at the time. In
short, what these two papers did was to summarize the emerging other-regarding behavior results
up to that point in time, including results from gift exchange experiments, and by explicitly
modeling this behavior, set off a whole new round of experiments that have helped to clarify the
nature of these other-regarding preferences.
9 Dufwenberg and Kirchsteiger (2004) address a flaw in Rabin’s theory. Rabin’s model is intended for normal form games, and has no means of updating beliefs following moves in an extensive form games. This can lead to implausible equilibria existing for basic games like the sequential Prisoner’s Dilemma. Dufwenberg and Kirchsteiger modify the theory to include a natural rule for updating beliefs, thereby eliminating these implausible equilibria.
7
The Fehr-Schmidt (FS) and Bolton and Ockenfels (BO) models assume that the utility ui (x)
of an outcome x = (x1,…, xi,…, xn) for a player in the game depends on player i’s own payoff xi
as well as how it compares to other players’ payoffs. Some percentage of individuals in the
population are assumed to get negative utility from having lower payoffs than others, which
explains why Responders are willing to reject low, but positive income offers in the ultimatum
game. Once Proposers recognize this, they respond by making substantial positive offers as
observed in the data. There is also a portion of the population that gets negative utility from
being better off than others, which can explain the positive offers in the dictator game. Both
models assume that the disutility from being worse off than others is likely to be greater than the
disutility from being better off. A nice feature of both models is that heterogeneity is explicitly
accounted for by assuming a distribution of preferences in the population. Even with a majority
of players having standard preferences - concern for own income only – both models can explain
the results from ultimatum and dictator games. Both models are fairly tractable since players’
preferences depend only on the outcomes of the game, and not on how they have been achieved.
It is therefore easy to apply both models and to make predictions about new games.
An interesting feature of both models is that they implicitly ignore payoffs outside the
laboratory. This amounts to an assumption that wealth outside the lab is the same between
subjects or is irrelevant to decisions made inside the lab. This assumption may seem innocuous,
but may be important for experiments that study interactions between differing ethnic groups
(e.g. Fershtman and Gneezy, 2001).10
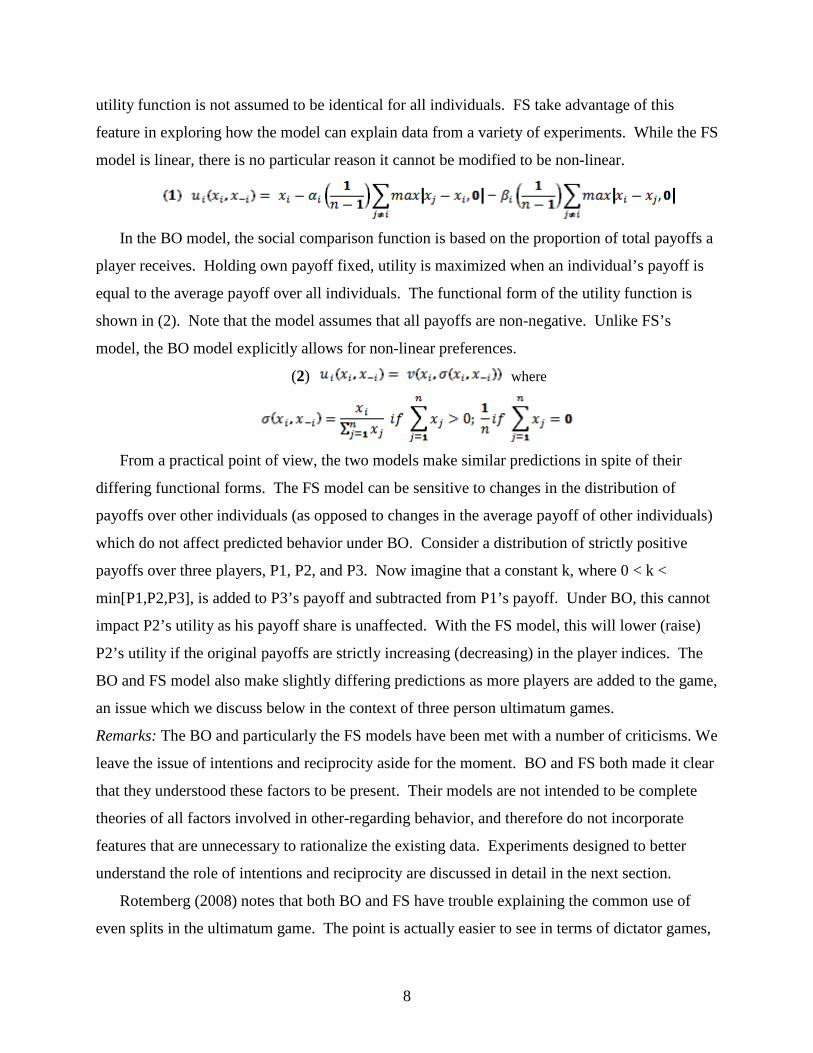
Formally, both models assign utility based on a subject’s own payoff and an other-regarding
component that compares a subject’s payoff with the payoffs of others. In the FS model, this
social comparison function is based on the difference between subjects’ own payoff xi and the
payoffs of all other subjects in the game. Utility is reduced when i’s payoff is either higher or
lower than other subjects’ payoffs, with the reduction being greater in the second case. The
resulting utility function is shown in (1). The parameters αi and βi capture the marginal disutility
from disadvantageous and advantageous inequality – by assumption αi ≥ βi ≥ 0. It is important to
note that the summations in (1) cannot be replaced with the average payoff to others, as the
distribution of payoffs over others affects the utility function. A second critical point is that the
10 See Armantier (2006) for one of the few experiments looking a the impact of wealth differences on play in ultimatum games (in this case, within experiment induced differences in player’s wealth).
8
utility function is not assumed to be identical for all individuals. FS take advantage of this
feature in exploring how the model can explain data from a variety of experiments. While the FS
model is linear, there is no particular reason it cannot be modified to be non-linear.
In the BO model, the social comparison function is based on the proportion of total payoffs a
player receives. Holding own payoff fixed, utility is maximized when an individual’s payoff is
equal to the average payoff over all individuals. The functional form of the utility function is
shown in (2). Note that the model assumes that all payoffs are non-negative. Unlike FS’s
model, the BO model explicitly allows for non-linear preferences.
(2) where
From a practical point of view, the two models make similar predictions in spite of their
differing functional forms. The FS model can be sensitive to changes in the distribution of
payoffs over other individuals (as opposed to changes in the average payoff of other individuals)
which do not affect predicted behavior under BO. Consider a distribution of strictly positive
payoffs over three players, P1, P2, and P3. Now imagine that a constant k, where 0 < k <
min[P1,P2,P3], is added to P3’s payoff and subtracted from P1’s payoff. Under BO, this cannot
impact P2’s utility as his payoff share is unaffected. With the FS model, this will lower (raise)
P2’s utility if the original payoffs are strictly increasing (decreasing) in the player indices. The
BO and FS model also make slightly differing predictions as more players are added to the game,
an issue which we discuss below in the context of three person ultimatum games.
Remarks: The BO and particularly the FS models have been met with a number of criticisms. We
leave the issue of intentions and reciprocity aside for the moment. BO and FS both made it clear
that they understood these factors to be present. Their models are not intended to be complete
theories of all factors involved in other-regarding behavior, and therefore do not incorporate
features that are unnecessary to rationalize the existing data. Experiments designed to better
understand the role of intentions and reciprocity are discussed in detail in the next section.
Rotemberg (2008) notes that both BO and FS have trouble explaining the common use of
even splits in the ultimatum game. The point is actually easier to see in terms of dictator games,
9
which also have an atom at the even split. BO predict that there should be no even splits in the
dictator game since the marginal utility from own income is positive at an even split and the
marginal utility from the other- regarding component of the utility function is zero. FS
rationalize even splits in the dictator game (as well as the ultimatum game) in terms of β > ½ so
that individuals strictly prefer a dollar in the pocket of someone with lower income
thanthemselves to a dollar in their own pocket. Rotemberg argues that this represents an
implausibly high level of altruism, and also notes that introducing a non-linear utility function in
place of the piecewise linear function does not improve matters. He then offers a model in which
Responders treat low offers as a signal of strong selfishness on the part of Proposers that they
want to punish. That is, like FS and BO Rotemberg explains rejections of unequal splits in the
ultimatum game in terms of ill-will toward Proposers, but argues that the ill-will is not a result of
income inequality.
Shaked (2006) offers a much more sweeping indictment of the FS model. The argument can
be summarized as follows: By virtue of having an infinite number of possible parameters values
the theory can predict a wide range of outcomes, from the competitive to the cooperative, so that
its predictions depend on the value of these parameters. (The infinite number of parameters
values referred to concern the heterogeneity of preferences within any given sample population
so that for any given game the theory’s predictions depend on how inequity averse the
population is.) As such the theory has no explanatory value beyond the capacity to predict a
broad range of outcomes as a function of possible parameter values within a given population.
We agree that there clearly are problems with both the BO and FS models, but holding these
models to their point predictions is probably too stringent a standard. Even in settings where
intentions and reciprocity have little force, any attempt to have a single functional form fit the
infinite variety of preferences present in the population is bound to lead to some questionable
results. The mass at the even split in dictator game makes this point clear. As Andreoni and
Bernheim (2009) argue persuasively, these individuals are probably following a social norm with
the goal of appearing “fair” rather than maximizing a well-behaved utility function over the
distribution of payoffs. In other words, the behavior of these subjects is driven by objectives
outside the realm of any model of purely outcome based preferences. What BO and FS did quite
successfully is to provide a tractable model that can rationalize and synthesize a reasonably large
10
body of data. Their work also motivated a large number of new experiments designed to better
understand what drives deviations from the standard (strictly) selfish preference model.
B. Some Initial Tests of the Bolton-Ockenfels and Fehr-Schmidt Models
Initial tests of the BO and FS models focused on two issues: (1) the extent to which choices
depend not only on outcomes but also on how those outcomes were achieved (i. e., the extent to
whichreciprocity and perceived intentions play a role in these games) and (2) the scope of
players’ concerns for own income compared to others in the relevant reference group.
Falk, Fehr, and Fischbacher (2003; FFF) investigated the role of intentions (or more
specifically, menu dependence) in a series of four discrete “mini” ultimatum games in which the
Proposer chose between two possible allocations x and y. In all four games the reference point
allocation x was the same: an (8, 2) split where the Proposer’s share is listed first. In one game
the alternative allocation was a (5, 5) split compared to which the (8, 2) allocation is relatively
selfish. In the second and third games the (8, 2) split was paired with a (10, 0) division and a (2,
8) division respectively. Compared with a (10, 0) option the (8, 2) split is relatively fair, with the
(2, 8) division forcing the Proposer to chose between being fair to himself or to the Responder.
Finally, as a control treatment they paired the (8, 2) allocation with itself, so that the Proposer
had no choice but to offer an (8, 2) allocation.11
Subjects played all four games in different order, with no feedback following each game.
The strategy method was employed so that Responders had to indicate their choices for both the
reference point allocation and the alternative allocation. Figure 3 reports their results in terms of
rejection rates for the (8, 2) allocation in favor of zero payoff for both players. The rejection rate
in the game with the (5, 5) alternative is significantly higher than in all the other games, with the
difference between the (2, 8) and (10, 0) games statistically significant as well. Proposer
behavior anticipates these outcomes as the percentage of (8, 2) offers is 31%, 73% and 100%
against the (5, 5), (2, 8) and (10, 0) alternatives respectively. FFF conclude that differences in
rejection rates between treatments clearly indicate that intentions matter. Finally, there is an
11 Bolton and Zwick (1995) are responsible for introducing the mini (or cardinal) ultimatum game to the experimental literature.
11
18% rejection rate under for the (8, 2) allocation when the Proposer has no choice, which FFF
cite as evidence of pure income inequality aversion.12
[Insert Figure 3]
Three person ultimatum games, introduced by Güth and van Damme (1998; GD), have also
provided a productive framework for testing the BO and FS models. In GD player X proposes to
split income between players X, Y and Z. Player Y then accepts or rejects the split, with the
division binding when Y accepts and all three players getting zero if the proposal is rejected. Z
is a “dummy” player with the same role as player 2 in the dictator game. GD found that
Proposers (player X) took advantage of Z’s Dummy status, essentially dividing the money
between themselves and Y, with these offers rarely rejected when Y had full information about
the proposed split.
Bolton and Ockenfels (1998) cite these results as strikingly consistent with their model. In
the BO model, the other-regarding component of utility is evaluated relative to the social norm of
equal shares for all players. Accordingly, adding a third player to the ultimatum game changes
the equal division social norm from ½ to 13 , leading to a prediction of higher acceptance rates for
offers in the interval than in the typical two player game. In line with the prediction, GD
observed no rejections of offers in the neighborhood of 40% of the pie for Responders (player Y)
when they knew the full distribution of payoffs. In contrast, such offers have a rejection rate of
about 20% in a standard two-person ultimatum game (see Cooper and Dutcher, 2011).
Moreover, other-regarding preferences in BO only depend on own share of total payoffs. The
distribution of payoffs over the other players has no impact on utility. This lines up well with
GD’s observation that no rejections could be attributed to the low share allocated to the Dummy
player.13
Kagel and Wolfe (2001; KW) modified GD’s three player design to obtain a much more
demanding test of the BO and FS models. First, the responding player was randomly selected to
be either Y or Z after X had made her allocation. This was designed to maximize the chance of
the Responder getting a relatively low offer as Proposers, not knowing the identity of the player
prior to making an offer, could no longer pay off the Responder at the expense of the Dummy 12 See Brandts and Solà (2001) for a similar design and results. These papers should be regarded as independent and simultaneous. Andreoni, Brown, and Vesterlund (2002) also provide evidence for the role of menu dependence in generating other-regarding behavior. 13 The FS model has more difficulty characterizing the GD results.
[ ]1 13 2,
12
player. Second, the rejection outcome for the non-responding player varied between treatments
taking on values of $0, $1, $3, and $12 with the amount of money to be divided set at $15.
Given a positive consolation prize for the “dummy” player, the BO model predicts that the
Responder will accept any positive offer since if they reject it they get no money and earn less
than the average payoff. The FS model permits some rejections with a positive consolation
prize. However, once the level of disadvantageous inequality from rejection is greater than from
acceptance, the offer must be accepted regardless of the amount of advantageous inequality the
offer provides the Responder compared to the “dummy” player.14 As such the $12 consolation
prize treatment should effectively eliminate all rejections under the FS model as well.
Pooled Responder data from KW’s treatments with positive consolation prizes are reported in
Figure 4.15 The point prediction of the BO model is falsified as rejection rates average between
15%-22% under the different positive consolation prize treatments. Further, with the $12
consolation prize, virtually all offers should have been accepted according to the FS model, but
this treatment had the highest rejection rate of 20%. Even more damaging to both models, the
rejection rate for the $0 consolation prize treatment was 21%, falling in the same range as
rejection rates for the positive consolation prize treatments. Similar results were found with a
negative consolation prize of $10 for the Dummy player.16 In short, the consequences for the
Dummy player did not seem to matter to Responders.17
[Insert Figure 4]
The invisibility of the third player in KW’s experiment calls into question FS and BO’s
explanations of why, despite other-regarding preferences of the sort both models specify, there is
typically no impact on the standard (selfish) model’s predictions in competitive markets. For
both models, explaining market results such as those reported by Roth et. al (1991) relies on
individuals comparing their payoffs with those of all market participants. For example, FS note
that the crucial factor leading to very inequitable outcomes in market games is that no single
14 Consider the following proposal (9, 6, 0) where 9 is the Proposer’s share, 6 is the Responder’s share and the Dummy gets 0. In case of rejection both the Proposer and Responder get 0 and the Dummy gets some amount greater than 3 (3+). As such utility from acceptance is Ui = 6 – 0.5 αi (3) – 0.5 βi (6) and utility from rejection is Ui = 0 – 0.5 αi (3+) – 0.5 βi (0) so that with 0 ≤ β ≤ 1, as FS assume, acceptance dominates rejection. 15 KW used a between groups design with 10 rounds per treatment with one of the 10 selected at random to be paid off on. Subjects received feedback following each round. 16 In this treatment all subjects received a starting cash balance of $15 in place of the $5 show-up fee provided in the other treatments in order provide positive earnings for Dummy players in the case of rejections. 17 Random effect probits indicate that, controlling for offers, rejection rates were essentially unaffected by the presence of positive consolation prizes or the size of the consolation prize.
13
player can enforce an equitable outcome. Therefore, even very inequity-averse Responders try
to turn the unavoidable inequality to their advantage by accepting low offers. However, in KW’s
three player ultimatum game we see a relatively high percentage of Responders who get low
offers turning their backs on the opportunity to reduce their income inequality relative to the
Dummy player by accepting a modest positive offer. Another key difference between the three
player ultimatum game and market games is that small payoffs can be directly attributable to a
single person in the ultimatum game, whereas individual attribution is typically difficult in
market games. As such the results also suggest that intentions matter, but with the added twist
that “unfair” offers are rejected regardless of the consequences for “innocent” third parties.
Bereby-Meyer and Niederle (2005; BMN) report two three-person games designed to
distinguish the presence of outcome based preferences and reciprocity in bargaining games. The
first class of games (called third-party rejection payoff games – TRP) is similar to the three
player game in KW with a Proposer making an offer to a Responder under each of three
consolation prizes for the third “dummy” player - $0, $5, or $10. There are a number of
procedural differences from KW as each subject plays once under each treatment with no
feedback on outcomes until the session is over, and the Proposer chooses to split the money
($10) strictly between herself and the Responder. In the second class of games (referred to as
proposer rejection payoff games – PRP) the Proposer is required to split the $10 between the
Responder and the Dummy player with no money for herself. If the Responder accepts, the
division is binding. If she rejects, both she and the Dummy get nothing, but the Proposer gets a
rejection payoff - $0, $5, or $10 - depending on the treatment. In terms of pure intention based
models,18 in the PRP-$0 game the Responder should accept all offers since the Proposer’s payoff
does not depend on the Responder’s action and the Dummy, not taking any action, cannot signal
kindness one way or the other. In the PRP-$5 and $10 games pure intention based models allow
for the possibility that low offers that would be rejected in the parallel TRP games will be
accepted so as to not reward Proposers for unkind behavior.
[Insert Figure 5] 18 It is a little tricky to define a “pure” model of intentions, since actions are defined as kind or unkind in terms of the distributions of payoffs that result. An axiom like the following captures the spirit of a pure model of intentions reasonably well: Consider a binary choice between two distributions of monetary payoffs across individuals. If these distributions result solely from moves by nature (in the game theoretic sense) or choices of disinterested parties (individuals whose monetary payoffs do not depend on their choices or the choices of other individuals), then all individuals should prefer the distribution that gives them the higher monetary payoff. In the PRP-$0 game, the Proposer is a disinterested party and the Dummy plays no role in determining the distribution of payoffs.
14
Figure 5 reports their results (all proposals were in dollar increments with $1 being the
smallest possible allocation). In the TRP games with positive payoffs for the Dummy player
when offers are rejected, low offers are routinely rejected at the same, or higher, rates compared
to the TRP-$0 treatment, which is inconsistent with both BO and FS models. Even more
damaging, there were significantly higher rejection rates in the TRP game than in the PRP game
for all payoff levels, which is inconsistent with outcome based models that predict no difference
in behavior according to players’ positions in the allocation process (Proposer, Responder or
Dummy player). Pure intentionality models can explain why rejection rates for low offers were
significantly lower in the PRP-$5 and $10 games, but cannot rationalize the higher rejection rate
observed in the PRP-$0 games when Responder’s payoffs were $3 or less. The results of this
experiment point to multiple forces playing a role in other-regarding behavior. The data give the
impression that intentions play a larger role than purely distributional concerns, but the role of
pure outcome based preferences is far from zero.
Xiao and Houser (2005; XH) also report results from a one-shot ultimatum game that are
quite damaging to the FS and BO models. They add the interesting twist of Responders having
the option to send written messages to Proposers in addition to deciding whether to accept or
reject offers. XH find that conditional on offers being 20% of the pie or less, rejection rates drop
from 60% to 32% when Responders have the option to verbally punish Proposers – for about
80% of the low offers a message with “negative emotions” was sent. There were no significant
differences in rejection rates with and without communication for more generous offers, as well
as no significant differences in the distribution of offers.
XH’s results are best understood in terms of the costs of punishment. Responders have an
emotional reaction to low offers and reciprocate by punishing the Proposers. When the only
punishment mechanism available is the relatively costly option of rejection, they use it.19
However, as demonstrated by Andreoni and Miller (2002), other-regarding behavior is price
sensitive. Given the less costly option of punishing selfish Proposers with verbal abuse a number
of Responders chose it rather than give up the money. Thus, outcome based models like the BO
and FS that only consider pecuniary outcomes are likely to miss important aspects of subjects’
behavior when players have a wider array of options to consider.
19 Work by Grimm and Mengel (2011) suggests that this emotional reaction is relatively short-lived. They find that a 10 minute delay with subjects answering an unrelated questionnaire before deciding to reject or accept offers in the ultimatum game reduces the rejection of low offers (20-30% of the pie) from 60-80% to 20%.
15
An important question here is the long run implication of Responders using verbal rather than
monetary punishment. In another paper, Xiao and Houser (2009) argue that monetary
punishment is initially more powerful than verbal punishment. One implication of this is that if
Responder’s persistently eschew monetary punishments, this would imply a long run trend
towards lower offers.20 However, there is no reason to believe that Responder’s mix of
punishments will be constant over time. Additional experimental work is needed to determine
the long run equilibrium when both pecuniary and non-pecuniary punishments are available.
Remark: This experiment holds lessons for field studies of other-regarding behavior. These
studies typically focus on the same narrow avenues of response incorporated into laboratory
experiments. But in field settings subjects usually have an array of responses available to them
that are difficult to capture or quantify. Failing to identify a reciprocal response along one
avenue doesn’t mean that a reciprocal response hasn’t occurred, nor does it imply that reciprocity
isn’t playing an important role in driving individual’s choices. As such one needs to be
particularly careful when drawing conclusions from less structured field settings.
Summary: The BO and FS outcome based models of social preferences pulled together a
surprisingly large number of experimental outcomes and organized them using other-regarding
preferences based on income inequality. As such they provided a clear focal point for further
experimental work. Although subsequent experiments have been hard on both models, these
papers made (and continue to have) a major impact on the literature and have moved the
discussion forward in terms of helping to identify exactly what kind of fairness considerations
underlie deviations from the standard selfish, income maximizing model. At this point the data
suggest: (1) outcomes do matter, to some extent at least, as for example when Responders reject
unequal offers in cases where Proposers have no choice but to make such offers, and (2)
intentions matter as well, possibly even more than outcomes.
There still remain important methodological issues to be addressed in this literature.
Reading through all of these papers at once, we are struck by the varying methods used by
different researchers. Strict comparisons across papers are therefore difficult, and it is unknown
how many of the results reported in the literature are robust to changes in methodology. As a
vivid example of this problem, consider the following question: why do subjects in FFF reject
20 In this follow-up paper XH look at the effect of Responder messages in a one-shot dictator game, finding that it results in higher offers.
16
unequal offers when Proposers have no choice but to make such offers? Difference aversion is
an obvious explanation for this, but results from Charness and Rabin (2002; CR) force us to
question this. In a dictator game, CR ask player Bs to choose between (800, 200) – 200 being
B’s payoff and 800 being A’s payoff – versus a (0, 0) allocation and find that 100% of the 36
subjects queried chose the (800, 200) option. It is hard to argue that the differing results of FFF
and CR are anything other than an artifact of how preferences are being elicited. One possible
methodological cause is CR’s use of an “equal opportunity” procedure whereby each subject got
to choose as a B player knowing that their actual position as the A or B player would be
determined randomly at the end of the session; other researchers have found that “equal
opportunity” procedures reduce inequality aversion (Bolton and Ockenfels, 2006). Another
possibility is that subjects don’t fully understand that the Proposer’s choice is irrelevant in FFF,
but would understand this if they gained experience via repeated trials with feedback. The point
is that further work is needed to know how researchers’ differing methodological choices are
affecting the observed behavior and, by extension, conclusions reached with respect to other-
regarding preferences.21
The question of whether to use one-shot experiments (or repeated trials without feedback)
versus repeated trials with feedback comes up repeatedly in this literature. The argument for
using one shot experiments is that these are particularly clean – there is no possibility of
unwanted repeated game effects and, because there is no rematching of subjects, games from the
same session can be treated as fully independent observations.22 However, the decision to not
allow for learning via experience can affect results. For example, if one looks at a standard
ultimatum game played for ten rounds, the distribution of proposals is typically much more
dispersed in early compared to later rounds, with the frequently stated stylized result of a high
concentration of offers in the 40-50% range (and minimal rejection rates for such offers) only
emerging in later rounds (see, for example, the data reported in Roth et al., 1991).
Economists have traditionally preferred experiments with repeated trials and feedback in
response to the original Wallis-Friedman (1942) critique of economic experiments:
21 For another clean example where a framing effect changes the degree of other-regarding behavior, in this case a preference for inclusion, see Cooper and Van Huyck (2003). 22 This depends a little on how careful you want to be in running statistics. There are possible sources of session effects beyond direct interaction (i.e. the instructions are read slightly differently, sunny vs. rainy weather affects the mood of subjects, etc.). Frechette (2012) provides a good discussion on how to control for session effect in experimental data.
17
“It is questionable whether a subject in so artificial an experimental situation could know
what he would make in an economic situation; not knowing, it is almost inevitable that he would, in entire good faith, systematize his answers in such a way as to produce plausible but spurious results. For a satisfactory experiment it is essential that the subject give actual reactions to actual stimuli.... Questionnaire or other devices based on conjectural responses to hypothetical stimuli do not satisfy this requirement. The responses are valueless because the subject cannot know how he would react.” This is not to say that repeated trials are the only way to conduct experiments, but more
investigation is needed of whether results based on one-shot experiments, or experiments without
feedback, yield results that are robust to subjects gaining experience.
Another methodological question that comes up frequently in this literature is whether to
use the standard direct response method or the strategy method. The appeal of the strategy
method is obvious, as it allows more data to be gathered per subject, but once again the question
comes up of whether this affects behavior. Results vary as to whether the strategy method leads
to different results than direct response.23 At the very least it seems clear that it can matter.
Brandts and Charness (2003) and Brosig, Weimann, and Yang (2003) both find that punishment
rates for an unkind and/or deceptive act are significantly lower when the strategy method is used.
Along similar lines, Casari and Cason (2009) find significantly less trustworthy behavior in trust
games when the strategy method is used. The size of the effect can be large. In Brandts and
Charness, the clearest example of an unkind act occurs when a player lies about his intent to
make a fair choice. Using direct responses this sort of lying is punished in 56% of the
observations (9/16), but the punishment rate is halved to 28% (19/69) when the strategy method
is used. Casari and Cason observe that 40% of subjects (14/35) return nothing when the direct
response method is used, but this jumps to 60% (43/72) when the strategy method is used. In
contrast to the preceding, there are also cases where the strategy method does not matter, as in
the examples reported by Brandts and Charness (2000). When an effect exists, the strategy
method yields less reciprocal behavior than direct responses. This suggests an anchoring and
adjustment process in line with other examples of framing effects – when subjects are faced with
a problem that has multiple dimensions, the framing can impact which dimension gets the most
23 See Brandts and Charness (2011) for a recent survey on this issue.
18
attention and which is treated as a secondary concern.24 In the environments discussed above,
subjects are trading off reciprocity for kind/unkind actions against payoff maximization. Direct
responses seem to focus attention more on reciprocity, yielding more reciprocal behavior. From
a practical point of view, the issue is that other-regarding behavior can be sensitive to the method
of elicitation. This makes it difficult to directly compare studies which have used different
elicitation methods.
C. Social Preferences versus Difference Aversion
At this point in time it seems safe to state that deviations from the predictions of the
standard selfish model cannot be explained solely based out outcomes, as reciprocity and
intentions play an important role. Nonetheless, outcome based preferences still seem likely to
explain some portion of other-regarding behavior. Within the BO and FS models, difference
aversion is the driving force behind these outcome based preferences. Beginning with Charness
and Rabin (2002) and continuing with Engelmann and Strobel (2004, ES) it has been argued that
social welfare preferences – concerns for efficiency (defined as maximizing total payoffs for the
group) and the payoffs for the least well-off players in the group (maximin preferences) – are the
key factors underlying outcome based preferences rather than difference aversion. Both of these
papers report a number of results supporting this position.
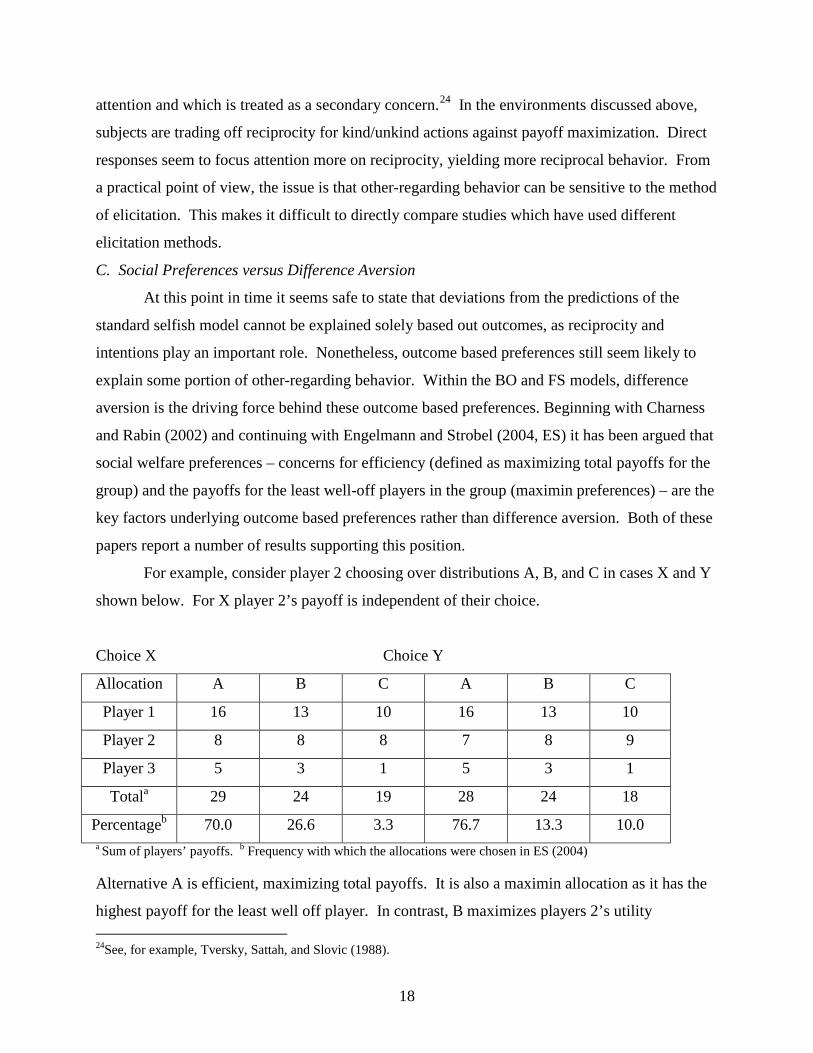
For example, consider player 2 choosing over distributions A, B, and C in cases X and Y
shown below. For X player 2’s payoff is independent of their choice.
Choice X Choice Y
Allocation A B C A B C
Player 1 16 13 10 16 13 10
Player 2 8 8 8 7 8 9
Player 3 5 3 1 5 3 1
Totala 29 24 19 28 24 18
Percentageb 70.0 26.6 3.3 76.7 13.3 10.0 a Sum of players’ payoffs. b Frequency with which the allocations were chosen in ES (2004) Alternative A is efficient, maximizing total payoffs. It is also a maximin allocation as it has the
highest payoff for the least well off player. In contrast, B maximizes players 2’s utility 24See, for example, Tversky, Sattah, and Slovic (1988).
19
according to the BO model, with C maximizing player 2’s utility according to FS.25 The
allocations in choice Y are the same as X with the exception that in Y it costs player 2 a modest
amount of money to choose the efficient, as well as the maximin, outcome. BO now predicts
choice of B or C, with FS still predicting C.26 In practice this small increase in cost has little
impact on the choice of the efficient (as well as maximin) allocation. Looking at a variety of
choices of this sort, both CR and ES estimate the relative impact of efficiency considerations,
maximin preferences and difference aversion of the sort specified in BO and FS on choices,
concluding that social welfare preferences play a more important role than difference aversion.
Earlier results by Kagel, Kim and Moser (1996) cast doubt on this conclusion. Kagel et
al report an ultimatum game experiment with asymmetric information and asymmetric payoffs
that shows players concerns for efficiency are trumped by own income concerns when the two
are in strong conflict. In a treatment in which the proposer has a 3 to 1 conversion ratio from
chips to dollars, with only proposers knowing the conversion ratio, and bargaining is in terms of
chips, Proposers offer Responders slightly less than half the chips on average, with only 8% of
their proposals being rejected.27 However, when payoffs favored Responders 3 to 1, again with
only Proposers knowing the conversion ratio, mean offers averaged 31.4 chips overall, as
Proposers “concern for efficiency” vanished in favor of own income, in spite of rejection rates
averaging some 21% of all offers.
Responding to ES, BO (2006) argue that the essential question is the willingness to pay
for efficiency as opposed to equity. They provide results from an experiment in which twice as
many subjects deviate from higher own payoffs in favor of the more equitable outcome as
opposed to deviating in favor of the more efficient outcome. In response ES (2006) point out
that it is difficult to identify the correct metric for measuring the tradeoff between efficiency and
equity, noting that in BO’s experiment subjects are asked to pay a lot for relatively small
percentage increases in efficiency. Fehr, Naef, and Schmidt’s (2006; FNS) response to ES is to
identify strong subject population effects in the degree with which subjects favor efficiency over
equity. They replicate one of ES’s choices, reporting that 53% of non-economists prefer the
most egalitarian (and least efficient) allocation as opposed to 30% when the subjects are 25 For BO it is own share divided by the average share that determines σi, which is maximized for allocation B. For FS the relatively small difference with respect to 2’s share relative to 1 in allocation C tips the scales given the other differences and the greater weight placed on negative as opposed to positive differences FS assume. 26 Payoffs were in Deutsche Marks with an exchange rate of between $0.45 and $0.55 at the time of the experiment. 27 These rejections can largely be accounted for by some Proposers going for more than 50% of the chips.
20
economics and business students. They attribute the stronger preference for efficiency over
equity in ES’s experiment as opposed to other studies to the fact that ES’s subject population
consisted of economics and business majors.
Reviewing this exchange of views, the literature suffers from attempts to oversimplify
subjects’ behavior. There is great heterogeneity among subjects’ preferences, as FNS (2006)
convincingly demonstrate, and subjects appear to be able to make reasonable adjustments in how
much they rely on any one criterion depending on the costs and benefits involved. Further,
reciprocity/intentionality appears to be a stronger force in driving subjects’ choices than any
purely distributional concerns. For example, only 18% of Responders rejected the (8, 2) offer in
FFF when Proposers have no choice, but 45% of such offers are rejected when the Proposer
could have offered a fair split (5, 5).
D. Models Incorporating Reciprocity/Intentions of Proposers
The experimental literature responding to introduction of the FS and BO models made it
clear that a full theory of other-regarding preferences must account for more than inequality
aversion. Limiting attention to distributional issues, the sources of other-regarding behavior
clearly extend beyond inequality aversion, given consistent evidence of preferences for social
welfare and Rawlsian (maxmin) preferences. A good model should be flexible enough to
capture these diverse motivations.
There are also a number of factors driving other-regarding behavior beyond distributional
preferences that a good model should incorporate. To be overly simplistic, the golden rule of
human behavior often seems to be “do unto others as they have done unto to you.” In other
words, individuals should place positive weight on the payoffs of others who have treated them
kindly and negative weight on the payoffs of unkind individuals. This apparently straight-
forward formulation immediately raises the critical issue of how to define kind/unkind actions.
The experimental evidence suggests that a number of factors may play into this definition. How
you perceive an action that could potentially be interpreted as being unkind is likely to depend on
the specifics of the situation. What other options were available (menu dependence)? Did the
other person act intentionally or were you harmed by accident (intentionality)? Did the other
person harm you because they anticipated you trying to harm them (2nd order beliefs)? Was the
other person’s action any worse than what would normally be expected (social norms)? An ideal
formal model of reciprocity would capture all of these aspects of kindness, but this is a
21
Herculean task given the diversity of issues involved. This has not, however, stopped a number
of authors from making the attempt.
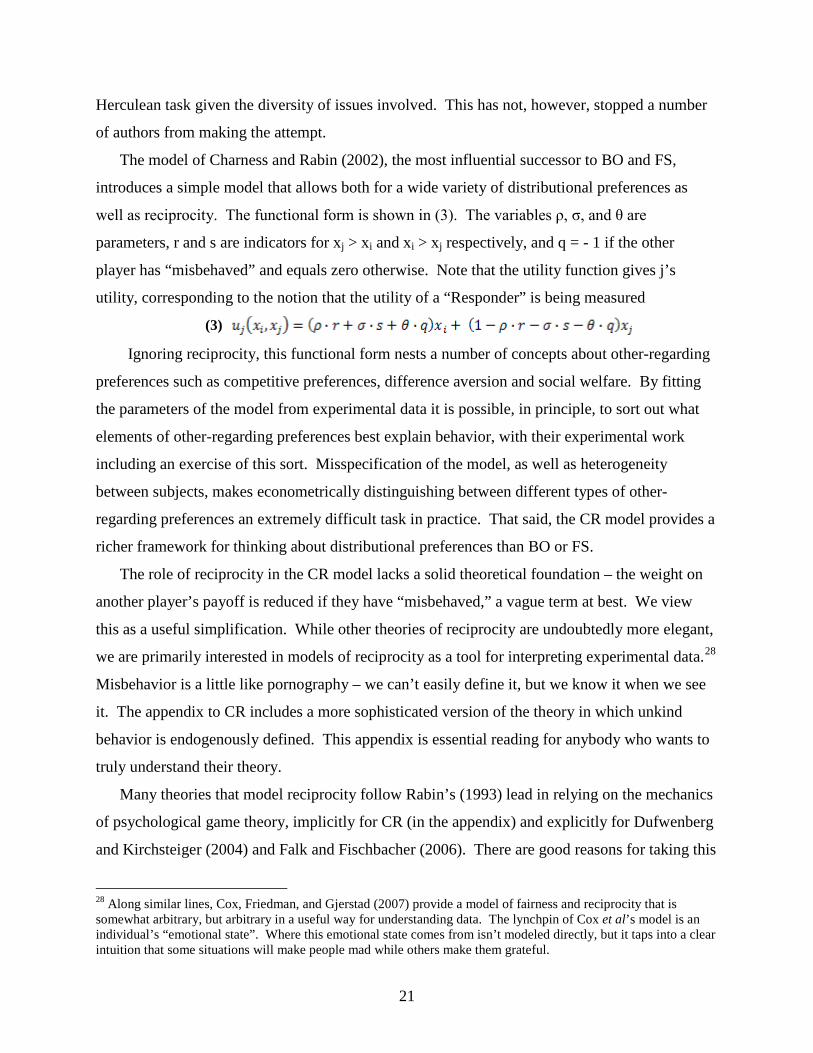
The model of Charness and Rabin (2002), the most influential successor to BO and FS,
introduces a simple model that allows both for a wide variety of distributional preferences as
well as reciprocity. The functional form is shown in (3). The variables ρ, σ, and θ are
parameters, r and s are indicators for xj > xi and xi > xj respectively, and q = - 1 if the other
player has “misbehaved” and equals zero otherwise. Note that the utility function gives j’s
utility, corresponding to the notion that the utility of a “Responder” is being measured
(3)
Ignoring reciprocity, this functional form nests a number of concepts about other-regarding
preferences such as competitive preferences, difference aversion and social welfare. By fitting
the parameters of the model from experimental data it is possible, in principle, to sort out what
elements of other-regarding preferences best explain behavior, with their experimental work
including an exercise of this sort. Misspecification of the model, as well as heterogeneity
between subjects, makes econometrically distinguishing between different types of other-
regarding preferences an extremely difficult task in practice. That said, the CR model provides a
richer framework for thinking about distributional preferences than BO or FS.
The role of reciprocity in the CR model lacks a solid theoretical foundation – the weight on
another player’s payoff is reduced if they have “misbehaved,” a vague term at best. We view
this as a useful simplification. While other theories of reciprocity are undoubtedly more elegant,
we are primarily interested in models of reciprocity as a tool for interpreting experimental data.28
Misbehavior is a little like pornography – we can’t easily define it, but we know it when we see
it. The appendix to CR includes a more sophisticated version of the theory in which unkind
behavior is endogenously defined. This appendix is essential reading for anybody who wants to
truly understand their theory.
Many theories that model reciprocity follow Rabin’s (1993) lead in relying on the mechanics
of psychological game theory, implicitly for CR (in the appendix) and explicitly for Dufwenberg
and Kirchsteiger (2004) and Falk and Fischbacher (2006). There are good reasons for taking this
28 Along similar lines, Cox, Friedman, and Gjerstad (2007) provide a model of fairness and reciprocity that is somewhat arbitrary, but arbitrary in a useful way for understanding data. The lynchpin of Cox et al’s model is an individual’s “emotional state”. Where this emotional state comes from isn’t modeled directly, but it taps into a clear intuition that some situations will make people mad while others make them grateful.
22
approach. Good or bad behavior can often only be defined in relationship to what situation the
actors believed they faced. For instance, consider defection in a prisoner’s dilemma. This is an
unkind act if cooperation is expected by the other player, but most people would agree that
defection is perfectly reasonable if the other player is expected to defect. Beliefs must play a
critical role in any theory that attempts to capture this aspect of reciprocity.
That said, there are important aspects of reciprocity (or to be more precise, kindness) that are
not captured well in models based on psychological game theory (i.e., Rabin, 1993; Dufwenberg
and Kirchsteiger, 2004; Falk and Fischbacher, 2006). In many cases the beliefs that are relevant
are not first or second order beliefs about what the players will do, but rather beliefs about what a
“normal” person would do. If I leave a 10% tip following good service at a restaurant in the US,
I am cheap and the waiter is reasonable to be angry. In most European countries this would be
kind behavior and the waiter should probably be grateful. While models of reciprocity based on
psychological game theory implicitly recognize that norms matter, the source of norms is
generally not modeled explicitly. For example, the full model for Charness and Rabin compares
a player’s behavior with λ*, defined as “the weight they feel a decent person should put on social
welfare.” This parameter serves the purpose of a social norm and is exogenous to the model.
Hopefully future work will make more progress in making reference points like λ* endogenous.
Psychological game theoretic models of reciprocity undoubtedly provide sophisticated
theories of a complex phenomenon, but our concern here is less with elegance than with useful
tools for understanding experimental data. Theories based on psychological game theory fall
short of this goal on two counts. First, as noted in our discussion of Rabin (1993), these models
are not terribly tractable and often yield implausible equilibria. The reliance on beliefs, while
clearly an important benefit of these models, also creates problems. Distributions of outcomes
can be observed directly, but beliefs are not so easily accessible to researchers.
Charness and Dufwenberg (CD, 2006) provide a useful demonstration both of the importance
of beliefs and how an experimental design can directly capture the interaction between beliefs
and other-regarding behavior. They study a version of the trust game in which the second player
(as a treatment variable) can send a pre-play message to the first player. This gives the second
player the opportunity to make non-binding promises about how much they will return (“Roll” in
the version of the game studied by CD). In keeping with many previous results in the
experimental literature, CD find that cooperation increases with pre-play communication. The
23
novel part of the paper is its focus on beliefs. CD develop a theory of guilt aversion, positing
that players don’t like to harm others relative to their beliefs. In terms of the trust game, the
second player experiences disutility if he does not return money and believes that the first player
expected money to be returned. Promises serve as a form of pre-commitment in this framework.
If a second player believes his promise affects the expectations of the first player, he experiences
greater disutility from failing to return money. Thus, the theory predicts not just an effect of
promises on actions but also an effect on beliefs. CD test this prediction by using an incentivized
mechanism to gather beliefs and second order beliefs. Following promises, beliefs shift in the
predicted direction. This is not direct evidence that the shift in beliefs is causing the shift in
behavior, an issue which has been studied extensively in the subsequent literature, but is
certainly consistent with the theory.29 For our purposes, we are more interested in CD’s
methods than the theory of guilt aversion. CD provide an important guidepost for how
experimenters interested in other-regarding behavior can directly address the issue of beliefs.
E. Other-Regarding Behavior and Utility Maximization
Much of the existing literature on other-regarding behavior revolves around attempts to
identify the preferences underlying seemingly anomalous behavior. As such, it can be
characterized as neo-classical economics flavored with a dash of psychology. Subjects are
presumed to be maximizing a stable utility function, with the theory departing from standard
microeconomics only through the arguments in the utility function. Even theories which have
roots in psychological game theory (e.g., CR, 2002) rely on subjects maximizing utility subject
to stable preferences. The work described in this section directly addresses the question of
whether or not other-regarding behavior is consistent with rational choice theory as understood
by economists.
Andreoni and Miller (2002; AM) address this question in the most direct possible fashion
and provide a strong affirmative answer. Subjects made decisions in a series of modified dictator
games. Both the available budget and the relative price of giving were varied across games. In
other words, subjects were asked to choose between payoffs for themselves and payoffs for
another anonymous subject under a variety of budget constraints. Rather than testing any
particular theory of other-regarding preferences, AM focus on whether choices are consistent
29 See Vanberg (2008), Ellingsen, Johannesson, Tjøtta, and Torsvik (2010) and Reuben, Sapienza, and Zingales (2009). There also exists an extensive literature on lie aversion, which we view as lying (pun intended) outside the jurisdiction of this survey. Interested readers are directed to Gneezy (2005) as the seminal work on this topic.
24
with the generalized axiom of revealed preference.30 They find that a remarkable 90% of the
subjects have no violations of GARP (with at least eight choices per subject), implying that most
subjects’ choices are consistent with maximization of a quasi-concave utility function. The 23%
of subjects who never gave away any money trivially have no violations of GARP, but most of
the subjects who gave money away also make choices that are compatible with a rational choice
model in terms of satisfying GARP. AM note that there is a great deal of heterogeneity among
subjects – beyond the large number of subjects (47%) whose behavior is most consistent with
selfish behavior, there were sizable numbers of subjects whose choices are most consistent with
Leontief preferences (30%), splitting the money equally between themselves and the other
player, or treating own and others’ payoffs as perfect substitutes (22%) by giving all the money
to the player with the highest payoff.31 This heterogeneity needs to be taken into account when
looking at other-regarding behavior. Finally, AM present evidence that behavior reported in
other other-regarding experiments could have been (approximately) generated by the distribution
of preferences they report. They argue that this is evidence that preferences are robust over a
variety of settings.
Fisman, Kariv, and Markovits (2007; FKM) provide a more powerful test of GARP as
subjects are asked to make fifty decisions rather than the eight used in most of AM’s sessions.
Looking at decisions in two person modified dictator games of the sort AM employ, varying the
budget and price of giving, the proportion of subjects whose decisions are completely consistent
with GARP falls to 11%. This decline relative to AM’s data is to be expected given the
substantial increase in the number of decisions. However, FKM conclude that violations of
rationality are generally small as 86% of subjects have CCEI scores, which measure how much a
subject’s budget constraint would need to be perturbed to make their choices consistent with
GARP (Afriat, 1972), of .8 or greater.32 FKM also expand AM’s analysis of individual utility
functions by studying three person dictator games, so that they can address broader classes of
30 A is directly revealed preferred to B if A is chosen when B was an available choice. A is indirectly revealed preferred to B if there is a chain of directly revealed preference running from A to B (e.g. A is directly revealed preferred to C is directly revealed preferred to B). GARP states that if A is indirectly revealed preferred to B then B cannot be strictly directly revealed preferred to A. 31 Andreoni and Miller classify 43% of their subjects as “strong” types who always choose in the way specified. The remaining 57% of subjects are classified as “weak” types. They are classified into types by determining the shortest distance of their choices from those of each strong type. 32 The scale runs from 0 to 1 with numbers closer to 1 indicating choices that are more consistent with GARP.
25
other-regarding preferences. While they continue to find evidence in favor of social welfare
preferences, their primary conclusion is that preferences are quite heterogeneous.33
The results of AM and FKM make a good case for other-regarding choices being
consistent with maximization of a well-behaved utility function. Both show that preferences are
reasonably consistent with standard theory in stable environments in that other-regarding
behavior is price sensitive in the usual ways. Further, there is a good deal of heterogeneity in the
preferences with large numbers of subjects having standard selfish preferences and others having
other-regarding preferences. Both studies rely on environments that, other than changing prices
and budgets, are stable. This misses some of the key problems already identified in terms of
standard utility functions: Altering seemingly irrelevant features of the decision making
environment which often change choices (see III.F above) or when the situation is sufficiently
non-trivial that learning is involved (see CS, 2002, in III.I above).
F. Learning
The literature on other-regarding preferences largely takes as given that the observed
differences from classical game theory result from non-standard preferences, with the debate
centered around what form these preferences take. The results of AM and FKM provide support
for this approach. However, models of bounded rationality and learning can provide an
alternative explanation for at least some of the anomalous behavior relative to standard (selfish)
preferences while still maintaining the standard selfish preference model. Although it seems
unlikely that models of bounded rationality and learning can entirely explain the wide variety of
other-regarding behavior observed in the laboratory, these models provide a good explanation for
a considerable number of outcomes at odds with the standard selfish preference model.
Bounded rationality and learning first entered the other-regarding behavior literature in a
pair of articles, Roth and Erev (1995; RE) and Gale, Binmore, and Samuelson (1995; GBS).
Although the models used in these papers differ, the main point is roughly the same: Suppose
players in the ultimatum game have completely standard selfish preferences but are adaptive
learners. Rather than maximizing payoffs, players have an initial distribution over their available
strategies (with the source of this initial distribution not explained). Over time, strategies that
earn higher payoffs are played with greater frequency. Play in a learning model of this sort does
33 In the three player case the proportion of subjects whose behavior is completely consistent with GARP rises to 25%. Only 12% have CCEI scores below .8.
26
not necessarily converge to the subgame perfect equilibrium. The logic of subgame perfection
relies on players making logical inferences about play off the equilibrium path, but adaptive
learning depends solely on outcomes players actually observe. If an action is taken only rarely,
players never learn what payoffs would have resulted from this action and can therefore
persistently play a suboptimal strategy off the (Nash) equilibrium path. In both models this is
precisely the mechanism that leads to a prediction that the ultimatum game need not converge to
the subgame perfect equilibrium.
Reaching the subgame perfect equilibrium under an adaptive learning model is a two step
process: Responders must learn to stop rejecting low offers and then Proposers must learn that
low offers will be accepted and hence are highly profitable. The timing here is tricky as
Responders must stop rejecting lower offers before Proposers have stopped making them.
However, the disparity in incentives between Proposers and Responders makes this highly
unlikely. Rejecting a low offer costs a Responder little, but having a low offer rejected is quite
costly given that roughly equal splits are almost always accepted. Proposers therefore learn to
stop making low offers faster than Responders learn to accept them, so that play fails to
converge to the subgame perfect equilibrium. This contrasts with games like the best-shot and
the market game where strong out-of-equilibrium incentives push the learning process toward the
subgame perfect equilibrium (which has highly asymmetric payoffs in both cases) matching the
strong convergence actually observed in these games.34
Experimenters responded to these two learning papers by largely ignoring them. This
was in part due to holes in the theory. Both RE and GBS make the point that behavior in the
ultimatum game can be explained without resorting to other-regarding preferences. This is not
quite the same thing as showing that other-regarding preferences are not playing a role, and
indeed it seems unlikely that other-regarding preferences don’t matter. Both theories are also
incomplete since behavior depends critically on initial propensities which are determined
exogenously. A clever experimental design by Abbink, Bolton, Sadrieh, and Tang (2001)
reveals serious flaws with this approach. They consider mini-ultimatum games where the payoff
to the proposer following rejection of an uneven split is a random variable. The value of this
variable is drawn at the beginning of each session and remains fixed throughout the session. The
34 The best shot game was introduced by (Harrison and Hirshleifer, 1989) and the market game is due to Prasnikar and Roth (1992). Prasnikar and Roth point out that the differing results for the ultimatum, best-shot, and market games can be attributed to differing out-of-equilibrium incentives. Roth and Erev formalize this insight.
27
proposers’ payoff following rejection is shown to responders but not proposers who only know
the distribution of values. Responders’ behavior varies with the realization of the proposer’s
punishment payoff, an effect which the learning models cannot predict. The learning models do
a poor job of tracking the data if propensities are forced to be identical across treatments (and
don’t do so wonderfully even when these are allowed to vary). Abbink et al make it clear that
adaptive learning cannot provide the entire explanation for other-regarding behavior.
Another serious problem was a lack of supporting experimental evidence. The theories
proposed by RE and GBS assume Proposers and Responders learn in an identical fashion.
Learning by Responders is predicted to be slower than Proposers’ learning, but this is solely due
to lower incentives to learn rather than any inherent difference between the two. Both models
therefore predict that Responders’ behavior should change with experience, albeit slowly. This
critical prediction is difficult to test given the small changes predicted and the limited number of
plays of the game in most experiments, so that power becomes a serious problem. The result is
that most studies show some learning on the part of Proposers, but changes in the behavior of
Responders is generally too small to be statistically significant (see Slonim and Roth, 1998, for
example).
However, two papers that are specifically designed to provide more powerful tests of
Responder learning find evidence for it.35 List and Cherry (2000; LC) run a variant of the SR’s
high-stakes experiment where Proposers earn the right to propose rather than having it
determined exogenously. This results in substantially more low offers than is typical – 28% of
offers are less than a quarter of the pie. With an enlarged sample of low offers, LC find that
(controlling for the size of offers) rejection rates fall with experience. Although this effect is in
line with the predictions of the RE and GBS model, it does not represent unqualified support for
these models since most of the decline observed in LC occurs in the last few periods, which is
more consistent with a reputation model than an adaptive learning model.
35 See also Armantier (2006) and Andreoni and Blanchard (2006). Armantier primarily focuses on the interaction between the initial distribution of wealth and fairness, but also fits a reinforcement learning model to his data. This fitting exercise provides evidence for learning by Responders. Andreoni and Blanchard compare behavior in standard ultimatum games with games using tournament payoffs where fairness should play little role. In the latter case, responder behavior converges towards the subgame perfect equilibrium, but quite slowly. This suggests important roles for bounded rationality and learning in the behavior of responders.
28
Cooper, Feltovich, Roth, and Zwick (2003; CFRZ) manipulate the experience received by
Responders by doubling the number of Proposers relative to Responders.36 Since Responders
are playing twice as often as Proposers, this tends to equalize the speed of learning between
Proposers and Responders. In the standard setup, relatively fast learning by Proposers drives the
predictions of RE and GBS that low offers will continue to be rejected with experience. This
prediction should be weakened in the 2 x 1 treatment. Indeed, CFRZ find that rejection rates are
lower in the 2 x 1 treatment than in controls which have an even number of Proposers and
Responders. They also find that a history of receiving low offers makes subjects more likely to
accept low offers, and that the treatment effect does not widen over time, consistent with
learning slowing over time. Although these results are consistent with adaptive learning, the
evidence is indirect as the treatment effect cannot be observed with the naked eye and the
magnitude of the estimated effects is moderate.
To directly test the prediction that rejection rates fall with experience in the ultimatum
game, Cooper and Dutcher (2011; CD) pool data gathered in seven different experiments.37
Their criteria for choosing studies for this meta-analysis was as follows: data had to be from
“standard” ultimatum games (i.e. played with direct response rather than the strategy method,
random re-matching between rounds, random selection into roles, endowments are provided
exogenously, Proposers and Responders play with equal frequency) and subjects had to play at
least ten rounds.
The main result of this meta-study can be seen in Figure 6. The x-axis gives the
proportion of the pie offered to the Responder and the bars show acceptance rates. The labels at
the top of the bars show the frequency of each offer category. Since only three of the six datasets
have more than ten rounds, this figure compares data from Rounds 1 – 5 with data from Rounds
6 – 10. The overall pattern is clear. The acceptance rate rises with experience for relatively
large offers, but falls for small offers (20% of the pie or less).
[Insert Figure 6]
The magnitude of these changes is small, but the advantage of doing a meta-study is that
the large data set provides the necessary power to detect small changes. CD run appropriate
36 The experiments are designed so subjects cannot distinguish whether they are in a standard session where the number of Proposers and Responders are even or in a treatment session where the number of Proposers is doubled. 37 Data were provided from Roth et al. (1991), SR (1998), Duffy and Feltovich (1999), Anderson, Rodgers, and Rodriguez (2000), CFRZ (2003), Andreoni, Castillo, and Petrie (2009), and Fischbacher, Fong, and Fehr (2009).
29
regressions using the entire dataset, controlling for session and individual effects, and confirm
that the changes in acceptance rates with experience, increasing for relatively large offers and
decreasing for small offers, are significant at the 1% level. The regressions also indicate that
there is no learning beyond the first ten periods, consistent with the learning models’ prediction
that learning should slow down with experience.
CD establishes beyond a reasonable doubt that Responder behavior in the ultimatum
game changes with experience. The aggregate effect is small, but that is predicted: What is not
consistent with the learning models of RE and GBS is the reduced acceptance rates for the very
lowest offers shown in Figure 6. This suggests that the adjustments observed in behavior over
time reflect something beyond simply learning to follow the money-maximizing strategy of
accepting all offers. CD note that this pattern is consistent with learning in a model that extends
Charness-Rabin’s framework by explicitly allowing Responders’ perceptions of kindness to
depend on their belief about the distribution of offers. As Responders learn about the
distribution of offers, their beliefs and hence their actions should change. CD present evidence
based on individual subject data that is consistent with such a model.38 That is, while learning is
subtle at the aggregate level, it is quite powerful at the individual level. If subjects need to learn
a norm about what is an acceptable offer and are on average correctly calibrated to begin with,
this is precisely the pattern that should be observed.
While observed changes in behavior are small for Responders in the ultimatum game,
changes in behavior can be quite large in other, related, situations. For example, Cooper and
Stockman (2002; CS) study a three player sequential step-level public goods game. Players take
turns deciding to contribute or not contribute to a public good. The good is provided if two or
more players decide to contribute. Critically, costs of contribution are sunk and rising in the
order of play. For all treatments the value of the public good is 18 tokens if provided. The cost
of contributing for each of the three players is 3/6/9, 1/3/9, and 1/3/16, respectively, across their
three treatments. CS focus on the behavior of “critical” third players, players whose decisions
determine whether or not the public good will be provided. Similar to Responders in the
ultimatum game, critical third players face no strategic uncertainty. As in the ultimatum game,
there is a tension between payoff maximization and fairness – critical third players always make
38 There is a strong negative relationship between the lagged offer and the likelihood that the current offer will be accepted. This is consistent with subjects lowering their expectations about the distribution of offers after receiving a low offer.
30
the most by contributing but always make less than the other two players if they contribute. For
all treatments CS find that contribution rates change significantly for critical third players with
experience. The surprise is that with the most uneven payoffs, as in the 1/3/16 treatment,
contributions rates for critical third players fall sharply with experience (see Figure 7). This
indicates that there is a significant dynamic to be explained and that the explanation cannot rely
purely on adaptive learning, but may instead involve a combination of adaptive learning and
other-regarding preferences. CS show that a hybrid model combining adaptive learning and
other-regarding preference can rationalize their result. The dynamics observed in CD, growing
acceptance of moderately uneven offers along with growing rejections of the most uneven offers,
are also consistent with this hybrid model.
[Figure 7]
Summary: Pure adaptive learning models can predict the main features of behavior in the
ultimatum game (as well as more subtle ones such as the differing speeds of learning for
Proposers and Responders). However, these models alone cannot provide a complete explanation
of other-regarding behavior. By design, learning models provide no explanation for initial
behavior and, as should be clear from the results of CD and CS, the observed dynamics are not
consistent with a model of adaptive learning with standard, strictly own income maximizing,
individuals. Nonetheless, learning models (adaptive and otherwise) remain an important topic in
the study of other-regarding behavior for two reasons. Even though the observed changes in
behavior can be quite small on aggregate, individual level data shows strong evidence of
learning. Notions of other-regarding behavior that treat preferences as fixed and immutable miss
an important feature of other-regarding behavior. There is a need to develop models that can
explain the changing nature of other-regarding behavior, not just to understand why behavior
changes but also because these changes tell us something about the nature of other-regarding
preferences. Observed changes in other-regarding behavior vary both in magnitude (compare the
dynamics in the ultimatum game with those observed by CS) and direction (toward the money
maximizing choice in some cases, away in others). A satisfactory model will need to encompass
this diversity of results. Promising candidates for such a model include hybrid models like the
one proposed by CS and models of social norm formation where changes of behavior are driven
31
by changes in beliefs about what constitutes misbehavior. There is currently a lack of evidence
distinguishing between these models.39
III. Other-Regarding Behavior, Applications and Regularities
A. The Investment/Trust Game
The investment (or trust) game introduced in Berg, Dickhaut, and McCabe (1995; BDM),
is a sequential move game in which two players are given equal endowments. Player 1 moves
first, with the opportunity to send money to player 2. The amount of money sent to player 2 is
typically tripled, after which player 2 has an opportunity to send money back to player 1, after
which the game ends. With standard selfish preferences, player 1 should anticipate player 2 not
returning any money, and therefore not send any money. Experiments show player 1s sending
positive amounts, with positive amounts returned, although typically (i) there is considerable
variability across subjects in the amount of money sent and returned, and (ii) the average amount
retuned is somewhat less than the amount of money sent.40 The trust game has played an
important role in the literature on other-regarding behavior both because it is a prominent
example of other-regarding behavior where reciprocity plays a central role and because it
provides a simple measure of trusting and trustworthy behavior.
Cox (2004) conducts an experiment to begin to determine the other-regarding preference
factors underlying the trust game. Using a between groups design he conducts a standard trust
game (the control treatment) as well as two variants of a dictator game. The first dictator game
differs from the trust game in that player 2 has no decision to make as they have no opportunity
to return any money. In the second dictator game, player 1s do not make any choices. Rather
they are given endowments equal to the amount of money kept in the control treatment with
player 2s given endowments equal to the amount of money received in the control treatment.41
39 There is also some evidence that other-regarding behavior changes over even longer time frames and with age. For example, Fehr, Rützler, and Sutter (2011) conduct a field study of other-regarding preferences in children aged 8 – 17. They find that preferences change as children grow older, with spitefulness fading and altruism gaining in strength. Brosig, Riechmann, and Weimann (2007) study behavior in ultimatum and dictator games over a three month period, finding that behavior tends to more closely conform to the standard, strictly own income maximizing preferences on repeated exposure to the same games. 40 In BDM the average amount of money player 1s sent was $5.16, with the average returned equal to $4.66. This game is also sometimes referred to as the moonlighting game. 41 To be precise, each pair in the second dictator game is matched with a pair in the control treatment. The endowments in the second dictator game match the amounts kept and received by the corresponding pair in the control treatment.
32
After being told the additional dollars they have relative to player 1s, 2s have an opportunity to
send money back to player 1s.
Any money sent in the first dictator game represents altruistic other-regarding
preferences (or a taste for efficiency as the money is tripled) as distinguished from possible trust
and anticipation of positive reciprocity. In turn, any money “returned” in the second dictator
game represents other-regarding preferences resulting either from difference aversion, or
maximin preferences, as opposed to the investment game where any money returned represents
reciprocity in conjunction with these other factors. As expected, the average amount of money
sent in the control treatment ($5.97) is greater than in the first dictator game ($3.63; Treatments
A and B in Figure 8). This difference, approximately 40% more money sent in the trust game
than the first dictator game, can be attributed to trust and anticipated positive reciprocity as
opposed to altruism or a taste for efficiency. The amount of money returned in the second
dictator game averaged $2.06 compared to $4.94 in the control treatment so that approximately
58% of the money returned in the investment game can be attributed to positive reciprocity.
[Insert Figure 8]
Thus, while trust and positive reciprocity play a role in the trust game, other forces are at
work so that behavior in the trust game should be regarded as an imperfect measure of trust and
trustworthiness. Consider the results of Glaeser et al (2000). They compare data from a one-
shot trust game with results from surveys measuring subjects’ attitudes towards trust as well as
their past trusting and trustworthy behavior. Glaeser et al report a positive but far from perfect
correlation between behavior between the experiment and survey results.42 They interpret their
results as illustrating the strengths and weaknesses of surveys. But a better explanation might be
that there is measurement error with respect to trust and trustworthiness in both the survey
instrument and the trust game. The positive correlation reflects a common unobserved behavioral
trait that presumably coincides with trust (or trustworthiness), but the experimental data also
reflect other behavioral traits such as outcome based preferences. This suggests that a
combination of surveys and experiments will be a better predictor of behavior in field settings
than either instrument in isolation.
42Interestingly, senders’ behavior is better predicted by the survey about past behavior while receivers’ behavior correlates well with components of the attitudinal surveys related to trust (rather than trustworthiness).
33
An interesting feature of the investment game data is that player 2s typically return less
money than what player 1s send (before any multiplication takes place), so that sending money is
typically not profit maximizing.43 This raises the interesting question of whether or not the
amount of money sent would deteriorate over time in an experiment with repeated trials and
random rematching of players.
B. Results from Multilateral Bargaining Experiments44
Multilateral bargaining experiments provide an interesting window into other-regarding
behavior, both by giving new insight into the nature of the other-regarding preferences and by
providing an important application of the theory. In multilateral bargaining games a set of n
players must decide on an allocation of a sum of money k through a voting mechanism. In the
simplest set-up, all players make proposed allocations, one of which is selected at random to be
voted on under majority rule with no opportunity to amend proposals.45 Consider an infinite
horizon version of the game so that if a proposal is rejected new proposals are solicited and the
process repeats itself until an allocation has been made. The money, k, is reduced to δk
following each round in which a proposal is rejected, 0 < δ ≤ 1. As with bilateral bargaining
games any proposal that is accepted constitutes a Nash equilibrium. Similar to subgame
perfection, the preferred equilibrium refinement is that of a stationary subgame perfect
equilibrium (SSPE) which, roughly speaking, is a subgame perfect equilibrium in which the
history of past choices plays no role in proposals or in voting (Baron and Ferejohn , 1989).
A shrinking pie (δ < 1) is not necessary to obtain an equilibrium in these games. A core
element of the SSPE is formation of a minimum winning coalition (MWC) in which the Proposer
gives payoffs to just enough players to secure passage of a proposal, and zero to everyone else.
The threat of being left out of the money in case of rejection induces players in the MWC to vote
in favor of the proposal provided they have been given a sufficiently high payoff. Thus, with δ =
1, there are no efficiency issues at stake in accepting or rejecting offers, and the frequency of
MWCs and/or the sensitivity of players to other players getting zero payoffs provide insight into
maximin preferences in a bargaining environment.
43 For example, Glaeser et. al report that about 91 cents is returned for every dollar sent. 44 These experiments are discussed from the perspective of their implications for legislative bargaining models in Palfrey, 201x; Chapter xx) along with a somewhat different perspective on the role of risk on the experimental outcomes. 45 This model was originally developed, and has been used extensively, to provide a game theoretic framework for legislative bargaining (see Palfrey, Chapter xx, for a review of legislative bargaining games).
34
Several experiments of this sort have been conducted. Frechette, Kagel and Morelli
(2005a; FKM) ran five player games where each player had equal voting weight. MWCs were
formed 77% of the time for inexperienced subjects, and 94% of the time for experienced
subjects.46 In equivalent three player games, MWCs averaged 69% of all proposals with this
number increasing to 85% for experienced subjects (FKM, 2005b). There were very few
perfectly egalitarian proposals in these games, averaging well below 10%. Further, random effect
probits consistently show own payoffs to be the key factor determining whether or not to vote for
a proposal, with dummy variables accounting for the number of players getting zero shares not
achieving statistical significance in both experiments. If maximin preferences play an important
role in subjects’ decisions, one would expect some sensitivity to the plight of players receiving a
zero allocation.
However, as is often the case, these results are not conclusive in knocking out maximin
preferences. The problem is that given the systematic growth of MWCs one cannot distinguish
between learning the benefits of MWCs from responding to the “selfishness” involved in other
players forming MWCs (or anticipating other players’ selfishness). That is, the data can
potentially be accounted for by a selfish core of players in conjunction with a group of
conditional reciprocators. It would be helpful to distinguish between these two alternatives.
FKM (2012) study a five player linear public goods game in which the allocation of
funds to the public and private goods is decided by majority voting (as opposed to the usual
voluntary contribution mechanism). Payoffs are a linear function of the amount of the budget
allocated to public goods and to a player’s own share of the goods, with players having
homogenous preferences for public versus private goods. Treatment conditions included a
variety of weights attached to public versus private goods, which had the effect of varying the
marginal return to the public good, with the treatment of primary interest for present purposes
being one in which the theory predicts an all private good allocation within a MWC. The
predicted allocation in this treatment not only gave zero payoff to two of the five players, but
46 In these, and the other experiments reported here, there were several groups bargaining at the same time, with subjects randomly allocated to a new group following each bargaining round with 10 or 12 rounds per session, with one round per session selected at random to determine payoffs. Data reported are for all proposals – passed or otherwise. Probits looking at voting exclude the votes of Proposer of a given allocation.
35
was less efficient than the perfectly egalitarian all public good allocation in terms of the total
money payout to subjects ($37.50 versus $43.75).47
Thus, in this case both maximin preferences and efficiency considerations favor the all
public good allocation. However, the data show little concern for either as all public good
allocations account for only 3% of all proposals, versus 65% of all proposals involving MWCs.48
The incentives for MWCs are clear enough in this case as Proposers averaged $15.64 for
allocations that passed, with coalition partners averaging $10.93, a little over $2 more than with
an all public good allocation. Both CR and ES recognize tradeoffs between social welfare
preferences and own payoffs, so that the one can rationalize the high frequency of equilibrium
type offers in this experiment on the basis of the higher own payoffs achieved with equilibrium
type offers. However, the key point is that the efficient all public good allocation (which is also
a maximin allocation) had very little drawing power at any point in these sessions, suggesting
little weight placed on social welfare preferences.
There is clear evidence that differences in payoffs matter within MWCs in these
experiments as the SSPE allocation typically calls for a much more uneven distribution of
payoffs within the MWC, a distribution that is hardly ever offered and which voting regressions
indicate would have virtually no chance of passing. In this respect it’s worth noting that probit
estimates of Responders’ average indifference point for the share required to accept or reject a
given allocation is close to what the SSPE predicts, but the dispersion in voters’ preferences
makes it almost certain that these allocations will not get passed. Intuitively, one might guess
that the FS or BO models might be able to capture this aversion to strong payoff differences
within MWCs. However, Montero (2007) shows that if players have FS type preferences,
Responders should be willing to accept smaller shares than predicted under the SSPE.49 As such
47 The amount of money available to be distributed shrinks by 20% in these games if proposals are rejected. 48 Some fraction of these MWC allocations included a small public good allocation (averaging less than 5% over all equilibrium type offers). The bulk of the remaining offers involved some private goods allocated to all players. Forty percent of these cases involved token allocations to two players (allocations that summed to less than 10% of the pie), constituting near MWC type allocations, versus 20% fully egalitarian private allocations which, in this case, were dominated by an all public good allocation (suggesting small mistakes for some players). 49 As an extreme example, assume that disutility is only experienced from disadvantageous inequality and there is no discounting. Consider the position of Responder j who is a member of a MWC in a game with five players where all others are following the SSPE. Rejecting a proposal, j gains very little as there is a 40% chance that the outcome is unchanged (j is again a member of the MWC), a 20% chance that disadvantageous inequality is lowered (as j become the Proposer and gets more money), and a 40% chance that the disadvantageous inequality becomes far worse (as j is left out of the winning coalition and gets nothing). The latter makes the Responder strictly prefer voting in favor of the offer since the expected loss in income is greater than the expected gain from being the
36
the failure of allocations to approach anything close to the SSPE allocation, or below it, should
be counted as further evidence that more is going on in games of this sort than we currently
understand.
C. A Second Look at Dictator Games
The dictator game was originally designed to distinguish whether the near equal shares
Proposers offer in the ultimatum game are a result of Proposers “trying to be fair” to Responders
or a strategic response to anticipated rejections of low offers. In this respect the dictator game
was quite successful with the strong reduction in offers to Player 2 clearly indicating that
anticipation of rejection of low offers was a significant factor behind the near equal splits typical
of the ultimatum game. It has, however, become a very popular tool for trying to distinguish
between various theories of other-regarding preferences. Dictator games have been used to
calibrate the Fehr-Schmidt utility function by pinning down the relative weights put on
advantageous versus disadvantageous inequality (FS, 1999; Blanco, Engelmann, and Normann,
2011), assuming (or in the case of Blanco et al, testing) that these estimates extrapolate directly
to other, more complicated environments. Choices in dictator type games provide some of the
strongest experimental evidence for social welfare preferences, as well as preferences for
efficiency (CR, 2002; ES, 2004, 2006).
While the dictator game was well suited for its original purpose, it is unclear how much
can be learned from experiments designed to precisely identify the form of outcome based
preferences. Dictator games are an attractive tool for this task because of their simplicity and
because neither reciprocity nor strategic uncertainty play a role in decision making. Given
evidence cited elsewhere in this chapter that reciprocity and intentionality tend to be stronger
forces than purely outcome based preferences, an environment where these factors play little role
(like the dictator game) is needed to get directly at these preferences. Unfortunately, a number of
experiments have raised concerns regarding the robustness of dictator game results.
Oberholzer-Gee and Eichenberger (2008; OGE) test the robustness of behavior in dictator
games by offering dictators the choice to play an unattractive lottery with negative expected
value. Using a between groups design, there are three treatments: (i) a standard dictator game
with an endowment of 7 Swiss francs (about $5), (ii) a lottery only treatment where subjects
Responder and yields more extreme disutility from disadvantageous income inequality than voting in favor of the proposal.
37
could use the 7 Swiss franc endowment to purchase a lottery ticket with negative expected
value50, and (iii) an expanded dictator game in which dictators could either invest their
endowment in the lottery or play the dictator game. Table 1 reports their results. In the standard
dictator game median transfers are 41% of the endowment. With the lottery present the median
transfer drops to zero, with the percentage of dictators keeping the entire cash endowment more
than doubling and 50% of them playing the lottery rather than transfer any money. The latter
contrasts strongly with the lottery only treatment where 26% of the subjects chose to play the
lottery. OGE obtain similar results using University of Pennsylvania students, a $10 cash
endowment, and with dictators able to invest only part of their endowment in the lottery. OGE
conclude that the introduction of the lottery produces a powerful framing effect that is not
explained by any extant principles. More broadly they conclude that their results imply that
“…it is problematic to use the transfers observed in the context of the standard (dictator) game to
make general statements about individuals’ “taste for fairness.”
[Insert Table 1]
List (2007) and Bardsley (2008) present very similar extensions of the dictator game,
allowing dictators to take money from receivers. For individuals who give a positive amount of
money in a standard dictator game, the possibility of taking money should not affect their
optimal allocation of money between themselves and the receiver.51 In fact, giving is reduced by
the possibility of taking. This effect is particularly striking in List’s data. In his control
treatment, a standard dictator game with $5 to allocate, 71% of dictators give a positive amount.
When the game is extended to allow for taking up to $5, only 10% of dictators give a positive
amount, with a mass point at $0 giving or taking and another one at taking $5.00. In contrast,
when subjects earn their initial endowments, under the $5 taking treatment, the overwhelming
number of subjects neither gives nor takes. The sensitivity of giving in dictator games to the
possibility of taking alters the interpretation of giving for standard dictator games since (i) giving
could reflect experimenter demand induced effects, with subjects responding to context specific
social norms not to be too selfish or (ii) sensitivity of decisions to an option’s location in the
50 Two different lottery treatments were employed (1) a 50-50 chance of 10 Swiss francs or 0 and (2) a 50-50 chance of 7 Swiss francs or 0. We have pooled the data and averaged across the two lotteries as the results are very similar. 51 With well-behaved preferences over own and others’ payoffs, allowing dictators to take should only affect subjects who are in a corner solution (giving zero) in the standard dictator game.
38
choice set. As Bardsley (2008) notes, interpretation (i) better accommodates the experimental
data and can account for the apparent external invalidity of the dictator game.
The results of OGE and Bardsley and List suggest that dictator game experiments can be
prone to demand induced effects. Even more damaging are experiments indicating that dictator
games do not get at outcome based preferences in isolation. Dana, Cain and Dawes (2006;
DCD) report an experiment in which dictators choose a dominated alternative rather than decide
how much to allocate to the second player. Their control treatment was a standard dictator game
with a $10 stake. They first compare this with a treatment in which, after determining how much
to allocate, dictators have the option to take $9 and not play the game. If the dictator chose to
make an allocation, the amount of money allocated along with the instructions for the game
would be transferred to the second player, even if the dictator gave nothing. After making their
allocation but before the money was transferred, dictators were given the opportunity to opt out
of the game and receive $9 with the designated second player never even learning anything about
the game.52 Twenty eight percent (11 out of 40) dictators chose the exit option, including two
who had intended to keep the $10. DCD argue that their results support the idea that some
people give money in the dictator game because they are concerned with appearing to be fair to
recipients, a kind of audience effect.53
DCD conduct a second treatment designed to rule out a number of alternative
explanations for choosing the dominated alternative. The most compelling, in our opinion, are
experimenter demand effects: subjects may choose the dominated alternative solely because it
was offered (and the experiment must therefore want it to be chosen) or because the dictators
wish to appear fair to the experimenter. In the new treatment, when a positive amount of money
is allocated, the money was transferred without the receiver knowing where it came from (or any
of the dictator’s instructions). Since the receiver’s knowledge is not a factor in this treatment
(and dictators know this), choosing the $9 instead of making an allocation cannot be because of
concerns about what receivers think. DCD compared this “private” treatment with a replication
of the exit treatment described above. They argue there should be significantly fewer exits in the
private treatment than in the original exit treatment, since dictators know there will be no
52 This was possible since the experiment was conducted as part of a larger classroom exercise with a number of other activities. 53 Similar results are reported by Lazear, Malmendier, and Weber (2012). Lazear et al are more concerned with the sorting this causes rather than individuals’ willingness to avoid playing a dictator game per se.
39
information provided to Responders.54 The results support their hypothesis as only 4% (1/24) of
dictators chose to exit in the private treatment compared to 43% (9/21) in the replication of the
original exit treatment (p < 0.01). Some giving still occurred in the private treatment, but less on
average than in the exit treatment.55
Similar concerns are raised by Dana, Weber and Kuang (2006; DWK). Consider the two
step binary dictator game shown in Figure 9. In Stage 1, subjects see the box shown on top. This
displays the dictator’s payoffs for options A or B, $6 and $5 respectively, but has a question
mark associated with Y’s payoffs. The dictator can proceed with his choices at this point, or can
click the “reveal” box, in which case they would get to see the full information regarding Y’s
payoffs – either box 1 or box 2 – before making their choice. Dictators are told that whether
payoffs are determined by box 1 or 2 was decided on the basis of a coin flip prior to the session
and that their decision to click the reveal button or not will not be revealed to Y. DWK compare
this treatment with a control treatment in which dictators choose between options A and B in box
1 – with the payoffs fully revealed. In the control treatment 14 of 19 dictators (74%) chose
option B, the ($5, $5) option. In the game where dictators do not know Y’s payoffs, but can
obtain the relevant information with a simple click of the mouse, 14 of 32 dictators (44%) chose
not to obtain information regarding Y’s payoffs. Of these, 12 of 14 (86%) chose option A with
its higher own payoff. Overall, only 15 of 32 dictators (47%) chose to reveal the true state and
chose the other-regarding outcome (option B), significantly less then under the control
treatment.56 As with DCD, the results of DWK are consistent with the idea that subjects are
more concerned with appearing to be fair (to themselves or others) than actually achieving a
more equitable split.
[Insert Figure 9]
54 To the extent that demand induced effects are present, they are present in both cases. 55 Cherry, Frykblom, and Shogren (2002; CFS) look at a two stage game in which subjects first earned either $40 or $10 as a function of their performance on a quiz. This money was then used as the stakes to be divided in a dictator game. CFS compared the earned income condition to control sessions in which dictators were arbitrarily provided $40 or $10. They found that subjects who “earned” the money were much less generous than in the control treatment. This difference is especially striking in the low stakes treatment, since the $10 stake was earned through poor performance! CFS’s results cannot be squared with an explanation of dictator game behavior that relies solely on outcome based preferences. Tadelis (2007) argues that “shame” rather than “guilt” drives the results reported in dictator games, constructing a model designed to distinguish between the two concepts and reporting an experiment based on the trust game to support his hypothesis. These are both nice papers that we encourage the interested reader to consult. 56 Option A in box 2 presumably dominates all other choices so that a control treatment with box 1 and 2 both fully revealed would not serve their purposes.
40
This idea is formalized by Andreoni and Bernheim (2009; AB). They start by noting the
surprising popularity of 50-50 splits in the dictator game (about 20% of choices in Forsythe et al,
1994). This is difficult to rationalize with distributional models of preferences, especially given
the bimodal distribution of offers: Small gifts (20% of the pie) and the 50-50 split are far more
common than intermediate amounts. AB develop an elegant signaling model in which fair types
use the 50-50 split to separate themselves from selfish types. To test their model they conduct a
two stage dictator game with $20 to allocate. In stage one, with some probability p, nature
makes the dictator’s move, assigning a dollar amount x0 to the recipient (either $0 or $1 in their
two treatments). Otherwise, the standard dictator game is played. Only the dictator knows the
outcome of the first stage. This first stage should have no effect on play in the standard dictator
game in the second stage if subjects have purely outcome based preferences, but should lead to a
mass of donations at x0 in the signaling model. The experimental results are consistent with the
predictions of their signaling model.
It should be clear at this point that results from dictator games are sensitive to a variety of
seemingly innocuous variations. This sensitivity results from several sources. First, it is well
known that experimental subjects have a tendency to do what they “are supposed to do,” trying
to figure out what the experimenter wants and then doing it to please him or her. In other words,
experiments are prone to “demand induced effects”.57 Within the standard dictator game this
involves splitting the money up between themselves and an anonymous other within a social
context where giving nothing is generally considered to be miserly. From this perspective, what
the lottery treatment in OGE does is provide dictators with something else to do so that the desire
to take an action and the desire to be generous aren’t forced to be aligned. Beyond trying to
please the experimenter, the results of DCD, DWK, and AB make it clear that behavior in
dictator games are subject to audience effects – dictators’ choices reflect a concern with how
they appear to others as well as to themselves. What the DCD experiment does, for example, is
to allow subjects to choose a selfish option by opting out of the game entirely, thereby not having
to appear fair in the eyes the recipient or themselves. Taken together, these results indicate that
57 See, for example, Rosenthal and Rosnow (1969). Demand induced effects are an ever present danger in an experiment and can create a kind of Hawthorn effect when the demand effect is aligned with the treatment effect. Among other things, experimenters must be careful that their instructions and materials not suggest how a game ought to be played unless they have an explicit reason for doing so.
41
dictator games cannot be treated as a Petri dish where outcome based preferences can be studied
in isolation.
D. Procedural Fairness
Procedural fairness refers to the idea that individuals care as much about whether the
process that led to an outcome was fair as the fairness of the outcome itself. There has been little
experimental work devoted to procedural fairness in spite of the fact that data from natural
experiments suggests that people are more willing to accept unfair outcomes if “fair” procedures
are used to achieve these outcomes.58 One significant exception to this is Bolton, Brandts and
Ockenfels (2005; BBO). In this experiment random procedures for choosing between outcomes
are introduced into a series of mini ultimatum games. They note that unbiased random
procedures capture the “level playing field” element that appears critical to many procedures that
modern societies deem fair, and go on to explore the relevance of this insight to other-regarding
preferences.
Figure 10 shows the three games employed in experiment 1 in BBO. In the first mini
ultimatum game (Game 1) the Proposer has only two options – a (200, 1800) allocation (option
A) versus an (1800, 200) allocation (option C) where the numbers in parentheses represent the
Proposers and Responders payoffs, respectively, in Pesetas. Responders have a choice of either
accepting the proposed allocation (a) or rejecting it (r) and getting a (0, 0) payoff. In the second
mini ultimatum game (Game 2), which serves as the control treatment, the Proposer has 3
options: options A and C, the same as in Game 1 plus option B, a (1000, 1000) allocation, where
rejection of any of the proposed allocation yields (0, 0). In Game 3, option B in Game 2 is
replaced by a new option which, if accepted, offers a 50-50 chance of a (200, 1800) allocation or
an (1800, 200) allocation. Both of these last two outcomes are unfair, but which outcome occurs
is determined using a fair (random) procedure.
[Insert Figure 10]
Using the strategy method and a between groups design, the (1800, 200) option is
rejected 6% of the time in the Game 1 versus 41% of the time in Games 2and 3. The low
rejection rate in Game 1 harkens back to the idea that players do not expect Proposers to be
“saints”, acting against their own self-interest when they have no other choice (Bolton and
Zwick, 1995), while the high rejection rates for the (1800, 200) offer in the other two cases
58 See, Rotemberg (2006) for a recent survey of field data on this score.
42
reinforces the importance of menu dependence (see the previous discussion of Falk et al, 2003)
since in both cases Proposers could have chosen a more egalitarian option. The main point is
that fair procedures are a good substitute for a fair outcome, as rejection rates for the random
option in Game 3 were essentially the same as for the (1000, 1000) option in the Game 2 (1/32
versus 0 rejections in the Game 2). This is an interesting line of research that deserves more
attention.
E: Diffusion of Responsibility
The results summarized in Section IIIC suggest that other-regarding behavior is closely
tied to perceptions: individuals want to be perceived as fair or kind, both by others and by
themselves. Beyond clarifying the nature of other-regarding preferences, this insight also raises
important economic issues. A long standing question in the economics of organizations is why a
manager would want to delegate important choices to an agent. Common explanations include
superior expertise or ability by the agent as well as strategic delegation where the agent is used
as pre-commitment device.59 However, if other-regarding behavior is driven by perceptions of
fairness (or kindness) rather than fairness itself, this suggests that agency can be used to
manipulate these perceptions. Specifically, deflecting blame for unfair outcomes along with the
resulting retaliation may serve as an important motivation for the use of an agent.
For example, consider the situation of a firm in financial distress that decides to downsize
as a way of cutting costs. Management runs the risk of damaging the relationship between
employees and the firm in the process of laying off workers. Bartling and Fischbacher (2012)
note that companies in this situation often hire an outside agent to act as CRO (chief
restructuring officer). This partially reflects a desire to have an expert in charge of managing the
firm through its financial crisis, but an explicit advertised purpose of CROs is to redirect the ire
of workers towards the consultant rather than the firm.
DWK report a treatment suggesting that diffusion of responsibility could have a powerful
effect on perceptions of fairness. Their game, shown in Figure 11, features two dictators rather
than one. The dictators simultaneously choose between a fair outcome (A which yields 5 for all
players) and an asymmetric split (B in which both dictators get 6 and the receiver gets 1). The
catch is that the unfair outcome is only implemented if both dictators choose it. That is, a
59 Experimental papers focusing on strategic delegation include Schotter, Zheng, and Snyder (2000) and Fershtman and Gneezy (2001).
43
dictator’s choice of the asymmetric outcome is only implemented if the other dictator has also
chosen it. The asymmetric split is chosen by 65% of dictators in the game with two dictators
compared with 26% in control sessions with a single dictator. DWK’s interpretation of this
result is that their procedures reduce the dictators’ sense of being responsible for the asymmetric
outcome, allowing them to justify choosing the unequal but more remunerative split. 60
[Insert Fig 11 here]
In a principal-agent setting, DWK’s result implies that a principal deflects responsibility
for unpopular but profitable choices by delegating them to an agent, thereby avoiding retribution.
This explanation for use of agents relies on two elements. Principals must feel freer to pursue
unkind actions when acting through an agent, and those affected by the unkind actions must shift
their ire from the principal to his hireling. Both issues have garnered attention in the recent
experimental literature on delegation.
Hamman, Loewenstein, and Weber (HLW, 2010) address the issue of a principal being
freer to pursue an unkind action when operating through an agent. Their basic experiment
studies a modified dictator game. All of the treatments feature six dictators independently
making twelve rounds of decisions about how much of a ten dollar pie should be allocated to a
fellow subject acting as a passive recipient. Dictators make their own decisions in the baseline
treatment. In the “agents” treatment, a fixed group of three potential agents is added to
experiment. The principals must choose to use one of these three agents in each round. The
chosen agent receives a fixed payment and makes the dictator’s choice for them. The agent has
no direct financial stake in the dictator’s payoffs, although competition among agents gives them
clear incentives to do what they think the dictator would want. The “agent/choice” treatment is
identical to the “agent” treatment for the first eight rounds, followed by four rounds in which the
principal has the choice of either using an agent or making the decision themselves.
[Insert Table 2 here]
The main results of the experiment can be seen in Table 2. With experience, the amount
given to recipients is significantly lower with agents. Principals actively choose agents who will
give low amounts; the likelihood of switching agents is strongly positively correlated with how
much the agent gives to the recipient. In the agent/choice treatment, in the last four rounds only
60 Bolton and Ockenfels’ model also predicts more choice of the asymmetric split with multiple dictators. This follows from the mathematical observation that 6/13 is closer to 1/3 than 6/7 is to 1/2.
44
40% of the principals continue to use an agent. Nevertheless, the contributions continue to
decline, as principals making their own choices gave less than in the control treatment, with the
average amount given almost the same as those principals continuing to use agents. HLW
attribute this result to a selection effect of the sort identified in Lazear, Malmendier, and Weber
(2012), with subjects who are comfortable giving minimal amounts to the recipient not risking
the possibility that their agent will behave too kindly. In a follow-up treatment where agents
could “advertise” how much they intended to give recipients, principals had a strong tendency to
choose the agents who said they would give the least. In the first round two-thirds of the
principals choose the agent who announced the smallest number, and this figure never dropped
below 80% in later rounds.
A particularly striking feature of HLW comes from a follow-up survey. Subjects were
asked to rank on a Likert scale, ranging from -2 to 2, how responsible for they felt for the amount
of money the recipients received. The average response dropped from .83 in the baseline to -.09
in treatments with agents, a difference that is easily significant at the 1% level. Even though
they are doing their best to hire an agent who won’t give away much money, principals who are
delegating the decision to others perceive themselves as being largely innocent of causing the
recipients harm!
There exist multiple papers addressing whether delegation succeeds in deflecting the
consequences of unkind actions away from the principal. Bartling and Fischbacher (2012) study
this in the context of four person dictator games. One subject plays the role of principal, one
plays the role of agent, and two play the role of receiver. The core of the paper is a 2x2
experimental design, varying whether delegation by the principal and punishment by the
receivers are possible. In sessions without delegation, the principal must choose between a fair
allocation (all players get 5) and an unfair allocation (principal and agent get 9, receivers get 1) .
When delegation is possible, the principal can either make this choice himself or pass it on to the
agent. If punishment is not possible, the game ends after the principal’s or agent’s choice of an
allocation. With punishment, one of the receivers, randomly chosen, is given the option of
selecting a costly punishment. This punishment costs 1 and yields 7 units of punishment which
can be allocated among the other three players.
Without punishment, delegation leads to fewer fair outcomes: 20% of groups end up with
the fair allocation with delegation as opposed to 35% when delegation is not possible. This effect
45
largely vanishes with punishment, as delegation only lowers the proportion of fair outcomes
from 63% to 61%. The result of greatest interest can be seen in Figure 12, where the principal is
“Player A” and the agent is “Player B”. This data is taken from the treatment with delegation
and punishment, and only shows observations where the unfair outcome was chosen. Shifting
the responsibility for choosing an unfair outcome also shifts the punishment from the principal to
the agent. This effect is sufficiently strong that a principal is financially better off delegating the
decision, taking the risk that the agent will choose the fair outcome, than choosing the unfair
outcome himself. Given these incentives, it is not surprising that the frequency of delegation is
more than three times as high when punishment is possible (55% vs. 17%). Even though the
principal could have guaranteed a fair outcome by making the choice himself, the agent is held
largely responsible when delegation takes place and the unfair option is chosen. Principals have
the option to deflect the consequences of an unfair outcome away from themselves, and the
majority of principals take advantage of this.
[Insert Fig 12 here]
Coffman (2011) also studied whether it is possible to use delegation to shift perceived
responsibility for an unfair action. Delegation is even less innocent in his experiment, as
principals can restrict their agents’ actions. The game is played by four players, a principal, an
agent (intermediary), a recipient, and a punisher. In the most basic treatment, the principal can
either play a $10 dictator game with the recipient or can sell the rights to play this game to the
agent. Critically, the agent has no choice about buying the rights. The principal chooses a price
which the agent must accept. The agent is then restricted to take at least as much as he paid.
The principal can therefore force the agent to take an unfair action by asking for a high price.
The punisher observes the outcome and can then impose a punishment on the principal (but not
on the agent). The punisher can reduce the principal’s payoff to any non-negative amount and
faces no costs of punishment.
Comparing observations where the principal plays the dictator game with those where he
sells the dictator game to the agent, punishment is lower with delegation holding the principal’s
payoff (pre-punishment) fixed. This effect is significant when the principal’s payoff is $8 (out of
a possible $10) or more. The principal is being held less responsible for an unfair outcome when
he sells the game even though the outcome is (weakly) less fair and the agent is forced to choose
an unfair outcome. Coffman uses a clever follow-up treatment to show that punishment is being
46
reduced rather than diffused or shifted. In this follow-up treatment, punishers are allowed to
punish the principal and/or the agent. Even when the sample is limited to observations where the
agent keeps nothing and punishers never punish these agents, the principal is punished
significantly less when the dictator game is sold. Delegation muddies the waters sufficiently that
a punisher who knows the agent to be blameless and does not hold the agent responsible for
unfair outcomes still lessens their punishment of the principal.
To summarize, the literature on delegation and diffusion of responsibility links results
concerning the nature of other-regarding behavior that are largely psychological in nature with
an institutional question that plays an important role within a number of important economic
environments. Delegation can be used to escape the consequences of unfair (or unkind) actions.
Principals understand this and take advantage of delegation to increase their payoffs with limited
side effects.
F. Group Identity and Social Preferences
Models like those of BO, FS, and CR rely on individuals putting weight on the payoffs of
others, but spend little time worrying about where these weights come from. It is a trivial
observation that people don’t care about all others equally. If a good friend asked for $20, you
might well give them the money without even asking why they need it. If a random person on
the street asks for the same amount of money, your response is not likely to be so positive. As
such it is a natural to explore what factors organize how much we care about the payoffs of
others. The literature on social identity examines a plausible source of differing weights on the
payoffs of others.
The roots of work on social identity stretch back to work by psychologists Tajfel and
Turner (1979) and was introduced into the economics literature by Akerlof and Kranton (2000).
The basic idea is that people identify as members of various categories (i.e. Jewish, men,
economists). Utility is determined in part by how much a person’s actions conform to norms for
that category. In terms of other-regarding behavior this could play out in several ways. First,
other things equal, group identity could make an individual feel they should place more (or less)
weight on the welfare of others. For instance, many religions stress charity. If I identify myself
with a religion, I may also feel that I should generous to all people who are poorer than me
47
regardless of their group identity.61 More relevant, group identity could make an individual feel
they should place relatively more weight on others who share the same identity. Continuing with
the preceding example, many religions run charitable organizations that focus on members of
that religion and giving to these specific groups is especially encouraged.
Focusing on the latter case, while a number of lab experiments have found that people put
more weight on the welfare of individuals who share their group identity (“in-group”), this result
is far from universal. Notable early examples where group identity enhances other-regarding
behavior include Sell, Griffith, and Wilson (1993), Solow and Kirkwood (2002), Eckel and
Grossman (2005), Charness, Rigotti and Rustichini (2007), and Croson, Marks, and Snyder
(2008). These studies are intriguing, but raise a number of problematic issues. First, the
existence of effects from group identity is maddeningly inconsistent. For every case where an
effect is observed there seems to be another where group identity has no effect. For example,
Sell et al, Croson et al, and Solow and Kirkland all study the relationship between group identity
and gender in public goods games. Sell et al find no effect, Croson et al find a positive effect
only for women, and Solow and Kirkwood find a positive effect only for men. While differing
experimental details may explain some of the variance in results, the overall message is far from
coherent. Making group identity salient generally makes it more likely that group identity
affects choices, but this is far from a sufficient condition for an effect.
Beyond yielding inconsistent results, the early literature on group identity faced several
methodological issues. Because all of these studies examine games rather than individual choice
problems, it is difficult to separate effects of identity on the weight put on others’ payoffs from
the effects of identity on beliefs about others. The early studies all focused on a single game,
usually some form of a public goods game. Other-regarding preferences are a complex
phenomenon with multiple dimensions, which suggests that focusing on a single type of choice
will necessarily yield an incomplete picture of the effects of group identity on other-regarding
preferences. Finally, it remains unresolved how to best make group identity salient.
Chen and Li (2009) successfully address many of these issues. They use several different
methods to generate group identity. Along one dimension, they either assign subjects into groups
randomly (minimal-group paradigm) or via their expressed preferences for paintings by
61 See Benjamin, Choi, and Strickland (2010) and Benjamin, Choi, and Fisher (2013) for experiments documenting these sorts of group identity effects.
48
Kandinsky versus Klee. Group identity was then enhanced in some of the sessions by having the
groups perform an additional artist identification task and/or engage in a series of decisions
allocating money between two other subjects. All subjects then played a series of two person
sequential games similar to those studied by Charness and Rabin. These include dictator games
as well as games where the second player makes a decision, making it possible to separate the
effect of group identity on preferences from the effect on beliefs. Control sessions had no groups
(and hence no group identity) and went directly to the final stage of playing two person
sequential games.
Focusing on sessions that maximize group identity (groups are formed based on subjects
true preferences and are asked to perform both tasks designed to build group identity), Chen and
Li find that subjects are significantly kinder to in-group members. When allocating money
between two other subjects, substantially more is given to an in-group member versus an out-
group member. Not only does this confirm that group identity increases the weight put on in-
group members, but establishes that the effect is not solely due to changing beliefs. In sequential
games, more charity is shown to an in-group member when they are making less than the
decision maker and less envy is displayed when they are making more. In terms of distributional
preferences, these results imply a greater weight on the payoffs of in-group members than out-
group members or subjects in control sessions. Results on reciprocity have a similar flavor.
Subjects respond more positively to kind actions by in-group members and punish unkind
actions less.
Turning to various means of building group identity, assigning subjects to groups based
on their true preferences (e.g., over paintings), as opposed to randomly, has little impact on the
importance of group identity. Working on a task together (but not allocating money between
others) significantly increases attachment to the group as measured by survey questions, but has
little effect on actual behavior. This last result is disappointing given earlier findings that
exercises of this sort affect behavior since it indicates that the strength of the effect is sensitive to
the specific task is employed.
Chen and Li’s work is important as much for the methodological direction it provides as
for the actual results. Because Chen and Li study a relatively broad set of decisions, they can
study the effects of group identity independent from beliefs and can look at preferences for
reciprocity in addition to the distribution of preferences between in-group and out-group
49
members. Their use of multiple methods to induce group identity helps to establish how little is
actually required to generate group identity in a lab setting.
We conclude this section by noting that there also exist a large number of field studies
which study the effects of group identity on other-regarding behavior. Perhaps the best known is
Fershtman and Gneezy (2001) who study play of the trust game between different ethnic groups
(Ashkenazic vs. Sephardic) within the Israeli Jewish population. They find that significantly less
money is transferred to Sephardim, but this is true for all senders (and hence there is no effect
from group identity) and reflects differences in beliefs rather than preferences. There are several
later studies that succeed in finding strong in-group effects on other-regarding behavior:
Bernhard, Fehr, and Fischbacher (2006) find this studying dictator games with third party
punishment in Papua New Guinea as do Goette, Huffman, and Meier (2006) studying this game
and prisoner’s dilemma games for Swiss army platoons. It remains an open question exactly
when group identity will manifest itself in field settings. Presumably the answer depends both
on the groups being studied and the task being used.
G. Generalizability
One of the key questions in the whole social preference literature, as it is for laboratory
experiments as a whole, is how representative are the laboratory results for “natural” behavior.
This question might be considered to be particularly important for the other-regarding preference
literature as it deviates from “rational/self-interested” economic man. Further, as shown, some
of the methods employed may be particularly susceptible to demand induced effects; e.g., the
dictator game. A number of working and published papers deal with this issue.
Falk, Meier and Zehnder (2013) address the question of how representative self-selected
student samples are as (i) they are students as opposed to “real people”, (ii) there is some
evidence that at least on some dimensions subjects who sign up for economic experiments are
different from the general student population, and (iii) students might be particularly susceptible
to demand induced effects with a professor or other older authority figure in the room running
the experiment.62 They address this question in the context of the trust game comparing students
with non-students recruited from a representative sample of the population of Zurich. There are
very little differences between the two samples in terms of money sent as Player 1 in the trust
game, but students back transfer about 15% less than non-students. A regression controlling for
62 We are sure that the skeptical reader can think of additional possible reasons for non-generalizability.
50
socio-economic characteristics between the two populations eliminates this difference indicating
that students are just as reciprocal as non-students with similar socio-demographic
characteristics. Of course, both samples self-selected into the experiment which may, by itself,
generate selection bias. To address this question FMZ compare experimental subjects charitable
contributions to two social funds with the contributions of all students to these two social funds
that all students are asked to contribute to. They conclude that while there might be some
selection effect within certain majors (e.g., students from the arts faculty), this subgroup does not
make up a sufficient part of the typical student sample to yield an overall significant effect.
Cleave, Nikiforakis, and Slonim (2013) test for selection bias in lab experiments by
conducting an in class one-shot trust experiment in which 98% of all students attending tutorials
participated and then, several months later, recruiting those same students for participation in an
unrelated laboratory experiment. CNS compare the money returned by second movers in the
classroom experiment to the money returned by the sub-set of students who participated in the
lab experiment (1,173 students versus the 12% or so who participated in the standard lab
experiment).63 They focus on Player 2’s choices to measure social preferences, since unlike
Player 1’s they have no payoff uncertainty or strategic considerations to take account of in
determining how much money to send.64 They measure the average percent returned for the lab
participants versus the general student population, finding that the general population returns a
slightly larger percentage, (25.9% versus 22.8%), a difference that is too small to be statistically
significant (p > 0.10).65 Notably, Player 1s who returned as experimental subjects sent
significantly less money to Player 2s than the general subject population ($8.13 on average
versus $6.13). Given that social and risk preferences do not differ between students who did and
did not return, eliminating two likely explanations for this result, CNS speculate that this
difference stems from differences in either betrayal aversion or beliefs about the behavior of
Player 2s. The low rate of sending by lab participants implies that less pro-social behavior will
be observed in the lab than in the field.
Carpenter and Seki (2010) compare student measures of social preference with fishermen
in Japan for a voluntary contribution mechanism, public good game. CS report that students
63 Eckel and Grossman (2000) pioneered this technique using a dictator game. 64 CNS also checked for selection bias with respect to risk preferences. 65 The game is played via the strategy method and Player 1s are only given a limited number of choices. Thus, average returns are calculated over the same choice set for all Player 2s.
51
contribute less to the public good than the fishermen. More importantly, they relate pro-social
behavior in the public goods game to productivity in fishing, which by its very nature involves
cooperation between workers on a given boat as well as between boats (and in their study, a
distinct sub-group who pool their catch at the end of the day). They find that those crews that
exhibit greater degrees of conditional cooperation and disapproval of shirking in the public
goods game are substantially more productive; the baseline effect of a standard deviation
increase in conditional cooperation is to increase the catch of all boats by an economically and
statistically significant amount, with an even larger impact for the poolers.
Anderson et al. (2012) use a one-shot modified trust game to measure other-regarding
behavior between a self-selected sample of college students, a self-selected sample of non-
students from the community surrounding the college, and adult trucker trainees in a residential
training program. Ninety-one percent of the truckers participated in the experiment, thereby
essentially eliminating (or at least severely limiting) any self-selection effect. In their trust game
first movers were endowed with $5 and could send either $0 or $5 to second movers with the
amount sent doubled by the experimenters. Second movers were endowed with $5 and could
send back {$0, $1,…, $5} which was also doubled. The strategy method was employed to get
measures of player 2’s responses to either $0 or $5 being sent.66 Subjects were classified into
different preference types based on their responses as second-movers: (i) “free-riders” who send
zero back regardless of the amount sent, (ii) “conditional-cooperators” who send $5 back in
response to receiving $5 and $0 back in response to receiving $0, and (iii) unconditional
cooperators who send $5 back regardless of what they were sent.67 Comparing between samples,
self-selected non-students and the truckers have a remarkably similar distribution across the three
types, with students having significantly fewer unconditional cooperators (4% versus 30% and
28% for the self-selected non-students and the trainees), with more conditional cooperators and
free-riders among the students. Pooling across the two cooperative types, the share of students
displaying some form of other-regarding behavior is 63% versus 79% of the non-students. These
population differences are robust to controlling for age, income, etc.
Anderson et al. also compare the need for social approval between their three samples, on
the grounds that more approval seeking types would be more prone to demand induced effects,
66 Subjects made choices in both roles with payoffs determined on the basis of one of the two roles. 67 Between 53% and 62% of the sub-populations could be classified into these “pure” types. The remaining participants were classified in terms of how close they were to one of these pure types.
52
which may also distort responses. Subjects filled out the brief form of the multidimensional
Personality Questionnaire (Patrick et al., 2002) which includes a stand-alone index of social
desirability, the Unlikely Virtues Scale, which ranges from 13-52 with high scores resulting
when subjects over-report uncommon good behaviors (e.g., answering positively to questions
such as “Never in my whole life have I taken advantage of anyone.”). Mean scores for students
were lowest (29.8 versus 33.6 and 34.3 for the non-student volunteers and the truckers). Tobit
regressions controlling for socio-demographic characteristics show that the difference between
students and non-students is statistically significant at better than the 1% level with the
difference between the truckers and non-student volunteers significant at the 5% level, which
may well account the high frequency of unconditional cooperators in the non-student samples.
Baran, Sapienza, and Zingales (2009) compare behavior in a laboratory trust game among
University of Chicago MBA students with end of school donations that are routinely asked for
(the Class Gift campaign). Behavior in the trust game was part of a series of in class
experiments (in a required course) upon first entering the program. One of the games was
randomly drawn with participants paid according to their earnings in that game. Data on end of
program contributions discussed here are based on actual contributions, excluding pledges that
were not paid by the end of the campaign.68 The game itself was a standard trust game with
Player 1s endowed with $50 and permitted to send in multiples of $5 with the amount of money
tripled for Player 2s. Player 2s used the strategy method responding to each possible allocation
of Player 1s, resulting in an average return ratio of 0.78 for $5, increasing to 1.09 for $50. BSZ
run regressions to relate the amount donated to Class Gift to the return ratio reported in the trust
game for different amounts donated focusing on the return ratio at $50 as the best proxy for
reciprocity: A one standard deviation in the return ratio at $50 is associated with a $28 increase
in the donation, with this effect significant at the 1% level.69
BSZ go on to relate their results to a shortened version of the Crowne-Marlowe (1960)
social desirability scale which measures the importance individuals give to doing or saying what
they consider to be socially desirable. The motivation for this part of the analysis was in response 68 There are many reasons why pledges might not be carried out, among them bowing to the social pressure to contribute while planning to default on their contributions. As in many drives of this sort the emphasis is on contributing something to the class gift. 69 In a similar vein, Karlan (2005) reports that Player 2s identified as returning more in a laboratory trust game in rural Peru were more likely to repay their loans one year later in a microcredit program. This result holds after controlling for responses to the General Social Survey (GSS) questions on trust, fairness and helping others so that the trust game results are not simply due to their correlation with the GSS questions.
53
to Levitt and List’s (2007) argument that laboratory experiments designed to measure social
preferences are biased as subjects may be trying to “look good” in the eyes of the experimenter
by exhibiting more pro-social behavior than they would outside the lab (an experimenter demand
induced effect). Using the Crowne-Marlowe social desirability scale to determine how much
behavior is distorted by scrutiny of different audiences BSZ find no significant correlation
between the social desirability scale and the actual donation amount indicating that the MBA
students are not sensitive to being observed by the school’s staff and faculty with respect to
donations to the Class Gift. Further, relating scores on the social desirability index to response
ratios in the trust game shows no significant relationship, indicating that what subjects consider
to be socially desirable also does not influence their behavior in the lab. However, BSZ find that
total amount pledged (as opposed to actual contributions) is positively correlated with the
Crowne-Marlowe scale, indicating that MBA students are sensitive to being observed by their
peers, at least with respect to pledged donations. We suggest that it would be useful to replicate
the trust game experiment employing the Crone-Marlowe social desirability scale with
undergraduate students to see whether the standard population used by most lab experiments is
susceptible to experimenter demand induced effects of this sort. It would also be interesting to
see if demand induced effects of this sort are more likely to kick in when making hypothetical
choices without any real monetary consequences, as these are more akin to pledges.
Leider et al. (2009) conduct a field experiment based on social networks at Harvard
University. They employ a dictator game with varying payoffs for the two players along with an
allocation game in which decision makers were asked to report the maximum price they would
be willing to pay for their partner to receive $30.70 The key treatment variables were (i) the
social distance of Player 2 from the decision maker and (ii) whether or not these were
anonymous transactions (neither the decision maker or Player 2 knew each other’s identity) or
not (both players knew each other’s identity). These treatment variables were designed to
distinguish between altruism to randomly determined strangers (“baseline altruism”) versus
“directed altruism” towards friends versus strangers (in the anonymous treatment) versus
reciprocal altruism motivated by the prospect of returned favors (the informed treatment). They
70 They employed a Becker-DeGroot-Marsack type procedure (to elicit sincere reporting) in which a random number was drawn between $0 and $30. If the number drawn was less than or equal to $30 the random number determined how much was deducted from their stake of $45 (with the elicited dollar value sent to Player 2), otherwise they kept the $45 and the second player got $0.
54
find that baseline altruism and directed altruism are correlated so that subjects giving more to
nameless partners also give more to named partners. This suggests that typical lab experiments,
where one interacts with unidentified individuals, pick up stable subject characteristics that carry
over to more realistic environments where the other individuals are identifiable.
A second interesting result in Leider et al. is that friends sort by baseline altruism, so that
subjects with a high (low) level of baseline altruism have more friends with a high (low) level of
baseline altruism. A related result is reported by Slonim and Garbarino (2008). They find that in
an online trust game in which the second mover’s gender and age were known to first movers,
more was sent when first movers could select their partners. This effect was present even after
controlling for expectations about the amount to be returned. These two results suggest that lab
studies may underestimate the impact of other-regarding behavior by missing the effects of
selection, both because the act of selection changes other-regarding behavior and because
selection makes it likely that generous individuals interact with other generous individuals,
thereby fostering conditional cooperation.71
Summary: There are a number of dimensions to generalizability issues covered in this section.
The question of whether students who enlist in economics type experiments with their paid
compensation contingent on their behavior are different from the general student population is
answered in the negative (FMZ and CNS). Regarding the more important question as to whether
student subjects are more other-regarding than “real” people, the answer is if anything students
have the same or less other-regarding preferences than the general population (FMZ, CS,
Anderson et al.). Given the relatively large number of other studies comparing students with non-
students reporting similar results, this should be considered a stylized fact of the literature.72
Regarding whether behavior in lab games carries over to behavior outside the lab, strong positive
correlations between in lab other-regarding preferences and other-regarding preferences outside
the lab are reported consistently across several studies (FMZ, CS, and BSZ, and Karlan, with
Leider et al, strongly suggestive as well).
71 Sorting effects of this sort were discussed earlier in Lazear et al (Section xx above). 72 See Bellemare and Kroger (2007), Carpenter et al. (2008), Fehr and List (2004), Hoffman and Morgan (2010), and Burks et al. (2009a).
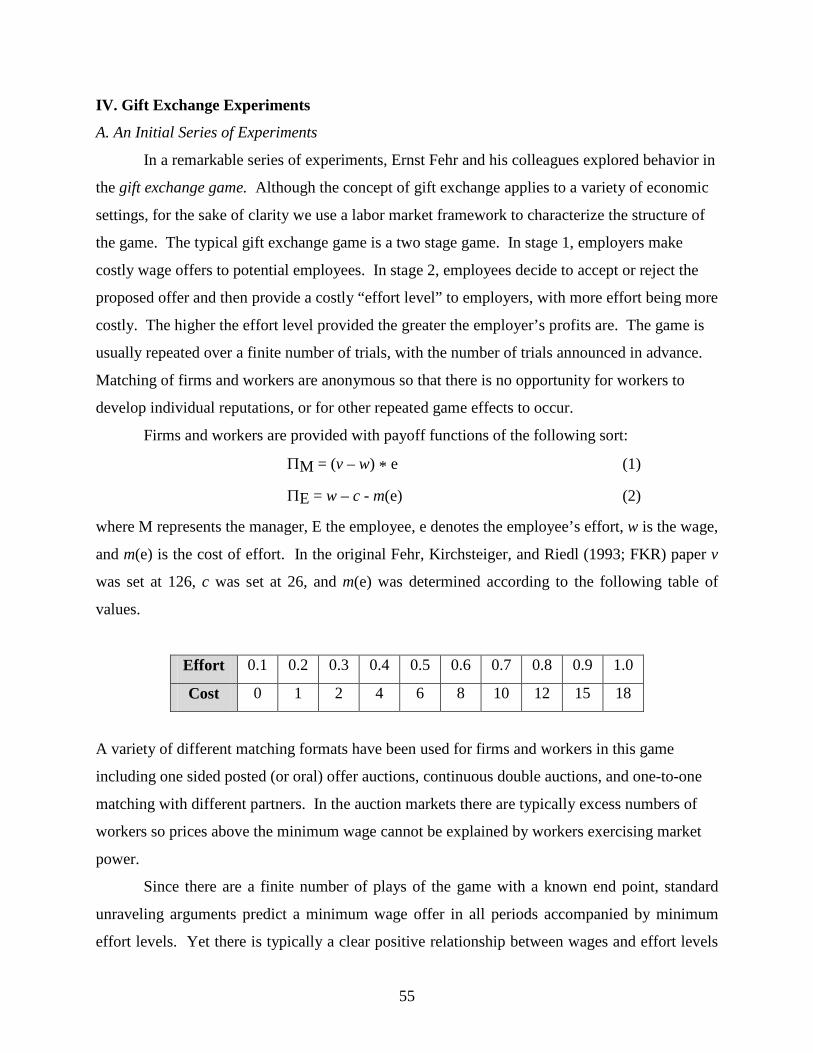
55
IV. Gift Exchange Experiments
A. An Initial Series of Experiments
In a remarkable series of experiments, Ernst Fehr and his colleagues explored behavior in
the gift exchange game. Although the concept of gift exchange applies to a variety of economic
settings, for the sake of clarity we use a labor market framework to characterize the structure of
the game. The typical gift exchange game is a two stage game. In stage 1, employers make
costly wage offers to potential employees. In stage 2, employees decide to accept or reject the
proposed offer and then provide a costly “effort level” to employers, with more effort being more
costly. The higher the effort level provided the greater the employer’s profits are. The game is
usually repeated over a finite number of trials, with the number of trials announced in advance.
Matching of firms and workers are anonymous so that there is no opportunity for workers to
develop individual reputations, or for other repeated game effects to occur.
Firms and workers are provided with payoff functions of the following sort:
ΠM = (v – w) * e (1)
ΠE = w – c - m(e) (2)
where M represents the manager, E the employee, e denotes the employee’s effort, w is the wage,
and m(e) is the cost of effort. In the original Fehr, Kirchsteiger, and Riedl (1993; FKR) paper v
was set at 126, c was set at 26, and m(e) was determined according to the following table of
values.
Effort 0.1 0.2 0.3 0.4 0.5 0.6 0.7 0.8 0.9 1.0
Cost 0 1 2 4 6 8 10 12 15 18
A variety of different matching formats have been used for firms and workers in this game
including one sided posted (or oral) offer auctions, continuous double auctions, and one-to-one
matching with different partners. In the auction markets there are typically excess numbers of
workers so prices above the minimum wage cannot be explained by workers exercising market
power.
Since there are a finite number of plays of the game with a known end point, standard
unraveling arguments predict a minimum wage offer in all periods accompanied by minimum
effort levels. Yet there is typically a clear positive relationship between wages and effort levels
56
(see Figure 13), resulting in a Pareto improving outcome with higher earnings for both firms and
workers than absent gift exchange. These results do not appear to depend on the fine points of
the market institutions (e. g., posted offer vs. double oral auction or one-to-one matching) and
there is typically minimal unraveling in the last plays of the game.73
[Insert Figure 13]
The results are consistent with Akerlof’s (1982) model of gift exchange, in which
employers receive higher productivity from employees by paying them above market wages.
But this result emerges in a much starker environment than the one Akerlof describes, as workers
are isolated from each other so that social norms regarding appropriate effort levels cannot
emerge, and there is no potential to fire employees whose effort levels fall below the firm’s
expectations. Since these mechanisms cannot cause the positive relationship between wages and
effort, Fehr and his colleagues explain their results via positive reciprocity between firms and
workers, consistent with the positive reciprocity observed in the trust game.
Fehr and his colleagues have applied the gift exchange game to a variety of interesting
issues in labor economics. Fehr and Falk (1999; FF) showed that wages fail to converge to the
competitive equilibrium level in a continuous double auction labor market in spite of more or
less continuous efforts to undercut wages by unemployed workers. Firms apparently refuse the
lower wage offers since they tend to be accompanied by lower effort levels, to the point that it is
not profit maximizing to hire such workers.
The preceding raises a puzzling feature of gift-exchange experiments. Employers who
offer wages above the minimum earn positive profits, in contrast with the trust game where
sending money is a break-even proposition at best (e.g. BDM, 1995). This is an important point
since Fehr and company argue that the profitability of wages above the minimum is a major
reason for their persistence. In contrast, we suspect that this difference between the two classes
of games can be explained by differences in the costs of reciprocal behavior. In the trust game,
the receiver must spend a dollar to give a dollar to the sender. Compare this with FF’s (1999)
gift exchange game when a wage of 60 (roughly the mean wage) is chosen. In this case, at low
effort levels, an employee giving up a dollar in own payoffs raises the employer’s payoff by up
73 This is not to say the relationship between wages and effort is stable. For example, Cooper and Lightle (2012) find that the response of effort to wages becomes steeper with experience. The point is that the positive response of effort to wages is not dissipating with experience.
57
to six dollars! This is consistent with the results of AM (2002) (Section III.J above) showing that
there is greater reciprocity when the cost of kindness is cheaper.
The existence of a successful gift exchange paradigm in the laboratory makes possible
controlled investigation of a number of interesting issues in labor economics. We briefly discuss
several applications below.
B Incomplete Contracts
In many markets contracts are incomplete, specifying agents’ obligations imprecisely
with trading relations based on informal agreements and unwritten codes of conduct. It is both
difficult and costly for neutral third parties to enforce these “contracts” as since typically
outsiders are unable to verify the contractual obligations and whether or not they have been met.
There have been a number of gift exchange and related experiments exploring these issues.
One research issue concerns the potential hidden costs of control – the fact that control
may drive out reciprocal behavior so that it backfires leaving the controller worse off than if they
relied on reciprocal relations that are natural to the situation. Falk and Kosfeld (2006)
experimentally investigate the hidden costs of control in a one-shot principal-agent game. In
their highly simplified game, the agent has an initial endowment of 120. The agent spends x,
varying over the interval [0, 1, …,120] on “effort” with the return to the agent equal to 2x. They
implement a two-stage version of the game: In stage one the principal can control the agents’
choices – either no control or a predetermined minimum level of effort x = 5, 10, or 20 – and in
stage 2 the agent chooses effort subject to any constraints imposed in stage 1. Under the low and
intermediate control values the principal does better on average with no control than with
control: with low control (x = 5) average effort is 12.2 versus 25.1 without control and with
intermediate control (x = 10) average effort is 17.5 versus 23.0 without control. At the highest
level of control implemented (x = 20) the differences are a wash – 25.4 with control versus 26.7
without.74
FK go on to implement a number of other treatments. Among other things, they
demonstrate that a likely cause for reduced effort with control is that imposing control breaks the
trust between the principal and the agent. They show this by comparing the control treatment
74 These treatments are implemented with the strategy method with agents determining their choices with and without control, followed by principals determining their choices. The overwhelming number of principals chose not to exercise control. A control treatment with x = 10 that went directly to the subgame with control (therefore no strategy method) showed similar results to the strategy method.
58
with x = 10 and a treatment in which it is clear that the experimenter, rather than the principal,
has fixed the minimal effort of 10. The latter results in an average effort (x) of 28.7, which is not
significantly different from the agents’ choices when the principal trusts and is significantly
more than when the principal chooses to control. They also implement a modified gift exchange
game with similar results at low levels of control – if control is incomplete, at low levels it may
drive out reciprocity so that no control is better than low levels of incomplete control.75 FK
make it clear that their paper is not intended as a horse race between the use of control or trust by
principals. Rather, the primary message is that control and explicit incentives may entail hidden
costs that must be taken seriously.76
A number of papers have explored different aspects of the contracting literature. Fehr and
Gächter (2002; FG) compare three types of one-shot contracts with no room for reputation
building: (1) Firms specify a wage along with a desired effort level and a fine if that effort level
is not realized, with an exogenously determined one-third probability of identifying shirking
workers, (2) Firms specify a bonus along with a wage and a desired effort level, with an
exogenously determined one-third probability of the bonus not being paid in case the worker was
identified as shirking, and (3) a control treatment in which the firm simply specifies a wage
along with a desired effort level. Their results show that treatment (1), the fine treatment,
generated consistently lower effort levels at each wage rate than the control treatment with no
explicit incentives. The bonus treatment (2) did better than the fine treatment, but the standard
gift exchange treatment without any explicit fines or bonuses had even higher effort levels.
Although explicit incentives resulted in lower effort levels in this experiment and lower social
surplus, employers’ profits were higher in the fine treatment as much lower wages were offered
while extracting higher effort levels out of workers in response to the probability of being hit
with a hefty fine.
Brown, Falk and Fehr (2004) introduce the possibility of longer term relations between
firms and workers. Using payoff functions similar to those reported in FKR above, they
compare an incomplete contract treatment with the possibility of long term relations (ICF) with a
75 That is, it should be clear that if principals set x equal to say 50 or 60 it would be better to control than to not control; see the results for the control treatment in Brown, Falk and Fehr (2004) below. 76 Also see Fehr and Rockenbach (2003) for a similar result in the trust game and Ellingsen and Johannesson (2008) for a model that can account for the motivational crowding out effect of low levels of explicit control. Finally, it would be interesting to see how subjects would behave in those localities that report anti-social punishment in public good games (Herrmann et al., 2008).
59
complete contract treatment (C) also permitting longer term relations (firms and workers knew
each other’s ID numbers), along with an incomplete contract treatment with no possibility for
reputations (as in the original FKR experiment). In the ICF and C treatments firms could make
public or private offers, with all offers in terms of a wage and a desired effort level. Only the
firm and worker involved in a contract knew the actual payoffs and effort level. Firms and
workers were aware of all public wage offers along with the desired effort level. A firm could
make as many public and private offers in a period as it wanted to. There were 10 workers and 7
firms in all treatments, with sessions lasting for 15 periods, announced in advance.
“Unemployed” workers received a fixed payment of 5 experimental currency units.
The main results of the experiment show that: Average wages and effort levels were
substantially higher in the ICF treatment than in the other two treatments with much of the
contracting done privately under repeated interactions between the firm and worker. There is a
noticeable drop in effort in the final period indicative of a number of workers masquerading as
reciprocal types as in the Gang of Four model for finitely repeated games of this sort (Kreps et
al., 1982), but effort is still significantly above that of the one-shot incomplete contract treatment
for the last period. Earnings are skewed quite heavily in favor of the firm with complete
contracts (but workers were still able to earn small positive rents) and, as is usual, in favor of
workers under the one-shot incomplete contract treatment. Earnings were approximately the
same between firms and workers under the ICF treatment regardless of the length of the
relationship, and increasing for both in the length of the relationship, as a result of the much
higher effort levels under the ICF. Firms’ earnings were highest under the complete contract
treatment, followed by the ICF treatment, and lowest under the one-shot incomplete contract
treatment. There are a number of other interesting experiments exploring elements of the
incomplete contract literature that we direct the interested reader to.77
C. Wage Rigidity
Surveys conducted to investigate reasons for wage rigidity in the face of rising
unemployment commonly report that employers fear adjusting wages downward will result in
negative effects on employee effort, along with adverse selection with respect to quits
(Campbell and Kamlani, 1997, Bewley, 1998). The validity of this fear isn’t obvious. Models of
77 Among others see Fehr, Gachter, and Kirchsteiger (1997), Fehr, Hart and Zehnder (2011), Ploner and Ziegelmeyer (2008), Kessler and Leider (2012).
60
outcome based preferences predict that employers faced with bad business conditions (i.e. low
revenues) should be able lower wages without reducing employee effort, and even models that
allow for reciprocity admit the possibility that a wage cut won’t harm employee effort under
these circumstances.78 To sort this out, Hannan (2005) presents an experiment studying the
interaction between firm profitability and employees’ reactions to wage changes. Her
experimental design employed payoff functions similar to (1) and (2) above, with the typical two
stage process where firms first set wages and employees respond with effort. However, she
added a third stage: After firms set wages and workers responded with their effort level, but
before these effort levels were reported back to employers, there was an exogenous shock to the
firm’s profit – a random draw with a one-third probability of a positive, negative, or zero
shock.79 If there was no shock, the wage and effort levels agreed to originally were binding and
the round ends. If there was a positive or negative income shock it was publicly announced, and
firms and workers had the ability to adjust their wages and corresponding effort levels.
Figure 14 reports her main results, with wage changes reported on the horizontal axis and
the change in mean effort levels on the vertical axis. The data support the fear that adjusting
wages downward, even after a negative income shock, will result in lower effort levels and be
unprofitable for employers as: (1) When wages are decreased, workers tend to decrease effort,
regardless of whether or not the income shock is positive or negative. (2) The magnitude of the
punishment or reward, in terms of effort, is directly related to the magnitude of the wage change,
regardless of whether or not there was a positive or negative profit shock. (3) The magnitude of
the negative response to wage decreases is twice that of the positive response to wage increases
so that workers punish firms more for decreasing wages than they reward them for increasing
wages. (4) Firm profits were significantly lower if they reduced wages following a negative
profit shock than if they had held wages constant.
[Insert Figure 14]
78 In any such model, effort depends on whether the wage is considered kind or unkind. If the employer’s profitability falls, lower wages could be considered less unkind than previously. 79 Income shocks were set at two different levels depending on the experimental session, and represented 50% or 100% of the lowest possible wage, and 8.3% or 16.7% of the highest possible wage.
61
D. The Effect of Cognitive Ability and the Big Five Personality Characteristics in Other-Regarding Behavior
There is growing interest in economics on the effects of personality traits as measured in the
psychology literature on economic outcomes (Borghans et al., 2008; Anderson et al., 2011). The
Big Five personality characteristics represent a consensus among personality psychologists on a
general taxonomy of personality traits, with the focus on internal consistency rather than
predictive ability. The Big Five characteristics do not represent a particular theoretical
perspective but are derived from the analysis of natural language terms people use to describe
themselves and others: agreeableness, extroversion, conscientiousness, neuroticism and
openness.
Becker et al. (2012) investigate the effect of the Big Five personality characteristics on
behavior in the trust game, investment in punishment in a VCM game, and on giving in the
dictator game, but have no measure for cognitive ability. They report positive correlations
between agreeableness and social preferences (e.g., positive reciprocity in the trust game and
giving in the dictator game).80 Anderson et al. (2011) look at the effect of the Big Five
personality characteristics in the one-shot modified trust game described in Section II.l (along
with a variety of life outcomes for their sample) for a sample of truck drivers, in conjunction
with measures of cognitive ability. Using a series of logit regressions with controls for a number
of demographic variables (e.g., age, divorced) the significant ability and personality
characteristics are as follows: The decision to send $5 is positively associated with cognitive skill
and agreeableness and negatively associated with conscientiousness. The response to a zero
transfer is negatively associated with cognitive skill and positively associated with agreeableness
and neuroticism. More agreeable, and more neurotic, types send back more money in response
to a $5 transfer, with greater cognitive skill resulting now resulting in greater transfers back.
Feliz-Ozbay, Ham, Kagel and Ozbay (2012; FHKO) explore cognitive ability and the Big
Five personality characteristics in the context of a standard gift exchange game with no
reputational possibilities, a game with a known end point after 12 rounds of play. Payoffs are
symmetric between “firms” and “workers.”81 Cognitive ability is measured using SAT scores
collected (with subject’s permission) from the registrar’s office, with personality measured with 80 Defining facets of the Big Five trait domain “agreeableness” include generosity, trust, altruism, and empathy (John et al. 2008, Table 4.3). They also look at the effect of the Big Five on time and risk preferences. 81 Firm’s profits ΠF = 100 – w + 5e with workers payoffs equal to ΠW = 100 – e + 5w where w is the wage rate firms offer and e and w are integers drawn from the interval [0, 100].
62
the Big Five Inventory (BFI) questionnaire (John et al., 2008). Their pooled results have the
usual pattern for these types of games – higher wages result in significantly higher effort levels,
although a persistent percentage of “workers” (around 20% in this case) respond with zero effort
regardless of the wage rate. They also find significant gender effects with women offering lower
average wages than men and responding with lower effort levels at higher wage rates, a result
not previously reported in the literature.82
The major impact of cognitive ability on outcomes is that both men and women with higher
SAT scores offer higher wages, consistent with growing evidence that higher cognitive ability is
associated with less risk aversion (Dohmen et al., 2010; Burks et al., 2009). Not surprisingly,
more agreeable types offer higher wages, but dropping SAT from the wage regression,
agreeableness is no longer statistically significant, indicating the potential importance of having
a measure of cognitive ability when investigating the impact of personality characteristics on
economic behavior. Also as expected, more agreeable types respond with greater effort at all
wage rates. However, the magnitude of this effect is quite large with a one standard deviation
increase in agreeableness having the same impact on increased effort as does a one standard
deviation increase in wages for women, and a very sizable effect relative to a comparable wage
increase for men. Looking at wage offers of men and women separately, for men a one standard
deviation increase in conscientiousness has essentially the same impact on increased wage offers
as does a one standard deviation increase in SAT scores, but the opposite effect (of roughly the
same absolute value) for women. This differential effect of conscientiousness on wages is
consistent with best responding to the impact of conscientiousness on effort responses of men
and women, where increased conscientiousness leads to increased effort on the part of men, but
decreased effort for women. One possible explanation this unexpected differential effect is that
conscientiousness captures “following norms and rules” which may well differ with respect to
men and women in this context as there is some evidence suggesting that for women explicit
monetary payments tend to drive out social preferences more than for men.83
Looking at the effects of personality characteristics such as the Big 5 on economic outcomes
is still in its infancy. However, a number of consistent results have appeared to date across both
82 See Croson and Gneezy (2009) for a review of gender differences in preference identified in economic experiments. 83 See Mellström and Johannesson (2008) who found that paying people to donate blood reduced women’s donations while men’s donations were unaffected.
63
experimental and non-experimental studies. First, these non-cognitive characteristics can have
as strong an effect on behavior and life outcomes as cognitive ability and some traditional
economic variables (e.g., wages). Second, agreeableness has a consistent and sometimes large
impact in the expected direction in a number of experiments with strong other-regarding
elements. This area of research has yet to be fully explored so one can anticipate further
regularities emerging as the literature grows.
E. Why Does Gift Exchange Occur?
Fehr and his colleagues explain the results of the gift exchange game in terms of the
importance of positive reciprocity and the desire to avoid social disapproval in economic
interactions (Fehr and Falk, 2002). Bolton and Ockenfels (2000) analysis of the gift exchange
game postulates a heterogeneous population made up of egoists that maximize pecuniary payoffs
and other-regarding income types who reciprocate with greater effort in response to higher
wages provided they are able to get at least half the pie. An increase in wages increases average
effort as the other-regarding types respond with higher effort and the egoists’ effort level remains
constant, so that average effort increases. And indeed, in most gift exchange experiments there
are a minority of subjects who more or less continuously provide minimal effort, regardless of
the wage rate. Further, the BO model predicts that higher wages will not always be met by
higher profits for firms, as other-regarding workers generally insist on getting at least half the
efficiency gains from reciprocating with higher effort, which is not always possible given the
(typically) increasing cost of higher effort for workers. This too is found in the data (BO, 2000).
Other studies have failed to find the same high levels of gift exchange reported by Fehr
and his colleagues. For example, Hannan, Kagel and Moser (2002; HKM) compare behavior in a
gift exchange game using undergraduates and MBAs, as well as worker responses to high versus
low productivity firms (where high productivity firms find it less costly to provide higher wages
than do low productivity firms).84 Wage offers were tagged with the firm’s productivity level in
a posted offer labor market. They find no difference in worker response to comparable wage
offers from high versus low productivity firms, as well as a marked difference in effort levels
84 ΠM = (v-w) e where v = 90 for low productivity firms and 120 for high productivity firms, so that for any given wage-effort level payoffs to high productivity firms were higher than for low productivity firms.
64
between undergraduates and MBAs.85 Undergraduates provided substantially lower effort levels
than both the MBAs and the effort levels reported in Fehr et al. (1998), particularly at higher
wage rates (see Figure 15).86 They conjecture that the lack of responsiveness to differences in
firm’s productivity levels (which was true for MBAs as well as for undergraduates) resulted from
a lack of saliency, as the relationship between firm profits and productivity is an indirect one. As
for the difference between MBAs and undergraduates, they note that MBAs have greater
experience in jobs where gift exchange plays an important role so were more able to relate their
past experience to the labor market context under which the experiment was conducted. In
contrast, most undergraduate work in the United States is associated with minimum wage jobs
where there is no, or minimal, gift exchange. This interpretation is consistent with the Akerlof
(1982) model of gift exchange which assumes that higher wages result in higher effort levels out
of social norms and conventions in the workplace. Only in this case, it is conventions and norms
from the workplace that carry over into the lab.
[Insert Figure 15]
Healy (2007) formalizes the role of reputation in fostering gift exchange. On first blush,
reputation does not seem to be a likely explanation for the positive relationship between wages
and effort in gift exchange experiments. Matchings in these experiments are typically
anonymous, meaning employers are unable to track an employee’s behavior over multiple
rounds, and the pool of employees is sufficiently large that no one employee greatly impacts the
reputation of the pool as a whole. Healy’s innovation is to note that stereotyping greatly
enhances the importance of reputation building. Stereotyping refers to the (possibly irrational)
attribution of characteristics of a group to individuals within the group even if the group
members are known to be heterogeneous. Within the gift exchange framework, suppose there
are two types of employees, strictly selfish types (egoists) and reciprocal types who will
reciprocate with higher effort in response to higher wages (reciprocators). If the probability of
reciprocal types is known and types are independent across individuals, observing reciprocal
behavior from one employee reveals nothing about the extent to which other employees are
reciprocal. With stereotyping, types are believed to be positively correlated across employees. 85 The failure to find higher effort levels for low productivity firms is inconsistent with the FS model of other-regarding preferences as an inequality-averse employee will respond with weakly higher effort to compensate for lower efficiency of effort (Bartling, Fehr, and Schmidt, 2012; p. 844). 86 Note, HKM do not assert that undergraduates do not provide statistically significant higher effort levels at higher wages. Just that they are considerably lower than found with MBAs and in FKR (1993).
65
Observing reciprocal behavior increases the perceived likelihood of reciprocal behavior from all
employees. If the perceived positive correlation of types across employees is sufficiently strong,
it becomes worthwhile for even egoists to exhibit reciprocal behavior until the final period of the
experiment so as to maintain the group’s reputation for reciprocity and the resulting high wage
offers. Reputation building can therefore explain a significant portion of the positive relationship
between wages and effort in gift exchange experiments.
While the primary contribution of Healy is theoretical, he also presents a series of
experiments that test predictions of his reputation model. The model predicts that effort should
collapse in the final round of play, since there is no benefit to maintaining a reputation for
egoists, and that if payoffs are manipulated to require a higher probability of reciprocal types to
maintain a reputation equilibrium it is possible that the positive relationship between wages and
effort should collapse. The experimental results are largely consistent with these predictions.87
Healy’s work leaves a number of open issues. For example, it does not provide an
explanation for the sizable population of consistently selfish employees observed in most gift
exchange experiments (in a reputation model, these individuals should be imitating the
reciprocating types). It would also be nice to have direct evidence of the stereotyping on which
the model relies so heavily. Nonetheless, Healy makes it clear that positive reciprocity is not the
only plausible explanation for positive correlation between effort and wages in gift exchange
games.88
F. Laboratory vs. Field Settings and Real Effort
One relevant question is whether or not gift exchange carries over to environments where
workers have to respond with real effort as opposed to the higher monetary costs associated with
greater “effort” in the typical experiment. An initial answer in the affirmative was provided by
Gneezy (2004) who used solving mazes as his real effort task, employing mazes with different
levels of difficulty (as measured by average time to solve a maze) and with different returns to
“firms” for each maze solved. In a single period game he found that in all treatments the higher
87 In some sessions, effort begins to collapse prior to the final round. This may reflect “trembling” on the part of players or could reflect a mixed strategy equilibrium – while Healy focuses on a tractable pure strategy equilibrium, the game supports mixed strategy equilibria as well, with the probability of cooperation decreasing over time. 88 Cox et al (2012) report an experiment, the results of which directly contradict reputation building models of the sort Healy applies. They develop a semi-rational behavioral model in place of the reputation building model, which fits their experimental data (a finitely repeated prisoner’s dilemma game). This model has yet to be generalized to other finitely repeated games.
66
the wage the higher the number of mazes solved, consistent with the presence of positive
reciprocity. However, higher wages did not always result in higher profits.
Subsequent results have been much more mixed. Gneezy and List (2006; GL) report an
experiment in which positive reciprocity is found initially in response to “surprise” higher wages,
only for output levels in the high wage and control treatment to converge over time. They looked
at two tasks – computerizing library holdings over a 6 hour period and a door-to-door
fundraising effort over a single weekend day. The gift exchange treatment was operationalized
by advertising a given wage rate and then when subjects showed up, paying a higher than
advertised wage for one of the two groups; in their case an advertised wage of $12 per hour for
the library task, with half the subjects given the “surprise” wage of $20 an hour upon showing
up. Procedures were designed to insure that subjects in the two treatments were not aware of the
difference in wage rates.
Figure 16 reports the results from the library task split into 90 minute intervals. In the
first 90 minutes the average number of books logged into the computer is significantly higher for
the high wage group but this trails off over time, with the averages the same over the last 3 hour
period. Similar results were found in the fundraising task in terms of the amount of money
raised, with significantly larger amounts raised before lunch in the high wage treatment
compared to the advertised treatment. But this difference was small and not statistically
significant after lunch. GL interpret these results in terms of the psychology literature on
reference point effects, arguing that after a while workers reference point shifts so that the new
higher wage serves as the fair wage reference point, with a resulting drop in effort. These results,
particularly given their interpretation, set off a fire storm since they seemed to be at odds with
the large body of laboratory research on gift exchange.
It’s important to focus on their interpretation of the results here as there are several
alternative explanations that are equally consistent with the results, and GL provide no explicit
evidence in favor of their interpretation. Two alternative explanations that come immediately to
mind are: (1) the higher wage workers became fatigued from working harder and/or (2) the
higher wage workers provided the gift level they thought appropriate to the higher than
advertised wage in the first half of the day and slacked off after that. These alternative
explanations, along with GL’s reference point shift interpretation (and probably others the reader
can think of) are all consistent with the data.
67
[Insert Figure 16]
The provocative results of GL spurred a number of studies examining gift exchange in
field settings. The results of these experiments often differ from those of GL. For instance, Kube
et al. (2013) look at gift exchange in a library cataloguing task, focusing on both positive and
negative reciprocity. Students hired for a six hour shift cataloguing books at hourly wage of
presumably €15 per hour (recruitment e-mail announced a presumptive salary). Upon arrival
one-third of the subjects were told the wage would be €20 per hr (the “Pay raise” treatment),
one-third told that the wage was actually €10 per hr (the “Pay cut” treatment), and one-third got
€15 per hr wage (the “Baseline” treatment). Subjects did not know what others paid.
Figure 17 reports the average number of books catalogued for each group by 90 minute
blocks. The number of books catalogued rises over time for all three treatments. The pay cut
treatment starts out at a much lower rate of cataloguing than the baseline treatment and remains
below it throughout, with the differences statistically significant in each 90 minute interval. The
pay increase treatment starts at a lower rate than the baseline treatment but increases faster after
that so that it exceeds the baseline treatment by the last 90 minute interval. Taking all three
treatments together, Kube et al. conclude that negative reciprocity is a stronger force than
positive reciprocity.89 Given that output in the pay increase treatment grows significantly faster
than in the baseline treatment, contrary to the drop reported in Gneezy and List (2006), positive
reciprocity could well have a significant effect in the long run as well.
[Insert Fig 17 here]
A similar experiment by Al-Ubaydli et al. (2008) yields different results from either GL
or Kube et al. The job task involved stuffing envelopes for a direct mail solicitation to contribute
to a research organization. Subjects were recruited for work through a temporary employment
agency. The positive gift exchange treatment was operationalized through an advertised wage
range of $8-$16 per hour, with workers paid the $16 wage. There was a negative reciprocity
treatment with the same advertised wage range but workers were paid at the lower bound $8 rate,
and a control treatment with an advertised (and paid) wage of $8 an hour. All three of these
treatments involved 2 days worth of work. 89 A piece rate treatment is introduced to check for the possibility that the lack of significance in the pay increase treatment in later periods was a result of coming up against an upper bound on subjects’ ability to do the cataloguing task. The data makes it clear that this was not a factor. However, as noted below, the baseline wage rate was substantially higher than the prevailing student wage rate (subjects were students) which may have already generated a positive gift response in terms of students’ effort.
68
There was strong growth over time in the number of letters packed starting from a low
rate of between 5-7 letters per hour with no sizable differences between treatments and
culminating at the end of day 1 with the positive gift treatment averaging 13 letters per hour,
with the control treatment averaging around 10 per hour, and with the negative reciprocity
treatment just a bit below that. Overall the two-day positive treatment yielded an increase of
nearly 15% in letters per hour (10.5 versus 9.1) over the control treatment (z = 1.54, p < 0.12
using a Mann-Whitney non-parametric test statistic; t = 2.03, P < 0.05 using a two sample t-
statistic).90 The authors note that these results appear much weaker in a regression controlling for
subject characteristics, with dummy variables accounting for the growth in the number of letters
packed per hour. However, this regression does not include an interaction term to account for the
much faster growth in letters packed per hour in the positive reciprocity treatment, as shown in
Figure 3 of their paper. We conjecture that a regression with this interaction term would pick up
a strong positive reciprocity effect. If so, this would contrast with the earlier results of GL as the
effect of positive reciprocity occurs late rather than early. 91
Bellemare and Shearer (2008) find that an unexpected one-time bonus for workers in a
tree planting firm significantly increases the number of trees planted, with the response from
workers increasing with their tenure in the firm. One strength, as well as weakness, of this study
is the long term relationship the workers had with the firm. From a labor economics point of
view, these sorts of long term employer-employee relationships are what Akerlof had in mind
when he was originally writing about gift-exchange. It is therefore especially valuable to see that
strong positive reciprocity is present in such an environment. However, from an experimental
point of view, the long term interaction of firms and workers makes it difficult to determine
whether gift exchange is occurring due to subject preferences, game theoretic concerns (e. g.,
90 Note that the average number of letters packed per hour in the positive reciprocity treatment is essentially the same as in the under a piecework treatment paying $6.50 per hour plus $0.15 per envelope, so that the positive reciprocity treatment may have been up against an upper bound on the extent towhich they could have provided higher output in response to the higher wage rate. 91 The authors also look at error rates finding no difference in critical and non-critical error rates per envelope between the positive reciprocity treatment and the control treatment, but a statistically significant increase in “recording errors” (an “ancillary administrative task that has no direct effect on the usefulness of packed envelopes”) in the positive reciprocity treatment and the 2-day $8 wage control treatment. However, inspection of the raw data shows that the 2-day $8 control treatment error rate on this dimension is substantially smaller than in all the other treatments including the 1-day $8 wage control treatment.
69
maintaining reputations, avoiding punishment in a supergame), or some combination thereof.92
This illustrates a general problem with the field studies of gift exchange, as workers may think
they are playing a different game than the experimenter has in mind – even temporary workers
may believe there is the possibility of a long term relationship.93
The varying results across papers suggest that drawing any strong conclusions about gift
exchange in field settings would be premature. While it seems clear that gift exchange can occur
in field settings and/or with real effort tasks, both the timing of gift exchange effects and the
relative strengths of positive and negative reciprocity vary across studies. 94 In sorting out the
effects of gift exchange it would be useful to employ experimental designs that include a
baseline measure of ability, as in the Jeffrey (2009) study reported on below, rather than relying
on random assignment in order to equalize ability across treatments. Also there is no doubt that
some of the variability in field experiments as compared to laboratory data has to do with the
relative lack of control in field settings as workers in can respond to incentives along multiple
dimensions; and the investigator does not know the cost of effort, the perceived benefits of effort
to the employer or the game that the employees think they are playing.
On these last points Hennig-Schmidt et al. (2010) report a field experiment designed to
assess the effect of own and peer wage variations on effort levels of hourly employees, reporting
no impact to an increase in own wage, nor to positive or negative peer comparisons in wages.
They then go on to address the question of whether information on employer’s cost and surplus,
which is available in laboratory experiments, but is absent in field experiments, could be the
cause of their null effects. They study a real-effort work situation in the lab that closely
resembles their field experiment – folding a letter and enveloping it. The work task was divided
into two 15 minute intervals with a 5 minute break in between.
92 Bellemare and Shearer partially address this question by controlling for whether or not a worker returned to the firm in the year following the experiment. If repeated-game effects drive responses, and workers know whether or not they will be returning, then significant response should only be observed in workers who return. While returning workers provide greater effort, indicating that repeater-play game effects are present, reciprocity is still positive and significant among the workers who did not return. 93 See Cohn, Fehr, and Goette (2007) for an experiment that measures players’ fairness perceptions in a field experiment. 94 Rotemberg (2006) summarizes field data supporting the idea that negative reciprocity is stronger than positive reciprocity. Lab experiments with the moonlighting and related games yield mixed results: Offerman (2002) reports much stronger negative reciprocity to hurtful actions than the positive reciprocity to helpful actions. Cox, Sadiraj, and Sadiraj (2008) report significant support for positive reciprocity, but mixed support for negative reciprocity. Falk, Fehr and Fishbacher (2008) find significant support for both positive and negative reciprocity.
70
Hennig-Schmidt et al. employ a 2x2 design: Along one dimension they vary whether or not
there is a 10% increase in wages in the second 15 minute interval. The other dimension of the
design varies whether or not employees have information about employers’ surplus from the
work. Information about employer’s benefits came in the form a table showing the employer’s
average cost per letter, depending on the number of envelopes filled per work unit, along with
explicitly stating the breakeven production level for each of the two wage rates compared to
outsourcing the work.
Calculating differences in individual worker output between the first and second work
periods, there is a significant increase in output in all treatments. But the change in the average
output from increasing wages is not statistically significant, when employees are not informed
about employers’ surplus (p = 0.24; an average difference of 0.1 envelopes). When employees
are informed, the effect of the wage hike increases and becomes statistically significant (p =
0.04; an average difference of 6.7 envelopes). These interesting results are consistent with the
common sense idea that information is required to elicit reciprocal responses, and clearly
deserves accounting for (and replicating) in future studies.
In an experiment related to the occurrence of gift exchange in field settings, Kube et al.
(2012) look at the effect of a gift in kind versus a monetary gift of equal value. The job task is
similar to the one reported in Kube et al. (2013). There were three treatments in this new
experiment: (1) A money treatment in which subject’s total wage was increased unexpectedly by
20%. (“We have a further small gift to thank you: You receive €7 in addition.”), (2) A gift
treatment in which subjects received a thermos bottle worth €7 wrapped in transparent gift paper.
(“We have a further small gift to thank you: You receive this thermos bottle in addition.”) and
(3) A gift treatment the same as above where the bottle came with a statement regarding its price:
“We have a further small gift to thank you: You receive this thermos bottle worth €7 in addition.
Figure 18 reports their results. Clearly, both the bottle treatment and the bottle treatment with
the price tag yield higher output levels than the money only treatment.95 To track down an
explanation for this effect Kube et al. supplement their results with a survey outlining the three
treatments to determine how the gift was perceived. The survey results indicate that the thermos
bottle is significantly more likely to signal kind intentions than the wage increase. However,
when given a straight up choice between the thermos or the money, subjects overwhelmingly
95 There were no differences in the quality of the work produced under the different treatments
71
(92.4%) preferred the money! One thing to keep in mind here is that the amount of money
involved here, €7, is relatively small, and that a gift in place of a small monetary payment is
certainly considered much more appropriate in number of settings. It is also worthwhile noting
that these results have an analogue in field data as there is an entire industry with its own
research foundation devoted to providing bonuses in the form of gifts (typically travel vacations)
to more productive workers.96 This appears to be a win-win situation as it may be cheaper for the
employer to provide a gift rather than cash and more valued by the employee at least for
moderate size bonuses (but less so for employees for major bonuses).97
[Insert Fig 18 here]
There is a beautiful earlier paper reported in the management science literature looking at the
motivational power of noncash versus cash incentives on a real effort task (Jeffrey, 2009).98
Subjects consisted of University of Chicago (nonfaculty) support staff. The experimental task
was a word game known as “Word Prospector” in which subjects had to create as many 4- to 6-
letter words as possible using a 10 letter target word. There was a strategic element involved as
well with participants allowed to switch between three words of varying difficulty. A within
subject design was used with an initial 10 minute period in which everyone was working on the
basis of the $10 participation fee, with no knowledge that they would have an opportunity to earn
additional rewards in a second 10 minute period. Rewards in the second period were tiered,
increasing in value as performance increased (e.g., those achieving a score in the 20th percentile
or higher would earn $2 or a fancy candy bar worth $2). Payoffs available at the highest level of
performance (95th percentile) consisted of $100 in the cash treatment or a coupon worth
approximately $100 for a massage at a spa or a 1.5 hour massage at their home. Subjects were
told the value of the noncash prizes to control for the possibility that participants had inflated
perceived values for these incentives. There was also a control group that performed the task
twice without any additional incentives.
Effectiveness was measured in terms of the improvement in subject performance relative to
the control group, using a regression that controlled for income and demographic characteristics.
96 See the Incentive Research Foundation. Michael Arkes, CEO of Hinda Incentives notes that “Corporate managers often decide to use non-cash vs. cash awards because it is the better choice for their company, that is it will cost them less and/or it is more effective.” 97 For example, Ohio State’s basketball coach recently received a bonus in the form a million dollar cash award with a number of doctors in the medical complex at the Ohio State University receiving six figure cash bonuses. 98 We are grateful to Hal Arkes for calling this paper to our attention.
72
Participants in the cash treatment improved by 17.6 points compared to the control treatment (p <
0.05), with the noncash treatment improving 47.2 points compared to the control treatment (p <
0.01 compared to the control and the cash treatments). Although there was no significant main
effect for income, as might be expected performance decreased significantly as income increased
in both incentive treatments. Participants in the noncash condition were asked a follow-up
question rating their level of agreement on a 7-point Likert-type scale with whether they would
prefer to receive the cash value of the prize or the prize itself, with 8 strongly agreeing, 6
agreeing (5 or 6 on the Likert scale), 4 disagreeing (score of 2 or 3) and none strongly
disagreeing. This inconsistency between performance in the noncash incentive treatment relative
to straight up comparative preference is rationalized in on the basis of “justifiability”; namely
earning a luxurious item rather than purchasing it would make it easier to justify consumption of
a good that they would not otherwise buy.99 To test this hypothesis subjects in the noncash
treatment were asked to evaluate the statement “It would be hard for me to justify purchasing a
massage such as the one offered as an award” on a 7-point Likert type scale, with the mean
response significantly higher than the neutral response. These Likert scores were then regressed
against the residuals in the regression used to evaluate the treatment outcomes, with the
justifiability scores having a significant positive effect on performance. Finally, what is notable
about this real effort task compared to several of the others reported on here, is the use of a
within subject design that controls for differences in inherent ability at the task at hand.
Summary: The evidence from field experiments on gift exchange is mixed. This sub-literature
illustrates both the strengths and weaknesses of field experiments. The subjects in these studies
do not know they are in an experiment, the tasks they are being asked to perform parallel those
they would normally perform, and, in some cases, the experiment takes place in the context of a
longer term relationship. As such, these experiments should be less prone to demand induced
effects than laboratory experiments and also should have a closer relationship to the field setting
that authors like Akerlof had in mind. However, the cost of this verisimilitude is high. There is
a tremendous loss of control in these experiments, as we neither know the cost of effort, the
perceived benefits of effort to the employer, nor the game that the employees think they are
playing. Measurement is a problem in many of these studies as workers in field settings can
99 Also see Shaffer and Arkes (2009) for more on preference reversals when comparing a cash to an equivalent noncash incentive, as opposed to evaluating them separately.
73
respond to incentives along multiple dimensions, so that the experimenter may miss important
elements of employees’ responses to a gift. Also one must take account of the level of baseline
wages relative to market wages for comparable work as higher than normal baseline wages may
already elicit a strong gift response. For example, in Kube et al. (2013) the baseline wage was
€15 while the average wage in previous work for the subjects was around €10.50 so that the
subjects could have already been performing at higher effort levels due to positive reciprocity in
the control treatment. As the authors note, this in conjunction with increasing marginal effort
levels could fully account for the lack of overall statistical significance in the pay increase
treatment. Cohn et al. (in press) also note that these factors may impose a ceiling resulting in a
downward bias in the response to the gift wage treatment.100 Finally, while it is clear that
subjects in a laboratory choosing numbers to represent effort are performing a substantially
different task than a worker planting trees in British Columbia, it is not so clear that one of these
cases is closer than the other to the situation of stock-brokers working in a Boston office. All
settings have specific elements which may affect behavior.
G. Summary
The experimental literature on gift-exchange has been highly influential, and deservedly
so. Even if gift exchange does not always occur in either laboratory or field studies, it occurs
often enough and is strong enough to be an important phenomenon. It remains an important
question to determine why gift exchange manifests itself in some settings and not in others. We
conjecture that the answer to this question will largely be economic in nature, relating to the
costs of reciprocity and the game that subjects perceive they are playing. With respect to the
latter, it would be interesting to know if the experience effects reported in HKM are due to
changes in preferences that MBAs undergo as a result of prior work experience compared to
undergraduates, or to perceived differences in the game being played. Finally, an important open
issue is how gift exchange will work when multiple avenues of reciprocity are open. Will
employees focus on the cheapest method of reciprocating, or will they also consider the benefits
to employers in determining how to reward the gift of above market wages?
Conclusions
The experimental literature on other-regarding behavior has been extraordinarily rich and
abundant over the past fifteen years, and will no doubt continue to be going forward. The
100 Unfortunately, the relationship of baseline wages to market wages is not always reported.
74
present survey is selective as there are many fine papers that we could have, at the risk of
completely overwhelming readers, reviewed. Rather our goal has been to cover the range of
research, to identify some of the highlights as well as some of the deficiencies in the existing
literature, and to make some heretofore overlooked connections between different branches of
the literature.
There have been some clear successes in the past fifteen years or so: there now exist well -
developed theories of outcome based preferences and reciprocity, an increasingly detailed picture
is developing of when other-regarding behavior is and is not likely to occur, and, particularly
through the literature on gift-exchange, it is becoming increasingly clear why the laboratory
studies of other-regarding behavior are important to mainstream economists. There are also a
number of issues that remain to be resolved in this literature: It is clear that none of the existing
models fully capture the determinants of other-regarding behavior, and those that attempt to
threaten to lose tractability. There is a tremendous amount of procedural variation in studies that
aim to look at similar phenomena. In particular, there is an over reliance on the strategy method
with their one-shot “what if” approach as opposed to behavior resulting from experienced play.
It is also clear that other-regarding behavior can be quite sensitive to the context in which it is
studied which makes it difficult to determine how results will generalize from one setting to
another.
One way we could have concluded this chapter is by giving a laundry list of important
questions that remain open. We’re not going to do that since the exercise would be a bit like a
broker giving stock tips – if the research ideas were really good, why would we be sharing them?
We could take one final stab at what it all means, but at this point in time it’s not entirely clear,
as the literature on other-regarding behavior has a long way to go yet.
Instead, we thought it would be fun to take the unusual step of each of us giving a list of
eight papers from this literature that every experimental economist should read, even if they read
nothing else. Given the many papers that have been written on the topic it can be hard to see the
forest for the trees, and the literature on other-regarding behavior and preferences has a lot of
trees. So here are our-- admittedly idiosyncratic-- takes on what you should read and why. Feel
free to be offended, as any such list is certain to miss important papers and becomes incomplete
within moments of being written (this list was initially compiled in 2008 and does not reflect
later papers). We are limiting ourselves to papers not covered in the earlier Handbook of
75
Experimental Economics (1995) and, just to avoid an obvious incentive problem, neither of us
will choose papers on which we were co-authors.
Cooper’s Elite Eight
1) Fehr and Schmidt (1999)/Bolton and Ockenfels (2000): The two most important models
of outcome based preferences. These tie together much of the preceding literature and
place a literature that often felt like bad pop psychology on a firm foundation of
economic theory. Which paper should take pride of place? Flip a coin.
2) Blount (1995): An elegant experiment that makes it completely obvious why outcome
based preferences are not enough.
3) Charness and Rabin (2002): The most influential model of other-regarding behavior that
incorporates psychological game theory, plus an important generalization of existing
models of outcome based preferences that moved the literature beyond inequality
aversion. Read the working paper version – it’s better than the published version.
4) Fehr, Kirchsteiger, and Riedl (1993): If there is any one reason why economists who are
not experimenters should care about other-regarding behavior, the literature on gift-
exchange is it. This is the paper that started this strand of research in experimental
economics.
5) Andreoni and Miller (2002): This paper shows that the standard economic theory we all
learned in our first semester of graduate school still remains relevant in the brave new
world of other-regarding preferences.
6) Kagel and Wolfe (2001): This illustrates one of the biggest problems in the literature on
other-regarding behavior and preferences – who is the “other”?
7) Dana, Weber, and Kuang (2007): This paper is one of a group of papers that elegantly
and persuasively establishes the idea that other-regarding behavior, particularly in
dictator game, can be quite sensitive to how subjects think their actions will be perceived,
both by themselves and others. These papers vividly illustrate the delicacy of dictator
game results, hopefully putting an end to the misuse of that particular instrument. John
picks the other papers in this group below, but I like this one best. Read them all – taken
together they provide a strong critique of over-reliance on dictator game experiments.
76
8) Xiao and Houser (2005): It has communication, so how could it possibly not be
interesting? More to the point, a weakness of the literature on other-regarding behavior is
that individuals are invariably given only a single method of rewarding and punishing
others. This paper illustrates how much outcomes might change when a richer and more
realistic set of options is available.
Kagel’s Elite Eight:
1.) Fehr and Schmidt (1999)/Bolton and Ockenfels (2000): It was clear at the time that both
these papers were written that they had to be “wrong”, but as one of my old teachers used
to say “wrong in the right way.” Both papers pulled together a large number of
experimental studies into a coherent framework without having to ignore too many
inconsistencies. They motivated a host of new experiments which have enriched our
understanding of behavior.
2.) Blount (1995): This was the first paper to make it clear that intentions mattered.
3.) Charness and Rabin (2002): This has been one of the more influential psychological
game theoretic models of other-regarding behavior. It also introduced the notion of
maximin preferences and taste for efficiency which set off a number of new experiments
exploring these issues.
4.) Oberholzer-Gee and Eichenberger (2008): This paper had actually been around in one
form or another for quite some time. It was one of the first papers demonstrating the
instability of dictator game choices as opposed to what the game was originally intended
to do – provide a clean test of the hypothesis that near equal splits in the ultimatum game
were not a result of Proposers trying to be fair to Responders, but rather a strategic
response to anticipated rejections of low offers. Runner up here would be Dana, Cain
and Dawes (2006).
5.) Prasnikar and Roth (1992): I’ve broken the rules with this one as it was covered in the
previous Handbook. It’s an experiment demonstrating that out-of-equilibrium play drives
behavior in the ultimatum game by highlighting the differences in out-of-equilibrium
play with the best shot game which does converge to the subgame perfect equilibrium. It
is the forerunner to the more general learning models covered in Section III.H.
77
6.) Fehr, Kirchsteiger, and Riedl (1998): This is a nice summary of the gift exchange
literature up to this point in time.
7.) Cox (2004): You need to read at least one paper on the trust game. This is a good one
that uses a clever experimental design to start to tease apart the motivations in the game.
8.) Reader’s choice: There are just too many relevant papers written and yet to be written on
regarding preferences. I suggest the reader pick a paper whose results do not square with
their intuition and read it carefully. It may just suggest an experiment of your own!
1
References
Abbink, Klaus, G. Bolton, Karim Sadrieh, and Fang-Fang Tang. 2001. Learning versus punishment in ultimatum bargaining. Games and Economic Behavior, 37, 1-25. Afriat, Sidney N. 1972. Efficiency estimation of production functions. International Economic Review, 13, 568-598. Al-Ubaydli, O., S. Andersen, U. Gneezy, and John A. List. 2008. For love or money? Testing non- pecuniary and pecuniary incentive schemes in a field experiment. Working Paper, University of Chicago. Akerlof, George. 1982. Labor contracts as partial gift exchange. Quarterly Journal of Economics,
97, 543-69.
Akerlof, George A. and Rachel E. Kranton. 2000. Economics and identity. The Quarterly Journal of Economics, 115 (3), 715-753.
Andersen, S., S. Ertaç, U. Gneezy, M. Hoffman and J.A. List. 2011. Stakes matter in the ultimatum game. American Economic Review, 101, 3427-3439.
Anderson, Jon, et al., 2012. Self-selection and variations in the laboratory measurement of other-regarding preferences across subject pools: evidence from one college student and two adult samples. Experimental Economics, 15 (1), 1-20. Anderson, Jon, Stephen Burks, Colin De Young, and Aldo Rustichini. 2011. Toward the Integration
of Personality Theory and Decision Theory in Explanation of Economic Behavior,. Unpublished manuscript. Presented at the IZA workshop: Cognitive and non-cognitive skills.
Anderson, L.R., Y.V. Rodgers, and R. R. Rodriguez. 2000. Cultural differences in attitudes toward bargaining. Economics Letters, 69, 45-54. Andreoni, James and B. Douglas Bernheim. 2009. Social image and the 50-50 norm: A Theoretical and Experimental Analysis of Audience Effects, Econometrica 77(5),1607-1636. Andreoni, James, Brown, Paul, and Lise Vesterlund. 2002. What Produces Fairness? Some Experimental Results. Games and Economic Behavior, 40, 1-24. Andreoni, James, Castillo, Marco, and Ragan Petrie. 2009. Revealing preferences for fairness in
ultimatum bargaining. Korean Economic Review, 25(1), 35-64 (also appeared in NAJ Economics, 9(4), 2005)
2
Andreoni, James and John H. Miller. 2002. Giving according to GARP: An experimental study of rationality and altruism. Econometrica, 70, 737-53. Andreoni, James and Emily Blanchard. 2006. Testing subgame perfection apart from fairness in ultimatum games. Experimental Economics, 9, 307-321. Armantier, Olivier. 2006. Do wealth differences affect fairness considerations? International Economic Review, 47, 391-429. Baran, Nicole M., Paola Sapienza, and Luigi Zingales. 2009. Can we infer social preferences from
the lab? Evidence from the trust game.. Chicago Booth Research Paper No. 10-02. Bardsley, Nicholas. 2008. Dictator game giving: Altruism or artifact? Experimental Economics, 11, 122-133. Baron, D. P. and J. A. Ferejohn. 1989. Bargaining in legislatures. American Political Science Review, 83, 1181-1206. Bartling, Björn and Urs Fischbacher. 2012. Shifting the blame: on delegation and responsibility,
Review of Economic Studies,79(1), 67-87. Bartling, Björn, Ernst Fehr, and Klaus Schmidt. 2012. Discretion, Productivity, and Work Satisfaction. Available at SSRN 2096838. Battigalli, Pierpaolo and Dufwenberg, Martin. 2009. Dynamic Psychological Games. Journal of Economic Theory, 144, 1-35. Becker, Anke, Thomas Deckers, Thomas Dohmen, Armin Falk, and Fabian Kosse. 2012. The Relationship Between Economic Preferences and Psychological Personality Measures.
Annual Review of Economics 4, 453–478 Bellemare, Charles and Bruce Shearer. 2008. "Gift Giving and Worker Productivity: Evidence from a Firm Level Experiment,” Games and Economic Behavior.67 (2008), 233-244. Bellemare, Charles and Sabine Kröger. 2007. On representative social capital. European Economic
Review, 51 (1), 183-202. Benjamin, Daniel. J, Choi, James. J.,and Geoffrey Fisher. 2013 Religious identify and economic
behavior. Cornell University mimeo. Benjamin, Daniel. J, Choi, James. J., and Strickland, A. Joshua. 2010. Social identity and
preferences. The American Economic Review, 100 (4), 1913-1928. Bernhard, Helen, Fehr, Ernst and Urs Fischbacher. 2006. Third‐Party Punishment Within and
Across Groups: An Experimental Study in Papua New Guinea.” American Economic Review, 96(2), 217-221.
3
Bereby-Meyer, Yoella and Muriel Niederle. 2005. Fairness in bargaining. Journal of Economic Behavior and Organization, 56, 173-186. Berg, Joyce E., John Dickhaut, and Kevin McCabe. 1995. Trust and reciprocity, and social history. Games and Economic Behavior, 10, 122-42. Bewley, Truman, 1998. Why not cut pay? European Economic Review, 42, 459-90. Blanco, Mariana, Dirk Engelmann, and Hans-Theo Normann.2011. A Within-subject analysis of
other-regarding preferences. Games and Economic Behavior 72(2), 321-338 Blount, Sally. 1995. When social outcomes aren’t fair: The effect of causal attributions on preference. Organizational Behavior and Human Decision Processes, 63, 131-44. Bolton, Gary E. and Axel Ockenfels. 2006. Inequality aversion, efficiency, and maximin preferences in simple distribution experiments: Comment. American Economic Review, 96, 1906-1911. Bolton, Gary E., Jordi Brandts, and Axel Ockenfels 2005. Fair procedures: Evidence from games involving lotteries. Economic Journal, 115, 1054-1076. Bolton, Gary E. and Axel Ockenfels. 2000. ERC: A theory of equity, reciprocity and competition. American Economic Review, 90, 166-193. Bolton, Gary E. and Axel Ockenfels. 1998. An ERC-analysis of the Güth-van Damme game. Journal of Mathematical Psychology, 42, 215-226. Bolton, Gary E. and Rami Zwick. 1995. Anonymity versus punishment in ultimatum bargaining, Games and Economic Behavior, 10, 95-121. Bolton, Gary E. 1991. A comparative model of bargaining: Theory and evidence. American Economic Review, 81, 1096-1136. Brandts, Jordi and Gary Charness. 2000. Hot vs. cold: Sequential responses and preference stability in experimental games. Experimental Economics, 2, 227-238. Brandts, Jordi and Gary Charness. 2011. The strategy versus the direct-response method: a first
survey of experimental comparisons. Experimental Economics, 14(3), 375-398. Brandts, Jordi and C. Solà. 2001. Reference points and negative reciprocity in simple sequential games. Games and Economic Behavior, 36, 138-157. Brandts, Jordi and Gary Charness. 2003. Truth or consequences: An experiment. Management Science, 49, 116-130. Borghans, L., A.L. Duckworth, J.J. Heckman, and B.T. Weel. 2008. The Economics and
4
Psychology of Personality Traits, Journal of Human Resources, 43, 972-1059. Brosig, J., Weimann J. and C-L Yang. 2003. The hot versus cold effect in a simple bargaining experiment. Experimental Economics, 6, 75-90. Brosig, Jeannette, Thomas Riechmann, and Weimann Joachim. 2007. Selfish in the end?: An investigation of consistency and stability of individual behavior. University of
Magdeburg, Department of Economics. MPRA Paper No. 2035 Brown, Martin, Armin Falk, and Ernst Fehr. 2004. Relational contracts and the nature of market interactions. Econometrica, 72, 747-80. Camerer, Colin F. 2003. Behavioral Game Theory. Princeton University Press. Cameron, Lisa A. 1999. Raising the stakes in the ultimatum game: Experimental evidence from Indonesia. Economic Inquiry, 27, 47-59. Campbell III, Carl M. and Kunal S. Kamlani. 1997. The reasons for wage rigidity: Evidence from a survey of firms. Quarterly Journal of Economics, 112, 759 –790. Carpenter, Jeffrey, Connolly, Cristina and Caitlin Myers. 2008. Altruistic Behavior in a
Representative Dictator Experiment. Experimental Economics, 11(3), 282-298. Carpenter, Jeffrey and Erika Seki. 2011. Do social preferences increase productivity? Field experimental evidence from fishermen in Toyama Bay. Economic Inquiry, 49 (2), 612-630. Casari, Marco and Timothy Cason. 2009. The strategy method lowers measured trustworthy behavior. Economic Letters Economics Letters 103, pp. 157-159 Charness, Gary and Mathew Rabin. 2002. Understanding social preferences with simple tests. Quarterly Journal of Economics, 117, 817-69. Charness, Gary and Martin Dufwenberg. 2006. Promises and partnership. Econometrica, 74 (6),
1579-1601. Charness, G., L. Rigotti and A. Rustichini. 2007. Individual behavior and group membership.
American Economic Review, 97(4), 1340-1352. Chen, Yan and Sherry Xin Li. 2009. Group Identity and Social Preferences. American Economic
Review, 99 (1), 431-457. Cherry, Todd L., Peter Frykblom, and Jason F. Shogren. 2002. Hardnose the dictator. American Economic Review, 92, 1218-1221. Cleave, Blair L., Nikos Nikiforakis, and Robert Slonim. 2013. Is there selection bias in laboratory
experiments? The case of social and risk preferences. Experimental Economics, 16(3), 372-382
5
Coffman, Lucas. 2011. Intermediation Reduces Punishment (and Reward), American Economic Journal: Microeconomics, 3, 77-106. Cohn, A., Ernst Fehr, and L. Goette. (in press). Fair Wages and Effort Provision: Combining
Evidence from the Lab and the Field Gift, Management Science. Cooper, David J. and Dutcher, E. Glenn.2011. The Dynamics of Responder Behavior in
Ultimatum Games: A Meta-study. Experimental Economics, 14 (4), pp. 519-546
Cooper, David and John Lightle. 2012. The Gift of Advice: Communication in a Bilateral Gift Exchange Game. Experimental Economics (forthcoming).
Cooper, David J. and Carol Stockman. 2002. Fairness and learning in a step-level public goods game. Games and Economic Behavior, 41, 26-45. Cooper, David J. and John Van Huyck. 2003. Evidence on the equivalence of the strategic and extensive form representation of games. Journal of Economic Theory, 110, 290-308. Cooper, David J., Nick Feltovich, Alvin E. Roth, and Rami Zwick. 2003. Relative versus absolute speed of adjustment in strategic environments: Responder behavior in ultimatum games. Experimental Economics, 6, 181-207. Cox, Caleb, Jones, Matthew, Pflum, Kevin E. and Paul, J. Healy. 2012. Revealed reputations in the
finitely-repeated prisoner’s dilemma. Unpublished manuscript. Cox, James C. 2004. How to identify trust and reciprocity. Games and Economic Behavior, 46, 260-281. Cox, James C., Daniel Friedman, and Steve Gjerstad. 2007. A tractable model of reciprocity and fairness. Games and Economic Behavior, 59, 17-45. Cox, James C., Daniel Friedman, and Vjollca Sadiraj. 2008. Revealed altruism. Econometrica, 76, 31-70. Cox, James C., Klarita Sadiraj, and Vjollca Sadiraj. 2008. Implications of trust, fear, and
reciprocity formodeling economic behavior. Experimental Economics, 11, 1-24. Croson, Rachel and Uri Gneezy, 2009. Gender Differences in Preferences, Journal of Economic Literature, 47, pp. 448-474. Croson, Rachel, Melanie Marks, and Jessica Snyder. 2008. Groups work for women: Gender and
group identity in social dilemmas. Negotiation Journal, 24(4), 411-427. Dana, Jason, Roberto A. Weber and Jason Xi Kuang. 2007. Exploiting ‘moral wiggle
room’:Experiments demonstrating an illusory preference for fairness. Economic Theory 33(1). 67-80.
6
Dana, Jason, Daylian M. Cain, and Robyn M. Dawes. 2006. What you don’t know won’t hurt me: Costly (but quiet) exit in dictator games. Organizational Behavior and Human Decision Processes, 100, 193-201. Dohmen, Thomas and Armin Falk. 2011. Performance Pay and Multidimensional Sorting:
Productivity, Preferences, and Gender. American Economic Review, 101, 556-590. Dohmen, Thomas, Armin Falk, David Huffman, Uwe Sunde, 2010. Are Risk Aversion and
Impatience Related to Cognitive Ability?, American Economic Review, 100(3): 1238-1260. (working paper version, ROA-RM-2009/7)
Duffy, John and Nick Feltovich. 1999. Does observation of others affect learning in strategic environments? An experimental study. International Journal of Game Theory, 28, 131-152. Dufwenberg, M., and G. Kirchsteiger. 2004. A theory of sequential reciprocity. Games and
Economic Behavior, 47, 268-98. Eckel, Catherine C. and Philip J. Grossman. 2005. Managing diversity by creating team identity.
Journal of Economic Behavior & Organization, 58 (3), 371-392 Eckel, Catherine C. and Philip J. Grossman. 2000. Volunteers and pseudo-volunteers: the effect of
recruitment method in dictator experiments. Experimental Economics, 3(2), 107-120. Ellingsen, Tore and Magnus Johannesson. 2008. Pride and prejudice: The human side of incentive
theory. American Economic Review, 98, 990-1008. Ellingsen, Tore, Magnus Johannesson, Sigve Tjøtta, and Gaute Torsvik. 2010. Testing Guilt
Aversion. Games and Economic Behavior, 68, 95-107. Engelmann, D. and Martin Strobel. 2006. Inequality aversion, efficiency, and maximum preferences in simple distribution experiments: Reply American Economic Review, 96, 1918-1923. Engelmann, D. and Martin Strobel. 2004. Inequality aversion, efficiency, and maximum preferences in simple distribution experiments. American Economic Review, 94, 857-869. Falk, Armin, Ernst Fehr, and Urs Fischbacher. 2003 On the nature of fair behavior. Economic
Inquiry, 41, (1) 20-26 Falk, Armin, Stephan Meier, and Christian Zehnder. 2013. Do lab experiments misrepresent social
preferences? The case of self-selected student samples. Journal of The European Economic Association.11 (4) 839-852
Falk, Armin and Urs Fischbacher. 2006. A theory of reciprocity. Games and Economic Behavior, 54, 293-315.
7
Falk, Armin, Ernst Fehr, Urs Fischbacher. 2008. Testing theories of fairness—Intentions matter. Games and Economic Behavior, 62, 287-303. Falk, Armin and M. Kosfeld. 2006. The hidden costs of control. American Economic Review, 96(5), 1611-30. Fehr, Ernst and Armin Falk. 1999. Wage rigidity in a competitive incomplete contract market. Journal of Political Economy, 107, 106-34. Fehr, Ernst, Naef, Michael, and Klaus M. Schmidt. 2006. Inequality Aversion, Efficiency, and
Maximin Preferences in Simple Distribution Experiments: Comment. The American Economic Review, 96 (5), 1912-1917
Fehr, Ernst and Klaus M. Schmidt. 2006. The economics of fairness, reciprocity and altruism – experimental evidence and new theories. Handbook on the Economics of Giving, Reciprocity and Altruism, ed. by. Serge-Christophe Kolm and Jean Mercier Ythier. Fehr, Ernst, Oliver Hart, and Christian Zehnder. 2011. Contracts as reference points: Experimental
evidence. American Economic Review 101, (2),493-525. Fehr, Ernst and Simon Gächter. 2002. Do incentive contracts undermine voluntary cooperation? University of Zurich, Institute for Empirical Research in Economics, Working Paper #34. Fehr, Ernst and Bettina Rockenbach. 2003. Detrimental effects of sanctions on human altruism. Nature, 442, 137-140. Fehr, Ernst, Rützler, Daniela and Matthias Sutter, 2011. The development of egalitarianism, altruism, spite and parochialism in childhood and adolescence. CESifo Working Paper Series 3361, CESifo Group Munich. Fehr, Ernst and Klaus M. Schmidt. 1999. A theory of fairness, competition and cooperation. Quarterly Journal of Economics, 114, 817-68. Fehr, Ernst, Simon Gächter, and Georg Kirchsteiger. 1997. Reciprocity as a contract enforcement device. Econometrica, 65, 833-60. Fehr, Ernst and John A. List. 2004. The hidden costs and returns of incentives—trust and
trustworthiness among CEOs. Journal of the European Economic Association, 2 (5), 743-771.
Fehr, Ernst, Georg Kirchsteiger, and Arno Riedl. 1993. Does fairness prevent market clearing? An experimental investigation. Quarterly Journal of Economics, 108, 437-60. Fehr, Ernst, Georg Kirchsteiger, and Arno Riedl. 1998. Gift Exchange and Reciprocity in Competitive
Experimental Markets, European Economic Review 42, 1-34.
8
Fehr, Ernst, Kirchler, Erich, Weichbold, Andreas, and Simon Gächter. 1998. When social norms overpower Competition. Journal of Labor Economics, 16, 324-351.
Fershtman, Chaim and Uri Gneezy. 2001. Discrimination in a segmented society: An experimental approach. Quarterly Journal of Economics, 116, 351-377. Fischbacher, Urs, Cristina M. Fong, and Ernst Fehr. 2009. Fairness, errors and the power of
competition. Journal of Economic Behavior & Organization, 72 (1), 527-545. Fisman, Raymond, Shachar Kariv, and Daniel Markovits. 2007. Individual preferences for giving. American Economic Review, 97, 1858-1876. Forsythe, Robert, Joel L. Horowitz, N.E. Savin, and Martin Sefton. 1994. Fairness in simple bargaining experiments. Games and Economic Behavior, 6, 347-369. Fréchette, Guillaume R. 2012. Session‐Effects in the Laboratory. Experimental Economics,
15(3), 485‐498. Fréchette, Guillaume R., John H. Kagel, and Massimo Morelli. 2005a. Behavioral identification in coalitional bargaining: An experimental analysis of demand bargaining and alternating offers. Econometrica, 73, 1893-1938. Fréchette, Guillaume R., John H. Kagel, and Massimo Morelli. 2005b. Nominal bargaining power, selection protocol and discounting in legislative bargaining. Journal of Public Economics, 89, 1497-1517. Fréchette, Guillaume R., John H. Kagel, and Massimo Morelli. 2012. Pork versus public goods: An
experimental study of public good provision within a legislative bargaining framework. . Economic Theory, 49, (3) pp. 779-800
Gale, John, Kenneth Binmore, and Larry Samuelson. 1995. Learning to be imperfect: The ultimatum game. Games and Economic Behavior, 8, 56-90. Geanakoplos, John, David Pearce, and Ennio Stacchetti. 1989. Psychological games and sequential
rationality. Games and Economic Behavior, 1(1), 60-79. Glaeser, Edward, David Laibson, Jose Scheinkman, and Christine Soutter. 2000. What is social capital? The determinants of trust and trustworthiness. Quarterly Journal of Economics, 115, 811-46. Gneezy, Uri. 2004. Do high wages lead to high profits? An experimental study of reciprocity using real effort. University of Chicago, Graduate School of Business, Working Paper. Gneezy, Uri and J. List. 2006. Putting behavioral economics to work: Field evidence of gift exchange. Econometrica, 74, 1365-84.
9
Goette, Lorenz, David Huffman, and Stephan Meier. 2006. The impact of group membership on cooperation and norm enforcement: Evidence using random assignment to real social groups. The American Economic Review, 96, 212-216.
Grimm, Veronika and Friederike Mengel. 2011. Let me sleep on it: Delay reduces rejection rates in
ultimatum games. Economics Letters, 111. 113-115. Güth, Werner and Eric van Damme. 1998. Information, strategic behavior and fairness in ultimatum bargaining: An experimental study. Journal of Mathematical Psychology, 42, 227-47. Hamman, John, George Loewenstein and Roberto A. Weber. 2010. Self-interest through delegation: An additional rationale for the principal-agent relationship. The American Economic Review. 100(4). 1826-1846. Hannan, R. Lynn. 2005. The combined effect of wages and firm profit on employee effort. The Accounting Review, 80, 167-188. Hannan, R. Lynn, John Kagel, and Donald Moser. 2002. Partial gift exchange in experimental labor markets: Impact of subject population differences, productivity differences, and effort requests on behavior. Journal of Labor Economics, 20, 923-51. Harrison, Glenn W. and J. Hirshleifer. 1989. An experimental evaluation of weakest link/ best shot models of public goods. Journal of Public Economy, 97, 201-225. Healy, Paul J. 2007. Group reputations, stereotypes, and cooperation in a repeated labor market. American Economic Review, 97, 1751-1773. Hennig-Schmidt, Heike, Bettina Rockenbach, and Abdolkarim Sadrieh. 2010. In search of workers’
real effort reciprocity, a field and a laboratory experiment. Journal of the European Economic Association, 8, 817-837.
Henrich, Joseph, et. al., 2005. “Economic man” in cross-cultural perspective: Behavioral experiments in 15 small-scale societies. Behavioral and Brain Sciences, 28, 795-855. Henrich, Joseph, Robert Boyd, Samuel Bowles, Colin Camerer, Ernst Fehr, Herbert Gintis, and Richard McElreath. 2001. In search of homo economicus: Behavioral experiments in 15 small-scale societies. American Economic Review, 91, 73-78. Herrmann, Benedikt, Thöni, Christian and Simon Gächter. 2008. Antisocial Punishment Across
Societies. Science, 319 (5868), 1362-1367. Hoffman, M and J. Morgan. 2010. Who’s naughty? Who’s nice? Social preferences in online industries. University of California, Berkeley, Manuscript,
http://faculty.haas.berkeley.edu/rjmorgan/NaughtyOrNice.pdf. Jeffrey, Scott A. 2009. Justifiability and the Motivational Power of Tangible Noncash Incentives, Human Performance, 22, 143-155.
10
John, Oliver P., Naumann, Laura, P., and Christopher J. Soto. 2008. Paradigm Shift: to the Integrative Big Five. In Oliver P. John, R. W. Robbins, and L. A. Pervin (Eds.), Handbook of Personality, Theory, and Research, N. Y. Guilford Press, pp. 114-158. Kagel, John H. and Katherine Wolfe. 2001. Tests of fairness models based on equity considerations in a three-person ultimatum game. Experimental Economics, 4, 203-19. Kagel, John H., Chung Kim, and Donald Moser. 1996. Fairness in ultimatum games with
asymmetric information and asymmetric payoffs. Games and Economic Behavior, 13 (1), 100-110.
Karlan, Dean S. 2005. Using experimental economics to measure social capital and predict
financial decisions. American Economic Review, 95(5), 1688-1699.
Kessler, Judd and Steve Leider. 2012. Norms and Contracting. Management Science, 58(1), 62–77. Kreps, David M., Paul Milgrom, John Roberts, and Robert Wilson. 1982. Rational cooperation in
the finitely repeated prisoners' dilemma. Journal of Economic theory, 27 (2), 245-252.
Kube, S., M.A. Maréchal, C. Puppe. 2012. The currency of reciprocity – gift-exchange in the workplace. American Economic Review, 102(4), 1644-1662.
Kube, S., M.A. Maréchal, C. Puppe. 2013 Do wage cuts damage work morale? Evidence from a natural field experiment. Journal of the European Economic Association, 11, 853-870. Lazear, Edward P., Ulrike Malmendier and Roberto A. Weber. 2012. Sorting inexperiments with
application to social preferences. American Economic Journal: Applied Economics, 4(1), 136-63.
Leider, Stephen, Markus M. Möbius, Tanya Rosenblat, and Quoc-Anh Do. 2009. Directed altruism
and enforced reciprocity in social networks. Quarterly Journal of Economics,11, 1815-1851. Levitt, Steven D. and John A. List. 2007. What do laboratory experiments measuring social
preferences reveal about the real world? Journal of Economic Perspectives, 21(2), 153-174.
List, John A. 2007. On the interpretation of giving in dictator games. The Journal of Political Economy, 115, 482-493. List, John A. and Todd L. Cherry. 2000. Learning to accept in ultimatum games: Evidence from an experimental design that generates low offers. Experimental Economics, 3, 11-31. Mellström, Carl and Magnus Johannesson,.2008. Crowding Out in Blood Donations: Was Titmuss
Right? Journal of the European Economic Association, 6, 845-863. Montero, Maria. 2007. Inequality aversion may increase inequity. The Economic Journal,
11
117, 192-204. Oberholzer-Gee, Felix and Reiner Eichenberger. 2008. Fairness in extended dictator game experiments. B.E. Journal of Economic Analysis & Policy 8 (1) Art. 16. Ochs, Jack, and Alvin E. Roth. 1989. An experimental study of sequential bargaining. The
American Economic Review, 355-384. Offerman, Theo. 2002. Hurting hurts more than helping helps. European Economic Review, 46, 1423-1437. Ploner, Matteo and Anthony Ziegelmeyer. 2008. The hidden costs of control: An unsuccessful repetition study. Working Paper, Max Planck Institute of Economics and University of Trento. Prasnikar, Vesna and Alvin E. Roth. 1992. Considerations of fairness and strategy: Experimental data from sequential games. Quarterly Journal of Economics, 107, 865-888. Rabin, M. 1993. Incorporating fairness into game theory and economics. American Economic Review, 83, 1281-302. Reuben, Ernesto, Sapienza, Paola, and Zingales, Luigi 2009. Is mistrust self-fulfilling. Economic Letters, 104(2): 89-91. Rosenthal, R. and R.L. Rosnow. 1969. Artifact in behavioral research. New York: Academic Press. Rotemberg, Julio J. 2008. Minimally acceptable altruism and the ultimatum game. Journal of Economics and Organizational Behavior, 66, 457-76. Rotemberg, Julio J. 2006. Altruism, reciprocity and cooperation in the workplace. Handbook on the Economics of Giving, Reciprocity and Altruism, vol 2, ed. by. Serge-Christophe Kolm and Jean Mercier Ythier, North Holland, 1371-1407. Roth, Alvin, E. 1995a. Introduction to experimental economics. In The Handbook of Experimental Economics, John H. Kagel and Alvin E. Roth (eds). Princeton University Press. Roth, Alvin, E. 1995b. Bargaining experiments. In The Handbook of Experimental Economics, John
H. Kagel and Alvin E. Roth (eds). Princeton University Press. Roth, Alvin E. and Ido Erev. 1995. Learning in extensive-form games: Experimental data and simple dynamic models in the intermediate term. Games and Economic Behavior, 8, 164- 212. Roth, Alvin E., Vesna Prasnikar, Masahiro Okuno-Fujiwara, and Shmuel Zamir. 1991. Bargaining and market behavior in Jerusalem, Ljubljana, Pittsburgh and Tokyo: An experimental study. American Economic Review, 81, 1068-95.
12
Schotter, Andrew, Zheng, Wei and Blaine Snyder. 2000. Bargaining through agents: An experimental study of delegation and commitment, Games and Economic Behavior, 30(2), 248-292
Sell, Jane, W. I. Griffith, and Rick K. Wilson. 1993. Are women more cooperative than men in social dilemmas? Social Psychology Quarterly, 211-222.
Shaffer, Victoria A. and Hal R. Arkes. 2009. Preference reversals in Evaluations of Cash versus
Non-Cash Incentives. Journal of Economic Psychology, 30, 859-872. Shaked, Avner. 2006. On the explanatory value of inequity aversion theory. Working Paper, Bonn University. Slonim, Robert L. and Alvin E. Roth. 1998. Learning in high stakes ultimatum games: An experiment in the Slovak Republic. Econometrica, 66, 569-96. Slonim, Robert, and Ellen Garbarino. 2008. Increases in trust and altruism from partner selection:
Experimental evidence. Experimental Economics, 11(2), 134-153. Solow, John L. and Nicole Kirkwood. 2002. Group identity and gender in public goods
experiments. Journal of Economic Behavior & Organization, 48(4), 403-412. Tadelis, Steve. 2007. The power of shame and the rationality of trust. Working Paper, University of California, Berkeley, Haas School of Business. Tajfel, H. and Turner, J. C. 1979. An integrative theory of intergroup conflict. In W. G. Austin & S.
Worchel (Eds.), The social psychology of intergroup relations Monterey, CA: Brooks/Cole, pp. 33–47.
Tversky, A., S. Sattah, and P. Slovic. 1988. Contingent weighting in judgment and choice. Psychological Review, 93, 371-384. Vanberg, C. 2008. Why do people keep their promises? An experimental test of two explanations. Econometrica, 76, 1467-1480. Wallis, W. Allen and Milton Friedman. 1942. The empirical derivation of indifference functions. In Studies in Mathematical Economics and Econometrics in Memory of Henry Schultz, O. Lange, F. McIntyre, and T. O. Yntema, editors, Chicago: University of Chicago Press. 175-189. Xiao, Erte and Daniel Houser. 2005. Emotion expression in human punishment behavior. Proceedings of the National Academy of Science, 102, 7398-7401. Xiao, Erte and Daniel Houser. 2009. Avoiding the sharp tongue: Anticipated written messages
promote fair economic exchange. Journal of Experimental Psychology, 30, 393-404.
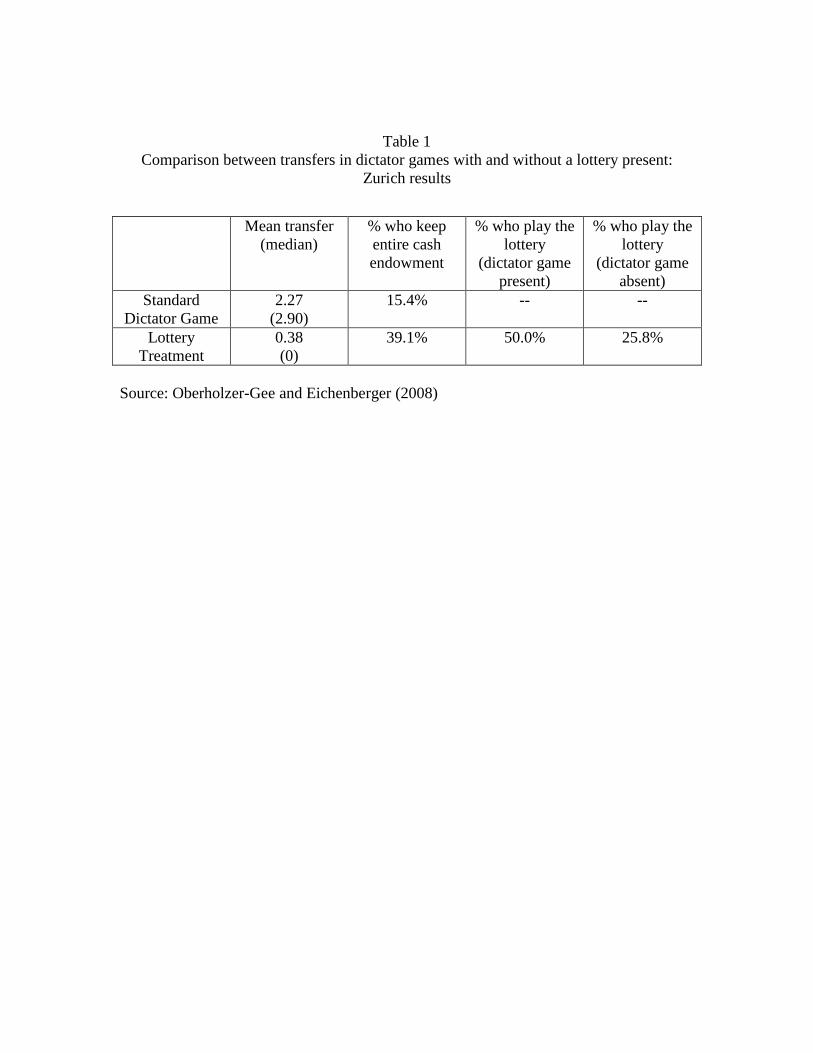
Table 1 Comparison between transfers in dictator games with and without a lottery present:
Zurich results
Source: Oberholzer-Gee and Eichenberger (2008)
Mean transfer (median)
% who keep entire cash endowment
% who play the lottery
(dictator game present)
% who play the lottery
(dictator game absent)
Standard Dictator Game
2.27 (2.90)
15.4% -- --
Lottery Treatment
0.38 (0)
39.1% 50.0% 25.8%
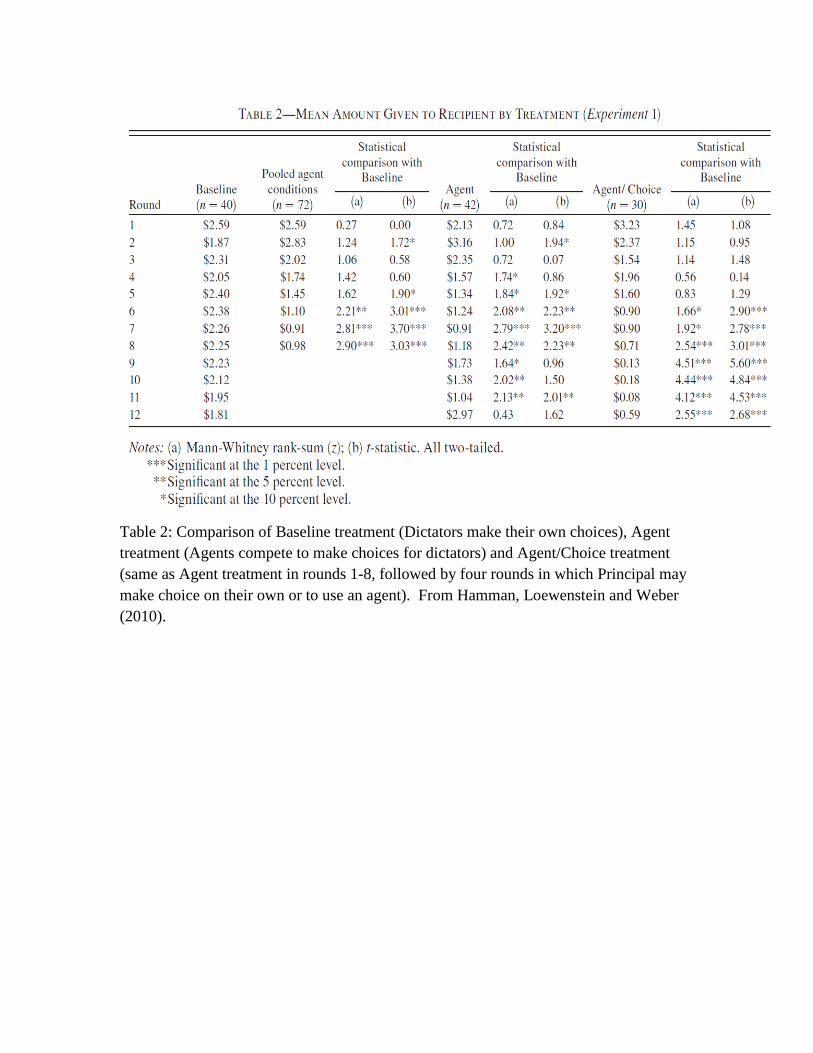
Table 2: Comparison of Baseline treatment (Dictators make their own choices), Agent treatment (Agents compete to make choices for dictators) and Agent/Choice treatment (same as Agent treatment in rounds 1-8, followed by four rounds in which Principal may make choice on their own or to use an agent). From Hamman, Loewenstein and Weber (2010).
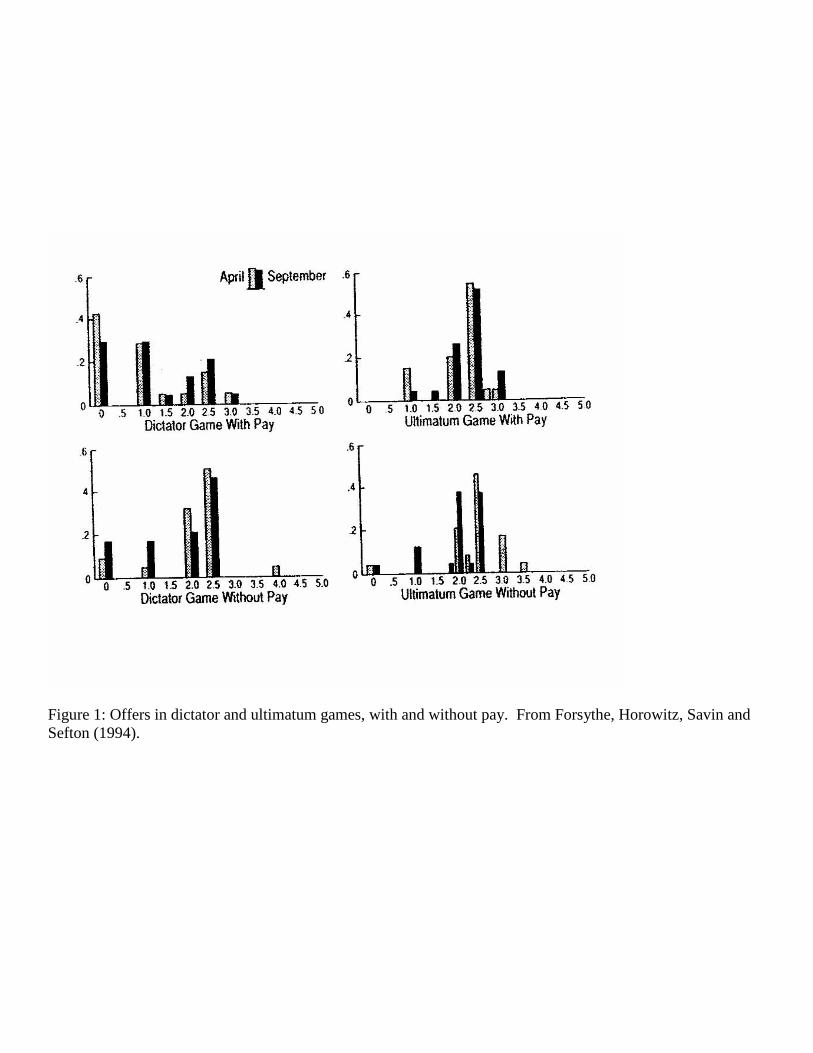
Figure 1: Offers in dictator and ultimatum games, with and without pay. From Forsythe, Horowitz, Savin and Sefton (1994).
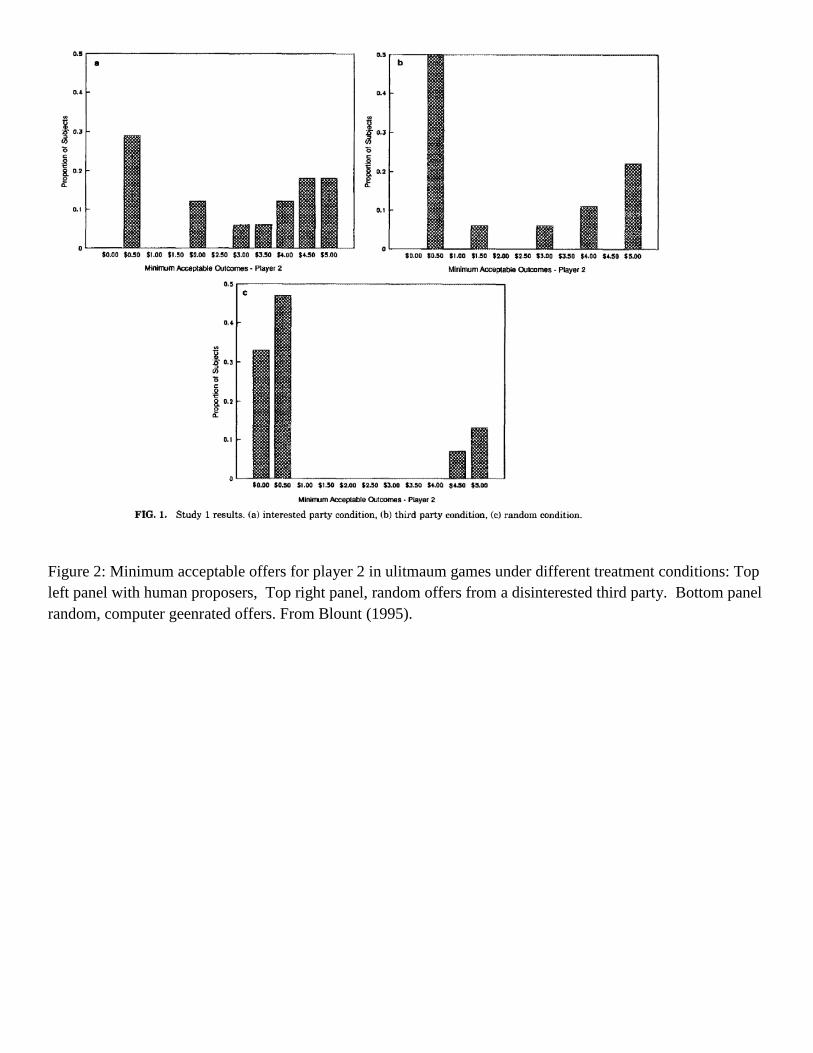
Figure 2: Minimum acceptable offers for player 2 in ulitmaum games under different treatment conditions: Top left panel with human proposers, Top right panel, random offers from a disinterested third party. Bottom panel random, computer geenrated offers. From Blount (1995).
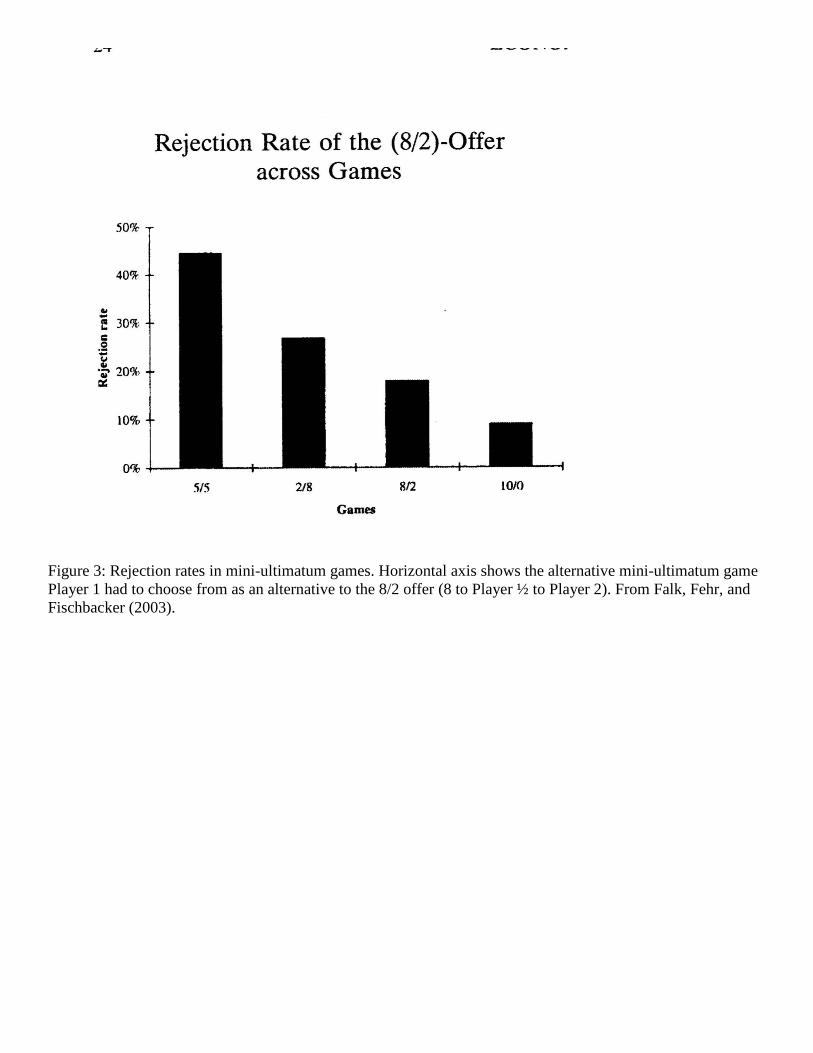
Figure 3: Rejection rates in mini-ultimatum games. Horizontal axis shows the alternative mini-ultimatum game Player 1 had to choose from as an alternative to the 8/2 offer (8 to Player ½ to Player 2). From Falk, Fehr, and Fischbacker (2003).
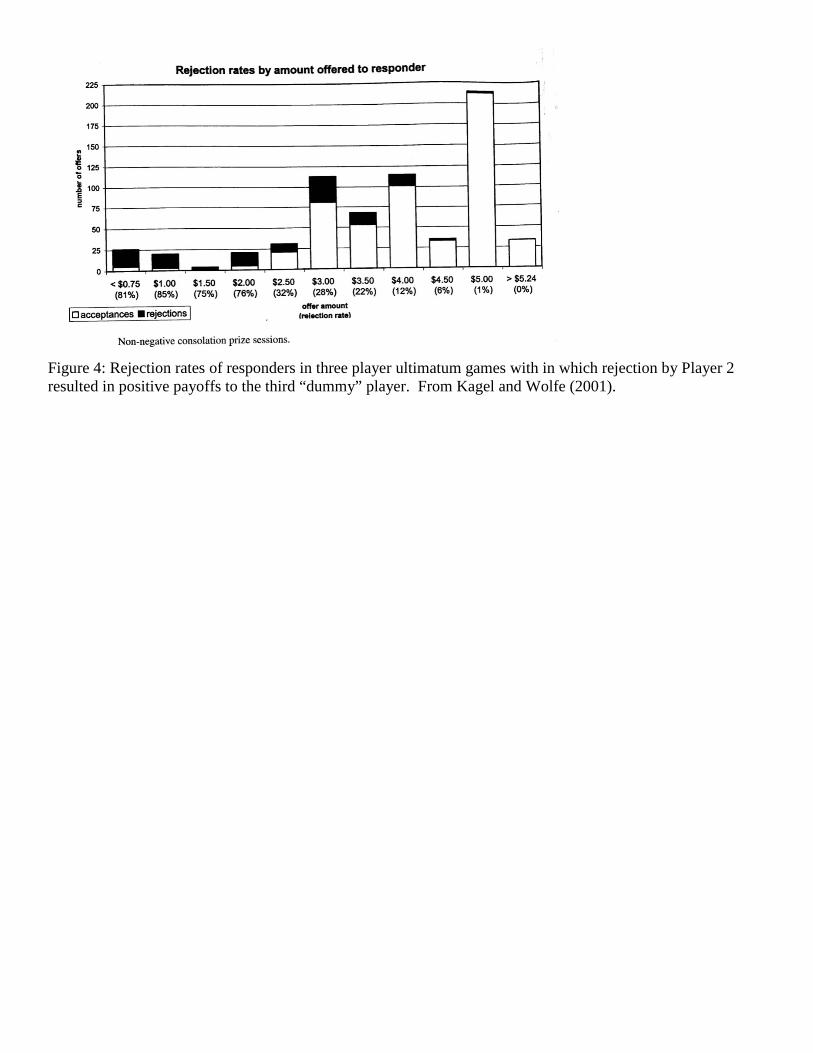
Figure 4: Rejection rates of responders in three player ultimatum games with in which rejection by Player 2 resulted in positive payoffs to the third “dummy” player. From Kagel and Wolfe (2001).
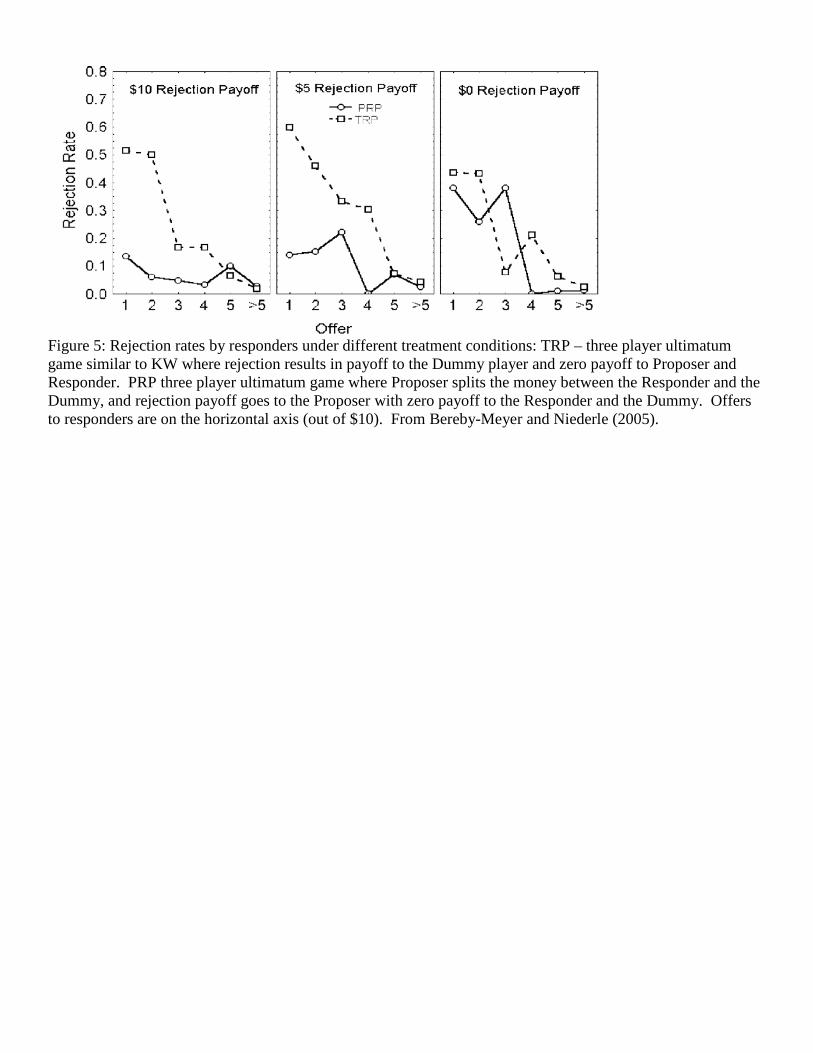
Figure 5: Rejection rates by responders under different treatment conditions: TRP – three player ultimatum game similar to KW where rejection results in payoff to the Dummy player and zero payoff to Proposer and Responder. PRP three player ultimatum game where Proposer splits the money between the Responder and the Dummy, and rejection payoff goes to the Proposer with zero payoff to the Responder and the Dummy. Offers to responders are on the horizontal axis (out of $10). From Bereby-Meyer and Niederle (2005).
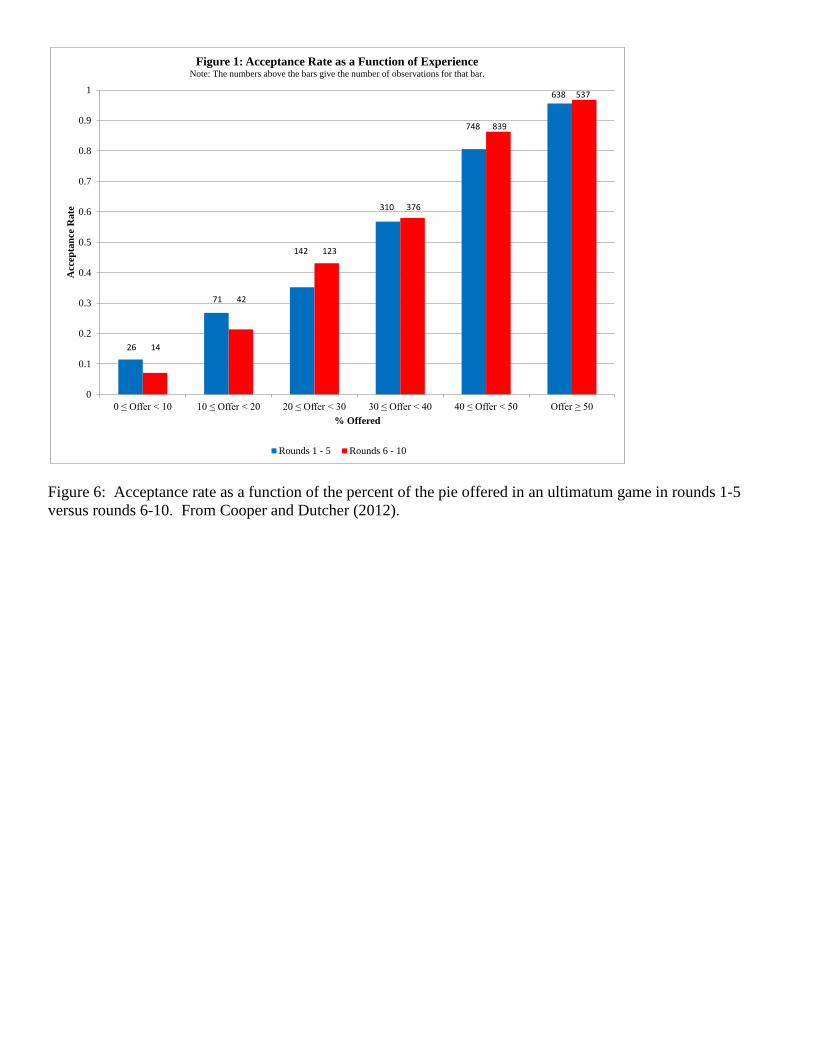
Figure 6: Acceptance rate as a function of the percent of the pie offered in an ultimatum game in rounds 1-5 versus rounds 6-10. From Cooper and Dutcher (2012).
0
0.1
0.2
0.3
0.4
0.5
0.6
0.7
0.8
0.9
1
0 ≤ Offer < 10 10 ≤ Offer < 20 20 ≤ Offer < 30 30 ≤ Offer < 40 40 ≤ Offer < 50 Offer ≥ 50
Acc
epta
nce
Rat
e
% Offered
Figure 1: Acceptance Rate as a Function of ExperienceNote: The numbers above the bars give the number of observations for that bar.
Rounds 1 - 5 Rounds 6 - 10
638 537
748 839
310 376
142 123
71 42
26 14
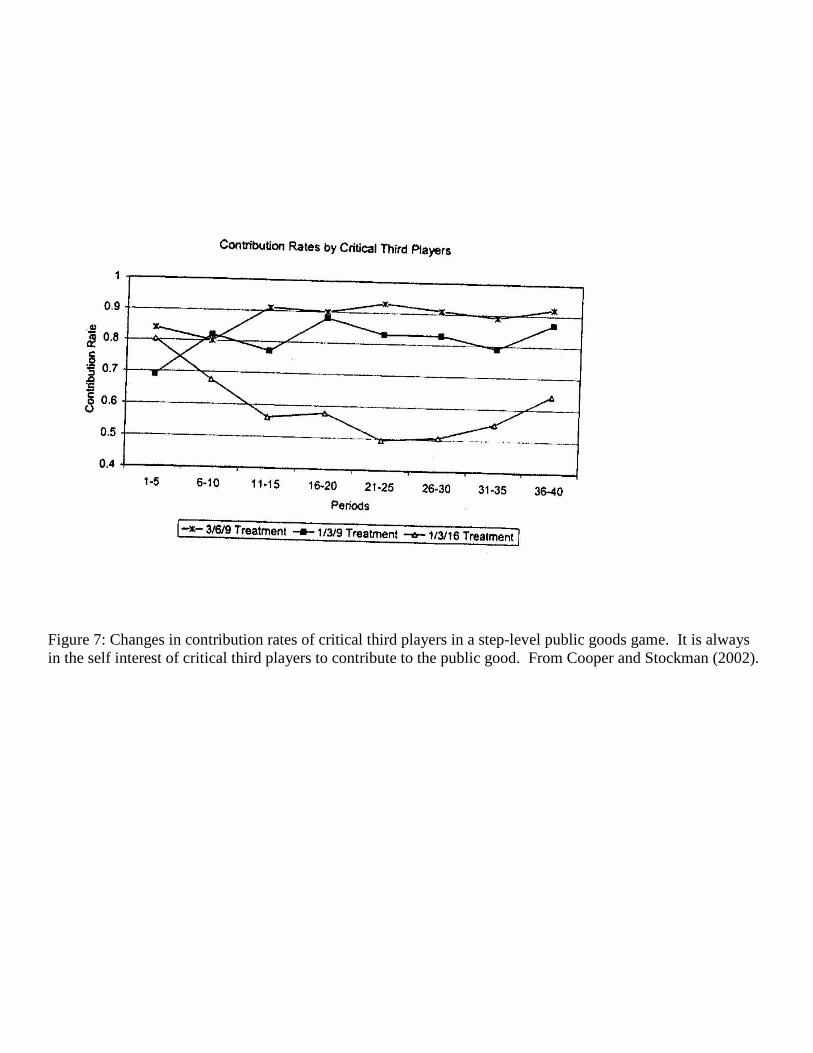
Figure 7: Changes in contribution rates of critical third players in a step-level public goods game. It is always in the self interest of critical third players to contribute to the public good. From Cooper and Stockman (2002).
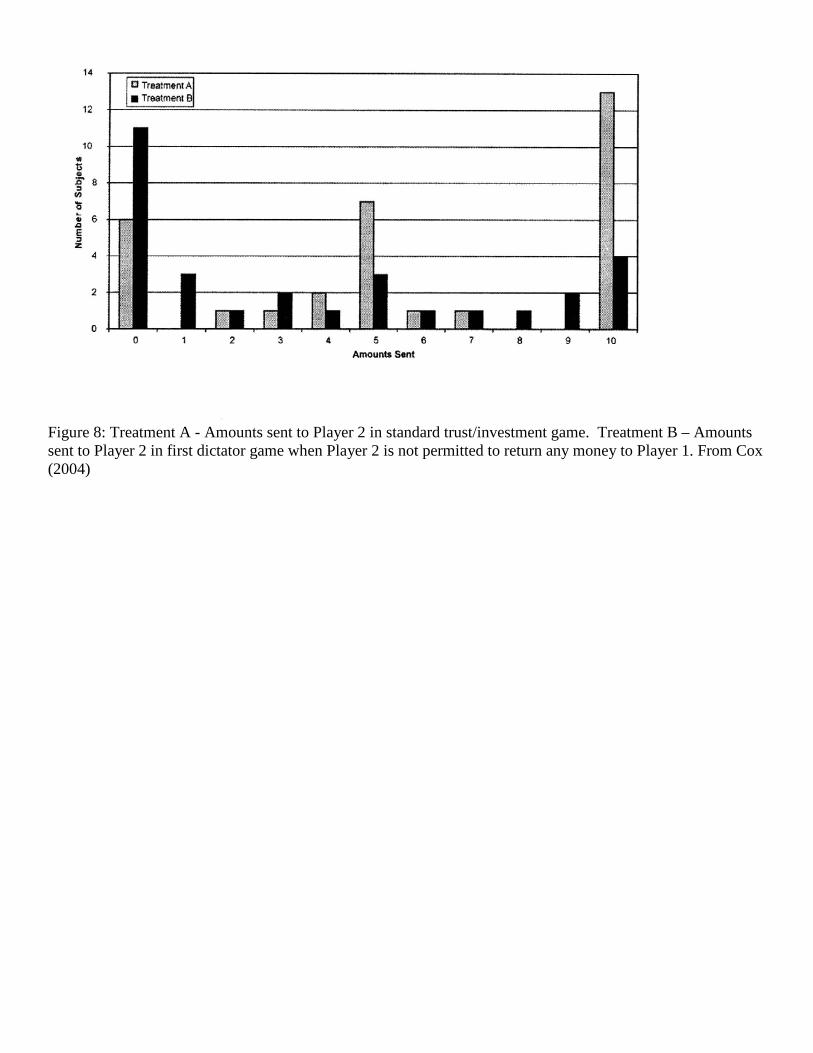
Figure 8: Treatment A - Amounts sent to Player 2 in standard trust/investment game. Treatment B – Amounts sent to Player 2 in first dictator game when Player 2 is not permitted to return any money to Player 1. From Cox (2004)
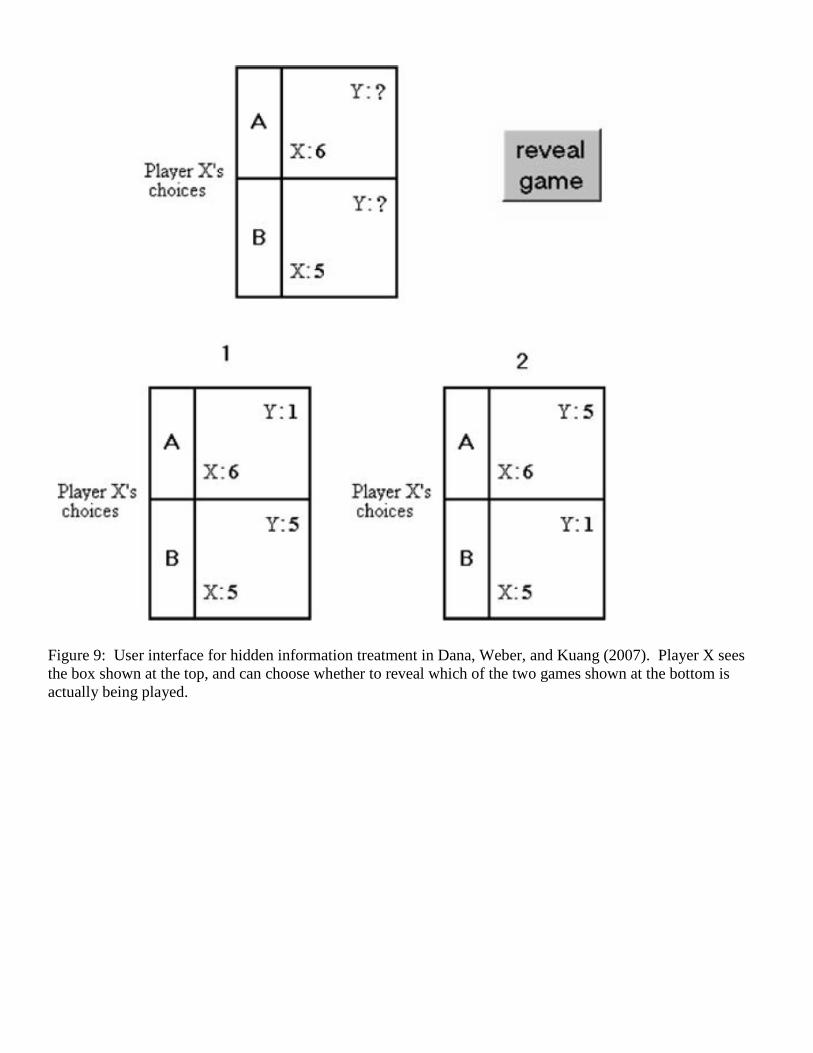
Figure 9: User interface for hidden information treatment in Dana, Weber, and Kuang (2007). Player X sees the box shown at the top, and can choose whether to reveal which of the two games shown at the bottom is actually being played.
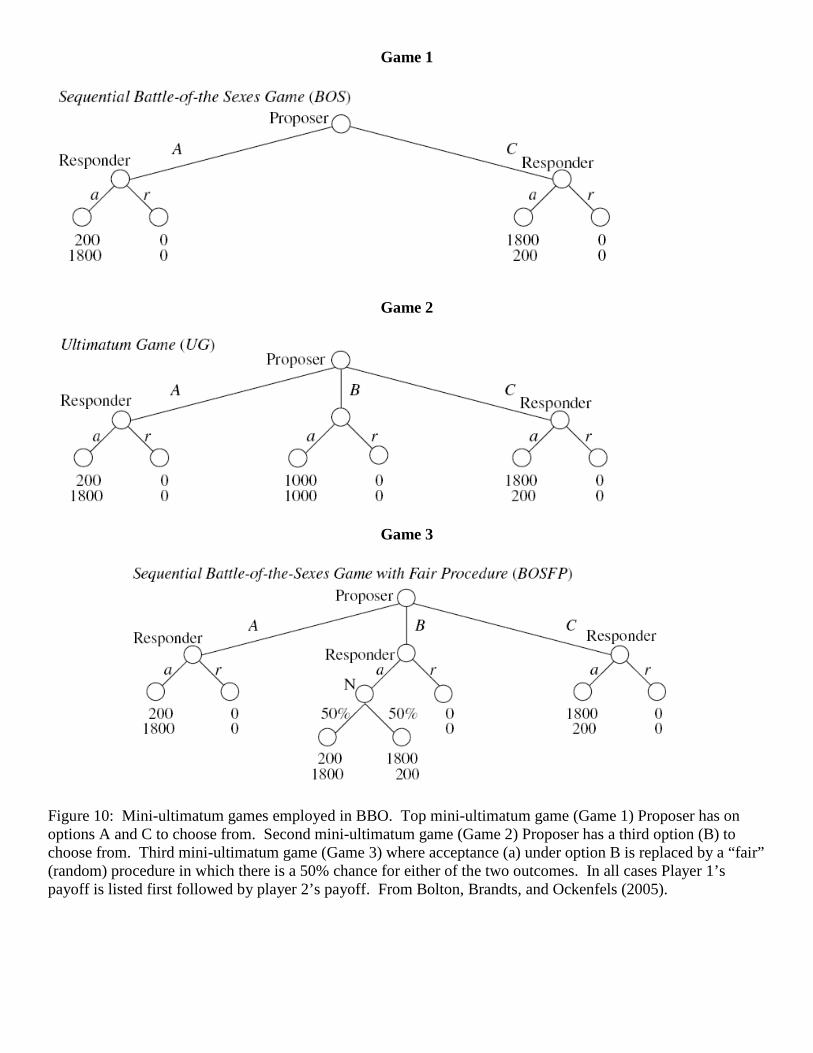
Game 1
Game 2
Game 3
Figure 10: Mini-ultimatum games employed in BBO. Top mini-ultimatum game (Game 1) Proposer has on options A and C to choose from. Second mini-ultimatum game (Game 2) Proposer has a third option (B) to choose from. Third mini-ultimatum game (Game 3) where acceptance (a) under option B is replaced by a “fair” (random) procedure in which there is a 50% chance for either of the two outcomes. In all cases Player 1’s payoff is listed first followed by player 2’s payoff. From Bolton, Brandts, and Ockenfels (2005).
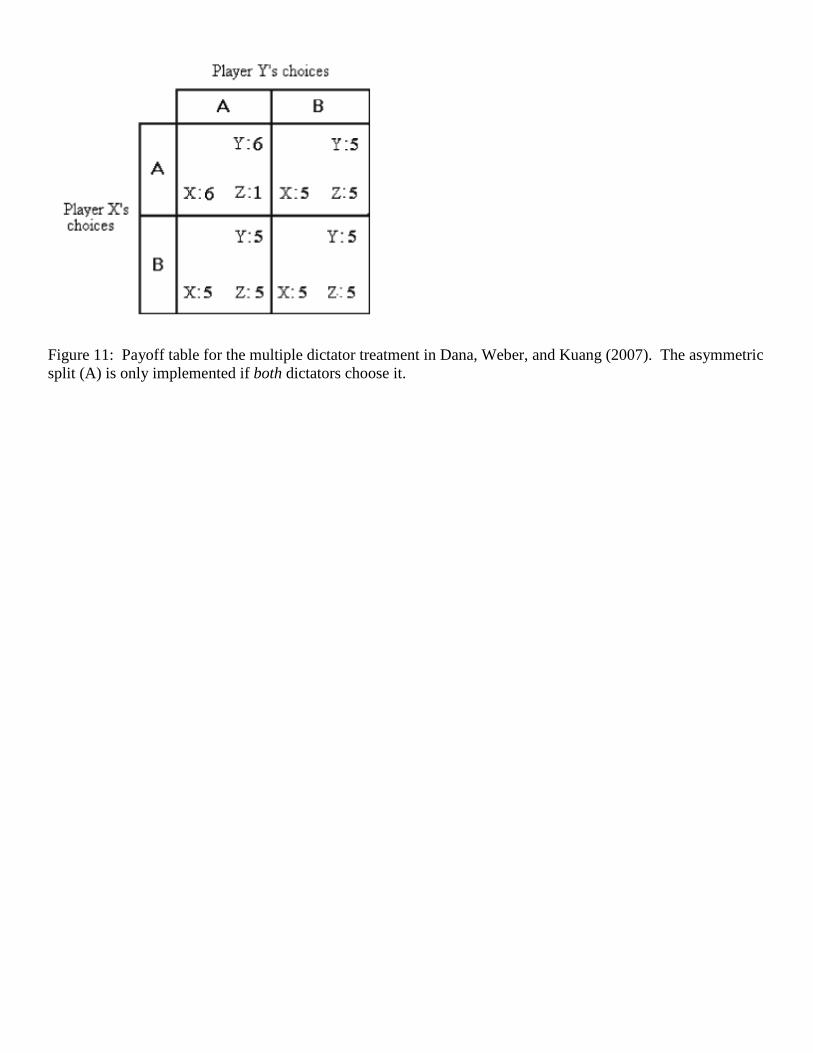
Figure 11: Payoff table for the multiple dictator treatment in Dana, Weber, and Kuang (2007). The asymmetric split (A) is only implemented if both dictators choose it.
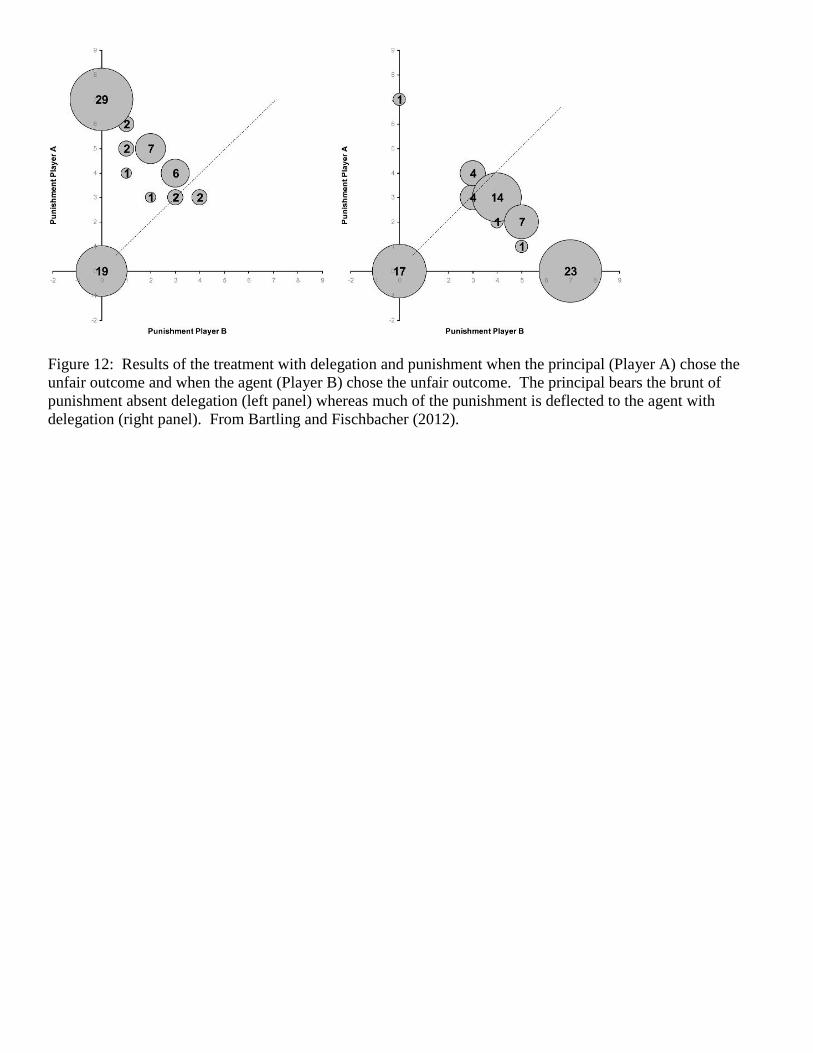
Figure 12: Results of the treatment with delegation and punishment when the principal (Player A) chose the unfair outcome and when the agent (Player B) chose the unfair outcome. The principal bears the brunt of punishment absent delegation (left panel) whereas much of the punishment is deflected to the agent with delegation (right panel). From Bartling and Fischbacher (2012).
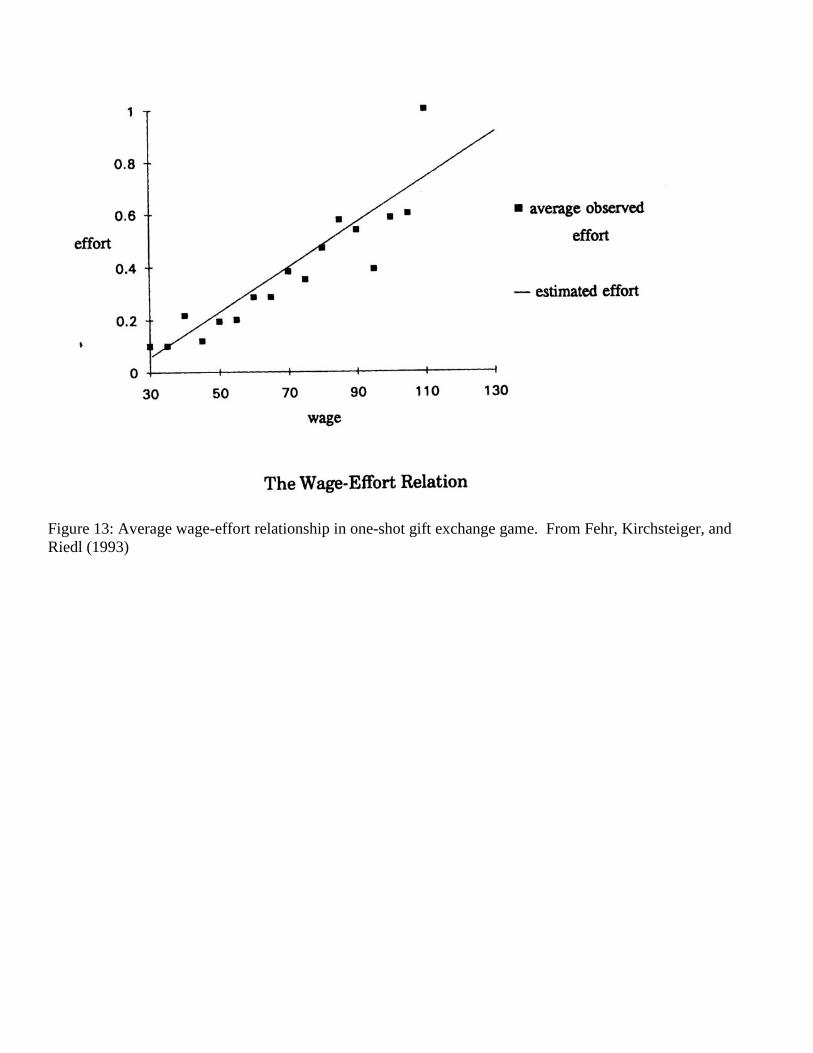
Figure 13: Average wage-effort relationship in one-shot gift exchange game. From Fehr, Kirchsteiger, and Riedl (1993)
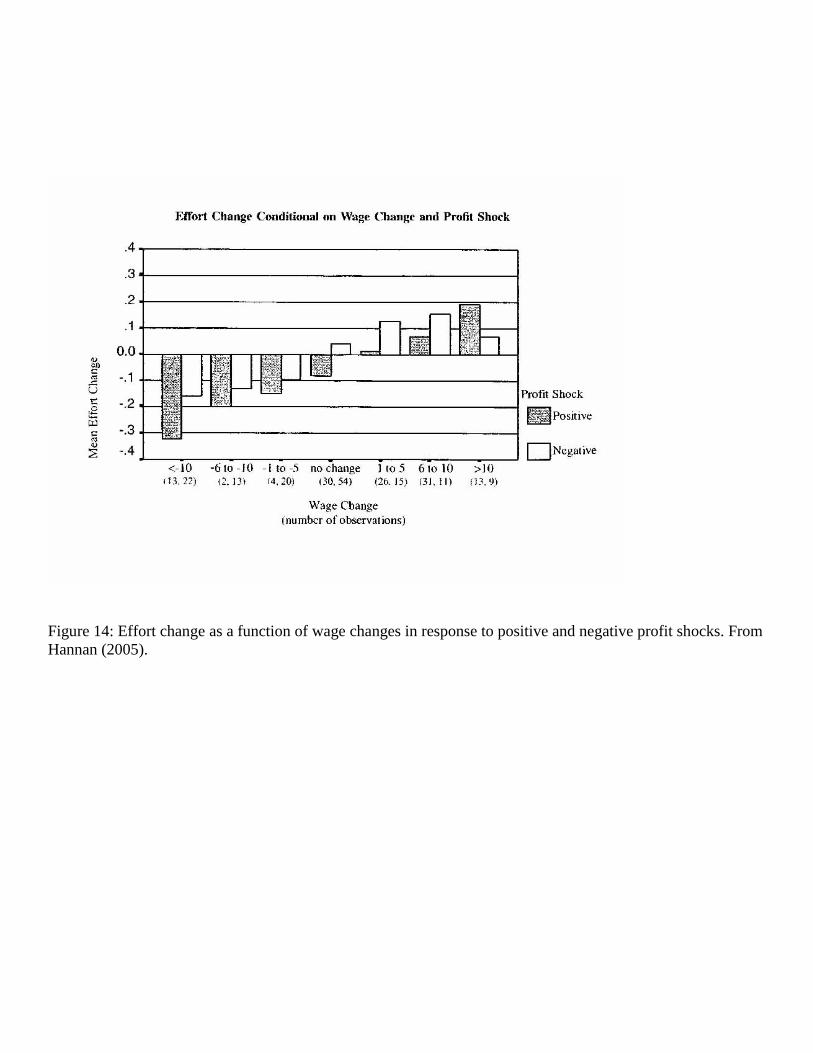
Figure 14: Effort change as a function of wage changes in response to positive and negative profit shocks. From Hannan (2005).
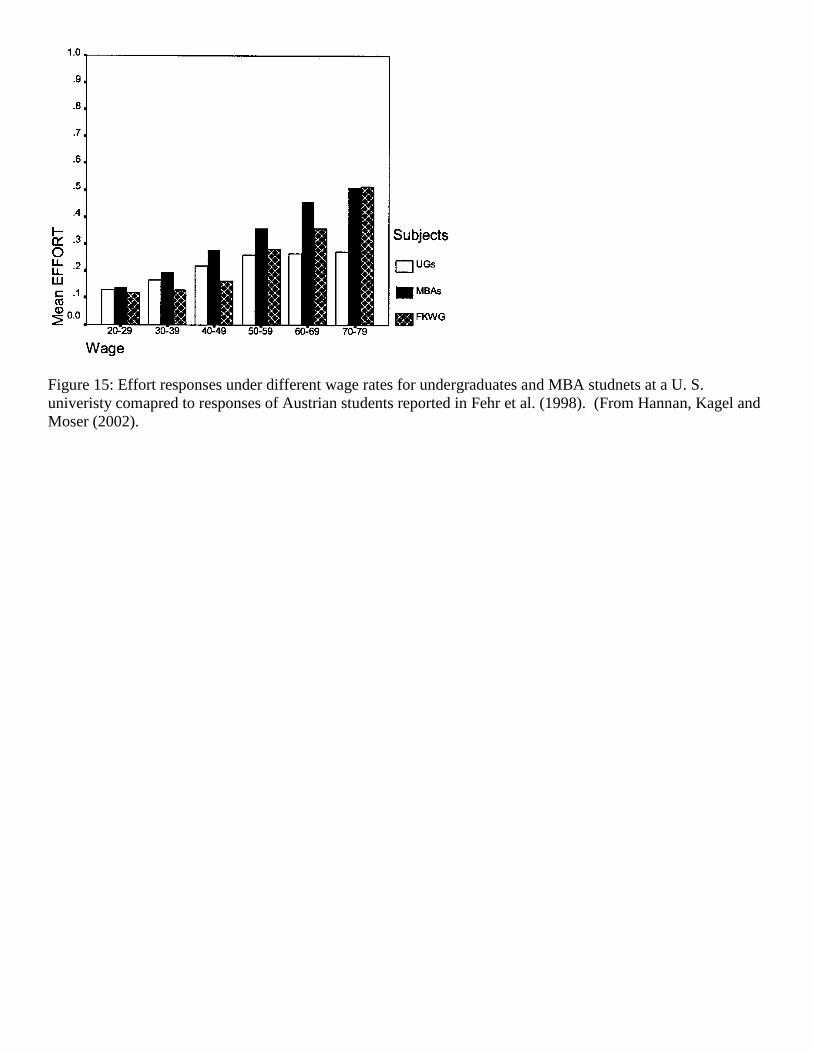
Figure 15: Effort responses under different wage rates for undergraduates and MBA studnets at a U. S. univeristy comapred to responses of Austrian students reported in Fehr et al. (1998). (From Hannan, Kagel and Moser (2002).
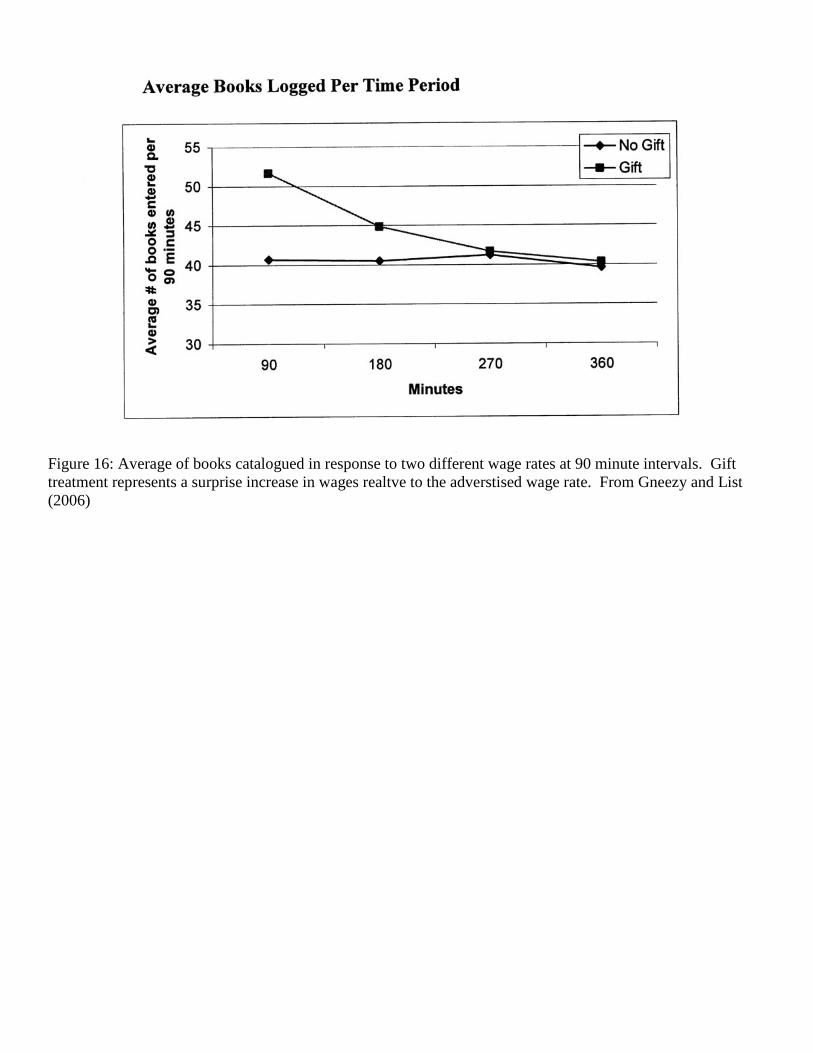
Figure 16: Average of books catalogued in response to two different wage rates at 90 minute intervals. Gift treatment represents a surprise increase in wages realtve to the adverstised wage rate. From Gneezy and List (2006)
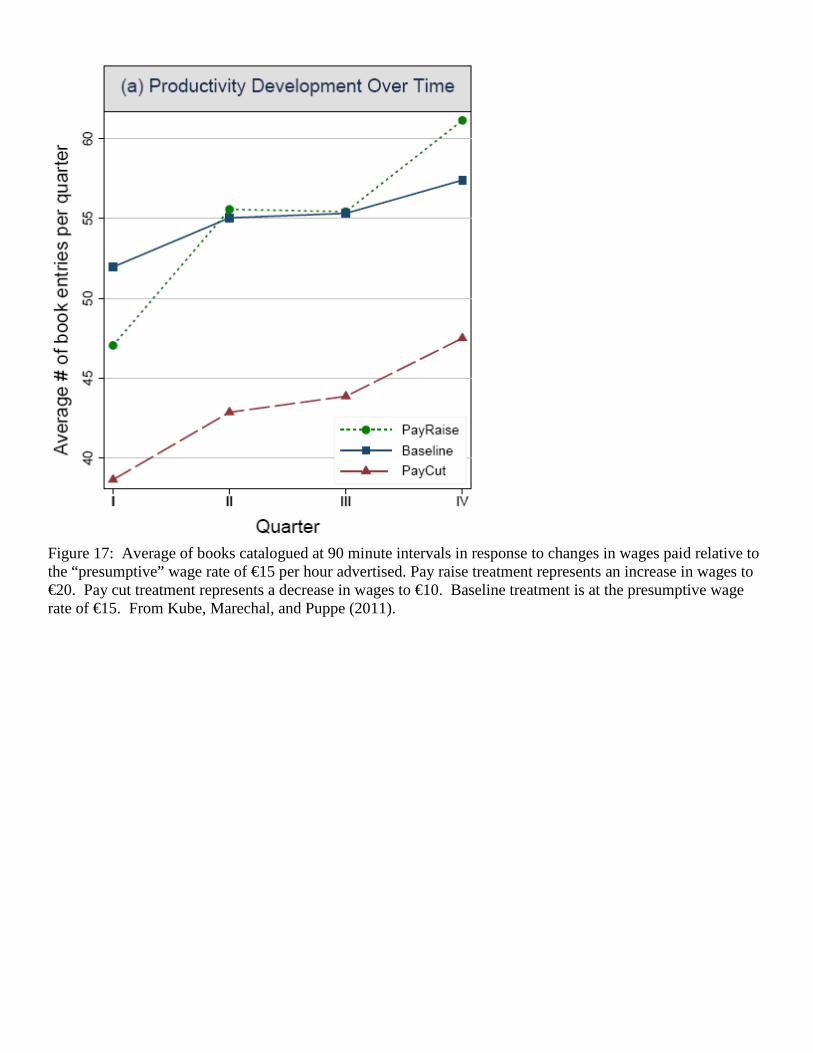
Figure 17: Average of books catalogued at 90 minute intervals in response to changes in wages paid relative to the “presumptive” wage rate of €15 per hour advertised. Pay raise treatment represents an increase in wages to €20. Pay cut treatment represents a decrease in wages to €10. Baseline treatment is at the presumptive wage rate of €15. From Kube, Marechal, and Puppe (2011).
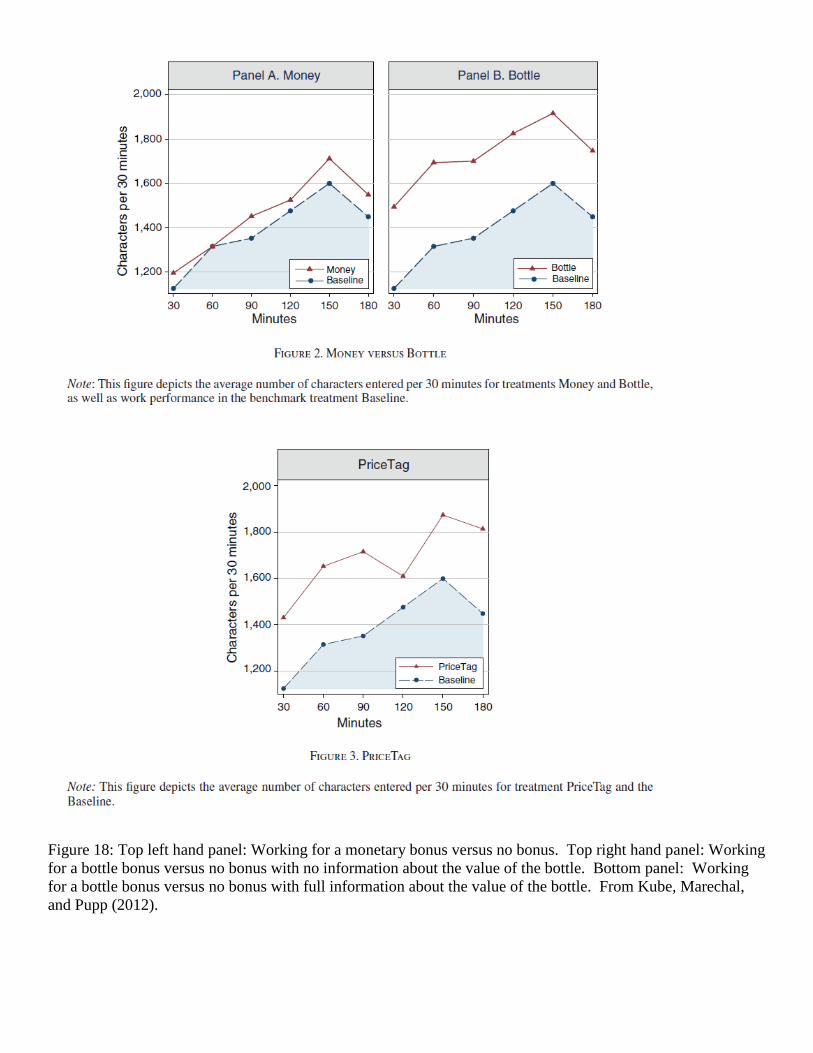
Figure 18: Top left hand panel: Working for a monetary bonus versus no bonus. Top right hand panel: Working for a bottle bonus versus no bonus with no information about the value of the bottle. Bottom panel: Working for a bottle bonus versus no bonus with full information about the value of the bottle. From Kube, Marechal, and Pupp (2012).