Embed Size (px)
Citation preview

Oswald Consultancy Ltd
Can Scottish hydro smooth wind and wave power?
Oswald Consultancy carried out this assessment and would like to thank Scottish and Southern Energy for their invaluable assistance in providing operational data and explanation on the hydro plants they
manage in Scotland.
This 2007 study was originally commissioned by the Scottish Sustainable Energy Foundation who unfortunately went into liquidation.

Oswald Consultancy Ltd
Can Scottish hydro smooth wind and wave power?
• It is known that renewables such as wind and wave deliver highly variable output of electricity due to fluctuations in British weather i.e. wind. We wish to know if Scotland’s existing hydro plant can make a significant contribution to smoothing this power delivery
• The paper concludes that this is not likely as there are already many existing constraints on the operation and power delivery characteristics of Scotland’s hydro plant and there is little scope to modify the plant’s behaviour
– To understand this fully it is necessary to understand the constraints and power characteristics of the existing hydro plant in more detail
Scottish wind output (equivalent to 40%) Jan 06
0500
10001500200025003000350040004500
01 Jan 11 Jan 21 Jan 31 Jan 10 Feb
Po
we
r (M
W)
Scottish wind output sufficient to meet 40% of Scotland’s electricity needs, Jan 2006,Ref Oswald Consultancy
http://www.ssef.org.uk/SSEF%5FPublications/

Oswald Consultancy Ltd
Scottish ROCs claimed, 2006
1,841,1641,959,855
366,488
210,700
5,413 9-
500,000
1,000,000
1,500,000
2,000,000
2,500,000
Smallhydro
Wind Landfill Biomass Sewage Wave
MW
h
5.2% 5.5%
1.7%
2006 Scottish hydro contribution• In 2006 12.2% of Scotland’s electricity (4.3TWh) was generated by hydro plant• Nearly two-thirds of this was generated by large hydro (2.5TMW)• Here we consider the detail power characteristics of Scottish hydro plant
– This has been compiled with the generous assistance of Scottish and Southern Energy who are the largest operator of conventional hydro in the UK
• SSE: 1050 MW conventional hydro plus 300 MW pumped storage• Scottish Power: 500MW conventional hydro plus 540 MW pumped storage
Large Hydro (no SROCs)
7.0%

Oswald Consultancy Ltd
Hydro - Understanding fuel flow
• Hydro plants are fed by water which is collected in the catchment area and sent to the turbines. On route, the water may be captured in a reservoir, which allows storage and control of water flow and power. However, many hydro plants are supplied immediately by the river and there is little control over flow; these are called run of the river systems.
– In designing a hydro plant the designer has a choice of fitting a large or small turbine relative to the maximum flow. A small turbine will spend more time at full power and so provide more consistent power, while a large turbine will provide a higher power but less consistently. In other words a small turbine will have a higher load factor over the year (higher percentage of full power) and a large turbine a lower load factor.
– Understanding the physical constraints explains the power characteristics of different hydro plant.
Reservoir Run of river
Small turbine with high LFor
Large turbine with low LF
Controlled flow Uncontrolled flow
Catchment area
Oswald Consultancy Ltd
Constraints on operation of hydro plant
• The output of hydro plant is often determined by external constraints on operation, including the following:
– Cascade hydro systems have stations in series along the same river and power delivery downstream is often decided by upstream control decisions.
– Water flow is managed to avoid large changes in flow (and therefore power), as sudden changes in river height has ecological and safety implications, and can cause difficulties for other river users such as anglers or canoeists.
– Operators are usually required to ensure a minimum flow is maintained along a river (called the statutory flow) to avoid the river running dry.
– Some storage capacity is held in reserve in reservoirs to provide a buffer in case of extreme rainfall events and alleviate downstream flooding.
– River flow affects wildlife; e.g. water spray is necessary for healthy algae, which are fundamental to the overall ecological health of the river.
– Water storage levels in spring are monitored and the flow is managed to ensure some water is left over for the end of the summer.
– Hydro plant designed for daily peaking power will have a low LF.
• These constraints mean each hydro plant has different characteristics in power delivery.
– In the following section, different plants are considered in detail, with the plants grouped into plant having low, medium and high load factors.
Oswald Consultancy Ltd
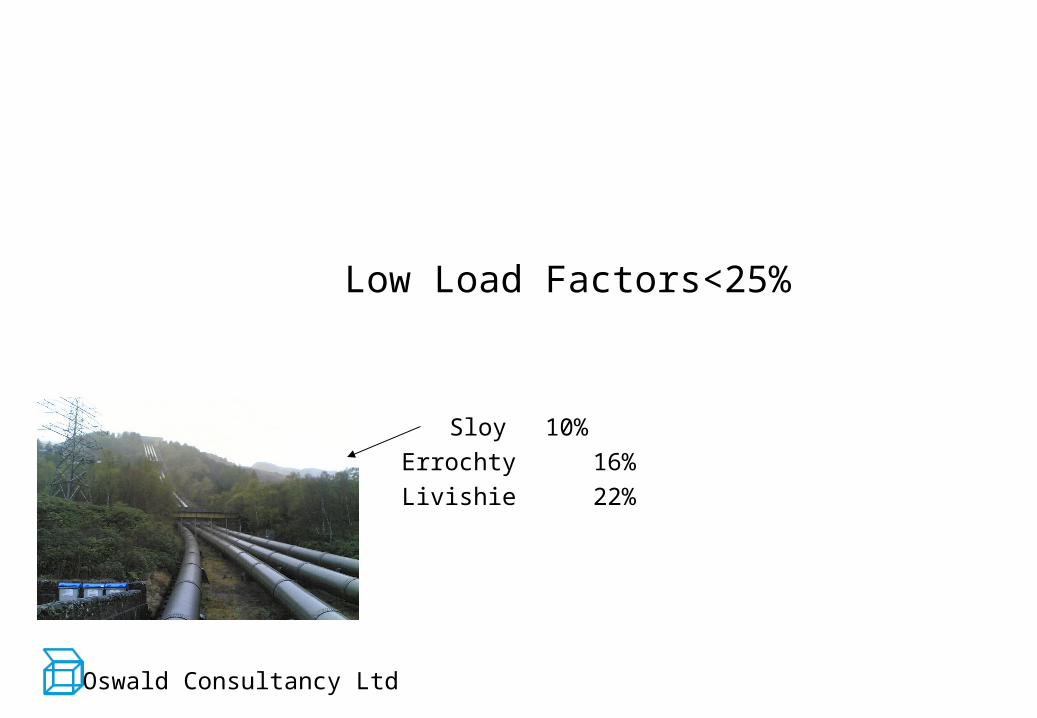
Low Load Factors<25%
Sloy 10%
Errochty 16%
Livishie 22%
Oswald Consultancy Ltd
Half hourly LF, Sloy
0
20
40
60
80
100
0 6 12 18 24 30 36 42 48
Half hour
Lo
ad
Fa
cto
r %
Monday in January
Sunday in January
Thursday in January
Thursday in April
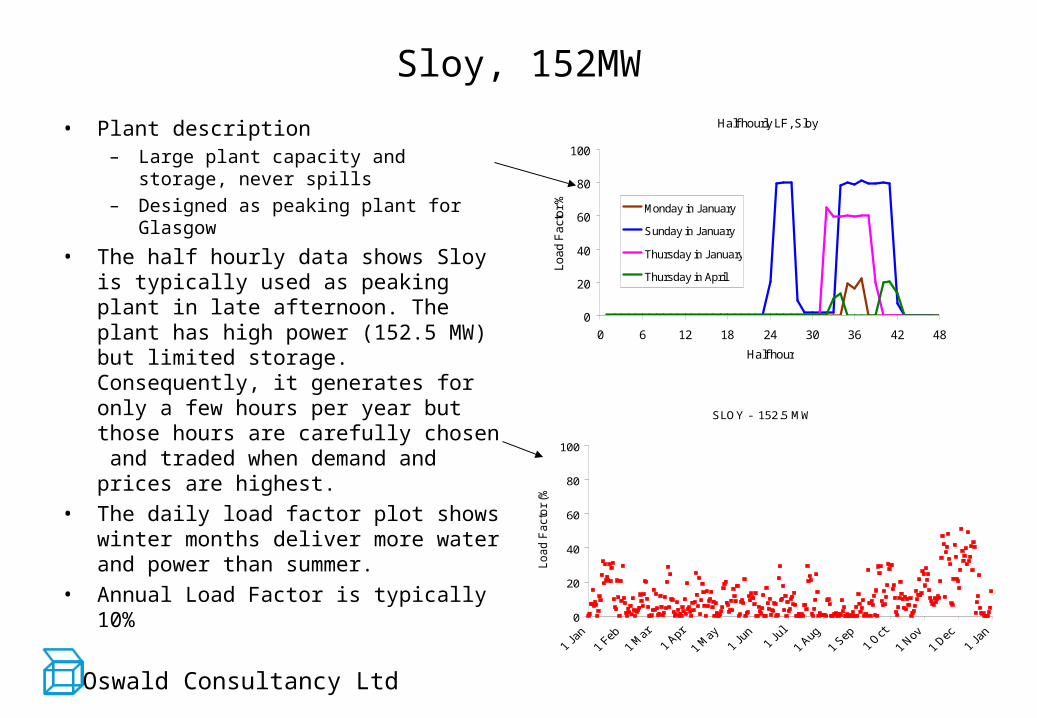
Sloy, 152MW
• Plant description– Large plant capacity and storage, never
spills
– Designed as peaking plant for Glasgow
• The half hourly data shows Sloy is typically used as peaking plant in late afternoon. The plant has high power (152.5 MW) but limited storage. Consequently, it generates for only a few hours per year but those hours are carefully chosen and traded when demand and prices are highest.
• The daily load factor plot shows winter months deliver more water and power than summer.
• Annual Load Factor is typically 10%
SLOY - 152.5 MW
0
20
40
60
80
100
Load F
act
or
(%)
Oswald Consultancy Ltd
Half hourly LF, Errochty
0
20
40
60
80
100
120
0 6 12 18 24 30 36 42 48
Half hour
Lo
ad
Fa
cto
r %
Tuesday inJanuary
Wednesdayin January
Thursday inJanuary
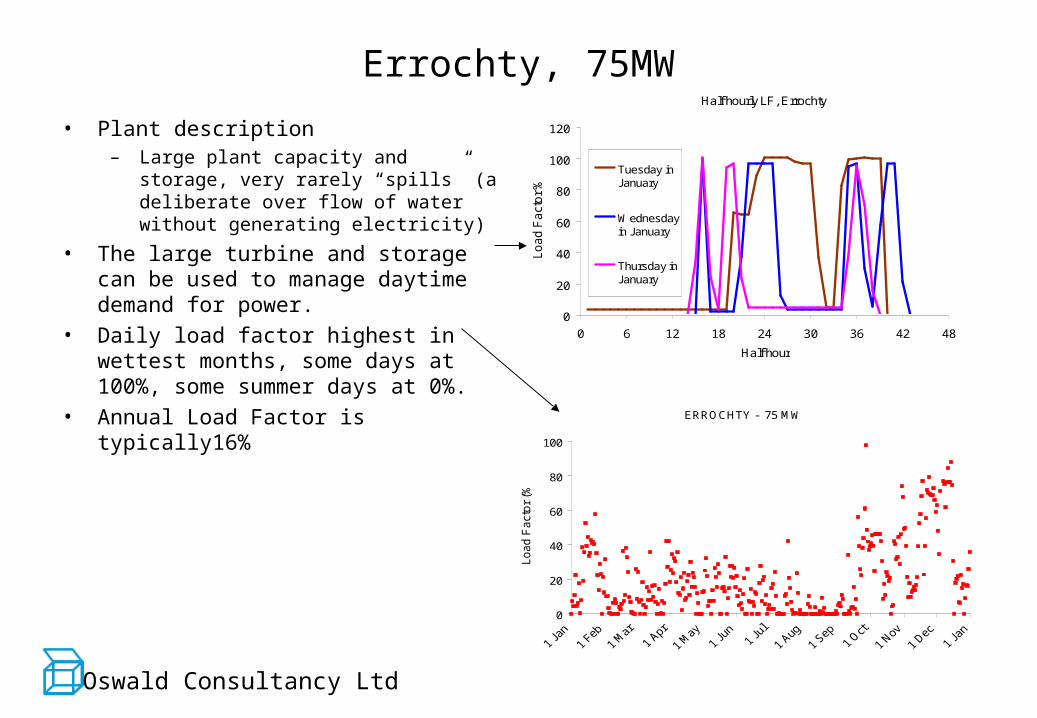
Errochty, 75MW
• Plant description– Large plant capacity and storage, very
rarely “spills” (a deliberate over flow of water without generating electricity)
• The large turbine and storage can be used to manage daytime demand for power.
• Daily load factor highest in wettest months, some days at 100%, some summer days at 0%.
• Annual Load Factor is typically16%
ERROCHTY - 75 MW
0
20
40
60
80
100
Load F
act
or
(%)

Oswald Consultancy Ltd
Half hourly LF, Livishie
0
20
40
60
80
100
120
0 6 12 18 24 30 36 42 48
Half hour
Lo
ad
Fa
cto
r %
Tuesday inJanuary
Wednesdayin January
Thursday inJanuary
• Plant description– Run of river, very limited storage, spills very
regularly
• The half hourly data shows Livishie is typically used for peaking in the early morning, afternoon and evening (it operates either at full load or does not operate).
• Livishie power station is supplied by a whole series of small dams, tunnels, aquaducts, and taps, and controls a series of small lochs, streams, and watersheds in the mountains to the North of Glen Moriston and the West of Loch Ness. The waters are taken to a small headpond on the Loch Bhlaraidh, which provides less than a days storage, and from there by pipe and tunnel to Livishe power station.
• Daily plot shows the plant generates little in the summer.
• Annual Load Factor is typically 22%
Livishie, 15MW
(http://www.corestore.org/LivishieHead.htm)
LIVISHIE - 15 MW
0
20
40
60
80
100
Load F
act
or
(%)

Oswald Consultancy Ltd
Medium Load Factor 25 to 45%
Kilmorack 33%
Fasnakyle 37%
Luichart 45%
Oswald Consultancy Ltd
Half hourly LF, Kilmorack
0
20
40
60
80
100
0 6 12 18 24 30 36 42 48
Half hour
Lo
ad
Fa
cto
r %
Tuesday in January
Wednesday in January
Thursday in January
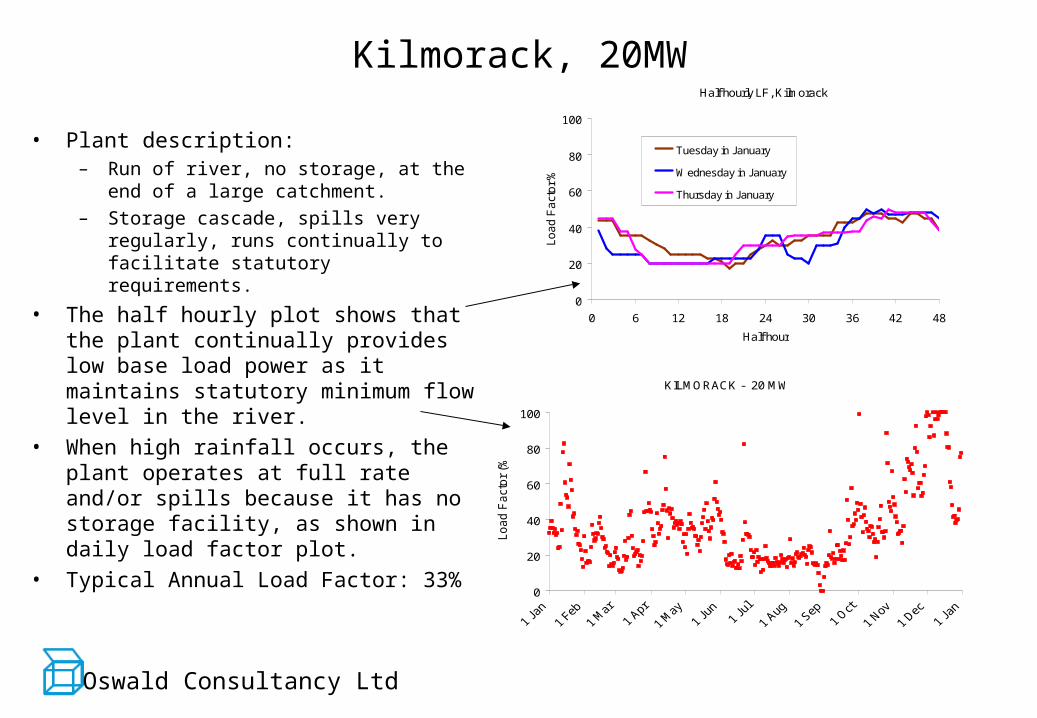
• Plant description:– Run of river, no storage, at the end of a large
catchment.
– Storage cascade, spills very regularly, runs continually to facilitate statutory requirements.
• The half hourly plot shows that the plant continually provides low base load power as it maintains statutory minimum flow level in the river.
• When high rainfall occurs, the plant operates at full rate and/or spills because it has no storage facility, as shown in daily load factor plot.
• Typical Annual Load Factor: 33%
KILMORACK - 20 MW
0
20
40
60
80
100
Load F
act
or
(%)
Kilmorack, 20MW
Oswald Consultancy Ltd
Half hourly LF, Fasnakyle
0
20
40
60
80
100
0 6 12 18 24 30 36 42 48
Half hour
Lo
ad
Fa
cto
r %
Tuesday inJanuary
Wednesday inJanuary
Thursday inJanuary
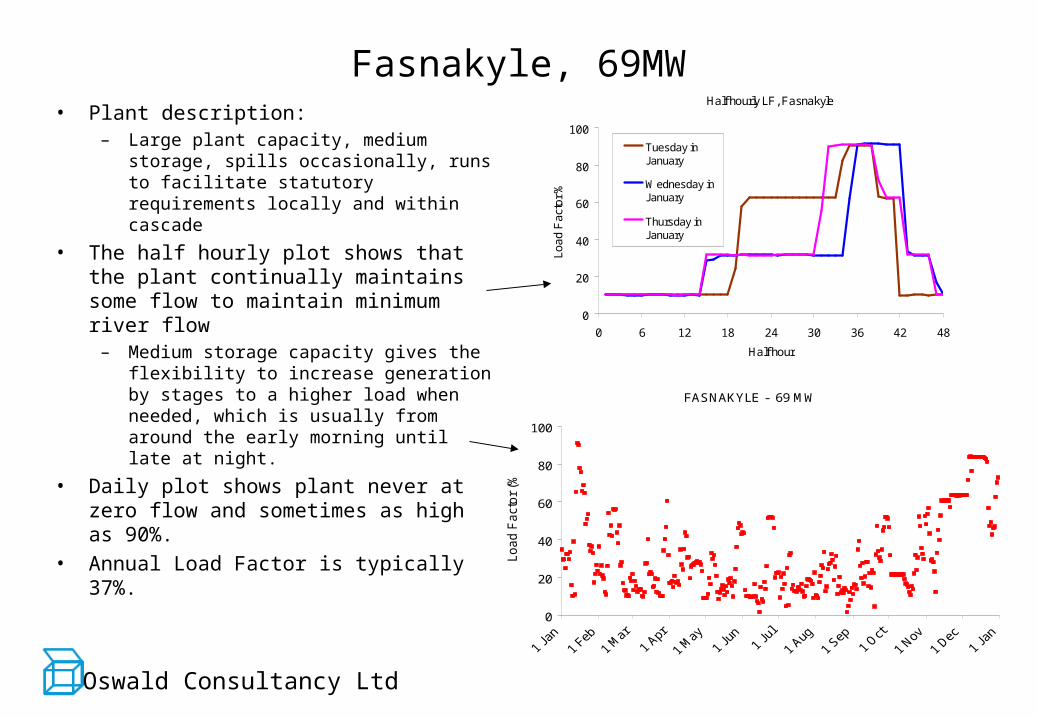
• Plant description:– Large plant capacity, medium storage,
spills occasionally, runs to facilitate statutory requirements locally and within cascade
• The half hourly plot shows that the plant continually maintains some flow to maintain minimum river flow
– Medium storage capacity gives the flexibility to increase generation by stages to a higher load when needed, which is usually from around the early morning until late at night.
• Daily plot shows plant never at zero flow and sometimes as high as 90%.
• Annual Load Factor is typically 37%.
FASNAKYLE - 69 MW
0
20
40
60
80
100
Load F
act
or
(%)
Fasnakyle, 69MW
Oswald Consultancy Ltd
Half hourly LF, Luichart
0
20
40
60
80
100
0 6 12 18 24 30 36 42 48
Half hour
Lo
ad
Fa
cto
r %
Tuesday in January
Wednesday in January
Thursday in January
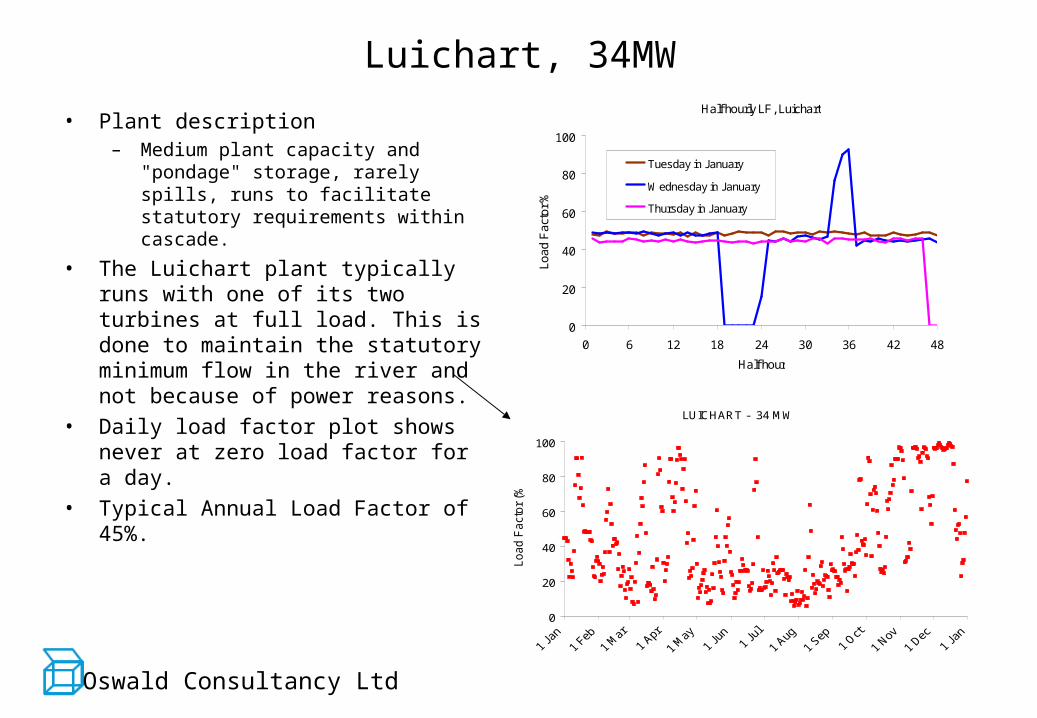
• Plant description– Medium plant capacity and "pondage"
storage, rarely spills, runs to facilitate statutory requirements within cascade.
• The Luichart plant typically runs with one of its two turbines at full load. This is done to maintain the statutory minimum flow in the river and not because of power reasons.
• Daily load factor plot shows never at zero load factor for a day.
• Typical Annual Load Factor of 45%. LUICHART - 34 MW
0
20
40
60
80
100
Load F
act
or
(%)
Luichart, 34MW

Oswald Consultancy Ltd
High Load Factor > 45%
Orrin 50%
Ceannacroc 50%
Cuileig 61%
Oswald Consultancy Ltd
Half hourly LF, Orrin
0
20
40
60
80
100
120
0 6 12 18 24 30 36 42 48
Half hour
Lo
ad
Fa
cto
r %
Tuesday in January
Wednesday in January
Thursday in January
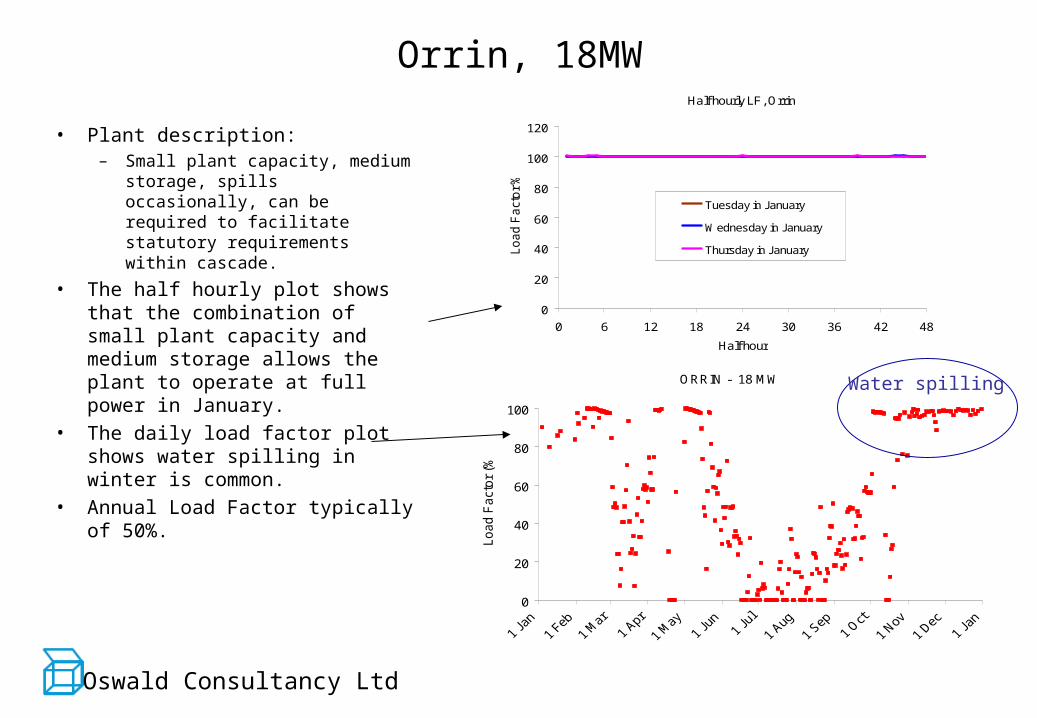
• Plant description:– Small plant capacity, medium
storage, spills occasionally, can be required to facilitate statutory requirements within cascade.
• The half hourly plot shows that the combination of small plant capacity and medium storage allows the plant to operate at full power in January.
• The daily load factor plot shows water spilling in winter is common.
• Annual Load Factor typically of 50%.
ORRIN - 18 MW
0
20
40
60
80
100
Load F
act
or
(%)
Orrin, 18MW
Water spilling
Oswald Consultancy Ltd
Half hourly LF, Ceannacroc
0
20
40
60
80
100
0 6 12 18 24 30 36 42 48
Half hour
Lo
ad
Fa
cto
r % Tuesday in January
Wednesday in January
Thursday in January
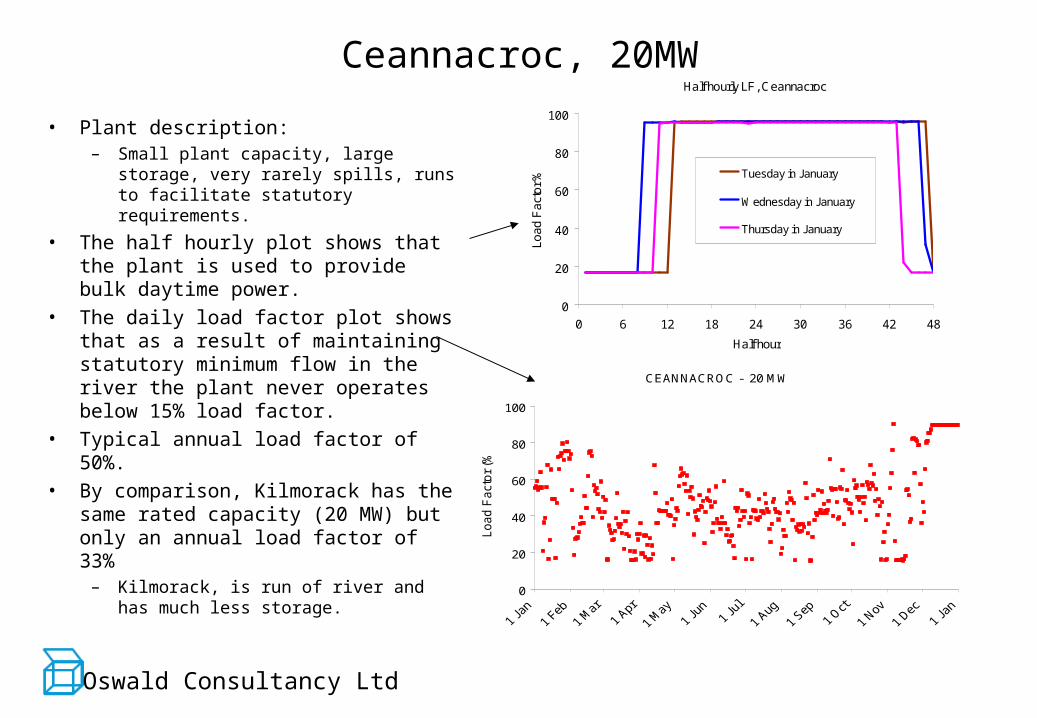
• Plant description:– Small plant capacity, large storage, very
rarely spills, runs to facilitate statutory requirements.
• The half hourly plot shows that the plant is used to provide bulk daytime power.
• The daily load factor plot shows that as a result of maintaining statutory minimum flow in the river the plant never operates below 15% load factor.
• Typical annual load factor of 50%.• By comparison, Kilmorack has the
same rated capacity (20 MW) but only an annual load factor of 33%
– Kilmorack, is run of river and has much less storage.
CEANNACROC - 20 MW
0
20
40
60
80
100
Load F
act
or
(%)
Ceannacroc, 20MW
Oswald Consultancy Ltd
Half hourly LF, Cuileig
0
20
40
60
80
100
0 6 12 18 24 30 36 42 48
Half hour
Lo
ad
Fa
cto
r %
Tuesday in January
Wednesday in January
Thursday in January
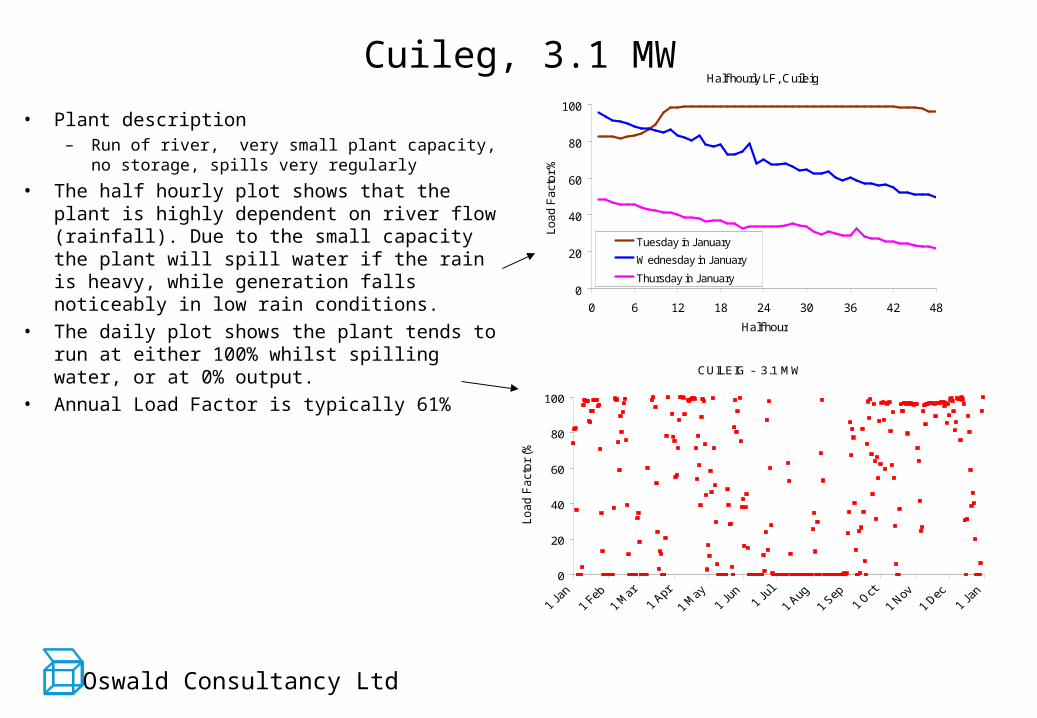
• Plant description– Run of river, very small plant capacity, no
storage, spills very regularly
• The half hourly plot shows that the plant is highly dependent on river flow (rainfall). Due to the small capacity the plant will spill water if the rain is heavy, while generation falls noticeably in low rain conditions.
• The daily plot shows the plant tends to run at either 100% whilst spilling water, or at 0% output.
• Annual Load Factor is typically 61%
CUILEIG - 3.1 MW
0
20
40
60
80
100
Load F
act
or
(%)
Cuileg, 3.1 MW
Oswald Consultancy Ltd
Conclusions
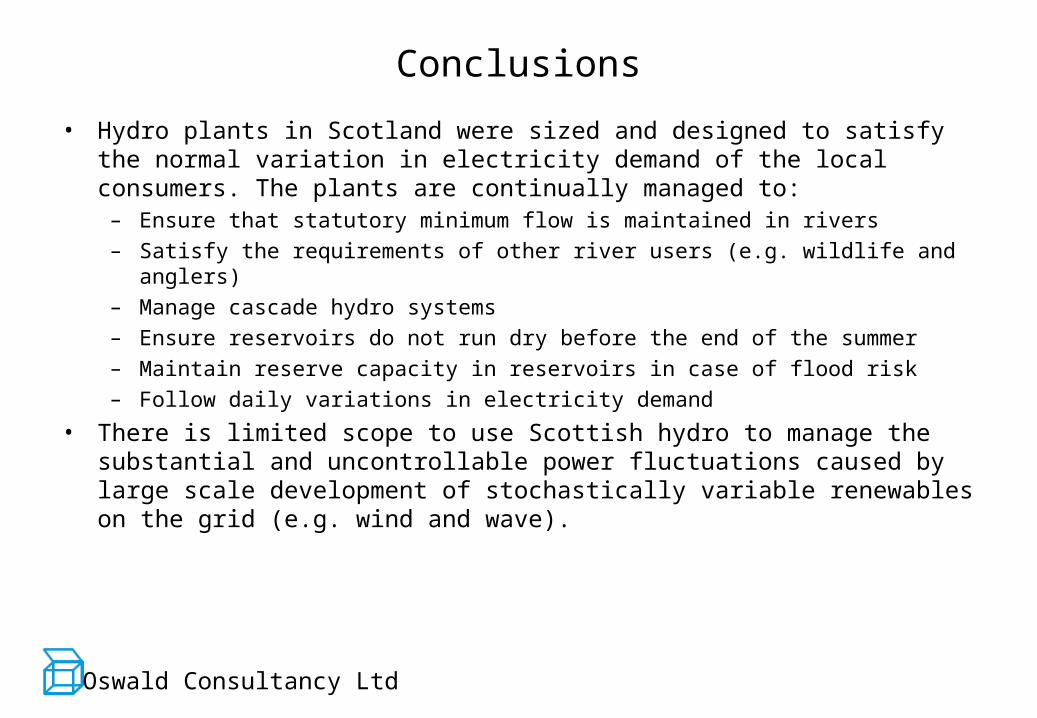
• Hydro plants in Scotland were sized and designed to satisfy the normal variation in electricity demand of the local consumers. The plants are continually managed to:
– Ensure that statutory minimum flow is maintained in rivers– Satisfy the requirements of other river users (e.g. wildlife and anglers)– Manage cascade hydro systems– Ensure reservoirs do not run dry before the end of the summer– Maintain reserve capacity in reservoirs in case of flood risk– Follow daily variations in electricity demand
• There is limited scope to use Scottish hydro to manage the substantial and uncontrollable power fluctuations caused by large scale development of stochastically variable renewables on the grid (e.g. wind and wave).