Embed Size (px)
Citation preview

Osumilite–melt interactions in ultrahigh temperature granulites:phase equilibria modelling and implications for the P–T–tevolution of the Eastern Ghats Province, India
F. J . KORHONEN,1 ,* M. BROWN,2 C. CLARK1 AND S. BHATTACHARYA3
1Department of Applied Geology, Curtin University, GPO Box U1987, Perth, WA 6845, Australia([email protected])2Laboratory for Crustal Petrology, Department of Geology, University of Maryland, College Park, MD 20742, USA3Geological Studies Unit, Indian Statistical Institute, Kolkata, India
ABSTRACT The exposed residual crust in the Eastern Ghats Province records ultrahigh temperature (UHT)metamorphic conditions involving extensive crustal anatexis and melt loss. However, there is dis-agreement about the tectonic evolution of this late Mesoproterozoic–early Neoproterozoic orogendue to conflicting petrological, structural and geochronological interpretations. One of the petro-logical disputes in residual high Mg–Al granulites concerns the origin of fine-grained mineral inter-growths comprising cordierite + K-feldspar � quartz � biotite � sillimanite � plagioclase. Theseintergrowths wrap around porphyroblast phases and are interpreted to have formed by the break-down of primary osumilite in the presence of melt trapped in the equilibration volume by the meltpercolation threshold. The pressure (P)–temperature (T) evolution of four samples from three locali-ties across the central Eastern Ghats Province is constrained using phase equilibria modelling in thechemical system Na2O–CaO–K2O–FeO–MgO–Al2O3–SiO2–H2O–TiO2–Fe2O3 (NCKFMASHTO).Results of the modelling are integrated with published geochronological results for these samples toshow that the central Eastern Ghats Province followed a common P–T–t history. This history ischaracterized by peak UHT metamorphic conditions of 945–955 °C and 7.8–8.2 kbar followed by aslight increase in pressure and close-to-isobaric cooling to the conditions of the elevated solidus at940–900 °C and 8.5–8.3 kbar. In common with other localities from the Eastern Ghats Province,the early development of cordierite before osumilite and the peak to immediate post-peak retro-grade reaction between osumilite and melt to produce the intergrowth features requires that theprograde evolution was one of contemporaneous increasing pressure with increasing temperature.This counter-clockwise (CCW) evolution is evaluated for one sample using inverse phase equilibriamodelling along a schematic P–T path of 150 °C kbar�1 starting from the low P–T end of the pro-grade P–T path as constrained by the phase equilibria modelling. The inverse modelling is executedby step-wise down temperature reintegration of sufficient melt into the residual bulk chemical com-position at the P–T point of the 1 mol.% melt isopleth at each step, representing the melt remain-ing on grain boundaries after each prograde drainage event, to reach the melt connectivitytransition (MCT) of 7 mol.%. The procedure is repeated until a plausible protolith composition isrecovered. The result demonstrates that clastic sedimentary rocks that followed a CCW P–T evolu-tion could have produced the observed mineral assemblages and microstructures preserved in thecentral Eastern Ghats Province. This study also highlights the role of melt during UHT metamor-phism, particularly its importance to both chemical and physical processes along the prograde andretrograde segments of the P–T path. These processes include: (i) an increase in diffusive lengthscales during the late prograde to peak evolution, creating equilibration volumes larger than a stan-dard thin section; (ii) the development of retrograde mineral assemblages, which is facilitated ifsome melt is retained post-peak; (iii) the presence of melt as a weakening mechanism and theadvection of heat by melt, allowing the crust to thicken; and (iv) the effect of melt loss, whichmakes the deep crust both denser and stronger, and reduces heat production at depth, limiting crus-tal thickening and facilitating the transition to close-to-isobaric cooling.
Key words: counter-clockwise P–T paths; Eastern Ghats Province; melt reintegration; osumilite; phaseequilibria modelling; UHT metamorphism.
*Present address: Geological Survey of Western Australia, East Perth WA 6004, Australia
© 2013 John Wiley & Sons Ltd 881
J. metamorphic Geol., 2013, 31, 881–907 doi:10.1111/jmg.12049

INTRODUCTION
Increasingly, ultrahigh temperature (UHT) metamor-phism is recognized from the hinterlands of colli-sional orogenic belts (Harley, 1998; Brown, 2006,2007; Kelsey, 2008). Under UHT conditions, clasticsedimentary rocks generate a significant volume ofmelt, but most of the melt produced along the pro-grade P–T path is thought to have been drained fromthese UHT rocks to explain their residual chemicalcompositions and to allow preservation of the largelyanhydrous close-to-peak mineral assemblages (e.g.Fyfe, 1973; Powell & Downes, 1990; Barboza &Bergantz, 2000; Brown, 2002; White & Powell, 2002,2010; Diener et al., 2008; Brown & Korhonen, 2009;Johnson et al., 2010, 2012; Korhonen et al., 2010).The strongly depleted nature of UHT metamorphicrocks leads to uncertainty over the original protolithcomposition in many cases. This uncertainty limitsthe application of forward phase equilibria modellingto UHT rocks. As a result, the prograde P–T evolu-tion for many UHT metamorphic rocks is largelyunconstrained and limited to inference.
Nonetheless, variable retrogression is apparent insome suites of UHT rocks. This retrogression indi-cates that melt generated around the metamorphicpeak may be trapped immediately post-peak by thepercolation threshold – the porosity at which a crys-tallizing rock becomes impermeable – at 8–11 vol.%melt for non-texturally equilibrated rocks (Cheadleet al., 2004). This trapped melt allows retrogradereaction to occur down temperature to the elevatedsolidus (Brown, 2002; White & Powell, 2002, 2011).In these suites of UHT rocks, retrograde mineralassemblages provide information critical to constrain-ing the overall form of the peak to post-peak P–Tpath (e.g. Brown & Raith, 1996; Raith et al., 1997;Kelsey et al., 2003; Baldwin et al., 2005; Harley,2008; Brown & Korhonen, 2009; Korhonen et al.,2013). This raises a question about whether peakmetamorphic conditions might be underestimated ifhigh-temperature retrograde reaction between peakminerals and melt trapped by the percolation thresh-old was cryptic.
These issues are addressed in this study usingexamples from the central Eastern Ghats Province, asubdivision of the Eastern Ghats orogenic belt inIndia (Dobmeier & Raith, 2003; Dasgupta et al.,2013). The Eastern Ghats Province is characterizedby the widespread occurrence of UHT metamor-phism. However, conflicting petrological and struc-tural interpretations relating to the P–T–time (t) path(counter-clockwise (CCW) v. clockwise (CW)) anddifficulties in deciphering the geological significanceof ages that span a range from the late Mesoprotero-zoic to the early Neoproterozoic (a single v. a poly-phase metamorphic evolution) have led to thedevelopment of contrasting tectono-metamorphicmodels for the evolution of the Province. In addition,
the interpretation of complex, sometimes enigmatic,microstructures and reaction textures has led to dif-ferent retrograde P–T trajectories (decompression v.cooling) with some fine-grained mineral intergrowthsbeing interpreted as either replacements of primaryminerals, particularly osumilite, or as representingproducts of melt crystallization.In this study, microstructural observations and
quantitative constraints from pseudosections calcu-lated in the chemical system Na2O–CaO–K2O–FeO–MgO–Al2O3–SiO2–H2O–TiO2–Fe2O3 (NCKFMASHTO)are used to define the P–T conditions of peak andretrograde metamorphism for four samples fromthree different localities in the central Eastern GhatsProvince. Several of these samples preserve fine-grained mineral intergrowths that are interpreted tohave formed by the breakdown of osumilite in thepresence of melt. These microstructures are commonin granulites throughout the central Eastern GhatsProvince, potentially indicating that osumilite waswidespread at the metamorphic peak across the Prov-ince, but was not preserved during the retrograde his-tory. Some rocks also preserve evidence for the pre-osumilite metamorphic mineral assemblages, whichprovide important constraints on the form of the P–T path. For one sample, a plausible protolith compo-sition is reconstructed using inverse phase equilibriamodelling in which melt is reintegrated into the resid-ual bulk chemical composition in a step-wise fashiondown temperature. The success of this exercise sug-gests that an overall CCW P–T–t path for the centralEastern Ghats Province is a reasonable interpretationof the available data. Based on the results of thisstudy, the role of melt during UHT metamorphism,particularly its importance to both chemical andphysical processes at all scales, is discussed and apossible tectonic model for this extreme type of high-T, moderate-P style of CCW metamorphism isproposed. We conclude that this type of UHT meta-morphism may be explained by a combination ofthinned lithosphere and radiogenic heating duringprograde thickening of crust weakened by the pres-ence of melt above the solidus.
GEOLOGICAL SETTING
Regional geology
The Eastern Ghats Belt extends over 1000 km alongthe eastern coast of Peninsular India (Fig. 1a) andexpose a deep crustal section through a compositeProterozoic orogenic belt. Despite broad lithologicalsimilarities, based on geological and isotopic data,the Eastern Ghats Belt has been separated into sev-eral discrete crustal segments with contrasting histo-ries, as follows: the Late Archean Jeyporeand Rengali Provinces, the Late PaleoproterozoicOngole Domain and the Mesoproterozoic–earlyNeoproterozoic Eastern Ghats Province (e.g. Rickers
© 2013 John Wiley & Sons Ltd
882 F . J . KORHONEN ET AL .

et al., 2001a; Dobmeier & Raith, 2003; Dasguptaet al., 2013).
The Eastern Ghats Province, which is the largestof these crustal segments, is located in the centraland northern parts of the Belt. It comprises most ofthe western and eastern khondalite belts, and thecharnockite–migmatite zone in Fig. 1a. The rocksexposed here preserve a complex imprint of pro-longed high-grade metamorphism and intense defor-mation. Previous petrological studies in the Provincehave reported estimates of peak UHT metamorphicconditions for the late Mesoproterozoic–early Neo-proterozoic orogenic event of > 950 °C and ~9 kbar,although there are differences in interpretation aboutwhether the P–T–t paths are CW or CCW, or
whether both exist but in different sectors of theProvince (e.g. Lal et al., 1987; Kamineni & Rao,1988; Sengupta et al., 1990; Dasgupta et al., 1995;Sen et al., 1995; Mohan et al., 1997; Mukhopadhyay& Bhattacharya, 1997; Shaw & Arima, 1997; Boseet al., 2000, 2006; Rickers et al., 2001b; Bhattacharya& Kar, 2002; Sarkar et al., 2003; Das et al., 2006,2011; Bose & Das, 2007; Nasipuri et al., 2008; Ko-rhonen et al., 2011, 2013; Dharma Rao et al., 2012).In addition to contrasting P–T–t paths, there are dis-parities in the number of metamorphic events recog-nized and in the timing and duration of the UHTmetamorphism, leading to conflicting tectono-meta-morphic models for the evolution of the EasternGhats Province (Bhattacharya & Kar, 2002; Boseet al., 2011; Das et al., 2011; Dasgupta et al., 2013;Dharma Rao et al., 2012; Gupta, 2012; Korhonenet al., 2013).Evidence for granulite facies metamorphism and
felsic magmatism between c. 1000 and c. 950 Ma hasbeen well documented (Grew & Manton, 1986; Shawet al., 1997; Mezger & Cosca, 1999; Bhattacharyaet al., 2003; Simmat & Raith, 2008; Das et al., 2011;Korhonen et al., 2011, 2013; Bose et al., 2011). How-ever, older ages ranging from c. 1400 Ma (U–Pb inzircon, Pb–Pb in feldspar – reviewed in Simmat &Raith, 2008) to c. 1250–1100 Ma (Th–U–Pb chemicalages retrieved from monazite – Simmat & Raith,2008) have been interpreted to date an early UHTmetamorphic event. As a result of these studies, acommon interpretation is that there was an earlyUHT event (M1) in which the metamorphic peakwas followed by close-to-isobaric cooling to ~750–800 °C. Furthermore, the ages of c. 1000–950 Maare argued to record a later pervasive granulite faciesevent (M2) that reached peak conditions of ~850 °Cand ~8 kbar before near-isothermal decompressionto ~5 kbar (Dasgupta & Sengupta, 2003; Simmat &Raith, 2008; Bose et al., 2011). Alternatively, theUHT metamorphism has been interpreted as a singlelong-lived event in the late Mesoproterozoic to earlyNeoproterozoic (e.g. Korhonen et al., 2011, 2013;Dharma Rao et al., 2012; Gupta, 2012). In a recentreview, Korhonen et al. (2013) proposed that the lateprograde to peak UHT metamorphism and initialclose-to-isobaric cooling occurred between c. 1130and c. 970 Ma. During close-to-isobaric cooling tothe solidus, crystallization of melt trapped by thepercolation threshold (Cheadle et al., 2004) resultedin populations of zircon and monazite that yieldweighted mean ages between c. 970 and c. 930 Ma.These ages are interpreted to reflect differences insolidus temperature from rock to rock across theProvince, consistent with a slow cooling rate of~1 °C Ma�1 during the retrograde stage of a singlelong-lived UHT metamorphic event (Korhonenet al., 2013).This study is located in the central part of the
Eastern Ghats Province (Fig. 1a), in Domain II of
(a)
(b)
Fig. 1. (a) Simplified geological map of the Eastern GhatsBelt; modified after Ramakrishnan et al. (1998) and Rickerset al. (2001a). (b) Google Earth image showing samplelocations.
© 2013 John Wiley & Sons Ltd
OSUMIL I TE MELT INTERACT IONS AT UHT 883

Rickers et al. (2001a). The dominant rocks includemigmatitic sillimanite–garnet-bearing gneiss (referredto locally as khondalite), orthopyroxene-free garnetif-erous quartzo-feldspathic gneiss (referred to locallyas leptynite), orthopyroxene-bearing charnockitic andenderbitic quartzo-feldspathic gneiss, and two-pyroxenemafic granulite. Small lenses of calcsilicate and highMg–Al granulites are present in the gneisses.
The local geology and outcrop setting for each ofthe samples studied in detail are described below,including a sample described previously from theSunki locality (sample SK2-6-05; Korhonen et al.,2011), which is reinterpreted as part of this study.For each of the samples, geochronological resultsfrom Korhonen et al. (2013) are summarized. Briefdiscussion of the P–T–t histories proposed in previ-ous studies of similar rocks from nearby localities isincluded for completeness. Unless otherwise indi-cated, these earlier interpretations have relied on pet-rogenetic grids in simplified chemical systems andconventional thermobarometry to determine P–Tconditions.
Paderu locality
Southwest of Paderu, in the area around GangarajaMadugula, pelitic migmatite, mafic granulite, char-nockite–enderbite, and intrusive granites are all wellexposed. Rare high Mg–Al granulites (Fig. 2a), somewith sapphirine, are present as small blocks andfolded layers within massif-type charnockite–enderbitebodies and as small blocks in granites.
In a study of sapphirine-bearing granulites nearGangaraja Madugula, Mohan et al. (1997) inter-preted the metamorphic peak to have been at> 900 °C and 8.4 kbar, which, they argued, was fol-lowed by a retrograde evolution that involved adecrease in pressure of up to 3 kbar and cooling of150–200 °C. In the area to the southwest of Gangara-ja Madugula, Bhattacharya & Kar (2002) proposedthat peak metamorphism was followed by high-tem-perature decompression from ~10 to ~8 kbar at1000 °C and subsequent cooling to a ~600 °C. Theseauthors inferred a CW P–T path and proposed a tec-tonic model in which crustal thickening and granulitemetamorphism was the result of homogeneous short-ening in a compressional setting. By contrast, Seng-upta et al. (2004) reinterpreted the data ofBhattacharya & Kar (2002) to argue that the decom-pression segment of the P–T path only began at apressure of ~7–8 kbar at a temperature of ~850 °Cand that it postdated cooling from peak UHT condi-tions. These authors inferred a general CCW P–T–tpath for the UHT metamorphism, broadly consistentwith the conclusions of Pal & Bose (1997; see alsoLal et al., 1987), who, 15 years earlier, had proposeda CCW path reaching peak conditions of ~1000 °Cand 9.5 kbar, followed by near-isobaric cooling to900 °C and 9 kbar.
For samples collected ~2 km northeast of Paderuat Panasapattu, Dharma Rao et al. (2012) proposeda minimum temperature of 1030–1050 °C at
(a)
(b)
(c)
Fig. 2. Field photographs of: (a) compositional layering inresidual granulite, with a distinct orthopyroxene-rich domainon the left of the photograph and an orthopyroxene-poor,garnet-rich domain on the right (Paderu locality); (b) darkerlayers in migmatite made up of coarse-grained orthopyroxeneand cordierite (Sunkarametta locality); and (c) migmatiticgranulite with coarse-grained peritectic garnet surrounded byleucosome (Sunkarametta locality).
© 2013 John Wiley & Sons Ltd
884 F . J . KORHONEN ET AL .

> 10 kbar for the peak of metamorphism, based onunivariant reactions in FMAS, results from phaseequilibria modelling in NCKFMASH and conventionalthermobarometry. They suggested that peak conditionswere followed by decompression to <10 kbar withsubsequent near-isobaric cooling to below 900 °C.Based on a record of UHT decompression precedingisobaric cooling, these authors proposed a CW P–Tpath, with the sapphirine granulites produced duringhigh temperature melting along the prograde seg-ment. Twenty-five years earlier, Lal et al. (1987) hadproposed a CCW path passing through 900 °C at6.5 kbar and 760 °C at 5 kbar for samples collected~1.5 km southwest of Paderu at Gunduru.
For this study, sample EGB-09-01 was collectedabout 4 km northeast of Gangaraja Madugula,approximately 12 km southwest of Paderu (Fig. 1b),and sample EGB-09-04 was collected about 2 kmnorth–northwest of sample EGB-09-01. Zircon fromsample EGB-09-01 yielded a weighted mean207Pb/206Pb age of 929 � 17 Ma, and monazite fromsample EGB-09-04 yielded a weighted mean207Pb/206Pb age of 968 � 20 Ma (Korhonen et al.,2013). These ages have been interpreted to record thetiming of final melt crystallization, with the variabil-ity in the weighted mean ages reflecting differences inthe temperature of the elevated solidus between thetwo samples.
Sunkarametta locality
Sample EGB-10-82 was collected approximately7 km northwest of Anantagiri and 1.5 km west ofSunkarametta (Fig. 1b). This area exposes migmatit-ic gneiss, mafic granulite and charnockite–enderbite.High Mg–Al granulite with either sapphirine or spi-nel (Fig. 2b) is present as small elongate bodieswithin the dominant migmatitic gneiss (Fig. 2c) nearthe margins with mafic and enderbitic granulites.Bose et al. (2000; see also Bose et al., 2006) haveinterpreted massive coarse-grained orthopyroxene–cordierite–sapphirine and migmatitic orthopyroxene–spinel granulites from this locality to be associatedwith prograde melting of biotite–plagioclase–quartz-bearing protoliths at pressures of ~6–8 kbar andtemperatures in excess of 850 °C, with peak meta-morphic conditions reaching ~9 kbar and ~950 °C,followed by slight decompression and cooling to~750–700 °C.
Monazite from sample EGB-10-82 yielded aweighted mean 207Pb/206Pb age of 953 � 7 Ma (Ko-rhonen et al., 2013) and monazite from a similarsample collected from the same outcrop yielded aweighted mean 207Pb/206Pb age of 948 � 5 Ma (sam-ple EGB-10-84; Korhonen et al., 2013). These ageshave been interpreted to record the timing of finalcrystallization of residual melt at the solidus. Addi-tional age information for the Sunkarametta localityis provided by sample EG-San3A from the study of
Bose et al. (2011). This orthopyroxene-bearing quar-tzo-feldspathic orthogneiss has a reported locationabout 120 m southwest of sample EGB-10-82. Ityielded a range of discordant 207Pb/206Pb spot agesfrom recrystallized domains in moderate-CL oscilla-tory-zoned zircon from c. 1600 to c. 1100 Ma, defin-ing a lower intercept age of 1008 � 49 Ma. Fournear concordant spot ages from bright-CL oscilla-tory-zoned grains range from c. 1025 to c. 950 Ma.A single spot age from an overgrowth domain has anage of c. 980 Ma.
Sunki locality
This locality is approximately 10 km south of Sunki(Fig. 1b) and exposes dominantly enderbites withsubordinate metasedimentary granulites. High Mg–Al granulite with or without sapphirine is present assmall bodies within metapelitic granulite (khonda-lite).Sample SK2-6-05 is a migmatitic high Mg–Al
granulite with discrete melanosomes and leucosomesranging in thickness from a few millimetres toseveral centimetres. Using phase equilibria model-ling, Korhonen et al. (2011) estimated peak P–Tconditions for this sample to have been in excessof 950 °C and 9.5 kbar, although pressure was notwell constrained. The retrograde evolution wasinterpreted to involve decompression and minorcooling to the elevated solidus at ~900 °C and7.5 kbar.Although osumilite was included in the phase equi-
libria modelling of this sample in Korhonen et al.(2011), it was not stable in any of the phase assem-blage fields in the pseudosections calculated in thatstudy. This appears to have been a consequence ofthe a–x model used for osumilite at that time.Because this study uses an updated osumilite a–xmodel in the phase equilibria modelling (see below),the phase equilibria modelling for sample SK2-6-05has been redone and the revised P–T pseudosectionis discussed below. The results from an additionalsample from that study (sample D1-3-S3; Korhonenet al., 2011) are also discussed. Based on this re-evaluation, the peak pressure estimated in Korhonenet al. (2011) may have been too high.Monazite analysed in situ from each of these two
samples yielded weighted mean 207Pb/235U ages ofc. 980 Ma, with a spread of 207Pb/235U spot agesfrom c. 1043 to c. 922 Ma (Korhonen et al., 2011,2013). A monazite inclusion in an orthopyroxeneporphyroblast was interpreted to date the lateprograde growth of the peak minerals at c. 1042 Ma,and the weighted mean ages of c. 980 Ma were inter-preted to date crystallization of residual melt trappedby the percolation threshold during cooling to thesolidus. The spread of ages reflects protracted mona-zite growth and implies very slow cooling from peakconditions at a rate of ~1 °C Ma�1.
© 2013 John Wiley & Sons Ltd
OSUMIL I TE MELT INTERACT IONS AT UHT 885

PETROGRAPHY AND PETROGENESIS
Petrographic observations are separated into thoserelating to the inferred prograde to peak UHT meta-morphic phase assemblages and those relating tomineral assemblages developed during the post-peakretrograde stage. Minerals that comprise the peakassemblage generally occur as coarse embayed grainsthat are commonly isolated from each other by coro-nae or intergrowths of finer grained minerals thatrepresent post-peak reaction products. Mineral chem-istry data have not been used in this study because ina slowly cooled, melt-present UHT terrane, mineralcompositions do not generally provide informationabout peak conditions but tend to record conditionsclose to the solidus, as seen, for example, for the Alcontents of orthopyroxene in the study of Korhonenet al. (2011) and discussed below.
Sample descriptions
Sample EGB-09-01 (Paderu locality)
In sample EGB-09-01, coarse-grained garnet por-phyroblasts (up to 10 mm in diameter), smaller orth-opyroxene porphyroblasts (up to 2 mm in diameter),quartz, plagioclase, K-feldspar, ilmenite and magne-tite comprise the inferred peak metamorphic mineralassemblage. Garnet has minor inclusions of biotite,ilmenite and magnetite (Fig. 3a). The orthopyroxeneis less abundant than garnet and may be in directcontact with it (Fig. 3a). Biotite is also present asminor inclusions in orthopyroxene and as coarselaths in the matrix, where it is inferred to be a post-peak phase. A second generation of garnet is charac-terized by having numerous fine-grained inclusions ofquartz, resulting in a distinct ‘spongy’ appearance.This secondary garnet typically forms rims aroundthe coarse-grained garnet porphyroblasts (Fig. 3b,c)and less commonly as rims around orthopyroxene,ilmenite and biotite (Fig. 3a–c).
Sample EGB-09-04 (Paderu locality)
In sample EGB-09-04, large embayed orthopyroxeneporphyroblasts (up to 8 mm in diameter), sillimanite,quartz and rutile form part of an inferred peak meta-morphic mineral assemblage (Fig. 4a), and define thefoliation on a centimetre scale. Sillimanite occurs assparse resorbed grains, which may contain fine ver-micular quartz inclusions. This type of sillimanite(Fig. 4a) is commonly separated from coarse-grainedorthopyroxene (Fig. 4b) by a fine-grained intergrowthof orthopyroxene + sillimanite + quartz � biotite.Coarse-grained quartz has fine rutile needles in coredomains (Fig. 4a), and displays undulose extinctionand elongate subgrains. A fine-grained intergrowthcomposed of cordierite + K-feldspar � quartz � bio-tite � sillimanite � plagioclase makes up a signifi-
(a)
(b)
(c)
Fig. 3. Photomicrographs from sample EGB-09-01 (Paderulocality). (a) Orthopyroxene adjacent to a garnet porphyroblast(bottom right). Both phases are rimmed by a secondgeneration of garnet (‘g2’), characterized by abundant fine-grained inclusions of quartz. (b) Rims of ‘g2’ garnet aroundgarnet, orthopyroxene and ilmenite. (c) Detail ofmicrostructure in (b). Mineral abbreviations: bi, biotite; cd,cordierite; g, garnet; ilm, ilmenite; ksp, K-feldspar; mt,magnetite; opx, orthopyroxene; pl, plagioclase; q, quartz; sa,sapphirine; sill, sillimanite; ru, rutile.
© 2013 John Wiley & Sons Ltd
886 F . J . KORHONEN ET AL .

(a) (b)
(c) (d)
(e) (f)
Fig. 4. Photomicrographs from sample EGB-09-04 (Paderu locality). (a) Orthopyroxene and sillimanite separated by a fine-grainedintergrowth of sillimanite + quartz (�biotite) replacing orthopyroxene. Coarse-grained quartz has fine rutile needles in the coredomains creating the ‘dirty’ appearance. (b) Garnet with abundant vermicular inclusions forming rims on orthopyroxene. Patchesof the fine-grained orthopyroxene + sillimanite + quartz intergrowth are also present. (c,d) Folia of intergrown cordierite + K-feldspar + quartz (�biotite � sillimanite � plagioclase) aligned in the foliation enclose resorbed orthopyroxene porphyroblasts;plane polarized (c) and cross-polarized (d) light respectively. (e,f) Intergrowths of cordierite + K-feldspar + quartz partiallypseudomorphing early cordierite and some patches of fine-grained intergrown orthopyroxene + sillimanite + quartz (�biotite) thatappear to be a pseudomorph after an earlier phase; plane polarized (e) and cross-polarized (f) light respectively.
© 2013 John Wiley & Sons Ltd
OSUMIL I TE MELT INTERACT IONS AT UHT 887

cant proportion of the sample (up to 20 vol.%;Fig. 4c–f). This intergrowth forms interstitial andcuspate films around matrix grains (Fig. 4c,d) anddiscrete patches (Fig. 4e,f). Coarse grains of cordie-rite are surrounded by the intergrowth (Fig. 4e,f),but the relationship between this generation of cor-dierite and the orthopyroxene–sillimanite–quartz–rutile assemblage remains unclear. In the absence ofinformation to the contrary, the cordierite is inferredto be a pre-peak or a peak phase. Thus, the peakmineral assemblage likely included cordierite, ortho-pyroxene, sillimanite, quartz and rutile. Minor garnetis present as discrete grains and as rare rims aroundorthopyroxene porphyroblasts (Fig. 4b), and is inter-preted to be a post-peak phase. Where adjacent tocoarse quartz in the matrix, the garnet has abundantvermicular inclusions of quartz, whereas adjacent tothe cordierite + K-feldspar � quartz � biotite � sil-limanite � plagioclase intergrowths, the garnet hasabundant inclusions of K-feldspar, biotite andquartz. Biotite occurs as rare inclusions in ortho-pyroxene, in the post-peak intergrowths, as inclusionsin garnet, and as coarse laths in the matrix.
Sample EGB-10-82 (Sunkarametta locality)
Sample EGB-10-82 comprises coarse-grained ortho-pyroxene, garnet, cordierite and quartz with lesseramounts of sapphirine, sillimanite, rutile, biotite,ilmenite, K-feldspar and plagioclase. Monazite andapatite are ubiquitous accessory phases. Orthopyrox-ene-rich and cordierite–quartz-rich layers ~2–5 mm inthickness define the foliation on a centimetre scale.There are sporadic garnet-rich layers throughout theoutcrop and garnet is present in some thin sections.
Orthopyroxene porphyroblasts (up to 5 mm) occurthroughout the sample as embayed grains with abun-dant exsolved Fe–Ti oxide lamellae (Fig. 5a,b). Silli-manite occurs as rare isolated and embayed grains(Fig. 5c,d) commonly surrounded by sillima-nite + quartz (� biotite) intergrowths near orthopy-roxene (Fig. 5c) or biotite near cordierite (Fig. 5d).Garnet porphyroblasts (up to 5 mm) are concen-trated in discrete layers with minor orthopyroxeneand rutile (Fig. 5e). A second generation of garnetwith numerous fine-grained inclusions of quartz
forms rims on the garnet porphyroblasts (‘g2’ onFig. 5e). Cordierite porphyroblasts (up to 3 mm) areabundant and are commonly surrounded by a fine-grained intergrowth of cordierite + K-feld-spar � quartz � plagioclase (Fig. 5a–g). Typically,orthopyroxene and cordierite are separated by fine-grained intergrowths of sillimanite + quartz � biotitewith rounded relicts of orthopyroxene that may beoptically continuous with coarse-grained porphyro-blasts (Fig. 5a,b), whereas orthopyroxene and quartzmay be in direct contact (Fig. 5b). Plagioclase is dis-tributed within the cordierite–K-feldspar domains asrounded grains, surrounded by moats of K-feldsparwith rounded cordierite � quartz. Rare elongategrains of sapphirine are present in some cordierite-rich layers (Fig. 5h), separated from orthopyroxene-rich layers by ~3–5 mm. The sapphirine grainsprimarily occur along grain boundaries of coarse-grained cordierite, but a few grains occur as inclu-sions. The cordierite-rich layers associated withsapphirine are not altered to the fine-grained cordie-rite + K-feldspar intergrowths. Sapphirine is inter-grown with and rimmed by sillimanite (Fig. 5h), andmay also be present as small rounded inclusions insillimanite. Small grains of orthopyroxene may formrims on the sillimanite + sapphirine associations.Based on these observations, the peak metamor-
phic mineral assemblage in this sample is interpretedto include orthopyroxene, cordierite, quartz, plagio-clase, ilmenite and rutile. Garnet is a peak phase insome layers and sapphirine in others, and sillimanitealso could be a peak phase. These interpretations willbe discussed in more detail below.
Sample SK2-6-05 (Sunki locality)
The peak metamorphic mineral assemblage in themelanosome of this sample is characterized by polyg-onal cordierite with orthopyroxene (up to 8 mm) andgarnet (up to 5 mm) porphyroblasts (fig. 3 in Korho-nen et al., 2011). Sillimanite is sparse, occurring assmall rounded or ragged grains within cordierite andas rare inclusions rimmed by cordierite hosted in gar-net. Modally minor quartz is present as smallrounded grains throughout the melanosome and asinclusions in garnet. Ilmenite grains with exsolved
Fig. 5. Photomicrographs from sample EGB-10-82 (Sunkarametta locality). (a) Coarse-grained orthopyroxene porphyroblasts withexsolution lamellae of oxide. Orthopyroxene and cordierite or cordierite + K-feldspar intergrowths are commonly separated byintergrown sillimanite + quartz (�biotite) that include rounded relics of orthopyroxene in optically continuity with theorthopyroxene porphyroblasts. (b) Orthopyroxene porphyroblasts adjacent to cordierite with rounded and optically continuousrelics and fine-grained intergrowths of sillimanite–quartz (�biotite). Orthopyroxene in direct contact with quartz lacks thismicrostructure. (c) Orthopyroxene porphyroblast and sillimanite are surrounded by a fine-grained intergrowth ofsillimanite + quartz (�biotite) along grain boundaries between cordierite grains. (d) Coarser grained sillimanite separated fromcordierite or cordierite + K-feldspar intergrowth by sillimanite hosting vermicular quartz (in boxes) and biotite, and fine-grainedrounded orthopyroxene aggregates. (e) Secondary garnet rims (‘g2’) with fine vermicular quartz inclusions located on a garnetporphyroblast overgrows the adjacent to cordierite + K-feldspar intergrowths. (f,g) Orthopyroxene and cordierite porphyroblastsare separated by folia of intergrown cordierite + K-feldspar; plane polarized (f) and cross-polarized (g) light, respectively. (h)Elongate grains of sapphirine as inclusions and along grain boundaries of coarse-grained cordierite. The sapphirine is intergrownwith and rimmed by sillimanite.
© 2013 John Wiley & Sons Ltd
888 F . J . KORHONEN ET AL .

(a) (b)
(c) (d)
(e) (f)
(g) (h)
© 2013 John Wiley & Sons Ltd
OSUMIL I TE MELT INTERACT IONS AT UHT 889

hematite lamellae are present in garnet-rich domains,either as inclusions in garnet porphyroblasts or asgrains in cordierite near garnet.
The immediate post-peak mineral assemblage isrepresented by recrystallized grains of garnet, ortho-pyroxene and quartz that are commonly developedalong the former grain boundaries between garnetand orthopyroxene porphyroblasts (fig. 3a in Korho-nen et al., 2011). Garnet relicts are common in sec-ond-generation cordierite. Biotite occurs as coarselaths and aggregates around garnet, orthopyroxeneand cordierite. These observations suggest that thepost-peak metamorphic mineral assemblage was gar-net, orthopyroxene, sillimanite, cordierite and biotite.
Fine-grained mineral intergrowths
Intergrowths composed of cordierite + K-feld-spar � quartz � orthopyroxene � biotite � sillimanite� plagioclase are abundant in the samples from thisstudy (Fig. 6) and in many samples from other stud-ies in the central Eastern Ghats Province (e.g. Boseet al., 2000, 2006; Bhattacharya & Kar, 2002; Bose &Das, 2009; Das et al., 2011; Korhonen et al., 2011).The intergrowths are present as discrete patches (e.g.Figs 4e & 6a,b), but may also form interstitial andcuspate films and folia around matrix grains (e.g.Figs 4c,d & 5f,g). Fine-grained vermicular cordie-rite � quartz occurs in a groundmass generally madeup of K-feldspar, which may continue as a thin filmalong grain boundaries of adjacent grains (Fig. 6a).Minor coarser grains of quartz and biotite are pres-ent within the intergrowths (Fig. 6a,b). Some inter-growths are zoned, with patches of cordierite + K-feldspar � quartz (� biotite � sillimanite) adjacentto cordierite + quartz (� biotite � sillimanite)(Fig. 6b,c). Some intergrowths also contain smallrounded grains of orthopyroxene (Fig. 6d,e). The in-tergrowths are aligned within the foliation and areamong the youngest microstructures observed in thesamples from this study; they wrap around primaryporphyroblasts and most other retrograde micro-structures. However, in some samples (e.g. EGB-09-04), late garnet overgrows the cordierite + K-feldsparintergrowths, with quartz inclusions in the garnetconcentrated near coarse quartz in the matrix, andK-feldspar, biotite and quartz inclusions concentratednear the cordierite + K-feldspar � quartz � bio-tite � sillimanite � plagioclase intergrowths (Fig. 6f).
Phase relations that relate to the formation of thisintergrowth (cordierite + K-feldspar � quartz � orth-opyroxene � biotite � sillimanite � plagioclase) areinvestigated in the silica-saturated ternary systemKAl2O–(Fe,Mg)O–Al2O3. Integrated chemical com-positions of these intergrowths (from Bose & Das,2009) are projected through SiO2 and plotted in theternary system in Fig. 7. These integrated composi-tions were either calculated from proportionsestimated by image analysis and mineral compositions
or based on broad area quantitative electron micro-probe scans (filled and open squares, respectively, inFig. 7). The results from the broad area scans show awide scatter of chemical compositions (Fig. 7), whichmay reflect inaccuracies associated with broad areascanning, since the use of image analysis and mineralcompositions has been shown to produce more reli-able results in other studies (e.g. Korhonen & Stout,2005).Representative phase compositions are also shown
in Fig. 7. Natural osumilite compositions from theliterature (n = 34; Berg & Wheeler, 1976; Ellis et al.,1980; Grew, 1982; Armbruster & Oberh€ansli, 1988;Arima & Gower, 1991; Audibert et al., 1995; Adjeridet al., 2013) and a predicted osumilite compositionfrom the phase equilibria modelling for sample EGB-09-04 (discussed below) are very similar (Fig. 7; yel-low and grey circles respectively). A predicted meltcomposition at peak conditions (calculated at 945 °Cand 8.3 kbar) for sample EGB-09-04 is also plottedin Fig. 7 (grey triangle). The integrated chemicalcompositions of the cordierite + K-feldspar inter-growths plot across the tielines joining the range ofosumilite compositions and the predicted melt com-position, suggesting that the intergrowths could havebeen formed by the breakdown of osumilite in thepresence of melt. Nonetheless, some of the integratedchemical compositions are slightly displaced off thecordierite–K-feldspar tieline in the direction of silli-manite, consistent with the minor amount of sillima-nite (+ quartz) observed in the intergrowths (e.g.Fig. 6c,e). Projecting the appropriate compositionsthrough sillimanite onto the cordierite–K-feldspartieline (grey diamonds, Fig. 7) shows that the inter-growths are typically composed of 28–52% K-feld-spar and 72–48% cordierite, similar to the range ofobserved proportions in Fig. 6. Two of the integratedchemical compositions determined by broad areascanning by Bose & Das (2009) plot close to the silli-manite–K-feldspar edge of the ternary diagram sug-gesting these areas may have been intergrowths ofmostly sillimanite + K-feldspar with minor cordieriteand a third composition plots with the natural os-umilites in Fig. 7.Based on the lack of crystal form, the common
absence of orthopyroxene and their occurrence asfolia wrapping other minerals, Bose et al. (2000,2008) and Bose & Das (2009) argued that this type ofintergrowth could not represent replacement after os-umilite. Instead, these authors proposed that the in-tergrowths were the last assemblage formed from thelate crystallization of trapped melt at ~800 °C and6.5–5.5 kbar, although they left open the possibilityof interaction between melt and residual minerals(Bose et al., 2008; Bose & Das, 2009). However, thereis no obvious mechanism by which a late-stage meltcould achieve the necessary conditions to make symp-lectitic intergrowths of this kind. Such intergrowthsin siliceous melts generally owe their origin to a state
© 2013 John Wiley & Sons Ltd
890 F . J . KORHONEN ET AL .

(a) (b)
(c) (d)
(e) (f)
Fig. 6. Backscatter electron images of cordierite + K-feldspar + quartz (� biotite) intergrowth microstructures. Within theintergrowth, lighter grey areas are K-feldspar and darker grey lamellae are cordierite. (a) Intergrowth forming a cuspate filmbetween matrix quartz grains. (b) Intergrowths showing compositional zoning, with cordierite + K-feldspar + quartz + biotite onthe right side of the intergrowth, and cordierite + quartz (with minor sillimanite and biotite) on the left side. (c) Highermagnification image of the cordierite + quartz (with minor sillimanite and biotite) portion. (d) K-feldspar groundmass withvermicular cordierite, quartz and minor sillimanite, orthopyroxene and plagioclase. Intergrowth surrounds a cordieriteporphyroblast. (e) Higher magnification image of the cordierite + quartz (+minor sillimanite, orthopyroxene) portion. (f) Garnet(‘g2’) with abundant vermicular inclusions to show quartz inclusions concentrated near the coarser quartz grains in the matrix, andK-feldspar, biotite and quartz inclusions concentrated near the cordierite + K-feldspar � quartz � biotite � sillimanite �plagioclase intergrowths.
© 2013 John Wiley & Sons Ltd
OSUMIL I TE MELT INTERACT IONS AT UHT 891

of high supersaturation of the melt in the crystallizingmineral components (in this case, cordierite + K-feldspar � quartz � orthopyroxene � biotite � silli-manite � plagioclase), a high rate of crystal growth(once nucleation and/or growth commences) and thehigh viscosity of the melt. These conditions are nor-mally achieved through liquidus undercooling, whichresults in local saturation and essentially one-dimen-sional (towards melt) crystal growth (London, 2009).Such a mechanism seems unlikely to apply at UHTconditions. Finally, the postulated origin by latecrystallization of trapped melt at ~800 °C and 6.5–5.5 kbar is not consistent with the results of thephase equilibria modelling presented below, which
yields both higher temperature and pressure for theformation of these intergrowths.In contrast, Bhattacharya & Kar (2002) interpreted
the cordierite + K-feldspar intergrowths to be pseud-omorphs after osumilite, based on reconstructedchemical compositions and the presence of relict os-umilite in one of the intergrowths. Similarly, the pre-ferred interpretation here is that the intergrowthsformed from the decomposition of osumilite in thepresence of melt trapped in the rock during coolingfrom peak conditions. The involvement of the meltserves two purposes. First, it explains the variablecomposition of the intergrowths (Fig. 7), which rep-resent different amounts of interaction between os-umilite and melt during replacement. Second, theosumilite + melt reaction is inferred to be a weaken-ing mechanism at the reaction sites allowing thedevelopment of the distinctive wrapping microstruc-ture (Figs 4c,d & 5a,f,g), including the folia of Boseet al. (2000).
PHASE EQUILIBRIA MODELLING
The conditions of metamorphism and the microstruc-tural evolution of two granulite samples (EGB-09-01and -04) from the Paderu locality and one sample(EGB-10-82) from the Sunkarametta locality areinvestigated using pseudosections based on bulk rockchemical compositions. These are residual composi-tions as a consequence of melt loss; thus, they aresuitable to determine the peak P–T conditions andthe immediate post-peak retrograde evolution. Inaddition, sample SK2-6-05 from the Sunki locality isremodelled using the melanosome compositionreported in Korhonen et al. (2011). Finally, a plausi-ble protolith composition was reconstructed for sam-ple EGB-10-82 using an inversion technique thatreintegrates melt into the residual composition in astepwise fashion down temperature along a schematicprograde P–T path of 150 °C kbar�1, as explainedbelow.The bulk chemical compositions were determined
by X-ray fluorescence spectroscopy (Table 1) using aPhillips 2404 XRF vacuum spectrometer at Franklin& Marshall College, USA, together with loss on igni-tion (LOI). FeO contents were analysed by Fe2+
titration also at Franklin & Marshall College, USA,and Fe2O3 contents were calculated by difference.The samples contain negligible MnO (<0.2 wt%,Table 1), which was not considered in the modelling.The calculations were performed using THERMO-
CALC version tc333 (Powell & Holland, 1988;updated June 2009) and the internally consistent ther-modynamic data set, tc-ds55s, a sapphirine-specificupdate of Holland & Powell (1998), as used in Kelseyet al. (2004). The calculations were undertaken inthe chemical system Na2O–CaO–K2O–FeO–MgO–Al2O3–SiO2–H2O–TiO2–Fe2O3 (NCKFMASHTO),which is currently the most realistic system in which
KAl2O (Fe,Mg)O
Al2O3
osm
melt
sill
cd
opxbiksp
Broad area scanImage analysis
Integrated cd–ksp compositions (from Bose & Das, 2009)
ksp: 28–52%cd: 72–48%
Predicted melt composition@ 8.3 kbar, 945 °C
Integrated compositionsprojected through sill
+ SiO2
Mineral compositionsNatural osumilite compositions
Predicted osm composition@ 8.3 kbar, 945 °C
Fig. 7. KAl2O–(Fe,Mg)O–Al2O3 ternary diagram projectedthrough SiO2 (after Bose & Das, 2009). Filled and opensquares represent recalculated compositions for cordierite +K-feldspar intergrowths (from Bose & Das, 2009) based onestimations by image analysis and broad area scansrespectively. Yellow circles are natural osumilite compositions(n = 34) from Berg & Wheeler (1976), Ellis et al. (1980), Grew(1982), Armbruster & Oberh€ansli (1988), Arima & Gower(1991), Audibert et al. (1995), and Adjerid et al. (2013). Greycircle and triangle are the calculated osumilite and meltcompositions, respectively, for sample EGB-09-04 at peakconditions (estimated at 945 °C and 8.3 kbar, although thesecalculated compositions do not change significantly with smallchanges in P–T); grey diamonds are the integratedcompositions projected through sillimanite (+quartz) onto thecordierite–K-feldspar tieline.
© 2013 John Wiley & Sons Ltd
892 F . J . KORHONEN ET AL .

melt-bearing equilibria can be calculated (Whiteet al., 2001, 2007, 2011).
The phases considered in the modelling and thecorresponding a–x models include biotite and melt(White et al., 2007), orthopyroxene and spinel–mag-netite (White et al., 2002), garnet (Diener et al.,2008), hydrous cordierite (Holland & Powell, 1998),sapphirine (Taylor-Jones & Powell, 2010), osumilite(modified from Holland et al., 1996 by T.J.B. Hol-land; pers. comm. via R.W. White, April 2012), K-feldspar and plagioclase (Holland & Powell, 2003)and ilmenite–hematite (White et al., 2000). The alu-minosilicates, quartz and rutile are treated as pureend-member phases. The mineral abbreviations are asfollows: bi – biotite; cd – cordierite; g – garnet; ilm –ilmenite, sensu lato; ksp – K-feldspar; ky – kyanite;liq – silicate liquid/melt; mt – magnetite; pl –plagio-clase; opx – orthopyroxene; osm – osumilite; q –quartz; ru – rutile; sa – sapphirine; sill – sillimanite;sp – spinel.
The H2O content used in the modelling wasadjusted, so that the final phase assemblage is stablejust above the solidus, assumed to reflect the condi-tions at which this assemblage would have been inequilibrium with the last remnants of melt (e.g.White et al., 2004; Diener et al., 2008). The effectsof H2O on the phase equilibria can also be evalu-ated using T/P–MH2O diagrams (e.g. Fig. 8a), asoutlined in Korhonen et al. (2011, 2012b). Similarly,the appropriate O (for Fe3+) content was evaluatedusing T–MO diagrams, which allow the effect ofFe2O3 on the phase equilibria to be assessed overthe range between all Fe as Fe2+ to all Fe as Fe3+
(e.g. Diener & Powell, 2010; Korhonen et al.,
2012b). In all samples considered in this study, theFeO:Fe2O3 proportion determined by Fe2+ titrationwas appropriate to reproduce the observed assem-blage on the T–MO diagrams, suggesting that sam-ple powders were not substantially oxidized duringor after sample preparation (cf. Fitton & Gill, 1970;Whipple et al., 1984).
Peak and retrograde evolution
Sample EGB-09-01
The subsolidus mineral assemblage preserved in thissample comprises garnet–orthopyroxene–magnetite–K-feldspar–biotite–quartz–plagioclase–ilmenite. AT–MH2O diagram was constructed at 9 kbar, which iswithin the range of previous estimates of peak pres-sure (Dasgupta et al., 1995; Rickers et al., 2001b;Sarkar et al., 2003; Bhattacharya et al., 2003; Korho-nen et al., 2011), to determine an appropriate H2Ocontent (Fig. 8a). The H2O contents investigatedrange from a near-anhydrous composition(MH2O = 0; Table 1) to a composition with a solidustemperature below 850 °C (MH2O = 1; Table 1). At9 kbar, the subsolidus mineral assemblage is stable atMH2O contents <0.2. At higher H2O contents, ortho-pyroxene is not predicted to be part of the peakassemblage, and the temperature of the solidus ismuch lower than is appropriate for such a residualgranulite facies assemblage (<850 °C; dashed line onFig. 8a). Based on these constraints, a MH2O value of0.10 (~0.4 mol.% H2O, Table 1; grey bar on Fig. 8a)was selected for subsequent modelling of this bulkcomposition.
Table 1. Bulk compositions.
Sample
XRF whole rock compositions (wt%)
SiO2 TiO2 Al2O3 Fe2O3 FeO MnO MgO CaO Na2O K2O LOI Total
EGB-09-01 62.62 1.41 15.60 3.24 5.47 0.15 1.99 4.38 1.76 2.83 0.71 100.16
EGB-09-04 67.56 0.93 13.68 1.78 4.24 0.06 8.03 0.17 0.44 2.03 0.96 99.88
EGB-10-82 68.03 0.68 16.06 0.55 4.60 0.06 6.99 0.49 0.38 1.05 1.42 100.31
SK2-6-05* 53.74 2.35 12.47 16.14 – 0.18 10.91 0.21 0.01 2.22 – 98.37
Sample Figs
Normalized molar proportion used for phase equilibria modelling
SiO2 TiO2 Al2O3 O FeO MgO CaO Na2O K2O H2O Total
EGB-09-01 8a (0) 67.86 1.15 9.96 1.32 7.60 3.21 5.09 1.85 1.96 0.01 100
8a (1) 65.19 1.10 9.57 1.27 7.30 3.08 4.89 1.77 1.88 3.94 100
8b (0) 68.49 1.16 10.05 0.00 7.67 3.24 5.14 1.86 1.98 0.41 100
8b (1) 66.78 1.13 9.80 2.50 7.48 3.16 5.01 1.82 1.93 0.40 100
8c,d 67.62 1.15 9.93 1.26 7.58 3.20 5.07 1.84 1.95 0.40 100
EGB-09-04 9 69.25 0.72 8.27 0.60 5.01 12.27 0.18 0.44 1.33 1.94 100
EGB-10-82 10 71.17 0.54 9.90 0.21 4.46 10.90 0.55 0.38 0.70 1.19 100
MI 1 11b 71.35 0.51 9.86 0.19 4.25 10.31 0.58 0.47 0.92 1.56 100
MI 2 11b 71.44 0.48 9.77 0.18 4.04 9.71 0.60 0.57 1.12 2.10 100
MI 3 11b 71.49 0.45 9.68 0.17 3.84 9.15 0.60 0.68 1.30 2.65 100
MI 4 11b 71.49 0.42 9.59 0.16 3.66 8.62 0.60 0.81 1.45 3.21 100
MI 5 11b 71.44 0.40 9.50 0.15 3.49 8.12 0.60 0.95 1.58 3.80 100
MI 6 11b 71.15 0.37 9.38 0.14 3.28 7.63 0.58 1.09 1.67 4.73 100
SK2-6-05* 12 55.25 1.82 7.56 2.11 12.49 16.72 0.23 0.01 1.46 2.36 100
FeO analysed by Fe2+ titration; Fe2O3 contents calculated by difference; *from Korhonen et al., 2011; –, not analysed;(0), x-axis = 0; (1), x-axis = 1.
© 2013 John Wiley & Sons Ltd
OSUMIL I TE MELT INTERACT IONS AT UHT 893

A T–MO diagram was constructed at 9 kbar usingthe adjusted H2O content (Fig. 8b). The changes inMO shown in Fig. 8b correspond to a range of possi-ble O contents from all Fe as Fe2+ to 67% Fe asFe3+ (Table 1). The observed mineral assemblage is
stable at temperatures below the solidus for MO con-tents >0.4 (Fig. 8b), which calculates to at least~27% Fe as Fe3+. Magnetite is not stable at lowerMO values. Based on the predicted phase assemblagesacross the range of Fe3+ contents, a MO value of
Sample EGB-09-01MH2O = 0.10; MO = 0.50(c) NCKFMASHTO (+ q + ksp + pl + ilm)
T (°C)
P (k
bar)
850
900
950
1000
1050
T (°
C)
MH2O
Sample EGB-09-01@ 9 kbar(a) NCKFMASHTO (+ q + pl + ilm)
g opxmt ksp
bi g mt
ksp big mt ksp bi liq
g opx mt ksp bi liq
g opx mt ksp liq
g opx mt liq
0850
900
950
1000
1050
T (°
C)
Sample EGB-09-01@ 9 kbar; MH2O = 0.10(b) NCKFMASHTO (+ q + pl + ilm)
g opx ksp liq
g opx mt ksp liq
gopxkspliq
g opx ksp bi liq
g ksp bi liq
g opx mt ksp bi liq
g opx mt ksp bi
g ksp bi liq
4
5
6
7
8
9
10
11
12
g opx mt liq
g opx mt bi
g opx bi
g bi
g biliq
g liq
g opx liq
g opx cd mt bi
opx cd mt bi
opx cd mt liq
opx mt liq g opx cd mt liq
g opx mt bi liq
MO 67% Feas Fe3+
0% Feas Fe3+
Fe titration ~ 35% Fe as Fe3+
0
opx mt liq
(d)
0.2 0.4 0.6 0.8 1 0.2 0.4 0.6 0.8 1
700 750 800 850 900 950 1000 1050 850 900 950 1000 10506
7
8
9
10
0.14
0.100.06
0.02
- opx
0.02
0.04
0.06
0.060.08
0.10
0.12
P (k
bar)
g opx mt liq
g opxmt bi
T (°C)
(d) NCKFMASHTO (+ q + ksp + pl + ilm)
g 0.100.14opx
?
0.100.15
- g
0.200.25
0.30
0.050.01
?
liq 0.10
Fig. 8. Calculated pseudosections for sample EGB-09-01. (a) T–MH2O diagram at 9 kbar. (b) T–MO diagram at 9 kbar. Grey barin (a) and (b) indicates H2O and O content used for subsequent modelling. (c) P–T pseudosection with proposed P–T path. (d)Isopleths of phase proportions (in mol.%). Solid red lines correspond to garnet; isopleth range is from 0.02 to 0.14 at an intervalof 0.04. Dotted purple lines correspond to orthopyroxene; isopleth range is from 0.02 to 0.12 at an interval of 0.02. Dashed bluelines correspond to melt; isopleth range is from 0.05 to 0.30 at an interval of 0.05. The heavy dashed line on all figures is thesolidus. Compositions used for modelling are listed in Table 1.
© 2013 John Wiley & Sons Ltd
894 F . J . KORHONEN ET AL .

0.50 (~35% Fe as Fe3+; grey bar on Fig. 8b)was selected to construct the P–T pseudosection(Fig. 8c). This estimate is equivalent to the FeO:Fe2O3 proportion determined by Fe2+ titration(Table 1).
The P–T pseudosection for sample EGB-09-01 isshown in Fig. 8c. In this pseudosection, the solidus ispredicted at temperatures between 830 and 900 °Cover the range of modelled pressures (4–12 kbar;dashed line on Fig. 8c), although the solidus temper-ature will vary slightly with any change in H2O con-tent. The elevated solidus reflects the residual bulkchemical composition of this sample, inferred to bedue to loss of melt at some point during the meta-morphic evolution. Biotite-out occurs at temperaturesjust above the solidus.
The peak phase assemblage in this sample isinferred to have been garnet–orthopyroxene–magne-tite–quartz–K-feldspar–plagioclase–ilmenite–melt,which is represented by the broad g–opx–mt–liq (+q,ksp, pl, ilm) field on Fig. 8c, stable at conditionsabove 860 °C between ~6 and ~11 kbar. Garnet andorthopyroxene � magnetite define the lower andupper pressure limits, respectively; cordierite is stableat pressures less than ~6 kbar.
Changes in predicted mineral abundance can beused to model mineral growth and consumption asa consequence of multivariant reactions during thepost-peak (retrograde) evolution (e.g. White et al.,2002; Kelsey et al., 2003; Diener et al., 2008;Korhonen et al., 2011). The P–T pseudosection forsample EGB-09-01 is contoured for mol.% garnet(solid lines; Fig. 8d) and orthopyroxene (dottedlines; Fig. 8d). The isopleths for mol.% garnet havesimilar slopes to those for orthopyroxene, but thechange in mol.% garnet with a decrease in pressureor temperature is the opposite of that for orthopy-roxene (increase and decrease in mol.%, respec-tively). Garnet with vermicular inclusions of quartz(�biotite, plagioclase, K-feldspar) rimming orthopy-roxene and garnet porphyroblasts (Fig. 3b) is inter-preted to be a second generation of garnet thatgrew close to the conditions of final melt crystalli-zation. These reaction relationships indicate anincrease in the mol.% of garnet (�biotite) at theexpense of orthopyroxene, which may occur alonga near-isobaric cooling path as temperaturedecreases across the peak phase assemblage field g–opx–mt–liq (+q–ksp–pl–ilm) and then across thenarrow g–opx–mt–bi–liq (+ q–ksp–pl–ilm) field,crystallizing a small amount of biotite (<4 mol.%),and into the subsolidus g–opx–mt–bi (+q–ksp–pl–ilm) field, where no further reaction is expected(Fig. 8d).
Sample EGB-09-04
The metamorphic mineral assemblage preserved inthis sample comprises biotite, garnet, cordierite, orth-
opyroxene, sillimanite, K-feldspar, plagioclase,quartz, ilmenite and rutile, which most likely reflectsconditions following final melt crystallization at thesolidus. A similar approach to that described abovefor sample EGB-09-01 was used to constrain appro-priate H2O and O contents for the P–T pseudosec-tion, which produces low H2O contents and confirmsthat the FeO:Fe2O3 proportion determined by Fe2+
titration (~24% Fe as Fe3+; Table 1) is a suitableestimate of O content.The P–T pseudosection for sample EGB-09-04 is
shown in Fig. 9a. In this pseudosection, theobserved mineral assemblage (without rutile) ispredicted to be stable at conditions just below thesolidus (Fig. 9b), represented by the very narrowbi–g–cd–opx–sill–ksp–pl (+q–ilm) field extending upto ~905 °C and 8.3 kbar (inset in Fig. 9b). Osumiliteis predicted to be stable at temperatures above~940 °C below ~8.4 kbar. Sapphirine is predicted atslightly higher temperatures above ~7.5 kbar. Cor-dierite + K-feldspar (+quartz � sillimanite, biotite,plagioclase) intergrowths commonly form thin filmsalong grain boundaries and wrap around primaryphases, including orthopyroxene and cordierite(Fig. 4c–f). These intergrowths are interpreted tohave formed by the breakdown of osumilite in thepresence of melt; thus osumilite (+cordierite + ortho-pyroxene) is inferred to have been part of the peakassemblage, represented by the cd–opx–osm–sill–ksp–ru–liq (+q–ilm) field in Fig. 9b. Cooling fromthe peak phase assemblage field into the cd–opx–sill–ksp–ru–liq (+q–ilm) field accounts for thedecomposition of osumilite and the growth of thecordierite–K-feldspar (+quartz � sillimanite, biotite,plagioclase) intergrowths (Fig. 9b). Further coolingextends into biotite-bearing fields, consistent withthe occurrence of sparse biotite in the post-peak in-tergrowths and in the matrix. The growth of garnetduring cooling is predicted at temperatures justabove the solidus (Fig. 9b, insert), which can explainthe symplectitic garnet in this sample, typicallyclosely associated with the cordierite + K-feldspar+ quartz intergrowths (Fig. 4b).The interpretation that the cordierite–K-feldspar
intergrowths represent peak to immediate post-peakretrograde reaction between osumilite and melttogether with the early development of cordieriteimplies that the prograde evolution was one of coevalincreasing temperature and increasing pressure(Fig. 9b). The peak and retrograde conditions con-strained by sample EGB-09-04 are consistent with theclose-to-isobaric cooling path determined from sam-ple EGB-09-01 (Fig. 9c). However, the P–T pseudo-sections for these samples are based on the residualbulk chemical composition; therefore, they are notappropriate to investigate the prograde history. Amethod to investigate the prograde evolution byinverse modelling of melt loss is described below forsample EGB-10-82.
© 2013 John Wiley & Sons Ltd
OSUMIL I TE MELT INTERACT IONS AT UHT 895

Sample EGB-10-82
The minerals present in this sample are orthopyrox-ene, garnet, sapphirine (along grain boundariesbetween cordierite and as inclusions in cordierite incordierite-rich layers), cordierite, sillimanite, K-feld-spar, biotite (sparse), plagioclase, quartz, ilmenite
and rutile, which, with the possible exception of sap-phirine, is interpreted to represent the solidus mineralassemblage. There is some compositional heterogene-ity in the sample larger than the scale of a thin sec-tion, with interspersed cm-scale garnet-rich layersand mm-scale sapphirine + cordierite layers. Ortho-pyroxene, sillimanite and cordierite are ubiquitous
8.1
8.2
8.3
8.4
8.5(b) NCKFMASHTO (+ q + ilm)
T (°C)
P (k
bar)
bi opx sillksp pl liq
bi cd opx sillksp pl liq
G
bi opxsill kspru liq
opx sill kspru liq
bi cd opxsill ksp
pl
bi g cd opxsill ksp pl
bi g cd opx ksppl
bi cdopx ksp pl
bi cd opxksp pl liq
sa opx sill ksp ruliq
sa opxksp ru liq
sa opx osmksp ru liq
opxosm
sill kspru liqcd opx sill
ksp ru liq
cd opx kspru liq
cd opx ksp pl ru liq
F
cdopxosmsill kspru liq
H
I
J
K
sa opx osm sill ksp ruliq
sa opxosm ru liq
cd sa opx osm ru liq
P (k
bar)
Sample EGB-09-04
6
7
8
9
10
bi opx sillksp pl
bi opxsill ksppl liq
opx sillksp ru liq
sa opx ksp ruliq
bi cd opxksp pl
cd opx liqcd opxosm liq
cd opx ksp plliq
sa opx ru liq
A
B
CD E
T (°C)
(a) NCKFMASHTO (+ q + ilm)
(b)
A. bi cd opx sill ksp plB. cd opx ksp liqC. cd opx osm ksp liqD. cd sa opx osm liqE. cd sa opx ru liq
890 900 910 920 930 940 950 960
850 900 950 1000 1050 850 900 950 1000 10506
7
8
9
10
T (°C)
(c) Proposed P–T path for Paderu locality
Sample EGB-09-04F. bi g cd opx ksp pl liqG. bi opx sill ksp liqH. bi cd opx sill ksp liqI. bi cd opx sill ksp pl ru liqJ. bi cd opx sill ksp ru liqK. cd opx sill ksp pl ru liq
bi g cd opxsill ksp pl liq
0.10
0.15
0.20
0.05
0.01
0.05
0.10
0.15
0.150.01
EGB-09-01
EGB-09-04
Fig. 9. (a) Calculated P–T pseudosection for sample EGB-09-04. (b) Expanded P–T range for the central part of the pseudosectionwith the proposed P–T path. (c) The two P–T paths for the samples from the Paderu locality. Dashed blue lines are calculatedcontours for melt proportion (in mol.%). Compositions used for modelling are listed in Table 1.
© 2013 John Wiley & Sons Ltd
896 F . J . KORHONEN ET AL .

throughout the sample. The H2O and O contentsused for the P–T pseudosection (Fig. 10a) wereassessed using T–MH2O and T–MO diagrams, asdescribed above.
The P–T pseudosection for sample EGB-10-82 isshown in Fig. 10a. Based on the observations above,the metamorphic mineral assemblage present at condi-tions just below the solidus is best approximated by
6
7
8
9
10
P (k
bar)
T (°C)
(a) NCKFMASHTO(+ q + pl + ilm + ru)
(b)
bi g opx sill liq
bi g sill liq
bi g cdopx sill
g opx sillksp liq
g cd opxsill ksp
g cd opxosm ksp
cd opxosm ksp
cd opx ksp
cd opxosm liq cd opx
liq
cd sa opx liq
sa opx liq(- ilm)
saopx liq
g saopx liq(- ilm)
A
A. sa opx liq (- pl, ilm)
850 900 950 1000 1050
930 940 950 960 970
7.7
7.9
8.1
8.3
8.5P
(kba
r)
T (°C)
(b) NCKFMASHTO (+ q + pl + ilm + ru)
g cd opx osm ksp
sa opx liq
g saopx liq
opx sill ksp liq
opxosm sill liq
cd opxosmsill liq
D
E
g cdopx osmksp liq
F
G
cd saopxosm
liq
H
I
J
L
g cd opxosm liq
g opx sill ksp liq
g cd opx sill ksp
B
C
K
bi g cdopx sill
bi g opxsill liq
bi g cd opx sillksp
cd opx osm ksp
cd opxosm ksp
liq
cd opxosm liq
bi g opxsill ksp
liq
Sample EGB-10-82
U
M
B. sa opx osm liqC. sa opx osm sill liqD. sa opx sill ksp liqE. sa opx sill liqF. cd opx osm sill ksp liqG. cd opx sill ksp liqH. g cd opx osm sill liqI. cd sa opx osm sill liqJ. g sa opx osm liqK. g cd sa opx osm liqL. g cd opx sill ksp liqM. bi g cd opx sill liqU. univariant reaction
Fig. 10. (a) Calculated P–T pseudosection for sampleEGB-10-82. (b) Expanded P–T range for the centralpart of the pseudosection. Compositions used formodelling are listed in Table 1.
© 2013 John Wiley & Sons Ltd
OSUMIL I TE MELT INTERACT IONS AT UHT 897

the bi–g–cd–opx–sill–ksp (+ q–pl–ilm–ru) field, whichis stable up to ~8.25 kbar at 910–915 °C (Figs 10b &11a). Biotite is not stable at temperatures >920 °C. Os-umilite is stable at temperatures >940 °C and sapphi-rine is stable at temperatures >950 °C above 7 kbar.The inferred peak phase assemblage in this sampleincludes cordierite, orthopyroxene, osumilite and melt(purple-shaded fields in Fig. 11). Garnet and sapphi-rine are also interpreted to be peak minerals, despitesome compositional control on their distribution fromlayer to layer, implying that the equilibration volumeat >> 900 °C is larger than the scale of a thin section.The P–T pseudosection predicts several small fieldswithin the stability of cd–opx–osm-bearing assem-blages (Figs 10b & 11a), including the occurrence ofgarnet between 945 and 965 °C from 7.4 to 7.9 kbar(stippled fields in Fig. 11a) and sapphirine (blue-shaded fields in Fig. 11a). These small phase assem-blage fields are generally consistent with the petro-graphic observations and the inferred peak phases,and likely have geological significance in a slowlycooled UHT terrane where cooling rates of~1 °C Ma�1 mean that it could take up to 10 Ma for asample to traverse these fields. However, in addition tothe uncertainties intrinsic to any calculated pseudosec-tion (Powell & Holland, 2008), slight changes in thechemical composition affect the existence of smallphase assemblage fields in pseudosections, so it is notsensible to deduce an exact P–T trajectory throughsuch fields. The arrow shown in Fig. 11a visualizes theuncertainty in the P–T path. This relatively wide swathshows that the P–T evolution may pass through anumber of small phase assemblage fields, but given theuncertainties involved, this does not have a significanteffect on the overall interpretation.
With these caveats, the peak P–T conditions areestimated at ~955 °C and ~7.8 kbar. Cooling withthickening from these conditions into the cd–opx–sill–ksp–liq (+q–pl–ilm–ru) field (from field F to field G onFig. 11a) accounts for the final elimination of osumi-lite in the presence of melt, which produced the inter-growths of the cordierite–K-feldspar (+ sillimanite).Further cooling with continued thickening crosses thenarrow g–cd–opx–sill–ksp–liq (+q–pl–ilm–ru) field(field L on Fig. 11a) at conditions just above the soli-dus, consistent with the growth of the second genera-tion of garnet that forms rims on the coarse-grainedgarnet porphyroblasts (Fig. 5e), into the bi–g–cd–opx–sill–ksp (+q–pl–ilm–ru) field by cooling across thesolidus, which is represented by a univariant reaction(labelled U on Fig. 11a) at ~8.25 kbar between915 and 910 °C, permitting the minor growth of bio-tite during final crystallization of the last dregs ofmelt.
Prograde evolution
The cordierite–K-feldspar intergrowths, which repre-sent the breakdown of osumilite in the presence of
melt, wrap around cordierite porphyroblasts in sev-eral samples and may indicate that the growth of cor-dierite predated osumilite. This interpretationrequires a CCW P–T path. The relationship betweencordierite and the intergrowths is particularly wellpreserved in sample EGB-10-82. Therefore, this sam-ple was selected for inverse phase equilibria model-ling.Reconstruction of a plausible bulk chemical com-
position for the protolith requires that melt thatdrained from the system during the prograde evolu-tion be reintegrated into the residual bulk chemicalcomposition via a series of down temperature stepsalong an inferred prograde P–T path. This inversemodelling involves the addition of melt of a composi-tion in equilibrium with the residue at a given pres-sure and temperature, progressing step by step tolower P–T conditions along the inferred P–T path(cf. White et al., 2004; Diener et al., 2008). There areseveral important unknowns in this process, includ-ing: the number of melt drainage events along theoriginal prograde P–T path and, therefore, the num-ber of reintegration steps required for the inversion;the amount of melt that drained from the system ineach of these events and, therefore, the amount ofmelt to reintegrate at each step in the inversion; andthe P–T conditions for each melt drainage eventalong the original prograde P–T path and, therefore,the P–T conditions along the inferred P–T pathwhere this melt should be reintegrated. These issuesare addressed next.In general, natural anatectic systems are neither
ideally open nor ideally closed on all length andtime-scales of deformation, particularly at outcropscale where they typically behave as conditionallyopen systems in which periods of melt buildup andmelt loss alternate (Handy et al., 2001; Brown, 2013;Yakymchuk et al., 2013). The melt volume at whichthis melt loss occurs is not well known and, in anycase, it will vary with temperature and strain rate.Notwithstanding, a value of 7 mol.% melt, which isapproximately equivalent to 7 vol.% on a one-oxy-gen basis, corresponding to the MCT of Rosenberg& Handy (2005), is commonly taken as an upperbound (Brown, 2010). Accordingly, this value istaken to be the point at which melt may have drainedfrom a melt-bearing source during the prograde evo-lution and, therefore, it is used as the step size forthe inverse reintegration of melt. However, the meltdoes not drain completely and a small volume(~1 vol.%) is likely to have been retained on grainboundaries after each drainage event (Sawyer, 2001).Based on this information, the procedure used forthe inversion involves backtracking down tempera-ture along a schematic prograde P–T path to a P–Tpoint where the amount of melt remaining in thephase assemblage field is 1 mol.%. At this point,6 mol.% melt of the composition in equilibrium withthe phase assemblage at these P–T conditions is rein-
© 2013 John Wiley & Sons Ltd
898 F . J . KORHONEN ET AL .

2
3
4
5
6
7
8
9
10
P (k
bar)
950 1000 1050T (°C)
900850650 700 750 800
cd opxosm pl liq
g opx sillksp pl ru liq
sa opx plru liq (- ilm)
g sa opxpl ru liq (- ilm)
cd opx pl liq
cdopx liq
cd opxpl ru liq
cd opx osmpl ru liq
5
10
1520
25
(a)
1
1
5
10
15
bi g kypl H2O
bi g kypl liq
bi cd sill pl liqbi cdsill plH2O
bi cd ksp pl liq
bi cd g sill pl liq
kysill
5
5
10
bi cd g sill pl
bi cd sill pl
bi cd opx ksp
pl liq
cd opxksp pl liq
1
1
5
5
10
bi cd gsill pl liq
Sample EGB-10-82 NCKFMASHTO (+ q + ilm)(b)
?
+ cd opx liq
+ g opx liq
+ g sa opx liq
+ bi cd opx liq
+ sa opx liq
+ cd opx osm liq
+ cd opx sill ksp liq
+ g
+ g
+ g
930 940 950 960 970
7.9
8.1
8.3
8.5
g cd opx osm ksp
sa opx liq
g saopx liqopx sill ksp liq
opxosm sill liqcd opxosm sill liq
DE
FG
cd saopxosm
liq
H
I
J
g opx sill ksp liq
g cd opx sill ksp
B. sa opx osm liqC. sa opx osm sill liqD. sa opx sill ksp liqE. sa opx sill liqF. cd opx osm sill ksp liqG. cd opx sill ksp liqH. g cd opx osm sill liqI. cd sa opx osm sill liqJ. g sa opx osm liqK. g cd sa opx osm liqL. g cd opx sill ksp liqM. bi g cd opx sill liqU. univariant reaction
B
C
K
bi g cdopx sill
bi g opxsill liq
bi g cd opx sillksp
cd opx osm ksp
cd opxosm ksp
liq
cd opxosm liq
bi g opx sill kspliq
L
7.7
7.5
7.3900 910 920
P (k
bar)
T (°C)
NCKFMASHTO (+ q + pl + ilm + ru)(a)
g cdopx osmksp liq
345
>150 °C kbar–1
6melt integration 1:
+ 6 mol.% melt2
g cd opxosm liq
15
10
15
10
10
5
1
U
M
+ g
Fig. 11. (a) Calculated P–T pseudosection for sample EGB-10-82 (derived from the upper part of Fig. 10b) with proposed P–Tpath. (b) Composite summary of pseudosection panels derived from the inverse modelling and melt reintegration. Phase fields aresimplified according to the colour-coding shown on the legend. In (b) the successive P–T pseudosection panels from right to leftshows the effect of changing bulk composition as melt is reintegrated on the phase assemblages. Melt is reintegrated at the1 mol.% melt isopleth down temperature along a schematic P–T path of 150 °C kbar�1. See text for further detail of themethodology. The final pseudosection panel (<750 °C) is derived from a plausible protolith composition. Dashed blue lines arecalculated contours for melt proportion (in mol.%). Compositions used for modelling are listed in Table 1.
© 2013 John Wiley & Sons Ltd
OSUMIL I TE MELT INTERACT IONS AT UHT 899

tegrated into the bulk chemical composition, resultingin 7 mol.% total melt at this P–T condition. Thisreproduces an amount of melt equivalent to theMCT at which melt is assumed to have drained onthe real prograde path. This procedure is the inverseof that adopted by Korhonen et al. (2012a) and Yak-ymchuck & Brown (2013) in their investigations ofthe effects of prograde melt loss. The reintegratedbulk chemical composition is then used to constructa new pseudosection and this pseudosection is usedfor the next melt reintegration step.
Whether the amount of melt used in the reintegra-tion affects the outcome significantly was assessed bya larger but arbitrary value of 10 mol.% and repeat-ing the reintegration. This procedure showed that thesize of the melt increment is not critical to the finaloutcome. Nevertheless, the size of the melt incrementdetermines the number of melt drainage events thathave to be inverted to reach a plausible protolithcomposition. Similarly, equilibrium melt composi-tions within the same phase assemblage field do notchange significantly with small changes in P–T; there-fore, the exact P–T point of the melt reintegrationstep is also not critical to the final outcome.
Starting from the P–T pseudosection for the resid-ual bulk rock chemical composition and the pointwhere the low P–T end of the high-temperature pro-grade segment of the P–T path constrained by thephase equilibria modelling intersects the 1 mol.%melt isopleth, the melt composition at this P–T pointwas used for the first melt reintegration step(Fig. 11b; step 1). From this P–T point, a schematicprograde P–T path of 150 °C kbar�1 was used forthe reintegration. Subsequent melt reintegration stepswere modelled by backtracking down temperaturealong this P–T path to the 1 mol.% isopleth andrepeating the procedure described above. The changein topology of the phase assemblage fields on the P–T pseudosection for each of the new bulk chemicalcompositions after each melt reintegration step isshown by successive pseudosection panels in Fig. 11b(the left-hand six panels down temperature from theright-hand panel, which is the pseudosection for thebulk rock chemical composition shown in Fig. 10a).
After reintegration of ~40 mol.% melt, the syn-thetic chemical composition used for the finalpseudosection approximates a plausible protolithcomposition as demonstrated by the presence of anH2O-saturated solidus between 650 and 690 °C(Fig. 11b, left-hand panel). A possible prograde evo-lution can be assessed by following an arbitrary P–Tpath across the sequence of pseudosections from thefictive protolith chemical composition in the left-handpanel, through six melt drainage events, as repre-sented by the middle five panels (between steps 6 and1), to the final residual bulk rock chemical composi-tion in the right-hand panel (above the temperaturefor step 1), to connect with the low P–T end of thehigh-temperature prograde segment of the P–T path
constrained by the phase equilibria modelling. Anarbitrary P–T evolution predicts a plausible assem-blage of bi–cd–sill–pl–liq (+q, ilm) during initial melt-ing and requires an elevated thermal gradient toreach the peak P–T conditions. The growth of ortho-pyroxene is predicted at intermediate temperatures(green-shaded fields in Fig. 11b), with an increase inmelt production across each phase assemblage fieldas temperature increases (dashed lines in Fig. 11b),followed by the disappearance of biotite and thegrowth of cordierite at higher temperatures (orange-shaded fields in Fig. 11b), again with an increase inmelt production across each phase assemblage field(dashed lines in Fig. 11b). Osumilite-bearing assem-blages are predicted at high temperature and moder-ate pressure conditions (purple-shaded fields inFig. 11b). Although this arbitrary prograde evolutionis an outcome predetermined by the inversion meth-odology, it is nonetheless a plausible progression thatleads to the sequence of cordierite growth followedby osumilite along a CCW P–T path.
P–T–t evolution of samples from the Sunki locality: arevaluation
The new results from this study discussed above showthat samples from two different localities in the centralEastern Ghats Province shared a similar metamorphicevolution with peak conditions of approximately950 °C and 8 kbar, and post-peak cooling to the soli-dus with a slight increase in pressure. The P–T pathsare interpreted to be CCW. In contrast, for the sam-ples from the Sunki locality (SK2-6-05, D1-3-S3), Ko-rhonen et al. (2011) estimated peak P–T conditions tohave been in excess of 950 °C and 9.5 kbar. Further-more, these authors argued that the metamorphic peakwas followed by decompression and cooling to the ele-vated solidus at ~900 °C and 7.5 kbar. This interpreta-tion implies a CW P–T evolution that contrasts withthe new results herein.The predominant zircon and monazite age popula-
tions at Paderu, Sunkametta and Sunki all yieldweighted mean ages in the interval c. 980–930 Ma(Korhonen et al., 2011, 2013). These ages are inter-preted to record close-to-isobaric cooling from peakUHT conditions and growth of zircon and/or mona-zite near the elevated solidus for individual samples.Thus, the UHT metamorphism in the central EasternGhats Province is interpreted to be a single event thatwas essentially coeval at all three localities.This raises the question of whether the contrasting
P–T paths (CW v. CCW) are correct or whether theimplied CW evolution at Sunki was a flawed interpre-tation. To address these discrepancies, and to incor-porate the recently updated a–x model for osumilitein the interpretation in appropriate samples from theSunki locality, sample SK2-6-05 is reinvestigatedhere. The results from sample D1-3-S3 reported inKorhonen et al. (2011) are also discussed.
© 2013 John Wiley & Sons Ltd
900 F . J . KORHONEN ET AL .

The P–T pseudosection for sample SK2-6-05 isshown in Fig. 12. This rock contains sparse sillima-nite as rounded or ragged grains within cordierite.The sillimanite was interpreted by Korhonen et al.(2011) as a post-peak phase that formed duringdecompression from the inferred peak phase field ofg–opx–liq (+q, ilm; Fig. 12). Notwithstanding, aninterpretation that the sillimanite is primary is alsoconsistent with the microstructures, which wouldresult in a peak phase assemblage of g–opx–sill–liq(+q, ilm), stable at lower pressures at > 950 °C(Fig. 12). There is no evidence in this sample for theformer presence of osumilite, which, therefore,defines a lower pressure limit at ~8.4 kbar. Sparsebiotite inclusions in cordierite (fig. 3c in Korhonenet al., 2011) imply minor biotite growth contempora-neous with or just prior to cordierite nucleation andgrowth. These features suggest that the retrogradeP–T path passed through the bi–g–opx–sill–liq (+q,ilm) and bi–cd–g–opx–sill–liq (+q, ilm) fields (field Bon Fig. 12), consistent with cooling and slight decom-pression just before final melt crystallization atthe elevated solidus around 900 °C and 8.3 kbar(Fig. 12). The microstructures described in detail byKorhonen et al. (2011) for this sample are consistentwith the revised P–T trajectory shown in Fig. 12.
The Al content in orthopyroxene was also used byKorhonen et al. (2011) to estimate peak conditions>950 °C and 9 kbar. Sample SK2-6-05 contains orth-opyroxene cores with maximum y(opx) (=xAl,M1)contents of 0.17–0.18 (Korhonen et al., 2011; unpub-lished data, F.J. Korhonen). Temperatures predictedby these y(opx) values and the calculated temperatureof the elevated solidus shown in Fig. 12 are within2r uncertainty, suggesting that the Al contents inorthopyroxene may record the conditions close to
crystallization of the last vestiges of melt during thehigh-temperature retrograde history.To summarize, the results from sample SK2-6-05
indicate peak temperatures in excess of 950 °C(Fig. 12). Pressure is more poorly constrained, but theinferred peak phase assemblage (g–opx–sill–liq–q–ilm)limits pressure to between ~8.4 and 9.7 kbar (Fig. 12).The retrograde P–T path recorded is characterized bycooling and slight decompression to the elevated soli-dus around 900 °C and 8.3 kbar (Fig. 12).The post-peak P–T path retrieved from sample
D1-3-S3 in Korhonen et al. (2011) is consistent withthe revised trajectory retrieved from sample SK2-6-05(Fig. 12). However, the spinel-bearing equilibriareported in Korhonen et al. (2011; fig. 8d) arepredicted to be metastable with respect to sapphirine-bearing equilibria. This discrepancy may be due toeither nucleation issues of sapphirine in the equilibra-tion volume leading to the metastable growth ofspinel, or, more likely, to oversimplifications in thephase equilibria modelling. The presence of 1.2–1.4 wt%ZnO in spinel from sample D1-3-S3 (Korhonen et al.,2011; unpublished data, F.J. Korhonen) shows thatZnO is an important component and that NCKF-MASTHO is a smaller chemical system than thatcontrolling the equilibria. Therefore, phase equilibriamodelling in the NCKFMASTHO system for sampleD1-3-S3 could produce spurious results. Despite thelimitations of modelling this sample, the cordie-rite + K-feldspar intergrowths interpreted to bepseudomorphs after osumilite are well preserved insample D1-3-S3. These intergrowths surroundinferred peak or near-peak orthopyroxene andcordierite porphyroblasts (fig. 4d in Korhonen et al.,2011), similar to observations from samples EGB-09-04 and EGB-10-82.
850 900 950 1000 10506
7
8
9
10
bi g opx pl
bi gopx liq
g opx liqbig
opxplliq
g opx sill liq
opx sill liqA
bi g opxsill pl
bi cd gopx osm pl
bi cdopx osm pl
B
C
D
E
F
cd opx sill liq
cd opx liq
cd opxosm liq
Sample SK2-6-05
T (°C)
P (k
bar)
+ osm
NCKFMASHTO (+ q + ilm)
bi cd g opxsill pl
bi g opxsill liq
A. bi g opx sill pl liqB. bi cd g opx sill liqC. bi cd g opx osm pl liqD. bi cd g opx osm liqE. bi cd opx osm pl liqF. bi cd opx osm liq
0.20
0.25
0.30
0.050.01
Fig. 12. Revised* P–T pseudosections forsample SK2-6-05 with proposed P–T pathfrom Sunki locality. Solid portion indicatesthat part of the path is well constrained byequilibria, whereas the dashed path isinferred. Osumilite-bearing equilibria occurwithin heavy black line; labelled ‘+ osm’,which provide a lower pressure limit forthis sample. Dashed blue lines arecalculated contours for melt proportion (inmol.%). The heavy dashed line is thesolidus. Composition used for modelling islisted in Table 1. * From Korhonen et al.(2011).
© 2013 John Wiley & Sons Ltd
OSUMIL I TE MELT INTERACT IONS AT UHT 901
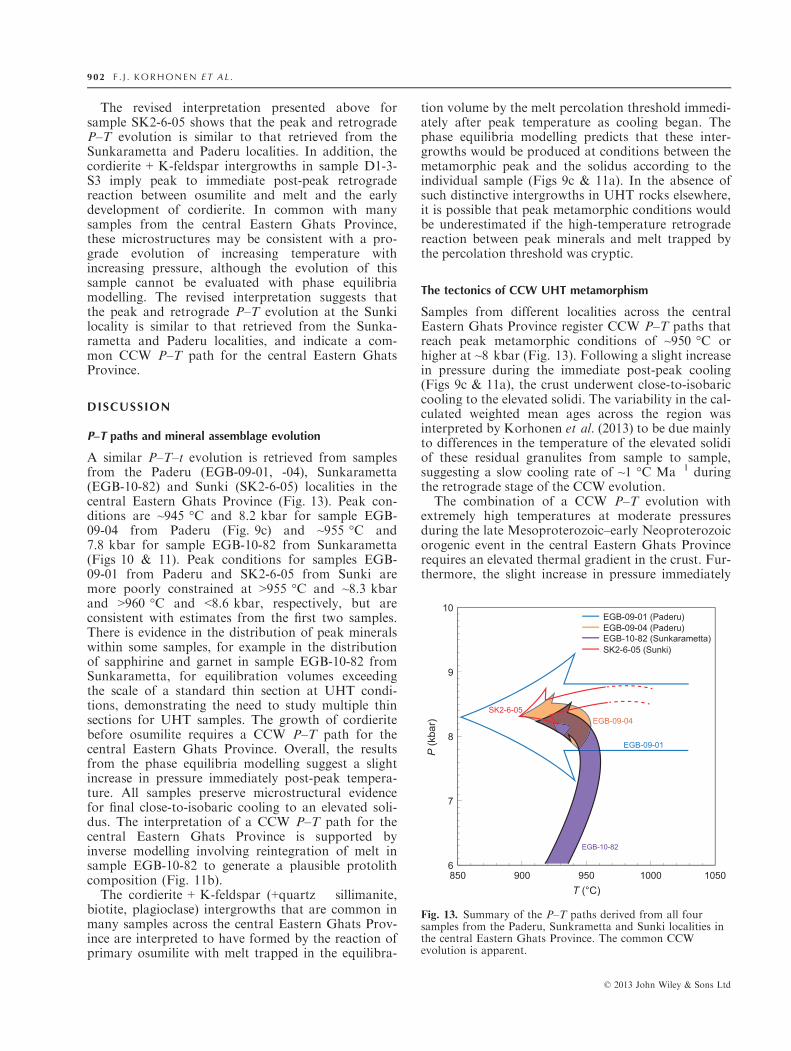
The revised interpretation presented above forsample SK2-6-05 shows that the peak and retrogradeP–T evolution is similar to that retrieved from theSunkarametta and Paderu localities. In addition, thecordierite + K-feldspar intergrowths in sample D1-3-S3 imply peak to immediate post-peak retrogradereaction between osumilite and melt and the earlydevelopment of cordierite. In common with manysamples from the central Eastern Ghats Province,these microstructures may be consistent with a pro-grade evolution of increasing temperature withincreasing pressure, although the evolution of thissample cannot be evaluated with phase equilibriamodelling. The revised interpretation suggests thatthe peak and retrograde P–T evolution at the Sunkilocality is similar to that retrieved from the Sunka-rametta and Paderu localities, and indicate a com-mon CCW P–T path for the central Eastern GhatsProvince.
DISCUSSION
P–T paths and mineral assemblage evolution
A similar P–T–t evolution is retrieved from samplesfrom the Paderu (EGB-09-01, -04), Sunkarametta(EGB-10-82) and Sunki (SK2-6-05) localities in thecentral Eastern Ghats Province (Fig. 13). Peak con-ditions are ~945 °C and 8.2 kbar for sample EGB-09-04 from Paderu (Fig. 9c) and ~955 °C and7.8 kbar for sample EGB-10-82 from Sunkarametta(Figs 10 & 11). Peak conditions for samples EGB-09-01 from Paderu and SK2-6-05 from Sunki aremore poorly constrained at >955 °C and ~8.3 kbarand >960 °C and <8.6 kbar, respectively, but areconsistent with estimates from the first two samples.There is evidence in the distribution of peak mineralswithin some samples, for example in the distributionof sapphirine and garnet in sample EGB-10-82 fromSunkarametta, for equilibration volumes exceedingthe scale of a standard thin section at UHT condi-tions, demonstrating the need to study multiple thinsections for UHT samples. The growth of cordieritebefore osumilite requires a CCW P–T path for thecentral Eastern Ghats Province. Overall, the resultsfrom the phase equilibria modelling suggest a slightincrease in pressure immediately post-peak tempera-ture. All samples preserve microstructural evidencefor final close-to-isobaric cooling to an elevated soli-dus. The interpretation of a CCW P–T path for thecentral Eastern Ghats Province is supported byinverse modelling involving reintegration of melt insample EGB-10-82 to generate a plausible protolithcomposition (Fig. 11b).
The cordierite + K-feldspar (+quartz � sillimanite,biotite, plagioclase) intergrowths that are common inmany samples across the central Eastern Ghats Prov-ince are interpreted to have formed by the reaction ofprimary osumilite with melt trapped in the equilibra-
tion volume by the melt percolation threshold immedi-ately after peak temperature as cooling began. Thephase equilibria modelling predicts that these inter-growths would be produced at conditions between themetamorphic peak and the solidus according to theindividual sample (Figs 9c & 11a). In the absence ofsuch distinctive intergrowths in UHT rocks elsewhere,it is possible that peak metamorphic conditions wouldbe underestimated if the high-temperature retrogradereaction between peak minerals and melt trapped bythe percolation threshold was cryptic.
The tectonics of CCW UHT metamorphism
Samples from different localities across the centralEastern Ghats Province register CCW P–T paths thatreach peak metamorphic conditions of ~950 °C orhigher at ~8 kbar (Fig. 13). Following a slight increasein pressure during the immediate post-peak cooling(Figs 9c & 11a), the crust underwent close-to-isobariccooling to the elevated solidi. The variability in the cal-culated weighted mean ages across the region wasinterpreted by Korhonen et al. (2013) to be due mainlyto differences in the temperature of the elevated solidiof these residual granulites from sample to sample,suggesting a slow cooling rate of ~1 °C Ma�1 duringthe retrograde stage of the CCW evolution.The combination of a CCW P–T evolution with
extremely high temperatures at moderate pressuresduring the late Mesoproterozoic–early Neoproterozoicorogenic event in the central Eastern Ghats Provincerequires an elevated thermal gradient in the crust. Fur-thermore, the slight increase in pressure immediately
850 900 950 1000 10506
7
8
9
10
T (°C)
P (k
bar)
EGB-09-01 (Paderu)
EGB-10-82 (Sunkarametta)EGB-09-04 (Paderu)
SK2-6-05 (Sunki)
EGB-10-82
EGB-09-01
SK2-6-05EGB-09-04
Fig. 13. Summary of the P–T paths derived from all foursamples from the Paderu, Sunkrametta and Sunki localities inthe central Eastern Ghats Province. The common CCWevolution is apparent.
© 2013 John Wiley & Sons Ltd
902 F . J . KORHONEN ET AL .

post-peak temperature and the close-to-isobaric cool-ing to the solidus (Fig. 13) imply that the crust was notsignificantly overthickened and the erosion rate waslow. The elevated thermal gradient indicates that addi-tional heat flux from the mantle was most likelyinvolved, possibly via replacement of the lithosphericmantle with melt-bearing asthenospheric mantle dur-ing early extension prior to contractional thickeningduring the prograde heating to the metamorphic peak.In addition, the residual granulites in the central East-ern Ghats Province are characterized by higher thanaverage heat production (Senthil Kumar et al., 2007).Thus, it is likely that the original sedimentary succes-sion would have generated more heat by radioactivedecay than average crust during thickening (Clarket al., 2011; Bea, 2012).
The early stage of the tectonic scenario describedabove for the central Eastern Ghats Province is simi-lar to results of 2D petrological–thermomechanicalnumerical modelling of orogenesis for an upper man-tle temperature of 150 °C above the present dayvalue and radiogenic heat production of 1.5 times thepresent value (Sizova et al., 2013). Such values arereasonable for the late Mesoproterozoic (Herzberget al., 2010). In particular, the numerical experimentsthat develop the truncated hot collision regime of Siz-ova et al. (2013) may provide an appropriate initialcondition for the development of UHT metamor-phism via a CCW P–T evolution as seen in the cen-tral Eastern Ghats Province. In the experiments ofSizova et al. (2013), during the subduction phase,dehydration of the slab weakens the overriding plate,which undergoes extension associated with decom-pression melting of the mantle wedge and replace-ment of the subcontinental lithospheric mantle byhot melt-bearing asthenospheric mantle prior to shal-low slab breakoff. The extension and lithosphericthinning generates a wide sedimentary basin withhigher than average heat flow in <10 Ma (figs 7 & 10in Sizova et al., 2013). Subsequent shortening of thishot thinned lithosphere in response to far-fieldapplied stress would generate a CCW P–T–t evolu-tion that would return the crust to ‘normal’ thick-ness. When combined with a high heat-producingsedimentary infill, the thickening could have achievedUHT metamorphic conditions, particularly given theslow evolution implied by the zircon and monazitegeochronology of Korhonen et al. (2013), whichshows that the crust of the central Eastern GhatsProvince sustained UHT conditions for >>50 Ma,and perhaps for as long as 200 Ma from c. 1130 to c.930 Ma.
The role of melting and melt migration in the evolution ofCCW orogens
At the local scale, anatectic systems may be open(melt is drained) or closed (melt is retained) or condi-
tionally open (cyclic closed- and open-system behav-iour), although at the scale of the crust, anatecticsystems must have been open as they represent thesource for upper crustal granites (Handy et al., 2001;Brown, 2013). In general, as crust continues to heatand thicken after the prograde P–T path crosses thesolidus, melt volume increases to a threshold value,at which point the melt nucleates rheological instabil-ities that lengthen and connect to allow melt drainagefrom the anatectic system (Handy et al., 2001;Brown, 2010, 2013). However, the amount of meltbuildup required to trigger a local melt drainageevent and the frequency of these events will be afunction of strain rate and/or temperature, and it isplausible that at UHT conditions, strain rates werelow enough that parts of the crust would havedeformed by granular flow. In these circumstances, ifthe melt production rate locally exceeded the meltsegregation rate, melt could be squeezed out of thesystem fast enough to pre-empt the formation of rhe-ological instabilities and the system would becomeunconditionally open (Handy et al., 2001).Nothwithstanding, the behaviour of an anatectic
system is likely to vary spatially and temporallyaccording to protolith fertility, rheology and strainrate (Handy et al., 2001; Yakymchuk & Brown,2013; Yakymchuk et al., 2013). Thus, along the pro-grade P–T path, the orogenic crust could haveundergone cycles of melt-induced weakening fol-lowed by hardening until UHT conditions, althoughthe threshold for melt extraction may not have beenthe same from lithology to lithology, and in anycase, the MCT of Rosenberg & Handy (2005) likelyrepresents a maximum (Brown, 2010). At UHT con-ditions, the crust could have become sufficientlyweak, at least locally, that melt drainage was effec-tively continuous from some lithologies. This is con-sistent with the variability in the amount and styleof leucosome preserved in UHT granulites, both inthe study area (Fig. 2) and elsewhere (e.g. Guernina& Sawyer, 2003; Zhang et al., 2012). In a comple-mentary effect, during the prograde evolution, heatwould have been advected through the orogen, bothdisplacing the growing thermal anomaly to shallowercrustal levels and promoting weakening of the oro-genic infrastructure (cf. Brown & Solar, 1999; Leitch& Weinberg, 2002).Prograde thermal weakening was enhanced by
melting, melt migration and advection of heat thatwould have enabled the crust to thicken under gran-ulite facies to UHT metamorphic conditions (Sandi-ford & Powell, 1991). Close to the metamorphicpeak, as the deep crust became progressively moreresidual and drier due to cumulative melt loss, italso became denser and stronger (Menegon et al.,2011; Yakymchuk & Brown, 2013) limiting then ter-minating thickening. This effect was associated witha reduction in heat production as high heat-produc-
© 2013 John Wiley & Sons Ltd
OSUMIL I TE MELT INTERACT IONS AT UHT 903

ing elements, particularly K and Th, were lost withfugitive melt to shallow levels in the crust. Assum-ing uniform melt loss across the UHT domains, thisprocess could result in long-term cooling of theresidual crust by several tens of degrees (Sandifordet al., 2002). Such a postulate is consistent with thetime-scale for the CCW P–T evolution in the centralEastern Ghats Province, which recent geochronolog-ical data suggest occurred over a prolonged periodon the order of >>50 to 200 Ma (Korhonen et al.,2013). Concomitantly, thickening of the underlyingsubcontinental lithospheric mantle displaced theasthenosphere to greater depth reducing the heatflux from the mantle.
The interpretation that the fine-grained mineral in-tergrowths, which may form more than 20 vol.% ofthe rock, were formed by the breakdown of osumilitein the presence of melt has implications for theamount of melt retained at the metamorphic peak.The amount of melt at the metamorphic peak maybe estimated from the melt contents predicted by thephase equilibria modelling. Predicted melt amountsat peak conditions are typically 5–20 mol.% basedon the residual bulk compositions (Figs 8d, 9b &11b; Table 1). The slight increase in pressure follow-ing peak temperature in the central Eastern GhatsProvince could reflect final thickening due to thepresence of this melt, which is terminated once meltis trapped by the percolation threshold and begins tocrystallize during cooling. By this stage, both heatingand crustal thickening had ceased, enabling the tran-sition to close-to-isobaric cooling in crust that wasnot overthickened to the extent of becoming gravita-tionally unstable.
CONCLUSIONS
The similarity in the P–T paths retrieved from multi-ple samples from several localities in the central East-ern Ghats Province using a combination ofmicrostructural interpretation and phase equilibriamodelling reduces the ambiguity associated withinterpreting single samples. Therefore, the results ofthis study provide confidence in the interpretationthat the central Eastern Ghats Province achievedUHT metamorphic conditions and experienced acommon CCW evolution. This confidence is sup-ported by the results of inverse phase equilibria mod-elling, which demonstrate that CCW P–T evolutioncould have produced the observed mineral assem-blages and microstructures in one particular sample.A possible tectonic evolution for the central EasternGhats Province is proposed involving extension ofthe continental lithosphere during hot collision priorto slab breakoff followed by renewed convergenceand thickening in response to far-field applied stress.
This study shows that the equilibration volumes atUHT conditions may be larger than the scale of astandard thin section, which makes deciphering the
history of such rocks challenging and requires studyof multiple thin sections. Furthermore, the P–Tpseudosections constructed for the high Mg–Al gran-ulites used in this study predict the stability of multi-ple small phase assemblage fields at close-to-peakmetamorphic conditions. This confirms that thesebulk compositions are highly reactive and susceptibleto significant mineralogical change over small P, Tintervals, and demonstrates the usefulness of theserocks as recorders of mineral assemblage evolutionduring UHT metamorphism, especially for slowlycooling terranes. It also suggests that the presence orabsence of such small phase assemblage fields inpseudosections is likely to be sensitive to the bulk (ordomainal) composition used. These features demandthat great care be taken when applying phase equilib-ria modelling to UHT rocks.The results from this study highlight the role of
melting during UHT metamorphism and its impor-tance to both chemical and physical processes fromthe thin section scale to the crustal scale. At the thinsection scale, the development of retrograde mineralreaction assemblages is facilitated by the presence ofmelt trapped by the percolation threshold as coolingbegins. As a result of this study, we speculate thatpeak metamorphic conditions may sometimes beunderestimated where high-temperature retrogradereaction between peak minerals and melt trapped bythe percolation threshold was cryptic.At the crustal scale, the extensive melting predicted
to occur along the prograde evolution for UHTmetamorphism initially weakens the deep crust, butmelt loss redistributes melt and heat causing weaken-ing in the overlying orogenic suprastructure and den-sification and strengthening of the orogenicinfrastructure. For CCW orogens, these processesenable thickening to occur during the high-tempera-ture part of the prograde evolution to the metamor-phic peak. Conversely, because drainage of meltleads to densification and strengthening of the deepercrust, overall thickening is limited. Redistribution ofthe high heat-producing elements, particularly K andTh, leads to long-term cooling in the source andallows orogens of this type to evolve isobarically toan elevated solidus.
ACKNOWLEDGEMENTS
We thank R.W. White and D. Kelsey for useful dis-cussions about osumilite stability, and S. Mertzmanfor XRF analyses at Franklin & Marshall College.D. Kelsey and J. Baldwin provided constructivereviews that enabled us to significantly improve thestudy during revision. We also thank R.W. Whitefor careful editorial comments. This project wasfunded through the DIISR Australia–India StrategicFund project ST030046. C. Clark acknowledgessalary and research support from DECRA(DE120103067).
© 2013 John Wiley & Sons Ltd
904 F . J . KORHONEN ET AL .

REFERENCES
Adjerid, Z., Godard, G., Ouzegane, K.H. & Kienast, J.-R.,2013. Multistage progressive evolution of rare osumi-lite-bearing assemblages preserved in ultrahigh-temperaturegranulites from In Ouzzal (Hoggar, Algeria). Journal ofMetamorphic Geology, 31, 505–524.
Arima, M. & Gower, C.F., 1991. Osumilite-bearing granulitesin the Eastern Granville Province, Eastern Labrador, Can-ada: mineral parageneses and metamorphic conditions. Jour-nal of Petrology, 32, 29–61.
Armbruster, T. & Oberh€ansli, R., 1988. Crystal chemistry anddouble-ring silicates: structural, chemical, and optical varia-tion in osumilites. American Mineralogist, 73, 858–594.
Audibert, N., Hensen, B.J. & Bertrand, P., 1995. Experimentalstudy of phase relations involving osumilite in the systemK2O–FeO–MgO–Al2O3–SiO2–H2O at high pressure and tem-perature. Journal of Metamorphic Geology, 13, 331–344.
Baldwin, J.A., Powell, R., Brown, M., Moraes, R. & Fuck,R.A., 2005. Mineral equilibria modeling of ultrahigh-temper-ature metamorphism: an example from the An�apolis-Itauc�uComplex, central Brazil. Journal of Metamorphic Geology,23, 511–531.
Barboza, S.A. & Bergantz, G.W., 2000. Metamorphism andanatexis in the mafic complex contact aureole, Ivrea zone,northern Italy. Journal of Petrology, 41, 1307–1327.
Bea, F., 2012. The sources of energy for crustal melting andthe geochemistry of heat-producing elements. Lithos, 153,278–291.
Berg, J.H. & Wheeler, E.P, 1976. Osumilite of deep-seated ori-gin in the contact aureole of the anorthositic Nain complex,Labrador. American Mineralogist, 61, 29–37.
Bhattacharya, S. & Kar, R., 2002. High-temperature dehydra-tion melting and decompressive P-T path in a granulite com-plex from Eastern Ghats, India. Contributions to Mineralogyand Petrology, 143, 175–191.
Bhattacharya, S., Kar, R., Teixeira, W. & Basei, M., 2003.High-temperature crustal anatexis in a clockwise P-T-t path:isotopic evidence from a granulite–granitoid suite in theEastern Ghats belt, India. Journal of the Geological Society,London, 160, 39–46.
Bose, S. & Das, K., 2007. Sapphirine + quartz assemblage incontrasting textural models from the Eastern Ghats Belt,India: implications for stability relations in UHT metamor-phism and retrograde processes. Gondwana Research, 11,492–503.
Bose, S. & Das, K., 2009. Cordierite–K-feldspar–quartz sym-plectite and its implication on the reworking of isobaricallycooled crust: a case study from the Eastern Ghats belt,India. Indian Journal of Geology, 78, 55–78.
Bose, S., Fukuoka, M., Sengupta, P. & Dasgupta, S., 2000. Evo-lution of high-Mg–Al granulites from Sunkarametta, EasternGhats, India: evidence for a lower crustal heating–cooling tra-jectory. Journal of Metamorphic Geology, 18, 223–240.
Bose, S., Das, K., Dasgupta, S., Miura, H. & Fukuoka, M.,2006. Exsolution textures in orthopyroxene in aluminousgranulites as indicators of UHT metamorphism: new evidencefrom the Eastern Ghats Belt, India. Lithos, 92, 506–523.
Bose, S., Das, K. & Arima, M., 2008. Multiple stages andmelting and melt–solid interaction in the lower crust: newevidence from UHT granulites of the Eastern Ghats Belt,India. Journal of Mineralogical and Petrological Sciences,103, 266–272.
Bose, S., Dunkley, D.J., Dasgupta, S., Das, K. & Arima, M.,2011. India-Antarctica-Australia-Laurentia connection in thePaleoproterozoic–Mesoproterozoic revisited: evidence fromnew zircon U-Pb and monazite chemical age data from theEastern Ghats Belt, India. Geological Society of AmericaBulletin, 123, 2031–2049.
Brown, M., 2002. Retrograde processes in migmatites and gran-ulites revisited. Journal of Metamorphic Geology, 20, 25–40.
Brown, M., 2006. Duality of thermal regimes is the distinctivecharacteristic of plate tectonics since the Neoarchean. Geol-ogy, 34, 961–964.
Brown, M., 2007. Metamorphic conditions in orogenic belts: arecord of secular change. International Geology Review, 49,193–234.
Brown, M., 2010. The spatial and temporal patterning of thedeep crust and implications for the process of melt extrac-tion. Philosophical Transactions of the Royal Society, Ser. A,368, 11–51.
Brown, M., 2013. Granite: from genesis to emplacement. Geo-logical Society of America Bulletin, 125, 1079–1113.
Brown, M. & Korhonen, F.J., 2009. Some remarks on meltingand extreme metamorphism of crustal rocks. In: Physics andChemistry of the Earth’s Interior (eds Gupta, A.K. & Das-gupta, S.), pp. 66–88. Springer (India) Private Limited, NewDelhi.
Brown, M. & Raith, M., 1996. First evidence of ultrahigh-tem-perature decompression from the granulite province ofSouthern India. Journal of the Geological Society, London,153, 819–822.
Brown, M. & Solar, G.S., 1999. The mechanism of ascent andemplacement of granite magma during transpression: a syn-tectonic granite paradigm. Tectonophysics, 312, 1–33.
Cheadle, M.J., Elliott, M.T. & McKenzie, D., 2004. Percola-tion threshold and permeability of crystallizing igneousrocks: the importance of textural equilibrium. Geology, 32,757–760.
Clark, C., Fitzsimons, I.C.W., Healy, D. & Harley, S.L., 2011.How does the continental crust get really hot? Elements, 7,235–240.
Das, K., Bose, S., Ohnishi, I. & Dasgupta, S., 2006. Gar-net-spinel intergrowths in ultrahigh temperature granulite,Eastern Ghats, India: possible evidence of an early Tscher-mak rich orthopyroxene during prograde metamorphism.American Mineralogist, 91, 375–384.
Das, K., Bose, S., Karmakar, S., Dunkley, D.J. & Dasgupta,S., 2011. Multiple tectonometamor-phic imprints in thelower crust: first evidence of ca. 950 Ma (zircon U-PbSHRIMP) compressional reworking of UHT aluminousgranulites from the Eastern Ghats Belt. India. GeologicalJournal, 46, 217–239.
Dasgupta, S. & Sengupta, P., 2003. Indo-Antarctic correlation:a perspective from the Eastern Ghats Granulite Belt, India.In: Proterozoic East Gondwana: supercontinent assembly andbreakup, Vol. 206 (eds Yoshida, M., Windley, B.F. & Das-gupta, S.), pp. 131–143. Geological Society, London, SpecialPublication, London.
Dasgupta, S., Sengupta, P., Ehl, J., Raith, M. & Bardhan, S.,1995. Reaction textures in a suite of spinel granulites fromthe Eastern Ghats Belt, India: evidence for polymetamor-phism, a partial petrogenetic grid in the system KFMASHand the roles of ZnO and Fe2O3. Journal of Petrology, 36,435–461.
Dasgupta, S., Bose, S. & Das, K., 2013. Tectonic evolution ofthe Eastern Ghats Belt, India. Precambrian Research, 227,247–258.
Dharma Rao, C.V., Santosh, M. & Chmielowski, R.M., 2012.Sapphirine granulites from Panasapattu, Eastern Ghats belt,India: ultrahigh-temperature metamorphism in a Proterozoicconvergent plate margin. Geoscience Frontiers, 3, 9–31.
Diener, J.F.A. & Powell, R., 2010. Influence of ferric iron onthe stability of mineral assemblages. Journal of MetamorphicGeology, 28, 599–613.
Diener, J.F.A., White, R.W. & Powell, R., 2008. Granulitefacies metamorphism and subsolidus fluid-absent reworking,Strangways range, Arunta block, central Australia. Journalof Metamorphic Geology, 26, 603–622.
Dobmeier, C.J. & Raith, M.M., 2003. Crustal architecture andevolution of the Eastern Ghats Belt and adjacent regions ofIndia. In: Proterozoic East Gondwana: supercontinent assem-
© 2013 John Wiley & Sons Ltd
OSUMIL I TE MELT INTERACT IONS AT UHT 905

bly and breakup, Vol. 206 (eds Yoshida, M., Windley, B.F.& Dasgupta, S.), pp. 145–168. Geological Society, London,Special Publication, London.
Ellis, D.J., Sheraton, J.W., England, R.N. & Dallwitz, W.B.,1980. Osumilite–sapphirine–quartz granulites from EnderbyLand Antarctica – mineral assemblages and reactions. Con-tributions to Mineralogy and Petrology, 72, 123–143.
Fitton, J.G. & Gill, R.C.O., 1970. The oxidation of ferrousiron in rocks during mechanical grinding. Geochimica et Cos-mochimica Acta, 34, 518–524.
Fyfe, W.S., 1973. The granulite facies, partial melting and theArchaean crust. Philosophical Transactions of the Royal Soci-ety (London), A273, 457–461.
Grew, E.S., 1982. Osumilite in the sapphirine–quartz terrane ofEnderby Land, Antarctica: implications for osumilite petro-genesis in the granulite facies. American Mineralogist, 67,762–787.
Grew, E.S. & Manton, W.I., 1986. A new correlation of sap-phirine granulites in the Indo-Antarctic metamorphic ter-rane: Late Proterozoic dates from the Eastern Ghats.Precambrian Research, 33, 123–139.
Guernina, S. & Sawyer, E.W., 2003. Large-scale melt depletionin granulite terranes: an example from the Archean Ashuani-pi subprovince of Quebec. Journal of Metamorphic Geology,21, 181–201.
Gupta, S., 2012. Strain localization, granulite formation andgeodynamic setting of ‘hot orogens: a case study from theEastern Ghats Province, India. Geological Journal, 47, 334–351.
Handy, M.R., Mulch, A., Rosenau, M. & Rosenberg, C.L.,2001. A synthesis of the role of fault zones and melts as agentsof weakening, hardening and differentiation of the continentalcrust. In: The Nature and Tectonic Significance of Fault ZoneWeakening, Vol. 186 (eds Holdsworth, R.E., Strachan, R.A.,Magloughlin, J.F. & Knipe, R.J.), pp. 305–332. GeologicalSociety, London, Special Publication, London.
Harley, S.L., 1998. On the occurrence and characterization ofultrahigh-temperature (UHT) crustal metamorphism. In:What Drives Metamorphism and Metamorphic Relations?,Vol. 138 (eds Treloar, P.J. & O’Brien, P.J.), pp. 75–101.Geological Society, London, Special Publication, London.
Harley, S.L., 2008. Refining the P-T records of UHT crustalmetamorphism. Journal of Metamorphic Geology, 26, 125–154.
Herzberg, C., Condie, K. & Korenaga, J., 2010. Thermal his-tory of the Earth and its petrological expression. Earth andPlanetary Science Letters, 292, 79–88.
Holland, T.J.B. & Powell, R., 1998. An internally consistentdataset for phases of petrological interest. Journal of Meta-morphic Geology, 16, 309–343.
Holland, T.J.B. & Powell, R., 2003. Activity–composition rela-tions for phases in petrological calculations: an asymmetricmulticomponent formulation. Contributions to Mineralogyand Petrology, 145, 492–501.
Holland, T.J.B., Babu, E.V.S.S.K. & Waters, D.J., 1996. Phaserelations of osumilite and dehydration melting in peliticrocks: a simple thermodynamic model for the KFMASHsystem. Contributions to Mineralogy and Petrology, 124, 383–394.
Johnson, T.E., Brown, M. & White, R.W., 2010. Petrogeneticmodelling of strongly residual metapelitic xenoliths withinthe southern Platreef, Bushveld Complex, South Africa.Journal of Metamorphic Geology, 28, 269–291.
Johnson, T.E., Fischer, S., White, R.W., Brown, M. & Rollin-son, H.R., 2012. Archaean intracrustal differentiation frompartial melting of metagabbro – field and geochemical evi-dence from the central region of the Lewisian complex, NWScotland. Journal of Petrology, 53, 2115–2138.
Kamineni, D.C. & Rao, A.T., 1988. Sapphirine-bearing quartz-ite from the Eastern Ghats Granulite Terrain, Vizianagaram,India. Journal of Geology, 96, 209–220.
Kelsey, D.E., 2008. On ultrahigh-temperature crustal metamor-phism. Gondwana Research, 13, 1–29.
Kelsey, D.E., White, R.W. & Powell, R., 2003. Orthopyrox-ene–sillimanite–quartz assemblages: distribution, petrology,quantitative P-T–X constraints and P–T paths. Journal ofMetamorphic Geology, 21, 439–453.
Kelsey, D.E., White, R.W., Holland, T.J.B. & Powell, R.,2004. Calculated phase equilibria in K2O–FeO–MgO–Al2O3–SiO2–H2O for sapphirine-quartz-bearing mineral assem-blages. Journal of Metamorphic Geology, 22, 559–578.
Korhonen, F.J. & Stout, J.H., 2005. Borosilicate- and pheng-ite-bearing veins from the Grenville Province of Labrador:evidence for rapid uplift. Journal of Metamorphic Geology,23, 297–311.
Korhonen, F.J., Saito, S., Brown, M. & Siddoway, C.S., 2010.Modeling multiple melt loss events in the evolution of anactive continental margin. Lithos, 116, 230–248.
Korhonen, F.J., Saw, A.K., Clark, C., Brown, M. & Bhattach-arya, S., 2011. New constraints on UHT metamorphism inthe Eastern Ghats Province through the application of phaseequilibria modelling and in situ geochronology. GondwanaResearch, 20, 764–781.
Korhonen, F.J., Brown, M., Grove, M., Siddoway, C.S., Bax-ter, E.F. & Inglis, J.D., 2012a. Placing constraints on thetiming of melting and melt loss events during polymetamor-phism in the Fosdick migmatite–granite complex, West Ant-arctica. Journal of Metamorphic Geology, 30, 165–192.
Korhonen, F.J., Powell, R. & Stout, J.H., 2012b. Stability ofsapphirine + quartz in the oxidised rocks of the Wilson Laketerrane, Labrador: calculated equilibria in NCKFMASHTO.Journal of Metamorphic Geology, 30, 21–36.
Korhonen, F.J., Clark, C., Brown, M., Bhattacharya, S. &Taylor, R., 2013. How long-lived is ultrahigh temperature(UHT) metamorphism? Constraints from zircon and mona-zite geochronology in the Eastern Ghats orogenic belt, India.Precambrian Research. doi: 10.1016/j.precamres.2012.12.001.
Lal, R.K., Ackermand, D. & Upadhyay, H., 1987. P-T–X rela-tionships deduced from corona textures in sapphirine-spi-nel-quartz assemblages from Paderu, southern India. Journalof Petrology, 28, 1139–1168.
Leitch, A.M. & Weinberg, R.F., 2002. Modelling melt migra-tion by mesoscale pervasive flow. Earth and Planetary Sci-ence Letters, 200, 131–146.
London, D., 2009. The origin of primary textures in graniticpegmatites. Canadian Mineralogist, 47, 697–724.
Menegon, L., Nasipuri, P., Stunitz, H., Behrens, H. & Ravna,E., 2011. Dry and strong quartz during deformation of thelower crust in the presence of melt. Journal of GeophysicalResearch, 116, B10410.
Mezger, K. & Cosca, M.A., 1999. The thermal history of theEastern Ghats belt (India), as revealed by U–Pb and40Ar–39Ar dating of metamorphic and magmatic minerals:implications for the SWEAT correlation. PrecambrianResearch, 94, 251–271.
Mohan, A., Tripathi, P. & Motoyoshi, M., 1997. Reaction his-tory of sapphirine granulites and a decompressional P-Tpath in a granulite complex from the Eastern Ghats. Pro-ceedings of the Indian Academy of Science (Earth and Plane-tary Science), 106, 115–130.
Mukhopadhyay, A.K. & Bhattacharya, A., 1997. Tectonother-mal evolution of the gneiss complex at Salur in the EasternGhats granulite belt of India. Journal of Metamorphic Geol-ogy, 15, 719–734.
Nasipuri, P., Bhattacharya, A. & Das, S., 2008. Metamorphicreactions in dry and aluminous granulites: a Perple_X P-Tpseudosection analysis of the influence of effective reactionvolume. Contributions to Mineralogy and Petrology, 157,301–311.
Pal, S. & Bose, S., 1997. Mineral reactions and geothermoba-rometry in a suite of granulite facies rocks from Paderu,Eastern Ghats granulite belt: a reappraisal of the P-T trajec-
© 2013 John Wiley & Sons Ltd
906 F . J . KORHONEN ET AL .

tory. Proceedings of the Indian Academy of Sciences Earthand Planetary Sciences, 106, 77–89.
Powell, R. & Downes, J., 1990. Garnet porphyroblast-bearingleucosomes in metapelites: mechanisms and an example fromBroken Hill, Australia. In: High Temperature Metamorphismand Crustal Anatexis (eds Ashworth, J.R. & Brown, M.),pp. 105–123. Unwin Hyman, London.
Powell, R. & Holland, T.J.B., 1988. An internally consistentthermodynamic dataset with uncertainities and correlations.3. Application, methods, and worked examples and a com-puter program. Journal of Metamorphic Geology, 6, 173–204.
Powell, R. & Holland, T.J.B., 2008. On thermobarometry.Journal of Metamorphic Geology, 26, 155–179.
Raith, M., Karmakar, S. & Brown, M., 1997. Ultrahigh-tem-perature metamorphism and multi-stage decompressionalevolution of sapphirine granulites from the Palni HillRanges, Southern India. Journal of Metamorphic Geology,15, 379–399.
Ramakrishnan, M., Nanda, J.K. & Augustine, P.F., 1998. Geo-logical evolution of the Proterozoic Eastern Ghats mobile belt.In: Geological Evolution of Proterozoic Eastern Ghats MobileBelt (eds , Vol. 44 Ramakrishnan, M., Paul, D.K. & Mishra,R.N.), pp. 1–21. Special Publication 44, Kolkata, India.
Rickers, K., Mezger, K. & Raith, M.M., 2001a. Evolution ofthe continental crust in the Proterozoic Eastern Ghats Belt,and new constraints for Rodinia reconstruction: implicationsfrom Sm–Nd, Rb–Sr and Pb–Pb isotopes. PrecambrianResearch, 112, 183–212.
Rickers, K., Raith, M. & Dasgupta, S., 2001b. Multistage reac-tion textures in xenolithic high-MgAl granulites at Anakap-alle, Eastern Ghats Belt, India: examples of contactpolymetamorphism and infiltration-driven metasomatism.Journal of Metamorphic Geology, 19, 563–582.
Rosenberg, C.L. & Handy, M.L., 2005. Experimental deforma-tion of partial melted granite revisited: implications for thecontinental crust. Journal of Metamorphic Geology, 23, 19–28.
Sandiford, M. & Powell, R., 1991. Some remarks on high-tem-perature - low-pressure metamorphism in convergent oro-gens. Journal of Metamorphic Geology, 9, 333–340.
Sandiford, M., McLaren, S. & Neumann, N., 2002. Long-termthermal consequences of the redistribution of heat-producingelements associated with large-scale granitic complexes. Jour-nal of Metamorphic Geology, 20, 87–98.
Sarkar, S., Santosh, M., Dasgupta, S. & Fukuoka, M., 2003.Very high density CO2 associated with ultrahigh-temperaturemetamorphism in the Eastern Ghats granulite belt, India.Geology, 31, 51–54.
Sawyer, E.W., 2001. Melt segregation in the continental crust:distribution and movement of melt in Anatectic rocks. Jour-nal of Metamorphic Geology, 18, 291–309.
Sen, S.K., Bhattacharya, S. & Acharyya, A., 1995. A multi-stage pressure-temperature record in the Chilka Lake granu-lites: the epitome of the metamorphic evolution of EasternGhats, India? Journal of Metamorphic Geology, 13, 287–298.
Sengupta, P., Dasgupta, S., Bhattacharya, P.K., Fukuoka, M.,Chakraborty, S. & Bhowmik, S., 1990. Petro-tectonic imprintsin the sapphirine granulites from Anantagiri, Eastern Ghatsmobile belt, India. Journal of Petrology, 31, 971–996.
Sengupta, P., Raith, M. & Dasgupta, S., 2004. Comment on:‘High-temperature dehydration melting and decompressiveP-T path in a granulite complex from the Eastern GhatsIndia’ by S. Bhattacharya and R. Kar. Contributions to Min-eralogy and Petrology, 147, 123–125.
Senthil Kumar, P., Menon, R. & Reddy, G.K., 2007. The role ofradiogenic heat production in the thermal evolution of a Pro-terozoic granulite-facies orogenic belt: Eastern Ghats (Indianshield). Earth and Planetary Science Letters, 254, 39–54.
Shaw, R.K. & Arima, M., 1997. Retrograde pressure–tempera-ture path for spinel-bearing metapelites in Rayagada, East-ern Ghats, India. Mineralogy and Petrology, 60, 41–59.
Shaw, R.K., Arima, M., Kagami, H., Fanning, C.A.M., Shirai-shi, K. & Motoyoshi, Y., 1997. Proterozoic events in theEastern Ghats Granulite Belt, India: evidence from Rb–Sr,Sm–Nd systematics, and SHRIMP dating. Journal of Geol-ogy, 105, 645–656.
Simmat, R. & Raith, M.M., 2008. U-Th–Pb monazite geochro-nometry of the Eastern Ghats Belt, India: timing and spatialdisposition of poly-metamorphism. Precambrian Research,162, 16–39.
Sizova, E., Gerya, T. & Brown, M., 2013. Contrasting styles ofPhanerozoic and Precambrian continental collision. Gondw-ana Research, http://dx.doi.org/10.1016/j.gr.2012.12.011.
Taylor-Jones, K. & Powell, R., 2010. The stability of sapphi-rine + quartz: calculated phase equilibria in FeO–MgO–Al2O3–SiO2–TiO2–O. Journal of Metamorphic Geology, 28,615–633.
Whipple, E.R., Speer, J.A. & Russell, C.W., 1984. Errors inFeO determinations caused by tungsten carbide grindingapparatus. American Mineralogist, 69, 987–988.
White, R.W. & Powell, R., 2002. Melt loss and the preserva-tion of granulite facies mineral assemblages. Journal ofMetamorphic Geology, 20, 621–632.
White, R.W. & Powell, R., 2010. Retrograde melt–residueinteraction and the formation of near-anhydrous leuco-somes in migmatites. Journal of Metamorphic Geology, 28,579–597.
White, R.W. & Powell, R., 2011. On the interpretation of ret-rograde reaction textures in granulite facies rocks. Journal ofMetamorphic Geology, 29, 131–149.
White, R.W., Powell, R., Holland, T.J.B. & Worley, B.A.,2000. The effect of TiO2 and Fe2O3 on metapelitic assem-blages at greenschist and amphibolite facies conditions:mineral equilibria calculations in the system K2O–FeO–MgO–Al2O3–SiO2–H2O–TiO2–Fe2O3. Journal of Metamor-phic Geology, 18, 497–511.
White, R.W., Powell, R. & Holland, T.J.B., 2001. Calculationof partial melting equilibria in the system Na2O–CaO–K2O–FeO–MgO–Al2O3–SiO2–H2O. Journal of Metamorphic Geol-ogy, 19, 139–153.
White, R.W., Powell, R. & Clarke, G.L., 2002. The interpretationof reaction textures in Fe-rich metapelitic granulites of theMusgrave Block, central Australia: constraints from mineralequilibria calculations in the system K2O–FeO–MgO–Al2O3–SiO2–H2O–TiO2–Fe2O3. Journal of Metamorphic Geology, 20,41–55.
White, R.W., Powell, R. & Halpin, J.A., 2004. Spa-tially-focussed melt formation in aluminous metapelites fromBroken Hill, Australia. Journal of Metamorphic Geology, 22,825–845.
White, R.W., Powell, R. & Holland, T.J.B., 2007. Progressrelating to calculation of partial melting equilibria formetapelites. Journal of Metamorphic Geology, 25, 511–527.
White, R.W., Stevens, G. & Johnson, T.E., 2011. Is the cruci-ble reproducible? Reconciling melting experiments with ther-modynamic calculations. Elements, 7, 241–246.
Yakymchuk, C. & Brown, M., 2013. Consequences of opensystem melting in tectonics. Journal of the Geological Society,London, in press.
Yakymchuk, C., Brown, M., Ivanic, T.J. & Korhonen, F.J.,2013. Leucosome distribution in migmatitic paragneisses andorthogneisses: a record of self-organized melt migration andentrapment in a heterogeneous partially-molten crust. Tec-tonophysics, doi: 10.1016/j.tecto.2013.05.022.
Zhang, H., Li, J., Liu, S., Li, W., Santosh, M. & Wang, H.,2012. Spinel + quartz-bearing ultrahigh-temperature granu-lites from Xumayao, Inner Mongolia Suture Zone, NorthChina Craton: Petrology, phase equilibria and counterclock-wise P-T path. Geoscience Frontiers, 3, 603–611.
Received 13 March 2013; revision accepted 22 July 2013.
© 2013 John Wiley & Sons Ltd
OSUMIL I TE MELT INTERACT IONS AT UHT 907