Embed Size (px)
Citation preview

Agricultural Assessment Report
For
OSU Research Dairy 4490, NW Harrison St Corvallis, OR 97331
ENERGY / EFFICIENCY CENTER

OREGON STATE UNIVERSITY
ENERGY / EFFICIENCY CENTER
Assessment Report No. AG-1000-B
August 7, 2008
Joseph F. Junker, Assistant IAC Director ________________________________
Mikhail Jones, Lead Analyst ________________________________
Assessment Participants
Nathan Keeley Energy Analyst Carl Moen Energy Analyst Peter Hanslits Energy Analyst Elsie Delande Energy Analyst and Safety Officer
Joseph F. Junker Dr. George Wheeler Assistant Director IAC Director Batcheller Hall 344 Batcheller Hall 341 Corvallis, OR Corvallis, OR 97331-2405 97331-2405 (541) 737-5034 (541) 737-2515


PREFACE The work described in this report is a service of the Oregon State University Energy/Efficiency Center. The primary objective of the E/EC agricultural assessment is to identify and evaluate opportunities for energy conservation, waste minimization, and productivity improvements through visits to agricultural sites. Data is gathered during a one-day site visit and assessment recommendations (ARs) are identified. Some ARs may require additional engineering design and capital investment. When engineering services are not available in-house, we recommend that a consulting engineering firm be engaged to provide design assistance as needed. In addition, since the site visits by E/EC personnel are brief, they are necessarily limited in scope and a consulting engineering firm could be more thorough. We believe this report to be a reasonably accurate representation of energy use, waste generation, and production practices, and opportunities in your facility. However, because of the limited scope of our visit, the Oregon State University Energy/Efficiency Center cannot guarantee the accuracy, completeness, or usefulness of the information contained in this report, nor assumes any liability for damages resulting from the use of any information, equipment, method or process disclosed in this report. Pollution prevention recommendations are not intended to deal with the issue of compliance with applicable environmental regulations. Questions regarding compliance should be addressed to either a reputable consulting engineering firm experienced with environmental regulations or to the appropriate regulatory agency. Clients are encouraged to develop positive working relationships with regulators so that compliance issues can be addressed and resolved. The assumptions and equations used to arrive at energy, waste, productivity, and cost savings for the recommended ARs are given in the report. We believe the assumptions to be conservative. If you do not agree with our assumptions you may follow the calculation methodologies presented using revised assumptions to develop your own estimates of energy, waste, productivity, and cost savings. Please feel welcome to contact the E/EC if you would like to discuss the content of this report or if you have another question about energy use or pollution prevention. The E/EC staff that visited your site and prepared this report is listed on the preceding page.
TABLE OF CONTENTS
1. Introduction ...........................................................................................................................1 2. Narrative ................................................................................................................................2 3. Assessment Recomendations ................................................................................................5
AR No. 1. Milk Tank Insulation ........................................................................5 Nathan Keeley
AR No. 2. Parlor Heater Interlock .....................................................................5 Peter Hanslits
AR No. 3. Safety Lighting Controls ..................................................................5 Carl Moen
AR No. 4. Barn Lighting Upgrade ....................................................................6 Carl Moen
AR No. 5. Vacuum Pump VSD .........................................................................6 Justin Olson
AR No. 6. Roofing ............................................................................................7 Peter Hanslits
AR No. 7. Electric Waste Water Pump .............................................................7 Peter Hanslits
4. Other Measures Considered ..................................................................................................8
OMC No. 1. Field Moisture Sensors ....................................................................8 Elsie Delande
5. Energy Balance ......................................................................................................................9 Mikhail Jones 6. Calculation Methodology ....................................................................................................13
AR No. 1 Milk Tank Insulation ......................................................................13 AR No. 2 Parlor Heater Interlock ...................................................................19 AR No. 3 Safety Lighting Controls ................................................................22 AR No. 4 Barn Lighting Upgrade ..................................................................30 AR No. 5 Vacuum Pump VSD .......................................................................38 AR No. 6 Roofing ..........................................................................................42 AR No. 7 Electric Waste Water Pump ...........................................................44 A. Utilities Appendix ...............................................................................................................49 B. Lighting Appendix ..............................................................................................................55
1. INTRODUCTION This report describes how energy is used in your plant, and includes our recommendations on cost effective steps you can take to reduce your energy and waste costs and increase productivity. The contents are based on our recent visit to your plant. The report is divided into 6 major sections and 2 appendices: 1. Introduction. The purpose, contents and organization of the report are described in this
section. 2. Narrative. This section contains a description of the processes at your site and efficiency
measures we discussed. 3. Assessment Recommendations. This section contains our Assessment Recommendations
(AR), briefly highlights the current and proposed systems and summarizes the cost savings available upon implementation. Some of our recommendations will require a significant investment to implement, while others will cost little or nothing.
4. Other Measures Considered. These measures are just estimations made with limited data
or analysis because; (1) we were unable to obtain the information necessary to estimate savings or cost accurately; (2) the measure would adversely affect production. Some measures are included in response to specific questions you raised during the plant visit, but which do not appear to be feasible.
5. Energy Balance. Your energy use and waste generation costs, productivity, energy, and
waste savings, are summarized here. 6. Calculation Methodology. This section includes the detailed calculations for the
Assessment Recommendations (AR). It includes any data that was collected during the audit, assumptions we use to estimate savings, our estimate of the implementation cost, and the simple payback of implementation.
Appendix A: Utilities. Your utility bills and energy use by process are summarized and plotted in detail. Due to the changes in rate schedules and adjustments our calculations are an approximation and may not be exactly consistent with your bills. When available, we also include water and solid waste bills. Appendix B: Lighting. The number and type of lighting fixtures are recorded for each area. This appendix also includes the Lighting Worksheet Definitions, which describe the symbols and terminology used in our lighting calculations. The lighting power and annual energy use for each plant area are summarized in the Lighting Inventory worksheet.
1
2. NARRATIVE This section includes a summary of processes and equipment used at your site and brainstorm ideas discussed on site.
Processes: Below is a summary of the processes at your site.
• Milking Process: There are two milking sessions, one in the morning and one in the evening. The cows are milked in 14 stations using a 7.5 hp vacuum pump. The milk is pumped into a holding tank, chilled from 100°F to 37°F and stored until a truck arrives to empty the tank.
• Manure Cleanup Process: All manure solids as well as waste and manure contaminated liquids are flushed out of the barns and into gutters to be pumped up to the manure separator. The manure separator separates the manure solids from the liquids. The solids are deposited into a pile to be used as fertilizer and the liquids are collected in a holding tank. The liquids collected in the holding tank are stored until the tank becomes full and then are spread onto the dairy’s field using a 30 hp manure spreading pump. If the field is too saturated to apply the manure liquid it is deposited in a holding pond.
Equipment: Below is a list of your large equipment and its application.
• Manure Pumps: A 30 hp pump used to move manures and waste water from the gutter collection system to the manure separator.
• Manure Separator: Separates manure solids from liquids.
• Manure Spreading Pump: A 30 hp diesel pump used to spread manure liquids from the liquid holding tank.
• Air Compressor: Used to actuate pneumatic controls.
• Vacuum Pump: A 7.5 hp pump used to pump milk from the cows to the milk tank.
• Propane Heater: A propane space heater used to heat the milking parlor.
• Milk Tank Chiller: Used to chill the milk from 100°F to 37°F. It operates by running refrigerant through the walls of the milk storage tank.
• Tractors: Used to run the manure spreading pump and perform other tasks at the dairy.
• Irrigation Pump: Used to pump irrigation water onto the fields to supplement manure liquids in the summer.
2
Brainstorm Ideas: Below is a list of ideas we developed during the assessment and considered recommending in our report.
• Milk Tank Insulation: We considered insulating the milk storage tank with paint on food grade insulation to reduce the amount of cooling the milk needs while stored in the tank. This would reduce your cooling costs.
• Parlor Heater Interlock: We considered installing a timer or interlock to turn off the parlor heater when it is not needed. This would eliminate the possibility of the parlor heater being left on when the parlor is not in use. This would also reduce the heating costs for the milking parlor.
• Safety Lighting: We considered moving one metal halide light, installing two new metal halide lights with photocell sensors and installing an incandescent light with a motion sensor. We also thought that photocells on the current outdoor lighting might be assessed and cleaned to insure proper operation. This would reduce your electricity consumption.
• Barn Lighting Upgrade: We considered replacing the current high pressure sodium lights in certain areas of the barn as well as installing motion sensors. This would reduce your electricity consumption.
• Barn Lighting Timer: We considered replacing the batteries in the main barn lighting timer controller. This will prevent the device from resetting itself during power outages thus reducing your energy costs.
• Vacuum Pump VSD: We considered installing a variable speed drive on the milking
vacuum pump, instead of running the vacuum pump at full speed and throttling air flow the VSD will adjust the motor speed to match the air demand. This would reduce your electricity consumption.
• Roofing: We considered installing a roof to cover the concrete between the two open barns. This would reduce the amount of rainwater that comes into contact with manure and has to be stored, thus reducing how often the manure tank needs to be purged. This would reduce pumping costs as well as prevent the possibility of tank overflow because of a lack of options to dispose of accumulated liquids.
• Electric Waste Water Pump: We considered replacing the diesel manure pump with an electric pump. An electric pump would be more cost efficient than a diesel pump, thus reducing your energy costs.
• Moisture Sensing Irrigation: We considered installing soil moisture sensors to aid in
determining when to water the fields. Moisture sensors would reduce the amount of water used in the summer and provide information on whether or not a field is too saturated to apply manure water in the winter. This would both reduce water pumping costs and help prevent the manure tank from overflowing in the winter. This does not appear as a full recommendation because we were unable to quantify cost savings due to lack of data.
3
4
Recommendations Summary: Recommendations that we were able to quantify into cost savings, implementation cost and energy saved are summarized in the following table.
Assessment Recommendation Summary Energy Cost Implementation PaybackAR# Description (MMBtu) Savings Cost* (years) 1 Milk Tank Insulation 20.5 $788 $5551,2 0.7 2 Parlor Heater Interlock 9.5 $167 $350 2.1 3 Safety Lighting Controls 1.5 $65 $384 5.9 4 Barn Lighting Upgrade 160.7 $4,697 $582 0.1 5 Vacuum Pump VSD 23.5 $557 $1,3002 2.3 6 Roofing 26.1 $800 $40,000 50.0 7 Electric Waste Water Pump 103.2 $3,268 $3,995 1.2 Totals 345.0 $10,342 $47,166 4.6 * Implementation Cost in this column represents your final cost after any applicable incentives as noted 1 This final cost is reduced by an Oregon Department of Energy Business Energy Tax Credit. 2 This final cost is reduced by Energy Trust of Oregon Incentives. Total savings are the sum of the savings for each recommendation. Some of the recommendations may interact. Therefore, actual savings may be less than the total indicated above. In our calculations we indicate where we have assumed that other recommendations will be implemented in order to provide a realistic estimate of actual savings. When either one or another recommendation can be implemented, but not both, we have included the recommendation we recommend in this table and the alternate recommendation in a later section, Other Measures Considered. Total savings, including interactions among recommendations, can be better estimated after you select a package of recommendations.
3. ASSESSMENT RECOMMENDATIONS
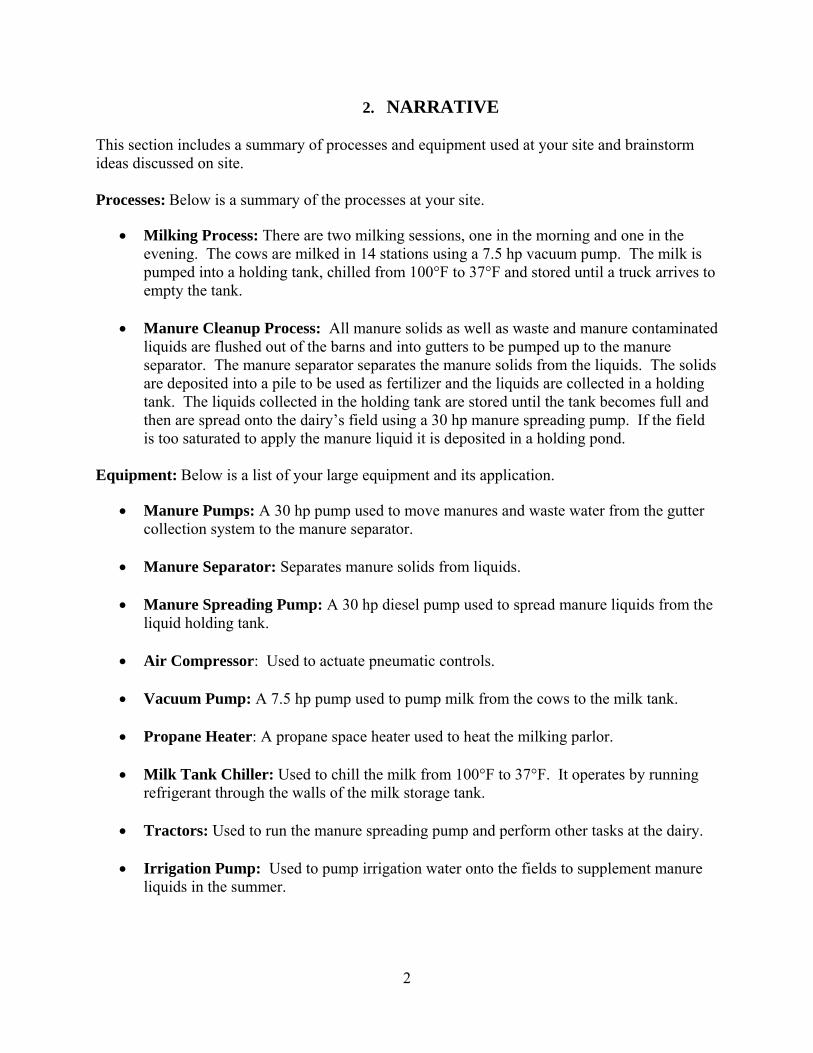
Milk Tank Insulation A milk tank is used to store milk at a cool temperature after milking. A portion of the energy used to cool the milk tank is lost to the room due to a temperature difference between the shell and the ambient temperature. Energy losses can be reduced 12% by adding paint on food grade insulation in addition to the insulation created by the trapped layer of air between the two stainless steel shells. Energy savings will result by reducing the amount of energy required to maintain the internal temperature of the tank. As detailed in the Milk Tank Insulation - Calculation Methodology, there is a 0.7 net year payback with a $555 net implementation cost and $788 annual cost savings.
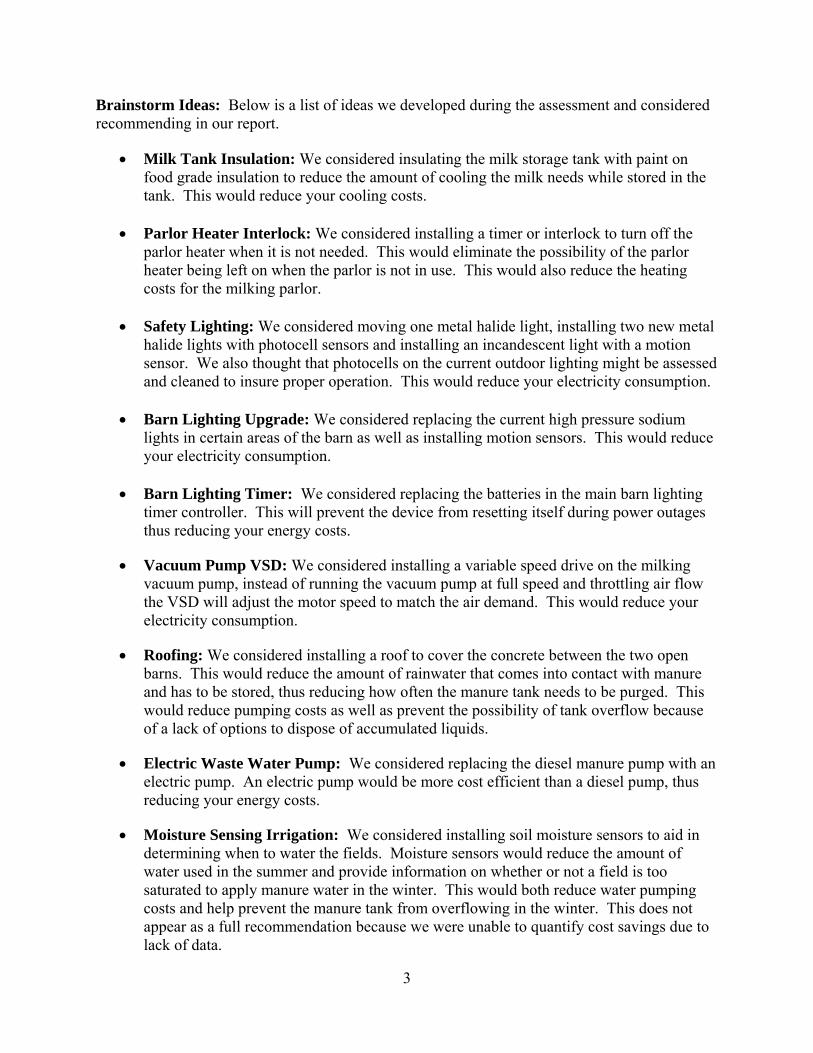
Parlor Heater Interlock Currently, it is the employee’s responsibility to turn the parlor heater off after milking. This is an unreliable method to ensure the heater is off, resulting in extra heater operating hours. This wastes energy in the form of propane. By automatically turning the heater on and off with the lights, heater control is attached to a more obvious mechanism that employees turn off more reliably. By interlocking the parlor heater with the lights, heating costs will be reduced by 3%. As detailed in the Parlor Heater Interlock - Calculation Methodology, there is a 2.1 year payback with a $350 implementation cost and $167 annual cost savings.
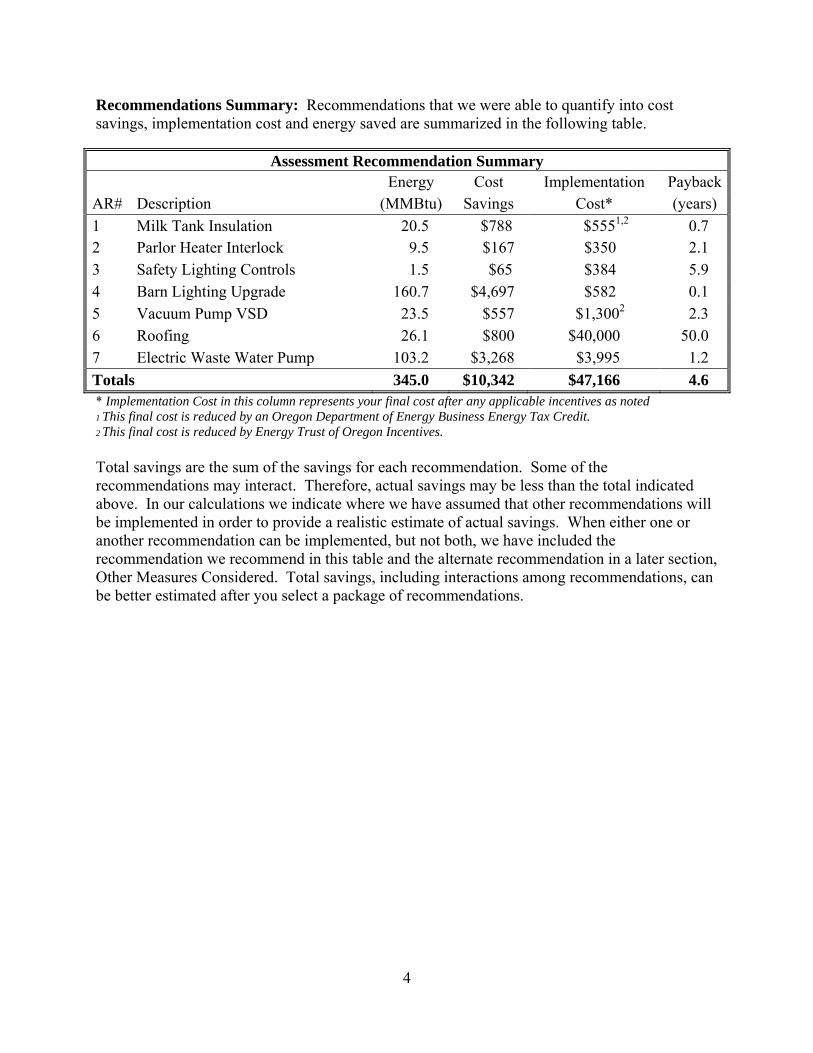
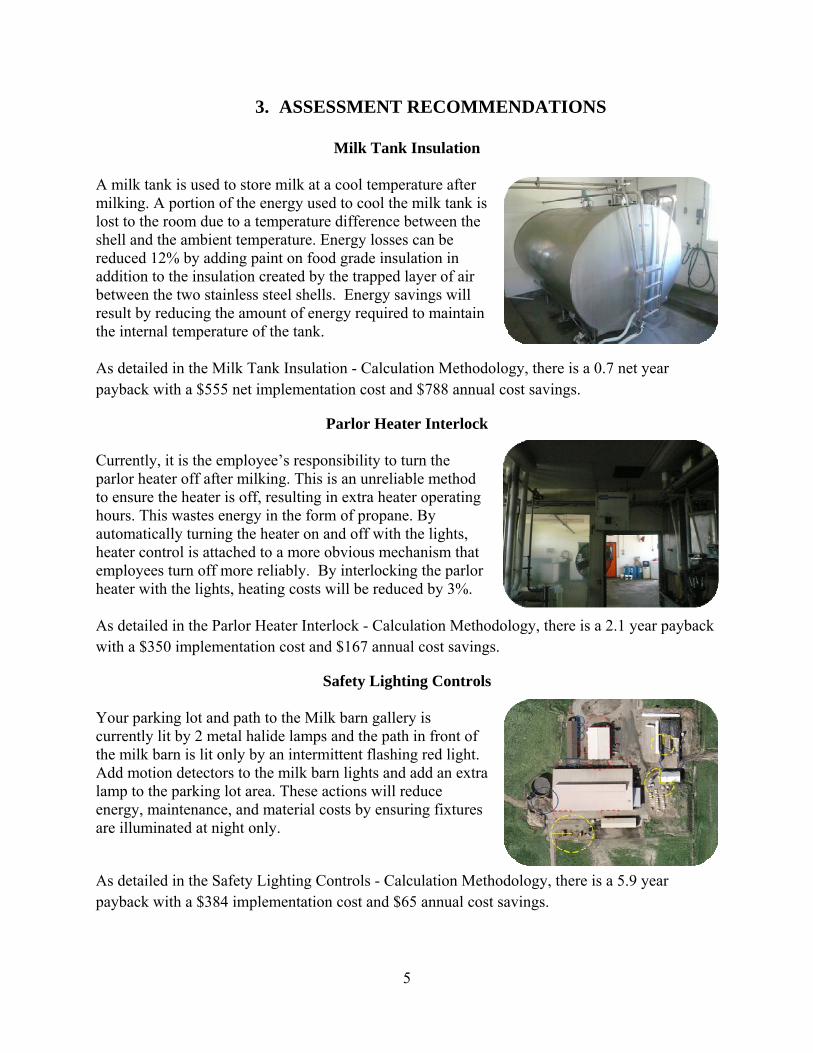
Safety Lighting Controls Your parking lot and path to the Milk barn gallery is currently lit by 2 metal halide lamps and the path in front of the milk barn is lit only by an intermittent flashing red light. Add motion detectors to the milk barn lights and add an extra lamp to the parking lot area. These actions will reduce energy, maintenance, and material costs by ensuring fixtures are illuminated at night only.
As detailed in the Safety Lighting Controls - Calculation Methodology, there is a 5.9 year payback with a $384 implementation cost and $65 annual cost savings.
5

Barn Lighting Upgrade While visiting your facility we inventoried your lighting. After consulting with facility personnel we determined that you could reduce operating hours in various areas. We also determined that some areas with metal halide fixtures could be replaced with T-8 florescent fixtures for greater fixture efficiencies. Reducing lighting fixture operating hours and increasing lamp efficiency will reduce electricity costs, as well as associated labor and maintenance costs As detailed in the Barn Lighting Upgrade - Calculation Methodology, there is a 0.1 year payback with a $582 implementation cost and $4,697 annual cost savings.
Note As suggested above, a timer connected to the barn lighting was no longer being used when we assessed your facility because it had proved to be unreliable. On investigation we found that a power-backup battery had not been installed. With the battery the timer should be more reliable. By only replacing the timer batteries and reprogramming the timer, $4,464 in annual cost savings should be available with immediate payback.
Vacuum Pump VSD
The vacuum pump system runs 9 milking units at 10 cfm, on average only 6 cfm is required. A more efficient way to provide required flow would be to run the pump at a percentage of its full load speed using a Variable Speed Drive. VSDs vary capacity by adjusting vacuum pump motor speed. This is more efficient than the current method and could reduce total vacuum pump operating cost by 40%. As detailed in the Vacuum Pump VSD - Calculation Methodology, there is a 2.3 year payback with a $1,300 implementation cost and $557 annual cost savings.
6
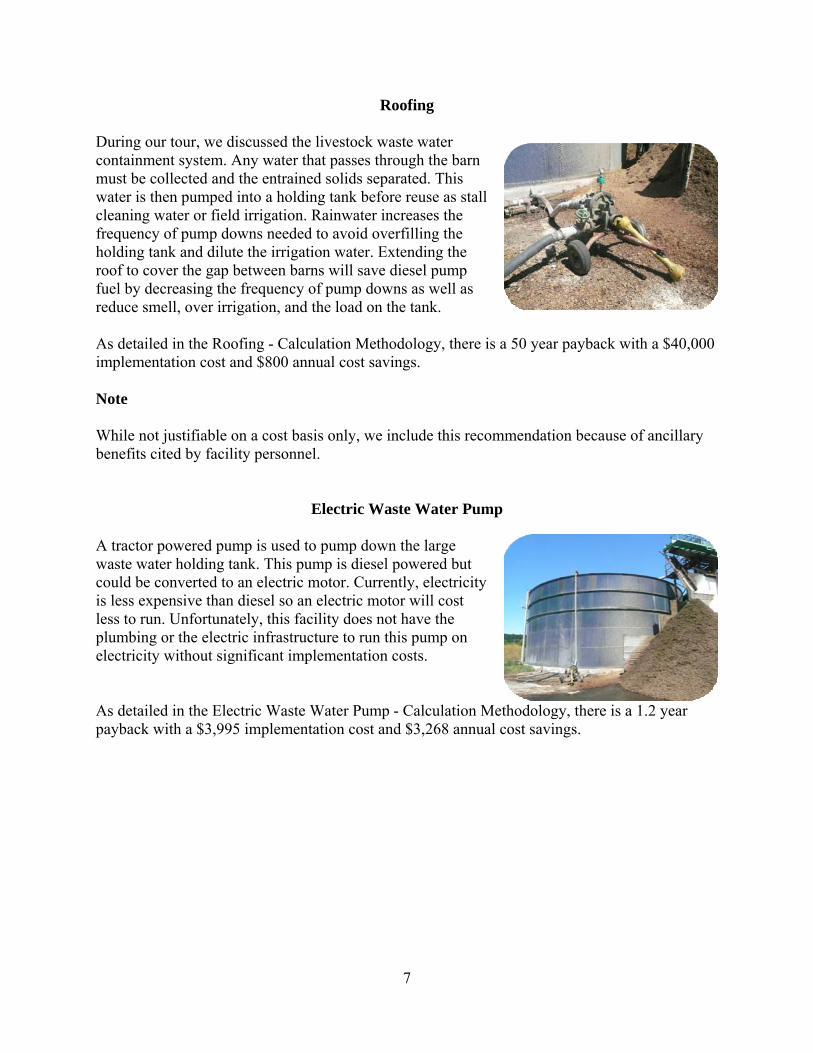
Roofing During our tour, we discussed the livestock waste water containment system. Any water that passes through the barn must be collected and the entrained solids separated. This water is then pumped into a holding tank before reuse as stall cleaning water or field irrigation. Rainwater increases the frequency of pump downs needed to avoid overfilling the holding tank and dilute the irrigation water. Extending the roof to cover the gap between barns will save diesel pump fuel by decreasing the frequency of pump downs as well as reduce smell, over irrigation, and the load on the tank. As detailed in the Roofing - Calculation Methodology, there is a 50 year payback with a $40,000 implementation cost and $800 annual cost savings. Note While not justifiable on a cost basis only, we include this recommendation because of ancillary benefits cited by facility personnel.
Electric Waste Water Pump A tractor powered pump is used to pump down the large waste water holding tank. This pump is diesel powered but could be converted to an electric motor. Currently, electricity is less expensive than diesel so an electric motor will cost less to run. Unfortunately, this facility does not have the plumbing or the electric infrastructure to run this pump on electricity without significant implementation costs. As detailed in the Electric Waste Water Pump - Calculation Methodology, there is a 1.2 year payback with a $3,995 implementation cost and $3,268 annual cost savings.
7

8
4. OTHER MEASURES CONSIDERED
Moisture Sensing Irrigation While visiting your facility we were informed that water laden with manure is stored in a holding tank until it can be deposited onto the field. We were also informed that during the winter the rain makes the fields appear saturated so water cannot be applied to the field and has to be pumped into a holding pond. Currently personnel determine when the fields can be irrigated based on observations. Installing moisture sensors will provide personnel with accurate information on field saturation. This will allow more manure laden water to be applied to the fields in the winter to reduce the risk of overfilling and damaging the tank. It will also reduce the amount of irrigation water needed in the summer by 30%. The total cost is $848 including material and labor. The material cost of installing a system is $748 for a monitoring system, 7 moisture sensors, 1 temperature sensor, and the software to operate the system. Labor costs include 1 hour of electrician’s labor at a rate of $50/hr to wire in the monitoring system and 5 hours of installation labor at $10/hr for preparing and installing the sensors. This was not included as a full recommendation because we did not know the amount of water used, or the irrigation water cost.

5. ENERGY BALANCE
Your energy use and waste generation costs, productivity, energy, and waste savings, are summarized here.
END USE SUMMARYAverage Electricity Cost: $0.06566 /kWhAverage Natural Gas Cost: $0.89730 /thermAverage Diesel Cost: $4.00 Gallon
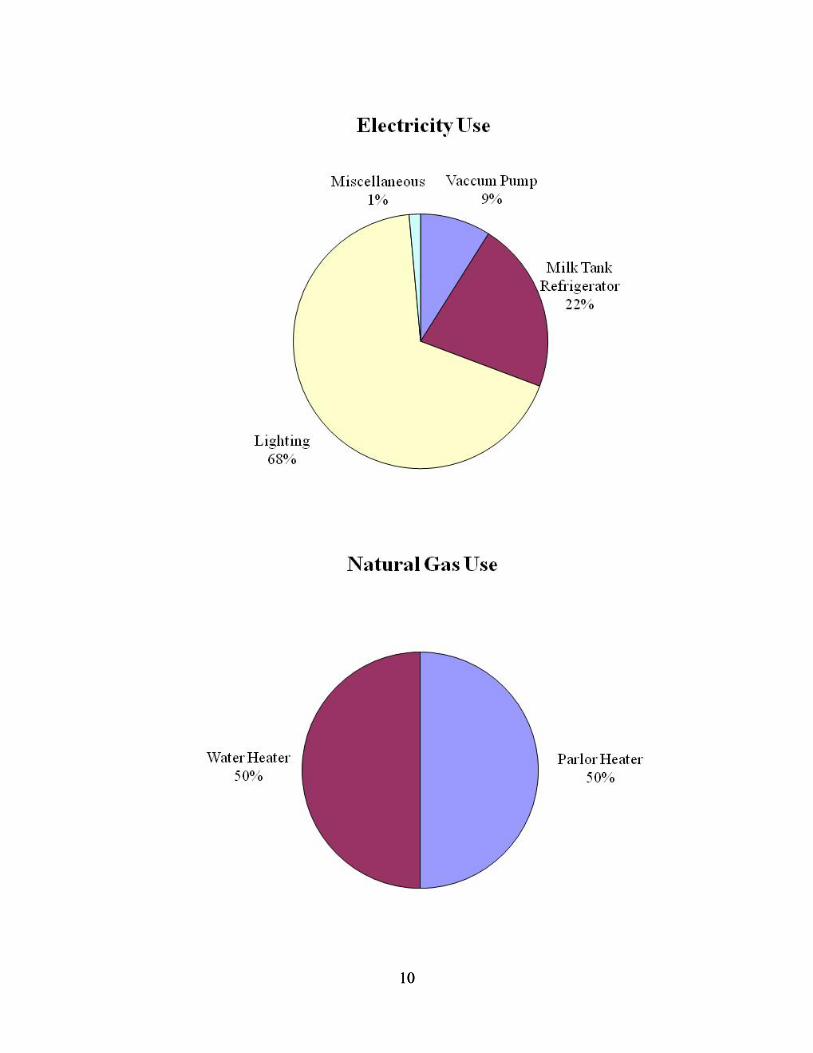
ELECTRICITYUSE UNIT MMBtu ENERGY % COST COST%
Vaccum Pump 17,233 kWh 59 9.0% $1,132 9.0%Milk Tank Refrigerator 41,900 kWh 143 21.8% $2,751 21.8%Lighting 130,488 kWh 445 67.8% $8,568 67.8%Miscellaneous 2,795 kWh 10 1.5% $184 1.5%TOTALS 192,416 kWh 657 100.0% $12,634 100.0%
NATURAL GASUSE UNIT MMBtu ENERGY % COST COST%
Parlor Heater 5,208 therm 521 50.0% $4,673 50.0%Water Heater 5,208 therm 521 50.0% $4,673 50.0%TOTALS 10,416 therm 1,042 100.0% $9,346 100.0%
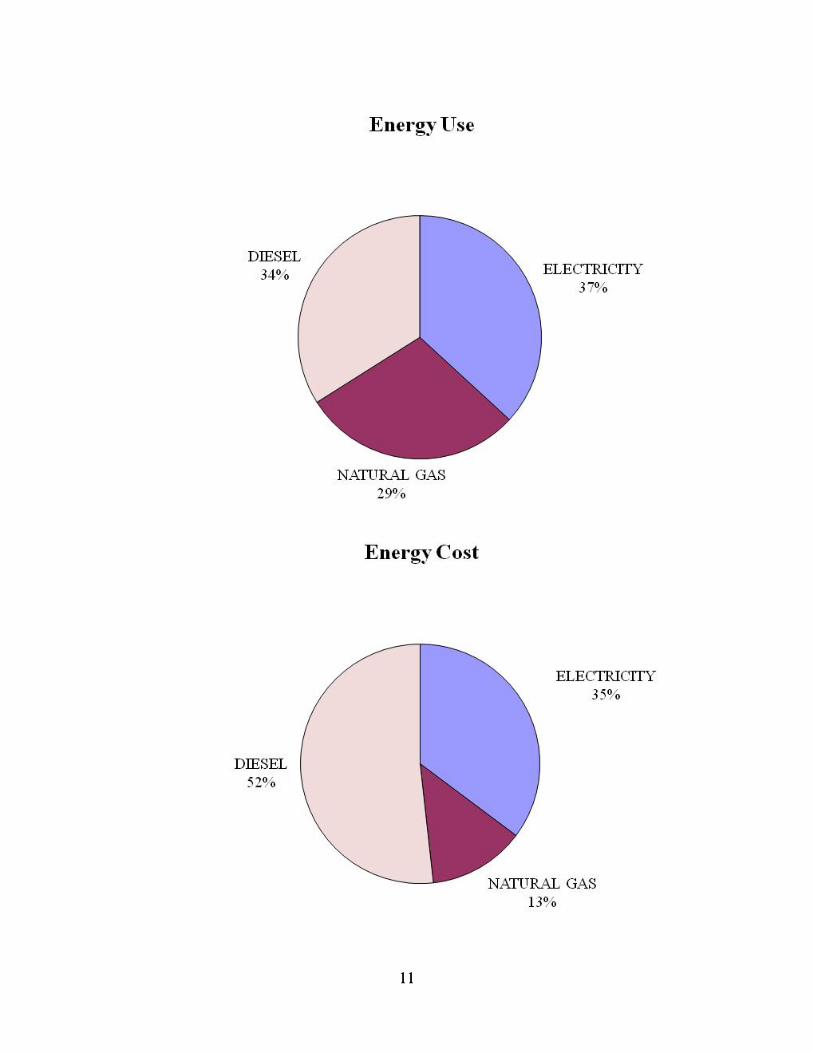
FUEL SUMMARYUSE UNIT MMBtu ENERGY % COST COST%
Electricity 192,416 kWh 657 36.8% $12,634 35.2%Natural Gas 5,208 therm 521 29.2% $4,673 13.0%Diesel 4,641 Gallons 606 34.0% $18,566 51.8%TOTALS 1,783 100.0% $35,873 100.0%
9
10
10
11
11

12
6. CALCULATION METHODOLOGY
AR No. 1 Milk Tank Insulation
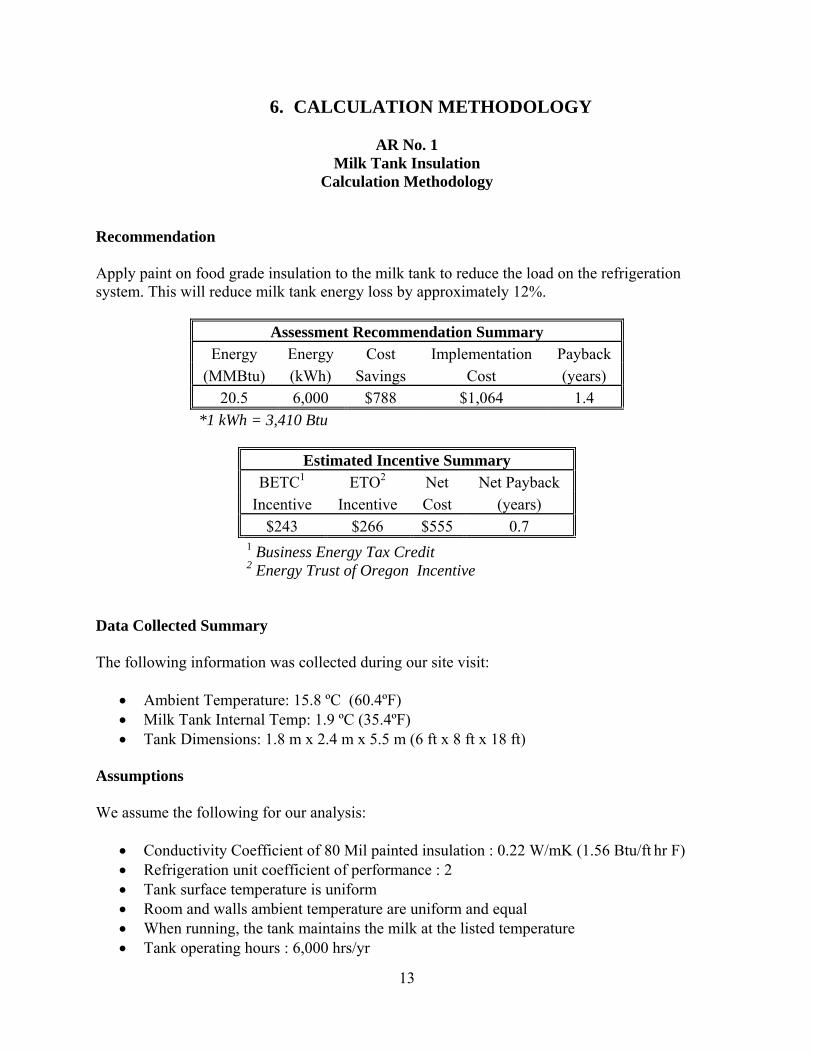
Calculation Methodology Recommendation Apply paint on food grade insulation to the milk tank to reduce the load on the refrigeration system. This will reduce milk tank energy loss by approximately 12%.
Assessment Recommendation Summary Energy Energy Cost Implementation Payback
(MMBtu) (kWh) Savings Cost (years) 20.5 6,000 $788 $1,064 1.4
*1 kWh = 3,410 Btu
Estimated Incentive Summary BETC1 ETO2 Net Net Payback
Incentive Incentive Cost (years) $243 $266 $555 0.7
1 Business Energy Tax Credit 2 Energy Trust of Oregon Incentive
Data Collected Summary The following information was collected during our site visit:
• Ambient Temperature: 15.8 ºC (60.4ºF) • Milk Tank Internal Temp: 1.9 ºC (35.4ºF) • Tank Dimensions: 1.8 m x 2.4 m x 5.5 m (6 ft x 8 ft x 18 ft)
Assumptions We assume the following for our analysis:
• Conductivity Coefficient of 80 Mil painted insulation : 0.22 W/mK (1.56 Btu/ft hr F) • Refrigeration unit coefficient of performance : 2 • Tank surface temperature is uniform • Room and walls ambient temperature are uniform and equal • When running, the tank maintains the milk at the listed temperature • Tank operating hours : 6,000 hrs/yr
13
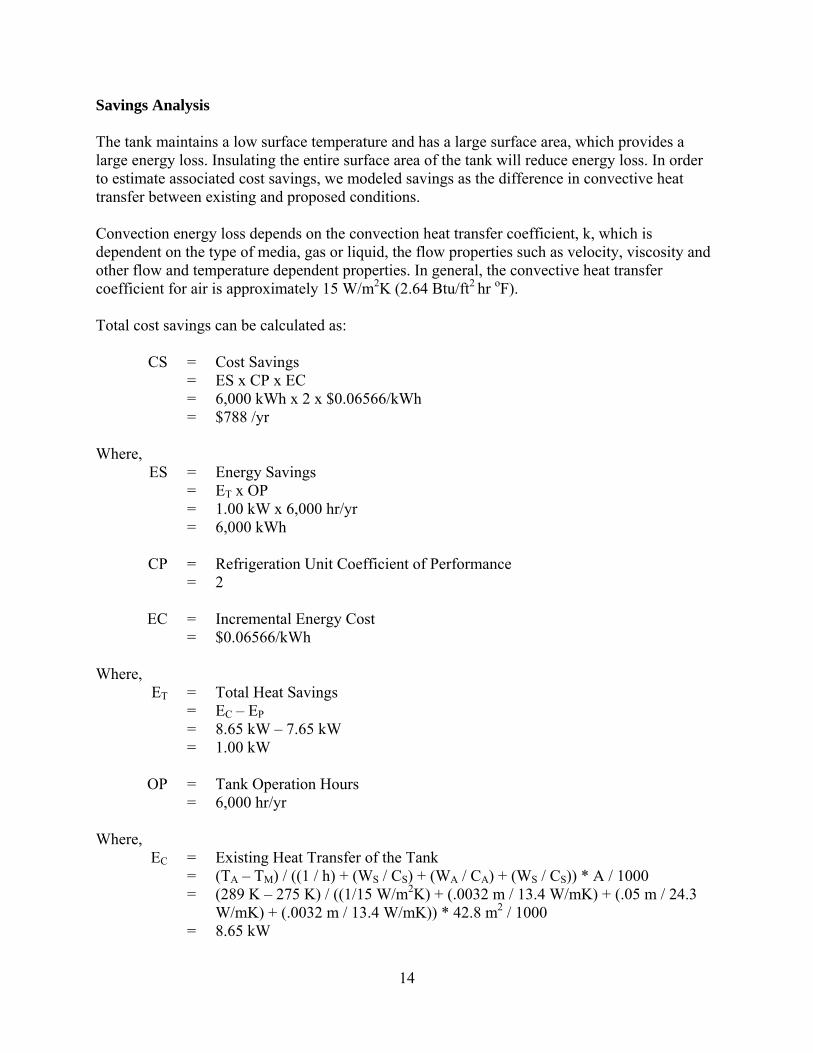
Savings Analysis The tank maintains a low surface temperature and has a large surface area, which provides a large energy loss. Insulating the entire surface area of the tank will reduce energy loss. In order to estimate associated cost savings, we modeled savings as the difference in convective heat transfer between existing and proposed conditions. Convection energy loss depends on the convection heat transfer coefficient, k, which is dependent on the type of media, gas or liquid, the flow properties such as velocity, viscosity and other flow and temperature dependent properties. In general, the convective heat transfer coefficient for air is approximately 15 W/m2K (2.64 Btu/ft2 hr oF). Total cost savings can be calculated as: CS = Cost Savings = ES x CP x EC = 6,000 kWh x 2 x $0.06566/kWh = $788 /yr Where, ES = Energy Savings = ET x OP = 1.00 kW x 6,000 hr/yr = 6,000 kWh CP = Refrigeration Unit Coefficient of Performance = 2 EC = Incremental Energy Cost = $0.06566/kWh Where, ET = Total Heat Savings = EC – EP = 8.65 kW – 7.65 kW = 1.00 kW OP = Tank Operation Hours = 6,000 hr/yr Where, EC = Existing Heat Transfer of the Tank = (TA – TM) / ((1 / h) + (WS / CS) + (WA / CA) + (WS / CS)) * A / 1000 = (289 K – 275 K) / ((1/15 W/m2K) + (.0032 m / 13.4 W/mK) + (.05 m / 24.3
W/mK) + (.0032 m / 13.4 W/mK)) * 42.8 m2 / 1000 = 8.65 kW
14
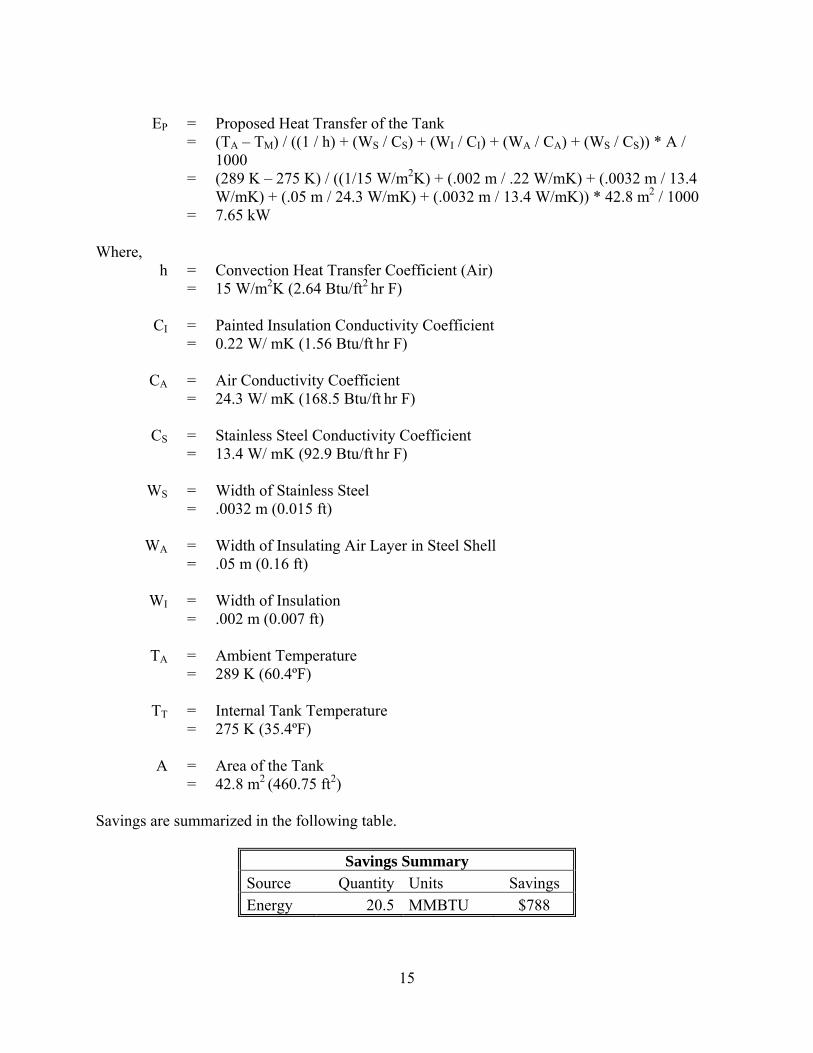
EP = Proposed Heat Transfer of the Tank = (TA – TM) / ((1 / h) + (WS / CS) + (WI / CI) + (WA / CA) + (WS / CS)) * A /
1000 = (289 K – 275 K) / ((1/15 W/m2K) + (.002 m / .22 W/mK) + (.0032 m / 13.4
W/mK) + (.05 m / 24.3 W/mK) + (.0032 m / 13.4 W/mK)) * 42.8 m2 / 1000 = 7.65 kW Where, h = Convection Heat Transfer Coefficient (Air) = 15 W/m2K (2.64 Btu/ft2 hr F) CI = Painted Insulation Conductivity Coefficient = 0.22 W/ mK (1.56 Btu/ft hr F) CA = Air Conductivity Coefficient = 24.3 W/ mK (168.5 Btu/ft hr F) CS = Stainless Steel Conductivity Coefficient = 13.4 W/ mK (92.9 Btu/ft hr F) WS = Width of Stainless Steel = .0032 m (0.015 ft) WA = Width of Insulating Air Layer in Steel Shell = .05 m (0.16 ft) WI = Width of Insulation = .002 m (0.007 ft) TA = Ambient Temperature = 289 K (60.4ºF) TT = Internal Tank Temperature = 275 K (35.4ºF) A = Area of the Tank = 42.8 m2 (460.75 ft2) Savings are summarized in the following table.
Savings Summary Source Quantity Units Savings Energy 20.5 MMBTU $788
15
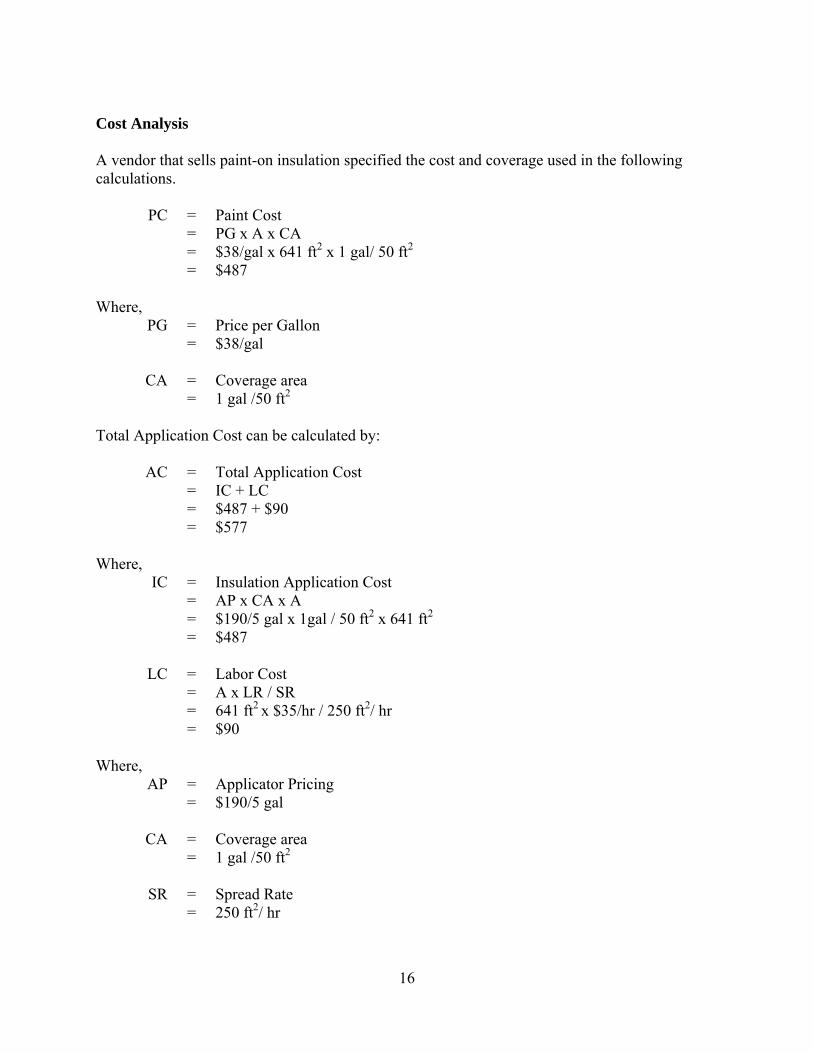
Cost Analysis A vendor that sells paint-on insulation specified the cost and coverage used in the following calculations. PC = Paint Cost = PG x A x CA = $38/gal x 641 ft2 x 1 gal/ 50 ft2 = $487 Where, PG = Price per Gallon = $38/gal CA = Coverage area = 1 gal /50 ft2 Total Application Cost can be calculated by: AC = Total Application Cost = IC + LC = $487 + $90 = $577 Where, IC = Insulation Application Cost = AP x CA x A = $190/5 gal x 1gal / 50 ft2 x 641 ft2 = $487 LC = Labor Cost = A x LR / SR = 641 ft2 x $35/hr / 250 ft2/ hr = $90 Where, AP = Applicator Pricing = $190/5 gal CA = Coverage area = 1 gal /50 ft2 SR = Spread Rate = 250 ft2/ hr
16
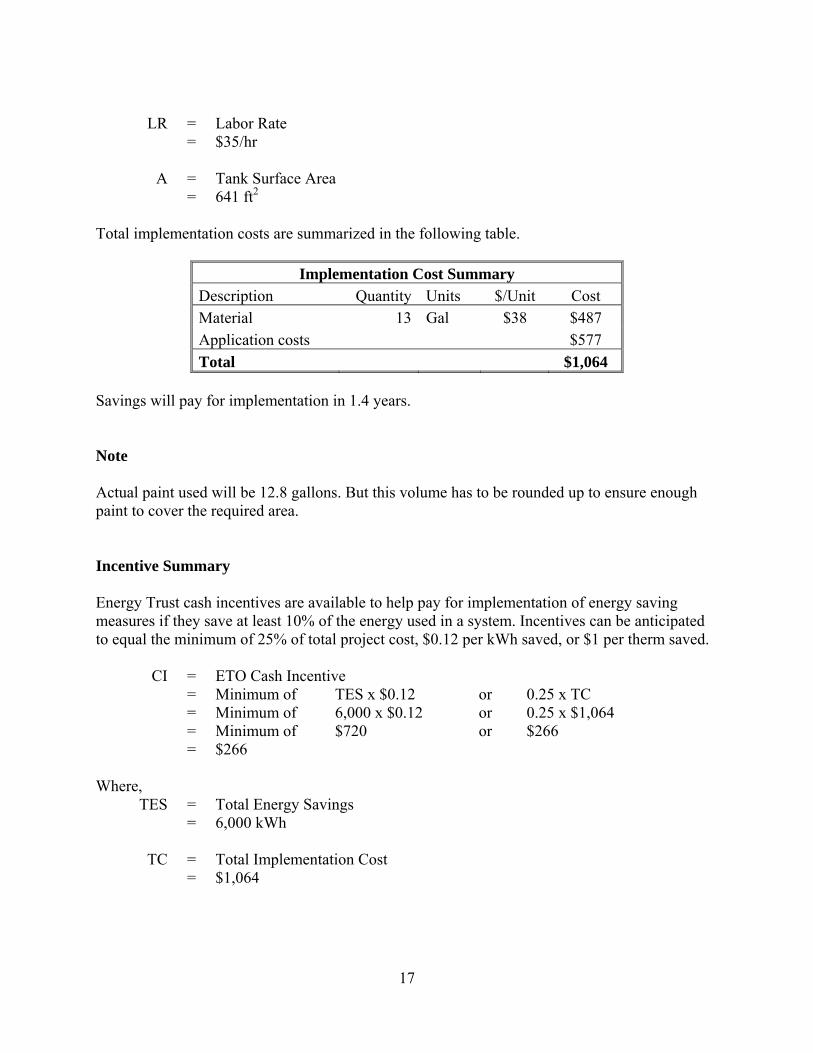
LR = Labor Rate = $35/hr A = Tank Surface Area = 641 ft2 Total implementation costs are summarized in the following table.
Implementation Cost Summary Description Quantity Units $/Unit Cost Material 13 Gal $38 $487 Application costs $577 Total $1,064
Savings will pay for implementation in 1.4 years. Note Actual paint used will be 12.8 gallons. But this volume has to be rounded up to ensure enough paint to cover the required area. Incentive Summary
Energy Trust cash incentives are available to help pay for implementation of energy saving measures if they save at least 10% of the energy used in a system. Incentives can be anticipated to equal the minimum of 25% of total project cost, $0.12 per kWh saved, or $1 per therm saved. CI = ETO Cash Incentive = Minimum of TES x $0.12 or 0.25 x TC = Minimum of 6,000 x $0.12 or 0.25 x $1,064 = Minimum of $720 or $266 = $266 Where, TES = Total Energy Savings = 6,000 kWh TC = Total Implementation Cost = $1,064
17

18
You may also be eligible for the Oregon Business Energy Tax Credit. If a project reduces system energy use by at least 10%, the incentive can be expected to equal 35% of project costs after applying other incentives. However the tax credit accrues over a 5 year period (10%, 10%, 5%, 5%, and 5%), or over one year for projects with implementation costs of less than $20,000. The Oregon Department of Energy also allows “pass through” of a onetime lump value, which is 25.5% of project costs over $20,000 and 30.5% of project costs under $20,000. As this is a reasonable estimate of the net present value of the 35% tax credit, we will use 30.5% as the value of the tax credit in our analysis and estimate of the “payback” period. BTC = Business Energy Tax Credit = (TC – CI) x 0.305 = ($1,064 – $266) x 0.305 = $243 The following table summarizes implementation costs before and after incentives.
Incentive Summary Description Cost Pre-incentive Cost $1,064 Energy Trust Incentives ($266) Business Energy Tax Credit ($243)Total after Incentives $555
Savings will pay for implementation costs in 0.7 years after incentives. Note Check with manufacturer on heat transfer coefficients of desired insulation and re-perform calculations before implementing this recommendation. The proposed insulation is a paint-on insulation of food grade material. It is easy to clean and maintain. This should make it usable on both sides of the milk tank. However, research into whether this type of insulation complies with state and federal health codes is recommended before installation.
AR No. 2 Parlor Heater Interlock
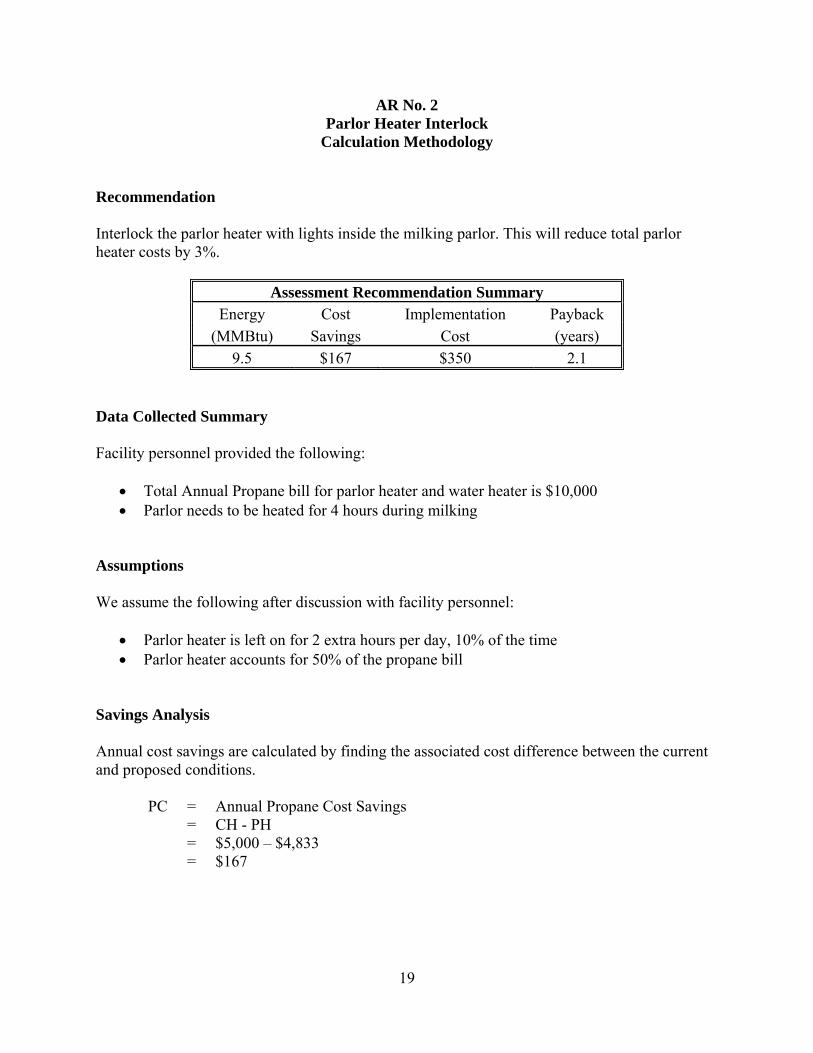
Calculation Methodology Recommendation Interlock the parlor heater with lights inside the milking parlor. This will reduce total parlor heater costs by 3%.
Assessment Recommendation Summary Energy Cost Implementation Payback
(MMBtu) Savings Cost (years) 9.5 $167 $350 2.1
Data Collected Summary Facility personnel provided the following:
• Total Annual Propane bill for parlor heater and water heater is $10,000 • Parlor needs to be heated for 4 hours during milking
Assumptions We assume the following after discussion with facility personnel:
• Parlor heater is left on for 2 extra hours per day, 10% of the time • Parlor heater accounts for 50% of the propane bill
Savings Analysis Annual cost savings are calculated by finding the associated cost difference between the current and proposed conditions. PC = Annual Propane Cost Savings = CH - PH = $5,000 – $4,833 = $167
19

Where, CH = Current Heater Propane Cost = TP x %B = $10,000 x 50% = $5,000 PH = Proposed Heater Propane Cost = CH x (%U + [%C x (PO ÷ CO)]) = $5,000 x (90% + [10% x (4 hrs ÷ 6 hrs)]) = $4,833 Where, TP = Total Current Propane Cost = $10,000 %B = Parlor Heater Percentage of the Total Propane Cost = 50% %U = Percent of Operating Hours that are Unchanged = 90% %C = Percent of Operating Hours that are Changed = 10% PO = Proposed Operating Hours = 4 hrs CO = Current Operating Hours when the Heater is left on for 2 hours = 6 hrs Total annual cost savings are summarized in the following table:
Saving Summary Source Quantity Units Energy (MMBtu) Cost Savings Propane 104 gal Propane 9.5 $167 *1 gal propane = 91,600 Btu
Cost Analysis The cost of implementation is the cost of wiring the propane heater to the same switch as the lights in the parlor and the cost of installing a manual off switch to be used during the day.
20

21
Total implementation costs are summarized in the following table:
Implementation Summary Source Quantity Units $/Unit CostMaterial Costs $100Labor Costs 5 hours $50 $250Total $350
Savings will pay for implementation in 2.1 years. Note Manual control over the parlor heater should be maintained to ensure that when weather is warmer, the parlor heater can be left off.
AR No. 3 Safety Lighting Controls Calculation Methodology
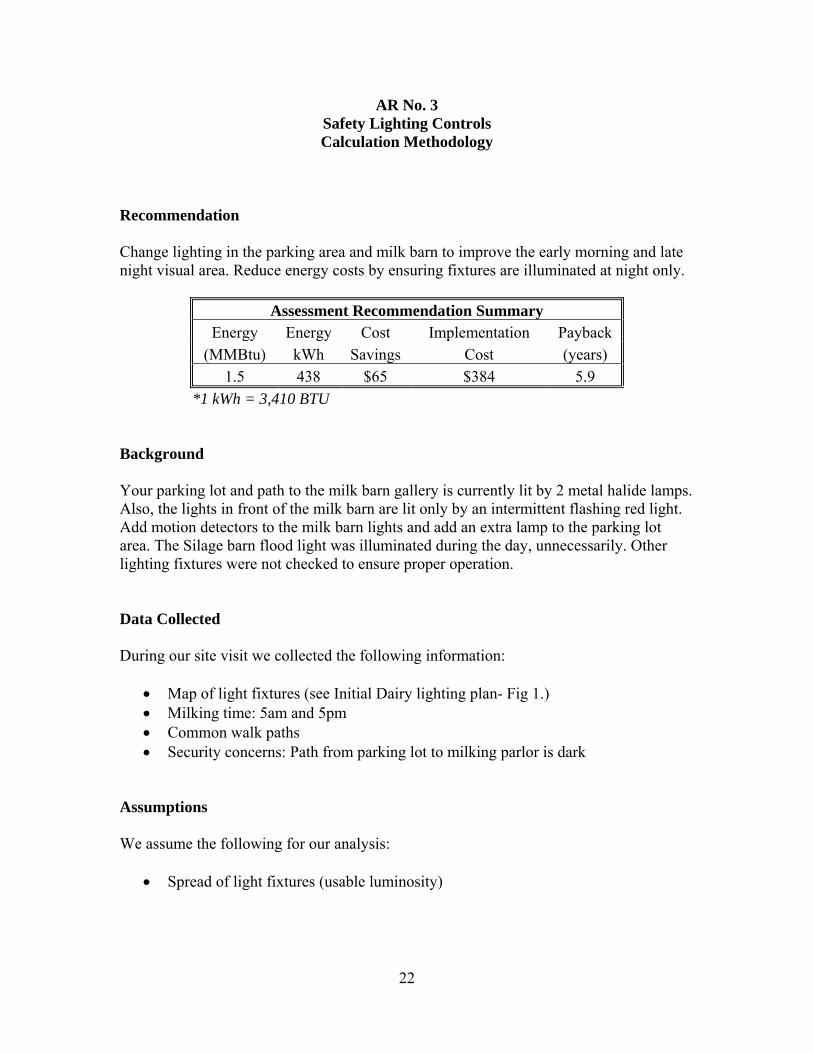
Recommendation Change lighting in the parking area and milk barn to improve the early morning and late night visual area. Reduce energy costs by ensuring fixtures are illuminated at night only.
Assessment Recommendation Summary Energy Energy Cost Implementation Payback
(MMBtu) kWh Savings Cost (years) 1.5 438 $65 $384 5.9
*1 kWh = 3,410 BTU Background Your parking lot and path to the milk barn gallery is currently lit by 2 metal halide lamps. Also, the lights in front of the milk barn are lit only by an intermittent flashing red light. Add motion detectors to the milk barn lights and add an extra lamp to the parking lot area. The Silage barn flood light was illuminated during the day, unnecessarily. Other lighting fixtures were not checked to ensure proper operation. Data Collected During our site visit we collected the following information:
• Map of light fixtures (see Initial Dairy lighting plan- Fig 1.) • Milking time: 5am and 5pm • Common walk paths • Security concerns: Path from parking lot to milking parlor is dark
Assumptions We assume the following for our analysis:
• Spread of light fixtures (usable luminosity)
22

Changes Recommended (see Fig 2)
• Dry Barn: The parking lot is currently illuminated by one metal halide fixture. Change this to two metal halide fixtures. Each fixture will be covering approximately one-half of the parking lot.
• Light pole A (turn around site for the milk truck): Install a street light style metal
halide lamp on the pole. This will illuminate the front of the dry barn and milking barn.
• Light pole B (between main barn and feed barn): Move the current fixture from
the feed barn to the power pole between the main barn and feed barn. This will illuminate the driving area between the main barn and feed barn.
• Check the photocells controlling all barn security lights (dashed lines) to ensure
proper operation (Off during daylight and on during night time.) • Install an incandescent light fixture for the space at the milk shed entrance door,
and have a motion sensor that looks to the area C for signal. (We recommend installing a less efficient incandescent because it will function in all weather conditions.)
Savings Analysis Savings are only calculated for reducing the time the Silage Metal Halide flood light is on during daylight hours. See the table at the end of this recommendation. Energy and maintenance cost savings are calculated using the table (Table 1) that follows this calculation methodology. Terminology for the lighting worksheets is described in Appendix B. There are no demand savings because motion sensors reduce runtime, not load. Energy savings are estimated using power, current operating hours, and proposed operating hours per year. Energy cost savings are estimated with an incremental energy cost of $ 0.06566 /kWh; CS = Cost Savings = ES x EC = 438 kWh x $ 0.06566 /kWh = $29 Where, EC = Incremental Energy Cost = $ 0.06566 /kWh ES = Energy Savings = CU – PU = 876 kWh – 438 kWh = 438 kWh
23
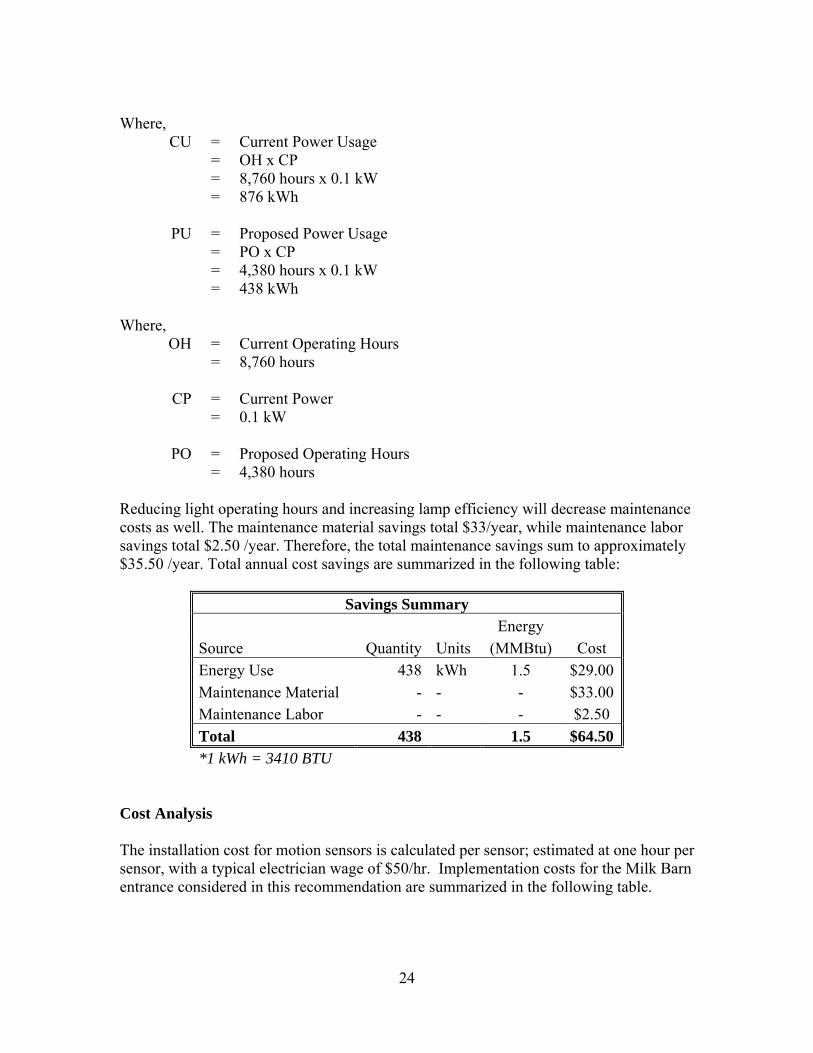
Where, CU = Current Power Usage = OH x CP = 8,760 hours x 0.1 kW = 876 kWh PU = Proposed Power Usage = PO x CP = 4,380 hours x 0.1 kW = 438 kWh Where, OH = Current Operating Hours = 8,760 hours CP = Current Power = 0.1 kW PO = Proposed Operating Hours = 4,380 hours Reducing light operating hours and increasing lamp efficiency will decrease maintenance costs as well. The maintenance material savings total $33/year, while maintenance labor savings total $2.50 /year. Therefore, the total maintenance savings sum to approximately $35.50 /year. Total annual cost savings are summarized in the following table:
Savings Summary Energy
Source Quantity Units (MMBtu) Cost Energy Use 438 kWh 1.5 $29.00 Maintenance Material - - - $33.00 Maintenance Labor - - - $2.50 Total 438 1.5 $64.50 *1 kWh = 3410 BTU
Cost Analysis The installation cost for motion sensors is calculated per sensor; estimated at one hour per sensor, with a typical electrician wage of $50/hr. Implementation costs for the Milk Barn entrance considered in this recommendation are summarized in the following table.
24
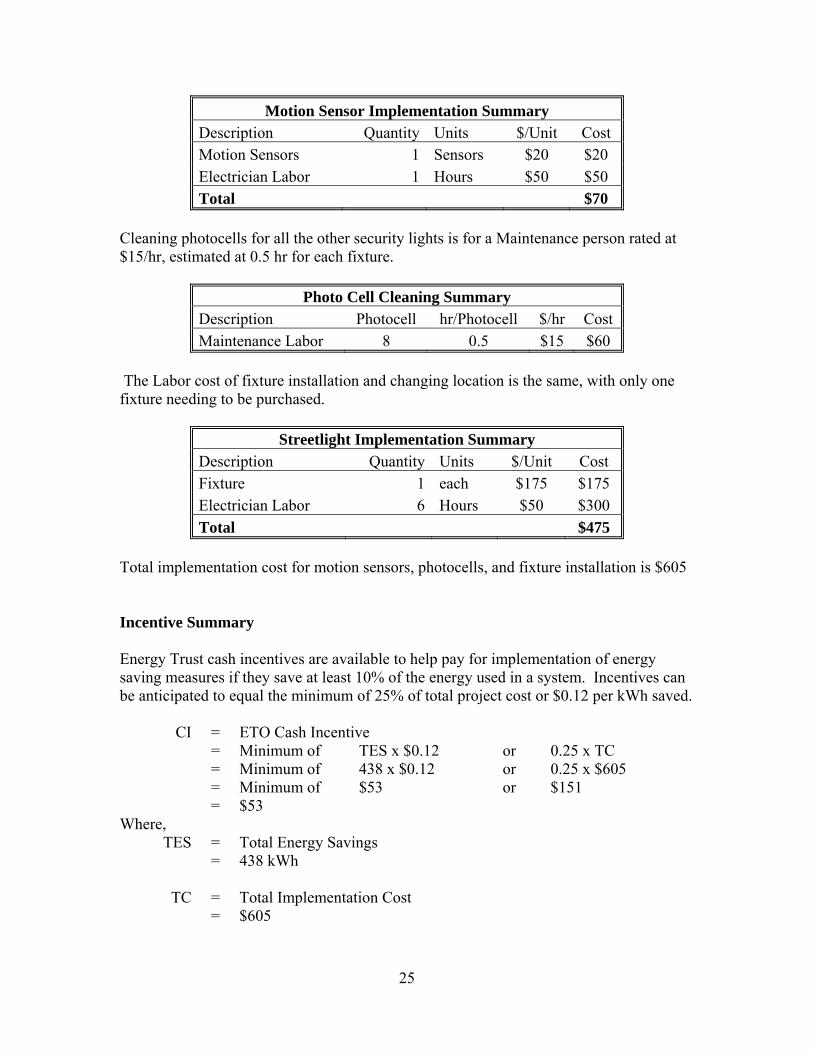
Motion Sensor Implementation Summary Description Quantity Units $/Unit Cost Motion Sensors 1 Sensors $20 $20 Electrician Labor 1 Hours $50 $50 Total $70
Cleaning photocells for all the other security lights is for a Maintenance person rated at $15/hr, estimated at 0.5 hr for each fixture.
Photo Cell Cleaning Summary Description Photocell hr/Photocell $/hr Cost Maintenance Labor 8 0.5 $15 $60
The Labor cost of fixture installation and changing location is the same, with only one fixture needing to be purchased.
Streetlight Implementation Summary Description Quantity Units $/Unit Cost Fixture 1 each $175 $175 Electrician Labor 6 Hours $50 $300 Total $475
Total implementation cost for motion sensors, photocells, and fixture installation is $605 Incentive Summary Energy Trust cash incentives are available to help pay for implementation of energy saving measures if they save at least 10% of the energy used in a system. Incentives can be anticipated to equal the minimum of 25% of total project cost or $0.12 per kWh saved. CI = ETO Cash Incentive = Minimum of TES x $0.12 or 0.25 x TC = Minimum of 438 x $0.12 or 0.25 x $605 = Minimum of $53 or $151 = $53 Where, TES = Total Energy Savings = 438 kWh TC = Total Implementation Cost = $605
25
26
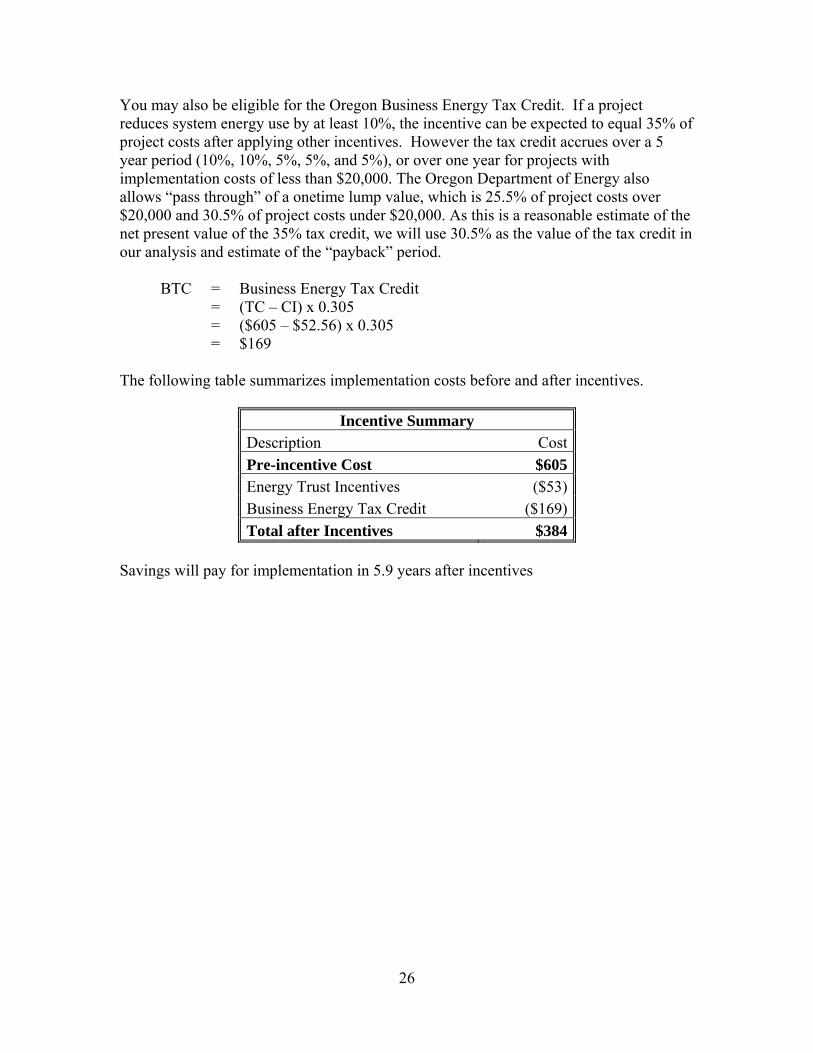
You may also be eligible for the Oregon Business Energy Tax Credit. If a project reduces system energy use by at least 10%, the incentive can be expected to equal 35% of project costs after applying other incentives. However the tax credit accrues over a 5 year period (10%, 10%, 5%, 5%, and 5%), or over one year for projects with implementation costs of less than $20,000. The Oregon Department of Energy also allows “pass through” of a onetime lump value, which is 25.5% of project costs over $20,000 and 30.5% of project costs under $20,000. As this is a reasonable estimate of the net present value of the 35% tax credit, we will use 30.5% as the value of the tax credit in our analysis and estimate of the “payback” period. BTC = Business Energy Tax Credit = (TC – CI) x 0.305 = ($605 – $52.56) x 0.305 = $169 The following table summarizes implementation costs before and after incentives.
Incentive Summary Description CostPre-incentive Cost $605Energy Trust Incentives ($53)Business Energy Tax Credit ($169)Total after Incentives $384
Savings will pay for implementation in 5.9 years after incentives

Current Dairy Lighting Plan (Fig. 1)

C
B
A
Proposed Dairy Lighting Plan (Fig. 2)
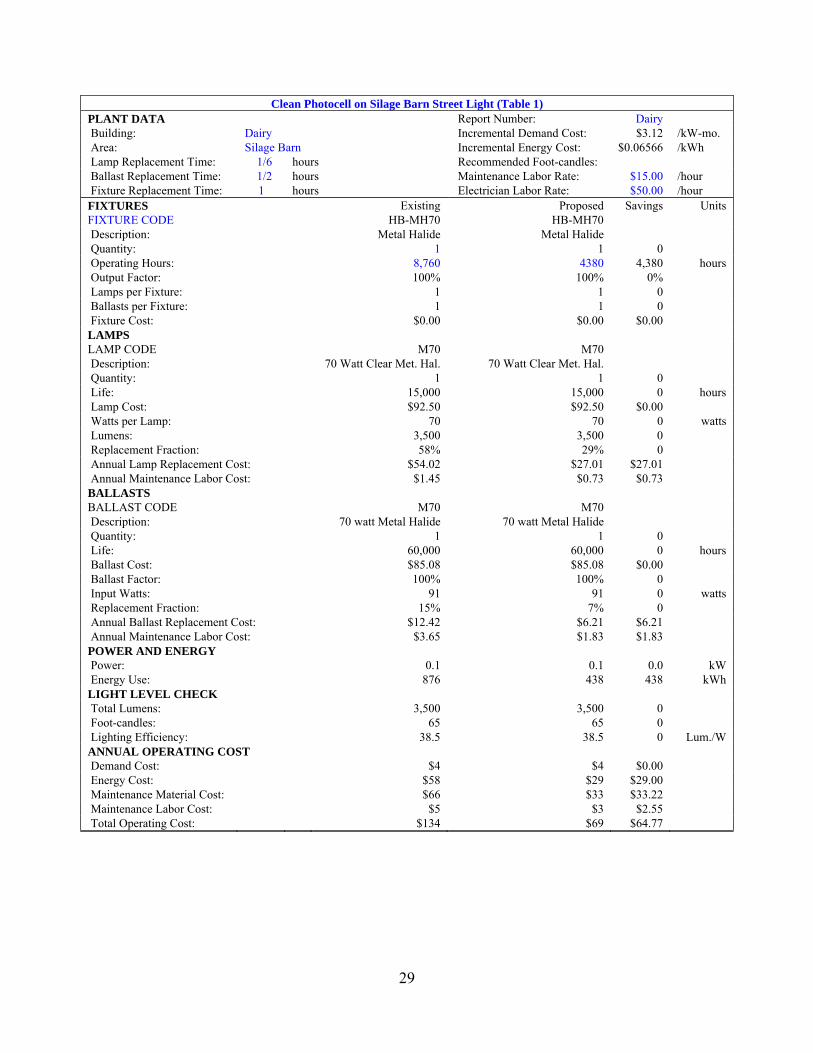
Clean Photocell on Silage Barn Street Light (Table 1) PLANT DATA Report Number: Dairy Building: Dairy Incremental Demand Cost: $3.12 /kW-mo. Area: Silage Barn Incremental Energy Cost: $0.06566 /kWh Lamp Replacement Time: 1/6 hours Recommended Foot-candles: Ballast Replacement Time: 1/2 hours Maintenance Labor Rate: $15.00 /hour Fixture Replacement Time: 1 hours Electrician Labor Rate: $50.00 /hour FIXTURES Existing Proposed Savings Units FIXTURE CODE HB-MH70 HB-MH70 Description: Metal Halide Metal Halide Quantity: 1 1 0 Operating Hours: 8,760 4380 4,380 hours Output Factor: 100% 100% 0% Lamps per Fixture: 1 1 0 Ballasts per Fixture: 1 1 0 Fixture Cost: $0.00 $0.00 $0.00 LAMPS LAMP CODE M70 M70 Description: 70 Watt Clear Met. Hal. 70 Watt Clear Met. Hal. Quantity: 1 1 0 Life: 15,000 15,000 0 hours Lamp Cost: $92.50 $92.50 $0.00 Watts per Lamp: 70 70 0 watts Lumens: 3,500 3,500 0 Replacement Fraction: 58% 29% 0 Annual Lamp Replacement Cost: $54.02 $27.01 $27.01 Annual Maintenance Labor Cost: $1.45 $0.73 $0.73 BALLASTS BALLAST CODE M70 M70 Description: 70 watt Metal Halide 70 watt Metal Halide Quantity: 1 1 0 Life: 60,000 60,000 0 hours Ballast Cost: $85.08 $85.08 $0.00 Ballast Factor: 100% 100% 0 Input Watts: 91 91 0 watts Replacement Fraction: 15% 7% 0 Annual Ballast Replacement Cost: $12.42 $6.21 $6.21 Annual Maintenance Labor Cost: $3.65 $1.83 $1.83 POWER AND ENERGY Power: 0.1 0.1 0.0 kW Energy Use: 876 438 438 kWh LIGHT LEVEL CHECK Total Lumens: 3,500 3,500 0 Foot-candles: 65 65 0 Lighting Efficiency: 38.5 38.5 0 Lum./W ANNUAL OPERATING COST Demand Cost: $4 $4 $0.00 Energy Cost: $58 $29 $29.00 Maintenance Material Cost: $66 $33 $33.22 Maintenance Labor Cost: $5 $3 $2.55 Total Operating Cost: $134 $69 $64.77
29
AR No. 4 Barn Lighting Upgrade
Calculation Methodology
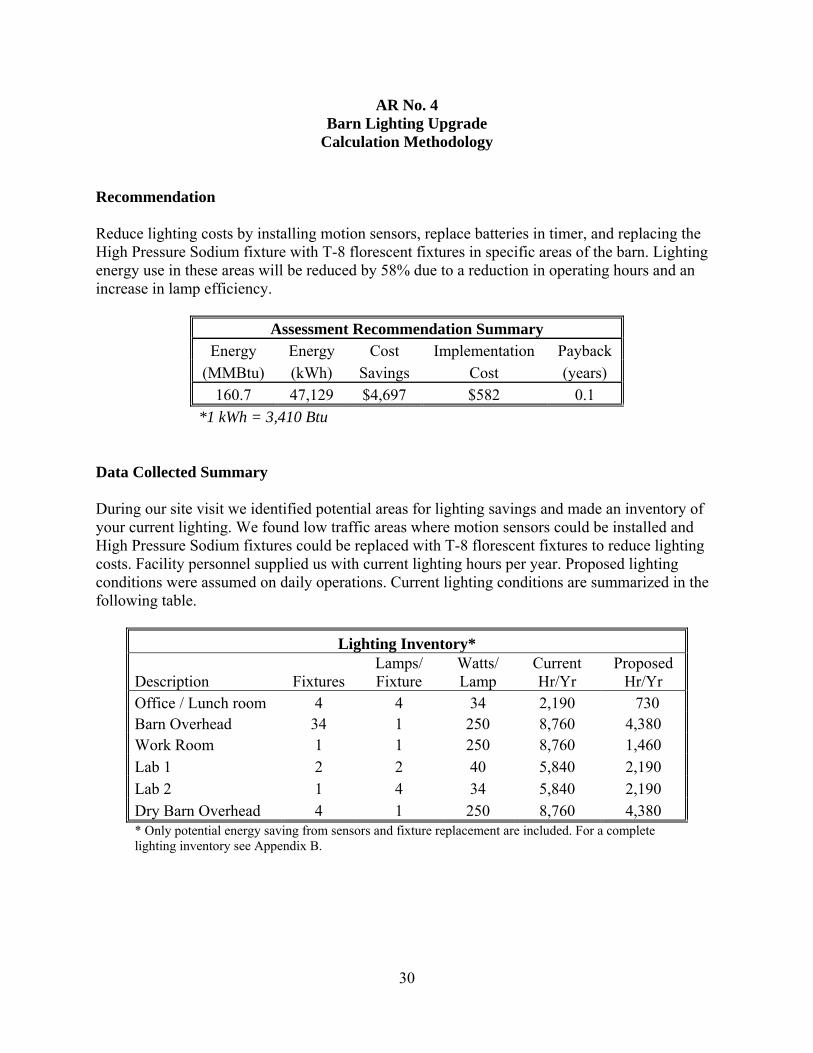
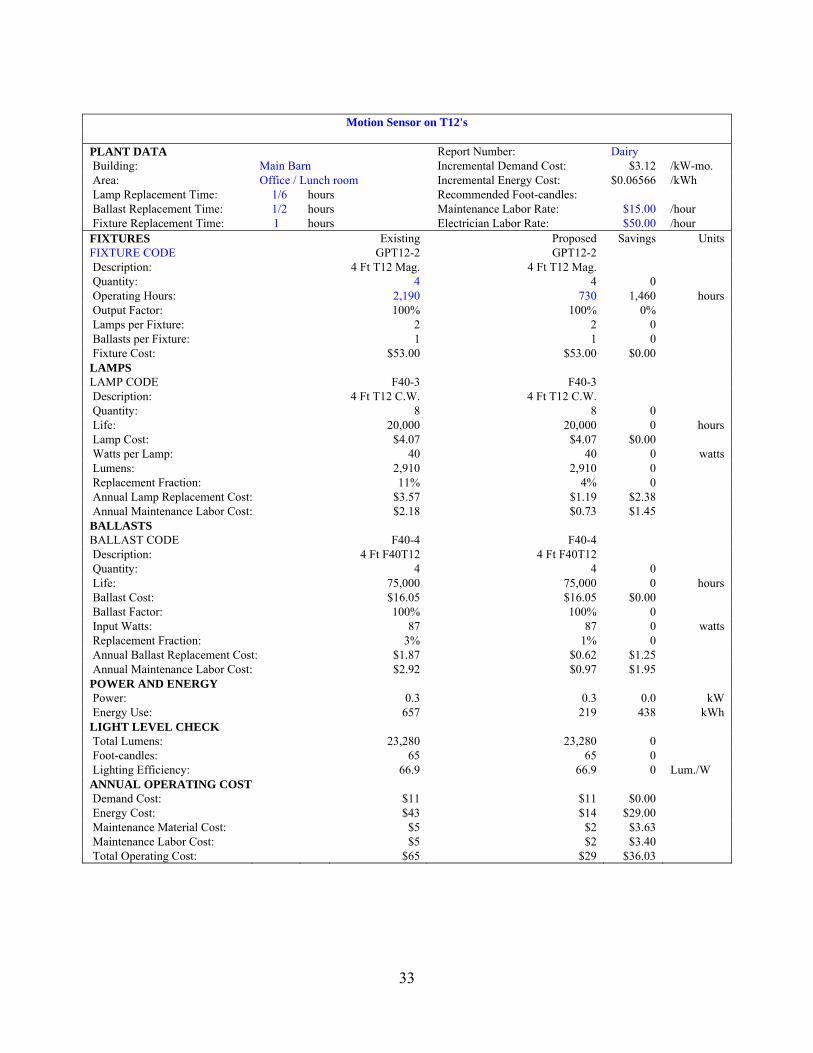
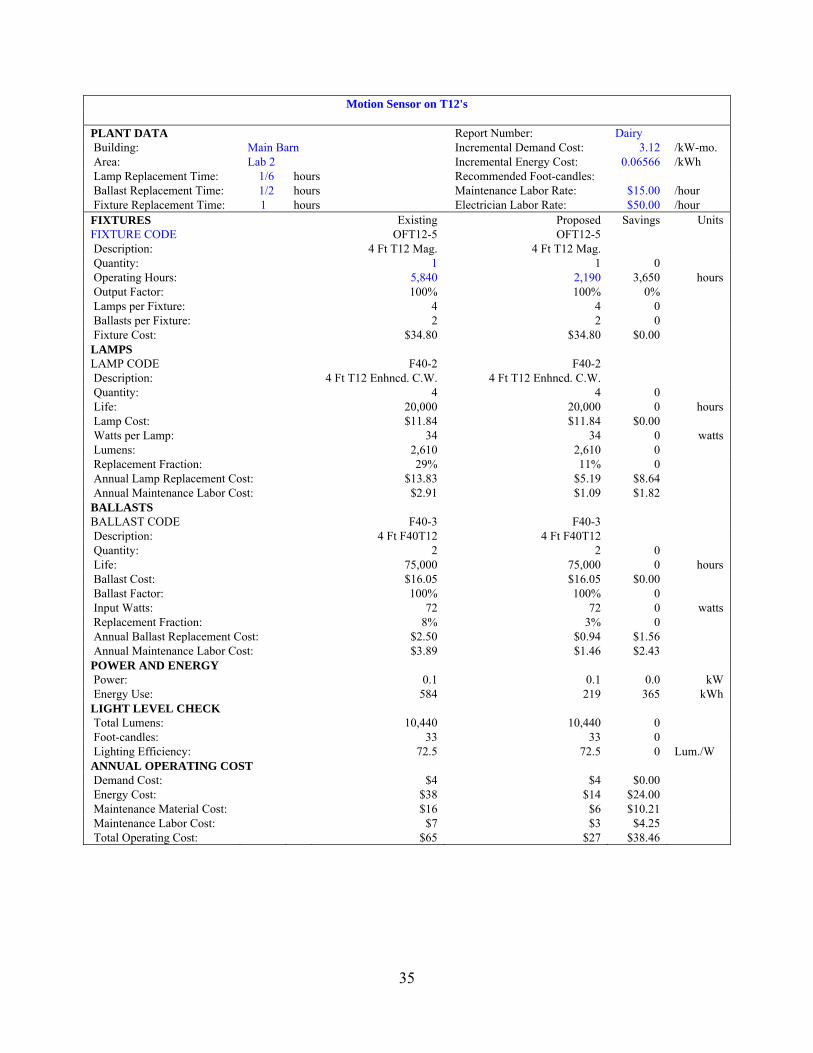
Recommendation Reduce lighting costs by installing motion sensors, replace batteries in timer, and replacing the High Pressure Sodium fixture with T-8 florescent fixtures in specific areas of the barn. Lighting energy use in these areas will be reduced by 58% due to a reduction in operating hours and an increase in lamp efficiency.
Assessment Recommendation Summary Energy Energy Cost Implementation Payback
(MMBtu) (kWh) Savings Cost (years) 160.7 47,129 $4,697 $582 0.1
*1 kWh = 3,410 Btu Data Collected Summary
During our site visit we identified potential areas for lighting savings and made an inventory of your current lighting. We found low traffic areas where motion sensors could be installed and High Pressure Sodium fixtures could be replaced with T-8 florescent fixtures to reduce lighting costs. Facility personnel supplied us with current lighting hours per year. Proposed lighting conditions were assumed on daily operations. Current lighting conditions are summarized in the following table.
Lighting Inventory*
Description Fixtures Lamps/ Fixture
Watts/ Lamp
Current Hr/Yr
Proposed Hr/Yr
Office / Lunch room 4 4 34 2,190 730 Barn Overhead 34 1 250 8,760 4,380 Work Room 1 1 250 8,760 1,460 Lab 1 2 2 40 5,840 2,190 Lab 2 1 4 34 5,840 2,190 Dry Barn Overhead 4 1 250 8,760 4,380 * Only potential energy saving from sensors and fixture replacement are included. For a complete lighting inventory see Appendix B.
30

Savings Analysis Energy and maintenance cost savings are calculated using the tables that follow this calculation methodology. Terminology for the lighting worksheets is described in Appendix B. Because lights may still be on during peak demand times, we do not estimate any demand by implementing motion sensors. Energy savings are estimated using power, current operating hours, and proposed operating hours per year. Energy cost savings are estimated with an incremental energy cost of $0.06566 /kWh; the motion sensor implementation in the Office/ Lunch room is taken as an example. CS = Cost Savings = ES x EC = 438 kWh x $0.06566 /kWh = $29 Where, EC = Incremental Energy Cost = $0.06566 /kWh ES = Energy Savings = CU – PU = 657 kWh – 219 kWh = 438 kWh Where, CU = Current Power Usage = OH x CP = 2,190 hours x 0.3kW = 657 kWh PU = Proposed Power Usage = PO x CP = 730 hours x 0.3kW = 219 kWh Where, OH = Current Operating Hours = 2,190 hours CP = Current Power = 0.3 kW PO = Proposed Operating Hours = 730 hours
31
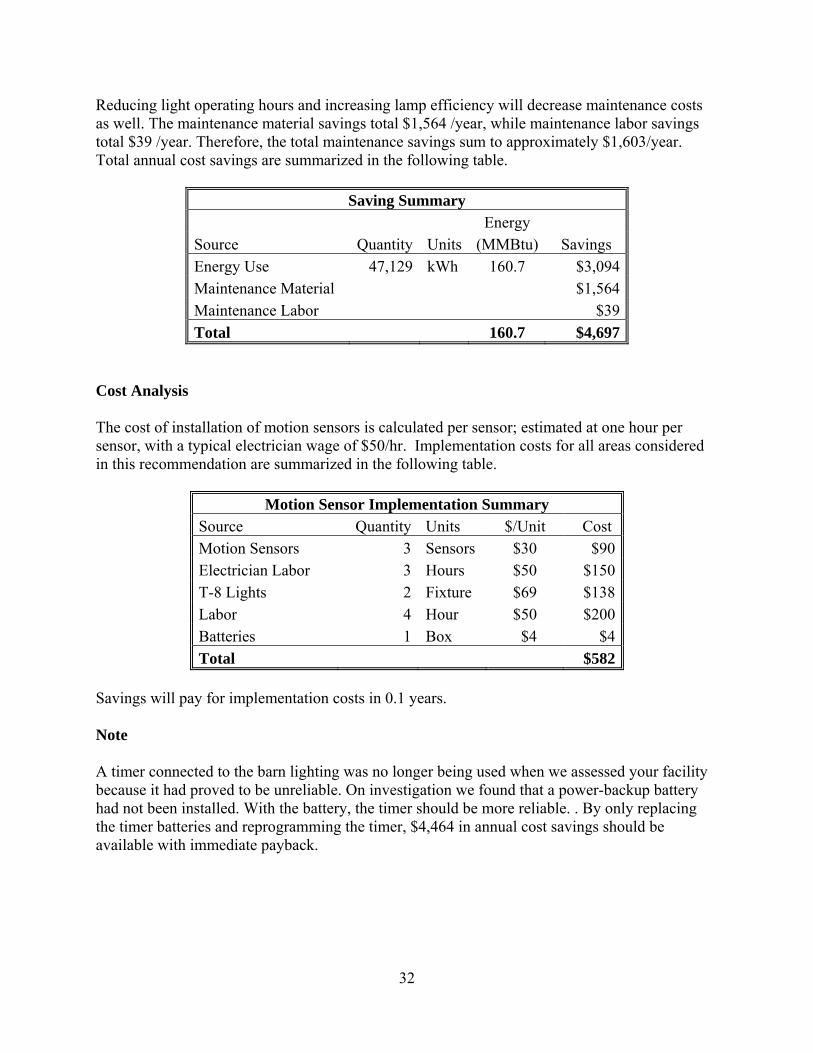
Reducing light operating hours and increasing lamp efficiency will decrease maintenance costs as well. The maintenance material savings total $1,564 /year, while maintenance labor savings total $39 /year. Therefore, the total maintenance savings sum to approximately $1,603/year. Total annual cost savings are summarized in the following table.
Saving Summary Energy
Source Quantity Units (MMBtu) Savings Energy Use 47,129 kWh 160.7 $3,094 Maintenance Material $1,564 Maintenance Labor $39 Total 160.7 $4,697
Cost Analysis The cost of installation of motion sensors is calculated per sensor; estimated at one hour per sensor, with a typical electrician wage of $50/hr. Implementation costs for all areas considered in this recommendation are summarized in the following table.
Motion Sensor Implementation Summary Source Quantity Units $/Unit Cost Motion Sensors 3 Sensors $30 $90 Electrician Labor 3 Hours $50 $150 T-8 Lights 2 Fixture $69 $138 Labor 4 Hour $50 $200 Batteries 1 Box $4 $4 Total $582
Savings will pay for implementation costs in 0.1 years. Note A timer connected to the barn lighting was no longer being used when we assessed your facility because it had proved to be unreliable. On investigation we found that a power-backup battery had not been installed. With the battery, the timer should be more reliable. . By only replacing the timer batteries and reprogramming the timer, $4,464 in annual cost savings should be available with immediate payback.
32
Motion Sensor on T12's
PLANT DATA Report Number: Dairy Building: Main Barn Incremental Demand Cost: $3.12 /kW-mo. Area: Office / Lunch room Incremental Energy Cost: $0.06566 /kWh Lamp Replacement Time: 1/6 hours Recommended Foot-candles: Ballast Replacement Time: 1/2 hours Maintenance Labor Rate: $15.00 /hour Fixture Replacement Time: 1 hours Electrician Labor Rate: $50.00 /hour FIXTURES Existing Proposed Savings Units FIXTURE CODE GPT12-2 GPT12-2 Description: 4 Ft T12 Mag. 4 Ft T12 Mag. Quantity: 4 4 0 Operating Hours: 2,190 730 1,460 hours Output Factor: 100% 100% 0% Lamps per Fixture: 2 2 0 Ballasts per Fixture: 1 1 0 Fixture Cost: $53.00 $53.00 $0.00 LAMPS LAMP CODE F40-3 F40-3 Description: 4 Ft T12 C.W. 4 Ft T12 C.W. Quantity: 8 8 0 Life: 20,000 20,000 0 hours Lamp Cost: $4.07 $4.07 $0.00 Watts per Lamp: 40 40 0 watts Lumens: 2,910 2,910 0 Replacement Fraction: 11% 4% 0 Annual Lamp Replacement Cost: $3.57 $1.19 $2.38 Annual Maintenance Labor Cost: $2.18 $0.73 $1.45 BALLASTS BALLAST CODE F40-4 F40-4 Description: 4 Ft F40T12 4 Ft F40T12 Quantity: 4 4 0 Life: 75,000 75,000 0 hours Ballast Cost: $16.05 $16.05 $0.00 Ballast Factor: 100% 100% 0 Input Watts: 87 87 0 watts Replacement Fraction: 3% 1% 0 Annual Ballast Replacement Cost: $1.87 $0.62 $1.25 Annual Maintenance Labor Cost: $2.92 $0.97 $1.95 POWER AND ENERGY Power: 0.3 0.3 0.0 kW Energy Use: 657 219 438 kWh LIGHT LEVEL CHECK Total Lumens: 23,280 23,280 0 Foot-candles: 65 65 0 Lighting Efficiency: 66.9 66.9 0 Lum./W ANNUAL OPERATING COST Demand Cost: $11 $11 $0.00 Energy Cost: $43 $14 $29.00 Maintenance Material Cost: $5 $2 $3.63 Maintenance Labor Cost: $5 $2 $3.40 Total Operating Cost: $65 $29 $36.03
33

Motion Sensor on T12's
PLANT DATA Report Number: Dairy Building: Main Barn Incremental Demand Cost: 3.12 /kW-mo. Area: Lab 1 Incremental Energy Cost: 0.06566 /kWh Lamp Replacement Time: 1/6 hours Recommended Foot-candles: Ballast Replacement Time: 1/2 hours Maintenance Labor Rate: $15.00 /hour Fixture Replacement Time: 1 hours Electrician Labor Rate: $50.00 /hour FIXTURES Existing Proposed Savings Units FIXTURE CODE OFT12-2 OFT12-2 Description: 4 Ft T12 Mag. 4 Ft T12 Mag. Quantity: 2 2 0 Operating Hours: 5,840 2,190 3,650 hours Output Factor: 100% 100% 0% Lamps per Fixture: 2 2 0 Ballasts per Fixture: 1 1 0 Fixture Cost: $36.60 $36.60 $0.00 LAMPS LAMP CODE F40-3 F40-3 Description: 4 Ft T12 C.W. 4 Ft T12 C.W. Quantity: 4 4 0 Life: 20,000 20,000 0 hours Lamp Cost: $4.07 $4.07 $0.00 Watts per Lamp: 40 40 0 watts Lumens: 2,910 2,910 0 Replacement Fraction: 29% 11% 0 Annual Lamp Replacement Cost: $4.75 $1.78 $2.97 Annual Maintenance Labor Cost: $2.91 $1.09 $1.82 BALLASTS BALLAST CODE F40-4 F40-4 Description: 4 Ft F40T12 4 Ft F40T12 Quantity: 2 2 0 Life: 75,000 75,000 0 hours Ballast Cost: $16.05 $16.05 $0.00 Ballast Factor: 100% 100% 0 Input Watts: 87 87 0 watts Replacement Fraction: 8% 3% 0 Annual Ballast Replacement Cost: $2.50 $0.94 $1.56 Annual Maintenance Labor Cost: $3.89 $1.46 $2.43 POWER AND ENERGY Power: 0.2 0.2 0.0 kW Energy Use: 1,168 438 730 kWh LIGHT LEVEL CHECK Total Lumens: 11,640 11,640 0 Foot-candles: 65 65 0 Lighting Efficiency: 66.9 66.9 0 Lum./W ANNUAL OPERATING COST Demand Cost: $7 $7 $0.00 Energy Cost: $77 $29 $48.00 Maintenance Material Cost: $7 $3 $4.53 Maintenance Labor Cost: $7 $3 $4.25 Total Operating Cost: $98 $41 $56.78
34
Motion Sensor on T12's PLANT DATA Report Number: Dairy Building: Main Barn Incremental Demand Cost: 3.12 /kW-mo. Area: Lab 2 Incremental Energy Cost: 0.06566 /kWh Lamp Replacement Time: 1/6 hours Recommended Foot-candles: Ballast Replacement Time: 1/2 hours Maintenance Labor Rate: $15.00 /hour Fixture Replacement Time: 1 hours Electrician Labor Rate: $50.00 /hour FIXTURES Existing Proposed Savings Units FIXTURE CODE OFT12-5 OFT12-5 Description: 4 Ft T12 Mag. 4 Ft T12 Mag. Quantity: 1 1 0 Operating Hours: 5,840 2,190 3,650 hours Output Factor: 100% 100% 0% Lamps per Fixture: 4 4 0 Ballasts per Fixture: 2 2 0 Fixture Cost: $34.80 $34.80 $0.00 LAMPS LAMP CODE F40-2 F40-2 Description: 4 Ft T12 Enhncd. C.W. 4 Ft T12 Enhncd. C.W. Quantity: 4 4 0 Life: 20,000 20,000 0 hours Lamp Cost: $11.84 $11.84 $0.00 Watts per Lamp: 34 34 0 watts Lumens: 2,610 2,610 0 Replacement Fraction: 29% 11% 0 Annual Lamp Replacement Cost: $13.83 $5.19 $8.64 Annual Maintenance Labor Cost: $2.91 $1.09 $1.82 BALLASTS BALLAST CODE F40-3 F40-3 Description: 4 Ft F40T12 4 Ft F40T12 Quantity: 2 2 0 Life: 75,000 75,000 0 hours Ballast Cost: $16.05 $16.05 $0.00 Ballast Factor: 100% 100% 0 Input Watts: 72 72 0 watts Replacement Fraction: 8% 3% 0 Annual Ballast Replacement Cost: $2.50 $0.94 $1.56 Annual Maintenance Labor Cost: $3.89 $1.46 $2.43 POWER AND ENERGY Power: 0.1 0.1 0.0 kW Energy Use: 584 219 365 kWh LIGHT LEVEL CHECK Total Lumens: 10,440 10,440 0 Foot-candles: 33 33 0 Lighting Efficiency: 72.5 72.5 0 Lum./W ANNUAL OPERATING COST Demand Cost: $4 $4 $0.00 Energy Cost: $38 $14 $24.00 Maintenance Material Cost: $16 $6 $10.21 Maintenance Labor Cost: $7 $3 $4.25 Total Operating Cost: $65 $27 $38.46
35
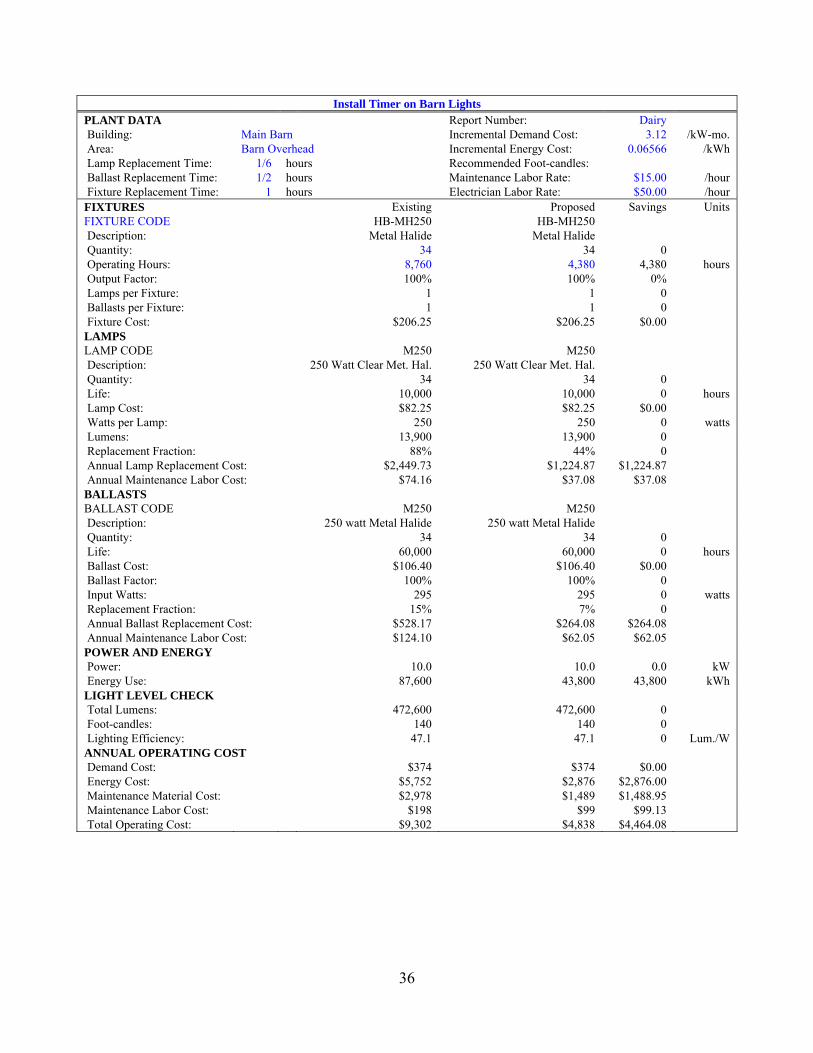
Install Timer on Barn Lights PLANT DATA Report Number: Dairy Building: Main Barn Incremental Demand Cost: 3.12 /kW-mo. Area: Barn Overhead Incremental Energy Cost: 0.06566 /kWh Lamp Replacement Time: 1/6 hours Recommended Foot-candles: Ballast Replacement Time: 1/2 hours Maintenance Labor Rate: $15.00 /hour Fixture Replacement Time: 1 hours Electrician Labor Rate: $50.00 /hour FIXTURES Existing Proposed Savings Units FIXTURE CODE HB-MH250 HB-MH250 Description: Metal Halide Metal Halide Quantity: 34 34 0 Operating Hours: 8,760 4,380 4,380 hours Output Factor: 100% 100% 0% Lamps per Fixture: 1 1 0 Ballasts per Fixture: 1 1 0 Fixture Cost: $206.25 $206.25 $0.00 LAMPS LAMP CODE M250 M250 Description: 250 Watt Clear Met. Hal. 250 Watt Clear Met. Hal. Quantity: 34 34 0 Life: 10,000 10,000 0 hours Lamp Cost: $82.25 $82.25 $0.00 Watts per Lamp: 250 250 0 watts Lumens: 13,900 13,900 0 Replacement Fraction: 88% 44% 0 Annual Lamp Replacement Cost: $2,449.73 $1,224.87 $1,224.87 Annual Maintenance Labor Cost: $74.16 $37.08 $37.08 BALLASTS BALLAST CODE M250 M250 Description: 250 watt Metal Halide 250 watt Metal Halide Quantity: 34 34 0 Life: 60,000 60,000 0 hours Ballast Cost: $106.40 $106.40 $0.00 Ballast Factor: 100% 100% 0 Input Watts: 295 295 0 watts Replacement Fraction: 15% 7% 0 Annual Ballast Replacement Cost: $528.17 $264.08 $264.08 Annual Maintenance Labor Cost: $124.10 $62.05 $62.05 POWER AND ENERGY Power: 10.0 10.0 0.0 kW Energy Use: 87,600 43,800 43,800 kWh LIGHT LEVEL CHECK Total Lumens: 472,600 472,600 0 Foot-candles: 140 140 0 Lighting Efficiency: 47.1 47.1 0 Lum./W ANNUAL OPERATING COST Demand Cost: $374 $374 $0.00 Energy Cost: $5,752 $2,876 $2,876.00 Maintenance Material Cost: $2,978 $1,489 $1,488.95 Maintenance Labor Cost: $198 $99 $99.13 Total Operating Cost: $9,302 $4,838 $4,464.08
36
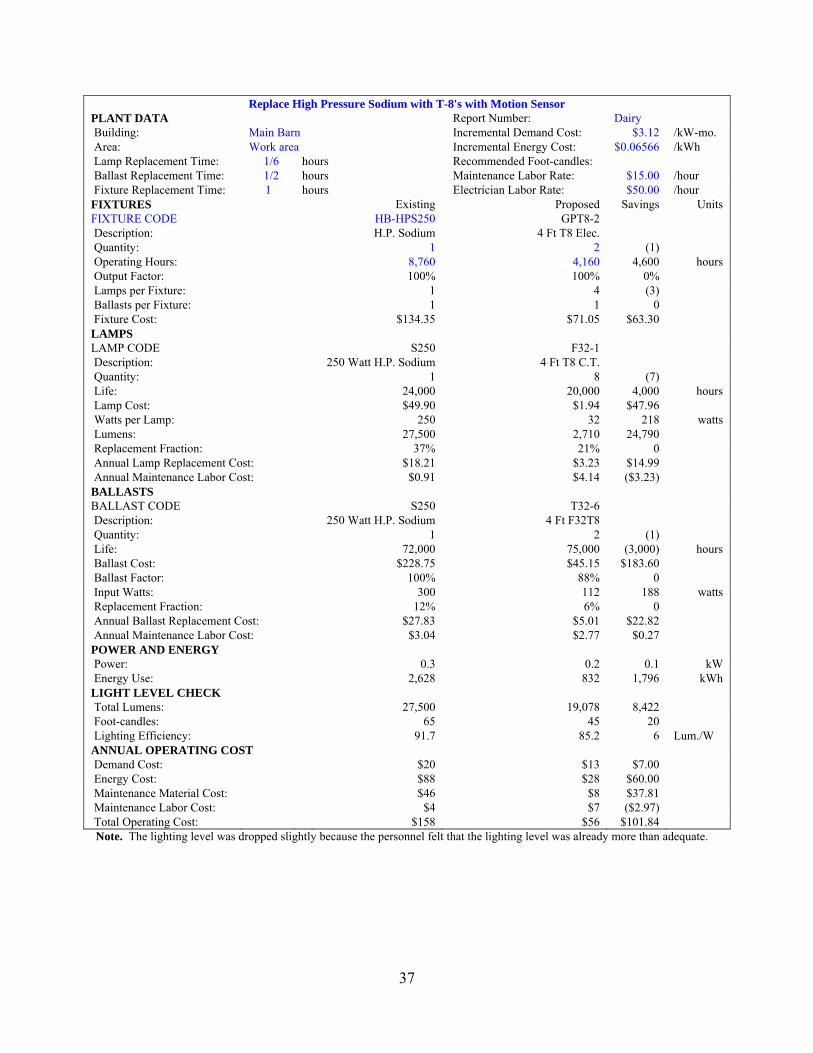
Replace High Pressure Sodium with T-8's with Motion Sensor PLANT DATA Report Number: Dairy Building: Main Barn Incremental Demand Cost: $3.12 /kW-mo. Area: Work area Incremental Energy Cost: $0.06566 /kWh Lamp Replacement Time: 1/6 hours Recommended Foot-candles: Ballast Replacement Time: 1/2 hours Maintenance Labor Rate: $15.00 /hour Fixture Replacement Time: 1 hours Electrician Labor Rate: $50.00 /hour FIXTURES Existing Proposed Savings Units FIXTURE CODE HB-HPS250 GPT8-2 Description: H.P. Sodium 4 Ft T8 Elec. Quantity: 1 2 (1) Operating Hours: 8,760 4,160 4,600 hours Output Factor: 100% 100% 0% Lamps per Fixture: 1 4 (3) Ballasts per Fixture: 1 1 0 Fixture Cost: $134.35 $71.05 $63.30 LAMPS LAMP CODE S250 F32-1 Description: 250 Watt H.P. Sodium 4 Ft T8 C.T. Quantity: 1 8 (7) Life: 24,000 20,000 4,000 hours Lamp Cost: $49.90 $1.94 $47.96 Watts per Lamp: 250 32 218 watts Lumens: 27,500 2,710 24,790 Replacement Fraction: 37% 21% 0 Annual Lamp Replacement Cost: $18.21 $3.23 $14.99 Annual Maintenance Labor Cost: $0.91 $4.14 ($3.23) BALLASTS BALLAST CODE S250 T32-6 Description: 250 Watt H.P. Sodium 4 Ft F32T8 Quantity: 1 2 (1) Life: 72,000 75,000 (3,000) hours Ballast Cost: $228.75 $45.15 $183.60 Ballast Factor: 100% 88% 0 Input Watts: 300 112 188 watts Replacement Fraction: 12% 6% 0 Annual Ballast Replacement Cost: $27.83 $5.01 $22.82 Annual Maintenance Labor Cost: $3.04 $2.77 $0.27 POWER AND ENERGY Power: 0.3 0.2 0.1 kW Energy Use: 2,628 832 1,796 kWh LIGHT LEVEL CHECK Total Lumens: 27,500 19,078 8,422 Foot-candles: 65 45 20 Lighting Efficiency: 91.7 85.2 6 Lum./W ANNUAL OPERATING COST Demand Cost: $20 $13 $7.00 Energy Cost: $88 $28 $60.00 Maintenance Material Cost: $46 $8 $37.81 Maintenance Labor Cost: $4 $7 ($2.97) Total Operating Cost: $158 $56 $101.84 Note. The lighting level was dropped slightly because the personnel felt that the lighting level was already more than adequate.
37
AR No. 5 Vacuum Pump VSD
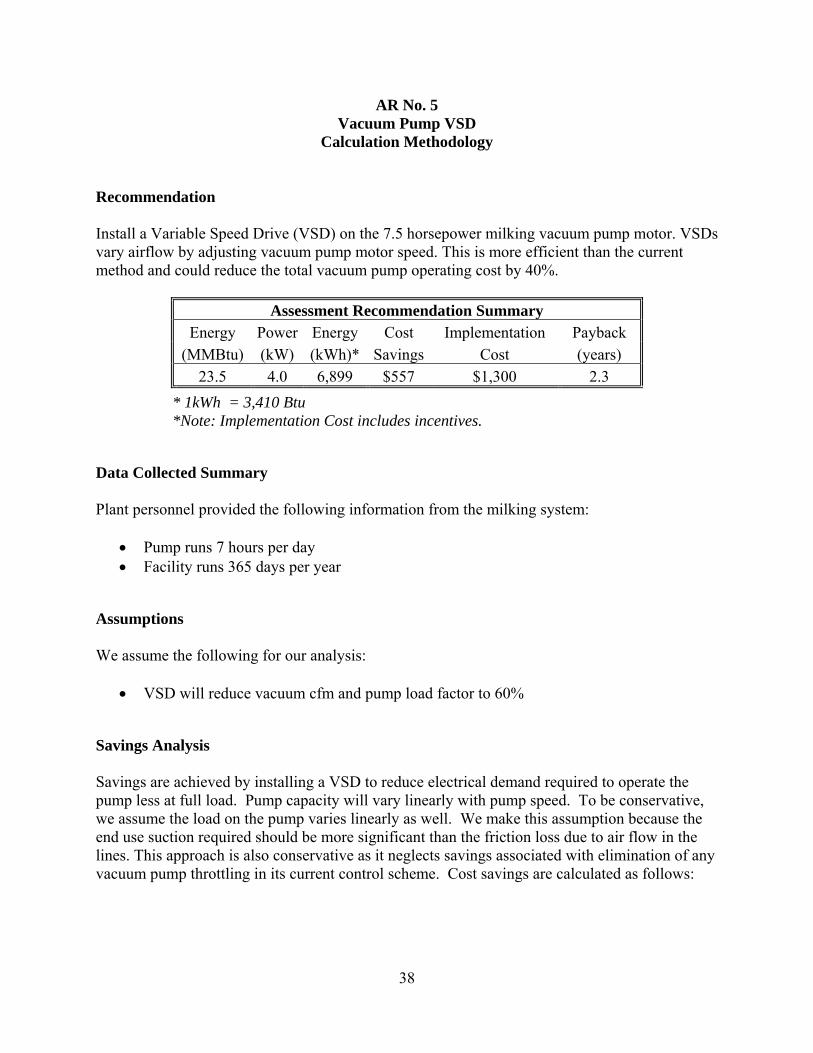
Calculation Methodology Recommendation Install a Variable Speed Drive (VSD) on the 7.5 horsepower milking vacuum pump motor. VSDs vary airflow by adjusting vacuum pump motor speed. This is more efficient than the current method and could reduce the total vacuum pump operating cost by 40%.
Assessment Recommendation Summary Energy Power Energy Cost Implementation Payback
(MMBtu) (kW) (kWh)* Savings Cost (years) 23.5 4.0 6,899 $557 $1,300 2.3
* 1kWh = 3,410 Btu *Note: Implementation Cost includes incentives.
Data Collected Summary Plant personnel provided the following information from the milking system:
• Pump runs 7 hours per day • Facility runs 365 days per year
Assumptions We assume the following for our analysis:
• VSD will reduce vacuum cfm and pump load factor to 60%
Savings Analysis Savings are achieved by installing a VSD to reduce electrical demand required to operate the pump less at full load. Pump capacity will vary linearly with pump speed. To be conservative, we assume the load on the pump varies linearly as well. We make this assumption because the end use suction required should be more significant than the friction loss due to air flow in the lines. This approach is also conservative as it neglects savings associated with elimination of any vacuum pump throttling in its current control scheme. Cost savings are calculated as follows:
38
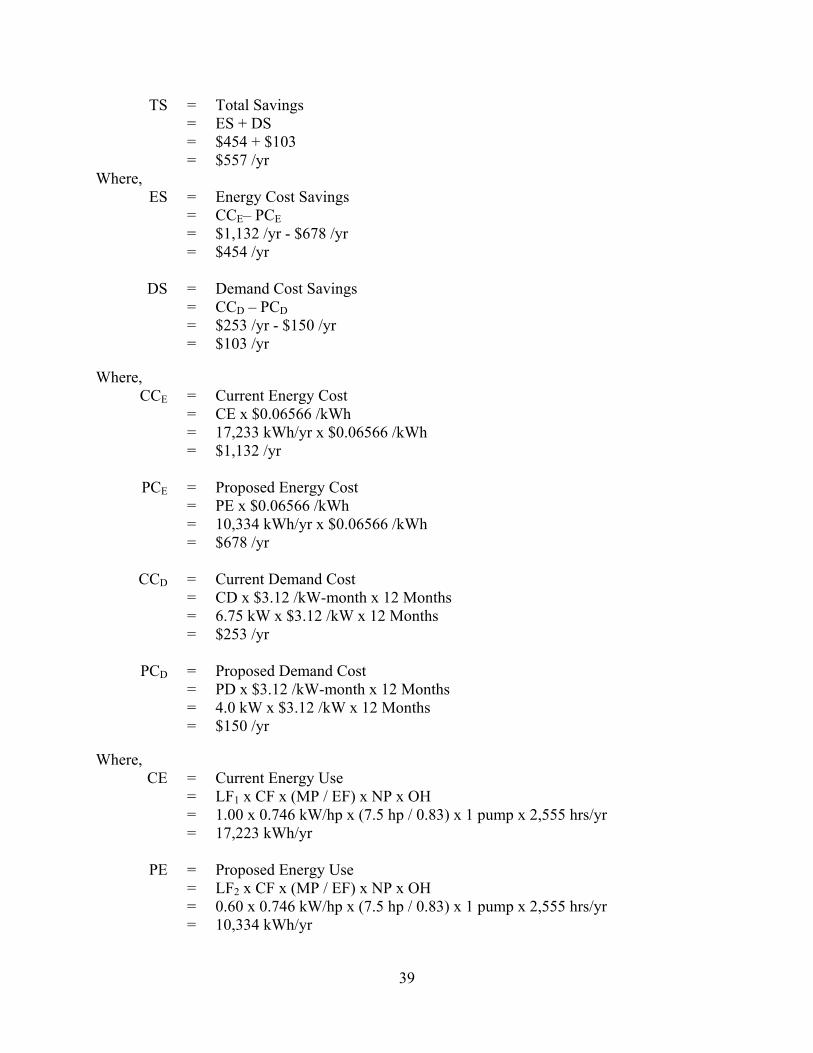
TS = Total Savings = ES + DS = $454 + $103 = $557 /yr Where,
ES = Energy Cost Savings = CCE– PCE = $1,132 /yr - $678 /yr
= $454 /yr
DS = Demand Cost Savings = CCD – PCD = $253 /yr - $150 /yr = $103 /yr Where, CCE = Current Energy Cost = CE x $0.06566 /kWh = 17,233 kWh/yr x $0.06566 /kWh = $1,132 /yr PCE = Proposed Energy Cost = PE x $0.06566 /kWh = 10,334 kWh/yr x $0.06566 /kWh = $678 /yr CCD = Current Demand Cost = CD x $3.12 /kW-month x 12 Months = 6.75 kW x $3.12 /kW x 12 Months = $253 /yr PCD = Proposed Demand Cost = PD x $3.12 /kW-month x 12 Months = 4.0 kW x $3.12 /kW x 12 Months = $150 /yr Where, CE = Current Energy Use = LF1 x CF x (MP / EF) x NP x OH = 1.00 x 0.746 kW/hp x (7.5 hp / 0.83) x 1 pump x 2,555 hrs/yr = 17,223 kWh/yr PE = Proposed Energy Use = LF2 x CF x (MP / EF) x NP x OH = 0.60 x 0.746 kW/hp x (7.5 hp / 0.83) x 1 pump x 2,555 hrs/yr = 10,334 kWh/yr
39

CD = Current Demand = LF1 x CF x (MP / EF) x NP = 1.00 x 0.746 kW/hp x (7.5 hp / 0.83) x 1 pump = 6.75 kW PD = Proposed Demand = LF2 x CF x (MP / EF) x NP = 0.60 x 0.746 kW/hp x (7.5 hp / 0.83) x 1 pump = 4.0 kW Where, LF1 = Load Factor before VSD = 100% LF2 = Load Factor after VSD = 60%
CF = Conversion Factor = 0.746 kW/hp MP = Motor Horsepower = 7.5 hp EF = Motor Efficiency = 83% NP = Number of Pumps = 1 pump OH = Operating Hours = 2,555 hrs/yr Comparing current and proposed conditions shows a cost savings of $557 /yr. Cost Analysis A vendor supplied us with the following implementation cost estimations.
Implementation Cost Summary Description Cost 7.5 hp VSD $2,000 Labor $500 Total $2,500
Savings will pay for implementation in 4.5 years.
40
41
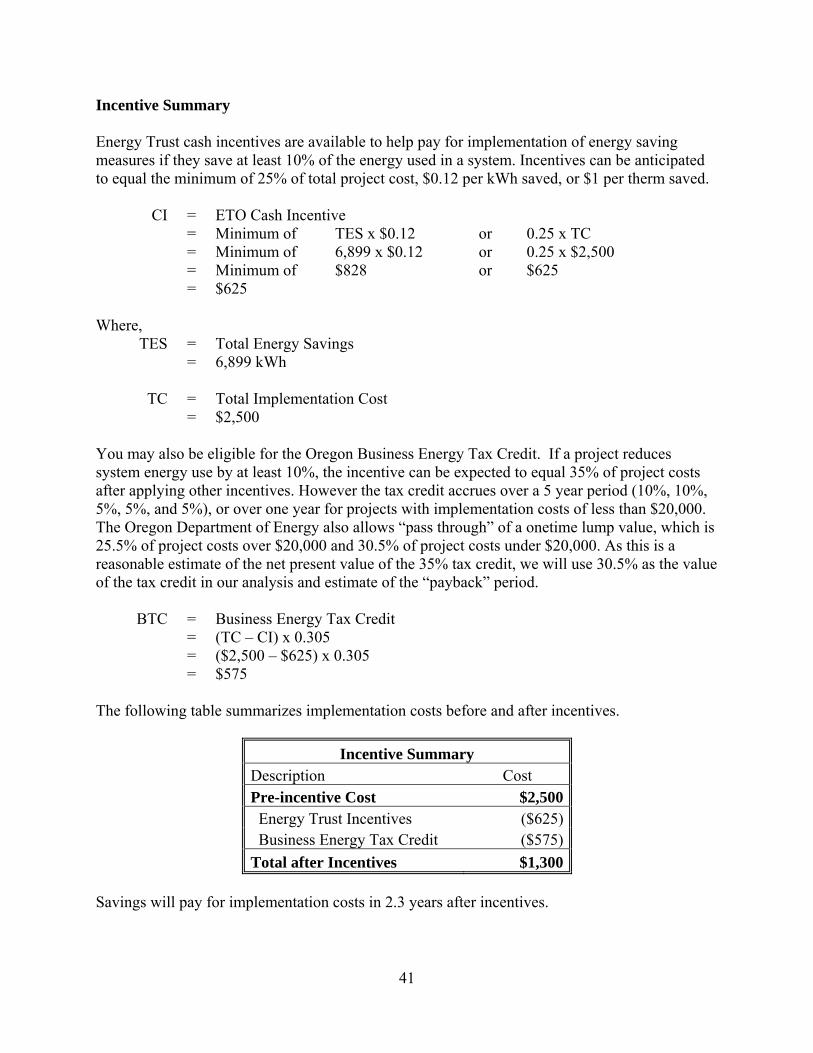
Incentive Summary
Energy Trust cash incentives are available to help pay for implementation of energy saving measures if they save at least 10% of the energy used in a system. Incentives can be anticipated to equal the minimum of 25% of total project cost, $0.12 per kWh saved, or $1 per therm saved. CI = ETO Cash Incentive = Minimum of TES x $0.12 or 0.25 x TC = Minimum of 6,899 x $0.12 or 0.25 x $2,500 = Minimum of $828 or $625 = $625 Where, TES = Total Energy Savings = 6,899 kWh TC = Total Implementation Cost = $2,500 You may also be eligible for the Oregon Business Energy Tax Credit. If a project reduces system energy use by at least 10%, the incentive can be expected to equal 35% of project costs after applying other incentives. However the tax credit accrues over a 5 year period (10%, 10%, 5%, 5%, and 5%), or over one year for projects with implementation costs of less than $20,000. The Oregon Department of Energy also allows “pass through” of a onetime lump value, which is 25.5% of project costs over $20,000 and 30.5% of project costs under $20,000. As this is a reasonable estimate of the net present value of the 35% tax credit, we will use 30.5% as the value of the tax credit in our analysis and estimate of the “payback” period. BTC = Business Energy Tax Credit = (TC – CI) x 0.305 = ($2,500 – $625) x 0.305 = $575 The following table summarizes implementation costs before and after incentives.
Incentive Summary Description Cost Pre-incentive Cost $2,500 Energy Trust Incentives ($625) Business Energy Tax Credit ($575)Total after Incentives $1,300
Savings will pay for implementation costs in 2.3 years after incentives.
AR No. 6 Roofing
Calculation Methodology
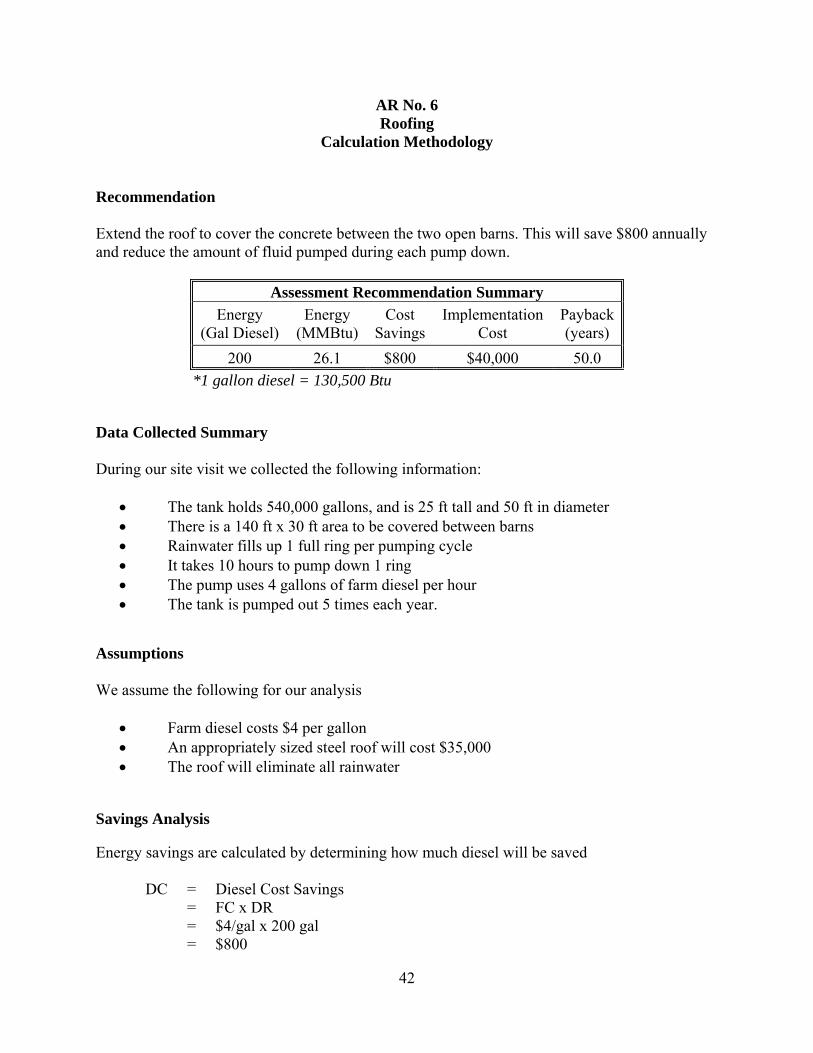
Recommendation Extend the roof to cover the concrete between the two open barns. This will save $800 annually and reduce the amount of fluid pumped during each pump down.
Assessment Recommendation Summary Energy
(Gal Diesel) Energy
(MMBtu) Cost
Savings Implementation
Cost Payback (years)
200 26.1 $800 $40,000 50.0 *1 gallon diesel = 130,500 Btu
Data Collected Summary During our site visit we collected the following information:
• The tank holds 540,000 gallons, and is 25 ft tall and 50 ft in diameter • There is a 140 ft x 30 ft area to be covered between barns • Rainwater fills up 1 full ring per pumping cycle • It takes 10 hours to pump down 1 ring • The pump uses 4 gallons of farm diesel per hour • The tank is pumped out 5 times each year.
Assumptions We assume the following for our analysis
• Farm diesel costs $4 per gallon • An appropriately sized steel roof will cost $35,000 • The roof will eliminate all rainwater
Savings Analysis Energy savings are calculated by determining how much diesel will be saved DC = Diesel Cost Savings = FC x DR = $4/gal x 200 gal = $800
42

43
Where, FC = Fuel Cost = $4/gal DR = Diesel to Pump Rainwater = NP x RP x TR x PD = 5 purges x 1 ring/purge x 10 hrs/ring x 4 gal/hr = 200 gal NP = Number of purges each year = 5 purges RP = Quantity of Rainwater Pumped each Purge = 1 ring/purge TR = Time Required to Pump a Ring = 10 hrs/ring PD = Pump Demand = 4 gal/hr Cost Analysis Implementation costs include material and installation labor costs for a prefabricated steel roof.
Implementation Cost Summary Source Quantity Cost/Unit Cost Prefabricated Steel Roof 1 $40,000 $35,000 Labor Cost 100 $50/hr $5,000 Total $40,000
Cost savings will pay for implementation in 50.0 years. Additional Benefits Although this recommendation isn’t economical, there are other nonmonetary factors associated with it. Reducing rainwater infiltration into the holding tank will decrease the need to pump the tank down. This will in turn reduce smell, over irrigation, and will decrease the load on the tank. By decreasing the load on the tank, tank lifespan can be extended and current demands for greater tank capacity will be reduced.
AR No. 7 Electric Waste Water Pump
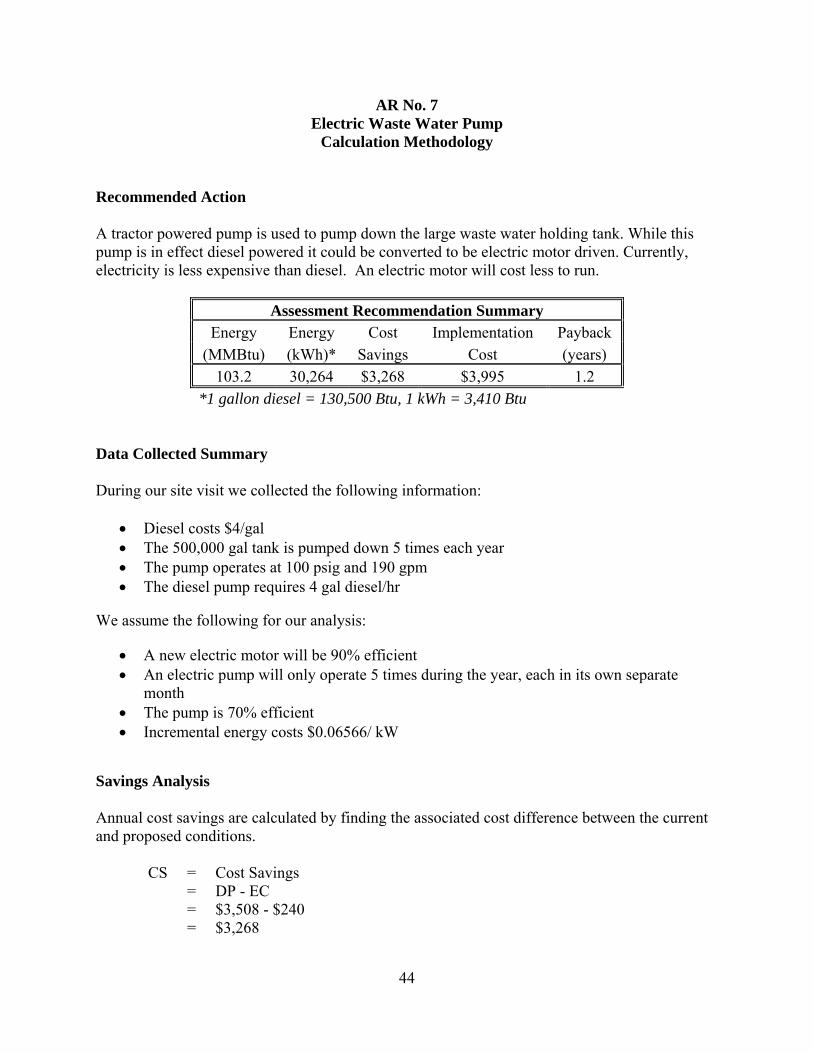
Calculation Methodology Recommended Action A tractor powered pump is used to pump down the large waste water holding tank. While this pump is in effect diesel powered it could be converted to be electric motor driven. Currently, electricity is less expensive than diesel. An electric motor will cost less to run.
Assessment Recommendation Summary Energy Energy Cost Implementation Payback
(MMBtu) (kWh)* Savings Cost (years) 103.2 30,264 $3,268 $3,995 1.2
*1 gallon diesel = 130,500 Btu, 1 kWh = 3,410 Btu Data Collected Summary During our site visit we collected the following information:
• Diesel costs $4/gal • The 500,000 gal tank is pumped down 5 times each year • The pump operates at 100 psig and 190 gpm • The diesel pump requires 4 gal diesel/hr
We assume the following for our analysis:
• A new electric motor will be 90% efficient • An electric pump will only operate 5 times during the year, each in its own separate
month • The pump is 70% efficient • Incremental energy costs $0.06566/ kW
Savings Analysis Annual cost savings are calculated by finding the associated cost difference between the current and proposed conditions. CS = Cost Savings = DP - EC = $3,508 - $240 = $3,268
44
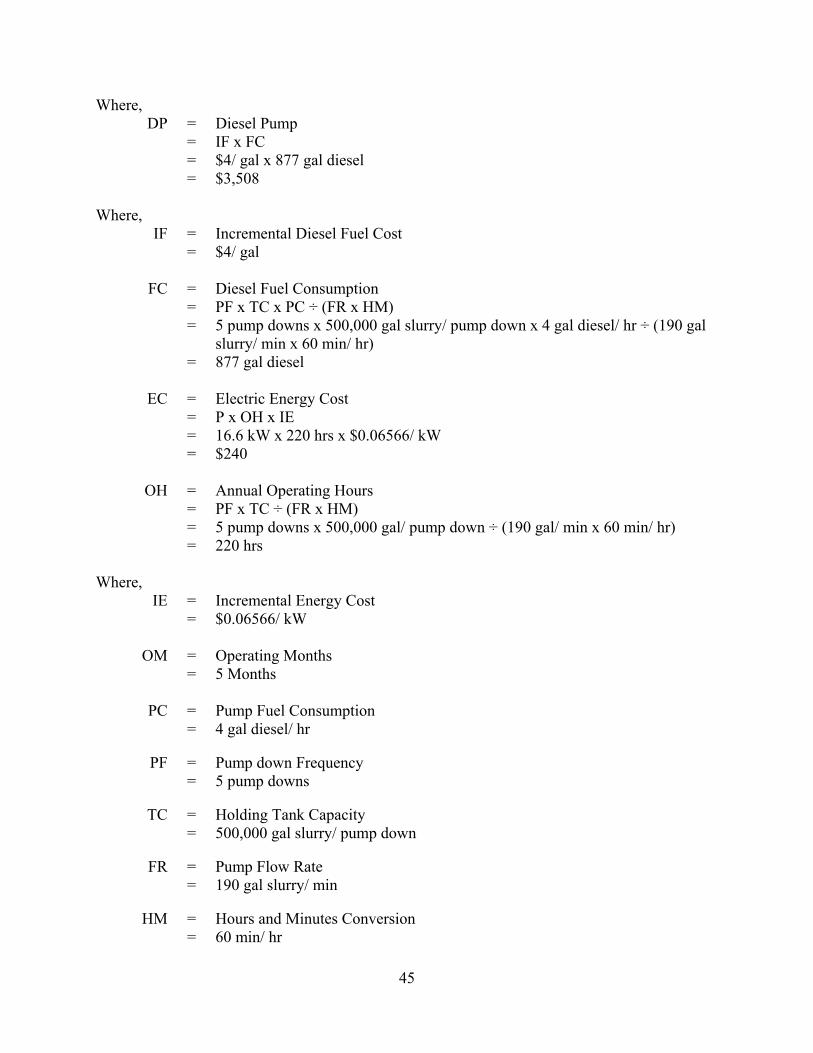
Where, DP = Diesel Pump = IF x FC = $4/ gal x 877 gal diesel = $3,508 Where, IF = Incremental Diesel Fuel Cost = $4/ gal FC = Diesel Fuel Consumption = PF x TC x PC ÷ (FR x HM) = 5 pump downs x 500,000 gal slurry/ pump down x 4 gal diesel/ hr ÷ (190 gal slurry/ min x 60 min/ hr) = 877 gal diesel EC = Electric Energy Cost = P x OH x IE = 16.6 kW x 220 hrs x $0.06566/ kW = $240 OH = Annual Operating Hours = PF x TC ÷ (FR x HM) = 5 pump downs x 500,000 gal/ pump down ÷ (190 gal/ min x 60 min/ hr) = 220 hrs Where, IE = Incremental Energy Cost = $0.06566/ kW OM = Operating Months = 5 Months PC = Pump Fuel Consumption = 4 gal diesel/ hr PF = Pump down Frequency = 5 pump downs TC = Holding Tank Capacity = 500,000 gal slurry/ pump down FR = Pump Flow Rate = 190 gal slurry/ min HM = Hours and Minutes Conversion = 60 min/ hr
45
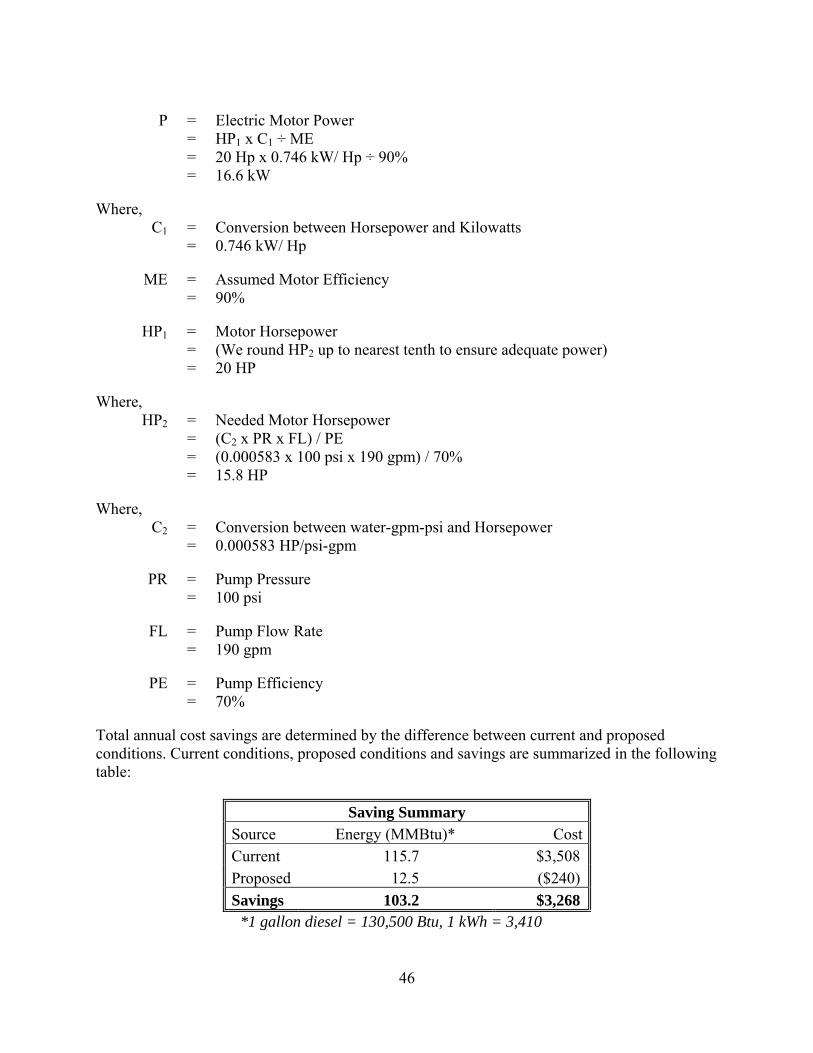
P = Electric Motor Power = HP1 x C1 ÷ ME = 20 Hp x 0.746 kW/ Hp ÷ 90% = 16.6 kW Where, C1 = Conversion between Horsepower and Kilowatts = 0.746 kW/ Hp ME = Assumed Motor Efficiency = 90% HP1 = Motor Horsepower = (We round HP2 up to nearest tenth to ensure adequate power) = 20 HP Where, HP2 = Needed Motor Horsepower = (C2 x PR x FL) / PE = (0.000583 x 100 psi x 190 gpm) / 70% = 15.8 HP Where, C2 = Conversion between water-gpm-psi and Horsepower = 0.000583 HP/psi-gpm PR = Pump Pressure = 100 psi FL = Pump Flow Rate = 190 gpm PE = Pump Efficiency = 70% Total annual cost savings are determined by the difference between current and proposed conditions. Current conditions, proposed conditions and savings are summarized in the following table:
Saving Summary Source Energy (MMBtu)* Cost Current 115.7 $3,508 Proposed 12.5 ($240) Savings 103.2 $3,268
*1 gallon diesel = 130,500 Btu, 1 kWh = 3,410
46
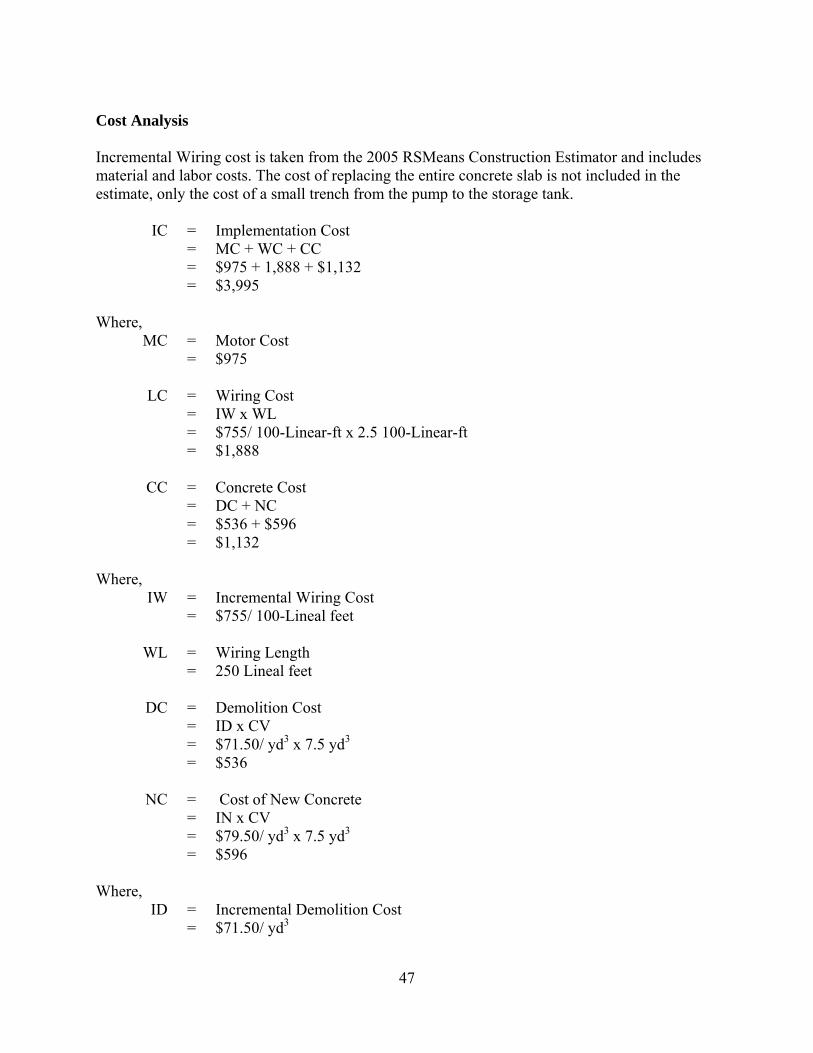
Cost Analysis Incremental Wiring cost is taken from the 2005 RSMeans Construction Estimator and includes material and labor costs. The cost of replacing the entire concrete slab is not included in the estimate, only the cost of a small trench from the pump to the storage tank. IC = Implementation Cost = MC + WC + CC = $975 + 1,888 + $1,132 = $3,995 Where, MC = Motor Cost = $975 LC = Wiring Cost = IW x WL = $755/ 100-Linear-ft x 2.5 100-Linear-ft = $1,888 CC = Concrete Cost = DC + NC = $536 + $596 = $1,132 Where, IW = Incremental Wiring Cost = $755/ 100-Lineal feet WL = Wiring Length = 250 Lineal feet DC = Demolition Cost = ID x CV = $71.50/ yd3 x 7.5 yd3 = $536 NC = Cost of New Concrete = IN x CV = $79.50/ yd3 x 7.5 yd3 = $596 Where, ID = Incremental Demolition Cost = $71.50/ yd3
47
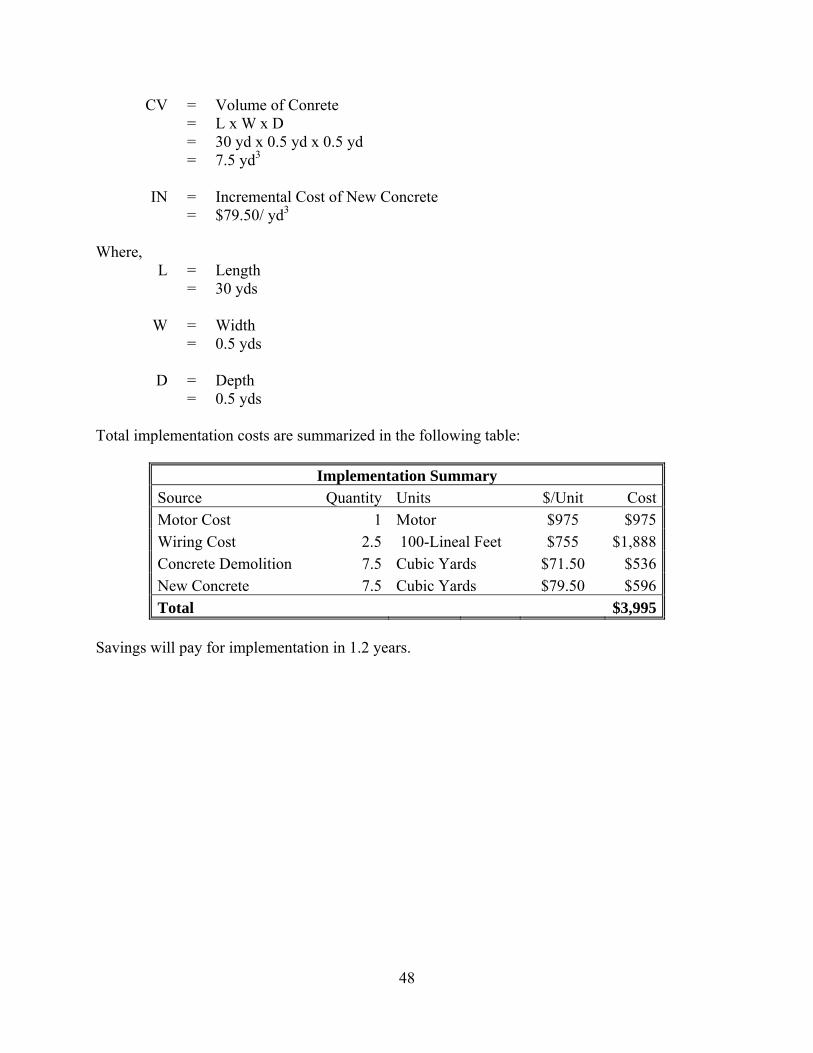
48
CV = Volume of Conrete = L x W x D = 30 yd x 0.5 yd x 0.5 yd = 7.5 yd3 IN = Incremental Cost of New Concrete = $79.50/ yd3 Where, L = Length = 30 yds W = Width = 0.5 yds D = Depth = 0.5 yds Total implementation costs are summarized in the following table:
Implementation Summary Source Quantity Units $/Unit CostMotor Cost 1 Motor $975 $975Wiring Cost 2.5 100-Lineal Feet $755 $1,888Concrete Demolition 7.5 Cubic Yards $71.50 $536New Concrete 7.5 Cubic Yards $79.50 $596Total $3,995
Savings will pay for implementation in 1.2 years.

APPENDIX A
UTILITIES A.1. Energy Definitions An essential component of any energy management program is tracking energy. When utility bills are received, we record energy use and cost in a spreadsheet and get the appropriate graphs. A separate spreadsheet may be required for each type of energy used, such as oil, gas, or electricity. A combination might be merited when both gas and oils are used interchangeably in a boiler. In such a case we suggest using a common energy unit for a cost-benefit analysis that can represent most fuel options: the Btu.
We have prepared a utility spreadsheet analysis based on the information provided by you or your utility companies. The worksheets are in section A.3, Energy, Waste, and Production Accounting. They show how energy is used and help identify potential energy savings.
We use specific terminology and calculations in analyzing and discussing your energy, water, and waste expenses. Energy related terms and calculations are detailed below followed by those for waste and water. Electricity Definitions: Average Energy Cost. The total amount billed for 12 months of energy, divided by the total number of energy units. Each energy type (oil, gas, electricity, propane, etc.) has its own average energy cost. The average cost per energy unit includes the fees, taxes and unit cost.
Average Energy Cost = (Total Billed $) ÷ (Total Energy Units)
Average Load Factor. The ratio of annual electrical energy use divided by the average kilowatts (kW) and the hours in a year.
Average Load Factor = (Total kWh/yr) ÷ (Average kW x 8,760 hrs/yr)
Average Load Factor expresses how well a given electrical system uses power. A higher load factor yields lower average energy cost.
An example of how load factor applies: A large air compressor has high electric demand for small periods of time and is not a large energy user. It will usually have low load factor and relatively high demand charges. A smaller air compressor that runs for longer periods of time at higher part load efficiency will have higher load factor and lower demand charges.
Basic Charge. The fee a utility company can charge each month to cover their administrative, facility, or other fixed costs. Some companies have higher energy or power rates that compensate for no or low basic charge.
49

Energy. The time-rate of work expressed in kWh for electric energy. The common unit is million Btu. For a more complete description, see Power.
Energy = Work ÷ Time = (Force x Distance) ÷ Time
Incremental Demand Cost. It is the price charged by your utility company for the capacity to meet your power needs at any given time. Peak demand is the highest demand level required over a set period of time and is calculated by continuously monitoring demand levels. Demand is usually billed based on peak power, but charges such as facility charges and other fees billed per kW are also included in the incremental demand cost. If your utility company has stepped demand cost rates, the step with the greatest demand is considered in the incremental demand cost. If your utility company bills one set rate for all power needs, this value is used as the incremental demand cost.
Incremental Energy Cost (Electricity). It is cost of one more unit of energy, from current use. This cost is usually taken from your utility rate schedule. When all large meters are on the same rate schedule, the incremental energy cost is the cost from the highest energy tier, or tail block. To further clarify this method: if a company is charged $0.05/kWh up to 100,000 kWh, and $0.03/kWh over 100,000 kWh and they are consistently buying over 100,000 kWh each month, any energy savings will be calculated using the $0.03/kWh cost.
If your company has multiple meters on different rate schedules or tariffs, the incremental cost is calculated by adding electrical energy costs and dividing by the total electrical energy use.
Incremental Energy Cost = (Total kWh $) ÷ (Total kWh)
Minimum Charge. The least amount billed by a utility at the end of the billing period. Power (and Energy). The rate at which energy is used, expressed as the amount of energy use per unit time, and commonly measured in units of watts and horsepower. Power is the term used to describe the capacity the utility company must provide to serve its customers. Power is specified three ways: real, reactive and total power. The following triangle gives the relationship between the three. Total Power (kVA)
Reactive Power (kVAR)
Ө
Real Power (kW)
Real power is the time average of the instantaneous product of voltage and current (watts). Apparent power is the product of rms (root mean square) volts and rms amps (volt-amps).
Demand The highest electrical power required by the customer, generally averaged over 15 minute cycling intervals for each month. Demand is usually billed by kW unit.
50
Kilovolt Amperes (kVA) Kilovolt amperes are a measure of the current available after accounting for power factor. See the triangle on the previous page. Power is sometimes billed by kVA.
Reactive Power
Reactive power is measured in units of kVAR. Reactive power produces magnetic fields in devices such as motors, transformers, and lighting ballasts that allow work to be done and electrical energy to be used. Kilo Volt Amperes Reactive (kVAR) could occur in an electrical circuit where voltage and current flow are not perfectly synchronized. Electric motors and other devices that use coils of wire to produce magnetic fields usually cause this misalignment of three-phase power. Out-of-phase current flow causes more electrical current to flow in the circuit than is required to supply real power. kVAR is a measure of this additional reactive power.
High kVAR can reduce the capacity of lines and transformers to supply kilowatts of real power and therefore cause additional expenses for the electrical service provider. Electric rates may include charges for kVAR that exceed a normal level. These charges allow the supplying utility to recover some of the additional expenses caused by high KVAR conditions, and also encourages customers to correct this problem.
Power Factor
The ratio of real power to total power. Power factor is the cosine of angle θ between total power and real power on the power triangle.
PF = cos θ = kW ÷ kVA
Disadvantages of Low Power Factor • Increases costs for suppliers because more current has to be transmitted requiring greater
distribution capacity. This higher cost is directly billed to customers who are metered for reactive power.
• Overloads generators, transformers and distribution lines within the plant, resulting in increased voltage drops and power losses. All of which represents waste, inefficiency and wear on electrical equipment.
• Reduces available capacity of transformers, circuit breakers and cables, whose capacity depends on the total current. Available capacity falls linearly as the power factor decreases.
Low Power Factor Charges
Most utilities penalize customers whose power factor is below a set level, typically in the range of 95% - 97%, or kVAR greater than 40% of kW. Improving power factor may reduce both energy and power costs, however these are generally much less than savings from real power penalties enforced by electrical utilities. Energy savings are also difficult to quantify. Therefore in our recommendations, only power factor penalty avoidance savings are included.
51

Improving Power Factor The most practical and economical power factor improvement device is the capacitor. All inductive loads produce inductive reactive power current (lags voltage by a phase angle of 90°). Capacitors, on the other hand, produce capacitive reactive power, which is the opposite of inductive reactive power (current leads…). Current peak occurs before voltage by a phase angle of 90°. By careful selection of capacitance required, it is possible to totally cancel out the inductive reactive power, but in practice it is seldom feasible to correct beyond your utilities’ penalty level (~95% for kVA meters).
Improving power factor results in:
• Reduced utility penalty charges. • Improved plant efficiency. • Additional equipment on the same line. • Reduced overloading of cables, transformers, and switchgear. • Improved voltage regulation due to reduced line voltage drops and improved starting torque
of motors.
Power Factor Penalty Utility companies generally calculate monthly power factor two ways. One way is based on meters of reactive energy and real energy.
Monthly PF = cos [tan-1 (kVARh ÷ kWh)]
The second method is based on reactive power and real power.
Monthly PF = cos [tan-1 (kVAR ÷ kW)]
Power Factor is often abbreviated as “PF”. Also see the Power Factor definition below.
Cost Calculations
Annual operating expenses include both demand and energy costs. Demand cost (DC) is calculated as the highest peak demand (D) multiplied by your incremental demand charge and the number of operating months per year:
DC = D x demand rate ($/kW·mo) x 12 mo/yr
Energy cost (EC) is energy multiplied by your incremental electric rate:
EC = E x energy rate ($/kWh)
52
Natural Gas Definitions:
Rate Schedules. (Or tariffs) specify billing procedures and set forth costs for each service offered. The state public utility commission approves public utility tariffs. For example: an electric utility company will set a price or schedule of prices for power and energy and specify basic and PF charges. A natural gas utility will specify cost to supply or transport gas and include costs such as price per therm, basic charge, minimum charges and other costs. Current rate schedules can often be found online at the utility company’s website. If you think your company belongs in a different rate schedule, your utility representative can help you best.
Tariff. Another term for rate schedule.
Therm. The unit generally used for natural gas (1 therm = 100,000 Btu), but sometimes it is measured in 106 Btu.
Commodity Rate. The component of the billing rate that represents the company’s annual weighted average commodity cost of natural gas.
Transportation. The movement of customer-owned natural gas from the pipeline receipt point(s)
Waste and Water Definitions: Average Disposal Cost. The average cost per pickup or ton of waste or other scrap material. This cost is calculated using all of the annual expenses to get a representative cost per unit of disposal.
Average Disposal Cost / Ton = (Total Disposal $) ÷ (Total tons removed)
Average Disposal Cost / Pickup = (Total Disposal $) ÷ (Total number of pickups)
BOD Charge. Charge levied by the sewer/water treatment utility to cover extra costs for high strength wastewater. High strength wastewater requires more intensive treatment by the utility and extra processing due to very low oxygen levels. BOD, biochemical oxygen demand, is a measure of how much oxygen will be used to microbiologically degrade the organic matter in the wastewater stream. State agencies such as a Department of Environmental Quality set BOD and other regulations that wastewater treatment facilities must meet to discharge treated water into nearby waterways. Your treatment facility may have ideas that could help lower the strength of your wastewater. Box Rental Charge. The fee imposed by the waste or recycling utility to cover costs of their receiving containers.
Disposal Cost. Incurred by the waste utility for disposing of your waste in a landfill or other facility. These charges increase when hazardous materials are present in the waste. Pickup Costs. The cost charged by the waste utility for each pickup of waste or recycling. This charge is usually applied when the utility is working on an “on call” basis. Pickup costs can also be a flat rate for a certain number of pickups per month.
53
54
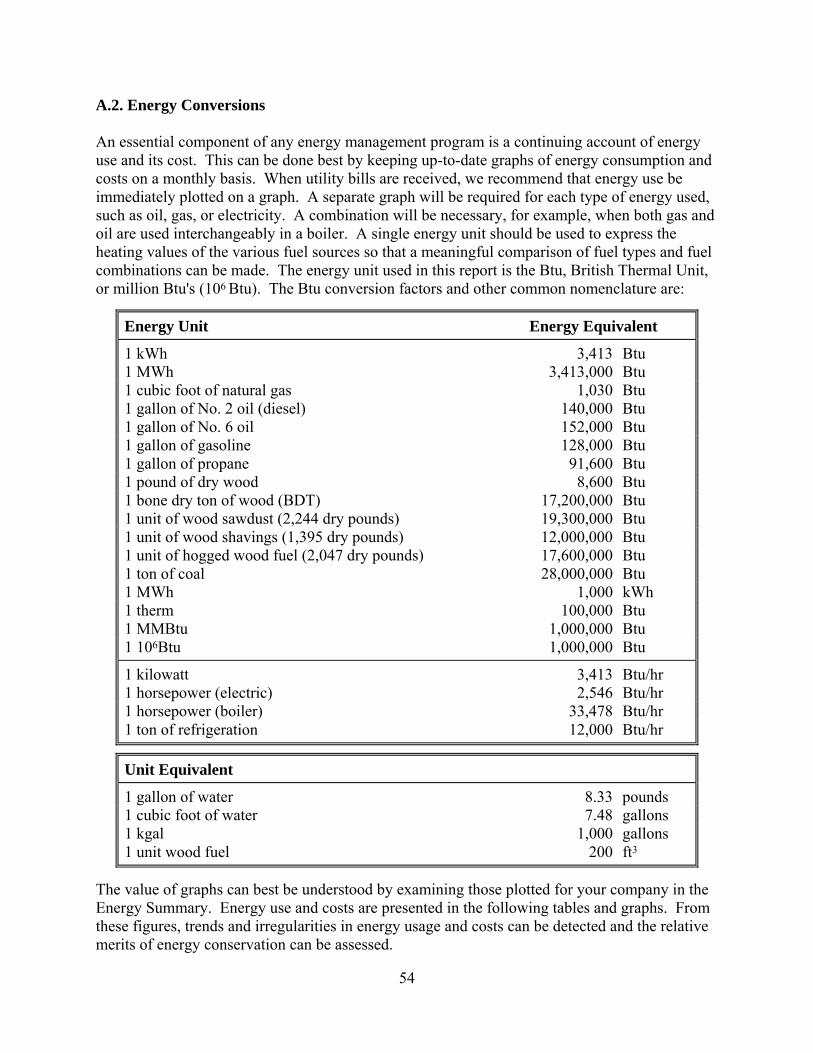
A.2. Energy Conversions An essential component of any energy management program is a continuing account of energy use and its cost. This can be done best by keeping up-to-date graphs of energy consumption and costs on a monthly basis. When utility bills are received, we recommend that energy use be immediately plotted on a graph. A separate graph will be required for each type of energy used, such as oil, gas, or electricity. A combination will be necessary, for example, when both gas and oil are used interchangeably in a boiler. A single energy unit should be used to express the heating values of the various fuel sources so that a meaningful comparison of fuel types and fuel combinations can be made. The energy unit used in this report is the Btu, British Thermal Unit, or million Btu's (106 Btu). The Btu conversion factors and other common nomenclature are:
Energy Unit Energy Equivalent
1 kWh 3,413 Btu 1 MWh 3,413,000 Btu 1 cubic foot of natural gas 1,030 Btu 1 gallon of No. 2 oil (diesel) 140,000 Btu 1 gallon of No. 6 oil 152,000 Btu 1 gallon of gasoline 128,000 Btu 1 gallon of propane 91,600 Btu 1 pound of dry wood 8,600 Btu 1 bone dry ton of wood (BDT) 17,200,000 Btu 1 unit of wood sawdust (2,244 dry pounds) 19,300,000 Btu 1 unit of wood shavings (1,395 dry pounds) 12,000,000 Btu 1 unit of hogged wood fuel (2,047 dry pounds) 17,600,000 Btu 1 ton of coal 28,000,000 Btu 1 MWh 1,000 kWh 1 therm 100,000 Btu 1 MMBtu 1,000,000 Btu 1 106Btu 1,000,000 Btu
1 kilowatt 3,413 Btu/hr 1 horsepower (electric) 2,546 Btu/hr 1 horsepower (boiler) 33,478 Btu/hr 1 ton of refrigeration 12,000 Btu/hr
Unit Equivalent
1 gallon of water 8.33 pounds 1 cubic foot of water 7.48 gallons 1 kgal 1,000 gallons 1 unit wood fuel 200 ft3
The value of graphs can best be understood by examining those plotted for your company in the Energy Summary. Energy use and costs are presented in the following tables and graphs. From these figures, trends and irregularities in energy usage and costs can be detected and the relative merits of energy conservation can be assessed.

APPENDIX B
LIGHTING
B.1 Lighting Worksheet Definitions The following lighting inventory and any lighting worksheets contained in the report use information obtained during the on-site visit to determine any potential energy savings related to lighting improvements. In all cases the value in the Savings column is the existing value less the proposed value. The terminology and calculations are described as follows: PLANT Building. A description of the building if the plant includes several buildings. Area: The lighting calculations may refer to a specific location within the building. Recommended Footcandles. The recommended footcandle levels come from the Illuminating Engineering Society (IES) Lighting Handbook. Average Demand Cost (D$). The demand cost ($/kW-month) is taken from the appropriate rate schedule of your utility. Winter and summer rates are averaged, if necessary. Average Energy Cost (E$). The energy cost ($/kWh) is taken from the appropriate rate schedule of your utility for the least expensive energy block. Winter and summer rates are averaged, if necessary. Labor Cost ($/H). The cost of labor is estimated for operating and installation cost calculations. FIXTURES Description (FID). Fixture type, size, manufacturer, or catalog number may be included here. Quantity (F#). The number of fixtures in the area are recorded during the site visit. Operating Hours (H). The number of hours which the lighting fixtures operate each year. Use Factor (UF). The fraction of fixtures that are used multiplied by the fraction of operating hours (H) that the lights are on. Lamps/Fixture (L/F). The number of lamps in each fixture. Ballasts/Fixture (B/F). The number of ballasts in each discharge fixture.
55
Cost (FC). The cost of the existing and proposed fixtures can be compared when modifying or replacing fixtures. LAMPS Description (LID). Lamp type, size, manufacturer, or catalog number may be included here. Quantity (L#). The number of lamps can be calculated from the number of fixtures and the number of lamps per fixture:
L# = F# x L/F Life (LL). Lamp life is defined as the number of operating hours after which half the original lamps will fail. The life recorded here is based on 3 operating hours per start. This provides a more conservative estimate of lamp life than using longer hours per start. Replacement Fraction (Lf). The fraction of lamps that normally can be expected to burn out during a year can be calculated from the operating hours, the use factor, and the lamp life: Lf = H x UF / LL Watts / Lamp (W/L). The rated lamp power does not include any ballast power, which is included in the Ballasts section. Lumens (LM). Lamp output is measured in lumens. Lumens are averaged over lamp life because lamp output decreases with time. Cost (C/L). The retail cost per lamp is entered here. BALLASTS This section applies only to discharge lamps with ballasts. This section will be blank for incandescent lamps. Description (BID). Additional information such as type, size, manufacturer, or catalog number may be included here. Quantity (B#). The number of ballasts can be calculated from the number of fixtures and the number of ballasts per fixture: B# = F# x B/F
56
Life (BL). Ballast life is determined from manufacturer's data. A life of 87,600 hours for a standard ballast and 131,400 hours for an efficient ballast is used in the calculations. Replacement Fraction (Bf). The fraction of ballasts normally expected to burn out during a year can be calculated from the operating hours, the use factor, and the ballast life: Bf = H x UF / BL Input Watts (IW). Ballast catalogs specify ballast input watts that include lamp power. The input wattage varies for different combinations of lamps and ballasts. Cost (BC). The retail ballast cost is entered here. POWER AND ENERGY Total Power (P). For incandescent lamps total power is the product of the number of lamps and the watts per lamp. P = L# x W/L (Incandescent Lamps) For discharge lamps total power is the product of the ballast input watts and the number of ballasts: P = B# x IW (Discharge Lamps) Energy Use (E). The annual energy use is the product of the total power, the use factor, and the annual operating hours: E = P x UF x H / (1,000 watts/kilowatt) LIGHT LEVEL CHECK Total Lumens (TLM). The existing and proposed lumen levels are summed for all lamps. TLM = L# x LM Footcandles (FC). Light is measured in units of footcandles. The existing footcandle level (FC0) is measured, while the proposed level (FC1) is determined from the ratio of the proposed total lumens (TLM1) to existing total lumens (TLM0) times the existing footcandle level. FC1 = FC0 x (TLM1 / TLM0) The proposed footcandle level can then be compared to both the existing and the recommended levels to determine if there will be adequate light for the work space.
57

Lumens / Watt (LM/W). The total lamp output in lumens divided by the total power is a measure of lighting efficiency. LM/W = TLM / P ANNUAL OPERATING COST Power Cost (PC). The annual demand cost is the total power times the average monthly demand cost from the worksheet times 12 months per year: PC = P x D$ x 12 months/year Energy Cost (EC). The annual energy cost is the energy use times the electricity cost from your utility rate schedule: EC = E x E$ Lamp O&M Cost (LOM). Operation and maintenance costs are the sum of lamp and labor costs for replacing the fraction of lamps (L# x Lf) that burn out each year. LOM = L# x Lf x [LC + (0.166 hours x $/H)] We assume that two people can replace a lamp and clean the fixture and lens in about five minutes (0.166 man-hours/lamp), replacing lamps as they burn out. Ballast O&M Cost (BOM). Operation and maintenance costs are the sum of ballast (BC) and labor costs ($/H) for replacing the fraction of ballasts (B# x Bf) that burn out each year. BOM = B# x Bf x [BC + (0.5 hours x $/H)] We assume that one person can replace a ballast in about thirty minutes (0.5 man-hours/ballast), replacing ballasts as they burn out. Total Operating Cost (OC). The sum of the annual power and energy costs and lamp and ballast O&M costs. OC = PC + EC + LOM + BOM
58
IMPLEMENTATION COST The implementation costs depend on whether refixturing, group relamping, or spot replacing of lamps and ballasts is recommended. Refixturing
Materials: The cost is the cost per fixture (C/F) times the number of fixtures (F#) plus the lamp cost (LC) times the number of lamps (L#).
M$ = F# x (C/F) + L# x C/L
Labor: The labor cost includes the removal of the existing fixtures and the installation of the recommended fixtures.
Group Relamping
Materials: When replacing all lamps at one time (group relamping), the cost of materials can be found from
M$ = L# x C/L
Labor: We estimate the labor cost for group relamping to be one half the cost of replacing each lamp as it burns out. We assume that two people can replace two lamps and clean the fixture and lens in about 5 minutes (0.083 man-hours/lamp, H/L). Because relamping does not require a licensed electrician, the labor rate for relamping is often lower than the labor rate for fixture replacement. To calculate the total labor cost for group lamp replacement we calculate the labor cost of group replacing all of the lamps.
L$GROUP = L# x H/L x $/H Spot Replacement of Lamps & Ballasts
Materials: When replacing lamps only as they burn out (spot relamping), we use the cost difference (LC1 - LC0) between standard and energy-efficient lamps for all lamps.
M$ = L# x (LC1 - LC0)
When replacing ballasts only as they burn out (spot reballasting), we use the cost difference (BC1 - BC0) between standard and energy-efficient ballasts for all ballasts.
M$ = B# x (BC1 - BC0)
Labor: There is no additional labor cost.
59
60
Total Cost (IC). Total implementation cost is the sum of materials and labor cost IC = M$ + L$ SIMPLE PAYBACK. The simple payback (SP) is calculated on each lighting worksheet. SP = IC / OC
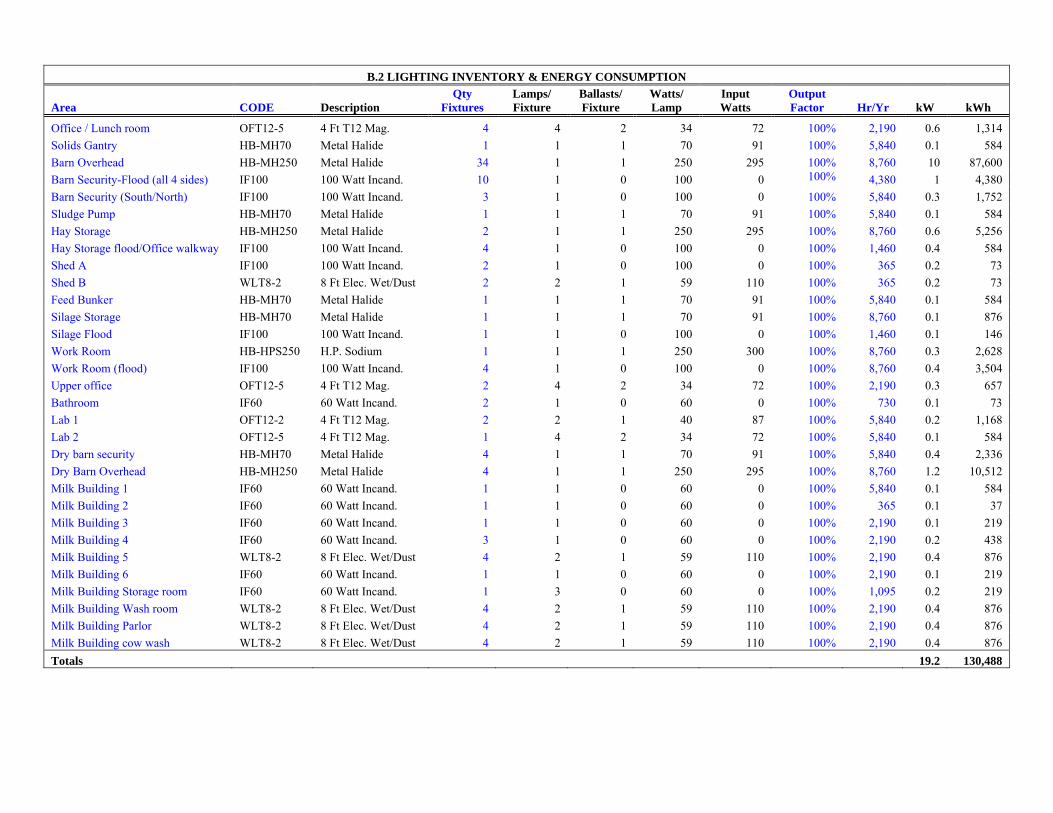
B.2 LIGHTING INVENTORY & ENERGY CONSUMPTION
Area CODE Description Qty
Fixtures Lamps/ Fixture
Ballasts/ Fixture
Watts/ Lamp
Input Watts
Output Factor Hr/Yr kW kWh
Office / Lunch room OFT12-5 4 Ft T12 Mag. 4 4 2 34 72 100% 2,190 0.6 1,314 Solids Gantry HB-MH70 Metal Halide 1 1 1 70 91 100% 5,840 0.1 584 Barn Overhead HB-MH250 Metal Halide 34 1 1 250 295 100% 8,760 10 87,600 Barn Security-Flood (all 4 sides) IF100 100 Watt Incand. 10 1 0 100 0 100% 4,380 1 4,380 Barn Security (South/North) IF100 100 Watt Incand. 3 1 0 100 0 100% 5,840 0.3 1,752 Sludge Pump HB-MH70 Metal Halide 1 1 1 70 91 100% 5,840 0.1 584 Hay Storage HB-MH250 Metal Halide 2 1 1 250 295 100% 8,760 0.6 5,256 Hay Storage flood/Office walkway IF100 100 Watt Incand. 4 1 0 100 0 100% 1,460 0.4 584 Shed A IF100 100 Watt Incand. 2 1 0 100 0 100% 365 0.2 73 Shed B WLT8-2 8 Ft Elec. Wet/Dust 2 2 1 59 110 100% 365 0.2 73 Feed Bunker HB-MH70 Metal Halide 1 1 1 70 91 100% 5,840 0.1 584 Silage Storage HB-MH70 Metal Halide 1 1 1 70 91 100% 8,760 0.1 876 Silage Flood IF100 100 Watt Incand. 1 1 0 100 0 100% 1,460 0.1 146 Work Room HB-HPS250 H.P. Sodium 1 1 1 250 300 100% 8,760 0.3 2,628 Work Room (flood) IF100 100 Watt Incand. 4 1 0 100 0 100% 8,760 0.4 3,504 Upper office OFT12-5 4 Ft T12 Mag. 2 4 2 34 72 100% 2,190 0.3 657 Bathroom IF60 60 Watt Incand. 2 1 0 60 0 100% 730 0.1 73 Lab 1 OFT12-2 4 Ft T12 Mag. 2 2 1 40 87 100% 5,840 0.2 1,168 Lab 2 OFT12-5 4 Ft T12 Mag. 1 4 2 34 72 100% 5,840 0.1 584 Dry barn security HB-MH70 Metal Halide 4 1 1 70 91 100% 5,840 0.4 2,336 Dry Barn Overhead HB-MH250 Metal Halide 4 1 1 250 295 100% 8,760 1.2 10,512 Milk Building 1 IF60 60 Watt Incand. 1 1 0 60 0 100% 5,840 0.1 584 Milk Building 2 IF60 60 Watt Incand. 1 1 0 60 0 100% 365 0.1 37 Milk Building 3 IF60 60 Watt Incand. 1 1 0 60 0 100% 2,190 0.1 219 Milk Building 4 IF60 60 Watt Incand. 3 1 0 60 0 100% 2,190 0.2 438 Milk Building 5 WLT8-2 8 Ft Elec. Wet/Dust 4 2 1 59 110 100% 2,190 0.4 876 Milk Building 6 IF60 60 Watt Incand. 1 1 0 60 0 100% 2,190 0.1 219 Milk Building Storage room IF60 60 Watt Incand. 1 3 0 60 0 100% 1,095 0.2 219 Milk Building Wash room WLT8-2 8 Ft Elec. Wet/Dust 4 2 1 59 110 100% 2,190 0.4 876 Milk Building Parlor WLT8-2 8 Ft Elec. Wet/Dust 4 2 1 59 110 100% 2,190 0.4 876 Milk Building cow wash WLT8-2 8 Ft Elec. Wet/Dust 4 2 1 59 110 100% 2,190 0.4 876 Totals 19.2 130,488