Embed Size (px)
Citation preview

OSU BLUEBERRY SCHOOL March 16-17, 2015
held at Oregon State University, Corvallis, Oregon
This two-day blueberry “school” was organized for new and experienced blueberry growers, farm managers, crew leaders, advisors, packers/shippers, and consultants. Experts from Oregon State University, USDA Agricultural Research Service, Washington State University, and the blueberry industry were asked to address key issues of where the blueberry market is going; how you might be more successful in tight labor or volume markets; which cultivars are easiest to grow and are in most demand; how to establish new acreage using cutting-edge methods; projected costs and the resources available to growers for selecting new planting sites; how to best manage existing acreage to maximize returns of high-quality fruit; provide basic information on blueberry plant physiology to help growers minimize environmental stresses and improve yield potential; nutrient management programs for optimal growth and quality; irrigation and fertigation practices for higher quality and better efficiency; use of organic amendments and mulches; planning for and improving machine harvest efficiency; pruning for hand or machine harvest (where can you cut corners….or not), maximizing pollination for good fruit and seed set; overviews of the most important blueberry viruses, diseases, insects, weeds, and vertebrate pests; and tools for good pest management. Information throughout the program addresses the needs of conventional, transitional, and organic growers. Simultaneous interpretation to Spanish has been provided. This proceedings book contains information provided on these topics by each speaker and co-authors. The thumb drive provided in the registration packet for each attendee includes a copy of each presentation. Thank you for attending. It is our sincere wish that this will be a very useful meeting and that you find the accompanying materials a valuable reference! – Bernadine Strik, Professor and Extension Berry Crops Specialist, OSU and the members of the organizing committee Organizing Committee Bernadine Strik, Chair, Oregon State University (OSU) Wei Yang, OSU. Co-chair (sponsorship coordinator), OSU Donna Williams, Rachel Williams & team at OSU Conference Services Dave Bryla, USDA-ARS HCRU Chad Finn, USDA-ARS HCRU Vaughn Walton - OSU Steve Castagnoli - OSU Steve Renquist - OSU Bryan Ostlund – Oregon Blueberry Commission Eric Pond - industry Jon Umble – industry Derek Peacock - industry Steve Erickson - industry Nancy Jensen - industry
i
Table of Contents OSU Blueberry School
Title Authors Page
Characteristics of production regions in the Pacific Northwest
Lisa DeVetter, Pat Jones, Bernadine Strik, Kathie Dello
1
Markets - what's the future for fresh, processed, and organic markets? Things you MUST think about before starting or expanding production
Rod Cook, Derek Peacock, Jeff Malensky, David Granatstein
9
Cultivar choices- Tried and true to brand new
Chad Finn and Bernadine Strik 15
Economics of production – resources
Bernadine Strik and David Granatstein 29
Resources available for selecting a good blueberry site
Wei Q. Yang 37
Site selection and establishment of a blueberry field
Wei Q. Yang and Bernadine Strik 41
Organic soil amendments and mulches for blueberry: the good, the bad and the ugly
Dan Sullivan (OSU) 47
On-farm irrigation system design and operation David Bryla 53
Blueberry plant physiology - why it's important to understand the plant to manage it well
Bernadine Strik 57
Irrigation scheduling: when, where, and how much?
David Bryla 63
Pruning - impact of plant age, cultivar, and harvest method
Bernadine Strik 69
Harvesting - hand vs. machine
Bernadine Strik (moderator); Paul Norris (Norris Farms); Frank Brown (Littau Harvesters (Inc.); Doug Krahmer (Berries Northwest)
75
Nutrient management of blueberry -- assessing plant nutrient needs and designing good fertilizer programs
Bernadine Strik and David Bryla 79
Maximizing pollination in blueberry
Ramesh Sagili, Carolyn Breece, John Borden
95
Blueberry viruses present in the Pacific Northwest and suggestions for their management
Robert Martin 99
Blueberry bacterial and fungal diseases
Jay Pscheidt and Jerry Weiland 107
ii
Title Authors Page
Weed management for blueberry fields in the Pacific Northwest
Tim Miller 115
Getting hit high and low: Options for managing bird and vole damage
Dana Sanchez (OSU 125
Management of arthropods, insect, and plant-parasitic nematodes in blueberries
Vaughn Walton,Nik Wiman, Inga Zasada, Joe DeFrancesco, Daniel Dalton, Amy Dreves, Jana Lee, Lynell Tanigoshi, Wei Yang
129
iii
Economics of production – resources
Bernadine Strik1 and David Granatstein2 1Department of Horticulture, Oregon State University; 2Center for Sustaining Agriculture and
Natural Resources, Washington State University OREGON There are two cost of production publications available for growers in Oregon, one for conventional production and one for certified organic production. These are available to growers for free on line at: 1) Blueberry Economics: The Costs of Establishing and Producing Blueberries in the Willamette Valley, AEB0022. http://arec.oregonstate.edu/oaeb/files/pdf/AEB0022.pdf; and 2) Blueberry Economics: The Costs of Establishing and Producing Organic Blueberries in the Willamette Valley. AEB0023. http://arec.oregonstate.edu/oaeb/files/pdf/AEB0023.pdf. Unfortunately, there are no work sheets associated with either of these publications – this would be helpful for entering your own cost of production numbers. Regardless, these publications are a great resource for new growers who need to be made aware of the typical activities associated with establishing and maintaining a blueberry farm (and the associated labor needs and costs). Established growers should use these as a guide and modify numbers based on changes in their farm establishment and management practices relative to what is assumed and published in these guides. Some of these key issues are addressed here for each guide. Conventional production guide: Production guides such as this one are always developed for a “typical, well-managed farm”. It’s important to understand that the model farm used, with the particular combinations of irrigation, land-size, cultivar, yields, cultural management, may not exist. Thus to make this useful you need to be aware of the key assumptions used to develop the cost study and how your costs may differ. Key assumptions made in the published cost study:
o 20-acre blueberry field on a 100-acre farm (affects overall costs, sharedequipment, etc.) o Cost budgets are based on a 25-year life of planting, although many fields in Oregon are
much older o Plant spacing: 3 ft in the row; 10 ft between rows (1,452 plants/acre) o Plant cost: $3.50 o Planted in early October o Soil is uniform and is well-suited to blueberry o Sawdust is incorporated as a pre-plant amendment (expensive) o All pre-plant work is contracted o Raised beds are used (custom work) o Sawdust is used as a mulch and is replenished every 3 years o A grass cover crop is planted between rows. This is mowed during the season. o Yield progression is (in tons/acre):
o 0.5 in year 2; 1.8 in year 3; 3.6 in year 4; 5.4 in year 5; 7.2 in year 6 and 9 in year 7 and onwards for hand harvested and 8 t/acre when machine harvested.
29
o Machine harvest for processing is assumed to start in year 7 o 10% of production that is predominantly hand harvested for fresh fruit is machine
harvested for processing o 100% of machine-harvested field is marketed for processing o Fresh price is $1.34/lb; processed is $0.75/lb [an average of the three years prior to
publication (in 2011)] o $1000 per year is allocated for bird control o Pruning time increases as the planting ages:
o 15 hr/acre in year 2; 30 in year 3; 50 in year 4; 70 in year 5; 85 in year 6; and 85 hr/acre for hand-picked mature field and 60 hr/acre for machine-picked field
o Grower owns shed and all machinery to manage planting (see list in publication) o General labor is valued at $13.50/hr and equipment operator labor at $19/hour including
all overhead expenses o Drip irrigation is installed in year 1 at a value of $50,000 including pump, filter, injector,
manifold, lines, and emitters – 15 year expected life o Trellis is installed in year 2 ($1700/acre) o Management costs for SWD are included in the budget o Interest rate on operating funds is 8.5% and is treated as a cash expense o Machinery and land owned are assessed 8.5% and 5% interest as a return on grower
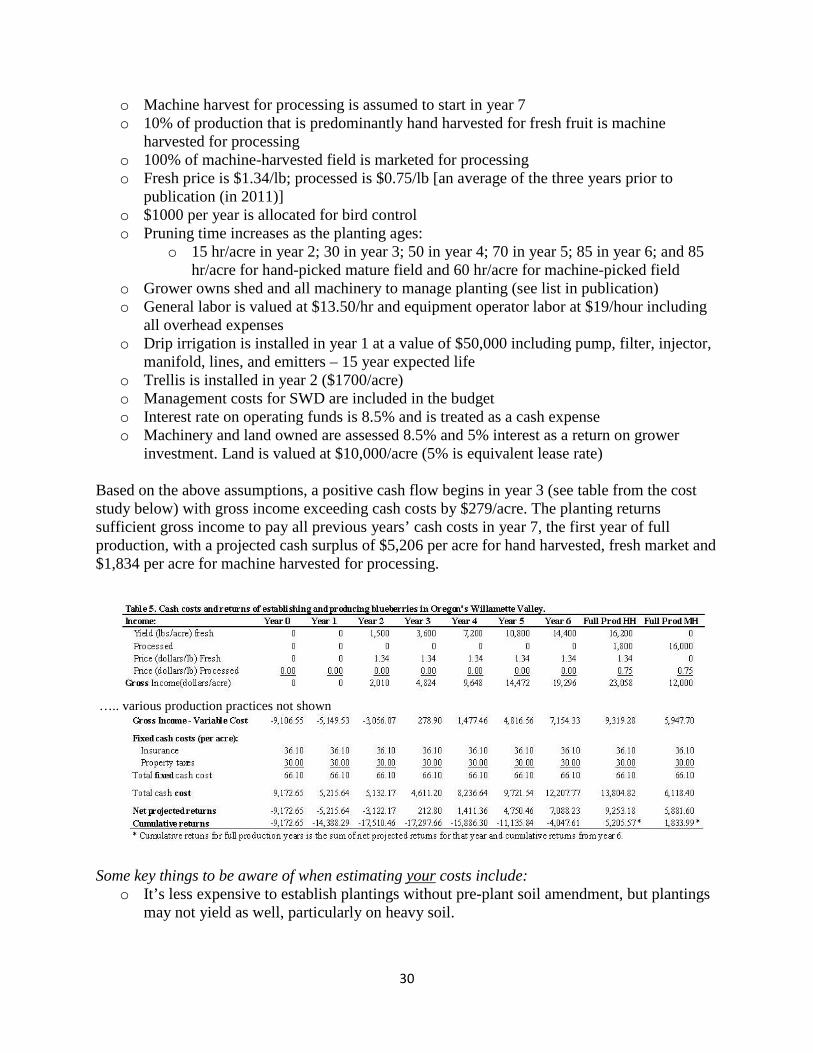
investment. Land is valued at $10,000/acre (5% is equivalent lease rate) Based on the above assumptions, a positive cash flow begins in year 3 (see table from the cost study below) with gross income exceeding cash costs by $279/acre. The planting returns sufficient gross income to pay all previous years’ cash costs in year 7, the first year of full production, with a projected cash surplus of $5,206 per acre for hand harvested, fresh market and $1,834 per acre for machine harvested for processing.
….. various production practices not shown
Some key things to be aware of when estimating your costs include:
o It’s less expensive to establish plantings without pre-plant soil amendment, but plantings may not yield as well, particularly on heavy soil.
30
o If you establish plantings on flat ground, then yields will likely be lower even on good soil (23% lower cumulative yield on good soil when comparing flat to raised in Oregon’s Willamette Valley).
o Yield may be lower, particularly with some cultivars and in some production regions. Good management and pruning are required to achieve these yields!
o Yield may be higher, especially for some cultivars – e.g. Legacy may achieve double the yields reported in this cost study. However, this cultivar also requires higher pruning costs (at least 30% more time) and hand-pick costs are higher (per pound) as fruit may be more difficult to find in the more dense canopy. This cultivar is also less adapted to machine harvest (and is thus limited to hand pick).
o Higher yields reported for cultivars like ‘Liberty’ and ‘Draper’ are also associated with higher pruning costs (estimate 25 to 30% more labor cost).
o Price received for fruit destined for fresh or processed markets varies with year, fruiting season/cultivar. It is important to check price trends to make a reasonable estimate of future profitability – even then it’s hard to predict how costs will change in the future!
o Since harvest costs are the largest share of cash costs, it’s easy to look at these budgets and “take the money to the bank” by just planning to machine pick for fresh (lowest harvest costs and highest income) – this is unrealistic for many reasons. Presently, not many cultivars are adapted to machine harvest for fresh; this is a relatively new practice with experience rather limited; pruning for machine harvest for fresh market is different than pruning for machine harvest for processing (with greater cost); pest management is often more expensive when machine harvesting for fresh; not all of the machine-harvested fruit may be marketed fresh; there are often more losses of fruit when machine picking for fresh than for processing (related to stage at which machine starts first harvest); and some packing companies pay differential prices for hand-picked versus machine-picked fresh at this time.
o Money may be saved by not using a trellis; however, many cultivars require a trellis to prevent wind damage (e.g. Liberty) or to keep the bush upright (e.g. Legacy). Trellises have also been shown to improve machine harvest recovery (reduce ground loss) by 8% of total yield (Strik and Buller, 2002). Many growers have indicated that trellises improve hand-harvest efficiency and reduce fruit drop during spraying events (e.g. for SWD).
o If weed mat (porous, polyethylene ground cover) is used in the row, instead of sawdust then the cost of materials and installation must be amortized for the expected life of the weed mat. While herbicide costs could be significantly reduced, there would be added costs for maintaining the edges of the weed mat and for opening and closing to add any granular fertilizer products or for rodent control. Drip irrigation would then be required (under weed mat).
Organic production guide: This is the first organic production guide developed in Oregon. There are only two others in the U.S. that we are aware of and both are for very small scale growers (atypical of our production in the PNW). Considering this was our first guide, some key assumptions were made – we plan to update this cost study using information learned from our 9-year research trial on certified organic production systems. It’s important to understand that the model farm used, with the particularly combinations of irrigation, land-size, cultivar, yields, cultural management, may not
31
exist. Thus to make this useful you need to be aware of the key assumptions used to develop the cost study and how your costs may differ. Key assumptions made in the published cost study:
o 20-acre blueberry field on a 100-acre farm (affects overall costs and equipment shared etc.)
o Cost budgets are based on a 25-year life (little industry experience on this) o Plant spacing: 3 ft in the row; 10 ft between rows (1,452 plants/acre) o Plant cost: $3.50 o Planted in early October o Soil is uniform and is well-suited to blueberry o Field is tiled ($1,200/acre) o Field is free of weeds (ready to plant - see comments below) o Sawdust and chicken compost are incorporated as a pre-plant amendment (expensive) o All pre-plant work is contracted o Raised beds are used (custom work) and are established just prior to planting o Weed mat (porous, polyethylene ground cover) is used as a mulch and has an expected
life of 5 years. A split or “zippered” system is used. o Sawdust is placed around plants in the “planting hole” area o A grass cover crop is planted between rows. This is mowed during the season. o A string trimmer is used to keep the edges of the cover crop from encroaching on the
weed mat. o Fish emulsion fertilizer is applied through the drip irrigation at rates of 25 lb N/ac in year
1 and 2; 50 lb N/ac in year 3; 100 lb N/ac in year 4 and 120 lb N/ac in year 5 and onward o Chicken compost along with any other needed nutrients are is applied in a broadcast band
in the row and under the weed mat every two years starting in fall of year 3. o Yield progression is (in tons/acre):
o 0.5 in year 2; 1.8 in year 3; 3.6 in year 4; 5.4 in year 5; 7.2 in year 6 and 9 in year 7 and onwards for hand harvested and 8 t/acre when machine harvested.
o Machine harvest for processing is assumed to start in year 7 o 10% of production that is predominantly hand harvested for fresh fruit is machine
harvested for processing o 100% of machine-harvested field is marketed for processing o Fresh price is $1.75/lb; processed is $1.00/lb [an average of the three years prior to
publication (in 2011)] o $50 per acre per year is allocated for bird control when plants are fruiting o Management costs for SWD are included in the budget o Costs of organic certification are included o Pruning time increases as the planting ages:
o 15 hr/acre in year 2; 30 in year 3; 50 in year 4; 70 in year 5; 85 in year 6; and 85 hr/acre for hand-picked mature field and 60 hr/acre for machine-picked field
o Grower owns shed and all machinery to manage planting (see list in publication) o General labor is valued at $13.50/hr and equipment operator labor at $19/hour including
all overhead expenses o Drip irrigation is installed in year 1 at a value of $50,000 including pump, filter, injector,
manifold, lines, and emitters – 15 year expected life
32
o Trellis is installed in year 2 ($1700/acre) o Interest rate on operating funds is 8.5% and is treated as cash expense o Machinery and land owned are assessed 8.5% and 5% interest as a return on grower
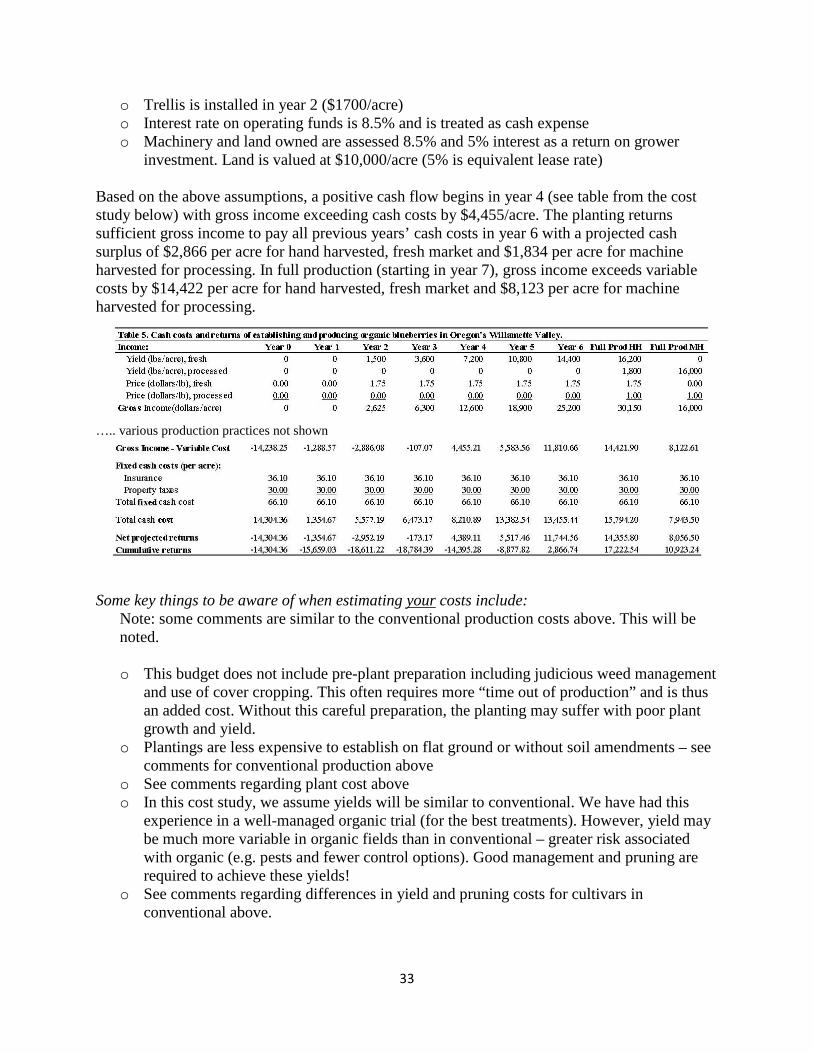
investment. Land is valued at $10,000/acre (5% is equivalent lease rate) Based on the above assumptions, a positive cash flow begins in year 4 (see table from the cost study below) with gross income exceeding cash costs by $4,455/acre. The planting returns sufficient gross income to pay all previous years’ cash costs in year 6 with a projected cash surplus of $2,866 per acre for hand harvested, fresh market and $1,834 per acre for machine harvested for processing. In full production (starting in year 7), gross income exceeds variable costs by $14,422 per acre for hand harvested, fresh market and $8,123 per acre for machine harvested for processing.
….. various production practices not shown
Some key things to be aware of when estimating your costs include:
Note: some comments are similar to the conventional production costs above. This will be noted.
o This budget does not include pre-plant preparation including judicious weed management
and use of cover cropping. This often requires more “time out of production” and is thus an added cost. Without this careful preparation, the planting may suffer with poor plant growth and yield.
o Plantings are less expensive to establish on flat ground or without soil amendments – see comments for conventional production above
o See comments regarding plant cost above o In this cost study, we assume yields will be similar to conventional. We have had this
experience in a well-managed organic trial (for the best treatments). However, yield may be much more variable in organic fields than in conventional – greater risk associated with organic (e.g. pests and fewer control options). Good management and pruning are required to achieve these yields!
o See comments regarding differences in yield and pruning costs for cultivars in conventional above.
33
o Not all cultivars are equally adapted to organic production. For example, ‘Duke’ is very particular with regard to soil pH and type of organic fertilizer used.
o See comments above regarding costs. While prices paid to organic growers for certified processed and fresh fruit have been higher the last couple of years (than those used in the cost study), prices fluctuate!
o While fish emulsion and fertigation are used in this cost study, we have found similar yield and growth and often better results (depending on cultivar) when using granular applications of feather meal – this would be a less expensive option, but would require opening and closing the weed mat for each application.
o See comments regarding hand vs. machine harvest costs above. o See comments regarding trellising above. o SWD may be more difficult to manage in organic production due to limited availability
of effective OMRI-approved products. o If you have a producing field that is being transitioned to organic production your costs
may be quite different than those presented in the guide. For example, your management costs during the transition period would be those of organically-approved methods/products but you will receive a conventional price for fruit for two years. In addition, there may be a transition period when transitioning to organic fertilizer products and a ‘learning curve’ leading to a risk of lower yields and more financial risk. Also, organic production typically takes greater attention to management, in terms of timing of operations, preventative practices, and understanding the system; growers must be vigilant with their own decisions and their workers to avoid accidental use of a prohibited material that might jeopardize their organic status (especially on mixed operations).
WASHINGTON There are currently no enterprise budgets for Washington blueberries, either for conventional or organic, or for western Washington versus eastern Washington. The Oregon budgets for the Willamette Valley (Julian et al., 2011a,b) are likely more representative of conditions and costs for production in western Washington. In eastern Washington, disease and pest problems are probably less and thus costs for control lower. Spotted Wing Drosophila is present in both environments, but comparative data on pest pressure and damage are not available. Blueberries in eastern Washington require full-season irrigation, which will add cost. Also, most soils have a pH above the optimal range, and growers incur an expense in acidifying the soil before planting and keeping it low over time. Certain irrigation water sources are also high pH, and water must be treated with acid prior to field use. The Oregon budgets found organic production to be 10-12% more expensive than conventional during years 0-7. It is unclear whether this would be the case in western Washington (it may be higher), while production costs between the two management systems might be quite similar in eastern Washington, as it is for apples (Taylor and Granatstein, 2013). Organic options for soil amendments (both for fertility and for pH adjustments) and water treatment are generally more expensive than their conventional counterparts. While yields were similar between the two systems in Oregon, that may not be the case in Washington, based on grower data from the Washington State Dept. of Agriculture and the USDA-National Agricultural Statistics Service (NASS). In a recent study (Brady et al., 2015), nearly 60% of the yields in western Washington
34
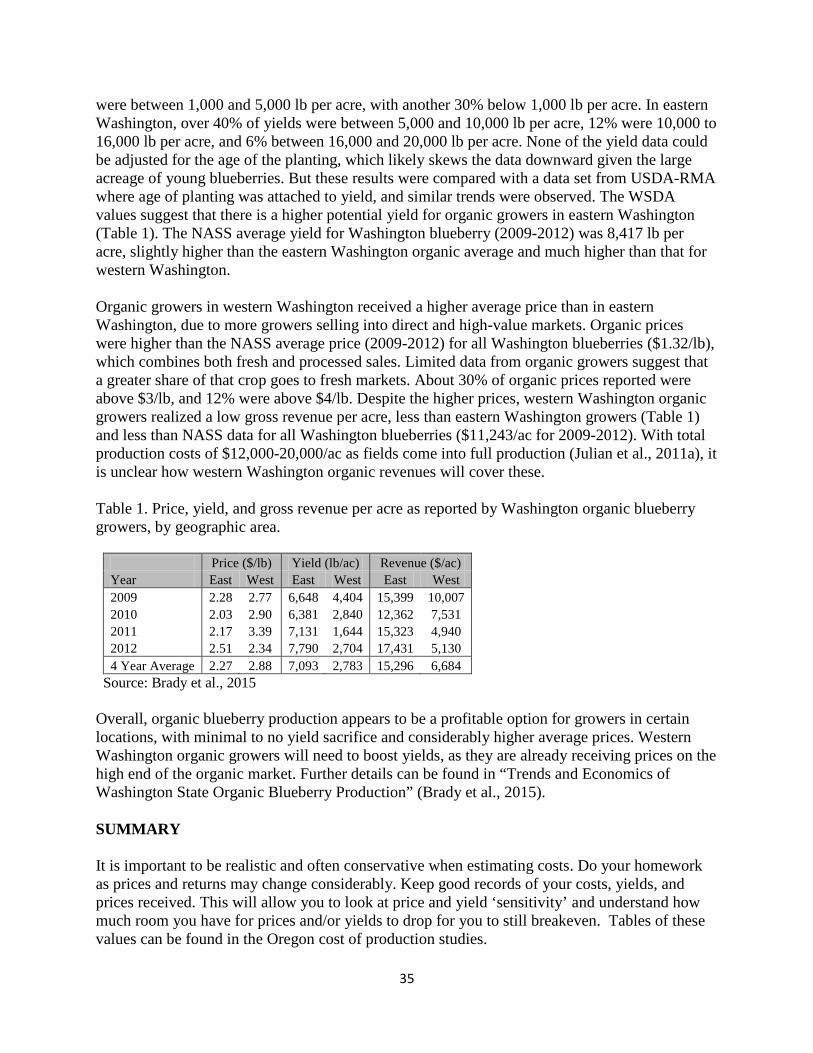
were between 1,000 and 5,000 lb per acre, with another 30% below 1,000 lb per acre. In eastern Washington, over 40% of yields were between 5,000 and 10,000 lb per acre, 12% were 10,000 to 16,000 lb per acre, and 6% between 16,000 and 20,000 lb per acre. None of the yield data could be adjusted for the age of the planting, which likely skews the data downward given the large acreage of young blueberries. But these results were compared with a data set from USDA-RMA where age of planting was attached to yield, and similar trends were observed. The WSDA values suggest that there is a higher potential yield for organic growers in eastern Washington (Table 1). The NASS average yield for Washington blueberry (2009-2012) was 8,417 lb per acre, slightly higher than the eastern Washington organic average and much higher than that for western Washington. Organic growers in western Washington received a higher average price than in eastern Washington, due to more growers selling into direct and high-value markets. Organic prices were higher than the NASS average price (2009-2012) for all Washington blueberries ($1.32/lb), which combines both fresh and processed sales. Limited data from organic growers suggest that a greater share of that crop goes to fresh markets. About 30% of organic prices reported were above $3/lb, and 12% were above $4/lb. Despite the higher prices, western Washington organic growers realized a low gross revenue per acre, less than eastern Washington growers (Table 1) and less than NASS data for all Washington blueberries ($11,243/ac for 2009-2012). With total production costs of $12,000-20,000/ac as fields come into full production (Julian et al., 2011a), it is unclear how western Washington organic revenues will cover these. Table 1. Price, yield, and gross revenue per acre as reported by Washington organic blueberry growers, by geographic area.
Price ($/lb) Yield (lb/ac) Revenue ($/ac) Year East West East West East West 2009 2.28 2.77 6,648 4,404 15,399 10,007 2010 2.03 2.90 6,381 2,840 12,362 7,531 2011 2.17 3.39 7,131 1,644 15,323 4,940 2012 2.51 2.34 7,790 2,704 17,431 5,130 4 Year Average 2.27 2.88 7,093 2,783 15,296 6,684
Source: Brady et al., 2015 Overall, organic blueberry production appears to be a profitable option for growers in certain locations, with minimal to no yield sacrifice and considerably higher average prices. Western Washington organic growers will need to boost yields, as they are already receiving prices on the high end of the organic market. Further details can be found in “Trends and Economics of Washington State Organic Blueberry Production” (Brady et al., 2015). SUMMARY It is important to be realistic and often conservative when estimating costs. Do your homework as prices and returns may change considerably. Keep good records of your costs, yields, and prices received. This will allow you to look at price and yield ‘sensitivity’ and understand how much room you have for prices and/or yields to drop for you to still breakeven. Tables of these values can be found in the Oregon cost of production studies.
35
For more information on markets online: The Agricultural Marketing Resource Center: http://www.agmrc.org/commodities__products/fruits/blueberries/ US Market News (prices for conventional and organic): https://www.marketnews.usda.gov/mnp/fv-nav-byCom?navClass=FRUITS&navType=byComm References Brady, M., Kirby, E., Granatstein, D. 2015. Trends and Economics of Washington State Organic Blueberry Production. FS154E, Washington State University Extension, Pullman, WA. In press. Julian, J., Strik, B., Pond, E. and Yang, W. 2011a. Blueberry Economics: The Costs of Establishing and Producing Organic Blueberries in the Willamette Valley. Oregon State University Extension AEB0023. http://arec.oregonstate.edu/oaeb/files/pdf/AEB0023.pdf. Julian, J., Strik, B., and Yang, W. 2011b. Blueberry Economics: The Costs of Establishing and Producing Blueberries in the Willamette Valley. Oregon State University Extension AEB0022. http://arec.oregonstate.edu/oaeb/files/pdf/AEB0022.pdf. Strik, B. and G. Buller. 2002. Improving yield and machine harvest efficiency of ‘Bluecrop’ through high-density planting and trellising. Acta Hort. 574:227-231. Taylor, M., and Granatstein, D. 2013. A cost comparison of organic and conventional apple production in the state of Washington. Crop Management doi:10.1094/CM-2013-0429-05-RS. https://www.agronomy.org/publications/cm/pdfs/12/1/2013-0429-05-RS
36


![Blueberry Hill - Kiama Blowhole Buskers€¦ · Blueberry Hill [C] /// /// [F] /// /// [G7] stop [Tacet] I found my [F]thrill ..... on Blueberry [C]Hill ..... On Blueberry [G] Hill](https://img.pdfslide.us/doc/110x75/5f334258c6a82b4839519c93/blueberry-hill-kiama-blowhole-buskers-blueberry-hill-c-f-g7.jpg)