Embed Size (px)
Citation preview

Osteoporosis: burden, health care provisionand opportunities in the EUA report prepared in collaboration with the International Osteoporosis Foundation (IOF)and the European Federation of Pharmaceutical Industry Associations (EFPIA)
O. Ström & F. Borgström & John A. Kanis &
Juliet Compston & Cyrus Cooper &
Eugene V. McCloskey & Bengt Jönsson
# International Osteoporosis Foundation and National Osteoporosis Foundation 2011
AbstractOsteoporosis, literally “porous bone”, is a disease
characterized by weak bone. It is a major public healthproblem, affecting hundreds of millions of people world-wide, predominantly postmenopausal women. The mainclinical consequence of the disease is bone fractures. It isestimated that one in three women and one in five men overthe age of fifty worldwide will sustain an osteoporoticfracture. Hip and spine fractures are the two most seriousfracture types, associated with substantial pain and suffer-ing, disability, and even death. As a result, osteoporosisimposes a significant burden on both the individual andsociety. During the past two decades, a range of medi-cations has become available for the treatment andprevention of osteoporosis. The primary aim of pharmaco-
logical therapy is to reduce the risk of osteoporoticfractures.
The objective of this report is to review and describe thecurrent burden of osteoporosis and highlight recent advan-ces and ongoing challenges for treatment and prevention ofthe disease. The report encompasses both epidemiologicaland health economic aspects of osteoporosis and osteopo-rotic fractures with a primary geographic focus on France,Germany, Italy, Spain, Sweden, and the UK. Projections ofthe future prevalence of osteoporosis and fracture inci-dence, the total societal burden of the disease, and theconsequences of different intervention strategies receivespecial attention. The report may serve as a basis for theformulation of healthcare policy concerning osteoporosis ingeneral and the treatment and prevention of osteoporosis in
O. Ström : F. BorgströmDepartment of Learning, Informatics, Management, and Ethics,Medical Management Centre, Karolinska Institutet,Stockholm, Sweden and Innovus, Stockholm, Sweden
J. A. KanisWHO Collaborating Centre for Metabolic Bone Diseases,University of Sheffield,Sheffield, UK
J. CompstonDepartment of Medicine, Addenbrooke’s Hospital,Cambridge University,Cambridge, UK
C. CooperMRC Lifecourse Epidemiology Unit,University of Southampton,Southampton, UK
C. CooperNIHR Musculoskeletal Biomedical Research Unit,Institute of Musculoskeletal Sciences, University of Oxford,Oxford, UK
E. V. McCloskeyAcademic Unit of Bone Metabolism, Northern General Hospital,Sheffield, UK
E. V. McCloskeyWHO Collaborating Centre for Metabolic Bone Diseases,University of Sheffield,Sheffield, UK
B. Jönsson (*)Department of economics, Stockholm School of Economics,Box 6501, SE 11383 Stockholm, Swedene-mail: [email protected]
Arch OsteoporosDOI 10.1007/s11657-011-0060-1

particular. It may also provide guidance regarding theoverall healthcare priority of the disease.
The report is divided into six chapters:
1. Introduction to osteoporosis
The first chapter provides a brief review of osteoporosis,how osteoporotic fractures are defined, a description of themost common osteoporotic fractures, the burden of frac-tures, as well as challenges in the delivery of health care toreduce the number of fractures.
2. Medical innovation and clinical progress in manage-ment of osteoporosis
The second chapter reviews the measurement of bonemineral density, diagnosis of osteoporosis, methods forassessment of fracture risk, the development of interven-tions that reduce the risk of fractures, practice guidelines,and the cost-effectiveness of osteoporosis treatments.
3. Epidemiology of osteoporosis
The third chapter reviews the epidemiology and con-sequences of osteoporosis and fractures, as well as differentapproaches for setting intervention thresholds (i.e. at whatfracture risk it is appropriate to initiate treatment).
4. Burden of osteoporosis
The fourth chapter presents a model estimation of thecurrent burden of osteoporosis in the five largest countriesin the European Union (EU5) and Sweden. The burden isdescribed in terms of fractures, costs, and quality-adjustedlife years (QALYs) lost.
5. Uptake of osteoporosis treatments
The fifth chapter provides a description of the currentuptake of osteoporosis treatments, that is, how manypatients of those eligible for treatment that actually canbe treated in France, Germany, Italy, Spain, Sweden andthe UK. International sales data from 1998 and forwardwas used to analyse international variations in treatmentuptake.
6. The future burden of fractures and the consequences ofincreasing treatment uptake
The last chapter presents projections of how thedemographic changes in the five largest countries in theFrance, Germany, Italy, Spain, Sweden and the UK willimpact the burden of osteoporosis up to 2025. Hypotheticalprojections of increments in treatment provision are alsoexplored, and the impact of increased treatment on costs,fracture rates, and morbidity is estimated.
Arch Osteoporos

Table of Contents
1 Introduction to osteoporosisSummary and key messages1.1 Introduction1.2 Defining an osteoporotic fracture1.3 Common osteoporotic fractures1.3.1 Hip fracture1.3.2 Vertebral fracture1.3.3 Distal forearm fracture1.4 Fracture burden worldwide1.4.1 The future burden1.5 Imperfect health care practice1.6 Aims of the reportReferences
2 Medical innovation and clinical progress in themanagement of osteoporosis
Summary and key messages2.1 Introduction2.2 Measurement of BMD2.2.1 Performance characteristics of bone mineral
measurements2.2.2 Diagnosis of osteoporosis2.2.3 Availability of DXA2.3 Assessment of fracture risk2.3.1 Assessing risk with BMD2.3.2 Age and the risk of fracture2.3.3 Other clinical risk factors2.3.4 Biochemical assessment of fracture risk2.4 Integrating risk factors2.4.1 FRAX®2.5 Treatment of osteoporosis and prevention of fracture2.5.1 General management2.5.2 Major pharmacological interventions2.5.3 Vertebroplasty and balloon kyphoplasty2.5.4 Future developments in the treatment and
management of osteoporosis2.5.5 Cost-effectiveness of pharmaceutical interventions2.5.6 Adherence, compliance and persistence2.6 National guidelines and reimbursement policies for
the management of osteoporosis in EU52.6.1 French guidelines2.6.2 German guidelines2.6.3 Italian guidelines2.6.4 Spanish guidelines2.6.5 UK guidelines2.6.6 Compliance to guidelinesReferences
3 Epidemiology of osteoporosisSummary and key messages3.1 Introduction
3.2 The population at risk3.2.1 Prevalence of osteoporosis3.2.2 Prevalence of osteopenia3.3 Incidence of fracture3.3.1 Incidence of hip fracture3.3.2 Incidence of forearm fracture3.3.3 Incidence of vertebral fracture3.3.4 Incidence of proximal humeral fracture3.3.5 Incidence of other osteoporotic fractures3.4 Number of fractures3.4.1 Prevalence of fractures3.5 Mortality due to osteoporosis and fracture3.5.1 Mortality due to hip fracture3.5.2 Mortality due to vertebral fracture3.5.3 Mortality due to other osteoporotic fractures3.5.4 Mortality estimates for the EU53.5.5 Deaths due to fractures3.6 The probability of osteoporotic fracture and setting
the threshold for intervention3.6.1 Intervention thresholdsReferences
4 Burden of osteoporosisSummary and key messages4.1 Introduction4.2 Methods and materials4.2.1 Model design4.2.2 Fracture-related costs4.2.3 Quality of life loss related to fractures4.3 Results4.3.1 QALYs lost due to fractures4.3.2 Value of lost QALYs4.3.3 Economic burden of osteoporosis4.3.4 Economic burden of osteoporosis compared to
other diseasesReferences
5 Uptake of osteoporosis treatmentsSummary and key messages5.1 Introduction5.2 Methods and data5.2.2 Treatments5.3 Results5.3.1 Market share and price analysis5.3.2 Uptake of treatmentsReferences
6 The future burden of fractures and the consequencesof increasing treatment uptake
Summary and key messages6.1 Introduction6.2 Secular trends6.3 Demography
Arch Osteoporos

6.4 The treatment gap6.5 Results6.5.1 Projection of fractures6.5.2 BMD measurements6.5.3 QALYs6.5.4 Cost of fractures in the future6.5.5 Cost consequences of increased treatment uptake6.5.6 Cost-effectiveness on a macro levelReferences
List of abbreviationsALN AlendronateAOPS Alendronate osteoporosis prevention studyATC Anatomical therapeutic classificationBMD Bone mineral densityBMI Body mass indexBPH Benign prostatic hyperplasiaCI Confidence intervalCOPD Chronic obstructive pulmonary diseaseCRF Clinical risk factorDALY Disability-adjusted life yearDDD Defined daily dosageDXA Dual-energy x-ray absorptiometryEFPIA European Federation of Pharmaceutical Industry
AssociationsEMA European Medicines AgencyEPIC European prospective investigation into cancer
and nutritionEPOS European prospective osteoporosis studyEU5 Refers to 5 countries of the European Union
(France, Germany, Italy, Spain and the UK)EU5+ EU5 with the inclusion of SwedenFRAX® WHO Fracture risk assessment toolGDP Gross domestic productGIOP Glucocorticoid-induced osteoporosisGPRD General practice research databaseGRIO Groupe de Recherche et d'Informations sur les
OstéoporosesHAS Haute Autorité de SantéHRT Hormone replacement therapyICD International classification of diseases
IHD Ischemic heart diseaseIMS Intercontinental Marketing ServicesINSEE Institut National de la Statistique et des
Etudes EconomiquesIOF International Osteoporosis FoundationMEDOS Mediterranean osteoporosis studymg MilligramMPR Medication possession ratioMS Multiple sclerosisNFkB Nuclear factor kappa BNHANES National health and nutrition examination
surveyNICE National Institute of Health and Clinical
ExcellenceNOGG National Osteoporosis Guideline GroupOA OsteoarthritisOPG OsteoprotegerinPMSI Programme de médicalisation des systèmes
d’informationPOSSIBLE EU Prospective observational study investi-
gating bone loss experience in EuropePPV Positive predicted valuepQCT Peripheral quantitative computed tomographyPTH Parathyroid hormoneQALY Quality-adjusted life yearQCT Quantitative computed tomographyQoL Quality of lifeQUS Quantitative ultrasoundRA Rheumatoid arthritisRANKL Receptor activator of nuclear factor kappa-B
ligandRCP Royal College of PhysiciansRCT Randomized clinical trialRR Risk ratioSARA Swedish adherence register analysisSD Standard deviationSERM Selective estrogen receptor modulatorT-score The deviation in units of SD of a BMD value
from the mean value in premenopausalwomen
WHO World Health OrganizationWTP Willingness to pay
Arch Osteoporos

1 Introduction to osteoporosis
SummaryThis introductory chapter briefly reviews the way in
which osteoporotic fractures are defined, describes the mostcommon osteoporotic fractures, the extent of the burdenworld wide shown in current literature and the challengesfaced in the delivery of health care to reduce the number offractures.
The key messages of this chapter are:
Osteoporosis is characterized by reduced bone massand disruption of bone architecture, resulting inincreased bone fragility and increased fracture risk.
The definition of osteoporotic fractures is not straight-forward, but is generally based on the concepts of“low energy impact”, fragility and age.
The approach used in this report, as elsewhere, was tocharacterize fracture sites as osteoporotic when theyare associated with low bone mass and their incidencerises with age after the age of 50 years.
The most common osteoporotic fractures defined in thisway are those at the hip, spine, forearm, and humerus.
There are large variations in the incidence of osteopo-rotic fractures between and within countries.
Risk factors for osteoporosis and osteoporotic fracturesinclude a low body mass index, low calcium intake,reduced sunlight exposure and early menopause.
Osteoporosis causes more than 8.9 million fracturesannually worldwide and over one third of all osteopo-rotic fractures occur in Europe.
In Europe osteoporotic fractures account for 2 milliondisability-adjusted life years (DALYs) annually, some-what more than accounted for by hypertensive heartdisease and rheumatoid arthritis, respectively.
The frequency of osteoporotic fracture is rising in manycountries. Reasons for this relate in part to theincreased longevity of the population.
Despite advances in the diagnosis, assessment andtreatment of osteoporosis, a minority of patients at highfracture risk is identified for treatment.
The assessment of best practices in prevention andtreatment and the adoption of these across countries
can potentially result in significant reductions in theburden of osteoporosis.
1.1 Introduction
Osteoporosis is characterized by reduced bone mass anddisruption of bone architecture, resulting in increased bonefragility and increased fracture risk [1]. Although the diseasehas been documented for many years, osteoporosis and thefractures that arise were commonly viewed as inevitableconsequences of the aging process. Indeed, the conceptualdescription of osteoporosis that is now widely accepted wasformulated less than 20 years ago [1]. The publication of aWorld Health Organization (WHO) report on the assessmentof fracture risk and its application to screening for postmen-opausal osteoporosis in 1994 provided diagnostic criteria forosteoporosis based on the measurement of bone mineraldensity (BMD) and recognized osteoporosis as an establishedand well-defined disease that affected more than 75 millionpeople in the United States, Europe and Japan [2].
The focus of this report is on differences in access totreatments for osteoporosis, describing the size of theproblem using a diverse set of metrics, and the treatmentsavailable and their uptake. This forms the basis for ananalysis to identify causes and consequences of variationsin access and for actions needed to improve standards ofcare today and in the future, with the aim of reducing theburden of the disease.
The consequences of osteoporosis reside in the fracturesthat arise. This introduction reviews briefly the way in whichosteoporotic fractures are defined, describes the most com-mon osteoporotic fractures, the extent of the burden world-wide shown in current literature and the challenges faced inthe delivery of health care to reduce the number of fractures.
1.2 Defining an osteoporotic fracture
Osteoporosis is manifested by fractures but the definition ofan osteoporotic fracture is not straightforward. Opinionsdiffer concerning the inclusion or exclusion of differentsites of fracture in describing osteoporotic fractures. Oneapproach is to consider all fractures from low energytrauma as being osteoporotic. “Low energy” may variouslybe defined as a fall from a standing height or less, or traumathat in a healthy individual would not give rise to fracture[3]. This characterization of low trauma indicates that thevast majority of hip and forearm fractures are low energyinjuries or fragility fractures. At the age of 50 years,approximately 75% of people hospitalized for vertebralfractures have fractures that are attributable to low energyinjuries, increasing to 100% by the age of 90 years [4]. Theconsideration of low energy has the merit of recognizingthe multifactorial causation of fracture, but osteoporotic
Arch Osteoporos

individuals are more likely to fracture than their normalcounterparts following high energy injuries [5]. As mightbe expected, there is also an imperfect concordancebetween low energy fractures and those associated withreductions in BMD [6, 7].
The rising incidence of fractures with age does not providedirect evidence for osteoporosis, since a rising incidence offalls could also be a cause. By contrast, a lack of increasingincidence with age is reasonable presumptive evidence that afracture type is unlikely to be osteoporosis-related. An indirectarbiter of an osteoporotic fracture is the finding of a strongassociation between the fracture and the risk of classicalosteoporotic fractures at other sites. Vertebral fractures, forexample, are a very strong risk factor for subsequent hip andvertebral fracture [8–11] whereas forearm fractures predictfuture vertebral and hip fractures [12].
Due to the difficulties of knowing which fractures havebeen caused by low energy trauma, the approach used in thisreport and elsewhere was to characterize fracture sites asosteoporotic when they are associated with low bonemass andtheir incidence rises with age after the age of 50 years [13].The most common fractures defined in this way are those atthe hip, spine and forearm, and humerus but many otherfractures after the age of 50 years are related at least in part tolow BMD and should be regarded as osteoporotic [6, 14, 15].These include fractures of the ribs, tibia (in women, but notincluding ankle fractures), pelvis and other femoral fractures(Fig. 1). Their neglect underestimates the burden of osteopo-rosis, particularly in younger individuals. Under this schema,the fracture sites that would be excluded include those at theankle, hands and feet, digits, skull and face, and kneecap.
Fig. 1 Hazard ratio and 95% confidence intervals for osteoporosis as
judged by BMD at the hip according to fracture site in women from
France [15]
Fing
er
Foot
Toe
Face
Ank
le
Cla
vicl
e
Fem
urHip
Pel
vis
Spi
ne
Hum
erus
Low
er le
g
Hee
l
Wri
st
Rib
Elb
ow
1.0
2.0
3.0 ’Not osteoporotic’ ’ Osteoporotic’
HR
1.3 Common osteoporotic fractures
The most common osteoporotic fractures comprise vertebralcompression fractures, fractures at the forearm (particularly
Colles’ fracture), hip fractures, and proximal humerus fractures[2]. In Sweden, the remaining lifetime risk at the age of50 years of sustaining a hip fracture is 22.9% in women and10.7% in men. The remaining lifetime risk of a majorosteoporotic fracture (clinical spine, hip, forearm or humeralfracture) is 46.4% in women and 22.4% in men [16] (Table 1).The vast majority of osteoporotic fractures occur in elderlywomen [17]. Overall, women have about twice as high a risk ofsustaining any fracture than men. However, there are variationsbetween different fracture sites. For example women haveabout a 5 times higher risk of sustaining a forearm fracture thanmen but less than twice the risk of sustaining a spine fracture.The reasons for this relate in part to differences in bone densityat maturity and in particular to the loss of bone that occurs afterthe menopause. In addition, women live longer than men andare exposed, therefore, for longer periods to a reduced bonedensity and other risk factors for osteoporosis or fracture. Menhave higher rates of fracture-related mortality than women [18],possibly related to higher rates of co-morbidity.
Table 1 Remaining lifetime probability of fracture (%) in men and
women from Sweden at the ages shown [16]. The risk ratio refers to
the female/male probabilities
At 50 years At 80 years
Type of fracture Men Women Riskratio
Men Women Riskratio
Forearm 4.6 20.8 4.5 1.6 8.9 5.6
Hip 10.7 22.9 2.1 9.1 19.3 2.1
Spine a 8.3 15.1 1.8 4.7 8.7 1.9
Proximalhumerus
4.1 12.9 3.1 2.5 7.7 3.1
Any of these 22.4 46.4 2.1 15.3 31.7 2.1
The incidence of fragility fractures increases markedly withage, though the rate of rise with age differs for differentfracture outcomes. For this reason, the proportion of fracturesat any site also varies with age. This is most evident forforearm and hip fractures [19] (Fig. 2). Thus forearm fracturesaccount for a greater proportion at younger ages than in theelderly. Conversely, hip fractures are rare at the age of 50 yearsbut become the predominant osteoporotic fracture from theage of 75 years. In women, the median age for distal forearmfractures is around 65 years and for hip fracture, 80 years.Thus both the number of fractures and the type of fracture arecritically dependent on the age of the populations at risk. Themost frequent fractures are those at the hip, spine and distalforearm (Fig. 3), in women these account for the majority offractures after the age of 50 years.
aClinical spine fracture
Arch Osteoporos
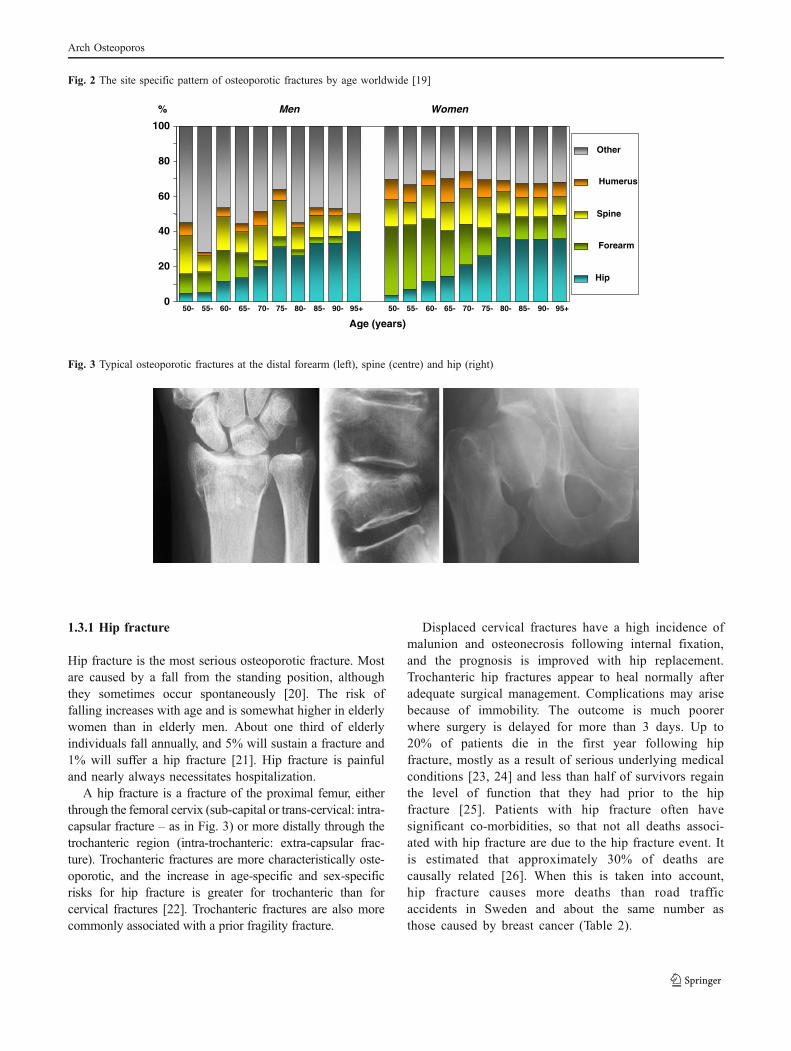
Fig. 2 The site specific pattern of osteoporotic fractures by age worldwide [19]
Men Women
0
20
40
60
80
100
50- 55- 60- 65- 70- 75- 80- 85- 90- 95+ 50- 55- 60- 65- 70- 75- 80- 85- 90- 95+
Age (years)
%
Other
Humerus
Spine
Forearm
Hip
Fig. 3 Typical osteoporotic fractures at the distal forearm (left), spine (centre) and hip (right)
1.3.1 Hip fracture
Hip fracture is the most serious osteoporotic fracture. Mostare caused by a fall from the standing position, althoughthey sometimes occur spontaneously [20]. The risk offalling increases with age and is somewhat higher in elderlywomen than in elderly men. About one third of elderlyindividuals fall annually, and 5% will sustain a fracture and1% will suffer a hip fracture [21]. Hip fracture is painfuland nearly always necessitates hospitalization.
A hip fracture is a fracture of the proximal femur, eitherthrough the femoral cervix (sub-capital or trans-cervical: intra-capsular fracture – as in Fig. 3) or more distally through thetrochanteric region (intra-trochanteric: extra-capsular frac-ture). Trochanteric fractures are more characteristically oste-oporotic, and the increase in age-specific and sex-specificrisks for hip fracture is greater for trochanteric than forcervical fractures [22]. Trochanteric fractures are also morecommonly associated with a prior fragility fracture.
Displaced cervical fractures have a high incidence ofmalunion and osteonecrosis following internal fixation,and the prognosis is improved with hip replacement.Trochanteric hip fractures appear to heal normally afteradequate surgical management. Complications may arisebecause of immobility. The outcome is much poorerwhere surgery is delayed for more than 3 days. Up to20% of patients die in the first year following hipfracture, mostly as a result of serious underlying medicalconditions [23, 24] and less than half of survivors regainthe level of function that they had prior to the hipfracture [25]. Patients with hip fracture often havesignificant co-morbidities, so that not all deaths associ-ated with hip fracture are due to the hip fracture event. Itis estimated that approximately 30% of deaths arecausally related [26]. When this is taken into account,hip fracture causes more deaths than road trafficaccidents in Sweden and about the same number asthose caused by breast cancer (Table 2).
Arch Osteoporos

Table 2 Causes of death in men and women aged 45 years or more
from Sweden [26]
Men Women Total Share of alldeaths (%)
Acute myocardial infarction 7,113 5,335 12,449 13
Lung cancer 1,761 1,112 2,873 3
Prostate cancer 2,480 0 2,480 3
Breast cancer 11 1,549 1,560 2
Hip fracture 566 854 1,420 2
Transport accident 422 142 564 1
1.3.2 Vertebral fracture
Falls account for only about one-third of new clinicalvertebral fractures, and most are associated instead withother activities such as lifting or changing position. Thevast majority of vertebral fractures are a result of moderateor minimal trauma [27]. The incidence and morbidity fromvertebral fractures is not well documented, in part related tothe difficulties in defining vertebral fracture, and because ofthe non-specific nature of the morbidity occasioned by thedisorder (e.g., back pain). In addition, the diagnosis is madeon a change in the shape of the vertebral body on x-rays. Thedeformities that result from osteoporotic fracture are usuallyclassified as a crush fracture (involving compression of theentire vertebral body), a wedge fracture (in which there isanterior or posterior height loss), and biconcavity (wherethere is relative maintenance of the anterior and posteriorheights with central compression of the end-plate regions). Anumber of morphometric approaches has been developed toquantify the shape of the vertebral body from radiographs ofthe lateral spine, and this has helped in defining theprevalence and incidence of vertebral fracture. A widelyused clinical system is to classify vertebral fractures as mild(20%–25% height loss), moderate (25%–40% height loss),or severe (>40% height loss) [28].
A further problem in describing the epidemiology ofvertebral fracture is that not all fractures come to clinicalattention [29–31]. Estimates for the proportion of vertebraldeformities that reach primary care attention vary, however, indifferent countries [29, 32, 33]. In register studies, thedischarge rate for hospitalised vertebral fractures is closelycorrelated with the discharge rate for hip fracture [31]. InSweden, approximately 23% of vertebral deformities come toclinical attention in women, and a somewhat higher propor-tion in men [33]. A similar proportion has been observed inthe placebo wing of multinational intervention studies [34].
Vertebral fractures may give rise to pain, loss of heightand progressive curvature of the spine (kyphosis). Theconsequences of kyphosis include difficulties in performingdaily activities and a loss of self-esteem due to the changein body shape. Severe kyphosis also gives rise torespiratory and gastrointestinal disorders. Although verte-bral fractures that come to clinical attention are less costlythan hip fractures, the morbidity from an acute fracture inthe first year is as severe as that due to a hip fracture [35],and is associated with an increase in mortality [36]. Theyare also a very strong risk factor for a further fracture at thespine and elsewhere [11].
1.3.3 Distal forearm fracture
The most common distal forearm fracture is a Colles’fracture. This fracture lies within 2.5 cm of the wrist jointmargin and is associated with dorsal angulation anddisplacement of the distal fragment of the radius. It maybe accompanied by a fracture of the ulna styloid process. ASmith fracture resulting in ventral angulation usuallyfollows a forcible flexion injury to the wrist and isrelatively uncommon in the elderly.
The cause of fracture is usually a fall on the outstretchedhand [27]. Although fractures of the forearm cause lessmorbidity than hip fractures, are rarely fatal, and seldomrequire hospitalization, the consequences are often under-estimated. Fractures are painful and need 4–6 weeks in plaster.Approximately 1% of patients with a forearm fracture becomedependent as a result of the fracture [37], but nearly half reportonly fair or poor functional outcome at 6 months [38]. There isa high incidence of algodystrophy – a syndrome which givesrise to pain, tenderness, stiffness and swelling of the hand, andmore rarely to frozen shoulder syndrome [39]. Moreover, therisk of other osteoporotic fractures in later life is also increasedafter Colles’ fracture [11].
1.4 Fracture burden worldwide
There is a marked difference in the incidence of hip fractureworldwide and probably in other osteoporotic fractures.Indeed, the difference in incidence between countries ismuch greater than the differences in incidence betweensexes within a country [40, 41]. Many risk factors forosteoporosis, and in particular for hip fracture have beenidentified which include a low body mass index, lowcalcium intake, reduced sunlight exposure and earlymenopause. These may have important effects withincommunities but do not explain differences in risk betweencommunities. The factor which best predicts this is socio-
Arch Osteoporos

economic prosperity that in turn may be related to lowlevels of physical activity [42] (Fig. 4). This is plausible,but only a hypothesis. It will be important to determinewhether this and other factors are truly responsible for theheterogeneity of fracture risk. If such factors can beidentified and are reversible, the primordial prevention ofhip fracture in those communities with presently low ratesmight be feasible.
Fig. 4 Correlation between average 10-year hip fracture probability in
different countries and gross domestic product (GDP) per capita [42]
0
1
2
3
4
0 10 20 30 40
10-year hip fracture probability (%)
GDP/capita ($000)
Osteoporosis causes more than 8.9 million fracturesannually worldwide (Table 3) – approximately 1,000 perhour [19]. Fracture rates are higher in the western worldthan in other regions so that, despite the lower population,slightly more than one-third of all osteoporotic fracturesoccur in Europe.
Table 3 Estimated number of osteoporotic fractures by site, in men
and women aged 50 years or more in 2000, by WHO region [19]
Number of fractures by site(in thousands)
Allosteoporoticfractures
WHO region Hip Spine ProximalHumerus
Forearm Number %
Africa 8 12 6 16 75 0.8
Americas 311 214 111 248 1,406 15.7
South-East Asia 221 253 121 306 1,562 17.4
Europe 620 490 250 574 3,119 34.8
EasternMediterranean
35 43 21 52 261 2.9
Western Pacifica 432 405 197 464 2,536 28.6
a Includes Australia, China, Japan, New Zealand and the Republic ofKorea
The global burden of osteoporosis can be quantifiedby disability adjusted life years (DALYs) [43]. Thisintegrates the years of life lost due to a fracture and thedisability in those that survive. A year lost due topremature mortality is equal to one DALY. If the qualityof life is halved by a fracture (1 = death; 0 = perfecthealth), then a year of life disabled is equal to a DALYof 0.5. In the year 2000 there were an estimated 9million osteoporotic fractures world-wide of which 1.6million were at the hip, 1.7 million at the forearm and1.4 million were clinical vertebral fractures. The totalDALYs lost was 5.8 million accounting for 0.83% ofthe global burden of non-communicable disease. InEurope osteoporotic fractures account for 2 millionDALYs annually, somewhat more than accounted forby hypertensive heart disease and rheumatoid arthritis[19], but less than chronic obstructive pulmonarydiseases (Fig. 5). With the exception of lung cancer,fractures due to osteoporosis account for more combineddeaths and morbidity than any cancer type (Fig. 6).Collectively, osteoporotic fractures account for approxi-mately 1% of the DALYs attributable to non-communi-cable diseases in Europe.
Fig. 5 Burden of diseases estimated as disability-adjusted life years
(DALYs) in 2002 in Europe [19]
269
307
451
490
1048
1217
1236
1359
2734
2936
3088
3453
2006
0 1000 2000 3000 4000
BPH
Multiple sclerosis
Parkinson's
Peptic ulcer
RA
Hypertensive HD
Migraine
Asthma
Cirrhosis
Alzheimer’s
OA
COPD
IHD
Osteoporosis
DALY's (000)
15751
IHD: Ischemic heart disease, COPD: Chronic obstructive pulmonary
disease, OA: Osteoarthritis, HD: heart disease, RA: Rheumatoid
arthritis, BPH: Benign prostatic hyperplasia
Arch Osteoporos
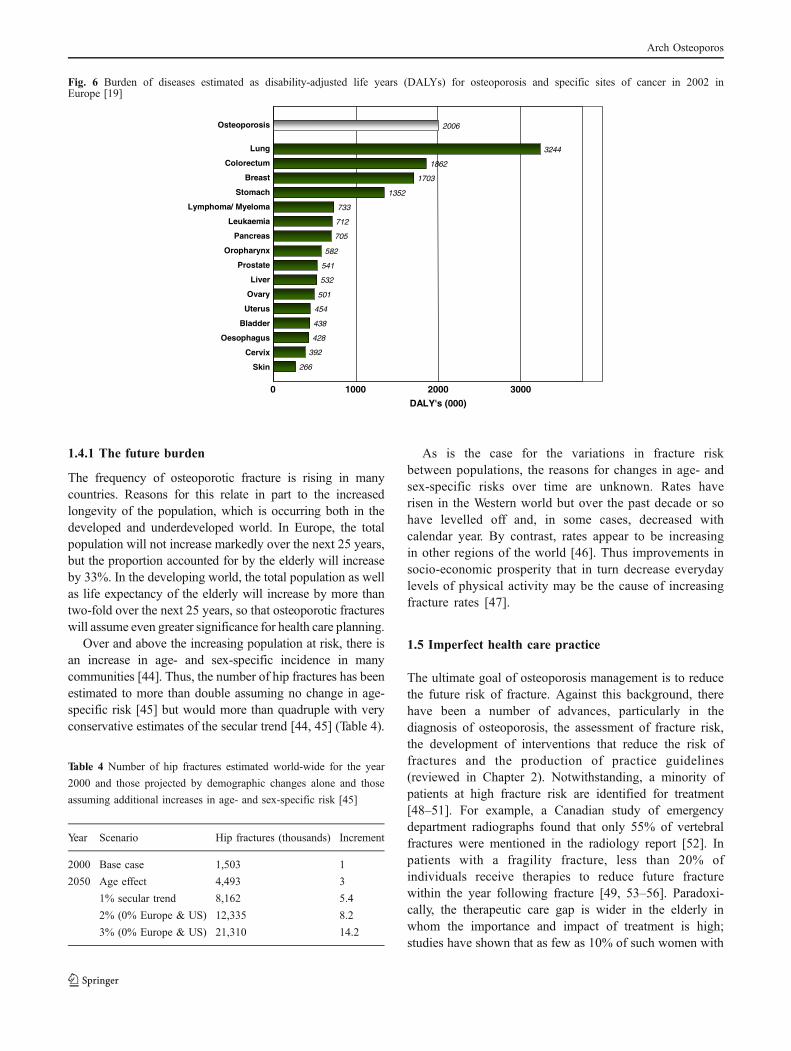
Fig. 6 Burden of diseases estimated as disability-adjusted life years (DALYs) for osteoporosis and specific sites of cancer in 2002 inEurope [19]
Skin
Cervix
Oesophagus
Bladder
Uterus
Ovary
Liver
Prostate
Oropharynx
Pancreas
Leukaemia
Lymphoma/ Myeloma
Stomach
Breast
Colorectum
Lung
Osteoporosis
266
392
428
438
454
501
532
541
582
705
712
733
1352
1703
1862
3244
2006
0 1000 2000 3000
DALY's (000)
1.4.1 The future burden
The frequency of osteoporotic fracture is rising in manycountries. Reasons for this relate in part to the increasedlongevity of the population, which is occurring both in thedeveloped and underdeveloped world. In Europe, the totalpopulation will not increase markedly over the next 25 years,but the proportion accounted for by the elderly will increaseby 33%. In the developing world, the total population as wellas life expectancy of the elderly will increase by more thantwo-fold over the next 25 years, so that osteoporotic fractureswill assume even greater significance for health care planning.
Over and above the increasing population at risk, there isan increase in age- and sex-specific incidence in manycommunities [44]. Thus, the number of hip fractures has beenestimated to more than double assuming no change in age-specific risk [45] but would more than quadruple with veryconservative estimates of the secular trend [44, 45] (Table 4).
Table 4 Number of hip fractures estimated world-wide for the year
2000 and those projected by demographic changes alone and those
assuming additional increases in age- and sex-specific risk [45]
Year Scenario Hip fractures (thousands) Increment
2000 Base case 1,503 1
2050 Age effect 4,493 3
1% secular trend 8,162 5.4
2% (0% Europe & US) 12,335 8.2
3% (0% Europe & US) 21,310 14.2
As is the case for the variations in fracture riskbetween populations, the reasons for changes in age- andsex-specific risks over time are unknown. Rates haverisen in the Western world but over the past decade or sohave levelled off and, in some cases, decreased withcalendar year. By contrast, rates appear to be increasingin other regions of the world [46]. Thus improvements insocio-economic prosperity that in turn decrease everydaylevels of physical activity may be the cause of increasingfracture rates [47].
1.5 Imperfect health care practice
The ultimate goal of osteoporosis management is to reducethe future risk of fracture. Against this background, therehave been a number of advances, particularly in thediagnosis of osteoporosis, the assessment of fracture risk,the development of interventions that reduce the risk offractures and the production of practice guidelines(reviewed in Chapter 2). Notwithstanding, a minority ofpatients at high fracture risk are identified for treatment[48–51]. For example, a Canadian study of emergencydepartment radiographs found that only 55% of vertebralfractures were mentioned in the radiology report [52]. Inpatients with a fragility fracture, less than 20% ofindividuals receive therapies to reduce future fracturewithin the year following fracture [49, 53–56]. Paradoxi-cally, the therapeutic care gap is wider in the elderly inwhom the importance and impact of treatment is high;studies have shown that as few as 10% of such women with
Arch Osteoporos

fragility fractures receive any osteoporosis therapy (estro-gens not considered) [48, 57, 58]. Furthermore, treatmentrates following a fracture are lower for those individualswho reside in long term care [49]. This contrasts withmyocardial infarction, which overcame a significant caregap over the past 15 years; 75% of individuals nowreceive beta blockers to help prevent recurrent myocar-dial infarction [59].
The poor access to treatments is compounded by pooradherence to treatment [60, 61]. Approximately 50% ofpatients do not follow their prescribed treatment regimenand/or discontinue treatment within 1 year [60]. As wouldbe expected, poor adherence is associated with reducedanti-fracture efficacy [62]. The determinants of low persis-tence and compliance to treatment are not well understood.Dosing requirements and frequency, adverse events, thepatient-physician relationship, and patient inability to detectimprovements in an asymptomatic disease are factors, butconstitute a minority of the variance [25, 63–67]. Retro-spective studies indicate that weekly dosing regimens areassociated with somewhat greater persistence than dailyregimens [68]. It is not yet known whether recentlydeveloped treatments given quarterly (i.v. ibandronate), 6-monthly (denosumab), or annual (zoledronic acid) areassociated with further improvements in persistence overthe long term. Patient education is also important in thisrespect and nurse-led monitoring early in the course oftreatment has been shown to improve compliance [69].Whether monitoring by measurement of biochemicalmarkers of bone turnover provides additional benefitshas not been established [70–72].
1.6 Aims of the report
Osteoporosis represents a major non-communicable diseaseof today that is associated with economic prosperity, and isset to increase markedly in the future. There is under-utilisation of the measures available to combat the diseaseand there is therefore a need for assessment of bestpractices in prevention and treatment, and the adoption ofthese across countries can potentially result in significantreductions in the burden of this disease. This report reviewscountry-specific information on the application of newtechnologies in osteoporosis, the epidemiology of fracture,future trends, and the uptake of treatments. The aim is toquantify the burden of osteoporosis in terms of prevalence,fractures, patients at risk, uptake of treatment, mortality andthe societal costs in different countries using a commonmethodology. The countries reviewed comprise the largerpopulations of Europe (Spain, Italy, France, Germany andthe UK) and Sweden wherefrom many epidemiological andhealth economic data are available. It is expected thatsubsequent reviews will extend this outreach.
References
1. Anonymous (1993) Consensus development conference: diag-nosis, prophylaxis, and treatment of osteoporosis. Am J Med 94:646–50
2. World Health Organization (1994) Assessment of fracture riskand its application to screening for postmenopausal osteoporo-sis. WHO Technical Report Series 843, Geneva
3. Melton LJ 3rd, Thamer M, Ray NF et al (1997) Fracturesattributable to osteoporosis: report from the National Osteopo-rosis Foundation. J Bone Miner Res 12:16–23
4. Johnell O, Kanis JA, Jonsson B, Oden A, Johansson H, de LaetC (2005) The burden of hospitalised fractures in Sweden.Osteoporos Int 16: 222–8
5. Sanders KM, Pasco JA, Ugoni AM et al (1998) The exclusion ofhigh trauma fractures may underestimate the prevalence of bonefragility fractures in the community: the Geelong OsteoporosisStudy. J Bone Miner Res 13: 1337–42
6. Seeley DG, Browner WS, Nevitt MC, Genant HK, Scott JC,Cummings SR (1991) Which fractures are associated with lowappendicular bone mass in elderly women? The study ofosteoporotic fractures research group. Ann InternMed 115: 837–42
7. Stone KL, Seeley DG, Lui LYet al (2003) BMD at multiple sitesand risk of fracture of multiple types: long-term results from theStudy of Osteoporotic Fractures. J Bone Miner Res 18: 1947–54
8. Melton LJ 3rd, Atkinson EJ, Cooper C, O'Fallon WM, Riggs BL(1999) Vertebral fractures predict subsequent fractures. Osteo-poros Int 10: 214–21
9. Kotowicz MA, Melton LJ 3rd, Cooper C, Atkinson EJ, O'FallonWM, Riggs BL (1994) Risk of hip fracture in women withvertebral fracture. J Bone Miner Res 9: 599–605
10. Ross PD, Davis JW, Epstein RS, Wasnich RD (1991) Pre-existingfractures and bone mass predict vertebral fracture incidence inwomen. Ann Intern Med 114: 919–23
11. Klotzbuecher CM, Ross PD, Landsman PB, Abbott TA 3rd,Berger M (2000) Patients with prior fractures have an increasedrisk of future fractures: a summary of the literature and statisticalsynthesis. J Bone Miner Res 15: 721–39
12. Cuddihy MT, Gabriel SE, Crowson CS, O'Fallon WM, MeltonLJ 3rd (1999) Forearm fractures as predictors of subsequentosteoporotic fractures. Osteoporos Int 9: 469–75
13. Kanis JA, Oden A, Johnell O, Jonsson B, de Laet C, Dawson A(2001) The burden of osteoporotic fractures: a method for settingintervention thresholds. Osteoporos Int 12: 417–27
14. Nguyen TV, Eisman JA, Kelly PJ, Sambrook PN (1996) Riskfactors for osteoporotic fractures in elderly men. Am JEpidemiol 144: 255–63
15. Delmas PD, Marin F, Marcus R, Misurski DA, Mitlak BH (2007)Beyond hip: importance of other nonspinal fractures. Am J Med120: 381–7
16. Kanis JA, Johnell O, Oden A et al (2000) Long-term risk ofosteoporotic fracture in Malmo. Osteoporos Int 11: 669–74
17. Cummings SR, Kelsey JL, Nevitt MC, O'Dowd KJ (1985)Epidemiology of osteoporosis and osteoporotic fractures.Epidemiol Rev 7: 178–208
18. Center JR, Nguyen TV, Schneider D, Sambrook PN, Eisman JA(1999) Mortality after all major types of osteoporotic fracture inmen and women: an observational study. Lancet 353: 878–82
19. Johnell O, Kanis JA (2006) An estimate of the worldwideprevalence and disability associated with osteoporotic fractures.Osteoporos Int 17: 1726–33
Arch Osteoporos

20. Melton LJ 3rd (1995) Epidemiology of fractures. In: Riggs BL,Melton LJ 3rd (eds) Osteoporosis: etiology, diagnosis, andmanagement, 2edn. Lippincott-Raven, Philadelphia, pp 225–47
21. Gibson M (1987) The prevention of falls in later life. Dan MedBull 34: 1–24
22. Michaelsson K, Weiderpass E, Farahmand BY et al (1999)Differences in risk factor patterns between cervical andtrochanteric hip fractures. Swedish Hip Fracture Study Group.Osteoporos Int 10: 487–94
23. Keene GS, Parker MJ, Pryor GA (1993) Mortality and morbidityafter hip fractures. BMJ 307: 1248–50
24. Poor G, Atkinson EJ, O'Fallon WM, Melton LJ 3rd (1995)Determinants of reduced survival following hip fractures inmen. Clin Orthop 319: 260–5
25. Melton LJ 3rd (2003) Adverse outcomes of osteoporoticfractures in the general population. J Bone Miner Res 18:1139–41
26. Kanis JA, Oden A, Johnell O, De Laet C, Jonsson B, OglesbyAK (2003) The components of excess mortality after hipfracture. Bone 32: 468–73
27. World Health Organization (2003) The burden of musculoskeletalconditions at the start of the new millennium, WHO TechnicalReport Series 919, Geneva
28. Genant HK, Jergas M, Palermo L et al (1996) Comparison ofsemiquantitative visual and quantitative morphometric assess-ment of prevalent and incident vertebral fractures in osteoporo-sis. The study of osteoporotic fractures research group. J BoneMiner Res 11: 984–96
29. Cooper C, Atkinson EJ, O'Fallon WM, Melton LJ 3rd (1992)Incidence of clinically diagnosed vertebral fractures: a popula-tion-based study in Rochester, Minnesota, 1985–1989. J BoneMiner Res 7: 221–7
30. Ettinger B, Black DM, Nevitt MC et al (1992) Contribution ofvertebral deformities to chronic back pain and disability. Thestudy of osteoporotic fractures research group. J Bone MinerRes 7: 449–56
31. Johnell O, Gullberg B, Kanis JA, (1997) The hospital burden ofvertebral fracture in Europe: a study of national register sources.Osteoporos Int 7: 138–44
32. Van Staa TP, Dennison EM, Leufkens HG, Cooper C (2001)Epidemiology of fractures in England andWales. Bone 29: 517–22
33. Kanis JA, Johnell O, Oden A et al (2004) The risk and burden ofvertebral fractures in Sweden. Osteoporos Int 15: 20–6
34. Lindsay R, Silverman SL, Cooper C et al (2001) Risk of newvertebral fracture in the year following a fracture. JAMA 285:320–3
35. Peasgood T, Herrmann K, Kanis JA, Brazier JE (2009) Anupdated systematic review of Health State Utility Values forosteoporosis related conditions. Osteoporos Int 20: 853–68
36. Kanis JA, Oden A, Johnell O, De Laet C, Jonsson B (2004)Excess mortality after hospitalisation for vertebral fracture.Osteoporos Int 15: 108–12
37. Chrischilles EA, Butler CD, Davis CS,Wallace RB (1991) Amodelof lifetime osteoporosis impact. Arch Intern Med 151: 2026–32
38. Kaukonen JP, Karaharju EO, Porras M, Luthje P, Jakobsson A(1988), Functional recovery after fractures of the distal forearm.Analysis of radiographic and other factors affecting theoutcome. Ann Chir Gynaecol 77: 27–31
39. Bickerstaff DR, Kanis JA (1994) Algodystrophy: an under-recognized complication of minor trauma. Br J Rheumatol 33:240–8
40. Johnell O, Gullberg B, Allander E, Kanis JA (1992) The apparentincidence of hip fracture in Europe: a study of national registersources. MEDOS Study Group. Osteoporos Int 2: 298–302
41. Elffors I, Allander E, Kanis JA et al (1994) The variableincidence of hip fracture in southern Europe: the MEDOSStudy. Osteoporos Int 4: 253–63
42. Johnell O, Borgstrom F, Jonsson B, Kanis JA (2007) Latitude,socioeconomic prosperity, mobile phones and hip fracture risk.Osteoporos Int 18: 333–7
43. Murray C, Lopez A (1996) Global and regional descriptiveepidemiology of disability. Incidence, prevalence, health expec-tancies and years lived with disability. In: Murray C and LopezA (eds) The global burden of disease: a comprehensiveassessment of mortality and disability from diseases, injuriesand risk factors in 1990 and projected to 2020. CambridgeUniversity Press, Cambridge, pp 201–46
44. Gullberg B, Johnell O, Kanis JA (1997) World-wide projectionsfor hip fracture. Osteoporos Int 7: 407–13
45. Cooper C, Campion G, Melton LJ 3rd (1992) Hip fractures inthe elderly: a world-wide projection. Osteoporos Int 2: 285–9
46. Cooper C, Cole Z, Holroyd C et al (2011) Secular trends in theincidence of hip and other osteoporotic fractures. Osteoporos Int22:1277–88
47. Kanis JA (2008) Assessment of osteoporosis at the primaryhealth-care level. Technical Report. WHO Collaborating Centre,University of Sheffield, UK
48. Freedman KB, Kaplan FS, Bilker WB, Strom BL, Lowe RA(2000) Treatment of osteoporosis: are physicians missing anopportunity? J Bone Joint Surg Am 82A: 1063–70
49. Giangregorio L, Papaioannou A, Cranney A, Zytaruk N, AdachiJD (2006) Fragility fractures and the osteoporosis care gap: aninternational phenomenon. Semin Arthritis Rheum 35: 293–305
50. Nayak S, Roberts MS, Greenspan SL (2009) Factors associatedwith diagnosis and treatment of osteoporosis in older adults.Osteoporos Int 20: 1963–7
51. Vaile J, Sullivan L, Bennett C, Bleasel J (2007) First FractureProject: addressing the osteoporosis care gap. Intern Med J 37:717–20
52. Majumdar SR, Kim N, Colman I et al (2005) Incidentalvertebral fractures discovered with chest radiography in theemergency department: prevalence, recognition, and osteopo-rosis management in a cohort of elderly patients. Arch InternMed 165: 905–9
53. Bessette L, Ste-Marie LG, Jean S et al (2008) Recognizingosteoporosis and its consequences in Quebec (ROCQ): back-ground, rationale, and methods of an anti-fracture patient health-management programme. Contemp Clin Trials 29: 194–210
54. Papaioannou A, Giangregorio L, Kvern B, Boulos P, IoannidisG, Adachi JD (2004) The osteoporosis care gap in Canada.BMC Musculoskelet Disord 5: 11
55. Elliot-Gibson V, Bogoch ER, Jamal SA, Beaton DE (2004) Practicepatterns in the diagnosis and treatment of osteoporosis after afragility fracture: a systematic review. Osteoporos Int 15: 767–78
56. Haaland DA, Cohen DR, Kennedy CC, Khalidi NA, Adachi JD,Papaioannou A (2009) Closing the osteoporosis care gap: increasedosteoporosis awareness among geriatrics and rehabilitation teams.BMC Geriatr 9: 28
57. Swedish Association of Local Authorities and Regions and theSwedish National Board of Health and Welfare (2009) Quality andEfficiency in SwedishHealth Care, Stockholm. www.skl.se/compareAccessed 23 May 2011
Arch Osteoporos

58. Borgstrom F, Zethraeus N, Johnell O et al (2006) Costs and qualityof life associated with osteoporosis-related fractures in Sweden.Osteoporos Int 17: 637–50
59. Austin P, Tu J, Ko D, Alter D (2008) Factors associated with theuse of evidence-based therapies after discharge among elderlypatients with myocardial infarction. CMAJ 179: 901–8
60. Compston JE, Seeman E (2006) Compliance with osteoporosistherapy is the weakest link. Lancet 368: 973–4
61. Rabenda V, Hiligsmann M, Reginster JY (2009) Poor adherenceto oral bisphosphonate treatment and its consequences: a reviewof the evidence. Expert Opin Pharmacother 10:2303–15
62. Siris ES, Harris ST, Rosen CJ et al (2006) Adherence tobisphosphonate therapy and fracture rates in osteoporoticwomen: relationship to vertebral and nonvertebral fracturesfrom 2 US claims databases. Mayo Clin Proc 81: 1013–22
63. Cramer JA (1995) Relationship between medication complianceand medical outcomes. Am J Health Syst Pharm 52: S27-9
64. Lamberg L (2000) Patient-physician relationship critical evenduring brief "medication checks". JAMA 284: 29–31
65. Eraker SA, Kirscht JP, Becker MH (1984) Understanding andimproving patient compliance. Ann Intern Med 100: 258–68
66. Diaz Curiel M, Carrasco de la Pena JL, Honorato Perez J, PerezCano R, Rapado A, Ruiz Martinez I (1997) Study of bonemineral density in lumbar spine and femoral neck in a Spanishpopulation. Multicentre research project on osteoporosis. Osteo-poros Int 7: 59–64
67. Claxton AJ, Cramer J, Pierce C (2001) A systematic review ofthe associations between dose regimens and medication compli-ance. Clin Ther 23: 1296–310
68. Silverman SL, Gold DT (2008) Compliance and persistence withosteoporosis therapies. Curr Rheumatol Rep 10: 118–22
69. Clowes JA, Peel NF, Eastell R (2004) The impact of monitoringon adherence and persistence with antiresorptive treatment forpostmenopausal osteoporosis: a randomized controlled trial. JClin Endocrinol Metab 89: 1117–23
70. Compston J (2009) Monitoring bone mineral density duringantiresorptive treatment for osteoporosis. BMJ 338: b1276
71. Bell KJ, Hayen A, Macaskill P et al (2009) Value of routinemonitoring of bone mineral density after starting bisphospho-nate treatment: secondary analysis of trial data. BMJ 338: b2266
72. Delmas PD, Vrijens B, Eastell R et al (2007) Effect ofmonitoring bone turnover markers on persistence with risedro-nate treatment of postmenopausal osteoporosis. J Clin Endo-crinol Metab 92: 1296–304
2 Medical innovation and clinical progressin the management of osteoporosis
Summary
In recent years, there has been a number of advances,particularly in the measurement of BMD, diagnosis ofosteoporosis, the assessment of fracture risk, the develop-ment of interventions that reduce the risk of fractures andthe production of practice guidelines. This chapterdescribes the current state of these aspects in the field ofosteoporosis. Also, the cost-effectiveness of osteoporosistreatments is addressed.
The key messages of this chapter are:
Ideally, clinical assessment of the skeleton should capturedifferent aspects of fracture risk but at present theassessment of bone mass is the only aspect that can bereadily measured in clinical practice.
BMD is the amount of bone mineral per unit volume(volumetric density, g/cm3), or per unit area (arealdensity, g/cm2), and both can be measured in vivo bydensitometric techniques.
There are significant differences in the performance ofdifferent techniques at different skeletal sites. Inaddition, the performance depends on the type offracture that is to be predicted. For example, BMDassessments by DXA to predict hip fracture is betterwhen measurements are made at the hip rather than atthe spine or forearm.
In 1994 and 2008, the WHO published diagnostic criteriafor osteoporosis in postmenopausal women based on theT-score, intended primarily for descriptive epidemiology.
Based on these diagnostic criteria, osteoporosis ispresent in approximately 20% of all postmenopausalCaucasian women and 50% of those aged 80 years.
An audit of DXA resources in the 27 member states ofthe European Union revealed that about 60% had therecommended number of DXA machines for theirpopulation.
The use of bone mass measurements for prognosisdepends upon accuracy. Accuracy in this context is theability of the measurement to predict fracture. Theability of BMD to predict fracture is comparable to theuse of blood pressure to predict stroke, and significant-ly better than serum cholesterol to predict myocardialinfarction.
Algorithms that integrate the weight of clinical riskfactors (CRFs) for fracture risk, with or without informa-tion on BMD, have been developed. The FRAX® tool(www.shef.ac.uk/FRAX ) computes the 10-year probabilityof hip fracture or a major osteoporotic fracture.
Major pharmacological interventions are bisphospho-nates, strontium ranelate, raloxifene, denosumab andparathyroid hormone peptides
Fracture prevention with generically priced alendro-nate in women aged 50 years and older at high risk offracture is cost-effective in most Western countries.Other treatments are cost-effective alternatives to no
Arch Osteoporos

treatment, particularly in patients that cannot use thistreatment.
Compliance and persistence with treatment for oste-oporosis are poor; approximately 50% of patients donot follow their prescribed treatment regimen and/ordiscontinue treatment within one year.
Treatments that could improve adherence will lead tomore avoided fractures and are cost-effective comple-ments to currently available treatments.
In all national treatment guidelines some case-findingapproach is suggested for patient identification.However, they vary in terms of which risk factors areacknowledged, how the fracture risk should beassessed and how BMD measurements should beused.
Notwithstanding the availability of guidelines, recom-mendations in national guidelines are not alwaysimplemented.
2.1 Introduction
In recent years, there has been a number of advances,particularly in the measurement of BMD, the diagnosis ofosteoporosis, the assessment of fracture risk, the develop-ment of interventions that reduce the risk of fractures andthe production of practice guidelines.
2.2 Measurement of BMD
The description of osteoporosis captures the notion thatlow bone mass is an important component of the risk offracture, but that other abnormalities occur in theskeleton that contribute to skeletal fragility (Fig. 7).Ideally, clinical assessment of the skeleton should captureall these aspects of fracture risk but at present theassessment of bone mass is the only aspect that can bereadily measured in clinical practice, and forms thecornerstone for the general management of osteoporosisbeing used for diagnosis, risk prediction, the selection ofpatients for treatment and monitoring of patients ontreatment [1].
Fig. 7 Light microscopic views of normal (left) and osteoporotic (right) cancellous bone. Osteoporosis is associated with thinning of trabecular
elements. The resulting destruction of interconnecting elements (arrows) weakens the strength of bone out of proportion to the amount of bone lost
(Courtesy of Professor DW Dempster, New York).
© 2000, David W. Dempster, PhD
OsteoporoticNormal
BMD is the amount of bone mass per unit volume(volumetric density, g/cm3), or per unit area (areal density,g/cm2), and both can be measured in vivo by densitometrictechniques. A large variety of techniques is available but themost widely used techniques by far are based on x-rayabsorptiometry in bone, particularly dual-energy x-rayabsorptiometry (DXA). DXA is based on the fact that theabsorption of x-rays is very sensitive to the calcium contentof tissue, of which bone is the most important source. Other
techniques include quantitative ultrasound (QUS), quantita-tive computed tomography (QCT) applied both to the spineand hip and to the appendicular skeleton (pQCT), peripheralDXA, digital x-ray radiogrammetry and radiographic absorp-tiometry [2]. DXA is versatile in the sense that it can be usedto assess bone mineral content of the whole skeleton as wellas specific sites, including those most vulnerable to fracture[3]. DXA provides a two-dimensional areal value rather thana volumetric density and thus is influenced by bone size as
Arch Osteoporos

well as true density. The most commonly measured sites arethe lumbar spine (L1-L4) and the proximal femur. However,in older people the accuracy of measurements in the lumbarspine may be impaired by scoliosis, vertebral deformity,osteophytes and extraskeletal calcification and the proximalfemur is the preferred site.
The widespread clinical use of DXA, particularly atthe proximal femur and lumbar spine, arises from manyprospective studies that have documented a stronggradient of risk for fracture prediction. For example, awidely cited meta-analysis [4] indicated that the risk ofhip fracture increased 2.6-fold for each standard devia-tion (SD) decrease in BMD. This gradient of risk isbetter than many other techniques, and the use of centralDXA predicts other types of fracture with as high agradient of risk as other competing techniques.
DXA measurements at the hip have particular utilityin the diagnosis of osteoporosis (described later), butmeasurements at the lumbar spine are also widely used.In early postmenopausal women in whom vertebralfractures are common, vertebral fractures may bepredicted with greater effect by measurements at thelumbar spine than with measurements made at the hip.Also, spinal measurements are sensitive to treatment-induced changes, and the spine represents the mostwidely used site for monitoring the response to treat-ment. DXA techniques on the lateral spine rather than inthe customary postero-anterior projection are increasinglyused to detect vertebral fractures [5, 6].
2.2.1 Performance characteristics of bone mineralmeasurements
The performance characteristics of many measurement techni-ques have beenwell documented [2, 4, 7, 8]. For the purpose ofrisk assessment and for diagnosis, the characteristic of majorimportance is the ability of a technique to predict fractures.This is traditionally expressed as the increase in relative riskper SD unit decrease in BMD measurements. This is termedthe gradient of risk.
There are significant differences in the performance ofdifferent techniques at different skeletal sites. In addition,the performance depends on the type of fracture that is tobe predicted [4]. For example, BMD assessments byDXA to predict hip fracture are better when measure-ments are made at the hip rather than at the spine orforearm (Table 5). For the prediction of hip fracture, thegradient of risk provided by hip BMD is 2.6. In otherwords, the fracture risk increases 2.6-fold for each SDdecrease in hip BMD. Thus, an individual with a Z-scoreof −3 at the hip would have a 2.63 or greater than 15-foldhigher risk than an individual of the same age with a Z-score of 0 (i.e., an average BMD). Where the intention is
to predict any osteoporotic fracture, the commonly usedtechniques are comparable: the risk of fracture increasesapproximately 1.5-fold (95% CI = 1.4-1.6) for each SDdecrement in the measurement. Thus, an individual with ameasurement of 3 SD below the average value for agewould have a 1.53 or greater than 3-fold higher risk thanan individual with an average BMD. Note that the risk offracture in individuals with an average BMD is lower thanthe average fracture risk, since BMD is normally distrib-uted whereas the risk of fracture increases exponentiallywith decreasing BMD.
Table 5 Age-adjusted increase in risk of fracture (with 95%CI) in women
for every 1 SD decrease in BMD (by absorptiometry) below the mean
value for age [4]
Site ofmeasurement
Outcome fracture
Forearm Hip Spine All fractures
Distal radius 1.7 (1.4–2.0) 1.8 (1.4–2.2) 1.7 (1.4–2.1) 1.4 (1.3–1.6)
Femoral neck 1.4 (1.4–1.6) 2.6 (2.0–3.5) 1.8 (1.1–2.7) 1.6 (1.4–1.8)
Lumbar spine 1.5 (1.3–1.8) 1.6 (1.2–2.2) 2.3 (1.9–2.8) 1.5 (1.4–1.7)
2.2.2 Diagnosis of osteoporosis
Total skeletal mass and density remain relatively constant oncegrowth has ceased, until the age of 50 years or so. Thedistribution of bone mineral content or density in younghealthy adults (“peak bone mass”) is approximately normallydistributed, irrespective of the measurement technique used.Because of this normal distribution, bone density values inindividuals may be expressed in relation to a referencepopulation in SD units. When SDs are calculated in relationto the mean of a young healthy population, this is referred to asthe T-score. In 1994, the WHO published diagnostic criteriafor osteoporosis in postmenopausal women based on the T-score, intended primarily for descriptive epidemiology (Table6) [2, 9]. These criteria have since been widely accepted andare commonly used, perhaps incorrectly, to provide interven-tion thresholds.
Table 6 WHO’s diagnostic thresholds for BMD at the spine, hip or
distal forearm
Diagnosis BMD T-score (SD units)
Normal ≥ −1Low bone mass (osteopenia) < −1 but >−2.5Osteoporosis ≤ −2.5Severe osteoporosis ≤ −2.5 plus one or more fragility
fractures
Arch Osteoporos

These thresholds were developed for measurements ofBMD at the spine, hip, or forearm. They are inappropri-ate for use in children or adolescents. More recently, theworking definition of osteoporosis has been refined withthe femoral neck being proposed as the standardmeasurement site and the reference population for bothmen and women being the mean and SD values in youngwomen from the NHANES III study [10, 11]. Reasonsfor adopting the femoral neck as a reference site includethe high predictive value for hip fracture risk (see Table 5) andthe wide experience with this site [1]. Measurements atany site (hip, spine and wrist) predict any osteoporoticfracture equally well with a gradient of risk of appro-ximately 1.5 per SD decrease in BMD. The use of asingle reference range to compute T-scores in both menand women is merited by the fact that age-specificfracture risk of hip fracture and other osteoporoticfractures is similar in men and women with the samefemoral neck BMD (Fig. 2) [12]. However, women dohave lower BMD on average and consequently higherfracture risk.
Fig. 8 The age-adjusted incidence of hip fracture according to femoralneck BMD in men and women from 9 population based cohorts indifferent regions of the world (derived from [12])
Incidence (/100,000)
T-score (SD)
0
200
400
600
800
1000
-4.0 -3.0 -2.0 -1.0 0.0 1.0 2.0 3.0 4.0
Men
Women
Based on these diagnostic criteria, osteoporosis ispresent in approximately 20% of all postmenopausalCaucasian women and 50% of those aged 80 years. Theprevalence of osteoporosis in Sweden using the WHOcriteria is shown for Swedish men and women in Table 7[13]. Approximately 6% of men and 21% of women aged50–84 years are classified as having osteoporosis. Theprevalence of osteoporosis in men over the age of 50 yearsis 3-times less frequent than in women – comparable to thedifference in lifetime risk of an osteoporotic fracture in menand women.
Table 7 Prevalence of osteoporosis at the age intervals shown inSweden using female-derived reference ranges at the femoral neck [13]
Men Women
Age range(years)
% ofpopulation
Numberaffected(thousands)
% ofpopulation
Numberaffected(thousands)
50-54 2.5 7 6.3 17
55-59 3.5 7.6 9.6 21.1
60-64 5.8 11.4 14.3 30
65-69 7.4 14.2 20.2 43.7
70-74 7.8 14.6 27.9 63
75-79 10.3 13.7 37.5 68.3
80-84 16.6 14.7 47.2 67.8
50-80 6.3 83.2 21.2 310.9
In addition to categorising individuals as having osteo-porosis or not, a much more important use of bone mineralmeasurement is to provide prognostic information of futurefracture risk (section 1.2). A further use is as a monitoringtool by which to monitor changes in bone mass in a treatedor untreated patient, though this remains a somewhatcontentious issue [14–16].
2.2.3 Availability of DXA
The requirement for assessing and monitoring the treatmentof osteoporosis to service practice guidelines has beenestimated at 10.6 DXA units per million of the generalpopulation [17, 18]. The figures assume a case findingapproach rather than population based screening. Thisrequirement can be compared with the availability ofDXA in different European countries as reported bymembers of the EU osteoporosis consultation panel in2008 [19]. The audit revealed that about 60% had therecommended number of DXA machines for their popula-tion (Fig. 9). Reimbursement for DXA scans varied widelybetween member states both in terms of the criteria for andlevel of reimbursement but only a minority of countries (9/27)provided full reimbursement under any circumstances. It isimportant to note that the figures provided do not distinguishmachines dedicated in part or in full to clinical research, ormachines that lie idle or are underutilised because of lack offunding. It is likely, therefore, that the majority of countries areunder-resourced in the context of practice guidelines. Afurther consideration is the inequity of geographical location,which is known to be problematic in Italy, Spain and the UK.This inequity results in long waiting times or long distances totravel or, in many cases, no practical access at all. The densityof DXA equipment estimated for 2010 in EU5 and Sweden isshown in Table 8 [20].
Arch Osteoporos

Fig. 9 Density (units/million of the population) of central DXA (spine/hip) units in EU as reported in 2007 [19]
0 5 10 15 20 25 30 35 40 45
LuxembourgBulgariaRomania
UKLithuania
PolandCzech Rep
EstoniaSpain
NetherlandsDenmarkSweden
*RecommendedGermany
ItalySlovakiaFinlandIreland
HungaryGreece
SloveniaMalta
FranceAustria
PortugalBelgiumCyprus
Table 8 Density (units/million of the population) of DXA units in EU5and Sweden estimated for 2010 [20]
DXA units Population (000) a Units/million population
France 1,823 62,637 29.1
Spain 382 45,317 8.4
UK 508 61,899 8.2
Sweden 93 9,293 10
Germany 1,732 82,057 21.1
Italy 1,116 60,098 18.6
aPopulation for 2010 (UN 2008)
2.3 Assessment of fracture risk
Although the diagnosis of the disease relies on the quantitativeassessment of BMD which is a major determinant of bonestrength, the clinical significance of osteoporosis lies in thefractures that arise. In this respect, there are some analogieswith other multifactorial chronic diseases. For example,hypertension is diagnosed on the basis of blood pressurewhereas an important clinical consequence of hypertension isstroke. Because a variety of non-skeletal factors contributes tofracture risk [2, 21], the diagnosis of osteoporosis by the useof BMD measurements is at the same time an assessment of arisk factor for the clinical outcome of fracture. For thesereasons there is a distinction to be made between the use ofBMD for diagnosis and for risk assessment.
2.3.1 Assessing risk with BMD
The use of bone mass measurements for prognosis dependsupon accuracy. Accuracy in this context is the ability of themeasurement to predict fracture. As reviewed above, manyprospective population studies indicate that the risk for fractureincreases by a factor of 1.5 to 3.0 for each SD decrease inBMD (see Table 5). The ability of BMD to predict fracture iscomparable to the use of blood pressure to predict stroke, andsignificantly better than serum cholesterol to predict myocar-dial infarction [4]. The highest gradient of risk is found at thehip to predict hip fracture where the gradient of risk is 2.6.
Despite these performance characteristics, it should berecognised that, just because BMD is normal, there is noguarantee that a fracture will not occur – only that the risk islower. Conversely, if BMD is in the osteoporotic range, thenfractures are more likely, but not invariable. The principaldifficulty is that BMD alone has high specificity but lowsensitivity, so that the majority of osteoporotic fractures willoccur in individuals with BMD values above the osteoporosisthreshold [22–25]. At the age of 50 years, the proportion ofwomen with osteoporosis who will fracture their hip, spine orforearm or proximal humerus in the next 10 years (i.e.,positive predictive value) is approximately 45%. The detec-tion rate for these fractures (sensitivity) is, however, low and96% of such fractures would occur in women withoutosteoporosis [26] (Table 9). The low sensitivity is one of thereasons why widespread population-based screening is notrecommended in women at the time of the menopause.
Arch Osteoporos

2.3.2 Age and the risk of fracture
The performance characteristics of the test can, how-ever, be improved by the concurrent consideration ofrisk factors that operate independently of BMD.Perhaps the best example is age. The vast majority ofhip fractures (90%), for example, occur in people aged50 years and older [27]. While this partly relates to theage-related decrease in BMD, age is also a risk factorthat is independent of bone mineral density. In otherwords, at any given BMD, an older adult is much morelikely to suffer a fracture than younger people. Forexample, poor balance and weaker muscles in theelderly contribute to the risk of falls and subsequentfractures. The same T-score with the same technique atany one site has, therefore, a different significance atdifferent ages [26, 28], indicating that age contributesto risk independently of BMD. In addition, theperformance characteristics of BMD vary with age.For example, at the age of 50 years, hip fracture riskincreased 3.7-fold per SD decrease in femoral neckBMD whereas at the age of 80 years the gradient ofrisk is 2.3 [12]. The impact of age on hip fractureprobability is shown in Table 10. Thus, the consider-ation of age and BMD together increases the range ofrisk that can be identified.
Table 10 Ten-year probability of hip fracture (%) in men and womenfrom Sweden according to age and T-score for BMD at the femoralneck (Johnell et al. 2005 [12] and 2007 Table from the erratum)
T-score (SD units)
Age (years) 1 0 -1 -2 -3 -4
Men
50 0.1 0.2 0.8 2.6 8.6 26.6
60 0.1 0.4 0.9 2.5 6.7 17.1
70 0.5 1.2 2.5 5.4 11.4 23
80 1.8 3.2 5.7 10 17.2 28.5
Women
50 0 0.1 0.3 0.9 3.2 10.7
60 0.1 0.3 0.8 2.3 6.7 18.9
70 0.3 0.8 2.1 5.2 12.8 29.4
80 1.1 2.3 4.8 9.9 19.8 36.9
There are, however, a large number of additional riskfactors that provide information on fracture risk indepen-dently of both age and BMD.
2.3.3 Other clinical risk factors
A large number of additional risk factors for fracture havebeen identified. In general, risk factor scores show relatively
Table 9 Estimates of positive predictive value (PPV), sensitivity, and specificity of measurements to predict any osteoporotic fracture over10 years or to death in women aged 50 years or 65 years, according to different population cut-offs to define a high-risk category [26]
High-risk category (% of population)
5 10 15
Gradient of risk (RR/SD) PPV (%) Sensitivity (%) Specificity (%) PPV (%) Sensitivity (%) Specificity (%) PPV (%) Sensitivity (%) Specificity (%)
Women aged 50 years
1.5 12.7 10.7 95.4 10.7 18 90.5 10.3 26.1 85.7
2 19.2 16.2 95.7 15.1 25.5 91 13.8 35.1 86.3
2.5 24.8 21 96 18.7 31.6 91.4 16.5 41.9 86.7
3 29.4 24.9 96.3 21.5 36.3 91.7 18.5 47 87
4 35.8 30.3 96.6 25.1 42.3 92 20.9 52.9 87.4
5 39.5 33.4 96.8 26.8 45.3 92.2 21.8 55.2 87.5
6 41.5 35 96.9 27.5 46.5 92.3 21.9 55.6 87.6
Women aged 65 years
1.5 28.8 10.2 95.9 24.4 17.3 91.2 23.7 25.3 86.7
2 40.8 14.5 96.6 32.9 23.4 92.2 30.7 32.7 87.9
2.5 49.8 17.7 97.1 39 27.7 92.9 35.4 37.7 88.7
3 56.2 19.9 97.4 43.1 30.6 93.4 38.3 40.8 89.2
4 63.5 22.6 97.9 47.5 33.8 93.9 41.2 43.8 89.7
5 67 23.8 98.1 49.2 34.9 94.1 41.7 44.4 89.8
6 68.5 24.3 98.2 49.4 35.1 94.1 41.2 43.8 89.7
Arch Osteoporos
poor specificity and sensitivity in predicting either bonemineral density or fracture risk [29, 30]. For the purposes ofrisk assessment, interest lies in those factors that contributesignificantly to fracture risk over and above that provided bybone mineral density measurements or age [31]. A caveat isthat some risk factors may not identify a risk that is amenableto particular treatments, so that the relationship betweenabsolute probability of fracture and reversibility of risk isimportant [32]. Liability to falls is an appropriate examplewhere the risk of fracture is high, but treatment with agentsaffecting bone metabolism may have little effect.
Over the past few years a series of meta-analyses has beenundertaken to identify CRFs that could be used in case findingstrategies with or without the use of BMD. These aresummarised in Table 11 with their predictive value for hipfracture risk [33].
Table 11 Risk ratio (RR) for osteoporotic fracture and 95% confidenceintervals associated with risk factors adjusted for age, with andwithout adjustment for BMD [33]
Risk indicator Without BMD With BMD
RR 95% CI RR 95% CI
Body mass index(20 v 25 kg/m2)
1.27 1.16-1.38 1.02 0.92-1.13
(30 v 25 kg/m2) 0.89 0.81-0.98 0.96 0.86-1.08
Prior fracture after50 years
1.86 1.72-2.01 1.76 1.60-1.93
Parental history of hipfracture
1.54 1.25-1.88 1.54 1.25-1.88
Current smoking 1.29 1.17-1.43 1.13 1.00-1.25
Ever use of systemiccorticosteroids
1.65 1.42-1.90 1.66 1.42-1.92
Alcohol intake 3 or moreunits daily
1.38 1.16-1.65 1.36 1.13-1.63
Rheumatoid arthritis 1.56 1.20-2.02 1.47 1.12-1.92
(a) A low body mass index (BMI) is a significant riskfactor for hip and other fractures. For hip fracture,the risk is nearly 2-fold increased comparing indi-viduals with a BMI of 25 kg/m2 and 20 kg/m2 [34](Table 11). It is important to note that comparison of25 versus 30 kg/m2 is not associated with a halving ofrisk, i.e., leanness is a risk factor rather than obesitybeing a protective factor. Higher BMI is, in fact,protective for bone status, but the effect is very smalland a BMI over 30 kg/m2 is associated withcardiovascular disease and diabetes. The value ofBMI in predicting fractures is very much diminishedwhen adjusted for BMD.
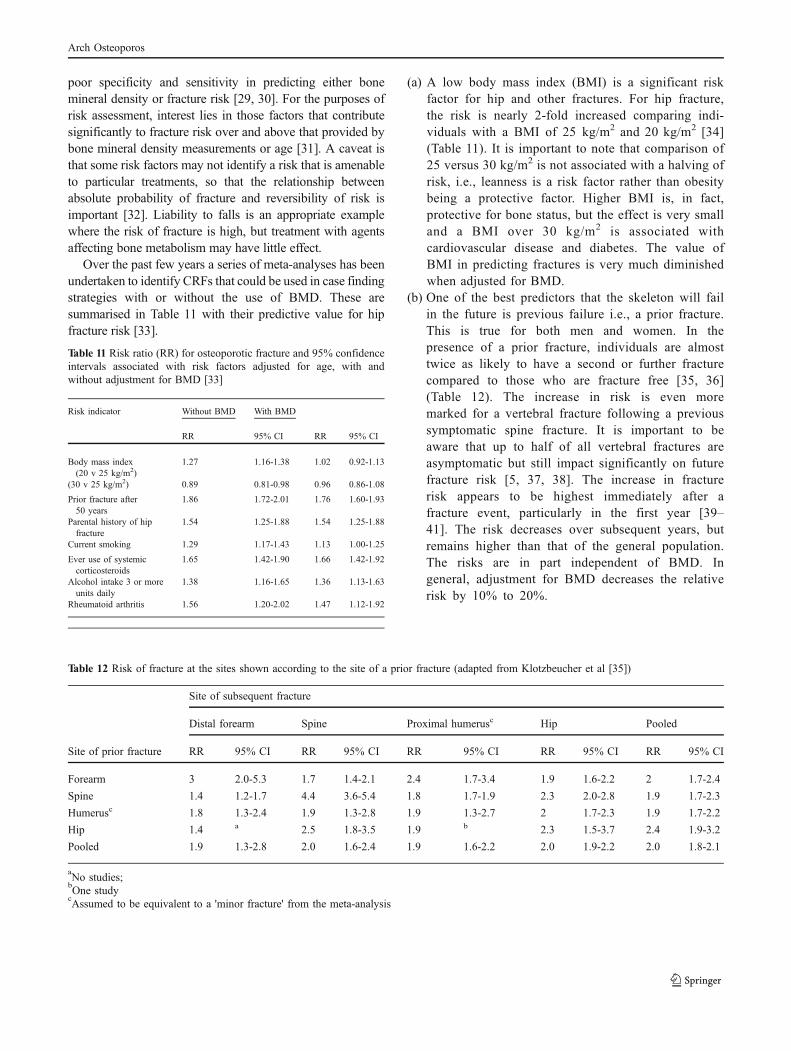
(b) One of the best predictors that the skeleton will failin the future is previous failure i.e., a prior fracture.This is true for both men and women. In thepresence of a prior fracture, individuals are almosttwice as likely to have a second or further fracturecompared to those who are fracture free [35, 36](Table 12). The increase in risk is even moremarked for a vertebral fracture following a previoussymptomatic spine fracture. It is important to beaware that up to half of all vertebral fractures areasymptomatic but still impact significantly on futurefracture risk [5, 37, 38]. The increase in fracturerisk appears to be highest immediately after afracture event, particularly in the first year [39–41]. The risk decreases over subsequent years, butremains higher than that of the general population.The risks are in part independent of BMD. Ingeneral, adjustment for BMD decreases the relativerisk by 10% to 20%.
Table 12 Risk of fracture at the sites shown according to the site of a prior fracture (adapted from Klotzbeucher et al [35])
Site of subsequent fracture
Distal forearm Spine Proximal humerusc Hip Pooled
Site of prior fracture RR 95% CI RR 95% CI RR 95% CI RR 95% CI RR 95% CI
Forearm 3 2.0-5.3 1.7 1.4-2.1 2.4 1.7-3.4 1.9 1.6-2.2 2 1.7-2.4
Spine 1.4 1.2-1.7 4.4 3.6-5.4 1.8 1.7-1.9 2.3 2.0-2.8 1.9 1.7-2.3
Humerusc 1.8 1.3-2.4 1.9 1.3-2.8 1.9 1.3-2.7 2 1.7-2.3 1.9 1.7-2.2
Hip 1.4 a 2.5 1.8-3.5 1.9 b 2.3 1.5-3.7 2.4 1.9-3.2
Pooled 1.9 1.3-2.8 2.0 1.6-2.4 1.9 1.6-2.2 2.0 1.9-2.2 2.0 1.8-2.1
aNo studies;bOne studycAssumed to be equivalent to a 'minor fracture' from the meta-analysis
Arch Osteoporos
(c) Genetics appear to play a large part in the determinationof bone mass and fracture risk. A family history offragility fractures is a significant risk factor that is largelyindependent of BMD [42]. A family history of hipfracture is a stronger risk factor than a family history ofother osteoporotic fractures and is independent of BMD.It is not known whether genetic factors govern themarked variation in fracture risk seen in different regionsof the world. The disease is more common in Caucasianand Asian populations, and the incidence of hip and spinefracture is lower in Africans than Caucasians [43].
(d) Smoking is a risk factor that is in part dependent onBMD. Smoking increases the risk for hip fracture by upto 1.5-fold [44]. As with alcohol, some of the riskassociated with smoking is due to decreased BMD andthis is particularly true in postmenopausal womenwhere smokers show a much more rapid decline inBMD than non-smokers [45]. Some of the riskassociated with smoking is also due to leanness orlow BMI.
(e) Glucocorticoids are an important cause of osteoporosis andfractures [46]. The fracture risk conferred by the use ofglucocorticoids is, however, not solely dependent uponbone loss and BMD independent risks have been identified.
(f) The relationship between alcohol intake and fracture riskis dose-dependent [47]. Where alcohol intake is onaverage two units or less daily there is no increase inrisk. Indeed, some studies suggest that BMD is higherand, by implication, that fracture risk may be reduced.Intakes of 3 or more units daily are associated with adose-dependent increase in risk.
(g) There are many secondary causes of osteoporosis (e.g.inflammatory bowel disease, endocrine disorders), butin most instances it is uncertain to what extent theincrease in fracture risk is dependent on low BMD orother risk factors such as the use of glucocorticoids. Bycontrast, rheumatoid arthritis causes a fracture riskindependently of BMD and the use of glucocorticoids[48].
(h) Most fractures occur after a fall. Whereas somestudies report that falls may be prevented by multi-dimensional interventions, the evidence that thesereduce the risk of fracture is plausible but not provenin meta-analysis [49, 50], with the possible exceptionof exercise interventions. There is also evidence thatvitamin D may decrease the risk of fracture bypreventing falls [51], but this is uncertain [49]. Otherstudies have suggested hip fracture risk was notsignificantly decreased in patients over the age of80 years given a bisphosphonate, the majority of
whom were purportedly selected on the basis of fallsrisk [52].
2.3.4 Biochemical assessment of fracture risk
Bone markers are increased after the menopause, and inseveral studies the rate of bone loss and fracture risk variesaccording to the marker value [53]. Thus, a potential clinicalapplication of biochemical indices of skeletal metabolism is inassessing fracture risk [54]. Some prospective studies haveshown an association of osteoporotic fracture with indices ofbone turnover independent of bone mineral density in womenat the time of the menopause and elderly women [8]. Atpresent, however, the biovariability and measurement varianceof bone turnover markers preclude their use in clinical practiceas a tool for fracture prediction in individual patients [55].
2.4 Integrating risk factors
Independent risk factors used with BMD can enhance thepredictive information provided by BMD alone [56]. Con-versely, some strong BMD-dependent risk factors can, inprinciple, be used for fracture risk assessment in the absenceof BMD tests. Thus the consideration of well-validated riskfactors, with or without BMD, is a very useful step inimproving the targeting of treatment and prevention strategiesto those at highest risk. Similar approaches are widely used inother disease areas including cardiovascular disease (e.g., theFramingham calculator) [57] and in the management ofprimary breast cancer (e.g., Adjuvant! Online, NottinghamPrognostic Index etc.).
Themultiplicity of these risk factors poses challenges in theunits of risk to be used. The T-score becomes of little value inthat different T-score thresholds for treatment would berequired for each combination of risk factors. Although theuse of relative risks is feasible, the metric of risk best suited forclinicians is the absolute risk (or probability) of fracture.
The probability of fracture depends upon age and lifeexpectancy as well as the current relative risk. In general,remaining lifetime risk of fracture decreases with ageespecially after the age of 70 years, since the risk of deathwith age outstrips the increasing incidence of fracturewith age. Estimates of lifetime probability are of value inconsidering the burden of osteoporosis in the community,and the effects of intervention strategies. For severalreasons they are less relevant for assessing risk ofindividuals in whom treatment might be envisaged [26].Thus, the International Osteoporosis Foundation (IOF)and the WHO recommend that risk of fracture should beexpressed as a short-term absolute risk, i.e. probability
Arch Osteoporos

over a ten year interval [58]. The period of 10-yearscovers the likely duration of treatment and the benefitsthat may continue once treatment is stopped.
The major advantage of using fracture probability is that itstandardizes the output from the multiple techniques and sitesused for assessment. The estimated probability will of coursedepend upon the performance characteristics (gradient of risk)provided by any technique at any one site. Moreover, it alsopermits the presence or absence of risk factors other thanBMD to be incorporated as a single metric. This is importantbecause, as mentioned, there are many risk factors that giveinformation over and above that provided by BMD and age.
The general relationship between relative risk and 10-year probability of hip fracture is shown in Fig. 10. Forexample, a woman at the age of 60 years has on average a10-year probability of hip fracture of 2.4%. In the presenceof a prior fragility fracture this risk is increased approxi-mately 2-fold and the probability increases to 4.8%.
Fig. 10 Ten-year probability of hip fracture in men and women fromSweden according to age and the risk (RR) relative to the averagepopulation. Probabilities are computed without the inclusion of BMD.(Data from [26])
0
Age 50 Age 60 Age 70 Age 80
10
20
30
40
50
60
1 2 3 4 1 2 3 4
10-y
ear
pro
bab
ility
of
hip
fra
ctu
re
Age 50 Age 60 Age 70 Age 80
Relative risk (RR)
Men Women
2.4.1 FRAX®
Algorithms that integrate the weight of CRFs for fracture risk,with or without information on BMD, have been developed bythe WHO Collaborating Centre for Metabolic Bone Diseases atSheffield, UK [56]. The risk factors used are given in Table 13.The FRAX tool (www.shef.ac.uk/FRAX) computes the 10-yearprobability of hip fracture or a major osteoporotic fracture. Amajor osteoporotic fracture is a clinical spine, hip, forearm andhumerus fracture. Probabilities can be computed for the indexcountries (including Australia, Austria, Argentina, Belgium,Canada, China, Colombia, Czech Republic, Finland, France,Germany, Hong Kong, Hungary, Italy, Japan, Jordan, SouthKorea, Lebanon, Malta, Mexico, Netherlands, New Zealand,Philippines, Poland, Romania, Singapore, Spain, Sweden,Switzerland, Taiwan, Tunisia, Turkey, the UK, and US). Where
a country is not represented (because of the lack ofepidemiological data) a surrogate may be chosen. In Fig. 11the ten year probability of a major osteoporotic fracture for a70-year old woman with previous fracture and BMI of 25 kg/m2 and no other risk factors according to FRAX for variouscountries is shown as an example.
Table 13 Clinical risk factors used for the assessment of fractureprobability [67]
• Age
• Sex
• Low body mass index
• Previous fragility fracture, particularly of the hip, wrist and spineincluding morphometric vertebral fracture
• Parental history of hip fracture
• History of fragility fracture
• Glucocorticoid treatment (≥5 mg prednisolone daily for 3months or more)
• Current smoking
• Alcohol intake 3 or more units daily
• Rheumatoid arthritis
• Other secondary causes of osteoporosis
- Untreated hypogonadism in men and women, e.g. prematuremenopause, bilateral oophorectomy or orchidectomy, anorexianervosa, chemotherapy for breast cancer, hypopituitarism
- Inflammatory bowel disease, e.g., Crohn’s disease and ulcerativecolitis. It should be noted that the risk is in part dependent on theuse of glucocorticoids, but an independent risk remainsafter adjustment for glucocorticoid exposure.
- Prolonged immobility, e.g., spinal cord injury, Parkinson’sdisease, stroke, muscular dystrophy, ankylosing spondylitis
- Organ transplantation
- Type I diabetes
- Thyroid disorders, e.g. untreated hyperthyroidism,over-treated hypothyroidism
- Chronic obstructive pulmonary disease
Fig. 11 Ten-year probability of a major osteoporotic fracture (%) for a70-year old woman with previous fracture and BMI of 25 kg/m2 andno other risk fractures according to FRAX in different Europeancountries
Ten-year probability (%)
0
5
10
15
20
25
30
Denm
ark
Sw
eden
Sw
itzerland
Austria
UK
Malta
Belgium
Italy
Germ
any
Hungary
Finland
Netherlands
France
Spain
Turkey
Arch Osteoporos

FRAX is also available on densitometers (Hologic, GELunar and DSM) and as an application on the i-Phone andi-Pad obtainable through the IOF (http://itunes.apple.com/us/app/frax/id370146412?mt=8). The FRAX pad allowspatients to input risk variables prior to medical consultationand is available from the IOF (www.iofbonehealth.org) inseveral languages. Where computer access is limited, papercharts can be downloaded that give fracture probabilities foreach index country (www.shef.ac.uk/FRAX ) according tothe number of CRFs. Hand held calculators are used inJapan and Poland.
Like any algorithm, FRAX has a number of limitations.These include:
a) Dose response of risk factors
Several of the CRFs identified take no account of dose-response, but rather represent an average dose orexposure. For example, there is good evidence that therisk associated with smoking [45], excess alcoholconsumption [47], and the use of glucocorticoids [59,60] increases with increasing exposure, as does thenumber of prior fractures [35, 38, 61]. Moreover, therisk of a second fracture is much higher immediatelyafter the first event, particularly during the first year aftera first fracture [39–41]. Ten-year probabilities willunderestimate, therefore, immediate fracture risk after afirst fracture, since the risk is integrated over the entire10-year interval. These limitations should be recognisedwhen interpreting the FRAX result in the clinic [62].
b) Other measurements of skeletal strength
At present the FRAX tool limits BMD to that measured atthe femoral neck, largely as a result of the wealth of dataavailable for this site. It has the advantage that for anygiven age and BMD, the fracture risk is approximately thesame in men and women. Because of this, the T-score isderived from a single reference standard (the NHANES IIIdatabase for female Caucasians aged 20–29 years) aswidely recommended [58]. There are, however, other bonemeasurements that provide information on fracture risk, butthe available information in the source cohorts was toosparse to provide a meta-analytic framework for the presentversion of FRAX. Other measurements may be incorporat-ed into risk assessment algorithms when they are moreadequately characterised.
c) Falls and other factors influencing fracture risk
The current version of FRAX does not incorporate fall-related risk factors, even though falls are known to be astrong risk factor [63–66]. It is therefore important toappreciate that fracture risk may be underestimated tosome extent in the presence of a falls history that ishigher than average for age. The concern that fracturerisk attributed to falls may not be amenable to anti-resorptive therapies such as bisphosphonates [52] is notsupported by more recent data [66], but further researchis required to clarify this.
Bearing these limitations in mind, FRAX is a wellvalidated tool that can be easily applied in clinical practiceand widens the access to the assessment of fracture risk.The application in clinical practice obviously demands aconsideration of the fracture probability at which tointervene, both for treatment (an intervention threshold)and for BMD testing (assessment thresholds). Probability-based intervention thresholds have been developed forEurope, but also for individual countries including Canada,Germany, Japan, Sweden, Switzerland, the UK and US[67–73].
The UK guidance for the identification of individuals athigh risk of fracture has been developed by the NationalOsteoporosis Guideline Group (NOGG) (www.shef.ac.uk/NOGG) and its potential application to other EU countriesis developed in subsequent chapters.
2.5 Treatment of osteoporosis and prevention of fracture
In recent years there have been significant advances in themanagement of osteoporosis, particularly with respect to thedevelopment of pharmacological interventions to reducefracture risk.
2.5.1 General management
General management includes the avoidance of modifi-able risk factors such as smoking and excessive alcoholintake. Assessment of the risk of falls and theirprevention is important in the elderly. An increasedlikelihood of falls can arise from numerous age- anddisease-related factors. Some of these factors, such as
Arch Osteoporos

short-sightedness or cataracts, may appear irrelevant butthere is good evidence that prompt treatment reducesfalls risk [74]. Other disease processes are more difficultto manage including, for example, dementia, strokes andother neurological diseases. Medications, especially seda-tives, can impair balance and are significant risk factors forfractures. Environmental factors that can precipitate a fallinclude slippery or uneven flooring, carpet edges and poor orinadequate footwear. Further, where possible, drugs thatinduce accelerated bone loss (Table 14) should be avoided orthe minimum effective dose titrated.
Table 14 Drugs that increase the risk of osteoporosis
Androgen deprivation therapy
Anticonvulsants
Aromatase inhibitors
Glucocorticoids
High dose thyroxine
Proton pump inhibitors
Selective serotonin reuptake inhibitors
Thiazolidenediones
Immobility is a strong risk factor for osteoporosis [75].Maintenance of mobility is therefore important. It is notknown what constitutes the optimal exercise programme tomaintain skeletal mass in health or disease but exercise canalso improve posture and balance to protect against bothfalls and fractures [76].
Correction of nutritional deficiencies, particularly ofcalcium, vitamin D and protein, are advised. Intakes ofat least 1000 mg/day of calcium, 800 IU of vitamin Dand of 1 g/kg body weight of protein are widelyrecommended [58, 77]. The use of calcium, vitamin Dand the combination as a therapeutic agent is discussedlater.
2.5.2 Major pharmacological interventions
Major pharmacological interventions are bisphospho-nates, strontium ranelate, raloxifene, denosumab andparathyroid hormone peptides. Interventions that areapproved for the prevention and treatment of osteopo-rosis in Europe are shown in Table 15. Most of theseare approved only for the treatment of postmenopausalosteoporosis. However, alendronate, etidronate, risedro-nate and zoledronic acid are also approved for the
prevention and treatment of glucocorticoid-inducedosteoporosis in Europe and alendronate, risedronate,zoledronic acid and teriparatide are approved for thetreatment of osteoporosis in men.
Table 15 Pharmacological interventions used in the prevention ofosteoporotic fractures
Intervention Year of marketapproval
Dosing regimen Route ofadministration
Alendronate 1995 70 mg once weeklyor 5 or 10 mgonce daily
Oral
Etidronate 1980 400 mg daily for2 weeks every3 months
Oral
Ibandronate a). 2005 150 mg oncemonthly
Oral
Ibandronate b). 2005 3 mg once every3 months
Intravenousinjection
Risedronate 2000 35 mg once weeklyor 5 mg once daily
Oral
Zoledronic acid 2005 5 mg once yearly Intravenousinfusion
Denosumab 2010 60 mg twice yearly Subcutaneousinjection
Raloxifene 1998 60 mg once daily Oral
Bazedoxifene 2009 20 mg once daily Oral
Strontiumranelate
2004 2 gm once daily Oral
Teriparatide 2003 20 μg once daily Subcutaneousinjection
Parathyroidhormone 1-84
2006 100 μg once daily Subcutaneousinjection
All these interventions have been shown to reducethe risk of vertebral fracture when given with calciumand vitamin D supplements. Some have been shown toalso reduce the risk of non-vertebral fractures, orspecifically hip fractures. Of the available options,alendronate, risedronate, zoledronic acid, denosumaband strontium ranelate have been demonstrated toreduce vertebral, non-vertebral and hip fractures [52,78–85] (Table 16). Because of this broader spectrum ofanti-fracture efficacy these agents are generally regardedas preferred options in the prevention of fractures inpostmenopausal women. This distinction is importantbecause once a fracture occurs, the risk of a subsequentfracture at any site is increased independent of BMD,and hence an intervention that covers all major fracturesites is preferable.
Arch Osteoporos

Table 16 Spectrum of anti-fracture efficacy of interventionsapproved in Europe [67]
Fracture outcome
Intervention Vertebral Non-vertebral Hip
Alendronate + + +
Ibandronate + +* NAE
Denosumab + + +
Risedronate + + +
Zoledronic acid + + +
Raloxifene + NAE NAE
Strontium ranelate + + +*
Teriparatide + + NAE
PTH (1–84) + NAE NAE
NAE: not adequately evaluated.
* In subsets of patients (post-hoc analysis)
PTH: recombinant human parathyroid hormone.
Since there have been no head-to-head studies withfracture as the primary outcome, direct comparison ofefficacy between agents is not possible. However, thereduction in vertebral fracture rate has generally beenbetween 50 and 70% whereas the magnitude of reductionin non-vertebral fracture, where demonstrated, has gen-erally been smaller and in the order of 15 to 25%.Details of the treatment effects assumed in this report aregiven in Chapter 6. This difference in effect on differentfracture outcomes is likely to reflect, at least in part, theimportance of falls in the pathogenesis of these fracturesbut may also result from differences in the effects of thevarious treatments on cortical and cancellous bone.
Reduction in fracture risk has been shown to occurwithin one year of treatment for bisphosphonates,strontium ranelate and denosumab. This is particularlyimportant in the case of vertebral fractures, since after anincident vertebral fracture there is a 20% risk of a furtherfracture occurring within the next 12 months, emphasiz-ing the importance of prompt treatment once a fracturehas occurred [39].
2.5.2.1 Bisphosphonates
Bisphosphonates are synthetic analogues of the naturallyoccurring compound pyrophosphate and inhibit boneresorption. Alendronate, risedronate, etidronate andibandronate are available as oral formulations (70 mgonce weekly, 35 mg once weekly, 400 mg daily and150 mg once monthly, respectively). Oral bisphospho-nates are generally well tolerated. Upper gastrointestinalside-effects may occur with nitrogen-containingbisphosphonates (alendronate, etidronate, risedronate
and ibandronate), particularly if the dosing regimen isnot adhered to. It is therefore important that patients takethe drug according to the instructions, namely in themorning with a full glass of water, 30–60 minutes beforefood, drink, or other medications, and remaining standingor sitting upright for that time. Compliance with thisdosing regimen is essential to maximise intestinalabsorption and prevent the occurrence of upper gastroin-testinal side-effects. Oral bisphosphonates are thereforenot suitable for very frail patients or those with cognitivedysfunction and are contraindicated in the presence ofsignificant oesophageal disease.
Ibandronate and zoledronic acid are available as intra-venous formulations. The former is given as a pushinjection over 15–30 seconds every 3 months, whereaszoledronic acid is administered as an intravenous infusionover 15 minutes at a dose of 5 mg once yearly. An acutephase reaction may occur, particularly with the firstinjection, resulting in flu-like symptoms. This is sometimessevere but is self-limiting and can be avoided or reduced inseverity by taking paracetamol on the day of the infusionand the subsequent 1–2 days.
Etidronate is generally considered to have the weakestevidence base of the bisphosphonates. It has been shownto reduce vertebral fractures over two years, but notsubsequently, with no significant effect on non-vertebralfractures [86].
Anti-fracture efficacy has not been directly shown forthe intravenous ibandronate formulation or for the150 mg once monthly regimen, but is assumed from abridging study based on BMD changes [87, 88].Zoledronic acid has been demonstrated to reduce verte-bral, non-vertebral and hip fractures in women withpostmenopausal osteoporosis and also reduces the incidenceof recurrent clinical fractures in patients who have suffered ahip fracture [83, 85].
However, there are potential concerns that long-termsuppression of bone turnover associated with treatmentmay eventually lead to adverse effects on bone strength.This remains largely a theoretical concern although therehave been recent reports of atypical stress fractures in thefemoral shaft or subtrochanteric region in patients onalendronate therapy; in some of these cases bonebiopsies have been done and have shown markedlysuppressed bone turnover [89–93]. However, it should bestressed that these fractures are extremely rare and easilyoutweighed overall by the beneficial effects of alendro-nate on fracture risk.
A potential side-effect of bisphosphonate therapy thathas received much attention is osteonecrosis of the jaw.Whilst it is likely that there is a causal association inpatients with malignant disease receiving high doses ofintravenous bisphosphonates, this remains unproven in
Arch Osteoporos

patients receiving the much lower doses of bisphosphonatesused for the treatment of osteoporosis [94]. Since many ofthe cases reported have been associated with dental disease,invasive dental treatment should be completed beforebisphosphonate therapy is started and where possible,avoided during treatment [95–97].
Recently, concerns have been raised about a possibleassociation between bisphosphonate therapy and atrialfibrillation following the report of a significant increase inrisk of serious atrial fibrillation in women treated withzoledronic acid in the HORIZON study. Subsequent studieshave produced conflicting results but have not excluded thepossibility of such an association and further investigationis warranted [98]. Finally, the possibility that bisphospho-nate therapy is associated with increased risk of oesopha-geal cancer has been raised. Two recent studies from theGeneral Practice Research Database in the UK haveproduced conflicting results, one failing to show anyassociation but another concluding that there was anincreased risk with 10 or more prescriptions for oralbisphosphonates and with prescriptions over about a fiveyear period [99, 100].
2.5.2.2 Denosumab
Denosumab is a fully humanised monoclonal antibody toreceptor activator of NFkB ligand (RANKL). RANKL is amajor regulator of osteoclast development and activity.Denosumab prevents the interaction of RANKL with itsreceptor RANK by binding to RANKL, resulting in rapidand profound inhibition of bone resorption [101]. It hasrecently been approved in Europe and the US. In the pivotalphase III trial in postmenopausal women with osteoporosis3 years treatment resulted in fracture reductions of 68%,20% and 40% for spine, non-vertebral and hip fractures,respectively [78]. The overall incidence of adverse eventswas similar in the treatment and placebo groups. Eczema,flatulence and cellulitis were more common in thedenosumab group compared with placebo (3.0%, 2.2%and 0.3% versus 1.7%, 1.4% and <0.1%, respectively).Osteonecrosis of the jaw has been rarely reported in womentreated for osteoporosis with denosumab.
Denosumab is administered as a subcutaneous injectionin a dose of 60 mg once every 6 months. This makes itideal for use in primary care and should encourage greateradherence to treatment than is seen with, for example, oralbisphosphonates.
2.5.2.3 Strontium ranelate
Strontium ranelate is composed of two atoms of stablestrontium with ranelic acid as a carrier. Its mechanism ofaction has not been fully defined. It has been proposed that
strontium ranelate both inhibits bone resorption andstimulates bone formation through the activation of thecalcium sensing receptor and the OPG/RANKL system[102–104]. The strength of bone may also be due to animprovement of the material or structural properties of bone[105, 106]. Its use is associated with a substantial increasein BMD in the spine and hip, although part of this increaseis due to incorporation of strontium into bone, which affectsthe accuracy of DXA [106].
Strontium ranelate has been shown to reduce vertebraland non-vertebral fractures in postmenopausal women withosteoporosis [80, 81]. In a post hoc analysis in olderwomen with low hip BMD, it was also shown to reduce hipfractures. It is taken as a single daily dose and is generallywell tolerated. There is a small increase in the frequency ofdiarrhoea, nausea and headache. There is also a smallincrease in the risk of venous thromboembolic disease (RR1.42 BMD 95% CI 1.02, 1.98) and very rarely, hypersensi-tivity reactions may occur [107].
2.5.2.4 Raloxifene
Raloxifene is a selective oestrogen receptor modulatorthat has oestrogenic (anti-resorptive) effects in theskeleton without the unwanted effects of oestrogen inthe breast and endometrium. It is taken orally as a singledaily dose. Reduction in vertebral, but not non-vertebralor hip fractures, has been demonstrated in postmeno-pausal women with osteoporosis [108]. Adverse effectsinclude leg oedema, leg cramps, hot flushes and a 2- to3-fold increase in the risk of venous thromboembolism.Its use is associated with a significant decrease in therisk of breast cancer but a small increase in the risk ofstroke [109].
2.5.2.5 Parathyroid hormone peptides
Teriparatide (recombinant human 1–34 parathyroid hor-mone peptide) and PTH (1–84) (recombinant human 1–84parathyroid hormone; PTH) are administered by subcuta-neous injection in daily doses of 20 μg and 100 μg,respectively. They have anabolic effects on bone, increasingbone formation and producing large increases in BMD inthe spine. Teriparatide has been shown to reduce bothvertebral and non-vertebral fractures in postmenopausalwomen with osteoporosis after a median treatment periodof 21 months, whereas reduction only in vertebralfractures was shown after 18 months treatment with PTH(1–84) [110, 111]. There are no data demonstrating areduction in hip fracture. Side-effects include nausea,headache and dizziness; in addition, transient hyper-calcaemia and hypercalciuria may occur, particularly withPTH. The treatment period is limited to 24 months. In
Arch Osteoporos

general, because of higher cost of these peptides,treatment is restricted to those with severe osteoporosiswho cannot tolerate or appear to be unresponsive to othertherapies.
2.5.2.6 Hormone replacement therapy (HRT)
Because the risk/benefit balance of HRT is generallyunfavourable in older postmenopausal women, it isregarded as a second-line treatment option. However, itis an appropriate option in younger postmenopausalwomen at high risk of fracture, who also have meno-pausal symptoms [112].
2.5.2.7 Calcium and vitamin D
Combined calcium and vitamin D supplements in a daily doseof 0.5-1.2 g and 400–800 IU, respectively, are generallyrecommended in patients receiving bone protective therapy,since most randomised controlled trial evidence for theefficacy of interventions is based on co-administration of theagent with calcium and vitamin D supplements. Effects ofcalcium and/or vitamin D as monotherapy are consideredbelow.
CalciumCalcium supplements produce modest increases in BMDand may reduce fractures by a small amount [113]. Arecent meta-analysis concluded that calcium supplementswithout co-administered vitamin D increased the risk ofmyocardial infarction by around 30% [114]. However, itshould be noted that cardiovascular outcomes were notprimary end points in any of the studies included in themeta-analysis and data on cardiovascular events were notcollected in a systematic manner.
Vitamin DVitamin D has been shown to reduce bone loss in olderwomen and in a meta-analysis was found to reduce non-vertebral fractures when given in doses between 400and 800 IU/day [115]. There is some evidence thatfracture reduction is seen only when calcium supple-ments are co-administered with the vitamin D [116]. Areduction in falls has also been reported in a recentmeta-analysis, vitamin D in a dose of 700–1000 IU/dayreducing the risk of falling among older individuals by19% [117]. However, two studies of high doses ofvitamin D given annually have demonstrated an
increased risk of hip fracture and, in one study, alsoof falls [118, 119].
2.5.3 Vertebroplasty and balloon kyphoplasty
Vertebroplasty and balloon kyphoplasty are options for themanagement of acute vertebral fractures [120]. Vertebro-plasty consists of the transpedicular placement of bonecement into fractured vertebral bodies, whereas in balloonkyphoplasty a balloon is introduced into the fracturedvertebra and inflated to restore vertebral height. Subse-quently, the balloon is deflated and the space created isfilled with bone cement. Both approaches have been shownto reduce pain and improve functional ability significantlywhen compared to non-surgical management in patientswith acute symptomatic vertebral fractures [121–123].Balloon kyphoplasty appears to be superior to vertebro-plasty with respect to restoration of vertebral height andreduction of spinal deformity, although the clinical andfunctional significance of the relatively small differencesremain to be established.
In the majority of studies, these procedures werecompared to non-surgical management. However, in tworecent randomized controlled studies, vertebroplasty wascompared to a placebo procedure in which the variousstages of vertebroplasty were mimicked but withoutinjection of cement. Neither of these studies was able todemonstrate a beneficial effect of vertebroplasty overplacebo on pain, functional ability or quality of life [124,125]. The follow-up period of these studies was relativelyshort (1 month and 6 months respectively) and it is possiblethat the long-acting local anaesthetic injected in the placebogroup might have provided some pain relief in the placebogroup. No placebo-controlled trials have been conductedfor balloon kyphoplasty.
In a recent meta-analysis, vertebroplasty was found tohave a higher rate of procedure-related complicationsthan balloon kyphoplasty and a higher rate of cementleakage, which may sometimes result in neurologicalsymptoms [124]. A potential concern for both proceduresis that the risk of compression fractures in vertebraeadjacent to the operated vertebra might be increased andfurther long-term studies are required to address thisissue. The results of studies so far reported indicate asimilar incidence of new vertebral fractures in womenwho have undergone balloon kyphoplasty or vertebro-plasty when compared to non-surgical management butlonger term data are required.
Arch Osteoporos
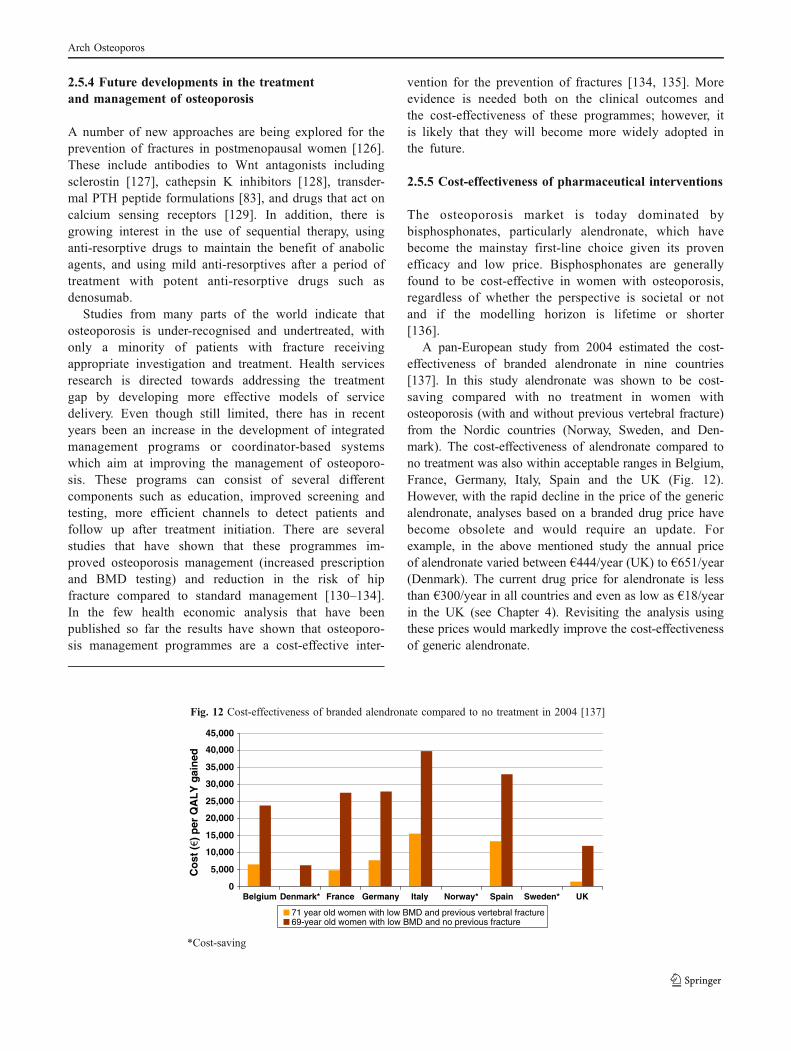
2.5.4 Future developments in the treatmentand management of osteoporosis
A number of new approaches are being explored for theprevention of fractures in postmenopausal women [126].These include antibodies to Wnt antagonists includingsclerostin [127], cathepsin K inhibitors [128], transder-mal PTH peptide formulations [83], and drugs that act oncalcium sensing receptors [129]. In addition, there isgrowing interest in the use of sequential therapy, usinganti-resorptive drugs to maintain the benefit of anabolicagents, and using mild anti-resorptives after a period oftreatment with potent anti-resorptive drugs such asdenosumab.
Studies from many parts of the world indicate thatosteoporosis is under-recognised and undertreated, withonly a minority of patients with fracture receivingappropriate investigation and treatment. Health servicesresearch is directed towards addressing the treatmentgap by developing more effective models of servicedelivery. Even though still limited, there has in recentyears been an increase in the development of integratedmanagement programs or coordinator-based systemswhich aim at improving the management of osteoporo-sis. These programs can consist of several differentcomponents such as education, improved screening andtesting, more efficient channels to detect patients andfollow up after treatment initiation. There are severalstudies that have shown that these programmes im-proved osteoporosis management (increased prescriptionand BMD testing) and reduction in the risk of hipfracture compared to standard management [130–134].In the few health economic analysis that have beenpublished so far the results have shown that osteoporo-sis management programmes are a cost-effective inter-
vention for the prevention of fractures [134, 135]. Moreevidence is needed both on the clinical outcomes andthe cost-effectiveness of these programmes; however, itis likely that they will become more widely adopted inthe future.
2.5.5 Cost-effectiveness of pharmaceutical interventions
The osteoporosis market is today dominated bybisphosphonates, particularly alendronate, which havebecome the mainstay first-line choice given its provenefficacy and low price. Bisphosphonates are generallyfound to be cost-effective in women with osteoporosis,regardless of whether the perspective is societal or notand if the modelling horizon is lifetime or shorter[136].
A pan-European study from 2004 estimated the cost-effectiveness of branded alendronate in nine countries[137]. In this study alendronate was shown to be cost-saving compared with no treatment in women withosteoporosis (with and without previous vertebral fracture)from the Nordic countries (Norway, Sweden, and Den-mark). The cost-effectiveness of alendronate compared tono treatment was also within acceptable ranges in Belgium,France, Germany, Italy, Spain and the UK (Fig. 12).However, with the rapid decline in the price of the genericalendronate, analyses based on a branded drug price havebecome obsolete and would require an update. Forexample, in the above mentioned study the annual priceof alendronate varied between €444/year (UK) to €651/year(Denmark). The current drug price for alendronate is lessthan €300/year in all countries and even as low as €18/yearin the UK (see Chapter 4). Revisiting the analysis usingthese prices would markedly improve the cost-effectivenessof generic alendronate.
Fig. 12 Cost-effectiveness of branded alendronate compared to no treatment in 2004 [137]
0
5,000
10,000
15,000
20,000
25,000
30,000
35,000
40,000
45,000
Belgium Denmark* France Germany Italy Norway* Spain Sweden* UK
Co
st (
) p
er Q
AL
Y g
ain
ed
71 year old women with low BMD and previous vertebral fracture69-year old women with low BMD and no previous fracture
*Cost-saving
Arch Osteoporos

In a more recent study from 2008 [138], the cost-effectiveness of alendronate compared with no treatmentusing a generic price in the UK was assessed by using theFRAX algorithm for fracture risk estimation. Alendronate wasin this analysis priced at £95/year and could be consideredcost-effective in most age and risk groups (Table 17).
Table 17 Cost-effectiveness of alendronate (cost (£000)/QALY gained)in UK women with CRFs according to age and T-score for femoralneck BMD [138]
T-score (SD)
Age 0 -1 -2 -3
Prior fracture
50 18.1 15.7 9.9 3.2
60 18.4 15.6 10.5 2.6
70 9.0 6.5 3.2 c.s.
80 13.9 7.3 2.3 c.s.
Family history
50 16.3 14.7 11.1 5.9
60 15.7 14 10.4 5.9
70 9 6 1.8 c.s.
80 5.1 c.s. c.s. c.s.
Glucocorticoids
50 23.3 19.5 13.3 4.6
60 22.3 19.0 12.6 3.1
70 10.6 7.5 2.9 c.s.
80 15.0 6.4 c.s. c.s.
Rheumatoid arthritis
50 21.1 22.6 15.4 6.2
60 25.1 21.1 14.4 6.3
70 11.5 8.4 4.4 c.s.
80 15.7 7.8 1.9 c.s.
Alcohol (>3 units/day)
50 28.5 24.3 16.2 6
60 27.1 22.7 15 6.1
70 12.6 8.9 4.4 c.s.
80 16.1 7.6 1.2 c.s.
Current smoking
50 37.6 31.7 19.9 6.6
60 37.7 31.1 19.5 6.7
70 18.5 13.1 5.6 c.s.
80 25.8 12.0 0.2 c.s.
c.s. = cost-saving
The cost-effectiveness of a range of treatments has alsobeen evaluated in women with a BMD value meeting orexceeding the threshold of osteoporosis. As seen in Table 18the cost-effectiveness of alendronate compared with notreatment was better than for the alternatives. This is mainlydriven by the drug price rather than because of differencesin efficacy between treatments. Thus, the study supports theview that alendronate should be considered as a first lineintervention, at least in a UK setting. Nevertheless, cost-effective scenarios were found for treatments other than
alendronate, providing credible alternative options forpatients unable to take alendronate. Similar conclusionshave also been reached in separate studies for most secondline treatments [77, 136, 139–146]. There are differences,however, in the spectrum of efficacy of these alternativesacross different fracture sites that will determine theirsuitability in the clinical management of individuals.
Table 18 Cost-per QALY gained (£) of various drugs compared to notreatment in women aged 70 years in the UK [138]
T-score = −2.5 SD No BMD
Intervention No priorfracture
Priorfracture
Priorfracture
Alendronate 3,714 867 2,119
Etidronate 12,869 10,098 9,093
Ibandronate daily 20,956 14,617 14,694
Ibandronate intermittent 31,154 21,587 21,745
Raloxifene 11,184 10,379 10,808
Raloxifene without breast cancer 34,011 23,544 23,755
Risedronate 18,271 12,659 13,853
Strontium ranelate 25,677 18,332 19,221
Strontium ranelate, post-hoc analysis 18,628 13,077 13,673
When considering the body of published evidence, fractureprevention with alendronate in women at elevated risk offracture older than 50 years is cost-effective in most westerncountries. Cost-effectiveness improves further in patients withadditional risk factors. Fracture risk at a given T-score issimilar in men and women [147], the effectiveness ofintervention in men is broadly similar to that in women atequivalent risk [148], and the cost and disutility of fractures issimilar in men and women [149, 150]. For these reasons thecost-effectiveness of treating men will broadly be the same asfor women at a given absolute risk of fracture.
2.5.6 Adherence, compliance and persistence
There is a wide variety of definitions for adherence in theliterature. The term compliance is widely used, but it hasbeen argued that the term implies “obedience to doctors”and that it should be termed in a way that also includes theactive choice of the patient [151]. In line with this view, anumber of alternative terms have been proposed: adherence[152], patient cooperation [153], therapeutic alliance [154]or concordance [155], referring to the agreement betweenpatient and physician. For the purpose of this report theterms compliance and persistence were used to define thefollowing of dosing instructions and the time on treatment,respectively. The term adherence was used as a general termencompassing both of these concepts.
Arch Osteoporos

Whilst clinical trials remain the gold standard formeasuring fracture reduction, the high internal validityrequired to demonstrate efficacy comes at the expense ofexternal validity. The results of such trials may thereforegeneralize poorly to clinical practice [156, 154] since thebenefits obtained in practice might fall short of theanticipated benefits indicated by clinical trials. Table 19summarizes the evidence on persistence for the bisphosph-
onates from the placebo-controlled studies identified in asystematic review by Lloyd-Jones and Wilkinson [158] ofrandomised clinical trials (RCTs) which report fractureoutcomes in postmenopausal or steroid induced osteoporo-sis. It is clear, however, that even in randomised trials,persistence with therapy declines over time. Thus, anyreduced effectiveness caused by sub-optimal adherence isto some extent already captured in clinical trials.
Table 19 RCTs reporting persistence: percentage of patients in bisphosphonate group still taking bisphosphonate therapy
Study Year 1 Year 2 Year 3 Year 4 Year 5 Year 6
Daily alendronate for postmenopausal osteoporosis
AOPS [159] 89 72 70
Bone 2000 [160] NR 74
EPIC Study [161] NR NR NR NR NR 50
Fracture Intervention Trial: women with pre-existing fractures [162] NR NR 89
Fracture Intervention Trial: women without pre-existing fractures [163] NR NR NR 81
Liberman 1995 [164] 92 89 84
Lindsay 1999 [165] 95
Pols 1999 [166] 88
Rossini 1994 [167] 100
Cyclical etidronate for postmenopausal osteoporosis
Herd 1997 [168] NR 85
Meunier [169] NR 89
Montessori [170] NR NR 87
Pouilles 1997 [171] NR 83
Storm [172] NR NR 61
Watts 1990 [173] NR 83
Cyclical etidronate for steroid-induced osteoporosis
Adachi 1997 [174] 82
Cortet 1999 [175] 98
Geusens 1998 [176] NR 72
Jenkins 1999 [177] 87
Pitt 1998 [178] NR 85
Roux 1998 [179] 88
Daily risedronate for postmenopausal osteoporosis
Brown (5 mg dose) [180] 84
Clemmesen 1997 (2.5 mg dose) [181] NR 66
Fogelman 2000 (5 mg dose) [182] NR 78
Harris 1999 (5 mg dose) [84] NR NR 60
McClung 2001 (2.5 or 5 mg dose) [55] NR NR 51
Mortensen 1998 (5 mg dose) [183] 86 46
Reginster 2000 (5 mg dose) [184] 82 NR 62
Weekly risedronate 35 mg for postmenopausal osteoporosis
Brown [180] 81
Daily risedronate for steroid-induced osteoporosis
Cohen 1999 (5 mg dose) [185] 82
NR = not reported
Arch Osteoporos

The methods available for measuring adherence areusually broken down into direct and indirect methods ofmeasurement. Each method has advantages and disad-vantages, and no method is considered the gold standard[186, 187]. Examples of direct methods of measures ofadherence include directly observed therapy, measure-ment of concentrations of a drug or its metabolite inblood or urine, and detection or measurement in blood ofa biological marker added to the drug formulation.Indirect methods of measurement of adherence includeasking the patient how easy it was to take the prescribedmedication, performing pill counts, ascertaining rates ofrefilling prescriptions, collecting patient questionnaires,using medication event monitoring systems or asking thepatient to keep a medication diary [188].
Because osteoporosis is an asymptomatic diseasewhere only a fraction of the treated patients will sustaina fracture, large samples of patients are needed to detectdifferences in fracture rates between patients with highand low adherence to medication. Therefore, much of thedata presented concerning adherence with anti-fracturemedication is based on claims data or data describingfilled prescriptions [189–193]. These databases oftenproduce two types of adherence estimates:
1) Persistence, defined as the proportion of patients that ata certain time point still fill prescriptions without a gapin refills longer than an allowed period of time (e.g.,30, 60, or 90 days).
2) Compliance, defined as medication possession ratio(MPR). MPR is usually defined as the number of daysof medication available to the patient, divided by thenumber of days of observation. Estimates of MPRshould be interpreted with caution since its meaningdiffers with the definition of days of observation. MPRmeasures only the frequency and length of refill gaps ifthe observation time is defined to be the same as apatient’s total time on treatment [193]. If days ofobservation is a predefined time period (e.g.,24 months) [190] MPR becomes a composite estimateof persistence and compliance. Although the MPRprovides insight into the availability of medication, itdoes not provide information on the timeliness andconsistency of refilling. An MPR > 80% is often usedas a threshold for high adherence, where improvedclinical outcomes can be observed [190, 194, 195].However, this threshold originates from a bloodpressure control study [196] and has been criticised
for being arbitrary when extrapolated to other diseases[197].
Compliance and persistence with treatment for osteo-porosis in clinical practice are poor; approximately 50%of patients do not follow their prescribed treatmentregimen and/or discontinue treatment within one year[198]. Poor adherence has been shown to be associatedwith reduced anti-fracture efficacy when expressed bothas MPR [190] and as persistence [193, 199]. Fig. 13shows an analysis from the Swedish Adherence RegisterAnalysis (SARA) study depicting the relation betweentime on treatment and fracture risk in 37,394 bisphosph-onate-treated patients observed for 36 months [193]. Thequantum of effect may be overestimated since patientswho fail to comply with placebo have poorer healthoutcomes than compliant patients [200, 201]. In thecontext of osteoporosis, fracture risks have been reportedto be higher and BMD lower in non-persistent patientstaking a placebo compared with persistent patients in theplacebo wing of an intervention study [202].
Fig. 13 Relative risk (RR) of 2-year fracture incidence (reference:<1 month of treatment) [202]
0.0
0.2
0.4
0.6
0.8
1.0
1.2
<1 month 1 month to 1 year 1 to 2 years 2 to 3 years
Time on Treatment (out of 3 years)
Rel
ativ
e R
isk
of
Fra
ctu
re
0.00
0.02
0.04
0.06
0.08
0.10
0.12
0.14
Th
ree-
Yea
r F
ract
ure
Inci
den
ce
Reference
Patient education and nurse-led monitoring early inthe course of treatment have been shown to improvecompliance [203]. Whether monitoring by measurementof biochemical markers of bone turnover or BMDprovides additional benefits has not been established[14, 15, 204]. The determinants of low persistence andcompliance to treatment are not well understood. Re-search suggests that several factors are important,including dosing requirements and frequency, adverseevents, the patient-physician relationship, and patientinability to detect improvements in an asymptomaticdisease [197, 205–208]. Retrospective studies indicatethat weekly dosing regimens are associated with better
Arch Osteoporos

persistence than daily regimens [208]. New treatmentshave quarterly (i.v. ibandronate), 6-monthly (denosumab),or annual (zoledronic acid) dosing. Theoretically, thistype of administration should have potential to improveadherence. However, to what extent increased use ofthese drugs will improve adherence and lead to fewerfractures in clinical practice is currently not known. Thiswill be an important issue to address in future studieswhen sufficient real world data become available.
2.5.6.1 Cost-effectiveness and adherence
Health economic modelling of anti-fracture therapies is athoroughly researched area, and many publications on thetopic are available. However, adherence is seldom included inthe cost-effectiveness models. Poor adherence is commonlybelieved to have little impact on cost-effectiveness in clinicalpractice, since poor adherence affects cost as well as out-comes. Also of relevance is that with poor adherence fewerpatients will be properly treated, and thus fewer fracturesprevented, which is the principal goal of treatment. Cost-effectiveness analysis is also important in this context sincefuture improvements in fracture prevention may come notonly from more efficacious treatments but also throughimproved drug delivery and adherence [209]. Thus the prices,costs, and cost-effectiveness of these new alternatives need tobe compared with the present alternatives in clinical practice.
From a health economic perspective, high adherence isparticularly important when treating high-risk populations.Cost-effectiveness of treatments that potentially confer high
adherence is sensitive to assumptions regarding the relationbetween adherence and residual effect after stoppingtreatment and drug-effect reductions from poor compliance.
Modelling studies of denosumab (6-monthly dosing)[143] and zoledronic acid (12-mothly dosing) [210]have indicated that improving treatment adherence islikely to be cost-effective. The health benefits ofimproved adherence are often partially offset by in-creased intervention costs that are associated with theimproved drug-taking behaviour. Nonetheless, adherenceis likely to be associated with added value for thehealth-care system because more fractures will beavoided [209, 211].
To summarise, adherence to osteoporosis treatment issub-optimal and associated with reduced anti-fractureeffectiveness in clinical practice. The treatment gap in themanagement of osteoporosis in Europe is partly caused byinsufficient case finding, but also in part by sub-optimaltreatment adherence. Besides improved case finding,improved adherence to treatment would increase treatmentpenetration in high-risk populations and would likely beassociated with improved outcomes in clinical practice.
2.6 National guidelines and reimbursement policiesfor the management of osteoporosis in EU5
Recommendations from national guidelines from France,Germany, Italy, Spain and the UK are summarized belowand in Table 20. Guidelines for Sweden are currently beingredrafted [70].
Table 20 Summary of the main features of guidelines in EU5
Country Date Scope Risk assessment Population-basedscreening
Criteria fortreatment
Economicanalysislinked
Reference
France 2006Updated 2008
Postmenopausalwomen, menand GIOP
BMD, age, previousfracture, CRFs
No Vertebral or hip fracture +T-score ≤−1 or BMD≤−2.5 + CRFs orT-score ≤−3
No AFSSAPS, 2006[212]
Germany 2006Updated 2009
Postmenopausalwomen, men
BMD, age, previousfracture, CRFs
Women aged over70 and men agedover 80 years*
Vertebral fracture +T-score ≤−2 or 10-yearprobability >30%
No DVO, 2006 & 2011[213, 214]
Italy 2009 Postmenopausalwomen, menand GIOP
BMD, age, previousfracture, CRFs
Women agedover 65 years*
Not explicitly stated No Adami et al,2009 [215]
Spain 2008 Postmenopausalwomen, menand GIOP
BMD, age, previousfracture, CRFs
No Not explicitly stated No González Macíaset al, 2008 [216]
UK (NICE) 2008Updated 2011
Postmenopausalwomen withosteoporosis
BMD, age, previousfracture, other CRFs
No Women aged >75 with afragility fracture.Women aged <75 yearsmust have T-score≤−2.5 or lower
Yes NICE, 2008 & 2011[217] [218] [219]
UK (NOGG) 2008 Postmenopausal women,older men, GIOP
FRAX No Age-dependent 10-yearfracture probability
Yes Compston et al, 2009 [67]
GIOP - glucocorticoid-induced osteoporosis
CRF – clinical risk factor
BMD – bone mineral density
* DXA recommended but no official screening programme
Arch Osteoporos
2.6.1 French guidelines
French national guidelines issued in 2006 address theprevention of fractures in postmenopausal women, men, andmen and women taking oral glucocorticoids [212]. A case-finding approach is used; bone densitometry being recom-mended in individuals with risk factors for fracture. Criteriafor pharmacological intervention are based on previousfracture history, T-scores, and CRFs. In individuals without aprevious history of fracture, a BMD T-score of ≤−2.5 SD withother risk factors or a BMD T-score of ≤−3 SD are regarded asan indication for treatment. In those with a history of fracture,treatment is recommended in individuals with a T-score ≤−2.5SD, or in the case of vertebral or hip fractures, a T-score ≤−1SD. Alendronate, risedronate and strontium ranelate are firstline options, with raloxifene, etidronate, ibandronate andparathyroid hormone peptides as alternative options. Inpatients taking oral glucocorticoids (≥7.5 mg daily for at least3 months) treatment is recommended in all postmenopausalwomen with a history of fracture. In the absence of a previousfracture, treatment is recommended in individuals with aBMD T-score of ≤−1.5 SD.
An update in 2008–9 includes a discussion of FRAX butdoes not explicitly recommend its use, nor are treatmentrecommendations based on 10-year fracture probabilityalthough, as in the previous version, the utility of CRFs infracture risk assessment is recognised. An update of theguidelines, scheduled in 2010–2011, will include newtreatments (zoledronic acid and denosumab), provide aconsensus on the potential role of FRAX or other algorithmsincorporating risk factors for fracture risk prediction, andprovide guidance on monitoring of therapy and optimalduration of treatment. This update will be produced by theFrench Society of Rheumatology and Groupe de Recherche etd'Informations sur les Ostéoporoses (GRIO).
DXA is reimbursed for men and women with a fragilityfracture, those taking oral glucocorticoids at a dose of ≥7.5 mgdaily for 3 months or longer, and for patients with some formsof secondary osteoporosis. Additionally, in postmenopausalwomen, reimbursement is available for those with a parentalhistory of hip fracture, a BMI ≤19 kg/m2, menopause beforethe age of 40 years and past use of glucocorticoids (≥7.5 mg/day prednisolone for 3 months or more). Treatment isreimbursed in men and women with fragility fracture,postmenopausal women with a BMD T-score ≤−3 SD or inthose with a BMD T-score ≤−2.5 SD plus at least two otherrisk factors (age ≥60 years, current glucocorticoid therapy,parental hip fracture or menopause before age 40 years).
2.6.2 German guidelines
German national guidelines issued in 2006 and subsequent-ly updated in 2010 address the prevention, diagnosis and
therapy of osteoporosis in adult women and men [213,214]. Assessment of BMD using DXA is recommended inwomen aged ≥70 years and men aged ≥80 years. In womenyounger than 70 years and men younger than 80 years acase-finding approach using fracture ± CRFs is used toselect individuals for diagnostic assessment.
Treatment is recommended in individuals with a singlemoderate or severe vertebral fracture or more than onevertebral fracture if the BMD T-score is <−2 SD, and inindividuals with an estimated 10-year fracture probability ofvertebral or hip fracture of ≥30% (equivalent to a 15% 10-yearprobability for major osteoporotic fractures) and a BMD T-score of ≤−2 SD. A table containing T-scores that on averagecorrespond to a 30% fracture probability in men and women atdifferent ages is provided, with the caveat that these thresholdsmay be lowered in the presence of CRFs.
No first-line treatment options are explicitly recommended;however, it is stated that alendronate, oestrogen, ibandronate,risedronate, strontium ranelate and teriparatide have all beenshown to reduce non-vertebral fracture in postmenopausalwomen (hip fracture is not considered separately). Alendro-nate, risedronate, teriparatide and zoledronic acid are men-tioned as possible treatments for men.
Reimbursement for DXA is currently restricted topatients with a fragility fracture. There are no formalrestrictions concerning treatment reimbursement, but inpractice limited budgets for medications may make physi-cians reluctant to prescribe treatment. In many districtsphysicians are obliged to prescribe generic alendronate for acertain percentage of patients.
2.6.3 Italian guidelines
Italian guidelines for the diagnosis, prevention and treat-ment of osteoporosis were published in 2009 [215].Postmenopausal women, men, and individuals takingglucocorticoids are included in the scope of the guidelines.Bone densitometry is recommended in all women above65 years of age, whereas in younger postmenopausalwomen and in men bone densitometry is recommendedonly in those with CRFs. The guidelines recognise FRAXas a tool for estimating fracture probability but provide analternative algorithm for estimating 10-year probability ofhip fracture and of clinical fracture. They suggest thatpharmacological intervention should be reserved for thosein whom the risk of fracture is “rather high” but do notspecify intervention thresholds. In the context of preven-tion, the guidelines state that use of pharmacological agentsin individuals with a BMD T-score ≥−2.5 SD is usually notjustified.
First-line and second-line therapeutic options are notexplicitly stated but the wider spectrum of anti-fractureefficacy across spine, non-vertebral sites and hip of alendro-
Arch Osteoporos

nate, risedronate, zoledronic acid, HRTand strontium ranelate,is acknowledged as compared to other interventions.
Criteria for reimbursement of treatment with bisphosph-onates, strontium ranelate and raloxifene are a previous hipfracture, previous moderate or severe vertebral fracture,glucocorticoid therapy ≥5 mg daily prednisolone orequivalent for ≥3 months, hip BMD T-score ≤−4.0 SD, orhip BMD T-score ≤−3.0 SD plus at least one other riskfactor (wrist fracture, low dose glucocorticoid therapy,rheumatoid arthritis, early menopause, low body weight,or family history of fracture).
2.6.4 Spanish guidelines
Spanish national guidelines were published in 2008 [216].They cover postmenopausal women, men and glucocorti-coid-treated individuals and recommend a case-findingapproach to select individuals for bone densitometry, basedon the presence of CRFs. Reference is made to FRAX butits use in estimating fracture probability is not explicitlyrecommended, although the use of CRFs to improvefracture risk prediction is discussed.
Alendronate and risedronate are recommended as first-line agents, although teriparatide is also considered a first-line agent in patients with more than two vertebralfractures. Alendronate and risedronate are also recommen-ded as first-line agents in men and individuals takingglucocorticoids. Intervention thresholds for individualsother than those with vertebral or hip fracture are notdefined.
Reimbursement is unrestricted for both DXA andtreatment, although the accessibility of DXA in parts ofthe country is poor.
2.6.5 UK guidelines
The National Institute of Health and Clinical Excellence(NICE) issued guidance for the primary and secondaryprevention of osteoporotic fractures in postmenopausalwomen in October 2008. This was amended, althoughwithout significant change, in January 2011 as a result ofa High Court Appeal that ruled against NICE [217, 218].NICE has recently issued separate guidance for the useof denosumab in postmenopausal women [219]. A case-finding approach is used to identify women at risk offracture and, although the FRAX risk factors are used inthe economic model, intervention thresholds are notexpressed as 10-year fracture probability but rather acombination of BMD, age and selected CRFs. Womenaged over 75 years with a fragility fracture may betreated without BMD measurement with alendronate, butyounger postmenopausal women with one or more
fractures may only receive treatment if the BMD T-scoreis −2.5 SD or lower. Women who cannot toleratealendronate have to satisfy more stringent disease criteria(based on BMD and CRFs) or become older beforereceiving other treatments. For women who have not hada fracture, a T-score of ≤−2.5 SD is a necessary pre-requisite for treatment except in those aged 75 years ormore who have two or more CRFs. Again, morestringent treatment thresholds are stipulated for womenwho cannot tolerate oral alendronate. The NICE apprais-als have been subject to much criticism [220].
In 2008, NOGG developed guidelines for osteoporosisto address the omission from NICE guidance of glucocor-ticoid-induced osteoporosis, men with osteoporosis, newerinterventions such as ibandronate, zoledronic acid anddenosumab, and women with a T-score ≥−2.5 SD [67].NOGG recommends a case-finding approach incorporatingFRAX, with or without BMD. Intervention thresholds areage-specific and based on the risk of subsequent fracture ina woman presenting with an incident fragility fracture,irrespective of BMD. Alendronate is the recommendedfirst-line option, but other treatments (excepting PTHpeptides) are all regarded as second-line options and donot require more stringent disease criteria as in the NICEguidance.
In the National Health Service, access to DXA andtreatment is determined primarily by NICE guidance andboth are free of charge provided that the criteria set out inthe guidance are satisfied.
In all the guidelines some case-finding approach issuggested for patient identification. However, they are allvarying in terms of what risk factors to acknowledge, howthe fracture risk should be assessed and how BMDmeasurements should be used. In all countries age, BMDand prior fragility fracture is recognised as important riskfactors. Different variations of intervention thresholdsdefined as absolute fracture risk is used in Germany, Italyand the UK (NOGG guidelines). The FRAX tool isconsidered but not specifically incorporated in the sug-gested case-finding recommendations in the French, Italianand Spanish guidelines. In the UK NICE guidelines, FRAXrisk factors are used in the cost-effectiveness analysis butare not used for determining intervention thresholds. TheUK NOGG guidelines suggest a case-finding approachbased on FRAX-estimated intervention thresholds.
It is only in the UK guidelines that alendronate is the solerecommended first-line option. In the other countries otherdrugs are also considered as first line treatments. This isbecause the UK guidelines have also considered the cost-effectiveness of the treatments when developing the guide-lines and the price of alendronate is particularly low in the UK.The guidelines in the other countries have mainly considered
Arch Osteoporos
the clinical profiles of the drugs when defining the treatmentline.
2.6.6 Compliance to guidelines
The Prospective Observational Study Investigating Bone LossExperience in Europe (POSSIBLE EU) is a longitudinal, non-interventional cohort study with the objective to examine theuse of osteoporosis medications in EU5 [221]. The POSSI-BLE EU included 3,402 women that either were receiving orstarting osteoporosis treatment. Information regarding demo-graphics, bone diagnosis (e.g. DXA), risk factors, co-morbid-ities and concomitant medication was collected at baseline.Patients were followed up after one year. The data collected inPOSSIBLE EU provide interesting information on howosteoporosis treatment is managed in clinical practice. Ananalysis of the baseline data showed that only 52% of allpatients had been evaluated by DXA and 68% of thesepatients had osteoporosis and 32% osteopenia. 25% of allpatients had no DXA and no prevalent fractures. There werealso large variations between countries, for example theproportion of patients that had osteoporosis (T-score <−2.5SD), a prior fracture and/or glucocorticoid therapy was 55% inSpain and 83% in the UK.
These are interesting findings because they imply thatosteoporosis is managed somewhat differently in clinicalpractice compared to national guidelines. It seems that eventhough not specifically acknowledged and recommended inseveral of the guidelines, physicians in clinical practice doconsider other risk factors such as parental fracture,smoking and alcohol use in the treatment decision.However, it also seems that guidelines have an impact inclinical practice. For example, the UK which has morerestricted recommendations (i.e., the NICE guidelines) alsohave a notable higher proportion of patients that fall under amore classical definition of osteoporosis and high risk offracture based on BMD and prior fracture.
References
1. Kanis JA, Gluer CC (2000) An update on the diagnosisand assessment of osteoporosis with densitometry.Osteoporos Int 11: 192–202
2. World Health Organization (1994) Assessment of fracturerisk and its application to screening for postmenopausalosteoporosis. Technical Report Series 843, Geneva
3. Genant HK, Lang TF, Engelke K et al (1996) Advancesin the noninvasive assessment of bone density, quality,and structure. Calcif Tissue Int 59: S10-5
4. Marshall D, Johnell O, Wedel H (1996) Meta-analysis ofhow well measures of bone mineral density predict
occurrence of osteoporotic fractures. Br Med J 312:1254–9
5. McCloskey EV, Vasireddy S, Threlkeld J et al (2008)Vertebral fracture assessment (VFA) with a densitometerpredicts future fractures in elderly women unselectedfor osteoporosis. J Bone Miner Res 23: 1561–8
6. Schousboe JT, Debold CR (2006) Reliability andaccuracy of vertebral fracture assessment with densi-tometry compared to radiography in clinical practice.Osteoporos Int 17: 281–9
7. Gluer CC (1997) Quantitative ultrasound techniquesfor the assessment of osteoporosis: expert agreementon current status. The International QuantitativeUltrasound Consensus Group. J Bone Miner Res12: 1280–8
8. Johnell O, Odén A, De Laet C, Garnero P, Delmas PD,Kanis JA (2002) Biochemical indices of bone turnoverand the assessment of fracture probability. OsteoporosInt 13: 523–6
9. Kanis JA, Melton LJ 3rd, Christiansen C, Johnston CC,Khaltaev N (1994) The diagnosis of osteoporosis. JBone Miner Res 9: 1137–41
10. Kanis JA, McCloskey EV, Johansson H, Oden A,Melton LJ 3rd, Khaltaev N (2008) A reference standardfor the description of osteoporosis. Bone 42: 467–75
11. Looker AC, Wahner HW, Dunn WL et al (1998)Updated data on proximal femur bone mineral levelsof US adults. Osteoporos Int 8: 468–89
12. Johnell O, Kanis JA, Oden A, et al (2005) Predictivevalue of BMD for hip and other fractures. J Bone MinerRes 20: 1185–94
13. Kanis JA, Johnell O, Oden A, Jonsson B, De Laet C,Dawson A (2000) Risk of hip fracture according to theWorld Health Organization criteria for osteopenia andosteoporosis. Bone 27: 585–90
14. Compston J (2009) Monitoring bone mineral densityduring antiresorptive treatment for osteoporosis. BMJ338: b1276
15. Bell KJ, Hayen A, Macaskill P et al (2009) Value ofroutine monitoring of bone mineral density afterstarting bisphosphonate treatment: secondary analysisof trial data. BMJ 338: b2266
16. Watts NB, Lewiecki EM, Bonnick SL et al (2009)Clinical value of monitoring BMD in patients treatedwith bisphosphonates for osteoporosis. J Bone MinerRes 24: 1643–6
17. Kanis JA, Johnell O (2005) Requirements for DXA forthe management of osteoporosis in Europe. OsteoporosInt 16: 229–38
18. Compston JE (2004) Action Plan for the prevention ofosteoporotic fractures in the European Community.Osteoporos Int 15: 259–62
Arch Osteoporos

19. International Osteoporosis Foundation (2008) Osteopo-rosis in the European Union in 2008. 10 years of progressand on-going challenges. http://www.iofbonehealth.org/publications/eu-policy-report-of-2008.html Accessed 23May 2011
20. Kanis JA (2011) Personal communication, data on file.21. Nguyen T, Sambrook P, Kelly P et al (1993) Prediction
of osteoporotic fractures by postural instability andbone density. BMJ 307: 1111–5
22. Langsetmo L, Goltzman D, Kovacs CS et al (2009)Repeat low-trauma fractures occur frequently amongmen and women who have osteopenic BMD. J BoneMiner Res 24: 1515–22
23. Schuit SC, van der Klift M, Weel AE et al (2004)Fracture incidence and association with bone mineraldensity in elderly men and women: the RotterdamStudy. Bone 34: 195–202
24. Stone KL, Seeley DG, Lui LY et al (2003) BMD atmultiple sites and risk of fracture of multiple types:long-term results from the Study of OsteoporoticFractures. J Bone Miner Res 18: 1947–54
25. Siris ES, Brenneman SK, Miller PD et al (2004)Predictive value of low BMD for 1-year fractureoutcomes is similar for postmenopausal women ages50–64 and 65 and oder: results from the NationalOsteoporosis Risk Assessment (NORA). J Bone MinerRes 19: 1215–20
26. Kanis JA, Johnell O, Oden A, De Laet C, Jonsson B,Dawson A (2002) Ten-year risk of osteoporotic fractureand the effect of risk factors on screening strategies.Bone 30: 251–8
27. Sambrook P, Cooper C (2006) Osteoporosis. Lancet367: 2010–8
28. Hui SL, Slemenda CW, Johnston CC Jr (1988) Age andbone mass as predictors of fracture in a prospectivestudy. J Clin Invest 81: 1804–9
29. Cummings SR, Nevitt MC, Browner WS et al (1995)Risk factors for hip fracture in white women. Study ofOsteoporotic Fractures Research Group. N Engl J Med332: 767–73
30. Poór G, Atkinson EJ, O'Fallon WM, Melton LJ 3rd(1995) Predictors of hip fractures in elderly men. JBone Miner Res 10: 1900–7
31. Kanis JA (2002) Diagnosis of osteoporosis andassessment of fracture risk. Lancet 359: 1929–36
32. Kanis JA on behalf of the World Health OrganizationScientific Group (2007) Assessment of osteoporosisat the primary health-care level. Technical Report.WHO Collaborating Centre, University of Sheffield,UK
33. Kanis JA, Borgstrom F, De Laet C et al (2005)Assessment of fracture risk. Osteoporos Int 16: 581–9
34. De Laet C, Kanis JA, Odén A et al (2005) Body massindex as a predictor of fracture risk: a meta-analysis.Osteoporos Int 16: 1330–8
35. Klotzbuecher CM, Ross PD, Landsman PB, Abbott TA3rd, Berger M (2000) Patients with prior fractures havean increased risk of future fractures: a summary of theliterature and statistical synthesis. J Bone Miner Res 15:721–39
36. Kanis JA, Johnell O, De Laet C et al (2004) A meta-analysis of previous fracture and subsequent fracturerisk. Bone 35: 375–82
37. Kotowicz MA, Melton LJ 3rd, Cooper C, Atkinson EJ,O'Fallon WM, Riggs BL (1994) Risk of hip fracture inwomen with vertebral fracture. J Bone Miner Res 9:599–605
38. Lunt M, O'Neill TW, Felsenberg D et al (2003)Characteristics of a prevalent vertebral deformitypredict subsequent vertebral fracture: results from theEuropean Prospective Osteoporosis Study (EPOS).Bone 33: 505–13
39. Lindsay R, Silverman SL, Cooper C et al (2001) Riskof new vertebral fracture in the year following afracture. JAMA 285: 320–3
40. Johnell O, Oden A, Caulin F, Kanis JA (2001) Acuteand long-term increase in fracture risk after hospitali-zation for vertebral fracture. Osteoporos Int 12: 207–14
41. Johnell O, Kanis JA, Odén A (2004) Fracture riskfollowing an osteoporotic fracture. Osteoporos Int 15:175–9
42. Kanis JA, Johansson H, Oden A (2004) A familyhistory of fracture and fracture risk: a meta-analysis.Bone 35: 1029–37
43. Kanis JA on behalf of the World Health OrganizationScientific Group (2007) Assessment of osteoporosis atthe primary health care level. Technical report. WorldHealth Organization Collaborating Centre for MetabolicBone Diseases, University of Sheffield, UK
44. Kanis JA, Johnell O, Oden A et al (2005) Smoking andfracture risk: a meta-analysis. Osteoporos Int 16: 155–62
45. Law MR, Hackshaw AK (1997) A meta-analysis ofcigarette smoking, bone mineral density and risk ofhip fracture: recognition of a major effect. BMJ 315:841–6
46. van Staa TP, Leufkens HG, Cooper C (2002) Theepidemiology of corticosteroid-induced osteoporosis: ameta-analysis. Osteoporos Int 13: 777–87
47. Kanis JA, Johansson H, Johnell O et al (2005) Alcoholintake as a risk factor for fracture. Osteoporos Int 16:737–42
48. Orstavik RE, Haugeberg G, Mowinckel P et al (2004)Vertebral deformities in rheumatoid arthritis: a compar-
Arch Osteoporos

ison with population-based controls. Arch Intern Med164: 420–5
49. Gillespie LD, Robertson MC, Gillespie WJ et al (2009)Interventions for preventing falls in older people livingin the community. Cochrane Database Syst Rev 2:CD007146
50. Cameron ID, Murray GR, Gillespie LD et al (2010)Interventions for preventing falls in older people innursing care facilities and hospitals. Cochrane DatabaseSyst Rev 1: CD005465
51. Bischoff-Ferrari HA, Dawson-Hughes B, Willett WC etal (2004) Effect of Vitamin D on falls: a meta-analysis.JAMA 291: 1999–2006
52. McClung MR, Geusens P, Miller PD et al (2001) Effectof risedronate on the risk of hip fracture in elderlywomen. Hip Intervention Program Study Group. NEngl J Med 344: 333–40
53. Szulc P, Delmas PD (2008) Biochemical markers ofbone turnover: potential use in the investigation andmanagement of postmenopausal osteoporosis. Osteo-poros Int 19: 1683–704
54. Garnero P, Hausherr E, Chapuy MC et al (1996)Markers of bone resorption predict hip fracture inelderly women: the EPIDOS Prospective Study. J BoneMiner Res 11: 1531–8
55. Glover SJ, Eastell R, McCloskey EV et al (2009)Rapid and robust response of biochemical markers ofbone formation to teriparatide therapy. Bone 45:1053–8
56. Kanis JA, Oden A, Johnell O et al (2007) The use ofclinical risk factors enhances the performance of BMDin the prediction of hip and osteoporotic fractures inmen and women. Osteoporos Int 18: 1033–46
57. Dyslipidaemia Advisory Group on behalf of thescientific committee of the National Heart Foundationof New Zealand (1996) National Heart Foundationclinical guidelines for the assessment and managementof dyslipidaemia. N Z Med J 109: 224–31
58. Kanis JA, Black D, Cooper C et al (2002) A newapproach to the development of assessment guidelinesfor osteoporosis. Osteoporos Int 13: 527–36
59. van Staa TP, Leufkens HG, Abenhaim L, Begaud B,Zhang B, Cooper C (2000) Use of oral corticosteroidsin the United Kingdom. QJM 93: 105–11
60. van Staa TP, Leufkens HG, Abenhaim L, Zhang B,Cooper C (2000) Oral corticosteroids and fracture risk:relationship to daily and cumulative doses. Rheuma-tology (Oxford) 39: 1383–9
61. Delmas PD, Genant HK, Crans GG et al (2003)Severity of prevalent vertebral fractures and the riskof subsequent vertebral and nonvertebral fractures:results from the MORE trial. Bone 33: 522–32
62. Kanis JA, Hans D, Cooper C et al (2011) Interpretationand use of FRAX in clinical practice. Osteoporos Int, Inpress
63. Wainwright SA, Marshall LM, Ensrud KE et al (2005)Hip fracture in women without osteoporosis. J ClinEndocrinol Metab 90: 2787–93
64.Porthouse J, Birks YF, Torgerson DJ, Cockayne S, PufferS, Watt I (2004) Risk factors for fracture in a UKpopulation: a prospective cohort study. QJM 97: 569–74
65. Roy DK, Pye SR, Lunt M et al (2002) Falls explainbetween-center differences in the incidence of limbfracture across Europe. Bone 31: 712–7
66. Kayan K, Johansson H, Oden A et al (2009) Can fallrisk be incorporated into fracture risk assessmentalgorithms: a pilot study of responsiveness to clodro-nate. Osteoporos Int 20: 2055–61
67. Compston JE, Cooper A, Cooper C et al (2009)Guidelines for the diagnosis and management ofosteoporosis in postmenopausal women and men fromthe age of 50 years in the UK. Maturitas 62: 105–8
68. MacLean C, Newberry S, Maglione M et al (2008)Systematic review: comparative effectiveness of treat-ments to prevent fractures in men and women with lowbone density or osteoporosis. Ann Intern Med 148:197–213
69. Papaioannou A, Morin S, Cheung AM et al (2010)Clinical practice guidelines for the diagnosis andmanagement of osteoporosis in Canada: summary.CMAJ 182: 1864–73
70. Socialstyrelsen (2010) Nationella riktlinjer för rörel-seorganens sjukdomar 2010 – stöd för styrning ochledning. Preliminär version. http://www.socialstyrelsen.se/publikationer2010/2010-11-15 Accessed 24 May2011
71. Association Suisse contre l‘Ostéoporose (2010) Ostéopor-ose: Recommandations ASCO 2010. http://www.svgo.ch/content/inhalt_frz/index.htm Accessed 24 May 2011
72. Dawson-Hughes B, Tosteson AN, Melton LJ 3rd et al(2008) Implications of absolute fracture risk assessmentfor osteoporosis practice guidelines in the USA.Osteoporos Int 19: 449–58
73. Kanis JA, Burlet N, Cooper C et al (2008) Europeanguidance for the diagnosis and management of osteo-porosis in postmenopausal women. Osteoporos Int 19:399–428
74. Harwood RH, Foss AJ, Osborn F, Gregson RM, ZamanA, Masud T (2005) Falls and health status in elderlywomen following first eye cataract surgery: a rando-mised controlled trial. Br J Ophthalmol 89: 53–9
75. Cooper C, Wickham C, Coggon D (1990) Sedentarywork in middle life and fracture of the proximal femur.Br J Ind Med 47: 69–70
Arch Osteoporos

76. Sherrington C, Whitney JC, Lord SR, Herbert RD,Cumming RG, Close JC (2008) Effective exercise forthe prevention of falls: a systematic review and meta-analysis. J Am Geriatr Soc 56: 2234–43
77. Borgström F, Carlsson A, Sintonen H et al (2006) Thecost-effectiveness of risedronate in the treatment ofosteoporosis: an international perspective. OsteoporosInt 17: 996–1007
78. Cummings SR, San Martin J, McClung MR et al (2009)Denosumab for prevention of fractures in postmeno -pausal women with osteoporosis. N Engl J Med 361:756–65
79. Delmas PD (2008) Clinical potential of RANKLinhibition for the management of postmenopausalosteoporosis and other metabolic bone diseases. J ClinDensitom 11: 325–38
80. Meunier PJ, Roux C, Ortolani S et al (2004) The effectsof strontium ranelate on the risk of vertebral fracture inwomen with postmenopausal osteoporosis. N Engl JMed 350: 459–68
81. Reginster JY, Seeman E, de Vernejoul MC et al (2005)Strontium ranelate reduces the risk of nonvertebralfractures in postmenopausal women with osteoporosis:treatment of peripheral osteoporosis (TROPOS) study. JClin Endocrinol Metab 90: 2816–22
82. Black DM, Cummings SR, Karpf DB et al (1996)Randomised trial of effect of alendronate on risk offracture in women with existing vertebral fractures.Fracture Intervention Trial Research Group. Lancet348: 1535–41
83. Black DM, Delmas PD, Eastell R et al (2007) Once-yearly zoledronic acid for treatment of postmenopausalosteoporosis. N Engl J Med 356: 1809–22
84. Harris ST, Watts NB, Genant HK et al (1999) Effects ofrisedronate treatment on vertebral and nonvertebralfractures in women with postmenopausal osteoporosis:a randomized controlled trial. Vertebral Efficacy withRisedronate Therapy (VERT) study group. JAMA 282:1344–52
85. Colón-Emeric CS, Sloane R, Hawkes WG et al (2000)The risk of subsequent fractures in community-dwelling men and male veterans with hip fracture.Am J Med 109: 324–6
86. McCloskey E, Selby P, Davies M et al (2004)Clodronate reduces vertebral fracture risk in womenwith postmenopausal or secondary osteoporosis: resultsof a double-blind, placebo-controlled 3-year study. JBone Miner Res 19: 728–36
87. Chesnut III CH, Skag A, Christiansen C et al (2004)Effects of oral ibandronate administered daily orintermittently on fracture risk in postmenopausalosteoporosis. J Bone Miner Res 19: 1241–9
88. Delmas PD, Adami S, Strugala C et al (2006)Intravenous ibandronate injections in postmenopausalwomen with osteoporosis: one-year results from thedosing intravenous administration study. ArthritisRheum 54: 1838–46
89. Odvina CV, Zerwekh JE, Rao DS, Maalouf N,Gottschalk FA, Pak CY (2005) Severely suppressedbone turnover: a potential complication of alendronatetherapy. J Clin Endocrinol Metab 90: 1294–301
90. Neviaser AS, Lane JM, Lenart BA, Edobor-Osula F,Lorich DG (2008) Low-energy femoral shaft fracturesassociated with alendronate use. J Orthop Trauma 22:346–50
91. Lenart BA, Neviaser AS, Lyman S et al (2009)Association of low-energy femoral fractures withprolonged bisphosphonate use: a case control study.Osteoporos Int 20: 1353–62
92. Abrahamsen B, Eiken P, Eastell R (2009) Subtrochan-teric and diaphyseal femur fractures in patients treatedwith alendronate: a register-based national cohortstudy. J Bone Miner Res 24: 1095–102
93. Compston JE (2010) Bisphosphonates and atypicalfemoral fractures: a time for reflection. Maturitas 65:3–4
94. Khan AA, Sándor GK, Dore E et al (2009)Bisphosphonate associated osteonecrosis of the jaw. JRheumatol 36: 478–90
95. Khan A (2010) Osteonecrosis of the jaw andbisphosphonates. BMJ 340: c246
96. Silverman SL, Landesberg R (2009) Osteonecrosis ofthe jaw and the role of bisphosphonates: a criticalreview. Am J Med 122: S33-45
97. Almazrooa SA, Woo SB (2009) Bisphosphonate andnonbisphosphonate-associated osteonecrosis of thejaw: a review. J Am Dent Assoc 140: 864–75
98. Pazianas M, Compston J, Huang CL (2010) Atrialfibrillation and bisphosphonate therapy. J Bone MinerRes 25: 2–10
99. Cardwell CR, Abnet CC, Cantwell MM, Murray LJ(2010) Exposure to oral bisphosphonates and risk ofesophageal cancer. JAMA 304: 657–63
100. Green J, Czanner G, Reeves G, Watson J, Wise L,Beral V (2010) Oral bisphosphonates and risk ofcancer of oesophagus, stomach, and colorectum: case-control analysis within a UK primary care cohort.BMJ 341: c4444
101. Hofbauer LC, Schoppet M (2004) Clinical impli-cations of the osteoprotegerin/RANKL/RANK sys-tem for bone and vascular diseases. JAMA 292:490–5
102. Chattopadhyay N, Quinn SJ, Kifor O, Ye C, BrownEM (2007) The calcium-sensing receptor (CaR) is
Arch Osteoporos

involved in strontium ranelate-induced osteoblastproliferation. Biochem Pharmacol 74: 438–47
103. Watts NB, Nolan JC, Brennan JJ, Yang HM (2000)Esterified estrogen therapy in postmenopausal women.Relationships of bone marker changes and plasmaestradiol to BMD changes: a two-year study. Meno-pause 7: 375–82
104. Hurtel-Lemaire AS, Mentaverri R, Caudrillier A et al(2009) The calcium-sensing receptor is involved instrontium ranelate-induced osteoclast apoptosis. Newinsights into the associated signaling pathways. J BiolChem 284: 575–84
105. Ammann P, Badoud I, Barraud S et al (2007)Strontium ranelate treatment improves trabecular andcortical intrinsic bone tissue quality, a determinant ofbone strength. J Bone Miner Res 22: 1419–25
106. Frost ML, Blake GM, Fogelman I (2001) Quantitativeultrasound and bone mineral density are equallystrongly associated with risk factors for osteoporosis.J Bone Miner Res 16: 406–16
107. Stevenson M, Davis S, Lloyd-Jones M, Beverley C(2007) The clinical effectiveness and cost-effective-ness of strontium ranelate for the prevention ofosteoporotic fragility fractures in postmenopausalwomen. Health Technol Assess 11: 1–134
108. Ettinger B, Black DM, Mitlak BH et al (1999)Reduction of vertebral fracture risk in postmenopausalwomen with osteoporosis treated with raloxifene:results from a 3-year randomized clinical trial. Multi-ple Outcomes of Raloxifene Evaluation (MORE)Investigators. JAMA 282: 637–45
109. Barrett-Connor E, Mosca L, Collins P et al (2006)Effects of raloxifene on cardiovascular events andbreast cancer in postmenopausal women. N Engl JMed 355: 125–37
110. Neer RM, Arnaud CD, Zanchetta JR et al (2001)Effect of parathyroid hormone (1–34) on fractures andbone mineral density in postmenopausal women withosteoporosis. N Engl J Med 344: 1434–41
111. Greenspan SL, Bone HG, Ettinger MP et al (2007)Effect of recombinant human parathyroid hormone (1–84) on vertebral fracture and bone mineral density inpostmenopausal women with osteoporosis: a random-ized trial. Ann Intern Med 146: 326–39
112. Vandenbroucke JP (2009) The HRT controversy:observational studies and RCTs fall in line. Lancet373: 1233–5
113. Fribourg D, Tang C, Sra P, Delamarter R, Bae H (2004)Incidence of subsequent vertebral fracture after kypho-plasty. Spine 29: 2270–6
114. Bolland MJ, Grey A (2010) Disparate outcomesfrom applying U.K. and U.S. osteoporosis treat-
ment guidelines. J Clin Endocrinol Metab 95:1856–60
115. Bischoff-Ferrari HA, Willett WC, Wong JB, GiovannucciE, Dietrich T, Dawson-Hughes B (2005) Fractureprevention with vitamin D supplementation: a meta-analysis of randomized controlled trials. JAMA 293:2257–64
116. Boonen S, Lips P, Bouillon R, Bischoff-Ferrari HA,Vanderschueren D, Haentjens P (2007) Need foradditional calcium to reduce the risk of hip fracturewith vitamin d supplementation: evidence from acomparative metaanalysis of randomized controlledtrials. J Clin Endocrinol Metab 92: 1415–23
117. Bischoff-Ferrari HA, Dawson-Hughes B, StaehelinHB et al (2009) Fall prevention with supplementaland active forms of vitamin D: a meta-analysis ofrandomised controlled trials. BMJ 339: b3692
118. Smith H, Anderson F, Raphael H, Maslin P, Crozier S,Cooper C (2007) Effect of annual intramuscularvitamin D on fracture risk in elderly men andwomen – a population-based, randomized, double-blind, placebo-controlled trial. Rheumatology (Ox-ford) 46: 1852–7
119. Sanders KM, Stuart AL, Williamson EJ et al (2010)Annual high-dose oral vitamin D and falls andfractures in older women: a randomized controlledtrial. JAMA 303: 1815–22
120. Boonen S, Wahl DA, Nauroy L et al (2011) Balloonkyphoplasty and vertebroplasty in the management ofvertebral compression fractures. Osteoporos Int.doi:10.1007/s00198-011-1639-5
121. Taylor RS, Taylor RJ, Fritzell P (2006) Balloonkyphoplasty and vertebroplasty for vertebral com-pression fractures: a comparative systematic reviewof efficacy and safety. Spine 31: 2747–55
122. Wardlaw D, Cummings SR, Van Meirhaeghe J et al(2009) Efficacy and safety of balloon kyphoplastycompared with non-surgical care for vertebral com-pression fracture (FREE): a randomised controlledtrial. Lancet 373: 1016–24
123. Bouza C, López T, Magro A, Navalpotro L, AmateJM (2006) Efficacy and safety of balloon kypho-plasty in the treatment of vertebral compressionfractures: a systematic review. Eur Spine J 15:1050–67
124. Buchbinder R, Osborne RH, Ebeling PR et al (2009)A randomized trial of vertebroplasty for painfulosteoporotic vertebral fractures. N Engl J Med 361:557–68
125. Kallmes DF, Comstock BA, Heagerty PJ et al (2009)A randomized trial of vertebroplasty for osteoporoticspinal fractures. N Engl J Med 361: 569–79
Arch Osteoporos
126. Canalis E (2010) New treatment modalities inosteoporosis. Endocr Pract 16: 855–63
127. Hoeppner LH, Secreto FJ, Westendorf JJ (2009) Wntsignaling as a therapeutic target for bone diseases.Expert Opin Ther Targets 13: 485–96
128. Stoch SA, Zajic S, Stone J et al (2009) Effect of thecathepsin K inhibitor odanacatib on bone resorptionbiomarkers in healthy postmenopausal women: twodouble-blind, randomized, placebo-controlled phase Istudies. Clin Pharmacol Ther 86: 175–82
129. Kumar S, Matheny CJ, Hoffman SJ et al (2010) Anorally active calcium-sensing receptor antagonist thattransiently increases plasma concentrations of PTHand stimulates bone formation. Bone 46: 534–42
130. Majumdar SR, Beaupre LA, Harley CH et al (2007)Use of a case manager to improve osteoporosistreatment after hip fracture: results of a randomizedcontrolled trial. Arch Intern Med 167: 2110–5
131. Davis JC, Guy P, Ashe MC, Liu-Ambrose T, Khan K(2007) HipWatch: osteoporosis investigation andtreatment after a hip fracture: a 6-month randomizedcontrolled trial. J Gerontol A Biol Sci Med Sci 62:888–91
132. Majumdar SR, Johnson JA, McAlister FA et al (2008)Multifaceted intervention to improve diagnosis andtreatment of osteoporosis in patients with recent wristfracture: a randomized controlled trial. CMAJ 178:569–75
133. Gardner MJ, Flik KR, Mooar P, Lane JM (2002)Improvement in the undertreatment of osteoporosisfollowing hip fracture. J Bone Joint Surg Am 84-A:1342–8
134. Dell RM, Greene D, Anderson D, Williams K (2009)Osteoporosis disease management: What every ortho-paedic surgeon should know. J Bone Joint Surg Am91: 79–86
135. Majumdar SR, Lier DA, Rowe BH et al (2010) Cost-effectiveness of a multifaceted intervention to improvequality of osteoporosis care after wrist fracture.Osteoporos Int 22: 1799–808
136. Zethraeus N, Borgström F, Ström O et al (2007) Cost-effectiveness of the treatment and prevention ofosteoporosis – a review of the literature and areference model. Osteoporos Int 18: 9–23
137. Ström O, Borgström F, Sen SS et al (2007) Cost-effectiveness of alendronate in the treatment ofpostmenopausal women in 9 European countries –an economic evaluation based on the fracture inter-vention trial. Osteoporos Int 18: 1047–61
138. Kanis JA, Adams J, Borgström F et al (2008) Thecost-effectiveness of alendronate in the managementof osteoporosis. Bone 42: 4–15
139. Fleurence RL, Iglesias CP, Johnson JM (2007) Thecost effectiveness of bisphosphonates for the pre-vention and treatment of osteoporosis: a structuredreview of the literature. Pharmacoeconomics 25:913–33
140. Borgström F, Johnell O, Kanis JA, Oden A, Sykes D,Jönsson B (2004) Cost effectiveness of raloxifene inthe treatment of osteoporosis in Sweden: an economicevaluation based on the MORE study. Pharmacoeco-nomics 22: 1153–65
141. Borgström F, Jönsson B, Ström O, Kanis JA (2006)An economic evaluation of strontium ranelate in thetreatment of osteoporosis in a Swedish setting: Basedon the results of the SOTI and TROPOS trials.Osteoporos Int 17: 1781–93
142. Borgström F, Ström O, Kleman M et al (2010) Cost-effectiveness of bazedoxifene incorporating theFRAX(R) algorithm in a European perspective.Osteoporos Int 22: 955–65
143. Jönsson B, Ström O, Eisman JA et al (2010) Cost-effectiveness of Denosumab for the treatment ofpostmenopausal osteoporosis. Osteoporos Int 22:967–82
144. Kanis JA, Borgstrom F, Johnell O, Jonsson B(2004) Cost-effectiveness of risedronate for thetreatment of osteoporosis and prevention offractures in postmenopausal women. OsteoporosInt 15: 862–71
145. Hiligsmann M, Vanoverberghe M, Neuprez A,Bruyère O, Reginster JY (2010) Cost-effectivenessof strontium ranelate for the prevention and treat-ment of osteoporosis. Expert Rev PharmacoeconOutcomes Res 10: 359–66
146. Hiligsmann M, Reginster JY (2010) Potentialcost-effectiveness of denosumab for the treatment ofpostmenopausal osteoporotic women. Bone 47: 34–40
147. Kanis JA (2008) Assessment of osteoporosis at theprimary health-care level. Technical Report. WHOCollaborating Centre, University of Sheffield, UK
148. Kanis JA, McCloskey EV, Johansson H, Oden A,Ström O, Borgström F (2010) Development anduse of FRAX in osteoporosis. Osteoporos Int 21:S407-13
149. Borgström F, Zethraeus N, Johnell O et al (2006)Costs and quality of life associated with osteoporosis-related fractures in Sweden. Osteoporos Int 17: 637–50
150. Ström O, Borgstrom F, Zethraeus N et al (2008)Long-term cost and effect on quality of life ofosteoporosis-related fractures in Sweden. ActaOrthop 79: 269–80
Arch Osteoporos
151. Donovan JL (1995) Patient decision making. Themissing ingredient in compliance research. Int JTechnol Assess Health Care 11: 443–55
152. Lutfey KE, Wishner WJ (1999) Beyond "compliance"is "adherence". Improving the prospect of diabetescare. Diabetes Care 22: 635–9
153. Henneman EA, Lee JL, Cohen JI (1995) Collaboration:a concept analysis. J Adv Nurs 21: 103–9
154. Madden BP (1990) The hybrid model for conceptdevelopment: its value for the study of therapeuticalliance. ANS Adv Nurs Sci 12: 75–87
155. Mullen PD (1997) Compliance becomes concor-dance. BMJ 314: 691–2
156. Fayers PM, Hand DJ (1997) Generalisation fromphase III clinical trials: survival, quality of life, andhealth economics. Lancet 350: 1025–7
157. Simon G, Wagner E, Vonkorff M (1995) Cost-effectiveness comparisons using "real world"
randomized trials: the case of new antidepressant drugs.J Clin Epidemiol 48: 363–73
158. Jones ML, Wilkinson A (2006) Adverse effects andpersistence with therapy in patients taking oralalendronate, etidronate or residronate: systematicreviews (NICE). The University of Sheffield, Schoolof Health and Related Research http://www.nice.org.uk/guidance/index.jsp?action=download&o=36718Accessed 24 May 2011
159. McClung M, Clemmesen B, Daifotis A et al (1998)Alendronate prevents postmenopausal bone loss inwomen without osteoporosis. A double-blind, ran-domized, controlled trial. Alendronate OsteoporosisPrevention Study Group. Ann Intern Med 128: 253–61
160. Bone HG, Greenspan SL, McKeever C et al (2000)Alendronate and estrogen effects in postmenopausalwomen with low bone mineral density. Alendronate/Estrogen Study Group. J Clin Endocrinol Metab 85:720–6
161. Ravn P, Bidstrup M, Wasnich RD et al (1999)Alendronate and estrogen-progestin in the long-termprevention of bone loss: four-year results from theearly postmenopausal intervention cohort study. Arandomized, controlled trial. Ann Intern Med 131:935–42
162. Black DM, Cummings SR, Karpf DB et al (1996)Randomised trial of effect of alendronate on risk offracture in women with existing vertebral fractures.Fracture Intervention Trial Research Group. Lancet348: 1535–41
163. Cummings SR, Black DM, Thompson DE et al (1998)Effect of alendronate on risk of fracture in womenwith low bone density but without vertebral fractures:
results from the Fracture Intervention Trial. JAMA280: 2077–82
164. Liberman UA, Weiss SR, Bröll J et al (1995) Effect oforal alendronate on bone mineral density and theincidence of fractures in postmenopausal osteoporo-sis. The Alendronate Phase III Osteoporosis Treat-ment Study Group. N Engl J Med 333: 1437–43
165. Genant HK, Cooper C, Poor G et al (1999) Interimreport and recommendations of the World HealthOrganization Task-Force for Osteoporosis. OsteoporosInt 10: 259–64
166. De Laet CE, van Hout BA, Burger H,Weel AE, HofmanA, Pols HA (1999) Incremental cost of medical careafter hip fracture and first vertebral fracture: theRotterdam study. Osteoporos Int 10: 66–72
167. Pedrazzoni M, Girasole G, Bertoldo F et al (2003)Definition of a population-specific DXA referencestandard in Italian women: the Densitometric ItalianNormative Study (DINS). Osteoporos Int 14: 978–82
168. Herd RJ, Balena R, Blake GM, Ryan PJ, Fogelman I(1997) The prevention of early postmenopausal boneloss by cyclical etidronate therapy: a 2-year, double-blind, placebo-controlled study. Am J Med 103: 92–9
169. Meunier PJ, Confavreux E, Tupinon I, Hardouin C,Delmas PD, Balena R (1997) Prevention of earlypostmenopausal bone loss with cyclical etidronatetherapy (a double-blind, placebo-controlled study and1-year follow-up). J Clin EndocrinolMetab 82: 2784–91
170. Montessori ML, Scheele WH, Netelenbos JC, KerkhoffJF, Bakker K (1997) The use of etidronate and calciumversus calcium alone in the treatment of postmenopausalosteopenia: results of three years of treatment. Osteo-poros Int 7: 52–8
171. Pouilles JM, Tremollieres F, Ribot C (1993) Is itpossible to identify women with rapid vertebral boneloss during menopause? Result of a longitudinal studyof 92 women at the onset of menopause. Rev RhumEd Fr 60: 217–22
172. Storm T, Thamsborg G, Steiniche T, Genant HK,Sørensen OH (1990) Effect of intermittent cyclicaletidronate therapy on bone mass and fracture rate inwomen with postmenopausal osteoporosis. N Engl JMed 322: 1265–71
173. Watts NB, Harris ST, Genant HK et al (1990)Intermittent cyclical etidronate treatment of postmen-opausal osteoporosis. N Engl J Med 323: 73–9
174. Adachi JD, Bensen WG, Brown J et al (1997)Intermittent etidronate therapy to prevent corticoste-roid-induced osteoporosis. N Engl J Med 337: 382–7
175. Cortet B, Houvenagel E, Puisieux F et al (1999) Spinalcurvatures and quality of life in women with vertebralfractures secondary to osteoporosis. Spine 24: 1921–5
Arch Osteoporos
176.Geusens P, Dequeker J, Vanhoof J et al (1998) Cyclicaletidronate increases bone density in the spine and hipof postmenopausal women receiving long term corti-costeroid treatment. A double blind, randomisedplacebo controlled study. Ann Rheum Dis 57: 724–7
177. Watts NB, Jenkins DK, Visor JM, Casal DC, GeusensP (2001) Comparison of bone and total alkalinephosphatase and bone mineral density in postmeno-pausal osteoporotic women treated with alendronate.Osteoporos Int 12: 279–88
178. Kanis JA, Pitt FA (1992) Epidemiology of osteoporo-sis. Bone 13: S7-15
179. Roux C, Oriente P, Laan R et al (1998) Randomizedtrial of effect of cyclical etidronate in the prevention ofcorticosteroid-induced bone loss. Ciblos Study Group.J Clin Endocrinol Metab 83: 1128–33
180. Brown JP, Kendler DL, McClung MR et al (2002) Theefficacy and tolerability of risedronate once a week forthe treatment of postmenopausal osteoporosis. CalcifTissue Int 71: 103–11
181. Ravn P, Clemmesen B, Christiansen C (1999)Biochemical markers can predict the response in bonemass during alendronate treatment in early post-menopausal women. Alendronate Osteoporosis Pre-vention Study Group. Bone 24: 237–44
182. Fogelman I, Ribot C, Smith R, Ethgen D, Sod E,Reginster JY (2000) Risedronate reverses bone loss inpostmenopausal women with low bone mass: resultsfrom a multinational, double-blind, placebo-controlledtrial. BMD-MN Study Group. J Clin EndocrinolMetab 85: 1895–900
183. Mortensen L, Charles P, Bekker PJ, Digennaro J,Johnston CC Jr (1998) Risedronate increases bonemass in an early postmenopausal population: twoyears of treatment plus one year of follow-up. J ClinEndocrinol Metab 83: 396–402
184. Reginster J, Minne HW, Sorensen OH et al (2000)Randomized trial of the effects of risedronate onvertebral fractures in women with established post-menopausal osteoporosis. Vertebral Efficacy withRisedronate Therapy (VERT) Study Group. OsteoporosInt 11: 83–91
185. Cohen S, Levy RM, Keller M et al (1999) Risedronatetherapy prevents corticosteroid-induced bone loss: atwelve-month, multicenter, randomized, double-blind,placebo-controlled, parallel-group study. ArthritisRheum 42: 2309–18
186. Alcoba M, Cuevas MJ, Perez-Simon MR et al (2003)Assessment of adherence to triple antiretroviral treat-ment including indinavir: role of the determination ofplasma levels of indinavir. J Acquir Immune DeficSyndr 33: 253–8
187. Paes AH, Bakker A, Soe-Agnie CJ (1998) Measurementof patient compliance. Pharm World Sci 20: 73– 7
188. Osterberg L, Blaschke T (2005) Adherence tomedication. N Engl J Med 353: 487–97
189. Sikka R, Xia F, Aubert RE (2005) Estimatingmedication persistency using administrative claimsdata. Am J Manag Care 11: 449–57
190. Siris ES, Harris ST, Rosen CJ et al (2006) Adherenceto bisphosphonate therapy and fracture rates inosteoporotic women: relationship to vertebral andnonvertebral fractures from 2 US claims databases.Mayo Clin Proc 81: 1013–22
191. Weycker D, Macarios D, Edelsberg J, Oster G (2006)Compliance with drug therapy for postmenopausalosteoporosis. Osteoporos Int 17: 1645–52
192. Lo JC, Pressman AR, Omar MA, Ettinger B (2006)Persistence with weekly alendronate therapy amongpostmenopausal women. Osteoporos Int 17: 922–8
193. Landfeldt E, Ström O, Robbins S, Borgström F (2011)Adherence to treatment of primary osteoporosis andits association to fractures - the Swedish AdherenceRegister Analysis (SARA). Osteoporos Int.doi:10.1007/s00198-011-1549-6
194. Caro JJ, Ishak KJ, Huybrechts KF, Raggio G, NaujoksC (2004) The impact of compliance with osteoporosistherapy on fracture rates in actual practice. OsteoporosInt 15: 1003–8
195. Huybrechts KF, Ishak KJ, Caro JJ (2006) Assessment ofcompliance with osteoporosis treatment and its conse-quences in a managed care population. Bone 38: 922–8
196. Haynes RB, Ackloo E, Sahota N, McDonald HP, YaoX (2008) Interventions for enhancing medicationadherence. Cochrane Database Syst Rev 2: CD000011
197. Claxton AJ, Cramer J, Pierce C (2001) A systematicreview of the associations between dose regimens andmedication compliance. Clin Ther 23: 1296–310
198. Compston JE, E Seeman (2006) Compliance withosteoporosis therapy is the weakest link. Lancet 368:973–4
199. Weycker D, Macarios D, Edelsberg J, Oster G (2007)Compliance with osteoporosis drug therapy and riskof fracture. Osteoporos Int 18: 271–7
200. Irvine J, Baker B, Smith J et al (1999) Poor adherenceto placebo or amiodarone therapy predicts mortality:results from the CAMIAT study. Canadian AmiodaroneMyocardial Infarction Arrhythmia Trial. PsychosomMed 61: 566–75
201. Granger BB, Swedberg K, Ekman I et al (2005)Adherence to candesartan and placebo and outcomesin chronic heart failure in the CHARM programme:double-blind, randomised, controlled clinical trial.Lancet 366: 2005–11
Arch Osteoporos

202. McCloskey E, de Takats D, Orgee J (2005) Character-istics associated with non-persistence during dailytherapy. Experience from the placebo wing of acommunity-based clinical trial. J Bone Miner Res20: S282
203. Clowes JA, Peel NF, Eastell R (2004) The impact ofmonitoring on adherence and persistence with anti-resorptive treatment for postmenopausal osteoporosis:a randomized controlled trial. J Clin Endocrinol Metab89: 1117–23
204. Delmas PD, Vrijens B, Eastell R et al (2007) Effect ofmonitoring bone turnover markers on persistence withrisedronate treatment of postmenopausal osteoporosis.J Clin Endocrinol Metab 92: 1296–304
205. Cramer JA (1995) Relationship between medicationcompliance and medical outcomes. Am J Health SystPharm 52: S27-9
206. Lamberg L (2000) Patient-physician relationshipcritical even during brief "medication checks". JAMA284: 29–31
207. Eraker SA, Kirscht JP, Becker MH (1984) Under-standing and improving patient compliance. AnnIntern Med 100: 258–68
208. Silverman SL, Gold DT (2008) Compliance andpersistence with osteoporosis therapies. Curr RheumatolRep 10: 118–22
209. Ström O, Borgström F, Kanis JA, Jönsson B (2009)Incorporating adherence into health economic model-ling of osteoporosis. Osteoporos Int 20: 23–34
210. Cotte FE, Fardellone P, Mercier F, Gaudin AF, Roux C(2010) Adherence to monthly and weekly oralbisphosphonates in women with osteoporosis.Osteoporos Int 21: 145–55
211. Hiligsmann M, Rabenda V, Gathon HJ, Ethgen O,Reginster JY (2010) Potential clinical and economicimpact of nonadherence with osteoporosis medica-tions. Calcif Tissue Int 86: 202–10
212. Agence Française de Sécurité Sanitaire des Produits deSanté (2006) Traitement medicamenteux de l’osteo-porose post-ménopausique – Recommandations http://www.afssaps.fr/Infos-de-securite/Recommandations/Traitement-medicamenteux-de-l-osteoporose-post-menopausique-Recommandations-de-bonne-pratique/(language)/fre-FR (Updated 2008 http://sante- mede-cine.commentcamarche.net/faq/1118-les- traitements-de-l-osteoporose-post-menopausique- afssaps)Accessed 24 May 2011
213.Pfeilschifter J (2006) DVO-guideline for prevention,diagnosis, and therapy of osteoporosis for womenafter menopause, for men after age 60 executivesummary guidelines. Exp Clin Endocrinol Diabetes114: 611–22
214. Dachverband Osteologie (2011) DVO Guideline 2009for prevention, diagnosis and therapy of osteoporosisin adults. Osteologie 20: 55–74
215. Adami S, Bertoldo F, Brandi ML et al (2009)Guidelines for the diagnosis, prevention and treatmentof osteoporosis. Reumatismo 61: 260–84
216. González M et al (2008) Practice guidelines forpostmenopausal, steroid-induced and male osteoporo-sis. Spanish Society for Bone and Mineral Research.Rev Clin Esp 208(Suppl1): 1–24
217. National Institute for Health and Clinical Excellence(2011) Alendronate, etidronate, risedronate, raloxi-fene, strontium ranelate and teriparatide for thesecondary prevention of osteoporotic fragility frac-tures in postmenopausal women. Technology appraisalTA161. http://egap.evidence.nhs.uk/TA161 Accessed24 May 2011
218. National Institute for Health and Clinical Excellence(2011) Alendronate, etidronate, risedronate, raloxi-fene and strontium ranelate for the primary pre-vention of osteoporotic fragility fractures inpostmenopausal women. Technology appraisalTA160. http://guidance.nice.org.uk/TA160 Accessed24 May 2011
219. National Institute for Health and Clinical Excellence(2010) Denosumab for the prevention of osteoporoticfractures in postmenopausal women. Technologyappraisal 204 http://guidance.nice.org.uk/TA204Accessed 24 May 2011
220. Kanis JA, McCloskey EV, Jonsson B, Cooper A,Ström O, Borgström F (2010) An evaluation of theNICE guidance for the prevention of osteoporoticfragility fractures in postmenopausal women. ArchOsteoporos 5: 19–48
221. Roux C, Cooper C, Díez-Pérez A et al (2010)Prevalence of osteoporosis and fractures amongwomen prescribed osteoporosis medication in fiveEuropean countries: the POSSIBLE EU((R)) study.Osteoporos Int 22: 1227–36
3 Epidemiology of osteoporosis
Summary
The objective of this chapter is to map the epidemiology ofosteoporosis and its consequences in the EU5 and Sweden(EU5+). This forms the basis for estimating the burden ofosteoporosis which is presented in Chapter 5 and 6. Differentapproaches for setting intervention thresholds (i.e. at whatfracture risk is it appropriate to start treatment) are alsodescribed.
Arch Osteoporos
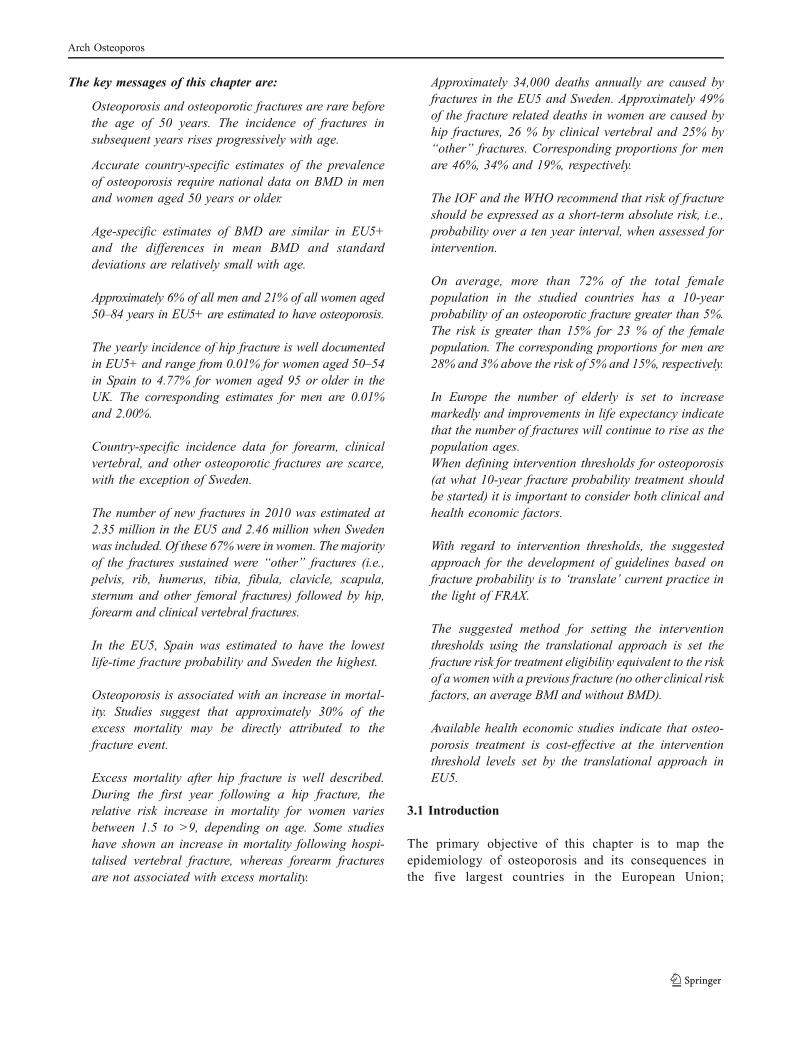
The key messages of this chapter are:
Osteoporosis and osteoporotic fractures are rare beforethe age of 50 years. The incidence of fractures insubsequent years rises progressively with age.
Accurate country-specific estimates of the prevalenceof osteoporosis require national data on BMD in menand women aged 50 years or older.
Age-specific estimates of BMD are similar in EU5+and the differences in mean BMD and standarddeviations are relatively small with age.
Approximately 6% of all men and 21% of all women aged50–84 years in EU5+ are estimated to have osteoporosis.
The yearly incidence of hip fracture is well documentedin EU5+ and range from 0.01% for women aged 50–54in Spain to 4.77% for women aged 95 or older in theUK. The corresponding estimates for men are 0.01%and 2.00%.
Country-specific incidence data for forearm, clinicalvertebral, and other osteoporotic fractures are scarce,with the exception of Sweden.
The number of new fractures in 2010 was estimated at2.35 million in the EU5 and 2.46 million when Swedenwas included. Of these 67% were in women. The majorityof the fractures sustained were “other” fractures (i.e.,pelvis, rib, humerus, tibia, fibula, clavicle, scapula,sternum and other femoral fractures) followed by hip,forearm and clinical vertebral fractures.
In the EU5, Spain was estimated to have the lowestlife-time fracture probability and Sweden the highest.
Osteoporosis is associated with an increase in mortal-ity. Studies suggest that approximately 30% of theexcess mortality may be directly attributed to thefracture event.
Excess mortality after hip fracture is well described.During the first year following a hip fracture, therelative risk increase in mortality for women variesbetween 1.5 to >9, depending on age. Some studieshave shown an increase in mortality following hospi-talised vertebral fracture, whereas forearm fracturesare not associated with excess mortality.
Approximately 34,000 deaths annually are caused byfractures in the EU5 and Sweden. Approximately 49%of the fracture related deaths in women are caused byhip fractures, 26 % by clinical vertebral and 25% by“other” fractures. Corresponding proportions for menare 46%, 34% and 19%, respectively.
The IOF and the WHO recommend that risk of fractureshould be expressed as a short-term absolute risk, i.e.,probability over a ten year interval, when assessed forintervention.
On average, more than 72% of the total femalepopulation in the studied countries has a 10-yearprobability of an osteoporotic fracture greater than 5%.The risk is greater than 15% for 23 % of the femalepopulation. The corresponding proportions for men are28% and 3% above the risk of 5% and 15%, respectively.
In Europe the number of elderly is set to increasemarkedly and improvements in life expectancy indicatethat the number of fractures will continue to rise as thepopulation ages.When defining intervention thresholds for osteoporosis(at what 10-year fracture probability treatment shouldbe started) it is important to consider both clinical andhealth economic factors.
With regard to intervention thresholds, the suggestedapproach for the development of guidelines based onfracture probability is to ‘translate’ current practice inthe light of FRAX.
The suggested method for setting the interventionthresholds using the translational approach is set thefracture risk for treatment eligibility equivalent to the riskof a women with a previous fracture (no otherclinical riskfactors, an average BMI and without BMD).
Available health economic studies indicate that osteo-porosis treatment is cost-effective at the interventionthreshold levels set by the translational approach inEU5.
3.1 Introduction
The primary objective of this chapter is to map theepidemiology of osteoporosis and its consequences inthe five largest countries in the European Union;
Arch Osteoporos
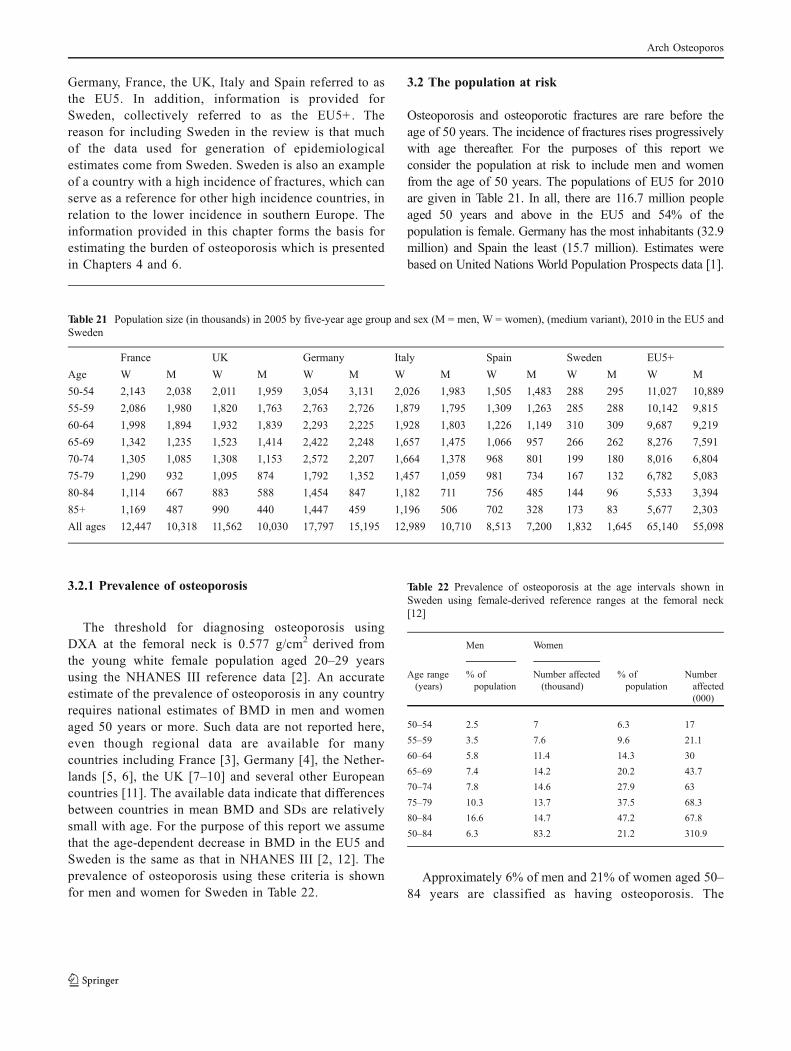
Germany, France, the UK, Italy and Spain referred to asthe EU5. In addition, information is provided forSweden, collectively referred to as the EU5+. Thereason for including Sweden in the review is that muchof the data used for generation of epidemiologicalestimates come from Sweden. Sweden is also an exampleof a country with a high incidence of fractures, which canserve as a reference for other high incidence countries, inrelation to the lower incidence in southern Europe. Theinformation provided in this chapter forms the basis forestimating the burden of osteoporosis which is presentedin Chapters 4 and 6.
3.2 The population at risk
Osteoporosis and osteoporotic fractures are rare before theage of 50 years. The incidence of fractures rises progressivelywith age thereafter. For the purposes of this report weconsider the population at risk to include men and womenfrom the age of 50 years. The populations of EU5 for 2010are given in Table 21. In all, there are 116.7 million peopleaged 50 years and above in the EU5 and 54% of thepopulation is female. Germany has the most inhabitants (32.9million) and Spain the least (15.7 million). Estimates werebased on United Nations World Population Prospects data [1].
3.2.1 Prevalence of osteoporosis
The threshold for diagnosing osteoporosis usingDXA at the femoral neck is 0.577 g/cm2 derived fromthe young white female population aged 20–29 yearsusing the NHANES III reference data [2]. An accurateestimate of the prevalence of osteoporosis in any countryrequires national estimates of BMD in men and womenaged 50 years or more. Such data are not reported here,even though regional data are available for manycountries including France [3], Germany [4], the Nether-lands [5, 6], the UK [7–10] and several other Europeancountries [11]. The available data indicate that differencesbetween countries in mean BMD and SDs are relativelysmall with age. For the purpose of this report we assumethat the age-dependent decrease in BMD in the EU5 andSweden is the same as that in NHANES III [2, 12]. Theprevalence of osteoporosis using these criteria is shownfor men and women for Sweden in Table 22.
Table 22 Prevalence of osteoporosis at the age intervals shown inSweden using female-derived reference ranges at the femoral neck[12]
Men Women
Age range(years)
% ofpopulation
Number affected(thousand)
% ofpopulation
Numberaffected(000)
50–54 2.5 7 6.3 17
55–59 3.5 7.6 9.6 21.1
60–64 5.8 11.4 14.3 30
65–69 7.4 14.2 20.2 43.7
70–74 7.8 14.6 27.9 63
75–79 10.3 13.7 37.5 68.3
80–84 16.6 14.7 47.2 67.8
50–84 6.3 83.2 21.2 310.9
Approximately 6% of men and 21% of women aged 50–84 years are classified as having osteoporosis. The
Table 21 Population size (in thousands) in 2005 by five-year age group and sex (M = men, W = women), (medium variant), 2010 in the EU5 andSweden
France UK Germany Italy Spain Sweden EU5+
Age W M W M W M W M W M W M W M
50-54 2,143 2,038 2,011 1,959 3,054 3,131 2,026 1,983 1,505 1,483 288 295 11,027 10,889
55-59 2,086 1,980 1,820 1,763 2,763 2,726 1,879 1,795 1,309 1,263 285 288 10,142 9,815
60-64 1,998 1,894 1,932 1,839 2,293 2,225 1,928 1,803 1,226 1,149 310 309 9,687 9,219
65-69 1,342 1,235 1,523 1,414 2,422 2,248 1,657 1,475 1,066 957 266 262 8,276 7,591
70-74 1,305 1,085 1,308 1,153 2,572 2,207 1,664 1,378 968 801 199 180 8,016 6,804
75-79 1,290 932 1,095 874 1,792 1,352 1,457 1,059 981 734 167 132 6,782 5,083
80-84 1,114 667 883 588 1,454 847 1,182 711 756 485 144 96 5,533 3,394
85+ 1,169 487 990 440 1,447 459 1,196 506 702 328 173 83 5,677 2,303
All ages 12,447 10,318 11,562 10,030 17,797 15,195 12,989 10,710 8,513 7,200 1,832 1,645 65,140 55,098
Arch Osteoporos
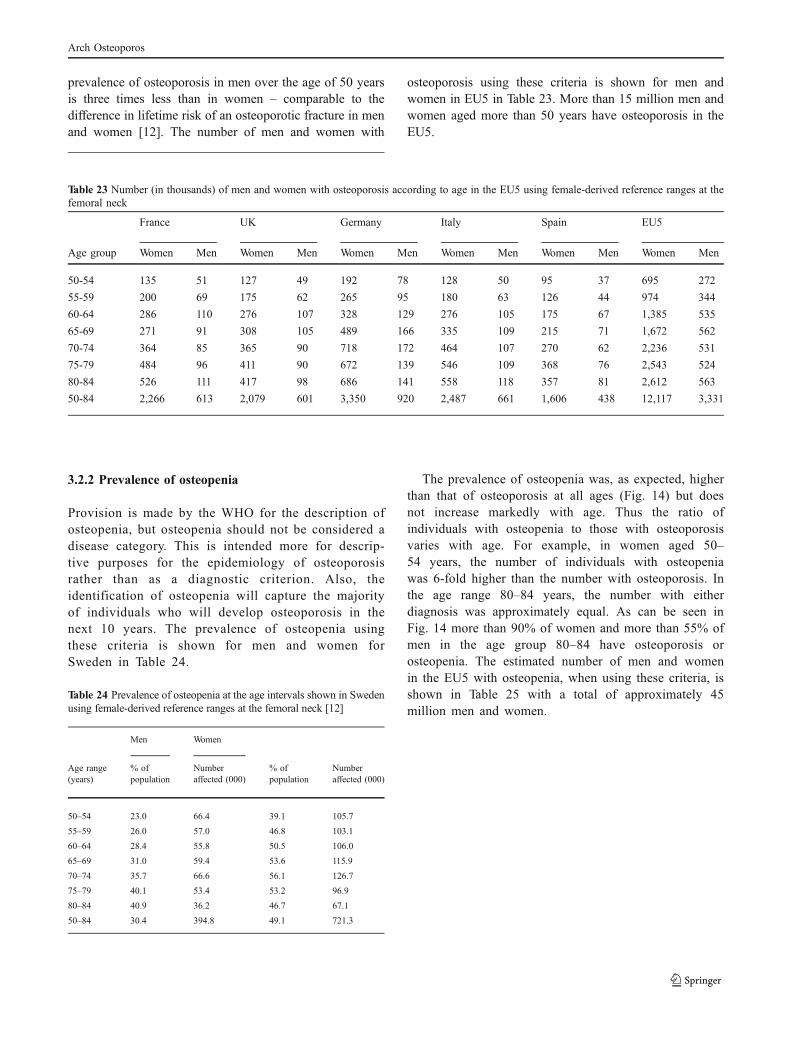
prevalence of osteoporosis in men over the age of 50 yearsis three times less than in women – comparable to thedifference in lifetime risk of an osteoporotic fracture in menand women [12]. The number of men and women with
osteoporosis using these criteria is shown for men andwomen in EU5 in Table 23. More than 15 million men andwomen aged more than 50 years have osteoporosis in theEU5.
3.2.2 Prevalence of osteopenia
Provision is made by the WHO for the description ofosteopenia, but osteopenia should not be considered adisease category. This is intended more for descrip-tive purposes for the epidemiology of osteoporosisrather than as a diagnostic criterion. Also, theidentification of osteopenia will capture the majorityof individuals who will develop osteoporosis in thenext 10 years. The prevalence of osteopenia usingthese criteria is shown for men and women forSweden in Table 24.
Table 24 Prevalence of osteopenia at the age intervals shown in Swedenusing female-derived reference ranges at the femoral neck [12]
Men Women
Age range(years)
% ofpopulation
Numberaffected (000)
% ofpopulation
Numberaffected (000)
50–54 23.0 66.4 39.1 105.7
55–59 26.0 57.0 46.8 103.1
60–64 28.4 55.8 50.5 106.0
65–69 31.0 59.4 53.6 115.9
70–74 35.7 66.6 56.1 126.7
75–79 40.1 53.4 53.2 96.9
80–84 40.9 36.2 46.7 67.1
50–84 30.4 394.8 49.1 721.3
The prevalence of osteopenia was, as expected, higherthan that of osteoporosis at all ages (Fig. 14) but doesnot increase markedly with age. Thus the ratio ofindividuals with osteopenia to those with osteoporosisvaries with age. For example, in women aged 50–54 years, the number of individuals with osteopeniawas 6-fold higher than the number with osteoporosis. Inthe age range 80–84 years, the number with eitherdiagnosis was approximately equal. As can be seen inFig. 14 more than 90% of women and more than 55% ofmen in the age group 80–84 have osteoporosis orosteopenia. The estimated number of men and womenin the EU5 with osteopenia, when using these criteria, isshown in Table 25 with a total of approximately 45million men and women.
Table 23 Number (in thousands) of men and women with osteoporosis according to age in the EU5 using female-derived reference ranges at thefemoral neck
France UK Germany Italy Spain EU5
Age group Women Men Women Men Women Men Women Men Women Men Women Men
50-54 135 51 127 49 192 78 128 50 95 37 695 272
55-59 200 69 175 62 265 95 180 63 126 44 974 344
60-64 286 110 276 107 328 129 276 105 175 67 1,385 535
65-69 271 91 308 105 489 166 335 109 215 71 1,672 562
70-74 364 85 365 90 718 172 464 107 270 62 2,236 531
75-79 484 96 411 90 672 139 546 109 368 76 2,543 524
80-84 526 111 417 98 686 141 558 118 357 81 2,612 563
50-84 2,266 613 2,079 601 3,350 920 2,487 661 1,606 438 12,117 3,331
Arch Osteoporos

Fig. 14 Prevalence of osteoporosis (T-score of −2.5 SD or less) and osteopenia (T-score between −1 and −2.5) using female-derived referenceranges at the femoral neck
% of women with osteopenia% of men with osteopenia
0%
20%
40%
60%
80%
100%
50–54 55–59 60–64 65–69 70–74 75–79 80–84
% of women with osteopenia % of women with osteoporosis
0%
20%
40%
60%
80%
100%
50–54 55–59 60–64 65–69 70–74 75–79 80–84
% of men with osteopenia % of men with osteoporosis
3.3 Incidence of fracture
Whereas patients with hip fractures are admitted tohospital and can be captured through hospital statisticsand other health care agencies, patients with clinicalspine, forearm and proximal humerus are commonlymanaged as outpatients and not all are possible toidentify in the hospital databases. Estimates of thenumber of hip fracture were available for all includedcountries, but information on other fractures wasincomplete. Where relevant, the incidence of other
osteoporotic fractures was imputed from the hipfracture incidence from the relevant country, using therelationship between hip fracture incidence and inci-dence of fractures in other sites in Sweden (Malmö)[13]. This assumes that the ratio of hip fractureincidence to the age- and sex-specific incidence ofother index fractures is similar in the EU5 as found inMalmö, Sweden. The assumption, used in the develop-ment of some FRAX models [14] appears to hold truefor countries where this has been tested. Examples aregiven in Fig. 15 [15].
Table 25 Number (in thousands) of men and women with osteopenia (low bone mass) in the EU5 according to age using female-derived referenceranges at the femoral neck
France UK Germany Italy Spain EU5
Age group Women Men Women Men Women Men Women Men Women Men Women Men
50-54 838 469 786 451 1,194 720 792 456 588 341 4,312 2,504
55-59 976 515 852 458 1,293 709 879 467 613 328 4,746 2,552
60-64 1,009 538 976 522 1,158 632 974 512 619 326 4,892 2,618
65-69 719 383 816 438 1,298 697 888 457 571 297 4,436 2,353
70-74 732 387 734 412 1,443 788 934 492 543 286 4,497 2,429
75-79 686 374 583 350 953 542 775 425 522 294 3,608 2,038
80-84 520 273 412 240 679 346 552 291 353 198 2,584 1,388
50-84 5,481 2,938 5,159 2,872 8,019 4,434 5,794 3,099 3,810 2,071 29,075 15,883
Arch Osteoporos
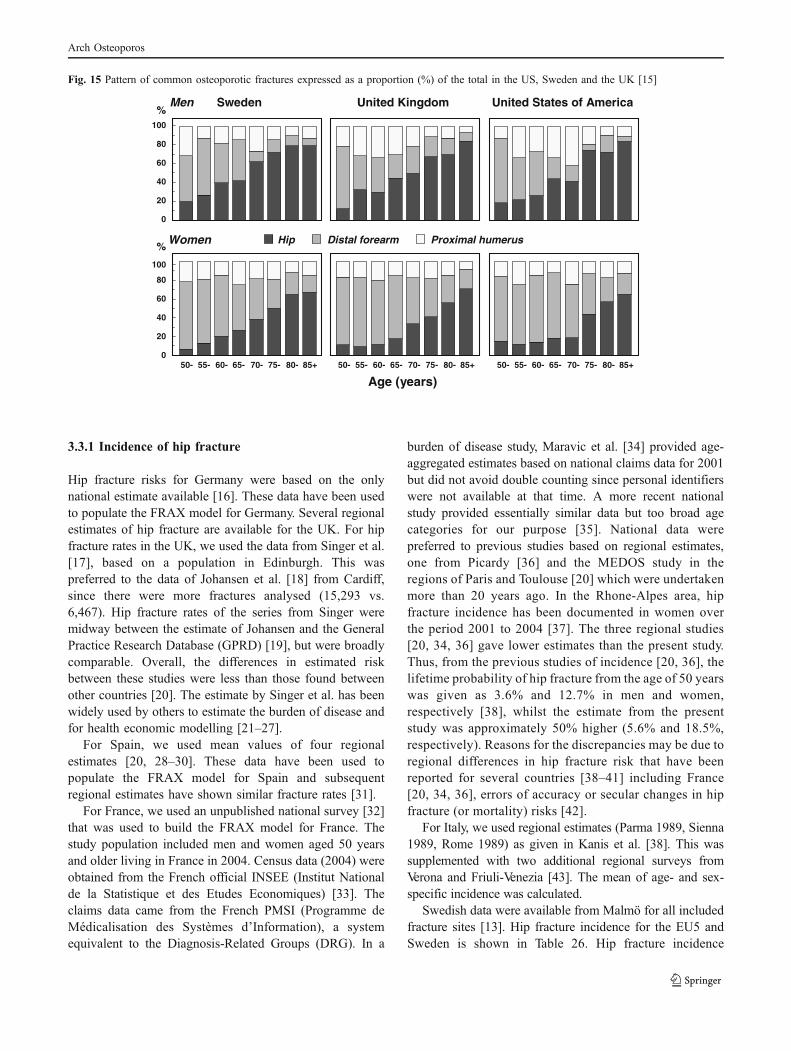
3.3.1 Incidence of hip fracture
Hip fracture risks for Germany were based on the onlynational estimate available [16]. These data have been usedto populate the FRAX model for Germany. Several regionalestimates of hip fracture are available for the UK. For hipfracture rates in the UK, we used the data from Singer et al.[17], based on a population in Edinburgh. This waspreferred to the data of Johansen et al. [18] from Cardiff,since there were more fractures analysed (15,293 vs.6,467). Hip fracture rates of the series from Singer weremidway between the estimate of Johansen and the GeneralPractice Research Database (GPRD) [19], but were broadlycomparable. Overall, the differences in estimated riskbetween these studies were less than those found betweenother countries [20]. The estimate by Singer et al. has beenwidely used by others to estimate the burden of disease andfor health economic modelling [21–27].
For Spain, we used mean values of four regionalestimates [20, 28–30]. These data have been used topopulate the FRAX model for Spain and subsequentregional estimates have shown similar fracture rates [31].
For France, we used an unpublished national survey [32]that was used to build the FRAX model for France. Thestudy population included men and women aged 50 yearsand older living in France in 2004. Census data (2004) wereobtained from the French official INSEE (Institut Nationalde la Statistique et des Etudes Economiques) [33]. Theclaims data came from the French PMSI (Programme deMédicalisation des Systèmes d’Information), a systemequivalent to the Diagnosis-Related Groups (DRG). In a
burden of disease study, Maravic et al. [34] provided age-aggregated estimates based on national claims data for 2001but did not avoid double counting since personal identifierswere not available at that time. A more recent nationalstudy provided essentially similar data but too broad agecategories for our purpose [35]. National data werepreferred to previous studies based on regional estimates,one from Picardy [36] and the MEDOS study in theregions of Paris and Toulouse [20] which were undertakenmore than 20 years ago. In the Rhone-Alpes area, hipfracture incidence has been documented in women overthe period 2001 to 2004 [37]. The three regional studies[20, 34, 36] gave lower estimates than the present study.Thus, from the previous studies of incidence [20, 36], thelifetime probability of hip fracture from the age of 50 yearswas given as 3.6% and 12.7% in men and women,respectively [38], whilst the estimate from the presentstudy was approximately 50% higher (5.6% and 18.5%,respectively). Reasons for the discrepancies may be due toregional differences in hip fracture risk that have beenreported for several countries [38–41] including France[20, 34, 36], errors of accuracy or secular changes in hipfracture (or mortality) risks [42].
For Italy, we used regional estimates (Parma 1989, Sienna1989, Rome 1989) as given in Kanis et al. [38]. This wassupplemented with two additional regional surveys fromVerona and Friuli-Venezia [43]. The mean of age- and sex-specific incidence was calculated.
Swedish data were available from Malmö for all includedfracture sites [13]. Hip fracture incidence for the EU5 andSweden is shown in Table 26. Hip fracture incidence
0
20
40
60
80
100
0
20
40
60
80
100
Age (years)
%
Hip Distal forearm Proximal humerus
Men
Women
United States of AmericaSweden United Kingdom
55- 65- 85+50- 60- 70- 80-75-
%
55- 65- 85+50- 60- 70- 80-75- 55- 65- 85+50- 60- 70- 80-75-
Fig. 15 Pattern of common osteoporotic fractures expressed as a proportion (%) of the total in the US, Sweden and the UK [15]
Arch Osteoporos

increased exponentially with age in women as well as in men.As expected, lower rates were seen in men compared towomen. There was some heterogeneity in fracture ratesbetween the included countries. Spain stands out as thecountry with lowest incidence rates in both women and men -consistent with the observations of differing hip fracture rates
within Europe [20, 44, 45]. Differences in incidence amongmen and women within a country may be accounted for bydifferences in femoral neck BMD, but do not explain thelarge differences between countries [38]. Hip fracture rateswere smoothed assuming an exponential increase in inci-dence with age.
3.3.2 Incidence of forearm fracture
Incidence of forearm fractures was available for the UK andwe used the same source as that for hip fracture rate [17].The majority of forearm fractures are treated in hospital out-patient departments [46] and are therefore seldom capturedin registries. For this reason, no data were available for theother EU5 countries. As detailed above, forearm fracturerates were imputed from the relationship between hipfracture incidence and forearm fracture in Sweden. Theincidence of forearm fractures in EU5 and Sweden is shownin Table 27.
Table 27 Forearm fracture incidence (per 10,000) by age and sex inthe EU5 and Sweden
Country Age intervals (years)
50–54
55–59
60–64
65–69
70–74
75–79
80–84
85–89
90–94
Men
France 4 8 11 11 4 8 11 22 40
Germany 6 20 10 24 8 11 17 22 28
Italy 5 7 10 17 7 12 12 33 44
Spain 0 3 8 8 7 5 8 12 19
Sweden 12 15 20 20 12 21 28 35 41
UK 12 8 6 6 12 12 14 15 25
Women
France 18 35 22 29 45 49 77 84 101
Germany 23 59 41 59 78 65 77 96 112
Italy 27 50 32 44 61 65 82 98 92
Spain 5 18 17 18 32 38 54 62 65
Sweden 43 50 62 78 96 110 128 146 164
UK 21 33 43 53 65 70 73 90 95
3.3.3 Incidence of vertebral fracture
Vertebral fracture may be defined in several ways. Morpho-metric vertebral fractures are identified as radiographicdeformities. They may be symptomatic or clinically silent.Thus, not all morphometric vertebral fractures come toclinical attention and the proportion that does come to clinicalattention varies between studies and between countries [19,47, 48]. Several studies indicate that the ratio of clinical tomorphometric fractures is approximately 20% in women and40% in men [48, 49]. In the context of this report, we havepreferred to estimate the incidence of clinically relevant
Table 26 Hip fracture incidence (per 100,000) by age in men and women from the EU5 and Sweden
Age intervals (years)
Country 50-54 55-59 60-64 65-69 70-74 75-79 80-84 85-89 90-94 95-99
Men
France 32 43 58 82 145 302 646 1,139 1,930 2,694*
Germany 54.5d 89.2 119.5 214 379.5 785.9 1,509.4 2,024*
Italy 40 40 50 120 240 420 730 1,720 2,130 *
Spain 10 21.8 56.2 52.2 136.2 225.6 494.8 1,022*
Sweden 88 88 76 189 304 629 1,474 1,807 1,852
UK 22 39 69 121 213 374 657 1,115 2,003*
Women
France 26 42 75 129 277 621 1,380 2,237 3,379 3,719*
Germany 45.5d 92.5 158.5 363.6 789.5 1,533.5 2,735.7 3,557.2*
Italy 40 60 110 200 370 820 1,470 2,610 3,070 *
Spain 14.3 29.8 53.5 90.1 238.4 483.7 1,108.3 2,108.8*
Sweden 55 56 192 315 556 1392 2,348 4,290 3,998 3,958
UK 30 57 107 201 379 713 1,344 2,532 4,770*
* ≥aged decade
Arch Osteoporos

vertebral fracture, since these are the patients most likely to beidentified for treatment. The incidence of clinically identifiedfractures has been studied in the UK within the GPRD [19].The incidence is, however, very low and it is likely that themajority of fractures were not coded [50]. Indeed, reportedrates of vertebral fracture vary by more than 10-fold in generalpractice in the UK [51]. The ratio of clinical fracturesidentified in the GPRD to those identified by morphometryin the UK is unrealistically low compared with other countries[52], which supports the view that the GPRD has markedlyunder-reported clinical vertebral fracture.
For these reasons, we imputed vertebral fracture ratesfrom data available from Malmö in Sweden that report theincidences of hip and vertebral fractures that come toclinical attention [13]. We assumed that the ratio of theincidence of vertebral fracture and hip fractures in Malmö,Sweden would be comparable to the ratio of vertebralfracture incidence in each EU5 country (unknown) and hipfracture incidence in each EU5 country. The rates are shownin Table 28.
Table 28 Clinical vertebral fracture incidence (per 10,000) by age andsex in the EU5 and Sweden
Age intervals (years)
Country 50-54
55-59
60-64
65-69
70-74
75-79
80-84
85-89
90-94
Men
France 7 6 18 10 24 30 40 80 151
Germany 12 10 19 17 27 36 43 82 128
Italy 9 6 16 14 40 41 45 121 166
Spain 1 3 10 8 16 22 27 45 73
Sweden 16 16 23 34 55 74 104 130 156
UK 2 7 12 14 33 34 38 72 141
Women
France 4 10 24 33 46 70 99 114 136
Germany 8 14 14 19 40 60 78 106 127
Italy 3 18 27 34 63 112 116 120 136
Spain 2 7 8 11 25 37 54 68 83
Sweden 16 22 36 57 91 113 135 183 231
UK 10 13 12 19 50 60 72 105 142
The incidence of morphometrically-defined vertebralfractures appears to vary less between countries than theincidence of clinical fractures [52]. Results from theEuropean Prospective Osteoporosis Study (EPOS) [52]indicate that the incidence of morphometric vertebraldeformities is greater in women than in men (Table 29).The incidence increases with age but less steeply than thatof hip fractures. Moreover, the international variation in theincidence of morphometric vertebral fractures is smallerthan that of hip fracture (Fig. 16). Morphometricallydiagnosed fractures collectively give rise to morbidity and
are associated with an increased risk of future fractures. Itshould however be noted that they also include the fracturesthat come to clinical attention, which makes the burdenattributable to purely sub-clinical fractures difficult toassess.
Table 29 Incidence of vertebral fracture (per 10,000) definedmorphometrically in EPOS [52]
Incidence Relative risk
Age Men Women Women vs. Men
50-54 5 36 4.1
55-59 55 55 1.0
60-64 48 95 2.0
65-69 63 123 2.0
70-74 87 179 2.1
75-79 136 293 2.2
All 57 107 1.9
Fig. 16 Age-standardised incidence of morphometrically definedfracture by region and gender from EPOS [52]
0
2
4
6
8
10
12
14
16
18
20
Scandinavia Southern Europe Eastern Europe Western Europe
Inci
den
ce (
per
100
0)
Men Women
3.3.4 Incidence of proximal humeral fracture
Incidence of humeral fractures was available for theUK and we used the same source as that for hipfracture rate [17]. The majority of humeral fractures aretreated in hospital out-patient departments and for thisreason no data were available for the other EU5countries. As detailed above, humeral fracture rateswere imputed from the relationship between hipfracture incidence and proximal humerus fracture inSweden. The incidence of humeral fractures in EU5 isshown in Table 30. The incidence reported for the UKis slightly lower than the imputed data in the oldestsub-group (85+years).
Arch Osteoporos
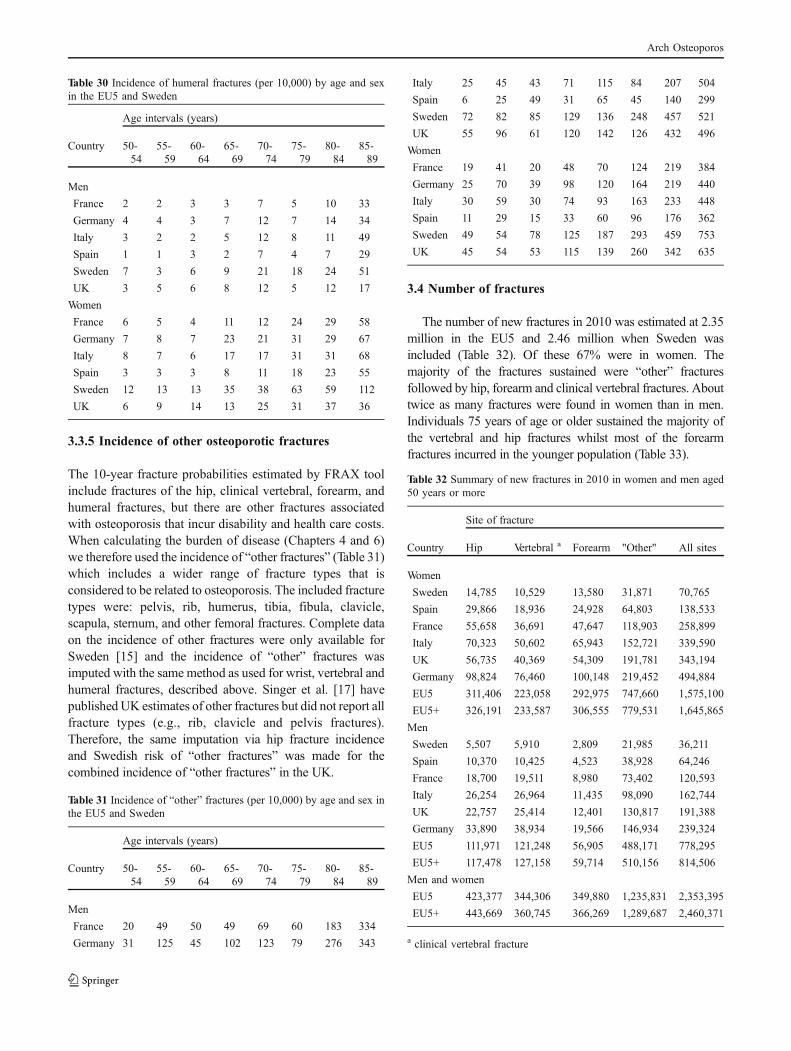
Table 30 Incidence of humeral fractures (per 10,000) by age and sexin the EU5 and Sweden
Age intervals (years)
Country 50-54
55-59
60-64
65-69
70-74
75-79
80-84
85-89
Men
France 2 2 3 3 7 5 10 33
Germany 4 4 3 7 12 7 14 34
Italy 3 2 2 5 12 8 11 49
Spain 1 1 3 2 7 4 7 29
Sweden 7 3 6 9 21 18 24 51
UK 3 5 6 8 12 5 12 17
Women
France 6 5 4 11 12 24 29 58
Germany 7 8 7 23 21 31 29 67
Italy 8 7 6 17 17 31 31 68
Spain 3 3 3 8 11 18 23 55
Sweden 12 13 13 35 38 63 59 112
UK 6 9 14 13 25 31 37 36
3.3.5 Incidence of other osteoporotic fractures
The 10-year fracture probabilities estimated by FRAX toolinclude fractures of the hip, clinical vertebral, forearm, andhumeral fractures, but there are other fractures associatedwith osteoporosis that incur disability and health care costs.When calculating the burden of disease (Chapters 4 and 6)we therefore used the incidence of “other fractures” (Table 31)which includes a wider range of fracture types that isconsidered to be related to osteoporosis. The included fracturetypes were: pelvis, rib, humerus, tibia, fibula, clavicle,scapula, sternum, and other femoral fractures. Complete dataon the incidence of other fractures were only available forSweden [15] and the incidence of “other” fractures wasimputed with the same method as used for wrist, vertebral andhumeral fractures, described above. Singer et al. [17] havepublished UK estimates of other fractures but did not report allfracture types (e.g., rib, clavicle and pelvis fractures).Therefore, the same imputation via hip fracture incidenceand Swedish risk of “other fractures” was made for thecombined incidence of “other fractures” in the UK.
Table 31 Incidence of “other” fractures (per 10,000) by age and sex inthe EU5 and Sweden
Age intervals (years)
Country 50-54
55-59
60-64
65-69
70-74
75-79
80-84
85-89
Men
France 20 49 50 49 69 60 183 334
Germany 31 125 45 102 123 79 276 343
Italy 25 45 43 71 115 84 207 504
Spain 6 25 49 31 65 45 140 299
Sweden 72 82 85 129 136 248 457 521
UK 55 96 61 120 142 126 432 496
Women
France 19 41 20 48 70 124 219 384
Germany 25 70 39 98 120 164 219 440
Italy 30 59 30 74 93 163 233 448
Spain 11 29 15 33 60 96 176 362
Sweden 49 54 78 125 187 293 459 753
UK 45 54 53 115 139 260 342 635
3.4 Number of fractures
The number of new fractures in 2010 was estimated at 2.35million in the EU5 and 2.46 million when Sweden wasincluded (Table 32). Of these 67% were in women. Themajority of the fractures sustained were “other” fracturesfollowed by hip, forearm and clinical vertebral fractures. Abouttwice as many fractures were found in women than in men.Individuals 75 years of age or older sustained the majority ofthe vertebral and hip fractures whilst most of the forearmfractures incurred in the younger population (Table 33).
Table 32 Summary of new fractures in 2010 in women and men aged50 years or more
Site of fracture
Country Hip Vertebral a Forearm "Other" All sites
Women
Sweden 14,785 10,529 13,580 31,871 70,765
Spain 29,866 18,936 24,928 64,803 138,533
France 55,658 36,691 47,647 118,903 258,899
Italy 70,323 50,602 65,943 152,721 339,590
UK 56,735 40,369 54,309 191,781 343,194
Germany 98,824 76,460 100,148 219,452 494,884
EU5 311,406 223,058 292,975 747,660 1,575,100
EU5+ 326,191 233,587 306,555 779,531 1,645,865
Men
Sweden 5,507 5,910 2,809 21,985 36,211
Spain 10,370 10,425 4,523 38,928 64,246
France 18,700 19,511 8,980 73,402 120,593
Italy 26,254 26,964 11,435 98,090 162,744
UK 22,757 25,414 12,401 130,817 191,388
Germany 33,890 38,934 19,566 146,934 239,324
EU5 111,971 121,248 56,905 488,171 778,295
EU5+ 117,478 127,158 59,714 510,156 814,506
Men and women
EU5 423,377 344,306 349,880 1,235,831 2,353,395
EU5+ 443,669 360,745 366,269 1,289,687 2,460,371
a clinical vertebral fracture
Arch Osteoporos

Table 33 Estimated number of incident fractures by country and age inthe population aged 50 years or more
Ageintervals(years)
Sweden Germany France Italy Spain UK EU5+
Hip fractures
50-74 4,697 39,282 13,091 20,852 6,607 18,451 102,980
75+ 15,595 93,432 61,268 75,725 33,629 61,041 340,689
Clinical vertebral fractures
50-74 7,551 61,506 21,793 33,232 10,615 30,806 165,503
75+ 8,888 53,888 34,409 44,335 18,746 34,977 195,243
Forearm fractures
50-74 9,837 78,701 29,763 44,126 14,344 40,357 217,128
75+ 6,552 41,013 26,864 33,252 15,107 26,353 149,141
"Other" fractures
50-74 22,159 181,308 66,240 94,967 32,365 135,635 532,674
75+ 31,697 185,078 126,064 155,845 71,367 186,963 757,013
3.4.1 Prevalence of fractures
For the purposes of this report, a prevalent fracture was definedas a historical fracture in a person who was alive during theindex year (i.e., 2010). Historical fractures that came to clinicalattention when the person was younger than 50 years were notincluded. Multiple fractures in one individual were onlycounted as one prevalent fracture. Fractures that occurred inthe index year are not counted as prevalent fractures. Data onthe prevalence of hip and vertebral fractures were not availablefrom the European literature and were therefore simulated. Amicro-simulation model, programmed in TreeAge, was used tosimulate the prevalence of hip and vertebral fractures fromincidence data. The micro-simulation model was populatedwith the hip and clinical vertebral fracture incidence datadescribed in section 2.2, normal population mortality [53], andSwedish relative risks of post-fracture mortality [54]. Agespecific prevalences of hip and clinical vertebral fracture weremultiplied by the age-specific population in each country [1].Simulated prevalences are shown in Table 34. The total numberof women and men with a prevalent hip or clinical vertebralfracture was estimated at 5.4 million in the EU5+ (Table 35).
Table 34 Estimated proportion of the population (%) at the ageintervals shown with one or more prior hip and vertebral fracture
Prevalence of hip fracture, women
50-64 65-74 75-84 85+
Sweden 0.4% 2.0% 7.0% 19.1%
Spain 0.1% 0.8% 3.2% 11.3%
France 0.2% 1.1% 4.2% 13.3%
Italy 0.3% 1.6% 5.3% 15.0%
UK 0.3% 1.3% 4.8% 14.8%
Germany 0.3% 1.9% 5.4% 13.9%
Prevalence of hip fracture, men
Sweden 0.5% 1.6% 4.6% 11.9%
Spain 0.1% 0.5% 1.7% 6.0%
France 0.2% 0.8% 2.1% 6.3%
Italy 0.3% 1.0% 2.8% 8.2%
UK 0.3% 1.1% 2.8% 8.4%
Germany 0.3% 1.2% 2.9% 7.6%
Prevalence of clinical vertebral fracture, women
Sweden 1.0% 3.4% 8.1% 14.8%
Spain 0.3% 1.3% 3.5% 7.6%
France 0.4% 1.7% 4.4% 9.2%
Italy 0.7% 2.5% 5.5% 10.1%
UK 0.7% 2.1% 4.8% 10.3%
Germany 0.7% 3.1% 6.2% 10.1%
Prevalence clinical vertebral fracture, men
Sweden 1.0% 2.3% 4.5% 9.1%
Spain 0.2% 0.9% 1.7% 4.1%
France 0.4% 1.2% 2.3% 5.3%
Italy 0.5% 1.5% 2.8% 6.3%
UK 0.6% 1.7% 2.7% 6.1%
Germany 0.6% 1.8% 3.0% 5.5%
Table 35 Estimated number of women and men older than 50 yearswith a prevalent hip or clinical vertebral fracture
Hip fractures Vertebral fractures
WomenSweden
67,373 75,082
Spain 156,806 152,973
France 293,632 286,532
Italy 386,168 387,458
UK 295,682 294,428
Germany 494,637 557,961
EU5 1,626,926 1,679,352
EU5+ 1,694,299 1,754,434
MenSweden
32,013 36,467
Spain 53,297 58,274
France 94,549 113,654
Italy 132,362 150,643
UK 123,849 143,824
Germany 177,109 217,012
EU5 581,165 683,407
EU5+ 613,178 719,874
The proportion of past hip or vertebral fractures thatengendered disability in 2010 is unknown but will likelydepend on fracture site, the time since fracture, and thepatient’s age. The number of prior fractures variedconsiderably by age and the majority were found in theelderly. In total, prevalent vertebral fractures were morecommon than prior hip fractures because they on averagewill occur in younger patients, who are larger in numberand with a longer life-expectancy after fracture.
Arch Osteoporos

3.5 Mortality due to osteoporosis and fracture
Osteoporosis is associated with an increase in mortality thatis independent of a prior fracture [55–57]. Over and abovethis excess mortality, some fracture sites are associated withincreased mortality. Although the mortality after a fracturehas been shown to be higher for men compared to women[56], this difference is less marked when relating themortality to that of the general population of the same sex[58, 59]. In health economic studies of osteoporosis it is theexcess mortality that would be avoided in the absence of afracture that is important to consider.
3.5.1 Mortality due to hip fracture
Excess mortality is well described after hip fracture. In thefirst year following hip fracture, mortality risk varies inwomen from 2.0 to greater than 10 depending upon age [56,58, 60–62]. Several studies have shown that mortality ishighest in the immediate fracture period and then decreaseswith time but remains higher than that of the generalpopulation [57, 62, 63]. Mortality rates after hip fractureappear to have remained constant over the past 20 years [60].
Since hip fracture patients have high co-existing morbidity,poor pre-fracture health is likely to contribute to the excessmortality. Case control studies adjusting for pre-fracturemorbidity indicate that a substantial component of the deathrisk can be attributed to co-morbidity [64, 65]. Irrespective ofthe attribution, it is difficult to determine the quantum ofexcess mortality that would be avoided in the absence of hipfracture [66]. It has been argued that the acute increment inmortality over the first 6 months is causally related to thefracture event and that death would be avoided by avoidingthe fracture. During this period, excess mortality risk has beenestimated at 3.35 (95% CI = 1.50-7.47) compared to asubsequent risk of 1.30 (95% CI = 0.85-1.98) [64].
A review of case-notes by Parker and Anand [67]estimated that 33% of deaths up to 6 months after hipfracture were totally unrelated to the hip fracture, 42%possibly related and 25% directly related. These figureswere not however stratified by age or sex and causality isbased on opinion. Extrapolation of the data to one yearsuggests that 48% of all deaths may be related to the hipfracture event [68]. Notwithstanding, hip fracture resultedin more deaths than other major causes of death such assuicide and transport accidents [69].
In a large study of 160,000 hip fracture cases in 28.8million hospital person-years the risk of death of those witha somewhat earlier hip fracture was compared to the risk ofdeath in individuals of the same age with a later hipfracture. Two individuals of the same age, but with adifferent time interval between their fractures, had an equalmortality provided that the time interval between the two
fractures exceeded one year. The difference in mortality ofless than one year can be ascribed to causally relateddeaths, i.e., the death would have been avoided had the hipfracture not occurred. The analysis suggested that approx-imately 24% of all deaths might be causally related to thehip fracture itself [70].
In keeping with the findings mentioned above, we haveassumed that 30% of the excess mortality after a hipfracture is related to the fracture itself. Age differentiatedestimates of relative mortality after a hip fracture (Table36), derived from a Swedish population study [57], wereused in this report. Thereby it was implicitly assumed thatthe relative mortality after a hip fracture in the EU5 iscomparable to that in Sweden.
3.5.2 Mortality due to vertebral fracture
Several studies have shown an increase in mortalityfollowing vertebral fracture [62, 71]. In one study, womenwith one or more vertebral fracture had a 1.23-fold greaterage-adjusted mortality rate (95% CI = 1.10-1.37). Unlikefor hip fracture, there was no acute excess documented [62,71]. It is notable that low BMD is also associated withexcess mortality [55–57], but the degree of increasedmortality after vertebral fracture is greater than thatexpected from low BMD.
These studies used morphometric rather than clinicaldefinitions of vertebral fracture. In contrast, other studiesthat examine mortality after vertebral fracture usingclinical criteria have shown more marked increases inmortality [56, 57, 72]. In one study from Australia,vertebral fractures in women were associated with anage-standardised risk of 1.92 (95% CI = 1.70-2.14) [56],and in another study, the risk was more than 8-fold higher[72]. A study on clinical fractures from the UK comparedmortality in patients with osteoporosis (and no fracture) tomortality in women with established vertebral osteoporosis[73]. The hazard ratio was 4.4 (95% CI = 1.85-10.6).Although absolute mortality amongst men after vertebralfracture is higher than amongst women [57], the relativemortality with fracture compared to population mortalityrates ratio was similar.
Unlike for morphometric deformities, the pattern ofmortality after clinical vertebral fracture is non-linearsuggesting, as is the case for hip fracture, that a fractionof deaths would not have occurred in the absence of afracture. Using the patient register for hospital admissionsin Sweden 28% of all deaths associated with vertebralfracture were judged to be causally related [74]. Theexcess mortality compared with the general population hasbeen shown to decline with increasing age. Thus, using asingle estimate of the average relative mortality mayunderestimate fracture related mortality in the younger
Arch Osteoporos

(approximately 50-70 years) and overestimate mortality inthe elderly (80+ years). For this reason we used age-differentiated estimates of relative mortality (Table 36)based on Swedish mortality data after clinical vertebralfracture [54, 57].
3.5.3 Mortality due to other osteoporotic fractures
We have assumed no increase in mortality from forearmfractures consistent with published surveys [56, 57, 62, 72].For “other” fractures, we assumed a relative mortality of1.22 [15, 54, 75].
3.5.4 Mortality estimates for the EU5
Most data relating to mortality associated with fracture arederived from outside the EU5. For the purposes of thisreport we assumed that the relative risk of death was similarin EU5 countries and comparable to Sweden [57, 58, 76],though the absolute risk of death will vary according tomortality rates in each of the EU5 countries. The excessmortality from fracture expressed in relative risks (Table 36)was multiplied by general population mortality to estimateabsolute mortality the year after fracture in each analysedcountry.
Table 36 Relative risk of death 1st year after fracture relative to normalpopulationa (derived from [57])
Age Women Men
Hip fracture Clinical vertebralfracture
Hip fracture Clinical vertebralfracture
50 9.5 12.1 15.0 17.8
55 8.4 10.1 11.7 13.2
60 7.9 9.0 9.1 9.7
65 6.6 7.4 7.1 7.2
70 5.8 6.0 5.9 5.6
75 4.5 4.4 4.7 4.3
80 3.0 2.8 3.6 3.1
85 2.3 1.9 3.0 2.5
90 1.6 1.4 2.8 2.1
a Not adjusted for comorbidities
3.5.5 Deaths due to fractures
Using the data for mortality and the estimated number ofincident fractures allows the estimation of deaths due tofractures. It was conservatively assumed that fractures wereonly associated with mortality during the first year afterfracture and that 30% of the excess mortality (Table 36) was
caused by the fracture itself. Even though the mortalityrelative to the normal population decreases with age (Table36), the absolute mortality in women caused by fractureswas estimated to increase from 4-7 deaths/1,000 hipfractures at age 50 years to 21–31 deaths/1,000 hipfractures at age 90 years (Table 37). The number of causallyrelated deaths per 1,000 hip fractures in men was generallyhigher than for women. This is caused by higher age-specific excess mortality and underlying normal mortalityin men compared with women.
Table 37 The incidence by age of causally related deaths the first yearafter hip fracture/1,000 fractures for the EU5 and Sweden
Women
Age Germany UK Spain France Italy Sweden
50 6 7 5 7 4 4
55 8 8 5 7 6 6
60 10 11 8 10 9 9
65 12 15 10 10 11 12
70 18 22 14 14 15 17
75 25 29 20 18 20 19
80 28 29 23 19 23 21
85 35 34 31 26 29 27
90 31 27 27 21 26 25
Men
Age Germany UK Spain France Italy Sweden
50 19 16 18 23 12 10
55 23 19 20 25 16 15
60 25 22 25 26 20 16
65 29 27 29 26 24 21
70 37 36 34 32 31 27
75 47 46 42 39 42 35
80 54 56 50 48 51 43
85 72 72 67 63 66 63
90 109 103 99 88 102 100
When combining the number of incident fractures(Table 33) with the causally related excess mortality itwas estimated that approximately 34,000 deaths annuallyare caused by fractures in the EU5 and Sweden (Fig. 17and Table 38). As can be seen in Fig. 18 approximately49% of the fracture related deaths in women are causedby hip fractures, 26 % by clinical vertebral and 25% by“other” fractures. Corresponding proportions for men are46%, 34% and 19%, respectively. Even though abouttwo-thirds of all fractures occur in women it wasestimated that only half of the attributable deaths occurin women. The reasons relate to the higher generalpopulation mortality in men and the higher relative riskof death after fracture in men compared with women(Table 36).
Arch Osteoporos

Fig. 17 Causally related deaths within the first year after fracture in2010 (women and men combined)
0
1,000
2,000
3,000
4,000
5,000
6,000
hip fractures vertebral fractures "other" fracturesAtt
rub
uta
ble
dea
ths
wit
hin
12
mo
nth
s
Germany Italy UK France Spain Sweden
Table 38 Causally related deaths within the first year after fracture in 2010
Deaths causedby hipfractures
Deaths causedby vertebralfractures
Deaths causedby "other"fractures
Total
Women
Germany 2914 1620 1356 5890
UK 1635 879 1109 3623
Spain 753 335 348 1436
France 1164 565 514 2244
Italy 1708 882 782 3372
Sweden 346 179 158 683
EU5+ 8520 4460 4267 17247
Men
Germany 2416 1892 999 5307
UK 1582 1199 864 3645
Spain 679 467 243 1390
France 1129 816 419 2365
Italy 1726 1190 617 3534
Sweden 337 240 131 708
EU5+ 7871 5804 3273 16948
3.6 The probability of osteoporotic fracture and settingthe threshold for intervention
The probability of fracture at any given age dependsupon the hazard of death as well as the hazard offracture. Fracture probability is not to be confused withincidence since it defines the probability of fracture overa longer time frame (e.g., 10 years or lifetime) andincorporates both fracture risk and mortality. The prob-ability is further an estimate of the risk of sustaining afirst fracture at a given site whilst the incidence is thenumber of fractures occurring during the same definedtime interval. In general, remaining lifetime fractureprobability decreases with age especially after the ageof 70 years or so since the risk of death with ageoutstrips the increasing incidence of fracture with age.The remaining lifetime probability of fracture at the ageof 50 is shown in Table 39. Spain has the lowestestimated fracture risks with lifetime probability of majorosteoporotic fracture of 9% in men and 25.5% in womenfrom the age of 50 years. Sweden has the highestestimated lifetime probability; 25.5% and 49.1% fromthe age of 50 years for men and women, respectively.
Table 39 Remaining lifetime probability (%) of a hip and majorosteoporotic fracture in men and women aged 50 years from the EU5countries and Sweden
Germany UK Spain France Italy Sweden
Men
Hip fracture 5.3 4.8 3.9 5.6 6.1 12.7
Major osteoporoticfracture*
12.9 12.8 9.0 12.2 13.6 25.5
Women
Hip fracture 14.0 13.7 12.0 18.6 16.4 24.9
Major osteoporoticfracture*
31.4 36 25.5 35.9 35.7 49.1
*Major osteoporotic fracture includes fractures of the hip, spine, wrist,and proximal humerus
Estimates of lifetime probability are of value in consideringthe burden of osteoporosis in the community and forestimating the risk reduction from interventions to reducefuture risk. For several reasons they are less relevant forassessing risk of individuals in whom treatment might beenvisaged [77] so that the IOF and the WHO recommend thatrisk of fracture should be expressed as a probability over a tenyear interval [78]. The period of ten years covers the likelyduration of treatment and the benefits that may continue oncetreatment is stopped.
A major advantage of using fracture probability is that itstandardises the output from the multiple techniques and
Fig. 18 The proportion (%) of deaths due to fracture by site in menand women from the EU5 and Sweden in 2010
49%
26%
25%
46%
34%
19%
Hip Vertebral
Women
Men
Other
Arch Osteoporos
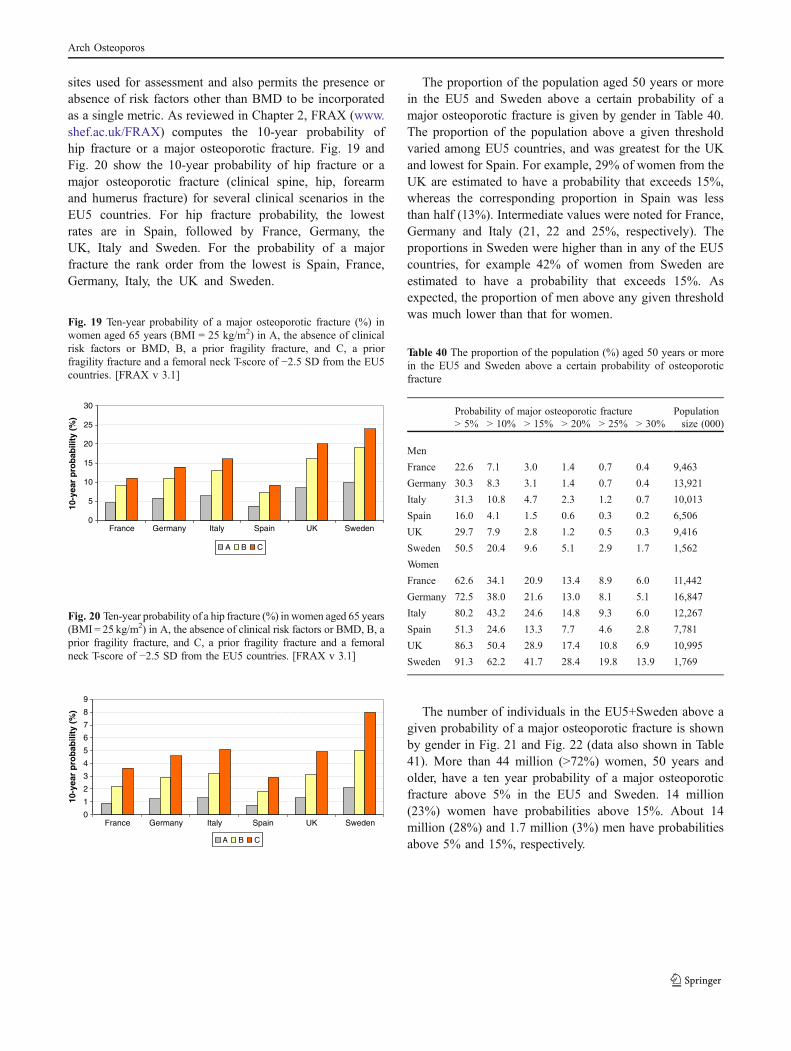
sites used for assessment and also permits the presence orabsence of risk factors other than BMD to be incorporatedas a single metric. As reviewed in Chapter 2, FRAX (www.shef.ac.uk/FRAX) computes the 10-year probability ofhip fracture or a major osteoporotic fracture. Fig. 19 andFig. 20 show the 10-year probability of hip fracture or amajor osteoporotic fracture (clinical spine, hip, forearmand humerus fracture) for several clinical scenarios in theEU5 countries. For hip fracture probability, the lowestrates are in Spain, followed by France, Germany, theUK, Italy and Sweden. For the probability of a majorfracture the rank order from the lowest is Spain, France,Germany, Italy, the UK and Sweden.
Fig. 19 Ten-year probability of a major osteoporotic fracture (%) inwomen aged 65 years (BMI = 25 kg/m2) in A, the absence of clinicalrisk factors or BMD, B, a prior fragility fracture, and C, a priorfragility fracture and a femoral neck T-score of −2.5 SD from the EU5countries. [FRAX v 3.1]
0
5
10
15
20
25
30
France Germany Italy Spain UK Sweden
10-y
ear
pro
bab
ility
(%
)
A B C
Fig. 20 Ten-year probability of a hip fracture (%) in women aged 65 years(BMI = 25 kg/m2) in A, the absence of clinical risk factors or BMD, B, aprior fragility fracture, and C, a prior fragility fracture and a femoralneck T-score of −2.5 SD from the EU5 countries. [FRAX v 3.1]
0
1
2
3
4
5
6
7
8
9
France Germany Italy Spain UK Sweden
10-y
ear
pro
bab
ility
(%
)
A B C
The proportion of the population aged 50 years or morein the EU5 and Sweden above a certain probability of amajor osteoporotic fracture is given by gender in Table 40.The proportion of the population above a given thresholdvaried among EU5 countries, and was greatest for the UKand lowest for Spain. For example, 29% of women from theUK are estimated to have a probability that exceeds 15%,whereas the corresponding proportion in Spain was lessthan half (13%). Intermediate values were noted for France,Germany and Italy (21, 22 and 25%, respectively). Theproportions in Sweden were higher than in any of the EU5countries, for example 42% of women from Sweden areestimated to have a probability that exceeds 15%. Asexpected, the proportion of men above any given thresholdwas much lower than that for women.
Table 40 The proportion of the population (%) aged 50 years or morein the EU5 and Sweden above a certain probability of osteoporoticfracture
Probability of major osteoporotic fracture Populationsize (000)> 5% > 10% > 15% > 20% > 25% > 30%
Men
France 22.6 7.1 3.0 1.4 0.7 0.4 9,463
Germany 30.3 8.3 3.1 1.4 0.7 0.4 13,921
Italy 31.3 10.8 4.7 2.3 1.2 0.7 10,013
Spain 16.0 4.1 1.5 0.6 0.3 0.2 6,506
UK 29.7 7.9 2.8 1.2 0.5 0.3 9,416
Sweden 50.5 20.4 9.6 5.1 2.9 1.7 1,562
Women
France 62.6 34.1 20.9 13.4 8.9 6.0 11,442
Germany 72.5 38.0 21.6 13.0 8.1 5.1 16,847
Italy 80.2 43.2 24.6 14.8 9.3 6.0 12,267
Spain 51.3 24.6 13.3 7.7 4.6 2.8 7,781
UK 86.3 50.4 28.9 17.4 10.8 6.9 10,995
Sweden 91.3 62.2 41.7 28.4 19.8 13.9 1,769
The number of individuals in the EU5+Sweden above agiven probability of a major osteoporotic fracture is shownby gender in Fig. 21 and Fig. 22 (data also shown in Table41). More than 44 million (>72%) women, 50 years andolder, have a ten year probability of a major osteoporoticfracture above 5% in the EU5 and Sweden. 14 million(23%) women have probabilities above 15%. About 14million (28%) and 1.7 million (3%) men have probabilitiesabove 5% and 15%, respectively.
Arch Osteoporos

Fig. 21 Number of women (in thousands), 50 years and older, in EU5 and Sweden above given probabilities of a major osteoporotic fracture
0
5000
10000
15000
20000
25000
30000
35000
40000
45000
> 5% > 10% > 15% > 20% > 25% > 30%
10-year probability of osteoporotic fracture
Nu
mb
er (
000)
France Germany Italy Spain UK Sweden
Fig. 22 Number of men (in thousands), 50 years and older, in EU5 and Sweden above certain probabilities of a major osteoporotic fracture
0
2000
4000
6000
8000
10000
12000
14000
> 5% > 10% > 15% > 20% > 25% > 30%
10-year probability of osteoporotic fracture
Nu
mb
er (
1000
)
France Germany Italy Spain UK Sweden
Table 41 Number of men and women (in thousands), 50 years andolder, 5932 in EU5 and Sweden above given probabilities of a major5933 osteoporotic fracture
Probability of major osteoporotic fracture
> 5% > 10% > 15% > 20% > 25% > 30%
Men
France 2,139 672 284 132 66 38
Germany 4,218 1,155 432 195 97 56
Italy 3,134 1,081 471 230 120 70
Spain 1,041 267 98 39 20 13
UK 2,797 744 264 113 47 28
Sweden 789 319 150 80 45 27
EU5+ 14,117 4,238 1,697 789 396 231
Women
France 7,163 3,902 2,391 1,533 1,018 687
Germany 12,214 6,402 3,639 2,190 1,365 859
Italy 9,838 5,299 3,018 1,816 1,141 736
Spain 3,992 1,914 1,035 599 358 218
UK 9,489 5,541 3,178 1,913 1,187 759
Sweden 1,615 1,100 738 502 350 246
EU5+ 44,310 24,159 13,998 8,554 5,419 3,504
Arch Osteoporos
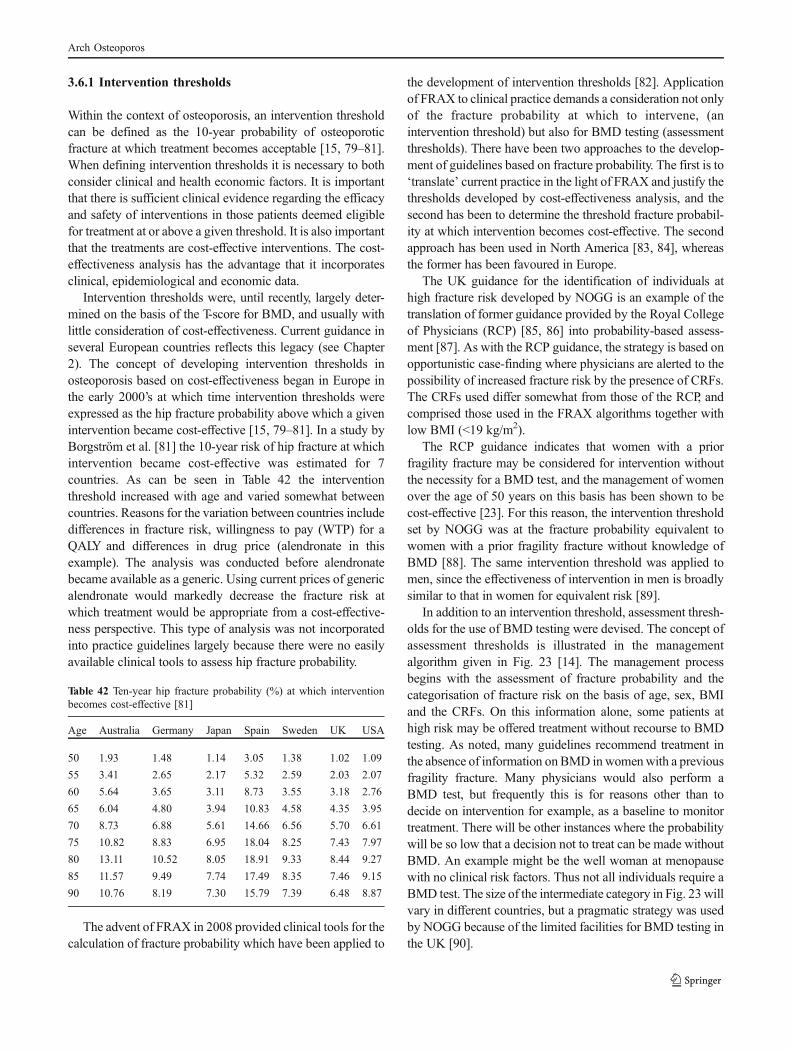
3.6.1 Intervention thresholds
Within the context of osteoporosis, an intervention thresholdcan be defined as the 10-year probability of osteoporoticfracture at which treatment becomes acceptable [15, 79–81].When defining intervention thresholds it is necessary to bothconsider clinical and health economic factors. It is importantthat there is sufficient clinical evidence regarding the efficacyand safety of interventions in those patients deemed eligiblefor treatment at or above a given threshold. It is also importantthat the treatments are cost-effective interventions. The cost-effectiveness analysis has the advantage that it incorporatesclinical, epidemiological and economic data.
Intervention thresholds were, until recently, largely deter-mined on the basis of the T-score for BMD, and usually withlittle consideration of cost-effectiveness. Current guidance inseveral European countries reflects this legacy (see Chapter2). The concept of developing intervention thresholds inosteoporosis based on cost-effectiveness began in Europe inthe early 2000’s at which time intervention thresholds wereexpressed as the hip fracture probability above which a givenintervention became cost-effective [15, 79–81]. In a study byBorgström et al. [81] the 10-year risk of hip fracture at whichintervention became cost-effective was estimated for 7countries. As can be seen in Table 42 the interventionthreshold increased with age and varied somewhat betweencountries. Reasons for the variation between countries includedifferences in fracture risk, willingness to pay (WTP) for aQALY and differences in drug price (alendronate in thisexample). The analysis was conducted before alendronatebecame available as a generic. Using current prices of genericalendronate would markedly decrease the fracture risk atwhich treatment would be appropriate from a cost-effective-ness perspective. This type of analysis was not incorporatedinto practice guidelines largely because there were no easilyavailable clinical tools to assess hip fracture probability.
Table 42 Ten-year hip fracture probability (%) at which interventionbecomes cost-effective [81]
Age Australia Germany Japan Spain Sweden UK USA
50 1.93 1.48 1.14 3.05 1.38 1.02 1.09
55 3.41 2.65 2.17 5.32 2.59 2.03 2.07
60 5.64 3.65 3.11 8.73 3.55 3.18 2.76
65 6.04 4.80 3.94 10.83 4.58 4.35 3.95
70 8.73 6.88 5.61 14.66 6.56 5.70 6.61
75 10.82 8.83 6.95 18.04 8.25 7.43 7.97
80 13.11 10.52 8.05 18.91 9.33 8.44 9.27
85 11.57 9.49 7.74 17.49 8.35 7.46 9.15
90 10.76 8.19 7.30 15.79 7.39 6.48 8.87
The advent of FRAX in 2008 provided clinical tools for thecalculation of fracture probability which have been applied to
the development of intervention thresholds [82]. Applicationof FRAX to clinical practice demands a consideration not onlyof the fracture probability at which to intervene, (anintervention threshold) but also for BMD testing (assessmentthresholds). There have been two approaches to the develop-ment of guidelines based on fracture probability. The first is to‘translate’ current practice in the light of FRAX and justify thethresholds developed by cost-effectiveness analysis, and thesecond has been to determine the threshold fracture probabil-ity at which intervention becomes cost-effective. The secondapproach has been used in North America [83, 84], whereasthe former has been favoured in Europe.
The UK guidance for the identification of individuals athigh fracture risk developed by NOGG is an example of thetranslation of former guidance provided by the Royal Collegeof Physicians (RCP) [85, 86] into probability-based assess-ment [87]. As with the RCP guidance, the strategy is based onopportunistic case-finding where physicians are alerted to thepossibility of increased fracture risk by the presence of CRFs.The CRFs used differ somewhat from those of the RCP, andcomprised those used in the FRAX algorithms together withlow BMI (<19 kg/m2).
The RCP guidance indicates that women with a priorfragility fracture may be considered for intervention withoutthe necessity for a BMD test, and the management of womenover the age of 50 years on this basis has been shown to becost-effective [23]. For this reason, the intervention thresholdset by NOGG was at the fracture probability equivalent towomen with a prior fragility fracture without knowledge ofBMD [88]. The same intervention threshold was applied tomen, since the effectiveness of intervention in men is broadlysimilar to that in women for equivalent risk [89].
In addition to an intervention threshold, assessment thresh-olds for the use of BMD testing were devised. The concept ofassessment thresholds is illustrated in the managementalgorithm given in Fig. 23 [14]. The management processbegins with the assessment of fracture probability and thecategorisation of fracture risk on the basis of age, sex, BMIand the CRFs. On this information alone, some patients athigh risk may be offered treatment without recourse to BMDtesting. As noted, many guidelines recommend treatment inthe absence of information onBMD inwomenwith a previousfragility fracture. Many physicians would also perform aBMD test, but frequently this is for reasons other than todecide on intervention for example, as a baseline to monitortreatment. There will be other instances where the probabilitywill be so low that a decision not to treat can be made withoutBMD. An example might be the well woman at menopausewith no clinical risk factors. Thus not all individuals require aBMD test. The size of the intermediate category in Fig. 23 willvary in different countries, but a pragmatic strategy was usedby NOGG because of the limited facilities for BMD testing inthe UK [90].
Arch Osteoporos

Fig. 23 Management algorithm for the assessment of individuals atrisk of fracture [14]
CRFs
Fractureprobability
High
Treat
Intermediate Low
BMD
Reassessprobability
High Low
Treat
The NOGG management strategy requires considerationof two additional thresholds:
& a threshold probability below which neither treatment nor aBMD test should be considered (lower assessment threshold)
& a threshold probability above which treatment may berecommended irrespective of BMD (upper assessmentthreshold)
The lower assessment threshold was set to exclude arequirement for BMD testing in women of average BMI(24 kg/m2) with weak or no clinical risk factors, as given inthe RCP and European guidelines. The upper threshold waschosen to minimise the probability that a patient character-ised to be at high risk on the basis of clinical risk factorsalone would be reclassified to be at low risk with additionalinformation on BMD [91]. The management algorithm isshown in Fig. 24 and summarised thereafter [87].
This translational approach from existing treatmentguidelines is characterised by an intervention thresholdthat increases progressively with age. The major reasonfor this is that the source guidelines took little or noaccount of age. In the UK, for example, intervention isrecommended in women with a prior fragility fracture,irrespective of age. Since age is an important indepen-dent determinant of fracture risk, the fracture probabilityof an individual with a prior fracture is higher at the ageof 70 years than at the age of 50 years. This age-dependent increase in the intervention threshold is notfound when intervention thresholds are derived fromhealth economic analyses alone [87].
The NOGG guideline provides an opportunity to applythe same approach to other countries and to determine theburden of disease in terms of FRAX. In other words todetermine the number of individuals that have a fractureprobability that is equivalent to or exceeds the age andcountry specific probability of fracture in a woman with aprior fragility fracture
The 10-year probability of a major osteoporoticfracture equivalent to women with a previous fracture(no other clinical risk factors, an average body massindex and without the knowledge of the patient’s BMD)are provided in Table 43 for the EU5 countries andSweden.
Table 43 FRAX 10-year probability (%) of a major osteoporoticfracture in women with a previous fracture (no other clinical riskfactors, a body mass index of 24 kg/m2 and without BMD)
Age Germany UK Spain France Italy Sweden
52 7.1 8.2 3.7 5.5 7.4 10.1
57 7.8 10.6 4.6 6.3 8.5 13.0
62 10.2 14.0 6.2 8.0 11.2 17.3
67 13.9 18.2 9.0 11.1 15.1 22.5
72 18.1 21.6 12.6 15.8 18.9 28.8
77 23.2 25.3 18.0 22.2 23.9 35.5
82 28.9 30.1 23.5 30.4 29.9 41.0
87 30.6 33.2 23.6 36.0 31.0 41.2
The proportion of men and women who exceed thisthreshold value was computed by simulation based on thedistribution of the risk-score among the cohorts used byWHO to develop FRAX and the epidemiology of fractureand death in each EU5 country. Table 44 and Table 45 showthe proportion of men and women in the EU5 with aprobability of major osteoporotic fracture exceeding that ofa woman with a previous fracture and no other CRFs, anaverage BMI, and unknown BMD.
The proportion of the population that could be eligiblefor treatment varied between countries and by age and sex.The relative difference between countries is larger in men
Fig. 24 NOGG management chart for osteoporosis showing therelationship between 10-year probability of a major fracture and age.The dotted line gives the intervention threshold [87]
Consider treatment
Measure BMD
No treatment
Ten year probability (%)
0
10
20
30
40
50
40 50 60 70 80 90
Age (years)
Arch Osteoporos

than in women. The UK appears to have one of the highestproportion of women falling above the threshold but lowestproportion of men. This variation across countries is causedby differences in fracture risk between women and men anddifferences in population prevalences of the risk factorsused by FRAX.
Table 44 Proportion (%) of men at each age group that have aprobability for osteoporotic fracture above that equivalent to womenwith a prior fracture and a BMI of 24 kg/m2
Age group France Germany Spain Italy UK Sweden
50-55 2.5 3.4 3.1 0.7 0.9 2.6
55-60 4.5 6.8 6.3 1.7 1.0 2.2
60-65 2.6 3.8 3.4 2.1 1.2 1.9
65-70 1.9 2.1 2.1 2.3 1.5 2.1
70-75 2.2 2.2 2.2 2.5 1.5 3.1
75-80 2.5 2.6 2.3 3.2 1.4 3.6
80-85 2.4 3.0 2.6 4.1 1.2 2.8
85- 1.5 2.3 1.8 3.5 0.9 1.3
All (weighted) 2.7 3.6 3.3 2.2 1.2 1.3
Table 45 Proportion (%) of women at each age group that have aprobability for osteoporotic fracture above that equivalent to womenwith a prior fracture and a BMI of 24 kg/m2
Age group France Germany Spain Italy UK Sweden
50-55 19.1 16.2 20.5 22.4 19.5 16.4
55-60 17.6 15.0 16.3 21.4 20.7 19.0
60-65 19.7 17.9 19.4 20.0 20.7 20.4
65-70 23.2 21.7 23.1 21.8 21.2 23.2
70-75 23.0 21.6 22.7 21.6 21.5 22.9
75-80 22.9 21.0 22.6 21.2 21.1 22.9
80-85 20.8 19.1 20.3 18.7 19.9 20.4
85- 17.7 17.1 17.4 16.3 18.7 16.7
All (weighted) 20.2 18.6 20.2 20.7 20.5 20.1
The number of women and men that could beconsidered eligible for an osteoporosis treatment in EU5based on the translational approach is shown in Fig. 25,26 and Table 46. In all, 13.0 million women and 1.5million men fall above the threshold probability fortreatment. The rank order for women follows the samepattern as the total population sizes, i.e., Germany hasthe most patients and Sweden the least. Men however donot follow the same order. Germany has the most patientsabove the threshold and Sweden the least but UK standsout as having rather few patients above the thresholdrelative to its population size.
Fig. 25 Number (in thousands) of women at each age group that havea probability for osteoporotic fracture above that equivalent to womenwith a prior fracture and a BMI of 24 kg/m2
0
500
1000
1500
2000
2500
3000
3500
Num
ber (
000)
France UK Germany Italy Spain Sweden
50-59 60-69 70-79 80+
Fig. 26 Number (in thousands) of men at each age group that have aprobability for osteoporotic fracture above that equivalent to womenwith a prior fracture and a BMI of 24 kg/m2
0
100
200
300
400
500
600
Num
ber
(000
)
France UK Germany Italy Spain Sweden
50-59 60-69 70-79 80+
Table 46 Number (in thousands) of women and men at each age groupthat have a probability for osteoporotic fracture above that equivalentto women with a prior fracture and a BMI of 24 kg/m2
France UK Germany Italy Spain Sweden EU5+
Women
50–54 409 392 495 454 309 47 2106
55–59 367 377 414 402 213 54 1828
60–64 394 400 410 386 238 63 1891
65–69 311 323 526 361 246 62 1829
70–74 300 281 556 359 220 46 1762
75–79 295 231 376 309 222 38 1472
80–84 232 176 278 221 153 29 1089
85+ 207 185 247 195 122 29 985
Men
50–54 51 18 106 14 46 8 243
55–59 89 18 185 31 80 6 409
60–64 49 22 85 38 39 6 239
65–69 23 21 47 34 20 6 151
70–74 24 17 49 34 18 6 147
75–79 23 12 35 34 17 5 126
80–84 16 7 25 29 13 3 93
85+ 7 4 11 18 6 1 47
Arch Osteoporos
The translational approach is a fairly straightforwardmethod to determine country-specific intervention thresh-olds using the FRAX algorithm. It acknowledges currenttreatment guidelines, but the intervention thresholds are notdirectly linked to, or estimated from, a cost-effectivenessanalysis. However, it is still important to evaluate whetherthe thresholds for intervention using the translationalapproach provide a cost-effective treatment strategy. Relat-ing the results from a recent study that estimated the cost-effectiveness of generic alendronate compared to notreatment using the FRAX tool for fracture risk estimation(further described in Chapter 2) treatment would be cost-effective at and above the threshold probability at any agein the UK [23]. Similar studies using FRAX directly as aninstrument for fracture risk estimation within the cost-effectiveness analysis have not yet been conducted foralendronate in other countries.
Updated intervention thresholds based on cost-effec-tiveness using a generic price would likely suggest thatpeople at very low fracture risks, generally not consid-ered to be osteoporotic, would be eligible for treatment.These low-risk patients are difficult to identify in normalcurrent practice and identification of such patients wouldrequire screening programs. However, the implementa-tions of such a programme would be associated withadditional costs for identification which would need tobe considered in the cost-effectiveness analysis and thethresholds and to date, few such studies have beencarried out. Another issue is that there is a lack ofavailable clinical evidence on the fracture risk reductionwith available drugs in low fracture risk populations. Forthese reasons intervention thresholds based on thetranslational approach were used in this report inChapters 4 and 6 when analysing the treatment uptakeand estimating the future burden of osteoporosis.
References
1. Department of Economic and Social Affairs -Population Division (2008) World Population Pros-pects. http://www.un.org/esa/population/ Accessed 24May 2011
2. Looker AC, Wahner HW, Dunn WL et al (1998)Updated data on proximal femur bone mineral levelsof US adults. Osteoporos Int 8: 468–89
3. Arlot ME, Sornay-Rendu E, Garnero P, Vey-Marty B,Delmas PD (1997) Apparent pre- and postmenopausalbone loss evaluated by DXA at different skeletal sitesin women: the OFELY cohort. J Bone Miner Res 12:683–90
4. Lehmann R, Wapniarz M, Randerath O et al (1995) Dual-energy X-ray absorptiometry at the lumbar spine inGerman men and women: a cross-sectional study. CalcifTissue Int 56: 350–4
5. Smeets-Goevaers CG, Lesusink GL, Papapoulos SEet al (1998) The prevalence of low bone mineraldensity in Dutch perimenopausal women: the Eind-hoven perimenopausal osteoporosis study. OsteoporosInt 8: 404–9
6. De Laet CE, Van Hout BA, Burger H, Weel AE,Hofman A, Pols HA (1998) Hip fracture prediction inelderly men and women: validation in the Rotterdamstudy. J Bone Miner Res 13: 1587–93
7. Shipman AJ, Guy GW, Smith I, Ostlere S, Greer W,Smith R (1999) Vertebral bone mineral density, contentand area in 8789 normal women aged 33–73 years whohave never had hormone replacement therapy. Osteo-poros Int 9: 420–6
8. Ryan PJ, Spector TP, Blake GM, Doyle DV, Fogelman I(1993) A comparison of reference bone mineral densitymeasurements derived from two sources: referred andpopulation based. Br J Radiol 66: 1138–41
9. Holt G, Khaw KT, Reid DM et al (2002) Prevalence ofosteoporotic bone mineral density at the hip in Britaindiffers substantially from the US over 50 years of age:implications for clinical densitometry. Br J Radiol 75:736–42
10. Noon E, Singh S, Cuzick J et al (2010) Significantdifferences in UK and US female bone densityreference ranges. Osteoporos Int 21: 1871–80
11. Lunt M, Felsenberg D, Adams J et al (1997)Population-based geographic variations in DXAbone density in Europe: the EVOS Study. EuropeanVertebral Osteoporosis. Osteoporos Int 7: 175–89
12. Kanis JA, Johnell O, Oden A, Jonsson B, De Laet C,Dawson A (2000) Risk of hip fracture according to theWorld Health Organization criteria for osteopenia andosteoporosis. Bone 27: 585–90
13. Kanis JA, Johnell O, Oden A et al (2000) Long-termrisk of osteoporotic fracture in Malmo. Osteoporos Int11: 669–74
14. Kanis JA on behalf of the World Health OrganizationScientific Group (2007) Assessment of osteoporosis atthe primary health-care level. Technical Report. WHOCollaborating Centre, University of Sheffield, UK.
15. Kanis JA, Oden A, Johnell O et al (2001) The burden ofosteoporotic fractures: a method for setting interventionthresholds. Osteoporos Int 12: 417–27
16. Icks A, Haastert B, Wildner M et al (2008) Trend of hipfracture incidence in Germany 1995–2004: a popula-tion-based study. Osteoporos Int 19: 1139–45
Arch Osteoporos

17. Singer BR, McLauchlan GJ, Robinson CM, Christie J(1998) Epidemiology of fractures in 15,000 adults: theinfluence of age and gender. J Bone Joint Surg Br 80:243–8
18. Johansen A, Evans RJ, Stone MD, Richmond PW, LoSV, Woodhouse KW (1997) Fracture incidence inEngland and Wales: a study based on the populationof Cardiff. Injury 28: 655–60
19. van Staa TP, Dennison EM, Leufkens HG, Cooper C(2001) Epidemiology of fractures in England andWales. Bone 29: 517–22
20. Elffors I, Allander E, Kanis JA et al (1994) The variableincidence of hip fracture in southern Europe: theMEDOS Study. Osteoporos Int 4: 253–63
21. Borgström F, Ström O, Coelho J et al (2010) The cost-effectiveness of risedronate in the UK for the manage-ment of osteoporosis using the FRAX. Osteoporos Int21: 495–505
22. Borgström F, Ström O, Coelho J et al (2010) The cost-effectiveness of strontium ranelate in the UK for themanagement of osteoporosis. Osteoporos Int 21: 339–49
23. Kanis JA, Adams J, Borgström F et al (2008) The cost-effectiveness of alendronate in the management ofosteoporosis. Bone 42: 4–15
24. Kanis JA, Borgström F, Johnell O, Oden A, Sykes D,Jönsson B (2005) Cost-effectiveness of raloxifene inthe UK: an economic evaluation based on the MOREstudy. Osteoporos Int 16: 15–25
25. Stevenson M, Davis S (2006) Analyses of the cost-effectiveness of pooled alendronate and risedronate,compared with strontium ranelate, raloxifene, etidro-nate and teriparatide. http://www.nice.org.uk/page.aspx?o=370643 Accessed 24 May 2011
26. National Institute for Health and Clinical Excellence(2011) Alendronate, etidronate, risedronate, raloxifene,strontium ranelate and teriparatide for the secondaryprevention of osteoporotic fragility fractures in postmen-opausal women. Technology appraisal TA161. http://egap.evidence.nhs.uk/TA161 Accessed 24 May 2011
27. National Institute for Health and Clinical Excellence(2011) Alendronate, etidronate, risedronate, raloxifeneand strontium ranelate for the primary prevention ofosteoporotic fragility fractures in postmenopausalwomen. Technology appraisal TA160. http://guidance.nice.org.uk/TA160/ Accessed 24 May 2011
28. Diez A, Puig J, Martinez MT, Diez JL, Aubia J, VivancosJ (1989) Epidemiology of fractures of the proximal femurassociated with osteoporosis in Barcelona, Spain. CalcifTissue Int 44: 382–6
29. SanchezM, Sangrador G, Blanco I (1997) Epidemiologiade la fractura osteoporotica de cadera en la provincial deZamora. Rev Esp Salud Publica 71: 357–67
30. Sosa M, Segarra MC, Hernández D, González A,Limiñana JM, Betancor P (1993) Epidemiology ofproximal femoral fracture in Gran Canaria (CanaryIslands). Age Ageing 22: 285–8
31. Adolfo Diez Perez (2010) personal communication.32. P.D. Delmas (2006) personal communication.33. Institut National de la Statistique et des Etudes
Economiques (2010) http://www.insee.fr. Accessed 24May 2011
34. Maravic M, Le Bihan C, Landais P, Fardellone P(2005) Incidence and cost of osteoporotic fracturesin France during 2001. A methodological approachby the national hospital database. Osteoporos Int 16:1475–80
35. Maravic M, Taupin P, Landais P, Roux C (2010) Changein hip fracture incidence over the last 6 years in France.Osteoporos Int 22: 797–801
36. Baudoin C, Fardellone P, Potard V, Sebert JL (1993)Fractures of the proximal femur in Picardy, France, in1987. Osteoporos Int 3:43–9
37. Couris CM, Duclos A, Rabilloud M et al (2007) Aseventy percent overestimation of the burden of hipfractures in women aged 85 and over. Bone 41: 896–900
38. Kanis JA, Johnell O, De Laet C, Jonsson B, Oden A,Ogelsby AK (2002) International variations in hipfracture probabilities: implications for risk assessment.J Bone Miner Res 17: 1237–44
39. Ismail AA, Pye SR, Cockerill WC et al (2002)Incidence of limb fracture across Europe: results fromthe European Prospective Osteoporosis Study (EPOS).Osteoporos Int 13: 565–71
40. Johnell O, Borgstrom F, Jonsson B et al (2007)Latitude, socioeconomic prosperity, mobile phonesand hip fracture risk. Osteoporos Int 18: 333–7
41. Schwartz AV, Kelsey JL, Maggi S et al (1999)International variation in the incidence of hip fractures:cross-national project on osteoporosis for the WorldHealth Organization Program for Research on Aging.Osteoporos Int 9: 242–53
42. Gullberg B, Johnell O, Kanis JA (1997 )World-wideprojections for hip fracture. Osteoporos Int 7: 407–13.
43. Adami S (2006) personal communication.44. Johnell O, Gullberg B, Allander E, Kanis JA (1992)
The apparent incidence of hip fracture in Europe: astudy of national register sources. MEDOS StudyGroup. Osteoporos Int 2: 298–302
Arch Osteoporos

45. Bacon WE, Maggi S, Looker A et al (1996) Internationalcomparison of hip fracture rates in 1988–89. OsteoporosInt, 6: 69–75
46. Kanis JA, Pitt FA (1992) Epidemiology of osteoporo-sis. Bone 13: S7-15
47. Cooper C, O'Neill T, Silman A (1993) The epidemiologyof vertebral fractures. European Vertebral OsteoporosisStudy Group. Bone 14: S89-97
48. Kanis JA, Johnell O, Oden A et al (2004) The risk andburden of vertebral fractures in Sweden. Osteoporos Int15: 20–6
49. Lindsay R, Silverman SL, Cooper C et al (2001) Riskof new vertebral fracture in the year following afracture. JAMA 285: 320–3
50. van Staa TP, Abenhaim L, Cooper C, Zhang B,Leufkens HG (2000) The use of a large pharmacoepi-demiological database to study exposure to oralcorticosteroids and risk of fractures: validation of studypopulation and results. Pharmacoepidemiol Drug Saf9: 359–66
51. de Lusignan S, Valentin T, Chan Tet al (2004) Problemswith primary care data quality: osteoporosis as anexemplar. Inform Prim Care 12: 147–56
52. Felsenberg D, Silman AJ, Lunt et al (2002) Incidenceof vertebral fracture in Europe: results from theEuropean Prospective Osteoporosis Study (EPOS). JBone Miner Res 17: 716–24
53. Human Mortality Database. University of California,Berkeley (USA), and Max Planck Institute for Demo-graphic Research (Germany). Available at www.mortality.org. Accessed 27 October 2005
54. Jönsson B, Ström O, Eisman JA et al (2011) Cost-effectiveness of Denosumab for the treatment ofpostmenopausal osteoporosis. Osteoporos Int 22:967–82
55. Browner WS, Seeley DG, Vogt TM, Cummings SR(1991) Non-trauma mortality in elderly women withlow bone mineral density. Study of OsteoporoticFractures Research Group. Lancet 338: 355–8
56. Center JR, Nguyen TV, Schneider D, Sambrook PN,Eisman JA (1999) Mortality after all major types ofosteoporotic fracture in men and women: an observa-tional study. Lancet 353: 878–82
57. Johnell O, Kanis JA, Odén A et al (2004) Mortalityafter osteoporotic fractures. Osteoporos Int 15: 38–42
58. Oden A, Dawson A, Dere W, Johnell O, Jonsson B,Kanis JA (1998) Lifetime risk of hip fractures isunderestimated. Osteoporos Int 8: 599–603
59. Johnell O, Kanis JA, Odén A et al (2004) Fracturerisk following an osteoporotic fracture. OsteoporosInt 15: 175–9
60. Roberts SE, Goldacre MJ (2003) Time trends anddemography of mortality after fractured neck of femur
in an English population, 1968–98: database study.BMJ 327: 771–5
61. Forsén L, Sogaard AJ, Meyer HE, Edna T, Kopjar B(1999) Survival after hip fracture: short- and long-termexcess mortality according to age and gender. OsteoporosInt 10: 73–8
62. Cooper C, Atkinson EJ, Jacobsen SJ, O'Fallon WM,Melton LJ 3rd (1993) Population-based study of survivalafter osteoporotic fractures. Am J Epidemiol 137:1001–5
63. Johnell O, Haglund B (1999) Co-morbidity andmortality in hip fracture patients: a population-basedstudy. J Bone Miner Res 14: 160
64. Meyer HE, Tverdal A, Falch JA, Pedersen JI (2000)Factors associated with mortality after hip fracture.Osteoporos Int 11:228–32
65. Poór G, Atkinson EJ, O'Fallon WM, Melton LJ 3rd(1995) Determinants of reduced survival following hipfractures in men. Clin Orthop 319: 260–5
66. Bolland MJ, Grey AB, Gamble GD, Reid IR (2010)Effect of osteoporosis treatment on mortality: a meta-analysis. J Clin Endocrinol Metab 95: 1174–81
67. Parker MJ, Anand JK (1991) What is the true mortalityof hip fractures? Public Health 105: 443–6
68. Kanis JA, Brazier JE, Stevenson M, Calvert NW, LloydJones M (2002) Treatment of established osteoporosis:a systematic review and cost-utility analysis. HealthTechnol Assess 6: 1–146
69. Harris AH, Cumming R, Watts J, Ebeling P, Crowley S(1998) The burden of illness and the cost of osteopo-rosis in Australia. Centre for Health Program Evalua-tion. Technical Report, Melbourne Australia http://www.buseco.monash.edu.au/centres/che/pubs/tr8.pdfAccessed 24 May 2011
70. Kanis JA, Oden A, Johnell O, De Laet C, Jonsson B,Oglesby AK (2003) The components of excess mortal-ity after hip fracture. Bone 32: 468–73
71. Kado DM, Browner WS, Palermo L, Nevitt MC,Genant HK, Cummings SR (1999) Vertebral fracturesand mortality in older women: a prospective study.Study of Osteoporotic Fractures Research Group. ArchIntern Med 159:1215–20
72. Cauley JA, Thompson DE, Ensrud KC, Scott JC, BlackD (2000) Risk of mortality following clinical fractures.Osteoporos Int 11: 556–61
73. Jalava T, Sarna S, Pylkkänen L et al (2003) Associationbetween vertebral fracture and increased mortality inosteoporotic patients. J Bone Miner Res 18: 1254–60
74. Kanis JA, Oden A, Johnell O, De Laet C, Jonsson B(2004) Excess mortality after hospitalisation for vertebralfracture. Osteoporos Int 15: 108–12
75. Barrett JA, Baron JA, Beach ML (2003) Mortality andpulmonary embolism after fracture in the elderly.Osteoporos Int 14: 889–94
Arch Osteoporos

76. Haentjens P, Magaziner J, Colón-Emeric CS et al(2010) Meta-analysis: excess mortality after hipfracture among older women and men. Ann InternMed 152: 380–90
77. Kanis JA, Johnell O, Oden A, Dawson A, De Laet C,Jonsson B (2001) Ten year probabilities of osteoporoticfractures according to BMD and diagnostic thresholds.Osteoporos Int 12: 989–95
78. Kanis JA, Black D, Cooper C et al (2002) A newapproach to the development of assessment guidelinesfor osteoporosis. Osteoporos Int 13: 527–36
79. Kanis JA, Johnell O, Oden A, De Laet C, Oglesby A,Jönsson B (2002) Intervention thresholds for osteopo-rosis. Bone 31: 26–31
80. Kanis JA, Johnell O, Oden A et al (2005)Intervention thresholds for osteoporosis in men andwomen: a study based on data from Sweden.Osteoporos Int 16: 6–14
81. Borgström F, Johnell O, Kanis JA, Jönsson B, RehnbergC (2006) At what hip fracture risk is it cost-effective totreat? International intervention thresholds for the treat-ment of osteoporosis. Osteoporos Int 17: 1459–71
82. Kanis JA, McCloskey EV, Johansson H, Oden A, MeltonLJ 3rd, Khaltaev N (2008) A reference standard for thedescription of osteoporosis. Bone 42: 467–75
83. National Osteoporosis Foundation (2008) Clinician'sguide to prevention and treatment of osteoporosis.www.nof.org Accessed 24 May 2011
84. Tosteson AN, Melton LJ 3rd, Dawson-Hughes B et al(2008) Cost-effective osteoporosis treatment thresholds:the United States perspective. Osteoporos Int 19: 437–47
85. Royal College of Physicians and Bone and ToothSociety of Great Britain (1999) Osteoporosis: clinicalguidelines for the prevention and treatment. London
86. Royal College of Physicians and Bone and Tooth Societyof Great Britain (2000) Update on pharmacologicalinterventions and an algorithm for management. London
87. Kanis JA, McCloskey EV, Johansson H et al (2008)Case finding for the management of osteoporosis withFRAX – assessment and intervention thresholds for theUK. Osteoporos Int 19: 1395–408 (Erratum published2009 Osteoporos Int 20: 499–502)
88. Compston J, Cooper A, Cooper C et al (2009) Guide-lines for the diagnosis and management of osteoporosisin postmenopausal women and men from the age of50 years in the UK. Maturitas 62: 105–8
89. Kanis JA, Stevenson M, McCloskey EV, Davis S, Lloyd-Jones M (2007) Glucocorticoid-induced osteoporosis: asystematic review and cost-utility analysis. Health TechnolAssess 11: 1–231
90. Kanis JA, Johnell O (2005) Requirements for DXA for themanagement of osteoporosis in Europe. Osteoporos Int16: 229–38
91. Johansson H, OdenA, Johnell O et al (2004) Optimizationof BMD measurements to identify high risk groups fortreatment – a test analysis. J Bone Miner Res 19: 906–13
Arch Osteoporos

4 Burden of osteoporosis
SummaryThe objective of this section is to estimate the current
burden of osteoporosis in the five largest countries in theEuropean Union (Germany, France, the UK, Italy andSpain), as well as Sweden.
The key messages from this chapter are:
Cost of illness studies estimate the cost of a disease.They give no direct guidance of how resources shouldbe allocated but may provide information concerningthe level attention a disease should be awarded byhealth care policy makers.
A previously published cost of illness model, populatedwith the latest cost, utility, and epidemiological data,was used to estimate the burden of osteoporosis interms of costs and QALYs in the EU5+.
The total health burden, measured in terms of lostQALYs, was estimated at approximately 850,000QALYs for EU5+.
The annual number of QALYs lost ranged from about250,000 in Germany to 39,000 in Sweden.The total annual value of lost QALYs in the EU5+ wasestimated at €47 billion.
The total cost burden, including pharmacologicalprevention, of osteoporosis in EU5+ was estimated at€30.7 billion (corresponding to approximately 3.5% ofthe total spending on health care in the analysedcountries).
70% of the total costs were estimated to be incurred inindividuals older than 74 years.Hip fractures were estimated to account for 54% of thecosts, other fractures 40%, vertebral fractures 5%, andwrist fractures only 1%.
A majority of the total costs burden could be attributedto incident fractures while pharmacological preventionand treatment management only represented 4.7% oftotal costs (ranging from 1.9% in Sweden to 14.7% inSpain).
The economic burden of osteoporotic fractures for theEU5 exceeds those for migraine, stroke, multiplesclerosis, and Parkinson’s disease, and is similar tothe burden of rheumatoid arthritis.
4.1 Introduction
Cost of illness studies estimate the cost of a disease. They giveno direct guidance of how resources should be allocated butmay provide information concerning the level of attention adisease should be awarded by health care policymakers. Cost ofillness studies play an important role in the understanding ofdisease implications andmay therefore aid decisions concerningsocietal resource allocation for research, development, andfunding of new treatments. Results from cost of illness studiescan also be utilised to assess the value of medical progress.Another important aspect is that cost of illness studies alsoprovides information about who bears the burden of a disease.
The objective of this chapter is to estimate the currentburden of osteoporosis in the five largest countries in theEuropean Union (Germany, France, the UK, Italy andSpain) as well as Sweden. The burden of osteoporosis willalso be compared to similar estimates for other diseases.
4.2 Methods and materials
A cost of illness study can take on a societal perspective(includes all cost carried directly or indirectly by society) or apayer perspective (usually includes all costs carried by thehealth care and social system). The present study includedcosts from a societal perspective and the burden of osteopo-rosis was measured in terms of fracture events, loss of QALYs,and in monetary terms including costs of fractures andtreatment. A model previously used to estimate the burden ofosteoporosis in Sweden [1] was adapted to the countriesincluded in the present study. A literature searchwas performedto identify the best available utility, epidemiological, andeconomic data used to populate the model. The epidemiolog-ical data used in the analysis are described in Chapter 3.
The three most common sites of osteoporotic fracture (hip,vertebral and wrist) were included in the model as well as acombination of “other” osteoporotic fractures (i.e. pelvis, rib,humerus, tibia, fibula, clavicle, scapula, sternum, and lowerfemur). Below the age of 50 years, the risk of osteoporoticfractures at a societal level is negligible, and data on forexample costs and quality of life (QoL) are limited. Therefore,only fractures occurring in individuals 50 years of age or olderand related consequences were included in the analysis.
4.2.1 Model design
The model employs a prevalence-based bottom-up ap-proach [2] that contains the number of cases within adefined period of time multiplied by the correspondingdisease-related consequences. Fractures often lead toincreased costs and morbidity for several years afterfracture. The consequences related to fracture can thereforebe divided into an acute or incident phase and a long-term
Arch Osteoporos

(prevalent) phase. In the acute phase (in this report defined asthe first year after fracture), the costs are higher and the healtheffects worse than in the following prevalent phase (defined asthe period beyond the first year after fracture). Therefore, wecaptured the relevant fracture-related costs and health effectswithin a defined time period for both incident (i.e., fracturesthat occur within the year of analysis) and prevalent fractures(i.e., fractures that occurred in previous years but still have animpact on costs and quality of life during the study period).Further details regarding the calculation of the burden offractures are described in Borgström et al. [1].
4.2.2 Fracture-related costs
First-year hip fracture-related direct costs were availablefor all countries except France and Spain. The Frenchand Spanish hip fracture costs were therefore derivedfrom UK data [3] by adjusting for differences betweenthe countries in price levels. In those cases where thedirect costs related to vertebral fracture and wrist fracturewere missing, the cost was derived via morbidityequivalents as estimated by Kanis et al. [4]. Morbidityequivalents can roughly be described as the morbidity afracture type confers compared to that of a hip fracture,and costs were assumed to follow the same pattern. Thisassumption has been shown to be appropriate, at least ina US setting [5].
Fracture-related productivity losses, only applicable toindividuals less than 65 years of age, have been estimatedto be small [6] and were only taken into account if theywere already included in the cost estimates found in theliterature.
To calculate the cost of “other” fractures for Sweden itwas assumed that femoral and pelvic fractures wereequivalent to hip fractures; humerus fractures were assumedto be equivalent to vertebral fractures; and fractures of therib, clavicle, scapula and sternum were assumed to beequivalent to forearm fractures. The costs were then age-weighted to represent the age distribution of these fractures[4]. For the other countries, the cost of “other” fractureswas calculated as a share of the first-year hip fracturerelated direct costs by assuming the same ratio of first-yearhip fracture related direct costs and “other” fracture cost asin Sweden.
All costs are given in Euros (€) and in 2010 year’sprices. The consumer price index was used to inflatecosts when needed [7]. The first-year fracture costs forthe six countries are shown in Table 47. Whereage-differentiated costs were available these were used(presented in ranges in Table 47) otherwise a singleestimate was used for all ages.
Table 47 First year direct costs of a hip, vertebral, forearm andother fracture (€, 2010). Age-differentiated costs are presented inranges.
Hip Clinicalvertebral
Forearm Other
France 12,030-19,004[3, 8]b
2,999 [3]b 1,374 [3]b 3,870-12,059 c
Germany 19,218 [9] 5,585-6,845 [9]
1,173 [9]a 6,182-13,130 c
Italy 19,602 [10] 4,336 [10]a 1,197 [10]a 6,306-13,393c
Spain 9,421-17,350[3, 8]b
2,349 [3]b 1,076 [3]b 3,030-9,444c
Sweden 12,870-19,667 [6]
2,048-14,219 [6]
2,401 [6] 4,140-9,096
UK 11,055-20,359[3, 8]
2,756 [3] 1,263[3] 3,556-11,081 c
aEstimated as a fraction of hip fracture cost based on the morbidity
equivalents in Kanis et al. [4].bImputed from the UK data by adjusting for differences in health care
price levels.cImputed from Swedish estimate [4, 6].
There are currently no published studies that providerobust estimates of the long-term fracture costs based onempirical patient samples. Therefore, hip fracture costs inthe second and following years are usually based on theproportion of patients that become institutionalised forthe long-term after fracture [11, 12]. The proportion ofpatients that has transitioned from independent living tolong-term care one year after hip fracture increases withage (approximately 6% at age 50 to 23% of patientsolder than 90 years). Patients who at the time of fracturealready reside in long-term care were assumed to nothave any additional long-term fracture related costs andthe rates were adjusted accordingly. Moreover, theproportion that is admitted to long-term one year afterfracture must be down-adjusted to account for the risk ofbeing admitted to long-term care due to causes notrelated to the hip fracture itself. The annual risk of beinginstitutionalized in long-term care in the general popula-tion in Sweden is approximately 0.1%, 0.5%, and 2% fora 65-, 75- and 85-year old individuals, respectively [13].Data on the proportion of patients that transition tonursing home after a hip fracture and on the incidence oftransition to nursing home in the general population arescarce in the published literature and Swedish data weretherefore used for all countries. This is a reasonable
Arch Osteoporos

proxy for countries in Northern Europe but may be anoverestimation for countries in Southern Europe, wherelong-term care to a larger extent is provided by informalcare givers (e.g., a spouse or child). Informal care ishowever also associated with societal costs like product-ivity losses, lost leisure time, and out-of-pocket expenses.The true net effect is unknown.
By multiplying the adjusted proportions with the yearlycost of a nursing home cost (Table 48), the annual hipfracture cost beyond the first year after a fracture could beobtained. Wrist fracture and vertebral fracture were as-sumed to not incur any costs beyond the first year afterfracture.
Table 48 Yearly cost at long-term care facility (€, 2010)
Country Long-term care cost Reference
France 31,512 [8] a
Germany 34,534 [14] b
Italy 50,202 [10]
Spain 51,786 [15]
Sweden 57,247 [6]
UK 33,756 [8]
aImputed from the UK long-term care cost adjusting for differences in
the health care price levelsbAn average of 4 long-term care facilities
4.2.3 Quality of life loss related to fractures
Loss of QoL can be a result of fracture consequences inseveral health domains, such as pain with loss of physicalfunctioning as well as social and mental consequences. Thephysical functioning includes loss in mobility and self-care.The impact on activities and role are important socialimpairments whilst mental health is affected by depression,anxiety and low self-esteem [16]. The health burden ofosteoporosis can be measured by disutility or loss in utilityresulting from the disease, as well as increased mortality.Utilities reflect the QoL, normally ranging between zero(reflecting death) and one (reflecting full health).
The utility loss from an osteoporotic fracture variesdepending on the site of fracture. Hip and vertebral fracturesresult in substantial disutility whereas forearm fractures areassociated with some decrements in utility but considerablyless and for a shorter period of time. The loss of utility isgreatest for all fractures in the first year and decreases insubsequent years. On average, patients with forearm fracturesregain their pre-fracture utility after 12 months [17].
The utility the first year after hip, vertebral and wristfracture relative to the age-specific utility in the normal
population (i.e. utility multiplier) has been estimated to be0.7, 0.59 and 0.956 respectively [18]. The QoL lost fromfracture does not differ significantly between women andmen and the relative loss has shown to be of the samemagnitude irrespective of whether the patient had had aprior fracture or not [6]. Quality of life in the subsequentyears after a hip fracture was assumed to be 80% of that ofa healthy individual [18]. Based on the findings thatradiographically defined vertebral fractures reduce QoL byapproximately 9% when the fracture had occurred at aunknown time [19], it was conservatively assumed that thequality of life loss related to clinical vertebral fractures inthe second and following years was 0.05 which gave amultiplier of 0.929 [20]. There are no studies suggestingthat wrist fracture is associated with a long-term reductionin QoL and it was therefore assumed that wrist fracture didnot have an impact on QoL beyond the first year afterfracture. No significant difference in QoL has beenestablished for patients who were hospitalised and thosewho were not [17].
Quality of life estimates for the general populationmeasured with EQ-5D were only available for Swedenand the UK and the other countries were therefore assumedto value their QoL similarly to the population of UK. Age-specific utilities after fracture are derived by multiplying theutility multipliers, described above, with the QoL values ofthe general population. For example a 75 year old man(average utility of the general population at age 72 years =0.72) who sustains a hip fracture has a disutility of 0.216(=0.72*(1–0.7)) in the year after fracture.
4.3 Results
4.3.1 QALYs lost due to fractures
The data presented in Chapter 3 on fractures andmortality were combined with the QoL data above toestimate the annual number of lost QALYs due tofractures. For the estimation of QALYs lost due tofracture related deaths it was assumed that individualswho die from a fracture will do so on average fourmonths after the fracture [1]. The burden of fractures, interms of lost QALYs, was estimated at 845,401 QALYsin the EU5 and Sweden (Fig. 27, Fig. 28 and Table 49)and 806,745 QALYs when considering the EU5 alone.Among the EU5, Germany was estimated to have highestnumber of lost QALYs which is a result of high fractureincidence and prevalence, and a large population.Sweden incurs the smallest total QALY loss. The annualnumber of QALYs lost ranged from about 250,000 inGermany to 39,000 in Sweden.
Arch Osteoporos

Fig. 27 Estimated number of QALYs lost due to fractures in women during 2010
Fig. 28 Estimated number of QALYs lost due to fractures in men during 2010
A large component of the QALYs lost arises in thesubsequent years after fracture as a consequence of thelong-term disability from osteoporotic fractures. Thispattern is less pronounced in men, because of higherabsolute mortality after fracture in men than inwomen. Fracture related mortality (see Chapter 3)during the first year after incident hip, vertebral, and“other” fractures represented approximately 1% and
3% of the total QALY-loss in women and men,respectively.
Even though common, wrist fractures only representeda marginal share of the estimated fracture relateddisability. The negligible impact of forearm fracture onQALY-loss in the total population is due to its relativelysmall impact on QoL during the first year after fracture,and the complete long-term recuperation after fracture.
0
20,000
40,000
60,000
80,000
100,000
120,000
140,000
160,000
180,000
Germany UK Italy France Spain Sweden
QA
LY
s lo
st
Prevalent vertebral fractures
Prevalent hip fractures
Incident "other" fractures
Incident forearm fractures
Incident vertebral fractures
Incident hip fractures
0
10,000
20,000
30,000
40,000
50,000
60,000
70,000
80,000
Germany UK Italy France Spain Sweden
QA
LY
s lo
st
Prevalent vertebral fractures
Prevalent hip fractures
Incident "other" fractures
Incident forearm fractures
Incident vertebral fractures
Incident hip fractures
Arch Osteoporos

Table 49 Estimated number of QALYs lost due to fractures during 2010
4.3.2 Value of lost QALYs
There is no international standard on the societal value ofa QALY lost and official numbers for the value of a QALYarerarely stated. In the UK, the WTP lies within the range ofGBP 20,000–30,000 (about €23,000–34,000 at currentexchange rates) per QALY. Rather than quantifying the valueof QALYs lost in a burden of illness estimation, such as thisone, this value is generally used for evaluating the cost-effectiveness of healthcare interventions. The high end of therange can be acceptable if the innovation adds demonstrableand distinctive benefits of a substantial nature which may nothave been adequately captured in the QALY measure [21].600,000 SEK (approximately €54,000) is a commonly usedas the value/QALY for Sweden and is based on the value ofstatistical life (i.e. a measure that summarizes tradeoffsbetween monetary wealth and fatal safety risks) estimated bythe Swedish National Road Administration [22, 23].
For the purpose of this study the value of a QALY wasrelated to the economic performance of the includedcountries, as a proxy for a country’s ability to pay forhealth care (Fig. 29). WHO has suggested a value of aQALY of 3 times the GDP per capita, but this multiplierwas suggested for developing economies. Borgström et al.[24] have suggested a WTP of 2 xGDP/capita forindustrialised countries, which is more appropriate forthe countries included in this report. Assigning a value of
2 xGDP/capita per QALY to the QALYs lost (Fig. 29)resulted in estimates of €14.9 billion, €9.2 billion, €8.6billion, €8.2 billion, €3.4 billion, and €2.7 billion for lostQALYs in Germany, Italy, UK, France, Spain, andSweden, respectively (Fig. 30). The total annual valuewas thus estimated at €44.3 billion in the EU5 and at €47billion when Sweden was included. It should be noted thatthis number does not represent an avoidable monetarycost, but rather the annual societal value of QoL andlength of life attributable to fragility fractures.
Fig. 29 Willingness to pay per QALY based on GDP/capita in EU5and Sweden
Women
Germany Italy UK France Spain Sweden EU5+
Incident hip fractures 22,861 16,006 13,017 12,498 6,754 3,517 74,654
Incident vertebral fractures 24,254 15,839 12,732 11,361 5,859 3,398 73,443
Incident forearm fractures 3,374 2,206 1,822 1,584 823 463 10,274
Incident "other" fractures 24,987 17,186 21,664 13,228 7,212 3,719 87,995
Prevalent hip fractures 71,603 55,500 42,502 41,936 22,404 10,150 244,097
Prevalent vertebral fractures 29,274 20,202 15,363 14,813 7,909 4,057 91,618
Total 176,354 126,939 107,102 95,420 50,962 25,303 582,080
Men
Germany UK Italy France Spain Sweden EU5+
Incident hip fractures 8,736 5,787 6,570 4,638 2,586 1,457 29,773
Incident vertebral fractures 13,127 8,500 8,856 6,417 3,419 2,053 42,373
Incident forearm fractures 675 427 387 307 153 100 2,049
Incident "other" fractures 17,408 15,309 11,310 8,493 4,477 2,686 59,683
Prevalent hip fractures 26,461 18,307 19,422 13,908 7,744 5,000 90,842
Prevalent vertebral fractures 11,707 7,724 8,002 6,038 3,073 2,056 38,600
Total 78,114 56,055 54,547 39,802 21,452 13,352 263,321
0
20,000
40,000
60,000
80,000
100,000
120,000
Germany UK Spain France Italy Sweden
Will
ing
nes
s to
pay
/QA
LY
()
1 x GDP/capita
2 x GDP/capita
3 x GDP/capita
Arch Osteoporos

Fig. 30 Value of lost QALYs in EU5 and Sweden
4.3.3 Economic burden of osteoporosis
The economic fracture burden in a country depends on avariety of factors, including the age specific fracture risks,the population’s size (Table 50), age and sex distribution,the cost per fracture, the cost of residing in a nursing home,and the proportion of hip fracture patients requiring nursinghome care after fracture.
Table 50 Burden of fractures in relation to population and health care
spending
The total monetary osteoporosis burden 2010 in the EU5(including pharmacological intervention) was estimated at€29.3 billion, or €30.7 billion when Sweden is included (Table51). A majority of costs could be attributed to incident fractureswhilst pharmacological intervention and administration of thetreatment only represented 4.7% of total costs (Table 52). Theshare ranged from 1.9% in Sweden up to 14.7% in Spain. Theannual expenditure of €30.7 billion corresponds to approxi-mately 3.5% (Table 50) of the total spent on health care in theanalysed countries (2.2% in France to 5.1% in Italy). It shouldbe noted, however, that not all fracture-related costs come fromthe countries’ healthcare budgets (e.g., long-term care, informalcare, community care).
The estimated burden per capita (total population)appeared to correlate reasonably with fracture risk, as
estimated by FRAX (Fig. 31). The risk population in Fig.31 was arbitrarily chosen but still provides a goodillustration of how age-specific fracture risk is a driver ofcosts. The highest direct cost per capita was estimated inSweden (€153/capita) and the lowest in Spain (€64/capita)(Table 50).
Table 51 Monetary burden of fractures 2010 in EU5 and Sweden
(million €)
Table 52 Shares of total cost burden by cost type
Fig. 31 Cost of osteoporosis/capita and international variations in
fracture risk
Country Population(000)
Health carespending(000 €)
% of healthcare spendingon fractures
Burden percapita (€)
Sweden 9,294 31,000 4.6% 153
Spain 45,000 95,000 3.0% 64
France 62,634 214,000 2.2% 76
UK 61,899 142,000 3.9% 89
Italy 60,098 138,000 5.1% 117
Germany 82,056 252,000 4.6% 111
EU5 311,687 841,000 3.7% 94
EU5+ 320,981 871,000 3.5% 96
Country Cost ofincidentfractures
Cost ofprevalentfractures
Treatment +administrationof treatment
Total
Sweden 863 528 27 1,418
Spain 1,401 1,043 420 2,864
France 3,266 1,152 327 4,744
UK 4,078 1,315 121 5,515
Italy 4,275 2,386 348 7,010
Germany 6,854 2,057 235 9,146
EU5+ 20,736 8,482 1,479 30,696
0
5
10
15
20
25
Germany Italy UK France Spain Sweden
Val
ue
of
lost
QA
LY
s (
bill
ion
) 1 x GDP/capita
2 x GDP/capita
3 x GDP/capita
Country Cost of incidentfractures
Cost ofprevalentfractures
Treatment +administrationof treatment
Sweden 60.8% 37.2% 1.9%
Spain 48.9% 36.4% 14.7%
France 68.8% 24.3% 6.9%
UK 73.9% 23.8% 2.2%
Italy 61.0% 34.0% 5.0%
Germany 74.9% 22.5% 2.6%
EU5+ 67.6% 27.6% 4.8%
0
5
10
15
20
25
30
Spain France Germany Italy UK Sweden
10-y
ear
pro
bab
ility
of
maj
or
ost
eop
oro
tic
frac
ture
(%
)
0
20
40
60
80
100
120
140
160
180
Co
st (
)
10-year probabaility of a 72 year oldwoman with previous fracture
Annual fracture related costs/capita
Arch Osteoporos

The monetary burden depends on a number of factors, ofwhich the most important is that fracture risk and cost perfracture increase with age. The more costly hip fracturesrepresent a larger share of all fractures in older individualswhich is reflected in the distribution of the total cost burdenover age groups (Fig. 32). Approximately 70% of the totalcosts were estimated to be incurred in individuals older than74 years. Fractures sustained in women were estimated toaccount for 69% of the total cost (Fig. 33). Hip fractureswere estimated to account for 54% of the costs, otherfractures 40%, vertebral fractures 5%, and wrist fractures2% (Table 53).
The estimate of 40% for “other” fractures may beperceived as a high figure given that most health economicevaluations of fracture prevention mainly focus on hip andvertebral fractures [23, 25–27]. However, such studiesusually evaluate treatment in elderly osteoporotic womenwhere the risks of hip and vertebral fractures are moreelevated than that of the risk of “other” fractures. Bycontrast, the current study captured all fractures in all agegroups.
The cost of clinical vertebral fractures is likely to beunderestimated due to the difficulties of studying them. 9-33% of clinical vertebral fractures become hospitalised(depending on age [28]). Non-hospitalised fractures areseldom available in registers and are more difficult toinclude in observational studies [6]. Further, the costestimation is complicated by the fact that many vertebralfractures do not come to clinical attention at all. Althoughthe consequences after clinical vertebral fractures are likelyworse than after morphometric subclinical vertebral frac-tures, it cannot be ruled out that the latter may also beassociated with costs and morbidity.
Fig. 32 Total cost burden stratified by age
Fig. 33 Total cost burden stratified by sex
Table 53 Shares of total cost burden by fracture site
The burden of fractures, expressed as the sum of the totalcost and the value of QALYs, was estimated at €73.6 billionin the EU5 and €77.7 billion in EU5 and Sweden (Table54). Germany was estimated to have the highest burden of€24 billion and Sweden the lowest burden of €4.1 billion.
The economic burden of fractures in the whole of Europe haspreviously been estimated at €36 billion in 2000 [29]. Theestimate would, translated to 2010, be higher due to increasednumber of fracture, which is partly due to an aging population.Given that the economic burden of fractures in the current reportalso included the cost of prevalent fractures and cost of treatment,and that ten years have passed between these two studies, theestimate of €30.7 billion in EU5 and Sweden is reasonable.
Table 54 The total cost of fractures and the value of QALYs in 2010
(billion €)
50-6410%
65-7420%
75-8434%
85+36%
Women69%
Men31%
Fracture site
Country Hip Spine Forearm Other All
Sweden 56.5% 10.3% 2.8% 30.3% 100%
UK 48.0% 3.1% 1.6% 47.3% 100%
France 56.3% 3.5% 1.8% 38.5% 100%
Germany 49.9% 7.6% 1.6% 41.0% 100%
Italy 56.8% 3.9% 1.4% 37.9% 100%
Spain 65.9% 2.6% 1.3% 30.2% 100%
EU5+ 53.7% 5.0% 1.6% 39.7% 100%
Country Cost of fractures Value of QALYs lost Total burden
Germany 9.1 14.9 24.0
Italy 7.0 9.2 16.2
UK 5.5 8.6 14.1
France 4.7 8.2 13.0
Spain 2.9 3.4 6.3
Sweden 1.4 2.7 4.1
EU5 29.2 44.3 73.6
EU5+ 30.7 47.0 77.7
Arch Osteoporos

4.3.4 Economic burden of osteoporosis compared to otherdiseases
The estimated total annual costs of osteoporosis may becompared to the cost of other diseases. The burden ofvarious brain disorders in the EU5 in 2004 has beenestimated at €38, €17, €5.9, €6.4 and €15 billion fordementia, migraine, multiple sclerosis (MS), Parkinsondisease and stroke, respectively [30]. The total societaleconomic consequence of cardiovascular diseases in theEU5 in 2003 was estimated at €133 billion [31]. A reporton the burden of rheumatoid arthritis estimated the totalcost in the EU5 to €27 billion [32]. Thus also in relation toother common non-communicable diseases osteoporosishas major economic consequences for society. Fig. 34illustrate that the economic consequences of osteoporoticfracture for the EU5 exceeds those for migraine, stroke,MS, and Parkinson’s disease. The financial burden ofrheumatoid arthritis is similar to that of osteoporosis.
Fig. 34 Cost of disease in EU5
References
1. Borgstrom F, Sobocki P, Strom O, Jonsson B (2007) Thesocietal burden of osteoporosis in Sweden. Bone 40:1602–9
2. Drummond M, O´Brien B, Stoddart G, Torrance G(1997) Methods for the economic evaluation of healthcare programmes. Oxford University Press, Oxford
3. Stevenson M, Davis S, Kanis JA (2006) The hospital-ization costs and outpatient costs of fragility fractures.Women Health Med 3: 149–51
4. Kanis JA, Oden A, Johnell O, Jonsson B, de Laet C,Dawson A (2001) The burden of osteoporotic fractures:a method for setting intervention thresholds. Osteo-poros Int 12: 417–27
5. Melton LJ, Gabriel SE 3rd, Crowson CS, Tosteson AN,Johnell O, Kanis JA (2003) Cost-equivalence ofdifferent osteoporotic fractures. Osteoporos Int 14:383–8
6. Borgstrom F, Zethraeus N, Johnell O et al (2006) Costsand quality of life associated with osteoporosis-relatedfractures in Sweden. Osteoporos Int 17: 637–50
7. Tidermark J, Zethraeus N, Svensson O, Törnkvist H,Ponzer S. (2002) Femoral neck fractures in the elderly:functional outcome and quality of life according toEuroQol. Qual Life Res 11: 473–81
8. Stevenson M, Davis S (2006) Analyses of the cost-effectiveness of pooled alendronate and risedronate,compared with strontium ranelate, raloxifene, etidro-nate and teriparatide. http://www.nice.org.uk/page.aspx?o=370643 Accessed 24 May 2011
9. Brecht JG, Kruse HP, Mohrke W, Oestreich A, HuppertzE (2004) Health-economic comparison of three recom-mended drugs for the treatment of osteoporosis. Int JClin Pharmacol Res 24: 1–10
10. Visentin P, Ciravegna R, Fabris F (1997) Estimating thecost per avoided hip fracture by osteoporosis treatmentin Italy. Maturitas 26: 185–92
11. Jonsson B, Christiansen C, Johnell O, Hedbrandt J,Karlsson G (1996) Cost-effectiveness of fractureprevention in established osteoporosis. Scand J Rheu-matol Suppl 103: 30–8
12. Stockholms stads (2003) Budgetavräkning. www.stock-holm.se Accessed 24 May 2011
13. The National Board of Health and Welfare (2005) Careand services to elderly persons, Sweden
14. Long term care facilities in Germany: www.pflegeheim-haus-am-see.de, www.aphw.telebus.de, www.hausstiftstrasse.de and www.domicil-seniorenresidenzen.deAccessed 24 May 2011
15. Kobelt G, Berg J, Lindgren P et al (2006) Costs andquality of life of multiple sclerosis in Spain. Eur JHealth Econ 7: S65-74
16. World Health Organization Scientific Group (2003)The burden of musculoskeletal conditions at the startof the second millennium. Technical report series 919,Geneva
17. Ström O, Borgstrom F, Zethraeus N et al (2008)Long-term cost and effect on quality of life ofosteoporosis-related fractures in Sweden. ActaOrthop 79: 269–80
18. Peasgood T, Herrmann K, Kanis JA, Brazier JE (2009)An updated systematic review of Health State UtilityValues for osteoporosis related conditions. OsteoporosInt 20: 853–68
19. Oleksik A, Lips P, Dawson A et al (2000) Health-relatedquality of life in postmenopausal women with lowBMD with or without prevalent vertebral fractures. JBone Miner Res 15: 1384–92
0 5 10 15 20 25 30 35 40
Dementia
Rheumatoid arthritis
Migraine
Stroke
Parkinson
MS
Fragility fractures
Cost in EU5 (billion /year)
Arch Osteoporos

20. Borgstrom F, Johnell O, Kanis JA, Oden A, Sykes,Jonsson B (2004)Cost effectiveness of raloxifene in thetreatment of osteoporosis in Sweden: an economicevaluation based on the MORE study. Pharmacoeco-nomics 22: 1153–65
21. National Institute for Health and Clinical Excellence(2008) Guide to the methods of technology appraisal.http://www.nice.org.uk/media/B52/A7/TAMethodsGuideUpdatedJune2008.pdf Accessed 24 May 2011
22. Vägverket (1997) Vägverkets samhällsekonomiskakalkymodell - Ekonomisk teori och värderingar.Stockholm
23. Strom O, Borgstrom F, Sen SS et al (2007) Cost-effectiveness of alendronate in the treatment ofpostmenopausal women in 9 European countries–aneconomic evaluation based on the fracture interventiontrial. Osteoporos Int 18: 1047–61
24. Borgström F, Johnell O, Kanis J, Jonsson B, RehnbergC (2006) At what hip fracture risk is it cost-effective totreat? International intervention thresholds for thetreatment of osteoporosis. Osteoporos Int 17:1459–71
25. Zethraeus N, Borgstrom F, Strom O, Kanis JA, JonssonB (2007) Cost-effectiveness of the treatment andprevention of osteoporosis–a review of the literatureand a reference model. Osteoporos Int 18: 9–23
26. Kanis JA, Adams J, Borgstrom F et al (2008) The cost-effectiveness of alendronate in the management ofosteoporosis. Bone 42: 4–15
27. Borgstrom F, Jonsson B, Strom O, Kanis JA (2006) Aneconomic evaluation of strontium ranelate in thetreatment of osteoporosis in a Swedish setting: Basedon the results of the SOTI and TROPOS trials.Osteoporos Int 17: 1781–93
28. Jonsson B, Strom O, Eisman JA et al (2010) Cost-effectiveness of Denosumab for the treatment ofpostmenopausal osteoporosis. Osteoporos Int 22:967–82
29. Kanis JA, Johnell O (2005) Requirements for DXA forthe management of osteoporosis in Europe. OsteoporosInt 16: 229–38
30. Andlin-Sobocki P, Jonsson B, Wittchen HU, Olesen J(2005) Cost of disorders of the brain in Europe. Eur JNeurol 12: 1–27
31. Leal JR, Luengo-Fernandez, Gray A, Petersen S,Rayner M (2006) Economic burden of cardiovasculardiseases in the enlarged European Union. Eur Heart J27: 1610–9
32. Kobelt G, Kasteng F (2009) Access to innovativetreatments in rheumatoid arthritis in Europe www.comparatorreports.se Accessed 24 May 2011
Arch Osteoporos

5 Uptake of osteoporosis treatments
SummaryThis chapter provides a description of current uptake
of osteoporosis treatments. In the absence of readilyavailable information on the number of patients treatedin most countries in Europe, we use international salesdata on volume (mg) and price (€) from IMS Health,combined with estimations on how many should beeligible for treatment using a fracture risk thresholdlevel. The analysis is based on France, Germany, Italy,Spain, Sweden and the UK.
The drugs included in the analysis are alendronate,etidronate, ibandronate, risedronate, zoledronic acid, ralox-ifene, strontium ranelate, teriparatide and PTH (1–84).Three out of the nine drugs received marketing authoriza-tion during the 1990s. The last drug to be marketed wasPTH(1–84) in 2006.
The results are presented as sales (€ 2008) anddefined daily dosages (DDDs) per 100,000 in populationabove 50 years of age. Also the number of patients ontreatment during a year related to the number of patientsthat could be considered eligible for treatment wasassessed.
Based on the analysis we conclude
Alendronate is the most commonly prescribed agentaccounting for about 30% of the total sale value in theEU5. In volume, alendronate accounts for about 50%of the market. The uptake of osteoporotic treatmentsvaries between countries (e.g., 11% of the populationabove 50 years in Spain compared with 3% inGermany).
The data do not indicate any clear correlationbetween the price of drug and the total volume ofdrug sold.The treatment uptake of osteoporosis drugs hasincreased considerably, albeit from very low levels,since 1998.There is a large gap between the numbers of womenthat are treated compared to the proportion of thepopulation that could be considered eligible fortreatment based on fracture risk.Swedish prescription data showed a 20% lower uptakeof alendronate compared with the sales data. Thisdifference cannot be explained by parallel export andhospital based prescriptions and requires furtherinvestigation.
5.1 Introduction
Treatment uptake includes the analysis of the rate of uptakeof a new drug to the market, and how many patients of thoseeligible for treatment are actually treated (i.e. have real accessto the medication). In order to analyse the uptake of treatmentsin different countries data on the number of patients currentlytreated and the number of patients that should be treated ineach country are required. Unfortunately, in most countries,individual patient data are not readily available and there areonly a few European nations (e.g., the Nordic countries andNetherlands) that hold sufficiently large databases whichcould facilitate a detailed analysis on prescription use at anindividual level. In the absence of country- and patient-specific data, we utilised international sales data in order toassess treatment uptake between countries and over time.
In this chapter we use international sales data between1998–2008 on volume (mg) and price (€) from IMSHealth to estimate the uptake of osteoporosis treatmentsin France, Germany, Italy, Spain, Sweden and the UK.
5.2 Methods and Data
IMS Health data are currently the only source ofcomparative data on sales of pharmaceuticals at an interna-tional level, but have a number of shortcomings which mustbe considered. In any country, it is unlikely that 100% of salesare captured, but it is difficult to define the magnitude of theunderestimate. For some countries, it is known that part or allof hospital sales are omitted and that certain wholesalers orother channels of distribution are not included. Similarly, it ispossible that sales are overestimated in some countries as aconsequence of the sample of pharmacies and hospitals thatprovide data. Since IMS Health attempts to correct for under-and over-estimation, and in the absence of any additionalinformation, we have refrained from an overall adjustment ofthe available sales figures.
Another difficulty may arise from parallel trade. Althoughdrugs launched in the last two decades have generally a rathernarrow price band across Europe, price control mechanisms,adaptation to distribution channels and currency fluctuationshave created a price difference that give incentives forparallel trade. IMS Health adjusts the data for paralleltrade but it is difficult to estimate the accuracy of thesecorrections. However, in a previous EFPIA report onrheumatoid arthritis [1] we have approached the issue byverifying data from Norway where parallel export wasknown to exist. Data from Farmastat (the organisationthat collects sales from wholesalers who are legallyobliged to exclude parallel export) were found to be very
Arch Osteoporos
similar to those reported by IMS Health. In this reportwe also performed a test of validity by comparing IMSHealth data with actual data from the Swedish PrescribedDrug Register. The result from this analysis is presentedin the results section.
An important component in the analysis of treatmentuptake is how many patients are treated and IMS Health salesdata allow for the estimation of how many treatment years thesales volume can cover. However, not all patients adhereperfectly to therapy, and such an approach would consequent-ly result in an underestimation of the actual number of patientsthat have started a treatment since some patients only aretreated for a part of the year. To correct for suboptimaladherence we estimated an adjustment factor from data fromthe Swedish Prescribed Drug Register. The adjustment factorwas employed irrespective of country because similar datawere not readily available for any other country. The followingsteps were included in the estimation of the number ofindividuals treated based on IMS Health sales data:
& The Defined Daily Dosages (DDDs) per 100,000 wasestimated by dividing the mg per 100,000 patients by theDDD in mg for each drug. The DDD for each drug wasderived from the WHO Anatomical Therapeutic Classifi-cation (ATC)/DDD database (http://www.whocc.no/atc_ddd_index/).
& The proportion of the total population in each country(all ages) that could theoretically be covered by a fullyear of treatment based on the sales volume can beestimated by dividing the DDDs per 100,000 in thepopulation by 365 (days in a year). In this report thisestimate is termed the population coverage.
& Almost all osteoporosis drugs are prescribed to patients50 years or older (97.2% based on Swedish prescriptiondata). Therefore, it was assumed that only patients 50 yearsor older were given osteoporosis treatments. The popula-tion coverage was thus adjusted to only reflect the part ofthe population at or above 50 years of age in each country.
& Based on an analysis of filled prescriptions from theSwedish Prescribed Drug Register between 2006 and2009, it was estimated that the total volume of theprescription could cover 73% of the total observed time(i.e., the sum of the days from treatment start to end ofthe year) for all patients that were prescribed anosteoporosis treatment during this period. This estimatewas not found to vary with age. This factor was used toapproximate the number of patients being treated duringa year for all countries.
& Additionally, to differentiate the uptake between menand women we assumed that 87% of the sales were
directed to women and 13% to men (based on Swedishprescription data).
In a treatment uptake analysis, the number of individualstreated also needs to be related to the number of patients in thepopulation that could be considered eligible for an osteoporosistreatment. However, this is not straightforward both due todifferent levels of fracture risks and guidelines betweencountries. In our analysis we used the translational approach(described in Chapter 3) assuming that the threshold level to beeligible to start treatment is the estimated country-specificfracture risk equivalent to a woman with a prevalent fractureand average weight at different ages based on the FRAXalgorithm.
5.2.2 Treatments
5.2.2.1 Use
Table 55 shows the year of introduction in Europe (EMAmarketing authorisation) for the available agents indicatedfor osteoporosis treatment. Out of the nine agents, threereceived marketing authorisation during the 1990s. The lastproduct to be marketed was PTH (1–84) in 2006. Uponexpiration of the patent of alendronate, generic versions of themedication started to become available in Europe in 2006.
Table 55 Year of first introduction in Europe
5.2.2.2 Price
The current annual drug prices in the EU5 and Sweden areshown in Table 56. There are variations in price betweencountries. UK has consistently the lowest price for all drugs.Although France, Germany, Italy and Spain have fairly similarprice patterns, there are some notable differences such as the
Year
Bisphosphonates
Alendronate 1995
Etidronate 1980
Ibandronate 2005
Risedronate 2000
Zoledronic acid 2005
SERMs
Raloxifene 1998
Parathyroid hormones
Teriparatide 2003
PTH (1–84) 2006
Strontium ranelate 2004
Arch Osteoporos

high price of etidronate in Germany and low price ofrisedronate in Spain. In addition, the prices of alendronatevary, with particularly low prices in Sweden and UKcompared with the other countries.
Table 56 Annual drug costs (pharmacy price €) in 2010 by country
Sources:awww.fass.sebBritish National Formularycwww.vidalpro.netdwww.rote-liste.deewww.agenziafarmaco.itfwww.portalfarma.com
Historical prices of drugs are difficult to extract in manycountries. Fig. 35 shows the development of annual drugprices between 2003 and 2010 based on past decisions bySwedish Pharmaceutical Benefits Board (www.tlv.se). Theprices for etidronate, strontium ranelate, raloxifene andzoledronic acid have all remained stable. Risedronate had areduction in the price in 2008. The price of alendronatedecreased markedly from 2003. It is notable that the priceof alendronate was reduced before the introduction ofgeneric substitutes. Prices for PTH (1–84) and teriparatide(not shown in the figure) remained stable since theirintroduction.
Fig. 35 Annual drug prices in Sweden between 2003 and 2010
5.3 Results
5.3.1 Market share and price analysis
The estimated market shares, based on value (€) and sales(DDDs), 1998 through 2008 in the EU5 are shown in Fig. 36and Fig. 37. The value of the sales increased fairly rapidlyuntil 2005 where the increase slowed down markedly. Theslowdown in sales was mainly driven by the introduction ofgeneric alendronate. The increase in sales in recent years ismainly related to the introduction of new drugs (ibandronate,strontium ranelate, zoledronic acid, PTH (1–84), and teripara-tide). The increase in volume has almost been linear from1998. The volume of sold alendronate has steadily increasedwhereas it has slightly decreased for risedronate and ralox-ifene in recent years.
In Table 57, the sales per product in 2008 and marketshares based on total sales value and volume (DDDs) areshown. The large difference in market share for alendronatebetween sales and DDD is a reflection of the low price ofthe generic version of the drug. The same applies forteriparatide and PTH (1–84) but in the opposite direction.Due to comparatively high prices their market share interms of price is much higher than the volume market share.
The total sales and DDDs per 100,000 of the population (allages) per country are presented in Fig. 38. There is a markeddifference between countries in the relation of sales and DDDs.This can be explained by differences in the market penetrationand price of generic alendronate. In countries such as the UKand Sweden the price of generic alendronate is at very lowlevels compared to other countries. In Germany, Italy, Franceand Spain the price difference between generic versus brandedalendronate is less, resulting in a lower market share of thegeneric version (Fig. 39). Another factor contributing todifferences is that the perception of the performance of genericalendronate among physicians differs between countries.
Fig. 36 Estimated market shares in EU5 (sales in €, per 100,000 in
whole population)
Francec Germanyd Italye Spainf UKb Swedena
Alendronate 209 245 294 201 18 27
Risedronate 380 509 474 299 217 366
Etidronate 99 475 97 44 79 241
Ibandronate 327 576 524 416 188 NA
Zoledronic acid 410 562 529 417 242 443
Raloxifene 365 540 452 449 221 358
Strontiumranelate
579 611 665 644 285 468
Parathyroidhormone
NA 7,853 6,528 5,168 2,897 4,585
Teriparatide 4,829 7,700 7,445 5,220 3,024 5,174
0
50
100
150
200
250
300
350
400
450
500
2003 2004 2005 2006 2007 2008 2009 2010
An
nu
al d
rug
pri
ce (
)
Alendronate Etidronate Risedronate Zoledronic acid Raloxifene Strontium ranelate
0
50 000
100 000
150 000
200 000
250 000
300 000
350 000
400 000
450 000
1998 1999 2000 2001 2002 2003 2004 2005 2006 2007 2008
Year
Sal
es in
p
er 1
00 0
00 p
op
ula
tio
n
Alendronate Etidronate IbandronatePTH(1-84) Raloxifene RisedronateStrontium ranelate Teriparatide Zoledronic acid
Arch Osteoporos

Fig. 37 Estimated market shares in EU5 (DDD per 100,000 in whole
population)
Table 57 Estimated sales in EU5 (ex factory prices) and market shares
in 2008 based on IMS Health data
As can be seen in Fig. 4, the uptake of treatments forosteoporosis varies in the EU5+. The lowest uptake in termsof daily doses is seen in Sweden – country with high fracturerates. Conversely, the highest uptake is seen in Spain – acountry with low fracture rates. The variations in drug uptakecannot however explain the heterogeneity of fracture rates [2].The UK is ranked fourth in uptake, but sixth in expendituredue to the very low cost of generic alendronate.
Fig. 38 Estimated sales (€ 2008) and DDDs per country (per 100,000
population)
Fig. 39 Estimated market shares (DDDs) of alendronate in 2008
In the value of sales analysis (Fig. 40) it is apparentthat the introduction of generic alendronate has impact-ed the value of sales differently. In Germany, Swedenand UK there is a clear break and reduction in the totalsales from year 2006, which is not evident for the othercountries. This is also observed when analysing thechange in cost per DDD over time (based on pricesfrom manufacturers) in Fig. 41. The price per DDD hasbeen fairly consistent over all years in France, Italyand Spain, whereas in the UK and Germany it hasdecreased by 79% and 52%, respectively. In France,branded alendronate is prescribed in a formulationcontaining vitamin D which has not been challengedby a generic form. In addition, risedronate performsvery well. These two parameters may explain thesomewhat weaker effect of generic alendronate inFrance, together with the resistance of GPs to prescribegenerics.
A factor that contributes to the reduction in sales valuein the UK is the depreciation of the British Pound versusthe Euro in recent years (about 13% depreciation between2006 and 2008).
Fig. 40 Estimated annual sales (€) (per 100,000 population)
0
100 000
200 000
300 000
400 000
500 000
600 000
700 000
1998 1999 2000 2001 2002 2003 2004 2005 2006 2007 2008
Year
DD
D p
er 1
00 0
00 p
op
ula
tio
n
Alendronate Etidronate IbandronatePTH(1-84) Raloxifene RisedronateStrontium ranelate Teriparatide Zoledronic acid
EstimatedSales 2008(€,millions)
Estimated MarketShare 2008(price)
Estimated MarketShare 2008(DDDs)
Alendronate 416 32.4% 52.9%
Etidronate 6 0.4% 0.2%
Ibandronate 138 10.7% 8.8%
Risedronate 340 26.5% 23.9%
Zoledronicacid
21 1.6% 1.4%
Raloxifene 101 7.8% 7.1%
Strontiumranelate
110 8.6% 5.0%
Teriparatide 114 8.9% 0.7%
PTH(1–84) 37 2.9% 0.0%
Total 1,283 100% 100%
0 200 000 400 000 600 000 800 000 1 000 000 1 200 000
Spain
France
Italy
Germany
Sweden
UK
Sales ( ) per 100 000 DDDs per 100,000
0% 10% 20% 30% 40% 50% 60% 70% 80%
France
Spain
Italy
Germany
UK
Sweden
Market Share (DDDs)
0
100 000
200 000
300 000
400 000
500 000
600 000
700 000
800 000
900 000
1 000 000
1998 1999 2000 2001 2002 2003 2004 2005 2006 2007 2008
Year
Sal
es (
) p
er 1
00,0
00 p
op
ula
tio
n
France Germany Italy Spain Sweden UK EU5
Arch Osteoporos

Fig. 41 Cost (€) per DDD in EU5 and Sweden all drugs
The average cost per DDD per treatment in EU5 isshown in Fig. 42. The price of etidronate has decreasedcontinuously since 1998. There is an apparent drop in theprice of alendronate in 2006 when generic substitutes wereintroduced (from 2003 in Sweden). Risedronate and ralox-ifene seem to have had a smaller reduction in price in recentyears whereas zoledronic acid showed a slight increase.
The volume (DDDs) has increased linearly whereas theprice per DDD has decreased or remained stable (varyingbetween countries). Thus, it appears as if the price of thedrugs has not had any major impact on total volume.
Fig. 42 Cost (€) per DDD per treatment in EU5
5.3.2 Uptake of treatments
Treatment uptake is presented using the followinganalyses:
The population coverage, i.e. the estimated proportionof the population 50 years or older that could be treatedbased on sales data adjusted for suboptimal adherence(as described in section 1.1.1).DDD per 100,000 based on whole population (all agesand both genders)
Estimated potentially treated patients compared to totalpatients assumed to be eligible for treatment
We first present the uptake of all drugs aggregated percountry and then the uptake of the individual drugs wherethe proportion of patients potentially treated are presented.
5.3.2.1 Uptake of treatments aggregated
The estimated population coverage (Fig. 43) has increasedwith a fairly linear trend in all countries but at different rates.In 2008, the coverage was 7.8%, 2.9%, 5.3%, 10.7%, 3.7%and 5.7% for France, Germany, Italy, Spain, Sweden and theUK, respectively. Spain appears to have the fastest uptake andalso has the highest coverage. In fact, Spain has a potentialpopulation coverage which is about 40% higher than France(the second highest uptake) and three times the uptakecompared with Germany (the lowest uptake). The level ofthe estimated population coverage contrasts to the fracturerisks in the different countries where Spain and Italy typicallyare considered countries with low fracture risk and Swedenand UK to be a high fracture risk countries. One part of theexplanation for the uptake differences may be related toparallel import/export which could not be fully controlled forin the data. Even though no official information is available,Spain is traditionally considered to be a country with a highlevel of parallel export.
Fig. 43 Estimated proportion of population 50 years or older treated
5.3.2.2 Uptake of individual treatments
The uptake of specific treatments is shown in Figs. 44 to52. The uptake of alendronate over time (Fig. 44) was moreor less linear in all countries. A possible exception wasFrance where the uptake seems to plateau from year 2006.The introduction of generic alendronate did not appear tobe associated with an increase in the rate of uptake in thenumber of patients treated. In 2008, the rank order ofuptake was Spain, UK, Italy, Sweden, France and Germany.
0.00
0.50
1.00
1.50
2.00
2.50
1998 1999 2000 2001 2002 2003 2004 2005 2006 2007 2008
Co
st (
) p
er D
DD
France Germany Italy Spain Sweden UK
0.0
0.2
0.4
0.6
0.8
1.0
1.2
1.4
1.6
1.8
2.0
1998 1999 2000 2001 2002 2003 2004 2005 2006 2007 2008
Co
st (
) p
er D
DD
Alendronate Etidronate Risedronate Zoledronic acid
Ibandronate Raloxifene Strontium Ranelate
0.00
0.02
0.04
0.06
0.08
0.10
0.12
1998 1999 2000 2001 2002 2003 2004 2005 2006 2007 2008
Year
Po
pu
lati
on
Co
vera
ge
France Germany Italy Spain Sweden UK EU5
Arch Osteoporos

Fig. 44 Uptake of alendronate
The pattern of the uptake of risedronate (Fig. 45) is notas clear as for alendronate and varied more widely betweencountries over time. The uptake has increased consistentlyin France and Italy whereas there is a notable reduction insales in Germany (year 2005) and UK (year 2006). In 2008,the rank order of uptake was Spain, France, Italy, the UK,Sweden and Germany.
Fig. 45 Uptake of risedronate
The uptake of etidronate (Fig. 46) has decreased to verylow levels. This downturn in usage of etidronate can beexplained by better clinical evidence for alendronate andother later marketed drugs in reducing fracture ratescompared with the data available for etidronate.
Fig. 46 Uptake of etidronate
The uptake of ibandronate (Fig. 47) differs somewhatbetween the countries with the highest uptake in Spainand the lowest in Germany. In France, the Health agency(Haute Autorité de Santé (HAS)) HAS has recommendedthat ibandronate should no longer be reimbursed becauseof insufficient data on efficacy compared to otherbisphosphonates. Ibandronate is not available for treat-ment of osteoporosis in the Swedish market.
Fig. 47 Uptake of ibandronate
The uptake of zoledronic acid (Fig. 48) has been modestin all countries in terms of volume, however, there seems tobe an increase in the rate of uptake from year 2007. In2008, France had the highest usage followed by Germany,Sweden, the UK, Spain and Italy.
Fig. 48 Uptake of zoledronic acid
The uptake of raloxifene (Fig. 49) follows the same trendin the different countries, albeit at different usage levels,namely an initial increase in the uptake followed by anapparent decline. In 2008, the highest uptake is observed inSpain followed by France. In the other countries the uptakeis almost at a similar level.
0
50 000
100 000
150 000
200 000
250 000
300 000
350 000
400 000
450 000
1998 1999 2000 2001 2002 2003 2004 2005 2006 2007 2008
Year
DD
Ds
per
100,
000
in p
opul
atio
n
France Germany Italy Spain Sweden UK EU5
0
50 000
100 000
150 000
200 000
250 000
300 000
1999 2000 2001 2002 2003 2004 2005 2006 2007 2008
Year
DD
Ds
per
100,
000
in p
opul
atio
n
France Germany Italy Spain Sweden UK EU5
0
5 000
10 000
15 000
20 000
25 000
30 000
35 000
40 000
45 000
50 000
1998 1999 2000 2001 2002 2003 2004 2005 2006 2007 2008
Year
DD
Ds
per
100,
000
in p
opul
atio
n
France Germany Italy Spain Sweden UK EU5
0
20 000
40 000
60 000
80 000
100 000
120 000
140 000
2005 2006 2007 2008
Year
DD
Ds
per
100,
000
in p
opul
atio
n
France Germany Italy Spain Sweden UK EU5
0
5
10
15
20
25
30
35
40
45
2005 2006 2007 2008Year
DD
Ds
per
100,
000
in p
opul
atio
n
France Germany Italy Spain Sweden UK
Arch Osteoporos

Fig. 49 Uptake of raloxifene
As for several of the other treatments, the uptake ofstrontium ranelate (Fig. 50) is highest in Spain and France.However, in these two countries the uptake increasedrapidly from market introduction but seems to have levelledoff from 2007. The marked decrease in uptake in France2007 may be related to concerns regarding drug rash witheosinophilia and systemic symptoms (DRESS) side effects.The low uptake in Sweden could be related to a restrictionin the indication to treat with strontium ranelate towardsmore severe osteoporotic patients.
Fig. 50. Uptake of strontium ranelate
The uptake of teriparatide and PTH (1–84) are shownin Fig. 51 and Fig. 52. Teriparatide is the most widelyused of the two PTH drugs. In Spain, the uptake ofteriparatide is the highest and has increased at a steadyrate whereas in the other countries the uptake has beenslower. In Spain, France, Italy and the UK the uptakeincrease in a fairly linear manner. In Germany, uptakeseems to have stabilised and in Sweden the usage startedto decrease from 2005.
Fig. 51 Uptake of teriparatide
Fig. 52 Uptake of PTH (1–84)
5.3.2.3 Proportion of patients treated
Fig. 53 shows the number of women that could betreated for a full year given the sales 2008 and adjusted forsuboptimal adherence related to the number of women thatcould be assumed to be eligible (exceeding the fracture riskthreshold) for an osteoporosis treatment. One minus theratio between treated patients and all patients can be viewedas an approximation of the treatment gap. The treatmentgap varies between countries which is a reflection of thesales as outlined above and national differences in fracturerisk between countries. Spain, for example, was shown tohave the highest treatment uptake, a relatively low risk offracture in the population and the smallest gap (about 19%for women) compared with Sweden which has one of thehighest levels of population fracture risk and an estimatedtreatment gap for women of 71%.
Table 58 shows the same information as in Fig. 53 innumbers and with the estimated treatment gaps. In total forall six countries there are 12.95 million women thatexceed the fracture risk level for treatment and 45% ofthese women could potentially be treated based on thesales data.
0
20 000
40 000
60 000
80 000
100 000
120 000
140 000
160 000
180 000
200 000
1998 1999 2000 2001 2002 2003 2004 2005 2006 2007 2008
Year
DD
Ds
per
100,
000
in p
opul
atio
n
France Germany Italy Spain Sweden UK EU5
0
10 000
20 000
30 000
40 000
50 000
60 000
70 000
2004 2005 2006 2007 2008
Year
DD
Ds
per
100
000
in p
opul
atio
n
France Germany Italy Spain Sweden United Kingdom EU5
0
2 000
4 000
6 000
8 000
10 000
12 000
14 000
20042003 2005 2006 2007 2008
Year
DD
Ds
per
100,
000
in p
opul
atio
n
France Germany Italy Spain Sweden UK EU5
0
50
100
150
200
250
300
350
400
450
280027002600
Year
DD
Ds
per
100,
000
in p
opul
atio
n
Germany Italy Spain Sweden UK EU5
Arch Osteoporos

Fig. 53 Estimated treated women compared to total female
population above 50 years assumed to be eligible for treatment
(year 2008)
The calculations for men (Fig. 54 and Table 58)indicate that the volume of sold osteoporosis drugswould be sufficient to cover treatment for more patientsthan the number that fall above the fracture riskthreshold in France, Spain and the UK. Note, however,that the results from this analysis has to be handledwith some caution since we have assumed the samedistribution of drug use between genders as observed inSweden. Also, the analysis assumes that treatments arecurrently targeted appropriately. In total for all sixcountries there are 1.45 million men that exceed thefracture risk level for treatment and 78% of these mencould potentially be treated based on the sales data(Table 58).
Fig. 54 Estimated treated men compared to total male population
above 50 years assumed to be eligible for treatment (year 2008)
Table 58 Number of men and women (in thousands) above 50 years
exceeding the fracture risk threshold for treatment and the potential
number treated
5.3.2.4 A comparison of data from the Swedishprescribed drug register and sales data
The Swedish Prescribed Drug Register was established inJune 2005. It contains all filled prescriptions outside of thehospital setting dispensed by pharmacies for the wholeSwedish population. The loss of patient information fromnon-hospital prescriptions in the Swedish Prescribed DrugRegister is at maximum 0.6%. Aggregated informationseparated on age and gender for all drugs is available from2006 until 2009 on the website of National Board of Healthand Welfare (www.sos.se). Information regarding the numberof patients prescribed a treatment, total number of DDDs,DDDs per 1,000 in population, and total number ofprescriptions can be extracted. In the following tables andfigures we present an analysis based on prescription data forosteoporosis drugs extracted from this source and acomparison with the IMS Health data.
As can be seen in Fig. 55 and Table 59 the IMS Healthsales data on volume (converted from mg to DDDs)matches well with the Swedish prescription register fornon-bisphosphonates but less so for bisphosphonates. Themain part of the gap is related to a difference in the use ofalendronate (Fig. 56).
The IMS Health sales data shows an estimated DDDper 100,000, which is about 20% higher than what wasdispensed through Swedish pharmacies. Overall, theIMS Health data show higher DDDs per 100,000 in thepopulation compared with the prescription data. The
0 500 000 1 000 000 1 500 000 2 000 000 2 500 000 3 000 000 3 500 000
Sweden
Spain
UK
France
Italy
Germany
Treated patients Not treated patients
0 100 000 200 000 300 000 400 000 500 000 600 000
Sweden
Spain
UK
France
Italy
Germany
Treated patients Not treated patients
Numberpotentiallytreated(000)
Number exceedingfracture riskthreshold(000)
Difference(000)
Treatmentgap (%)
Women
Sweden 106 368 262 71%
Spain 1,391 1,722 331 19%
UK 1,028 2,363 1335 56%
France 1,492 2,514 1022 41%
Italy 1,062 2,684 1622 60%
Germany 809 3,301 2492 75%
Total 5,890 12,952 7062 55%
Men
Sweden 21 40 19 48%
Spain 275 238 -37 -16%
UK 198 119 -78 -66%
France 286 283 -2 -1%
Italy 204 231 27 12%
Germany 158 543 385 71%
Total 1,141 1,454 313 22%
Arch Osteoporos

explanation of this discrepancy between the register andsales data is not self-evident. One part of the explana-tion for the uptake differences could be related toparallel import/export or to prescriptions filled throughhospital pharmacies which were not captured in theSwedish prescription register. However, the parallelexport in Sweden is very limited accounting for about1-2% of total sales1 and only 1-2% of all alendronate
prescriptions are filled in an inpatient care setting.2
Also, notable is that there seems to be a plateau or, evena decrease, in the uptake of alendronate in 2009 wherethe number of DDDs per 100,000 started to decrease(Fig. 56).
Fig. 55 DDDs per 100,000 in population for bisphosphonates based
on the Swedish Prescribed Drug Register and IMS Health data
Table 59 DDDs per 100,000 in population for non-bisphosphonates based on the Swedish Prescribed Drug Register and IMS Health
data
Fig. 56 DDDs per 100,000 in population for alendronate based on
Swedish prescription register and IMS Health data
As can be seen in Fig. 57, the percentage of thepopulation filling a prescription increases with age. In
women it rises from 0.7% in the age interval 50–54 yearsup to 11.3% in the 80–84 year age group and thereafter itdecreases at ages above 85 years. Men follow the samepattern but at much lower levels. The peak uptake (2.1%) isreached in the 80–84 year age group.
The annual number of patients that filled a prescriptionfor an osteoporosis drug increased by about 10,000between years 2006 and 2009 (Table 60). About 87% ofall patients treated were women. These figures can becompared to the estimate of how many patients could betreated for a full year based on the IMS Health data. For2008, the number of patients was estimated at 127, 025which is 24% higher than the actual number of patients thatfilled a prescription based on register data. In Table 61, thetreatment gap is shown in Sweden for men and women atdifferent ages based of the number of patients that filled anosteoporotic drug prescription in year 2009. The tableshows the proportion of the population exceeding the
0
50 000
100 000
150 000
200 000
250 000
300 000
350 000
400 000
2005 2006 2007 2008 2009
Year
DD
D p
er 1
00 0
00
Bisphophonates Swedish registry Bisphophonates IMS data
Bisphosphonates Raloxifene Strontium ranelate PTHs
Year Swedishregister
IMS Healthdata
Swedishregister
IMS Healthdata
Swedishregister
IMS Healthdata
Swedishregister
IMS Healthdata
2005 - 280,057 - 17,400 - - 1,893
2006 253,984 306,371 14,806 14,928 539 606 1,558 1,583
2007 275,888 336,727 13,008 13,182 1,464 1,600 1,340 1,327
2008 291,949 356,923 11,126 11,370 2,003 2,128 1,034 972
2009 280,060 - 9,425 - 2,338 - 770 -
0
50 000
100 000
150 000
200 000
250 000
300 000
2005 2006 2007 2008 2009
Year
DD
Ds
per
100
000
IMS Health data Swedish register
1 This estimate was provided by Tamro, one of the largest Swedishpharmaceutical wholesalers 2 Information provided by Apotekens Service AB
Arch Osteoporos

fracture risk threshold for treatment that might receivetreatment according to gender and age groups. Thetreatment gap decreases with age for both ages. For womenthe treatment gap is 95% in the 50–54 year age group and isat lowest (43%) between 80–84 years of age. Since thesetreatment gap calculations are based on the actual numberof patients that have filled a prescription they are betterestimates than those based on sales data in the previoussection. Based on sales data (see Table 58) the treatmentgap over all ages above 50 years was 71% and 48% forwomen and men, respectively. This can be compared to thehigher estimates of the treatment gap of 75% for womenand 67% for men based on the number of patients filling aprescription.
Fig. 57 Percentage of population prescribed an osteoporotic drug in
Sweden according to age group
Table 60 Number of patients aged 50 years or more prescribed an
osteoporotic drug in Sweden
Table 61 Number of patients that filled an osteoporotic drug prescription in year 2009 related to number in the population exceeding fracture risk
threshold for treatment in Sweden according to gender and age groups
Fig. 58 shows the proportion of a year that a patient onaverage has access to a daily dose of treatment based on thevolume of filled prescriptions. This is calculated bydividing the total DDDs prescribed by 365 and the numberof patients that filled a prescription. The observed coveragegap encompasses both treatment gaps (compliance) andtreatment discontinuation (persistence). Raloxifene has the
highest coverage followed by PTHs and bisphosphonates.The larger gap observed for strontium ranelate can partly beexplained by that the uptake has not reached a steady statebut is rising due to its relatively recent market introduction(approved in Sweden for reimbursement mid-year 2005).Also, the coverage decreased somewhat in year 2009 forPTHs and bisphosphonates.
0%
2%
4%
6%
8%
10%
12%
50 54 55 59 60 64 65 69 70 74 74 79 80 84 85+
Age group
Per
cen
tag
e (%
) o
f p
op
ula
tio
n
Women Men
Women Men
Age group Number of patientsprescribed anosteoporoticdrug in 2009
Number exceedingfracturerisk threshold
Treatmentgap (%)
Number ofpatients prescribedan osteoporoticdrug in 2009
Number exceedingfracture riskthreshold
Treatmentgap (%)
50-54 2,140 47,232 95% 563 7,670 93%
55-59 4,732 54,150 91% 926 6,336 85%
60-64 9,872 63,240 84% 1,660 5,871 72%
65-69 12,621 61,712 80% 1,952 5,502 65%
70-74 14,609 45,571 68% 2,157 5,580 61%
74-79 17,674 38,243 54% 2,223 4,752 53%
80-84 16,652 29,376 43% 2,148 2,688 20%
85+ 14,894 28,678 48% 1,544 1,343 -15%
Total 93,194 368,202 75% 13,173 39,742 67%
Bisphosphonates Raloxifene Strontiumranelate
PTHs
Year Women Men Women Men Women Men Women Men
2006 79,694 11,014 4,619 0 399 14 500 9
2007 84,343 11,883 3,983 2 951 41 404 10
2008 87,829 12,769 3,412 1 1,139 44 319 10
2009 88,918 13,113 2,909 0 1,165 48 250 12
Arch Osteoporos

Fig. 58 The average proportion of a year that a patient has access
to a daily dose of treatment based on the volume of filled
prescriptions
5.3.2.5 A comparison of prescription data from theBasque region in Spain and sales data
In a recent publication by Etxebarria-Foronda et al. [3]the use of osteoporosis treatments in the Basque region inSpain was analysed. In this study they derived data on thetotal annual number of DDDs of osteoporosis treatmentsprescribed to women in Basque between 2000 and 2008.The source of the data used is unfortunately not made clearin the article. Based on the DDD data they estimated thenumber of women above 54 years of age that could betreated for a full year (i.e., no adjustments for suboptimaladherence was made). Fig. 59 shows a comparison betweenthe estimated proportion of women that could be treated inBasque compared to the sales data for the whole of Spain.The same pattern was observed in this comparison as withthe Swedish Prescribed Drug Register comparison, i.e., thesales data showed a much higher uptake than local
prescription data. The difference also seemed to increaseover the years. This comparison needs to be interpretedwith some caution since the prescription data only cover apart of Spain and the publication does not disclose whatmedications are included or the source of the information.
Fig. 59 Proportion of women in the population that could be treated
for full year based on Basque prescription data and IMS Health sales
data for Spain [3]
References
1. Kobelt G, Kasteng F (2009) Access to innovativetreatments in rheumatoid arthritis in Europe www.comparatorreports.se Accessed 24 May 2011
2. Melton LJ III, Kanis JA, Johnell O (2005) Potentialimpact of osteoporosis treatment on hip fracture trends.J Bone Miner Res 20: 895–7
3. Etxebarria-Foronda I, Mar J, Arrospide A, Esnal-Baza E(2010) Trends in the incidence of hip fractures in womenin the Basque country. Arch Osteoporos 5: 131–7
0.00
0.10
0.20
0.30
0.40
0.50
0.60
0.70
0.80
0.90
2006 2007 2008 2009
Year
Pro
po
rtio
n o
f ye
arly
co
vera
ge
Bisphophonates Raloxifene Strontium ranelate PTHs
0.00
0.02
0.04
0.06
0.08
0.10
0.12
0.14
2000 2001 2002 2003 2004 2005 2006 2007 2008P
rop
ort
ion
of
wo
men
Sales data Spain Prescription data Basque
Arch Osteoporos

6 The future burden of fractures and the consequencesof increasing treatment uptake
SummaryThe objectives of this chapter were to estimate how the
expected demographic changes will impact the burden ofdisease up to 2025 in terms of fractures, morbidity andcosts in the EU5+ and how an increased treatment uptakewould affect the burden.
The key messages of this chapter are:
This chapter projects the burden in terms of number offractures, morbidity and costs between 2010 and 2025.
The annual number of fractures in the EU5+ wasestimated to increase from 2.46 million in 2010 to 3.17million in 2025 (a total increase of 28.9%).
The number of QALYs lost annually due to fractureswas projected to increase from 0.85 million to 1.0million over the same time period.
The total monetary burden in the EU5+ was estimated toincrease from €30.7 billion in 2010 to €38.5 billion in 2025.
Increasing treatment uptake to provide all individualswith a 10-year probability of fracture exceeding that ofan age- and sex-matched individual with a previousfracture with a 3-year treatment would require a 2.4-fold increase in provision of treatment in the EU5.
A large proportion of all fractures occur in osteopenicpatients, and pharmacological treatment given to highrisk patients will thus only partially alleviate theincreased burden, which in our estimation was solelycaused by demographic changes.
Increasing treatment uptake in the EU5+ would resultin 95,000 fewer fractures and 33,357 QALYs gainedannually in 2025.
The accumulated number of potentially avoided frac-tures from increasing uptake up to 2025 was estimatedat 699,000.
13% of the projected increase in fractures and 20% ofthe projected increase in lost QALYs could cost-effectively be avoided by increasing treatment uptaketo encompass all individuals with a 10-year probabilityof fracture exceeding that of an age- and sex-matchedindividual with a previous fracture.
6.1 Introduction
The prevalence of osteoporosis, as judged by BMDmeasurements, increases markedly with age. Approximately6% of women and 2.5% of men in the developed world haveosteoporosis at the age of 50 years, and this proportion risessteeply with age to reach approximately 50% and 20% in thoseolder than 85 years (Chapter 3). Approximately 12 millionwomen and 3 million men between 50–85 years haveosteoporosis in the EU5. In women aged 50 years, theremaining lifetime risk of experiencing a major osteoporoticfracture ranges from 26% in Spain to 49% in Sweden. Fig. 60gives a simple schematic overview of the determinants of theburden of osteoporotic fractures. The total fracture risk in apopulation will depend on its underlying age-specific fracturerisk, the age-distribution, andwhat measures are taken to reducethe risk of fractures. The consequences of a fracture can bedivided into an acute phase where costs, lost QoL and mortalityare considerable and a long-term phase where an effect onmorbidity and costs persists, but is less pronounced [1–4].
Fig. 60 Overview of the determinants of the burden of osteoporotic
fractures
The objective of this chapter was 2-fold. The impact ofthe demographic changes on the burden up to 2025 in termsof fractures, morbidity, and costs in the EU5+ wasestimated. Furthermore, it was estimated how an increasedtreatment uptake would affect the burden up to 2025 interms of fractures, morbidity and costs in the EU5+.
6.2 Secular trends
The number of fractures has increased during recentdecades, partly because of an increasing number ofelderly women in society. Over and above this, therehave been changes over time in the age- and sex-specific
Incident fracture
Prevalent fracture
Aging population
Mortality
Treatment
Cost
Quality of life
–
+
+
+
Fracture risk
+
+
+
–
–
+
Arch Osteoporos

risk of fracture, most completely studied in the case ofhip fracture [5, 6]. Whilst Swedish crude hip fractureincidence has increased, age-adjusted incidence (inde-pendent of demographic trends) has recently remainedstable between 1967 and 2001. Palvanen et al. [7] reporta clear rise in the rate of humeral fractures in Finnishwomen 60 years of age and older from 1970 till late1990s followed by stabilisation or even decreasedfracture rates in later years. The precise reasons forsecular changes are unknown, but a cohort effect towardsimproved functionality among older women and actionsand interventions in preventing falls and minimising fallseverity cannot be ruled out. These findings are sup-ported by a recent Canadian population-based analysis,which found that the age-adjusted incidence of low-trauma fractures has shown an annual decrease between1986 and 2006 of 1.2% and 0.4% in women and men,respectively [8]. Furthermore, studies from the UK [9]and Germany [10] have reported a stabilisation of age-standardised hip fracture incidence rates over the periods1989–1998 and 1995–2004, respectively. Few studies areavailable from Southern Europe. A Spanish studyreported that the number of hip fractures increasedbetween 1988 and 2002, but no significant change wasobserved in age-adjusted incidence rates among men orwomen, over the same period [11].
We found similar trends as in previous studies whenanalysing Swedish crude hip fracture incidence between1998 and 2008 from the Swedish patient register. Fig. 61shows a declining incidence of hospital discharges withs72.x (fractures of the hip and femur) as the primaryICD-10 diagnosis for hospitalisation. The observedfracture rates were based on a total of 207,000 fracturesin 19.2 million person-years in Swedish women olderthan 49 years. The observed incidences were not adjustedfor changes in demography. The red line in Fig. 61represents a projected incidence from 1998 that takesaccount of the increase in uptake of treatment between1998 and 2008. Treatment was assumed to reduce therisk of hip fractures by 38% [12] and treated patientswere assumed to have a 2-fold underlying risk of fracturecompared with the general population. This projectioncan be compared with the extrapolated incidence of 1998which disregards treatment uptake and secular trends,represented by the flat black line. Comparison of the areabetween these two curves with the area between theobserved incidence curve and the flat incidence curvesuggests that approximately 16.5% of the observed riskdecline between 1998 and 2008 could potentially beattributed to antifracture treatment. It is also relevant tonote that the age- and sex-specific incidence of hipfracture appears to have remained unchanged from 2002.
Fig. 61 Observed and projected risk of hip and femur fractures (s72.x)
between 1998 and 2008
Treatment penetration was only marginal duringthose years when reductions in age-adjusted risks werefirst observed. It is therefore unlikely that increasedaccess to treatment is the major cause behind thesetrends of stabilising or decreasing age-adjusted risks.Furthermore, a majority of all fragility fractures occur inindividuals with a T-score above −2.5 SD and fractureprevention targeted at individuals at high risk of fracturewill thus have a limited impact on the total fractureburden.
The findings presented above points at a stabilisationof fracture rates the past decades and therefore, forthe purpose of this report, a constant age- and sex-specific incidence was used for future fracture rateprojections.
6.3 Demography
Irrespective of whether age-adjusted risks are decreas-ing or not, the expected demographic changes will beassociated with an increase in the number of fractures inWestern Europe during the coming 15 years. Asdescribed in the previous chapters, age is an importantand independent clinical risk factor for fracture and thenumber of elderly men and women is projected toincrease (Fig. 62 and Fig. 63). Estimates based onUnited Nations World Population Prospects data [13]indicate that the number of women and men older than50 years will increase in the six reference countries.Particularly noteworthy is the group of women and menolder than 89 years, which, depending on country, isprojected to increase 1.5 to 3-fold in size in 2025. Theproportion of the population older than 65 years isprojected to increase from 14% to 17% between 2010and 2025 in the EU5 and Sweden (Table 62).
8
9
10
11
12
1998 1999 2000 2001 2002 2003 2004 2005 2006 2007 2008
Year
Hip
fra
ctu
re in
cid
ence
/1,0
00 w
om
en (
50+)
Projected incidence when only consideringincreased treatment uptakeObserved incidence
Lower CI95
Upper CI95
Projected incidence with treatment uptake
Arch Osteoporos

Fig. 62 Changes (%) in the number of women by age and country
between 2010 and 2025 by country
Fig. 63 Changes (%) in the number of men by age and country
between 2010 and 2025
Table 62 Total population (in thousands) and projected proportion of
total population older than 65 years in the EU5 and Sweden (%)
The proportion of the population aged 65 years orolder in Europe is expected to grow and the clinical andfinancial burden of osteoporosis is consequently alsoexpected to increase over time. Although the epidemi-ology of fractures (particularly hip fractures) and theprevalence of osteoporosis are relatively well docu-mented, limited data are available on the burden ofosteoporosis and fractures at a national level, andpotential trends over time. The future burden ofosteoporosis, set to increase in the coming years dueto changing demography, could potentially be decreasedby closing the “treatment gap”, i.e., the differencebetween current treatment uptake and the number ofpatients that, according to certain criteria, should betreated.
6.4 The treatment gap
Criteria for eligibility for treatment vary accordingto national guidelines in different countries (seeChapter 2). A commonly used definition of osteoporo-sis has been a femoral neck or lumbar spine T-score ator below -2.5 SD. Patients who also have a prevalentfracture are considered to have established osteoporosis[14]. If the proportion of the population with a T-scoreat the femoral neck at or below -2.5 SD is consideredas an intervention threshold, the current level oftreatment penetration is low in many countries. Whenreference BMD values from NHANES III [15] areused, then 6%, 12%, 22%, and 36% of women aged50, 60, 70, and 80 years will have a T-score <−2.5 SDin a given population. These estimates are in goodagreement with empirical data from different regions ofthe world [14]. Applying such calculations to the UKpopulation indicates that approximately 2.4 millionwomen have a T- score <−2.5 SD. Age-specificnumbers for other countries are given in Table 23 inChapter 3.
These numbers can be compared to the currentestimate of treatment. In the UK, for example,approximately one million women can receive treat-ment based on sales data (see Chapter 5). Thus,assuming that only patients with osteoporosis aretreated, then only 41% of women with osteoporosisas defined by BMD are treated. In practice, theproportion treated is expected to be less, since anuncertain proportion of treatments will be given towomen without osteoporosis. Estimates for men andmen and women in other countries are given in Table63 and Table 64.
10%
40%
90%
140%
190%
France Spain UK Germany Italy Sweden
Ch
ang
e (%
)
50 59 60 69 70 79 80 89 90+
2010 2015 2020 2025
Total population (000)
France 62,634 63,899 64,930 65,767
Spain 82,056 81,345 80,422 79,258
UK 60,098 60,604 60,408 60,020
Germany 45,317 47,202 48,564 49,266
Italy 61,899 63,529 65,088 66,601
Sweden 312,004 316,579 319,412 320,912
All 59,398 64,375 69,016 74,390
Age 65+ years (% of total population)
France 16.1 17.9 19.7 21.4
Spain 16.3 16.9 17.7 19.2
UK 15.6 16.7 17.5 18.3
Germany 19.3 20.3 21.7 23.6
Italy 19.4 20.6 21.8 23.1
Sweden 17.2 18.8 19.9 20.6
All 19.0 20.3 21.6 23.2
10%
10%
30%
50%
70%
90%
110%
France Spain UK Germany Italy Sweden
Ch
ang
e (%
)
50 59 60 69 70 79 80 89 90+
Arch Osteoporos

Table 63 Number (in thousands) of women aged 50 years or more with osteoporosis in EU5 and Sweden using female-derived reference ranges at
the femoral neck and the number of patients being treated
*Assuming that women receive 87% of all prescribed treatments
Table 64 Number (in thousands) of men aged 50 years or more with osteoporosis in EU5 and Sweden using female-derived reference ranges at the
femoral neck and the number of patients being treated
*Assuming that men receive 13% of all prescribed treatments
The development of FRAX has changed the manner oftargeting treatment from that based on BMD to that based onfracture probability (see Chapter 3) [16]. The UK, Sweden andGermany have developed guidelines based on fractureprobability. In the UK, intervention is recommended in womenwith a prior fragility fracture and in men and women with anage-specific fracture probability that corresponds to a womenwith a previous fracture (no other CRFs, an average BMI andwithout BMD) [17–19].
Using intervention thresholds based on the absolutefracture probability corresponding to an age-matched womanwith a prevalent fracture allows calculation of how manyindividuals who may be at a sufficient risk to be treated (seeFig. 21 and 22 in Chapter 3). In all, 12.6 million women and1.4 million men in the EU5 fall above the thresholdprobability for treatment. However, it does not provideguidance for how much a country’s treatment uptake shouldbe increased. Even though long-term pharmacological frac-ture prevention is relatively safe [20] it would be unrealistic toimagine that all patients at sufficiently high risk would betreated for the remainder of their life. Thus, to estimate a“target treatment uptake” based on the intervention thresholdsassessed using the translational approach (see Chapter 3 formore detail), the following assumptions were made:
– Every individual who meets or exceeds the absolute riskthreshold should receive a treatment that, on average, willlast for 3 years. It was implicitly assumed that anindividual can be given additional treatments later in life.
– Based on summary prescription data from Sweden(www.socialstyrelsen.se) it was assumed that 13% ofall doses were prescribed to men in all index countries.This figure is in close agreement with findings fromNorway where 10% of users were men [21].
– The current number of possibly treated individuals wasderived from sales data (Chapter 5). The estimates werenot adjusted for adherence because it is unknown howadherence will change in the future and a given amount ofconsumed doses should anyway translate into avoidedfractures, irrespective of adherence on the patient level.Therefore, all estimates in tables and figures from hereonwards in this report reflect person-years with treatmentrather than number of treated individuals and may thusdiffer from some estimates presented in Chapter 5.
– It was assumed that the “target treatment uptake” willbe reached by 2025. Treatment uptake was assumed toincrease linearly. The treatment uptake observed fromsales data for 2008 were assumed to be the same for2010, where the projection starts.
Population (000) % of population treated* Population with T-score<−2.5 SD (000)
Number treated (000)* % of osteoporotic populationpotentially treated
France 10,318 2.8 694 286 41
UK 10,030 2.0 673 198 29
Germany 15,195 1.0 997 158 16
Italy 10,710 1.9 745 204 27
Spain 7,200 3.8 492 275 56
Sweden 1,645 1 112 21 18
All 53,453 2.1 3,600 1,120 31
Population (000) % of population treated* Population with T-score<−2.5 SD (000)
Number treated (000)* % of osteoporotic populationpotentially treated
France 12,447 12.0 2,817 1,492 53
UK 11,562 8.9 2,545 1,028 40
Germany 17,797 4.5 4,034 809 20
Italy 12,989 8.2 3,051 1,062 35
Spain 8,513 16.3 1,937 1,391 72
Sweden 1,832 5.8 411 106 26
All 63,308 9.1 14,385 5,783 40
Arch Osteoporos

Even were treatment uptake to remain on the levelscurrently seen in sales, the number of women and mentreated would still increase up to 2025 due todemographic changes (Table 65 and Table 66). The
estimated target uptake corresponded to an averageincrease in the number of prescriptions in the EU5 bya factor of 2.36 when demographic changes wereaccounted for.
Table 65 Number of person-years with treatment in women 2010–2025 with current and target uptake
Table 66 Number of person-years with treatment in men 2010–2025 with current and target uptake
2010 2015 2020 2025
Spain Current treatment uptake 1,015,749 1,111,203 1,215,128 1,325,974
Approaching target uptake 1,015,749 1,143,456 1,285,668 1,441,436
Difference 0 32,253 70,539 115,461
Sweden Current treatment uptake 77,703 81,224 85,253 88,773
Approaching target uptake 77,703 132,946 193,830 258,363
Difference 0 51,722 108,576 169,590
Germany Current treatment uptake 590,802 632,863 667,255 673,861
Approaching target uptake 590,802 1,212,993 1,890,567 2,526,996
Difference 0 580,130 1,223,312 1,853,136
Italy Current treatment uptake 775,194 827,653 880,829 927,559
Approaching target uptake 775,194 1,221,102 1,718,283 2,250,383
Difference 0 393,448 837,454 1,322,824
UK Current treatment uptake 750,739 804,438 857,682 894,498
Approaching target uptake 750,739 1,083,126 1,451,949 1,824,163
Difference 0 278,688 594,268 929,665
France Current treatment uptake 1,089,450 1,171,288 1,239,034 1,297,415
Approaching target uptake 1,089,450 1,442,562 1,812,962 2,198,869
Difference 0 271,273 573,927 901,454
2010 2015 2020 2025
Spain Current treatment uptake 200,716 224,439 251,536 281,588
Approaching target uptake 200,716 228,648 260,969 297,427
Difference 0 4,208 9,433 15,839
Sweden Current treatment uptake 15,079 16,014 17,013 17,746
Approaching target uptake 15,079 16,487 18,018 19,318
Difference 0 473 1,005 1,572
Germany Current treatment uptake 115,301 126,949 136,138 137,800
Approaching target uptake 115,301 268,511 439,757 598,788
Difference 0 141,563 303,619 460,988
Italy Current treatment uptake 149,169 161,398 174,532 186,385
Approaching target uptake 149,169 186,783 229,434 274,330
Difference 0 25,385 54,902 87,945
UK Current treatment uptake 144,222 155,452 166,064 172,606
Approaching target uptake 144,222 141,127 135,457 124,888
Difference 0 -14,325 -30,606 -47,718
France Current treatment uptake 208,498 225,493 240,163 253,480
Approaching target uptake 208,498 251,384 295,314 340,792
Difference 0 25,891 55,150 87,313
Arch Osteoporos
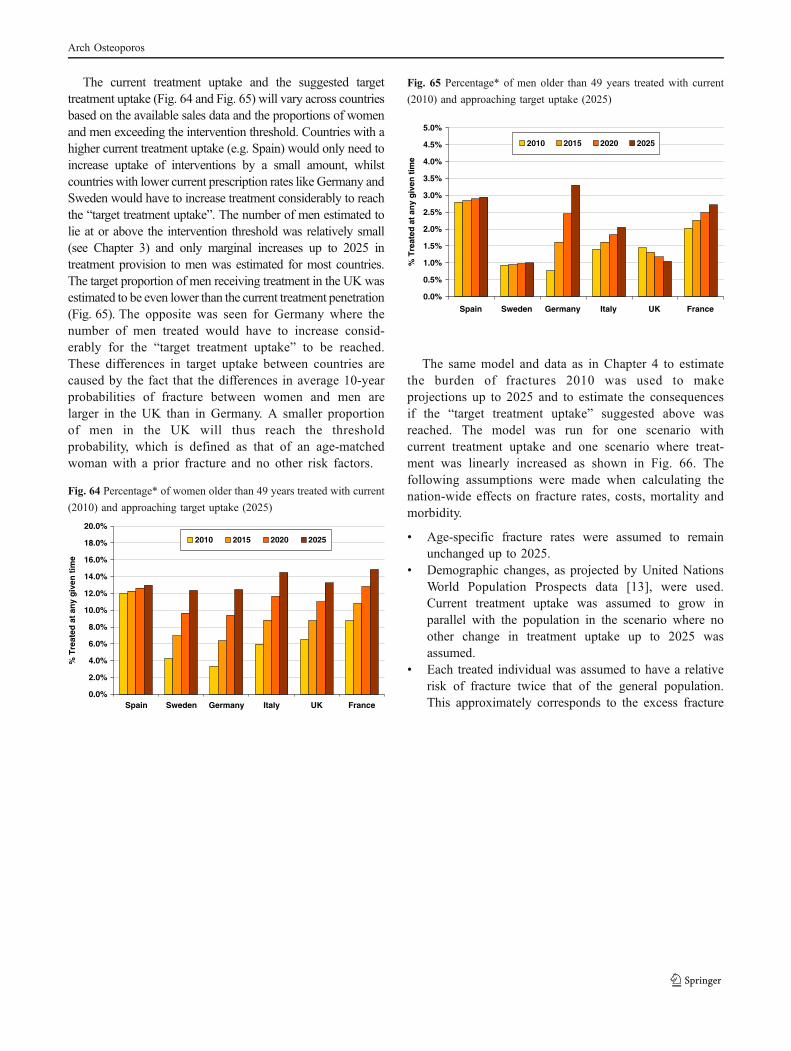
The current treatment uptake and the suggested targettreatment uptake (Fig. 64 and Fig. 65) will vary across countriesbased on the available sales data and the proportions of womenand men exceeding the intervention threshold. Countries with ahigher current treatment uptake (e.g. Spain) would only need toincrease uptake of interventions by a small amount, whilstcountries with lower current prescription rates like Germany andSweden would have to increase treatment considerably to reachthe “target treatment uptake”. The number of men estimated tolie at or above the intervention threshold was relatively small(see Chapter 3) and only marginal increases up to 2025 intreatment provision to men was estimated for most countries.The target proportion of men receiving treatment in the UKwasestimated to be even lower than the current treatment penetration(Fig. 65). The opposite was seen for Germany where thenumber of men treated would have to increase consid-erably for the “target treatment uptake” to be reached.These differences in target uptake between countries arecaused by the fact that the differences in average 10-yearprobabilities of fracture between women and men arelarger in the UK than in Germany. A smaller proportionof men in the UK will thus reach the thresholdprobability, which is defined as that of an age-matchedwoman with a prior fracture and no other risk factors.
Fig. 64 Percentage* of women older than 49 years treated with current
(2010) and approaching target uptake (2025)
Fig. 65 Percentage* of men older than 49 years treated with current
(2010) and approaching target uptake (2025)
The same model and data as in Chapter 4 to estimatethe burden of fractures 2010 was used to makeprojections up to 2025 and to estimate the consequencesif the “target treatment uptake” suggested above wasreached. The model was run for one scenario withcurrent treatment uptake and one scenario where treat-ment was linearly increased as shown in Fig. 66. Thefollowing assumptions were made when calculating thenation-wide effects on fracture rates, costs, mortality andmorbidity.
& Age-specific fracture rates were assumed to remainunchanged up to 2025.
& Demographic changes, as projected by United NationsWorld Population Prospects data [13], were used.Current treatment uptake was assumed to grow inparallel with the population in the scenario where noother change in treatment uptake up to 2025 wasassumed.
& Each treated individual was assumed to have a relativerisk of fracture twice that of the general population.This approximately corresponds to the excess fracture
0.0%
2.0%
4.0%
6.0%
8.0%
10.0%
12.0%
14.0%
16.0%
18.0%
20.0%
Spain Sweden Germany Italy UK France
% T
reat
ed a
t an
y g
iven
tim
e
2010 2015 2020 2025
0.0%
0.5%
1.0%
1.5%
2.0%
2.5%
3.0%
3.5%
4.0%
4.5%
5.0%
Spain Sweden Germany Italy UK France
% T
reat
ed a
t an
y g
iven
tim
e
2010 2015 2020 2025
Arch Osteoporos

risk in patients with a FRAX probability exceeding theintervention threshold risk compared with the generalpopulation.
& After stopping treatment each individual received alinearly declining residual antifracture effect equallylong as the time on treatment [20, 22–24]. Thismeans that when three years of treatment wasstopped the effect declined to 0 over 3 years. Inother words, a 3 year treatment conferred 1.5 years of“free” effect.
& The effects of alendronate estimated in a recent meta-analysis [12] were assumed to apply to all treatmentsused up to 2025. All treatments were thus assumed toreduce the risk of hip fracture (RR 0.62), clinicalvertebral fracture (RR 0.56), wrist fracture (RR 0.85),and other fractures (RR 0.82).
& All countries were assumed to have a 80/20 mixof generic alendronate and second-line brandedtreatments.
& Each treatment was assumed to be associated with aphysician visit each year and a BMD measurementevery second year [25, 26].
& To allow interpretation and comparison over time nodiscounting of costs or QALYs was employed unlessspecifically stated.
A schematic representation of how the “target treat-ment” level is reached is shown in Fig. 66 where thecurrent and target uptake rate are adjusted for demo-graphic changes.
Fig. 66 Concept of closing the gap
The same data were used as for the calculation of theburden of disease in Chapter 4. The cost of the 20%second-line treatments was calculated from current localprices (Table 67).
Table 67 Unit costs for treatment and management (€, 2010)
6.5 Results
6.5.1 Projection of fractures
The annual number of fractures (all types) is projected toincrease from 2010 to 2025 with the current treatment uptake(Table 68). As is seen in Table 68 below this is also the caseeven if the “target uptake” is reached. For example, with thecurrent treatment uptake the total number of fractures inFrance is estimated to increase from 379,493 in 2010 to506,995 in 2025, a total increase of 33.6%. The increase willbe mitigated (30.8%), but still substantial if the suggested“target uptake” is reached. In EU5 and Sweden, the number offractures (all types) is projected to increase by 28.9% between2010 and 2025 (from 2.46 million to 3.17 million). This is dueto the population increase and demographic change predictedto occur up to 2025, with increasing numbers of elderly in allcountries. However, increasing uptake of treatment would onaverage reduce the increase in the number of fracturesbetween 2010 and 2025 by 13%.
The pattern of increased annual number of fractures isapparent also when separated by type of fracture (Table 69).With the current treatment uptake hip fractures are expected toincrease on average by 33% between 2010 and 2025 in EU5and Sweden closely followed by “other” fractures, spinefractures and forearm fractures (30%, 28% and 22% respec-tively). Spain is expected to have the highest relative increasein number of fractures across all fracture types (35% forforearm fractures to 47% for hip fractures). However, if the
0
100000
200000
300000
400000
500000
600000
25202010
Tre
atm
ent
up
take
Target uptake Current uptake Analysed scenario
BMDmeasurement
Physicianvisit
Generic ALN(per year)
2nd line(per year)
Sweden 152a 130a 27b 443b
UK 51c 50c 18d 315d
France 41e 50f 209j 418j
Germany 36e 38g 245k 689k
Italy 81e 50h 294l 669l
Spain 109e 76i 201m 460m
a [27]b www.fass.sec [28]d British National Formularye [29]f [30]g [31]h [32]i [25]j www.vidalpro.netk www.rote-liste.del www.agenziafarmaco.itm www.portalfarma.com
Arch Osteoporos
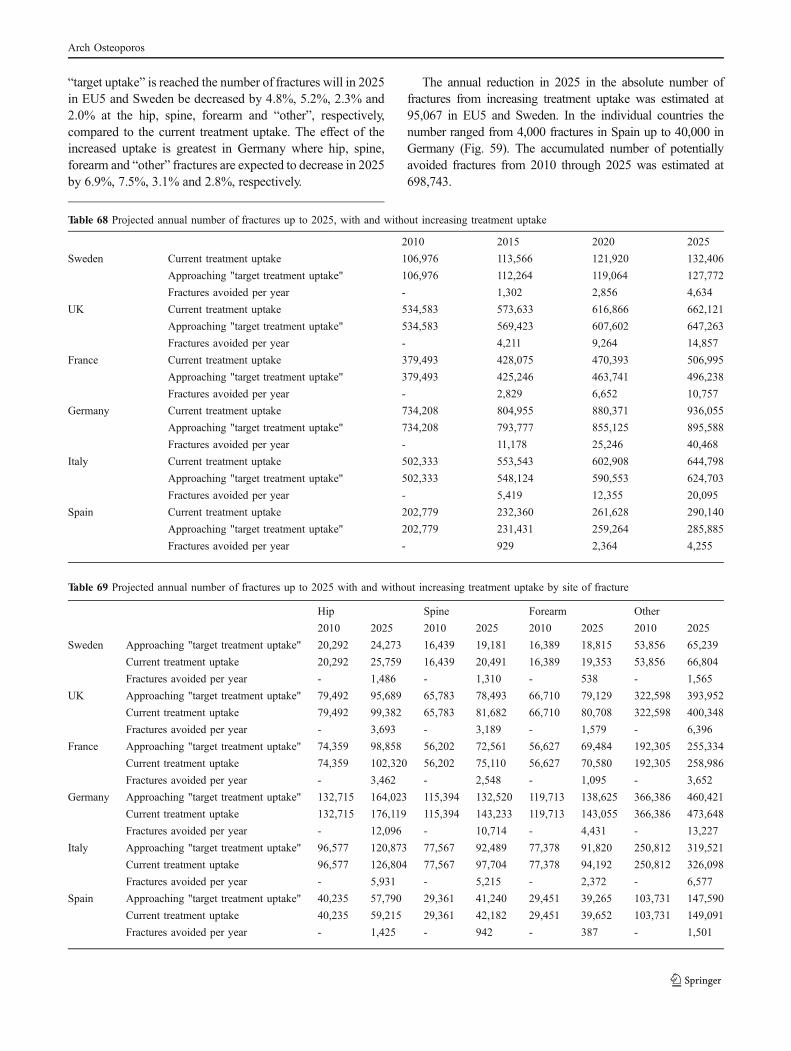
“target uptake” is reached the number of fractures will in 2025in EU5 and Sweden be decreased by 4.8%, 5.2%, 2.3% and2.0% at the hip, spine, forearm and “other”, respectively,compared to the current treatment uptake. The effect of theincreased uptake is greatest in Germany where hip, spine,forearm and “other” fractures are expected to decrease in 2025by 6.9%, 7.5%, 3.1% and 2.8%, respectively.
The annual reduction in 2025 in the absolute number offractures from increasing treatment uptake was estimated at95,067 in EU5 and Sweden. In the individual countries thenumber ranged from 4,000 fractures in Spain up to 40,000 inGermany (Fig. 59). The accumulated number of potentiallyavoided fractures from 2010 through 2025 was estimated at698,743.
Table 68 Projected annual number of fractures up to 2025, with and without increasing treatment uptake
Table 69 Projected annual number of fractures up to 2025 with and without increasing treatment uptake by site of fracture
2010 2015 2020 2025
Sweden Current treatment uptake 106,976 113,566 121,920 132,406
Approaching "target treatment uptake" 106,976 112,264 119,064 127,772
Fractures avoided per year - 1,302 2,856 4,634
UK Current treatment uptake 534,583 573,633 616,866 662,121
Approaching "target treatment uptake" 534,583 569,423 607,602 647,263
Fractures avoided per year - 4,211 9,264 14,857
France Current treatment uptake 379,493 428,075 470,393 506,995
Approaching "target treatment uptake" 379,493 425,246 463,741 496,238
Fractures avoided per year - 2,829 6,652 10,757
Germany Current treatment uptake 734,208 804,955 880,371 936,055
Approaching "target treatment uptake" 734,208 793,777 855,125 895,588
Fractures avoided per year - 11,178 25,246 40,468
Italy Current treatment uptake 502,333 553,543 602,908 644,798
Approaching "target treatment uptake" 502,333 548,124 590,553 624,703
Fractures avoided per year - 5,419 12,355 20,095
Spain Current treatment uptake 202,779 232,360 261,628 290,140
Approaching "target treatment uptake" 202,779 231,431 259,264 285,885
Fractures avoided per year - 929 2,364 4,255
Hip Spine Forearm Other
2010 2025 2010 2025 2010 2025 2010 2025
Sweden Approaching "target treatment uptake" 20,292 24,273 16,439 19,181 16,389 18,815 53,856 65,239
Current treatment uptake 20,292 25,759 16,439 20,491 16,389 19,353 53,856 66,804
Fractures avoided per year - 1,486 - 1,310 - 538 - 1,565
UK Approaching "target treatment uptake" 79,492 95,689 65,783 78,493 66,710 79,129 322,598 393,952
Current treatment uptake 79,492 99,382 65,783 81,682 66,710 80,708 322,598 400,348
Fractures avoided per year - 3,693 - 3,189 - 1,579 - 6,396
France Approaching "target treatment uptake" 74,359 98,858 56,202 72,561 56,627 69,484 192,305 255,334
Current treatment uptake 74,359 102,320 56,202 75,110 56,627 70,580 192,305 258,986
Fractures avoided per year - 3,462 - 2,548 - 1,095 - 3,652
Germany Approaching "target treatment uptake" 132,715 164,023 115,394 132,520 119,713 138,625 366,386 460,421
Current treatment uptake 132,715 176,119 115,394 143,233 119,713 143,055 366,386 473,648
Fractures avoided per year - 12,096 - 10,714 - 4,431 - 13,227
Italy Approaching "target treatment uptake" 96,577 120,873 77,567 92,489 77,378 91,820 250,812 319,521
Current treatment uptake 96,577 126,804 77,567 97,704 77,378 94,192 250,812 326,098
Fractures avoided per year - 5,931 - 5,215 - 2,372 - 6,577
Spain Approaching "target treatment uptake" 40,235 57,790 29,361 41,240 29,451 39,265 103,731 147,590
Current treatment uptake 40,235 59,215 29,361 42,182 29,451 39,652 103,731 149,091
Fractures avoided per year - 1,425 - 942 - 387 - 1,501
Arch Osteoporos

Fig. 67 Number of fractures potentially avoided annually in the EU5
and Sweden from an increased treatment uptake up to 2025
6.5.2 BMD measurements
Increasing the treatment uptake to the levels in Table65 and Table 66 would together with changing demogra-phy be associated with an increased need for treatmentmonitoring and diagnostics with BMD measurement. Therequirement for assessing and monitoring the treatment ofosteoporosis has been estimated at 10.6 DXA units permillion of the general population [33, 34]. The DXA unitrequirement should however vary with the treatmentpenetration in each country. For example, 10.6 units permillion capita would with Germany’s current treatmentprovision correspond to 406 measurements per unit peryear if the assumption of 0.5 BMD measurements/year oftreatment is considered. The corresponding number inSpain would be 1,275 measurements per DXA unit peryear. It was estimated that the suggested increase intreatment uptake and changes in demography would beassociated with a 2.4-fold increase in the necessarynumber BMD scans in the EU5 (Table 70).
Table 70 BMD scans needed for assessing and monitoring osteopo-
rosis per year per 1,000,000 population
However, should case finding increasingly be based onabsolute fracture probability, as estimated by FRAX, it may
be possible to reduce the need for BMD measurement insome patients. Adopting a case finding with FRAX wouldlikely reduce the need for DXA units since at least 1%-4%of men and 19%-21% of women older than 50 years will beat sufficiently high risk to warrant treatment withoutinformation of BMD (Tables 24 and 25 in Chapter 3).
6.5.3 QALYs
The number of lost QALYs follows a similar pattern asfor the number of fractures. The total number of QALYslost will continue to increase even if the “target uptake” isreached. With the current treatment penetration the totalnumber of QALYs lost was projected to increase from 0.85million in 2010 to 1.0 million in 2025, corresponding to anincrease of 20%. Increasing the treatment uptake wouldresults in 33,455 QALYs gained in 2025. 20% of theincrease in QALYs lost between 2010 and 2025 would beavoided if the treatment uptake target is reached.
The average QALYs lost (Table 71) per fracture (Table 68)was estimated at 0.24 in the EU5+. This should be comparedto 0.35 QALYs gained per avoided fracture if the treatmentuptake were to increase. This discrepancy arises because:
– The risk reduction from treatment is larger for the moresevere hip and vertebral fractures (compared to wristfractures and “other” fractures).
– The proportion of elderly, in whom the risk of hipfracture is very high, is projected to increase.
– There will be a “lag” in the benefit of reduced prevalenceof hip and vertebral fractures, both of which areassociated with long term quality of life loss [1]. Areduced fracture incidence will theoretically not fullytranslate into a reduced prevalence until all patients with aprevalent fracture (at the time of risk reduction) have died.
Table 71 Projected QALYs lost due to fractures up to 2025, with and
without increasing treatment penetration
0
5,000
10,000
15,000
20,000
25,000
30,000
35,000
40,000
45,000
Sweden S France UK Italy Germany
An
nu
al n
um
ber
of
avo
ided
fra
ctu
res
2015 2020 2025
BMD scans currentlyneeded /year /1,000,000
BMD scans needed2025/year /1,000,000
Relativeincrease
Spain 13,516 19,321 1.4
Sweden 4,992 14,939 3.0
Germany 4,303 19,047 4.4
Italy 7,690 21,005 2.7
UK 7,229 15,744 2.2
France 10,361 20,274 2.0
EU5 8,085 19,054 2.4
2010 2015 2020 2025
Sweden Current treatmentpenetration
38,655 39,995 42,187 45,156
Approaching"ideal treatmentpenetration"
38,655 39,628 41,235 43,410
QALYs gainedper year
- 367 952 1,746
UK Current treatmentpenetration
163,156 169,422 178,460 189,325
Approaching"ideal treatmentpenetration"
163,156 168,420 175,867 184,606
QALYs gainedper year
- 1,002 2,592 4,719
France Current treatmentpenetration
135,222 143,612 153,941 165,785
Arch Osteoporos
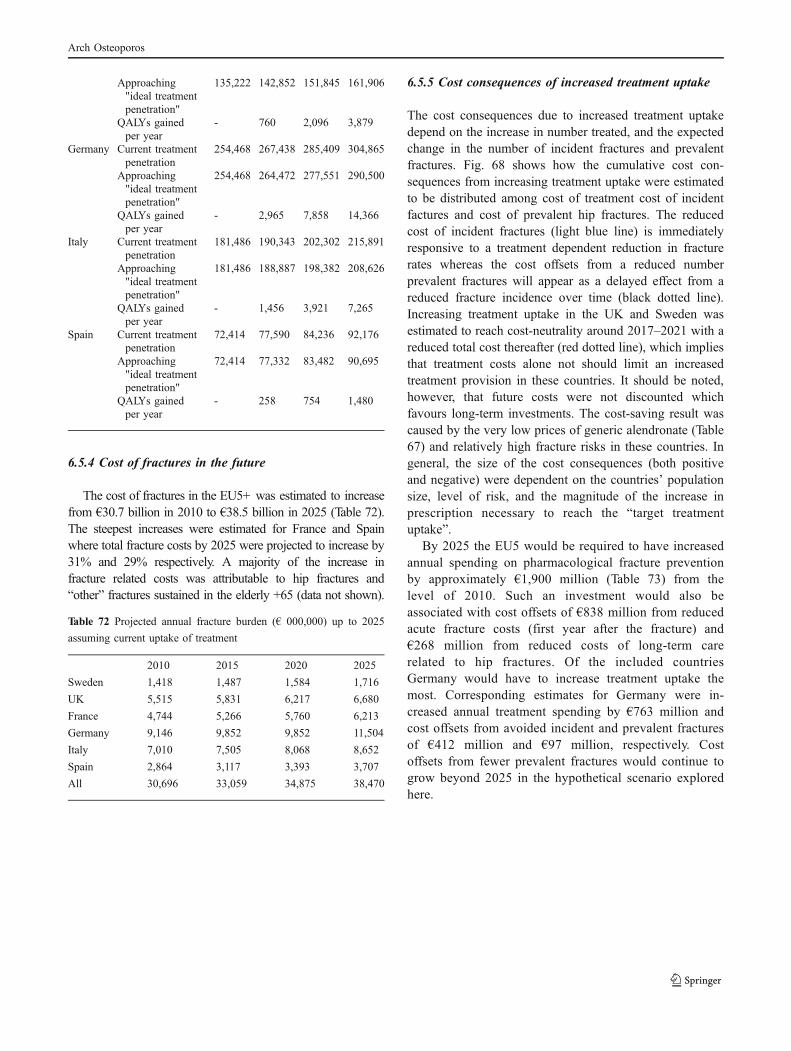
6.5.4 Cost of fractures in the future
The cost of fractures in the EU5+ was estimated to increasefrom €30.7 billion in 2010 to €38.5 billion in 2025 (Table 72).The steepest increases were estimated for France and Spainwhere total fracture costs by 2025 were projected to increase by31% and 29% respectively. A majority of the increase infracture related costs was attributable to hip fractures and“other” fractures sustained in the elderly +65 (data not shown).
Table 72 Projected annual fracture burden (€ 000,000) up to 2025
assuming current uptake of treatment
6.5.5 Cost consequences of increased treatment uptake
The cost consequences due to increased treatment uptakedepend on the increase in number treated, and the expectedchange in the number of incident fractures and prevalentfractures. Fig. 68 shows how the cumulative cost con-sequences from increasing treatment uptake were estimatedto be distributed among cost of treatment cost of incidentfactures and cost of prevalent hip fractures. The reducedcost of incident fractures (light blue line) is immediatelyresponsive to a treatment dependent reduction in fracturerates whereas the cost offsets from a reduced numberprevalent fractures will appear as a delayed effect from areduced fracture incidence over time (black dotted line).Increasing treatment uptake in the UK and Sweden wasestimated to reach cost-neutrality around 2017–2021 with areduced total cost thereafter (red dotted line), which impliesthat treatment costs alone not should limit an increasedtreatment provision in these countries. It should be noted,however, that future costs were not discounted whichfavours long-term investments. The cost-saving result wascaused by the very low prices of generic alendronate (Table67) and relatively high fracture risks in these countries. Ingeneral, the size of the cost consequences (both positiveand negative) were dependent on the countries’ populationsize, level of risk, and the magnitude of the increase inprescription necessary to reach the “target treatmentuptake”.
By 2025 the EU5 would be required to have increasedannual spending on pharmacological fracture preventionby approximately €1,900 million (Table 73) from thelevel of 2010. Such an investment would also beassociated with cost offsets of €838 million from reducedacute fracture costs (first year after the fracture) and€268 million from reduced costs of long-term carerelated to hip fractures. Of the included countriesGermany would have to increase treatment uptake themost. Corresponding estimates for Germany were in-creased annual treatment spending by €763 million andcost offsets from avoided incident and prevalent fracturesof €412 million and €97 million, respectively. Costoffsets from fewer prevalent fractures would continue togrow beyond 2025 in the hypothetical scenario exploredhere.
Approaching"ideal treatmentpenetration"
135,222 142,852 151,845 161,906
QALYs gainedper year
- 760 2,096 3,879
Germany Current treatmentpenetration
254,468 267,438 285,409 304,865
Approaching"ideal treatmentpenetration"
254,468 264,472 277,551 290,500
QALYs gainedper year
- 2,965 7,858 14,366
Italy Current treatmentpenetration
181,486 190,343 202,302 215,891
Approaching"ideal treatmentpenetration"
181,486 188,887 198,382 208,626
QALYs gainedper year
- 1,456 3,921 7,265
Spain Current treatmentpenetration
72,414 77,590 84,236 92,176
Approaching"ideal treatmentpenetration"
72,414 77,332 83,482 90,695
QALYs gainedper year
- 258 754 1,480
2010 2015 2020 2025
Sweden 1,418 1,487 1,584 1,716
UK 5,515 5,831 6,217 6,680
France 4,744 5,266 5,760 6,213
Germany 9,146 9,852 9,852 11,504
Italy 7,010 7,505 8,068 8,652
Spain 2,864 3,117 3,393 3,707
All 30,696 33,059 34,875 38,470
Arch Osteoporos

Fig. 68 Annual difference in projected costs with target treatment uptake compared to current treatment uptake in EU5 and Sweden, by cost
type
Sweden
50,000,000
30,000,000
10,000,000
10,000,000
30,000,000
50,000,000
UK
120,000,000
80,000,000
40,000,000
0
40,000,000
80,000,000
120,000,000
France
100,000,000
50,000,000
0
50,000,000
100,000,000
150,000,000
200,000,000
250,000,000
300,000,000Germany
400,000,000
200,000,000
0
200,000,000
400,000,000
600,000,000
800,000,000
Italy
300,000,000
200,000,000
100,000,000
0
100,000,000
200,000,000
300,000,000
400,000,000
500,000,000
600,000,000Spain
80,000,000
40,000,000
0
40,000,000
80,000,000
120,000,000
160,000,000
2010 2012 2014 2016 2018 2020 2022 2024 2010 2012 2014 2016 2018 2020 2022 2024
2010 2012 2014 2016 2018 2020 2022 2024 2010 2012 2014 2016 2018 2020 2022 2024
2010 2012 2014 2016 2018 2020 2022 2024 2010 2012 2014 2016 2018 2020 2022 2024
Treatment cost Prevalent fracture costs Incident fracture cost Total cost
Co
st d
iffe
ren
ce (
)
Co
st d
iffe
ren
ce (
)
Co
st d
iffe
ren
ce (
)
Co
st d
iffe
ren
ce (
)
Co
st d
iffe
ren
ce (
)
Co
st d
iffe
ren
ce (
)
Arch Osteoporos

Table 73 Total accumulated cost consequences (EUR million) of
reaching target treatment uptake by 2025
6.5.6 Cost-effectiveness on a macro level
Because of large differences between current treatmentuptake as well as fracture risks, fracture prevalence anddrug costs in different countries, the absolute results varywidely. Because Spain, for instance, already has both arelatively high prescription rate and a relatively low fracturerisk, there is a ceteris paribus smaller gain per capita fromclosing the treatment gap. From the estimated burdenestimations it is possible to calculate an incremental cost-effectiveness ratio on a macro level of increasing thetreatment uptake towards the suggested target level (Table74). The necessary investment in terms of treatment costsand associated cost offsets from avoided fractures up to2025 were discounted to present value. The same was donewith any future QALYs gained that arise due to increasedtreatment uptake.
Due to the low price of generic alendronate, and to asmaller extent to factors like fracture risk, fracture costs,and demography, increasing uptake over the 15-yearperiod was estimated to be cost-saving in the UK. Macrocost-effectiveness of increasing treatment uptake in theother analysed countries ranged from €1,494/QALY inSweden to 103,178 in Spain. Cost-effectiveness analysesof fracture prevention [19, 23, 25, 26] usually evaluatetreatment in a carefully defined target population with aspecific T-score, fracture prevalence, and age at start oftreatment. The present analysis assumed a 80/20 mix ofgeneric alendronate and branded treatment and thatosteoporosis on average is associated a 2-fold risk offracture compared with that of the general population.Notwithstanding the crude methods, the present analysisreaches results comparable to recent analyses [25, 28, 35]of the cost-effectiveness of fracture prevention in Europe-an perspective.
Table 74 Macro level cost/QALY gained of reaching the target uptake
by 2025 compared with keeping treatment provision on the current
level
aAn annual discount rate of 3% was used for all countries.
The treatment uptake future projections and macro cost-effectiveness analyses are somewhat crude but do stillprovide an indication of how to improve osteoporosismanagement in the countries analysed in this report. Thepoor treatment provision (Chapter 5), low drug costs, andhigher fracture risks in Sweden, Germany, France and theUK suggest that treatment uptake could be increased cost-effectively, or even with cost-savings, in these jurisdictions.
Our results indicate that treatment uptake in Spain onlymay be increased marginally, and that the cost-effectivenessof doing so was estimated to be poor. The ProspectiveObservational Study Investigating Bone Loss Experience inEurope (POSSIBLE EU) is a longitudinal, non-interven-tional cohort study with the objective to examine the use ofosteoporosis medications in EU5 [36]. The study (seeChapter 2) found that only 55% of Spanish patients had lowBMD (<−2.5 SD), a prior fracture and/or glucocorticoidtherapy, which implies that guideline adherence is notsatisfactory. Furthermore, Spain has the lowest fracture riskof the analysed countries (Table 26) and taking stepstowards price reductions of generic alendronate (Chapter5) would thus be preferable to allow more patients to becost-effectively treated.
References
1. Ström O, Borgstrom F, Zethraeus N et al (2008) Long-term cost and effect on quality of life of osteoporosis-related fractures in Sweden. Acta Orthop 79: 269–80
2. Borgström F, Zethraeus N, Johnell O et al (2006) Costsand quality of life associated with osteoporosis-relatedfractures in Sweden. Osteoporos Int 17: 637–50
3. Kanis JA, Oden A, Johnell O, De Laet C, Jonsson B,Oglesby AK (2003) The components of excess mortal-ity after hip fracture. Bone 32: 468–73
Cost offsets due to Increasedtreatment costincident fractures prevalent fractures
Germany -412 -97 763
Italy -167 -83 558
France -105 -32 255
UK -121 -34 130
Spain -34 -22 175
Sweden -45 -18 57
EU5 -838 -268 1,882
EU5+ -882 -286 1,939
Discounteda
accumulateddifference (M€)
Discounteda
accumulatedQALYs gained
Cost/QALYgained (€)
Sweden 12 8,362 1,494
UK -46 22,715 Cost-saving
France 799 18,188 43,933
Germany 1,792 68,613 26,121
Italy 1,888 34,268 55,095
Spain 683 6,621 103,178
Arch Osteoporos
4. Kanis JA, Oden A, Johnell O, De Laet C, Jonsson B(2004) Excess mortality after hospitalisation for verte-bral fracture. Osteoporos Int 15: 108–12
5. Ahlborg HG, Rosengren BE, Järvinen TL et al (2010)Prevalence of osteoporosis and incidence of hip fracturein women–secular trends over 30 years. BMC Muscu-loskelet Disord 11: 48
6. Cooper C, Cole ZA, Holroyd CR et al (2011) Seculartrends in the incidence of hip and other osteoporoticfractures. Osteoporos Int. doi:10.1007/s00198-011-1601-6
7. Palvanen M, Kannus P, Niemi S et al (2010) Seculartrends in distal humeral fractures of elderly women:nationwide statistics in Finland between 1970 and2007. Bone 46: 1355–8
8. Leslie WD, Sadatsafavi M, Lix LM et al (2010) Seculardecreases in fracture rates 1986–2006 for Manitoba,Canada: a population-based analysis. Osteoporos Int.doi:10.1007/s00198-010-1470-4
9. Balasegaram S, Majeed A, Fitz-Clarence H (2001)Trends in hospital admissions for fractures of the hipand femur in England, 1989–1990 to 1997–1998. JPublic Health Med 23: 11–7
10. Icks A, Haastert B, Wildner M, Becker C, Meyer G(2008) Trend of hip fracture incidence in Germany1995–2004: a population-based study. Osteoporos Int19: 1139–45
11. Hernández JL, Olmos JM, Alonso MA et al (2006)Trend in hip fracture epidemiology over a 14-yearperiod in a Spanish population. Osteoporos Int 17:464–70
12. National Institution for Health and Clinical Excellence(2008) Osteoporosis: Assessment of fracture risk andthe prevention of osteoporotic fractures in individuals athigh risk. http://www.nice.org.uk/guidance/index.jsp?action=byID&o=11621 Accessed 24 May 2011
13. United Nations (2008) World Population Prospects. http://www.un.org/esa/population/ Accessed 24 May 2011
14. Kanis JA on behalf of the World Health Organization(2007) Assessment of osteoporosis at the primaryhealth care level. Technical Report. WHO Collaborat-ing Centre for Metabolic Bone Diseases, University ofSheffield, UK.
15. Looker AC, Wahner HW, Dunn WL et al (1988)Updated data on proximal femur bone mineral levelsof US adults. Osteoporos Int 8: 468–89
16. Kanis JA, Oden A, Johansson H et al (2009) FRAX andits applications to clinical practice. Bone 44: 34–43
17. Kanis JA, Burlet N, Cooper C et al (2008) Europeanguidance for the diagnosis and management of osteo-
porosis in postmenopausal women. Osteoporos Int 19:399–428
18. Kanis JA, Johnell O, Oden A et al (2008) FRAX™ andthe assessment of fracture probability in men andwomen from the UK. Osteoporos Int 19: 385–97
19. Kanis JA, McCloskey EV, Johansson H et al (2008)Case finding for the management of osteoporosis withFRAX – assessment and intervention thresholds for theUK. Osteoporos Int 19: 1395–408 (Erratum published2009 Osteoporos Int 20: 499–502)
20. Watts NB, Diab DL (2010) Long-term use ofbisphosphonates in osteoporosis. J Clin EndocrinolMetab 95: 1555–65
21. Devold HM, Doung GM, Tverdal A et al (2010)Prescription of anti-osteoporosis drugs during 2004–2007 – a nationwide register study in Norway. Eur JClin Pharmacol 66: 299–306
22. Ström O, Borgström F, Kanis JA, Jönsson B (2009)Incorporating adherence into health economic model-ling of osteoporosis. Osteoporos Int 20: 23–34
23. Jönsson B, Ström O, Eisman JA et al (2010) Cost-effectiveness of Denosumab for the treatment ofpostmenopausal osteoporosis. Osteoporos Int 22:967–82
24. Black DM, Schwartz AV, Ensrud KE et al (2006) Effects ofcontinuing or stopping alendronate after 5 years oftreatment: the Fracture Intervention Trial Long-term Exten-sion (FLEX): a randomized trial. JAMA 296: 2927–38
25. Ström O, Borgström F, Sen SS et al (2007) Cost-effectiveness of alendronate in the treatment ofpostmenopausal women in 9 European countries – aneconomic evaluation based on the fracture interventiontrial. Osteoporos Int 18: 1047–61
26. Borgström F, Jönsson B, Ström O, Kanis JA (2006) Aneconomic evaluation of strontium ranelate in thetreatment of osteoporosis in a Swedish setting: Basedon the results of the SOTI and TROPOS trials.Osteoporos Int 17: 1781–93
27. Ström O, Borgström F, Kleman M et al (2010) FRAX andits applications in health economics – cost-effectivenessand intervention thresholds using bazedoxifene in aSwedish setting as an example. Bone 47: 430–7
28. Borgström F, Ström O, Kleman M et al (2010) Cost-effectiveness of bazedoxifene incorporating the FRAX(R) algorithm in a European perspective. Osteoporos Int22: 955–65
29. International Osteoporosis Foundation (2005) Cost-effectiveness reference model. http://www.iofbonehealth.org/health-professionals/health-economics/cost-effectiveness-model.html Accessed 24 May 2011
Arch Osteoporos

30. Saraux A, Brun-Strang C, Mimaud V, Vigneron AM,Lafuma A (2007) Epidemiology, impact, management,and cost of Paget's disease of bone in France. JointBone Spine 74: 90–5
31. Lordick F, Ehlken B, Ihbe-Heffinger A et al (2007) Healthoutcomes and cost-effectiveness of aprepitant in outpatientsreceiving antiemetic prophylaxis for highly emetogenicchemotherapy in Germany. Eur J Cancer 43: 299–307
32. Capri S, Perlini S (2005) Cost-effectiveness in Italy ofpreventive treatment with ramipril in patients at high riskof cardiovascular events. Curr Med Res Opin 21: 913–21
33. Kanis JA, Johnell O (2005) Requirements for DXA forthe management of osteoporosis in Europe. OsteoporosInt 16: 229–38
34. Compston J (2004) Action Plan for the prevention ofosteoporotic fractures in the European Community.Osteoporos Int 15: 259–62
35. Borgström F, Carlsson A, Sintonen H et al (2006) Thecost-effectiveness of risedronate in the treatment ofosteoporosis: an international perspective. OsteoporosInt 17: 996–1007
36. Roux C, Cooper C, Díez-Pérez A et al (2010) Prevalenceof osteoporosis and fractures among women prescribedosteoporosis medication in five European countries: thePOSSIBLE EU((R)) study. Osteoporos Int 22: 1227–36
AcknowledgementsThis report has been sponsored by an unrestricted
educational grant from the European Federation of Phar-maceutical Industry Associations (EFPIA) and the Interna-tional Osteoporosis Foundation (IOF). We thank Dr SkipOlson and Judy Stenmark who provided the liaisonbetween the two organizations, respectively. We acknowl-edge the help of Helena Johansson and Prof Anders Odenfor their help in the calculations of fracture probability. Wethank Drs Denys Wahl and Fina Liu of the IOF for theirhelp in editing the report. The report has been reviewed bythe IOF representatives of the ‘Invest in Your BonesCampaign’ of the IOF (Profs Eugene McCloskey, ThierryThomas, Jorge Cannata Andia, Karsten Dreinhöfer and
Silvano Adami), and we are grateful for their local insightson the management of osteoporosis in each country. Thereport has been reviewed and endorsed by the Committeeof Scientific Advisors of the IOF and benefitted from theirfeedback.
Competing interestsOskar Ström and Fredrik Borgström have received
funding from several pharmaceutical companies in-volved in marketing products for treatment of osteopo-rosis. JA Kanis: Speaker fees, advisory board and/orunrestricted research grants Abiogen, Italy; Amgen,USA, Switzerland and Belgium; Bayer, Germany;Besins-Iscovesco, France; Biosintetica, Brazil; Boeh-ringer Ingelheim, UK; Celtrix, USA; D3A, France;European Federation of Pharmaceutical Industry andAssociations, (EFPIA) Brussels; Gador, Argentina;General Electric, USA; GSK, UK, USA; Hologic,Belgium and USA; Kissei, Japan; Leo Pharma, Den-mark; Lilly, USA, Canada, Japan, Australia and UK;Merck Research Labs, USA; Merlin Ventures, UK;MRL, China; Novartis, Switzerland and USA; NovoNordisk, Denmark; Nycomed, Norway; Ono, UK andJapan; Organon, Holland; Parke-Davis, USA; PfizerUSA; Pharmexa, Denmark; Procter and Gamble, UK,USA; ProStrakan, UK; Roche, Germany, Australia,Switzerland, USA; Rotta Research, Italy; Sanofi-Aventis,USA; Servier, France and UK; Shire, UK; Solvay,France and Germany; Strathmann, Germany; TarsaTherapeutics, US; Tethys, USA; Teijin, Japan; Teva,Israel; UBS, Belgium; Unigene, USA; Warburg-Pincus,UK; Warner-Chilcott, USA; Wyeth, USA. J Compston:Speaker fees, advisory board and/or unrestricted re-search grants Osteotronix, Nycomed, Amgen, Novartis,Servier, GSK, Gilead, Procter & Gamble/Sanofi Aventis,Eli Lilly, Merck Sharp & Dohme, Medtronic, Warner-Chilcott. C Cooper: Lecture fees and consulting forAmgen, Eli Lilly, MSD, Servier, GSK, Roche, Novartisand ABBH. B Jonsson and E McCloskey declare nocompeting interests.
Arch Osteoporos