Embed Size (px)
Citation preview
PREPARED BY THE RESEARCH DEPARTMENT • AMERICAN ASSOCIATION OF COLLEGES OF OSTEOPATHIC MEDICINE
© 2014, AACOM. All rights reserved. Cover photo courtesy of UP-KYCOM.
Osteopathic Medical College Applicant and Matriculant Profile
F O R T H E C L A S S E N T E R I N G I N F A L L 2 0 1 3
AACOMAS Applicant/Matriculant Profile ― 2013 Entering Class
Following are summary tables of osteopathic medical school applicants and matriculants from the 2013 entering class.
AACOMAS received 137,542 individual school applications from 16,454 applicants for 5,857 COCA-approved seats in Fall 2013. These numbers include all applicants to
the 32 colleges of osteopathic medicine and branch campuses that participated in AACOMAS. There were 2.81 applicants for each COCA-approved seat in the first-year
class. The mean number of individual school applications per applicant was 8.36.
The Colleges of Osteopathic Medicine (COMs) matriculated a total of 6,184 applicants to the 2013 entering class1. Of these 6,184 matriculants, 6,135 (99 percent)
submitted an application through AACOMAS. A total of 49 matriculants did not submit an AACOMAS application. Of the 6,135 matriculants who submitted an application
through AACOMAS, 252 had applied in earlier years – one applied in 2008, three applied in 2010, six applied in 2011, and 242 applied in 2012.
The data points included in this report are as follows. Due to rounding, not all percents will total to 100 in the tables below.
● Gender – Full data are available for all but 201 applicants and 83 matriculants.
● Age – Data are classified into six age groups and calculated as of July 1, 2013. Also provided are the minimum, maximum, mean and median applicant ages.
Because AACOMAS does not require applicants to provide date of birth, the number of applicants with missing data is indicated in these tables.
● Military experience – The type of military discharge is a distinct question in the AACOMAS application.
● Race/Ethnicity – The race and ethnicity questions on the AACOMAS application ask applicants to mark all that apply. For this report, race/ethnicity is examined
using both: (1) single category response, where a single race/ethnicity is counted for each applicant, applicants listing more than one race are reported as “Multiple
Races,” and any applicant who marks Hispanic/Latino is counted as being of Hispanic/Latino ethnicity, effectively superseding any other race selection(s) s/he may
have made; and (2) multiple category response, where each applicant is counted for every race/ethnicity the applicant reported, which may result in the applicant being
counted multiple times. For the tables and figures in this report, the Multiple Races and Unknown categories do not describe option choices in the AACOMAS
application, but are instead respondent behavior (e.g., multiple or missing responses). United States citizens and permanent residents are included in race and ethnicity
totals, while temporary residents and non-U.S. citizens are counted in the Foreign category. This follows U.S. Census and IPEDS collection and reporting methodology.
● Baccalaureate major – All reported majors leading to a baccalaureate degree were organized into five groups: Life Sciences, Social Sciences (including Psychology
and Education), Physical Sciences (including Mathematics and Engineering), Arts & Humanities and Other. The number of majors may be greater than the number of
applicants/matriculants, as students can complete more than one baccalaureate degree or may complete multiple majors.
● GPA – AACOMAS may calculate up to three sets of GPAs for each applicant: undergraduate only, undergraduate and post-baccalaureate, and all coursework.
AACOM has provided means and standard deviations for both the science and non-science GPAs, as well as the overall GPA. Data are provided only for cells in which
there are at least five applicants/matriculants. The means in the total column are calculated as means of total, not total of means.
● MCAT scores – AACOMAS received MCAT data from 14,035 applicants and 5,799 matriculants in 2013. For cases in which more than one set of scores for a
particular applicant was received, AACOM included the set with the highest total score. The writing scores for matriculants who took the MCAT on or after January 2013
are not available since the writing sample section was replaced by a trial section2. The mean, standard deviation and median for each section of the MCAT, as well as
the total MCAT score, are all included in this report. AACOM reports data for which there are at least five applicants in an individual cell. The means in the total column
are calculated as means of total, not total of means.
● Parents' college education – This is not a required question on the application.
● Family member is a DO or MD – Full data are available for all applicants/matriculants.
● Feeder colleges – The top 20 undergraduate feeder colleges providing the largest number of applicants.
5550 Friendship Blvd., Suite 310, Chevy Chase, MD 20815-7231; 301-968-4100
Copyright 2014. American Association of Colleges of Osteopathic Medicine. All rights reserved. 1 of 19

Note: Semester Hours table revised on 1/29/15.
2: https://www.aamc.org/students/applying/mcat/faq/313936/differentexam.html
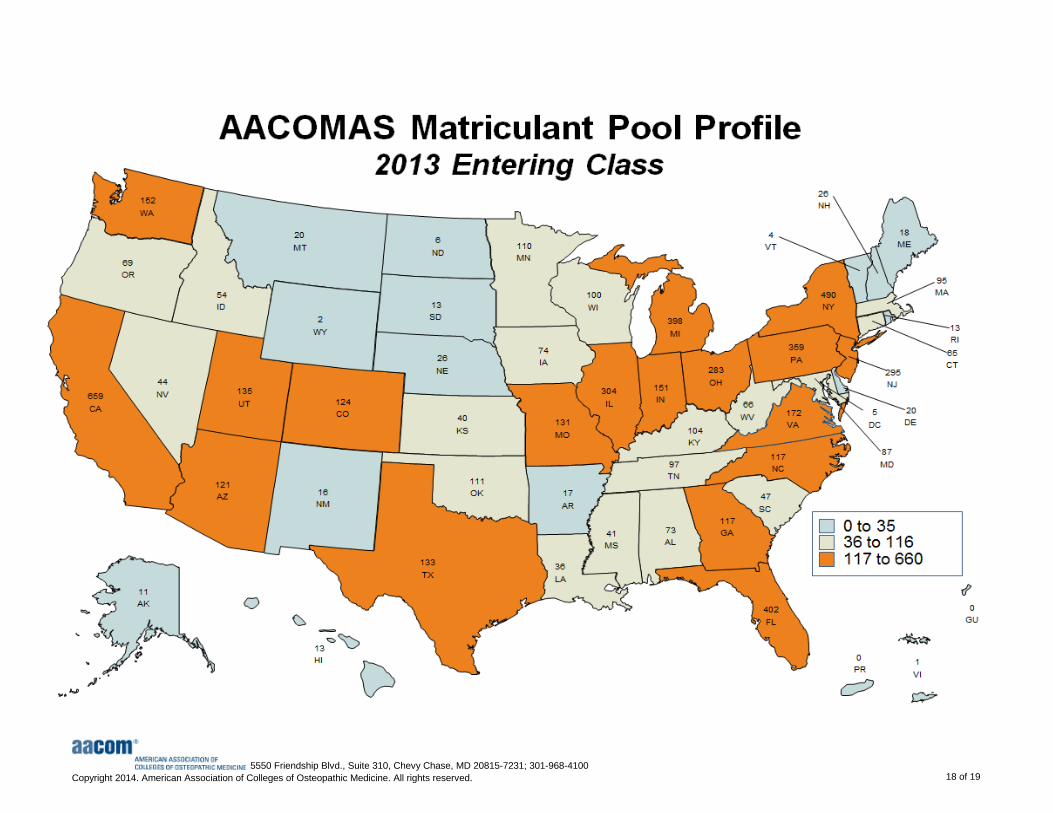
● State and country of permanent residence – In 2013, AACOMAS received 203 applications from non-U.S. permanent residents, 175 of whom were Canadian
residents. A total of 68 non-U.S. permanent residents matriculated to a college of osteopathic medicine, 58 of whom were Canadian residents. A map displaying all U.S.
applicants and matriculants is also included in this report.
● Research question – At the end of the application, applicants have been given the opportunity to answer several optional research questions. These questions were
answered before the end of medical school application cycles.
1: The University of North Texas Health Sciences Center at Fort Worth/Texas College of Osteopathic Medicine and NYIT-COM's émigré program applicants are not included in this analysis because the data are not
part of the AACOMAS database. UNTHSC/TCOM receives its applications through the Texas Medical and Dental School Application Service.
AACOMAS Applicant/Matriculant Profile ― 2013 Entering Class
5550 Friendship Blvd., Suite 310, Chevy Chase, MD 20815-7231; 301-968-4100
Copyright 2014. American Association of Colleges of Osteopathic Medicine. All rights reserved. 2 of 19
AACOMAS Applicant Pool Profile AACOMAS Matriculant Pool Profile2013 Entering Class: 16,454 2013 Entering Class: 6,135
1. Applicant and Matriculant Characteristics
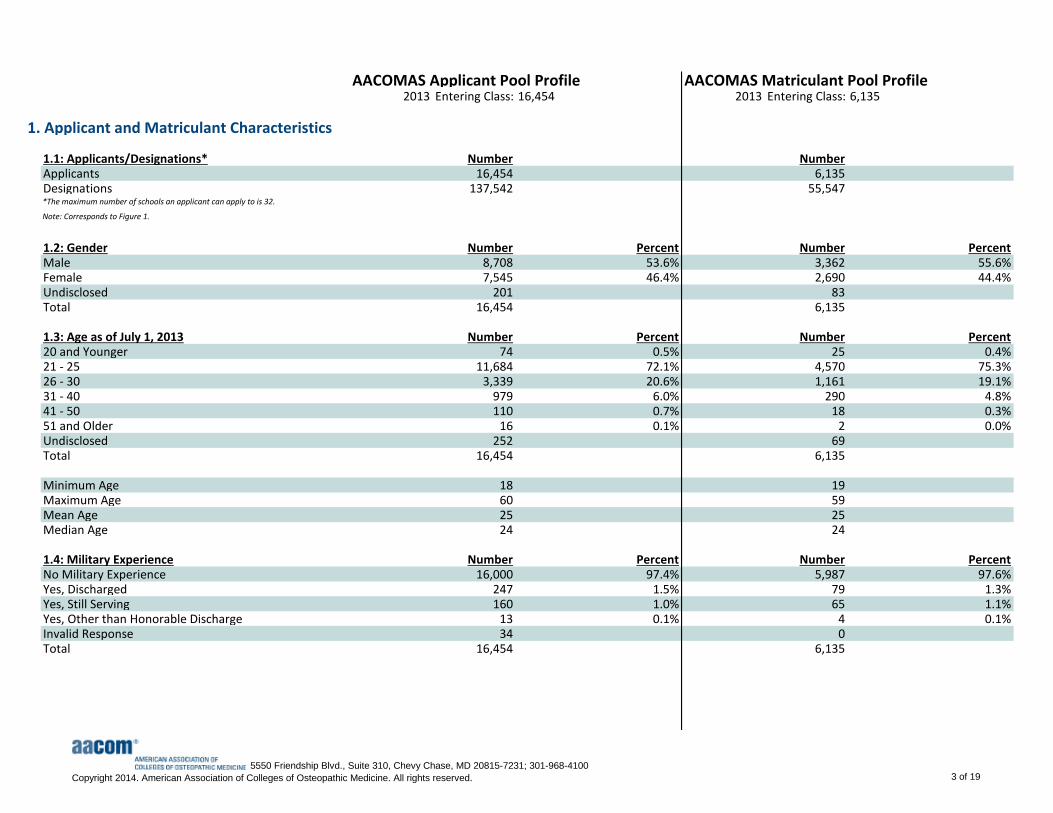
1.1: Applicants/Designations* Number NumberApplicants 16,454 6,135Designations 137,542 55,547*The maximum number of schools an applicant can apply to is 32.
Note: Corresponds to Figure 1.
1.2: Gender Number Percent Number PercentMale 8,708 53.6% 3,362 55.6%Female 7,545 46.4% 2,690 44.4%Undisclosed 201 83Total 16,454 6,135
1.3: Age as of July 1, 2013 Number Percent Number Percent20 and Younger 74 0.5% 25 0.4%21 - 25 11,684 72.1% 4,570 75.3%26 - 30 3,339 20.6% 1,161 19.1%31 - 40 979 6.0% 290 4.8%41 - 50 110 0.7% 18 0.3%51 and Older 16 0.1% 2 0.0%Undisclosed 252 69Total 16,454 6,135
Minimum Age 18 19Maximum Age 60 59Mean Age 25 25Median Age 24 24
1.4: Military Experience Number Percent Number PercentNo Military Experience 16,000 97.4% 5,987 97.6%Yes, Discharged 247 1.5% 79 1.3%Yes, Still Serving 160 1.0% 65 1.1%Yes, Other than Honorable Discharge 13 0.1% 4 0.1%Invalid Response 34 0Total 16,454 6,135
5550 Friendship Blvd., Suite 310, Chevy Chase, MD 20815-7231; 301-968-4100
Copyright 2014. American Association of Colleges of Osteopathic Medicine. All rights reserved. 3 of 19
AACOMAS Applicant Pool Profile AACOMAS Matriculant Pool Profile2013 Entering Class: 16,454 2013 Entering Class: 6,135
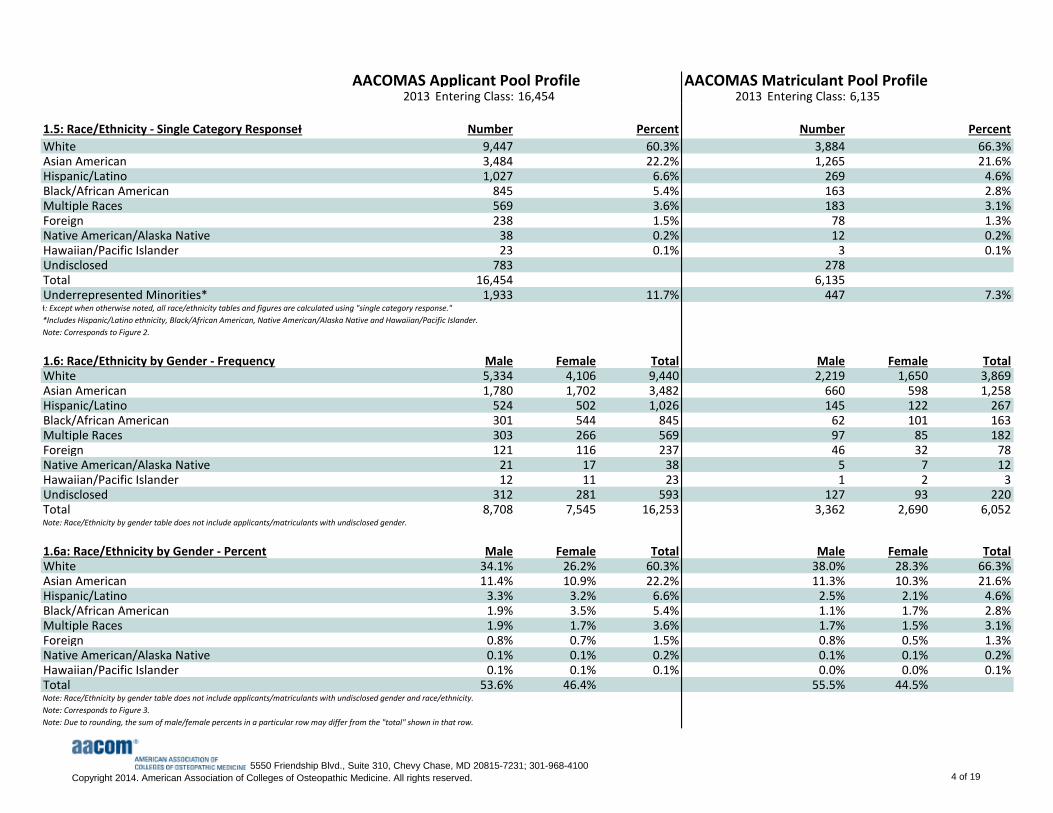
1.5: Race/Ethnicity - Single Category ResponseƗ Number Percent Number Percent
White 9,447 60.3% 3,884 66.3%Asian American 3,484 22.2% 1,265 21.6%Hispanic/Latino 1,027 6.6% 269 4.6%Black/African American 845 5.4% 163 2.8%Multiple Races 569 3.6% 183 3.1%Foreign 238 1.5% 78 1.3%Native American/Alaska Native 38 0.2% 12 0.2%Hawaiian/Pacific Islander 23 0.1% 3 0.1%Undisclosed 783 278Total 16,454 6,135Underrepresented Minorities* 1,933 11.7% 447 7.3%Ɨ: Except when otherwise noted, all race/ethnicity tables and figures are calculated using "single category response."
Note: Corresponds to Figure 2.
1.6: Race/Ethnicity by Gender - Frequency Male Female Total Male Female TotalWhite 5,334 4,106 9,440 2,219 1,650 3,869Asian American 1,780 1,702 3,482 660 598 1,258Hispanic/Latino 524 502 1,026 145 122 267Black/African American 301 544 845 62 101 163Multiple Races 303 266 569 97 85 182Foreign 121 116 237 46 32 78Native American/Alaska Native 21 17 38 5 7 12Hawaiian/Pacific Islander 12 11 23 1 2 3Undisclosed 312 281 593 127 93 220Total 8,708 7,545 16,253 3,362 2,690 6,052Note: Race/Ethnicity by gender table does not include applicants/matriculants with undisclosed gender.
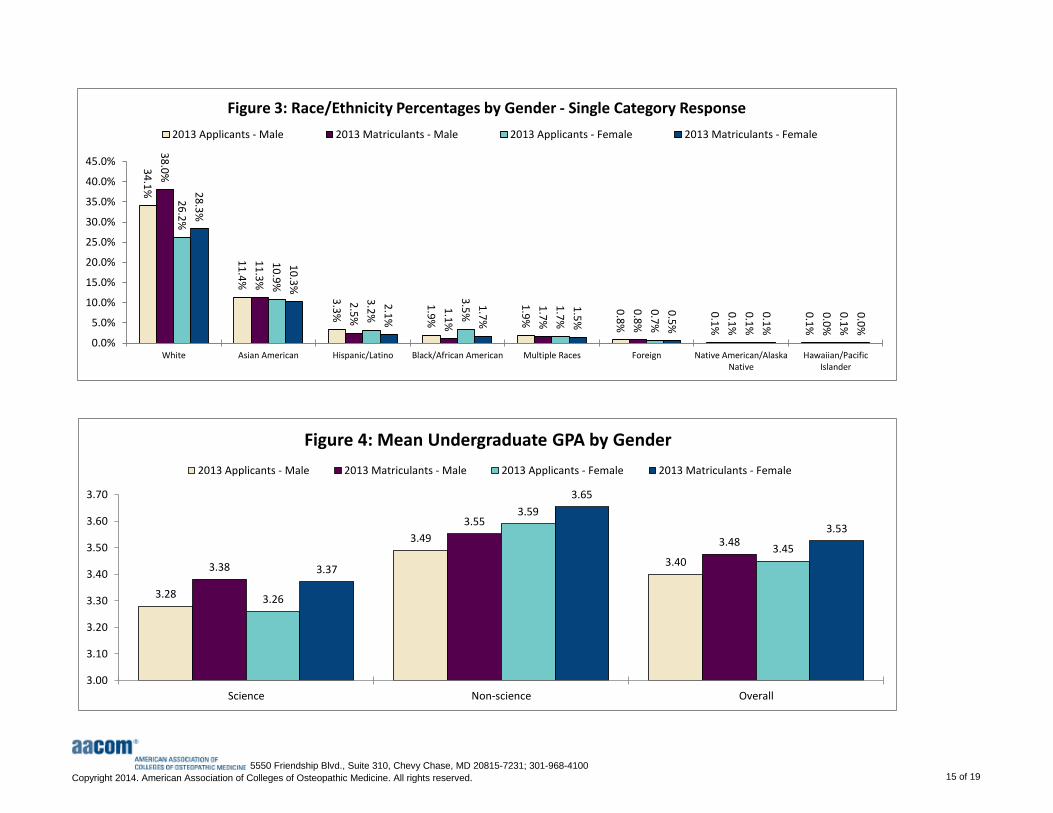
1.6a: Race/Ethnicity by Gender - Percent Male Female Total Male Female TotalWhite 34.1% 26.2% 60.3% 38.0% 28.3% 66.3%Asian American 11.4% 10.9% 22.2% 11.3% 10.3% 21.6%Hispanic/Latino 3.3% 3.2% 6.6% 2.5% 2.1% 4.6%Black/African American 1.9% 3.5% 5.4% 1.1% 1.7% 2.8%Multiple Races 1.9% 1.7% 3.6% 1.7% 1.5% 3.1%Foreign 0.8% 0.7% 1.5% 0.8% 0.5% 1.3%Native American/Alaska Native 0.1% 0.1% 0.2% 0.1% 0.1% 0.2%Hawaiian/Pacific Islander 0.1% 0.1% 0.1% 0.0% 0.0% 0.1%Total 53.6% 46.4% 55.5% 44.5%Note: Race/Ethnicity by gender table does not include applicants/matriculants with undisclosed gender and race/ethnicity.
Note: Corresponds to Figure 3.
Note: Due to rounding, the sum of male/female percents in a particular row may differ from the "total" shown in that row.
*Includes Hispanic/Latino ethnicity, Black/African American, Native American/Alaska Native and Hawaiian/Pacific Islander.
5550 Friendship Blvd., Suite 310, Chevy Chase, MD 20815-7231; 301-968-4100
Copyright 2014. American Association of Colleges of Osteopathic Medicine. All rights reserved. 4 of 19
AACOMAS Applicant Pool Profile AACOMAS Matriculant Pool Profile2013 Entering Class: 16,454 2013 Entering Class: 6,135
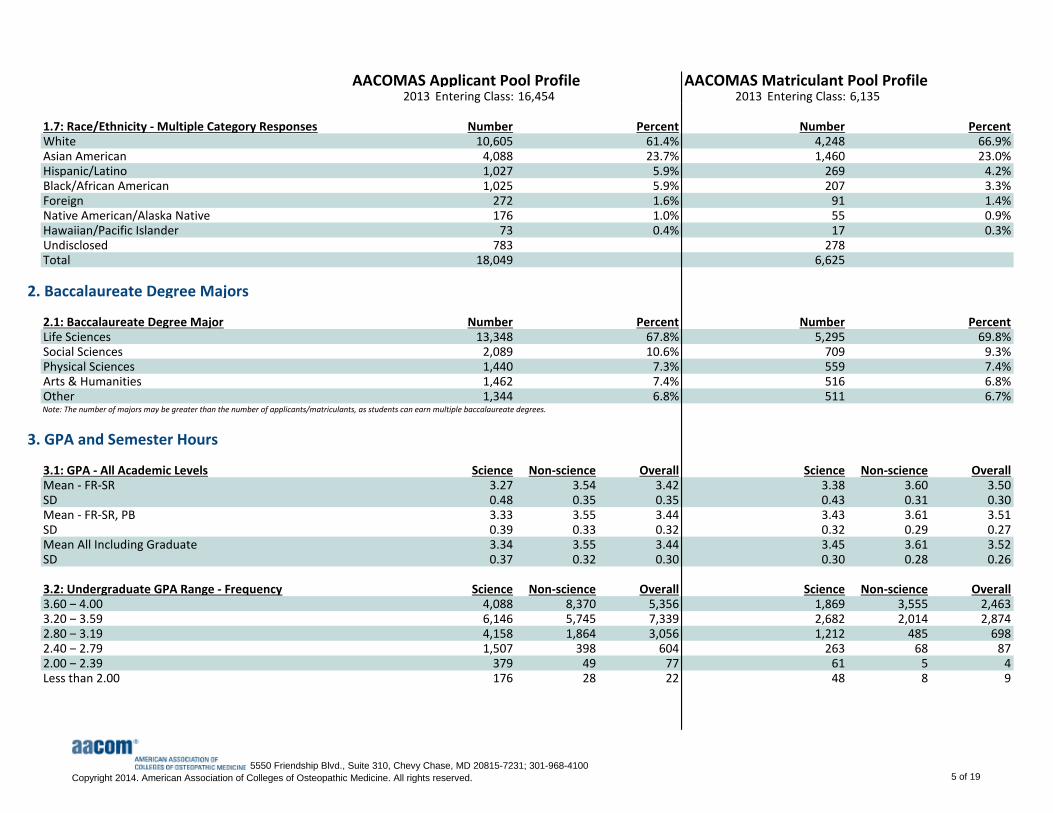
1.7: Race/Ethnicity - Multiple Category Responses Number Percent Number PercentWhite 10,605 61.4% 4,248 66.9%Asian American 4,088 23.7% 1,460 23.0%Hispanic/Latino 1,027 5.9% 269 4.2%Black/African American 1,025 5.9% 207 3.3%Foreign 272 1.6% 91 1.4%Native American/Alaska Native 176 1.0% 55 0.9%Hawaiian/Pacific Islander 73 0.4% 17 0.3%Undisclosed 783 278Total 18,049 6,625
2. Baccalaureate Degree Majors
2.1: Baccalaureate Degree Major Number Percent Number PercentLife Sciences 13,348 67.8% 5,295 69.8%Social Sciences 2,089 10.6% 709 9.3%Physical Sciences 1,440 7.3% 559 7.4%Arts & Humanities 1,462 7.4% 516 6.8%Other 1,344 6.8% 511 6.7%Note: The number of majors may be greater than the number of applicants/matriculants, as students can earn multiple baccalaureate degrees.
3. GPA and Semester Hours
3.1: GPA - All Academic Levels Science Non-science Overall Science Non-science OverallMean - FR-SR 3.27 3.54 3.42 3.38 3.60 3.50SD 0.48 0.35 0.35 0.43 0.31 0.30Mean - FR-SR, PB 3.33 3.55 3.44 3.43 3.61 3.51SD 0.39 0.33 0.32 0.32 0.29 0.27Mean All Including Graduate 3.34 3.55 3.44 3.45 3.61 3.52SD 0.37 0.32 0.30 0.30 0.28 0.26
3.2: Undergraduate GPA Range - Frequency Science Non-science Overall Science Non-science Overall3.60 ‒ 4.00 4,088 8,370 5,356 1,869 3,555 2,4633.20 ‒ 3.59 6,146 5,745 7,339 2,682 2,014 2,8742.80 ‒ 3.19 4,158 1,864 3,056 1,212 485 6982.40 ‒ 2.79 1,507 398 604 263 68 872.00 ‒ 2.39 379 49 77 61 5 4Less than 2.00 176 28 22 48 8 9
5550 Friendship Blvd., Suite 310, Chevy Chase, MD 20815-7231; 301-968-4100
Copyright 2014. American Association of Colleges of Osteopathic Medicine. All rights reserved. 5 of 19
AACOMAS Applicant Pool Profile AACOMAS Matriculant Pool Profile2013 Entering Class: 16,454 2013 Entering Class: 6,135
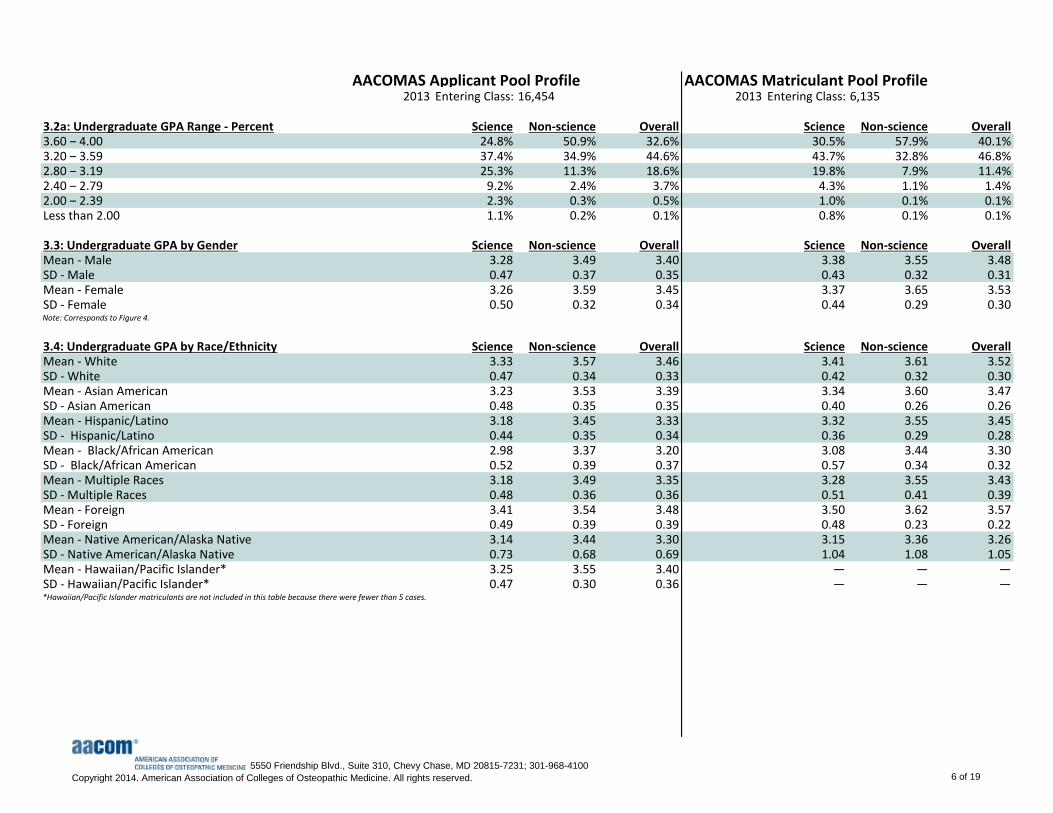
3.2a: Undergraduate GPA Range - Percent Science Non-science Overall Science Non-science Overall3.60 ‒ 4.00 24.8% 50.9% 32.6% 30.5% 57.9% 40.1%3.20 ‒ 3.59 37.4% 34.9% 44.6% 43.7% 32.8% 46.8%2.80 ‒ 3.19 25.3% 11.3% 18.6% 19.8% 7.9% 11.4%2.40 ‒ 2.79 9.2% 2.4% 3.7% 4.3% 1.1% 1.4%2.00 ‒ 2.39 2.3% 0.3% 0.5% 1.0% 0.1% 0.1%Less than 2.00 1.1% 0.2% 0.1% 0.8% 0.1% 0.1%
3.3: Undergraduate GPA by Gender Science Non-science Overall Science Non-science OverallMean - Male 3.28 3.49 3.40 3.38 3.55 3.48SD - Male 0.47 0.37 0.35 0.43 0.32 0.31Mean - Female 3.26 3.59 3.45 3.37 3.65 3.53SD - Female 0.50 0.32 0.34 0.44 0.29 0.30Note: Corresponds to Figure 4.
3.4: Undergraduate GPA by Race/Ethnicity Science Non-science Overall Science Non-science OverallMean - White 3.33 3.57 3.46 3.41 3.61 3.52SD - White 0.47 0.34 0.33 0.42 0.32 0.30Mean - Asian American 3.23 3.53 3.39 3.34 3.60 3.47SD - Asian American 0.48 0.35 0.35 0.40 0.26 0.26Mean - Hispanic/Latino 3.18 3.45 3.33 3.32 3.55 3.45SD - Hispanic/Latino 0.44 0.35 0.34 0.36 0.29 0.28Mean - Black/African American 2.98 3.37 3.20 3.08 3.44 3.30SD - Black/African American 0.52 0.39 0.37 0.57 0.34 0.32Mean - Multiple Races 3.18 3.49 3.35 3.28 3.55 3.43SD - Multiple Races 0.48 0.36 0.36 0.51 0.41 0.39Mean - Foreign 3.41 3.54 3.48 3.50 3.62 3.57SD - Foreign 0.49 0.39 0.39 0.48 0.23 0.22Mean - Native American/Alaska Native 3.14 3.44 3.30 3.15 3.36 3.26SD - Native American/Alaska Native 0.73 0.68 0.69 1.04 1.08 1.05Mean - Hawaiian/Pacific Islander* 3.25 3.55 3.40 ― ― ―SD - Hawaiian/Pacific Islander* 0.47 0.30 0.36 ― ― ―*Hawaiian/Pacific Islander matriculants are not included in this table because there were fewer than 5 cases.
5550 Friendship Blvd., Suite 310, Chevy Chase, MD 20815-7231; 301-968-4100
Copyright 2014. American Association of Colleges of Osteopathic Medicine. All rights reserved. 6 of 19
AACOMAS Applicant Pool Profile AACOMAS Matriculant Pool Profile2013 Entering Class: 16,454 2013 Entering Class: 6,135
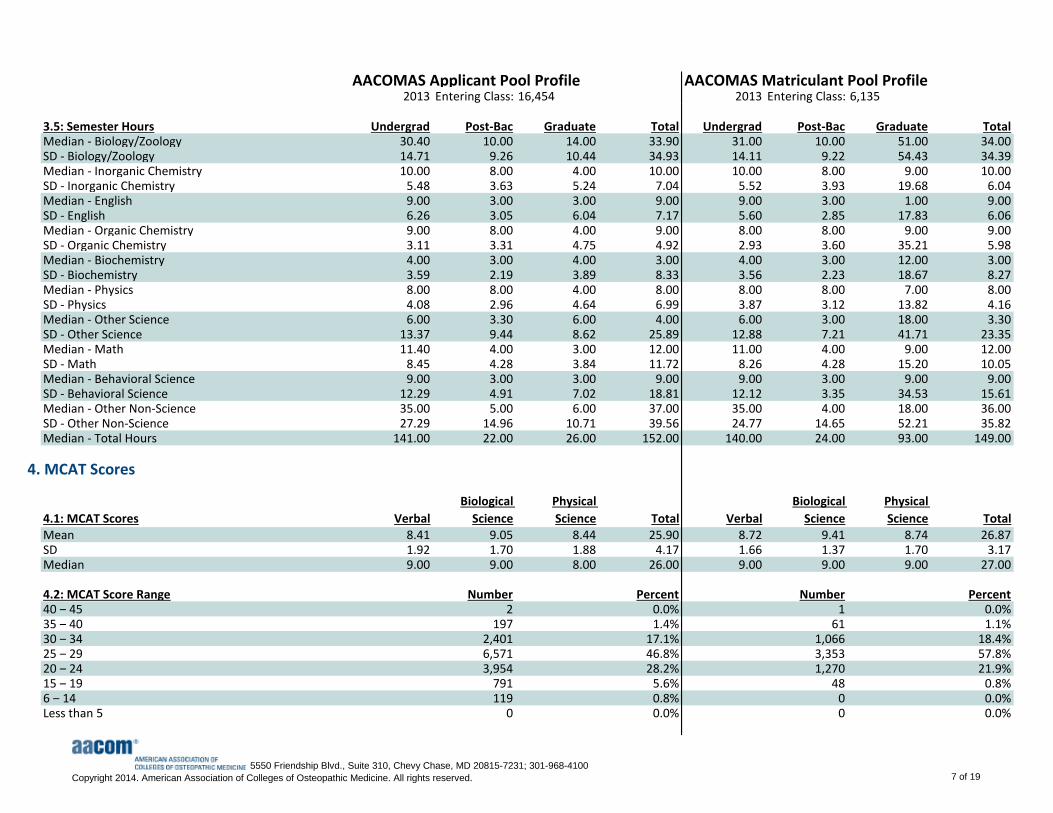
3.5: Semester Hours Undergrad Post-Bac Graduate Total Undergrad Post-Bac Graduate TotalMedian - Biology/Zoology 30.40 10.00 14.00 33.90 31.00 10.00 51.00 34.00SD - Biology/Zoology 14.71 9.26 10.44 34.93 14.11 9.22 54.43 34.39Median - Inorganic Chemistry 10.00 8.00 4.00 10.00 10.00 8.00 9.00 10.00SD - Inorganic Chemistry 5.48 3.63 5.24 7.04 5.52 3.93 19.68 6.04Median - English 9.00 3.00 3.00 9.00 9.00 3.00 1.00 9.00SD - English 6.26 3.05 6.04 7.17 5.60 2.85 17.83 6.06Median - Organic Chemistry 9.00 8.00 4.00 9.00 8.00 8.00 9.00 9.00SD - Organic Chemistry 3.11 3.31 4.75 4.92 2.93 3.60 35.21 5.98Median - Biochemistry 4.00 3.00 4.00 3.00 4.00 3.00 12.00 3.00SD - Biochemistry 3.59 2.19 3.89 8.33 3.56 2.23 18.67 8.27Median - Physics 8.00 8.00 4.00 8.00 8.00 8.00 7.00 8.00SD - Physics 4.08 2.96 4.64 6.99 3.87 3.12 13.82 4.16Median - Other Science 6.00 3.30 6.00 4.00 6.00 3.00 18.00 3.30SD - Other Science 13.37 9.44 8.62 25.89 12.88 7.21 41.71 23.35Median - Math 11.40 4.00 3.00 12.00 11.00 4.00 9.00 12.00SD - Math 8.45 4.28 3.84 11.72 8.26 4.28 15.20 10.05Median - Behavioral Science 9.00 3.00 3.00 9.00 9.00 3.00 9.00 9.00SD - Behavioral Science 12.29 4.91 7.02 18.81 12.12 3.35 34.53 15.61Median - Other Non-Science 35.00 5.00 6.00 37.00 35.00 4.00 18.00 36.00SD - Other Non-Science 27.29 14.96 10.71 39.56 24.77 14.65 52.21 35.82Median - Total Hours 141.00 22.00 26.00 152.00 140.00 24.00 93.00 149.00
4. MCAT Scores
4.1: MCAT Scores Verbal
Biological
Science
Physical
Science Total Verbal
Biological
Science
Physical
Science TotalMean 8.41 9.05 8.44 25.90 8.72 9.41 8.74 26.87SD 1.92 1.70 1.88 4.17 1.66 1.37 1.70 3.17Median 9.00 9.00 8.00 26.00 9.00 9.00 9.00 27.00
4.2: MCAT Score Range Number Percent Number Percent40 ‒ 45 2 0.0% 1 0.0%35 ‒ 40 197 1.4% 61 1.1%30 ‒ 34 2,401 17.1% 1,066 18.4%25 ‒ 29 6,571 46.8% 3,353 57.8%20 ‒ 24 3,954 28.2% 1,270 21.9%15 ‒ 19 791 5.6% 48 0.8%6 ‒ 14 119 0.8% 0 0.0%Less than 5 0 0.0% 0 0.0%
5550 Friendship Blvd., Suite 310, Chevy Chase, MD 20815-7231; 301-968-4100
Copyright 2014. American Association of Colleges of Osteopathic Medicine. All rights reserved. 7 of 19
AACOMAS Applicant Pool Profile AACOMAS Matriculant Pool Profile2013 Entering Class: 16,454 2013 Entering Class: 6,135
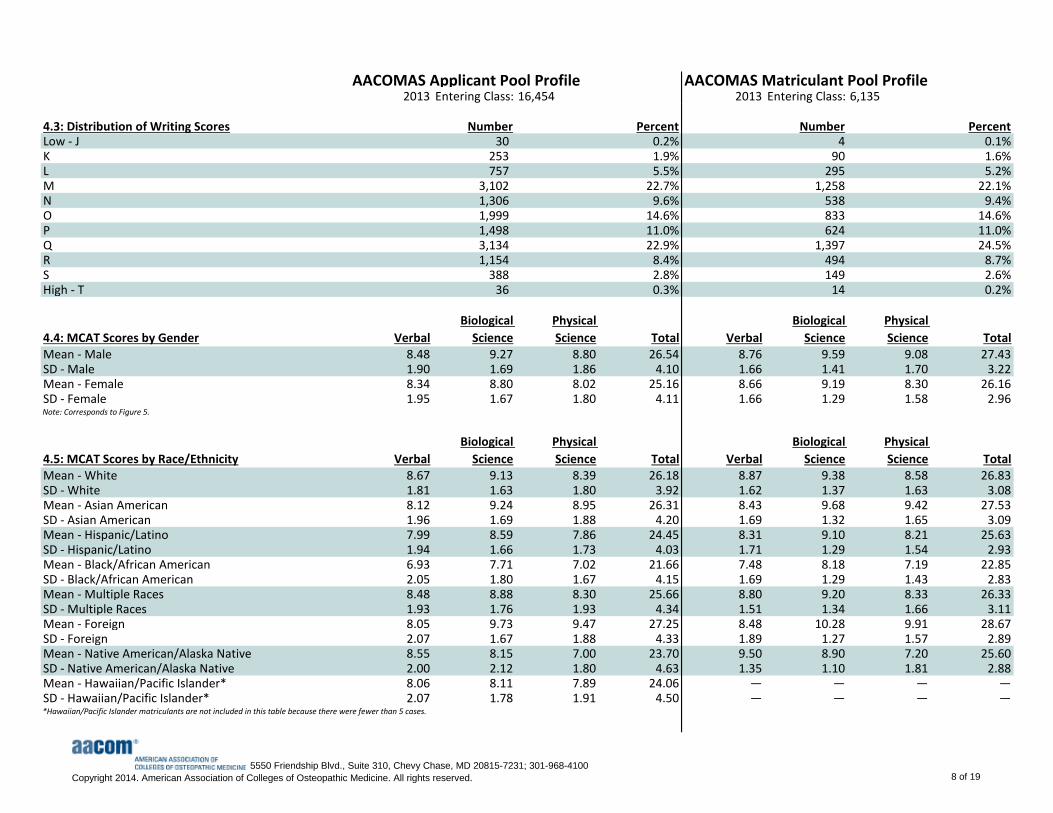
4.3: Distribution of Writing Scores Number Percent Number PercentLow - J 30 0.2% 4 0.1%K 253 1.9% 90 1.6%L 757 5.5% 295 5.2%M 3,102 22.7% 1,258 22.1%N 1,306 9.6% 538 9.4%O 1,999 14.6% 833 14.6%P 1,498 11.0% 624 11.0%Q 3,134 22.9% 1,397 24.5%R 1,154 8.4% 494 8.7%S 388 2.8% 149 2.6%High - T 36 0.3% 14 0.2%
4.4: MCAT Scores by Gender Verbal
Biological
Science
Physical
Science Total Verbal
Biological
Science
Physical
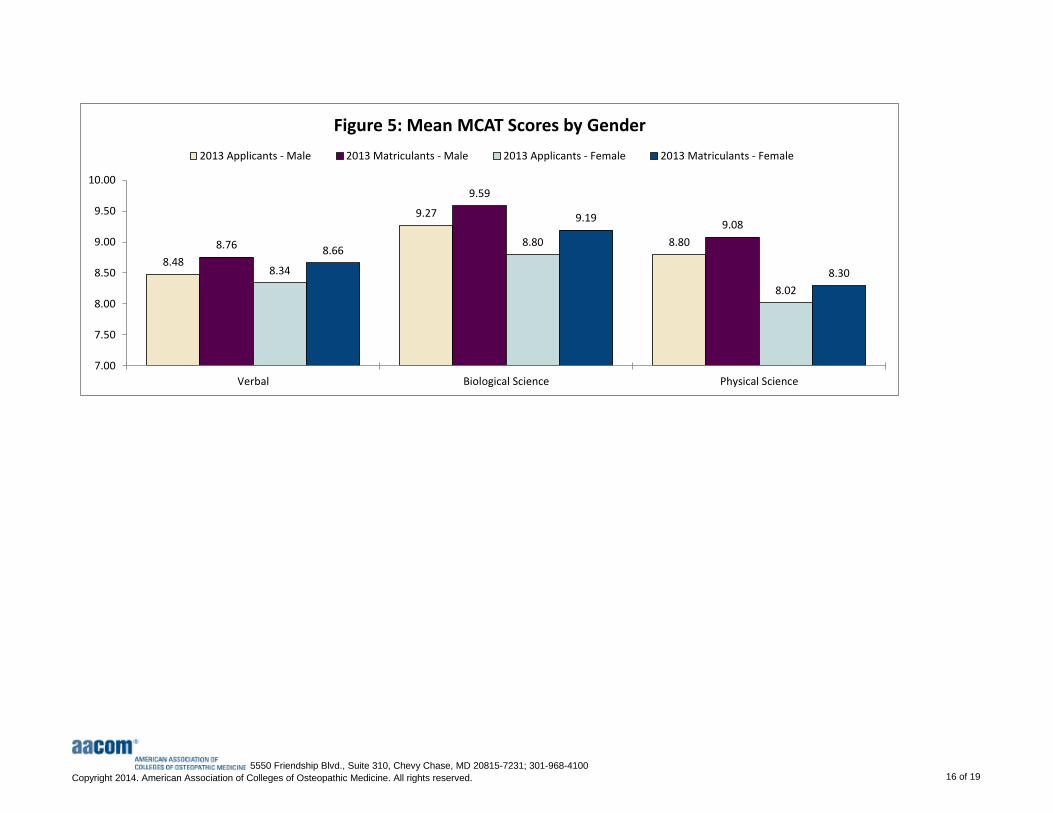
Science TotalMean - Male 8.48 9.27 8.80 26.54 8.76 9.59 9.08 27.43SD - Male 1.90 1.69 1.86 4.10 1.66 1.41 1.70 3.22Mean - Female 8.34 8.80 8.02 25.16 8.66 9.19 8.30 26.16SD - Female 1.95 1.67 1.80 4.11 1.66 1.29 1.58 2.96Note: Corresponds to Figure 5.
4.5: MCAT Scores by Race/Ethnicity Verbal
Biological
Science
Physical
Science Total Verbal
Biological
Science
Physical
Science TotalMean - White 8.67 9.13 8.39 26.18 8.87 9.38 8.58 26.83SD - White 1.81 1.63 1.80 3.92 1.62 1.37 1.63 3.08Mean - Asian American 8.12 9.24 8.95 26.31 8.43 9.68 9.42 27.53SD - Asian American 1.96 1.69 1.88 4.20 1.69 1.32 1.65 3.09Mean - Hispanic/Latino 7.99 8.59 7.86 24.45 8.31 9.10 8.21 25.63SD - Hispanic/Latino 1.94 1.66 1.73 4.03 1.71 1.29 1.54 2.93Mean - Black/African American 6.93 7.71 7.02 21.66 7.48 8.18 7.19 22.85SD - Black/African American 2.05 1.80 1.67 4.15 1.69 1.29 1.43 2.83Mean - Multiple Races 8.48 8.88 8.30 25.66 8.80 9.20 8.33 26.33SD - Multiple Races 1.93 1.76 1.93 4.34 1.51 1.34 1.66 3.11Mean - Foreign 8.05 9.73 9.47 27.25 8.48 10.28 9.91 28.67SD - Foreign 2.07 1.67 1.88 4.33 1.89 1.27 1.57 2.89Mean - Native American/Alaska Native 8.55 8.15 7.00 23.70 9.50 8.90 7.20 25.60SD - Native American/Alaska Native 2.00 2.12 1.80 4.63 1.35 1.10 1.81 2.88Mean - Hawaiian/Pacific Islander* 8.06 8.11 7.89 24.06 ― ― ― ―SD - Hawaiian/Pacific Islander* 2.07 1.78 1.91 4.50 ― ― ― ―*Hawaiian/Pacific Islander matriculants are not included in this table because there were fewer than 5 cases.
5550 Friendship Blvd., Suite 310, Chevy Chase, MD 20815-7231; 301-968-4100
Copyright 2014. American Association of Colleges of Osteopathic Medicine. All rights reserved. 8 of 19
AACOMAS Applicant Pool Profile AACOMAS Matriculant Pool Profile2013 Entering Class: 16,454 2013 Entering Class: 6,135
5. Familiarity with Osteopathic Medicine
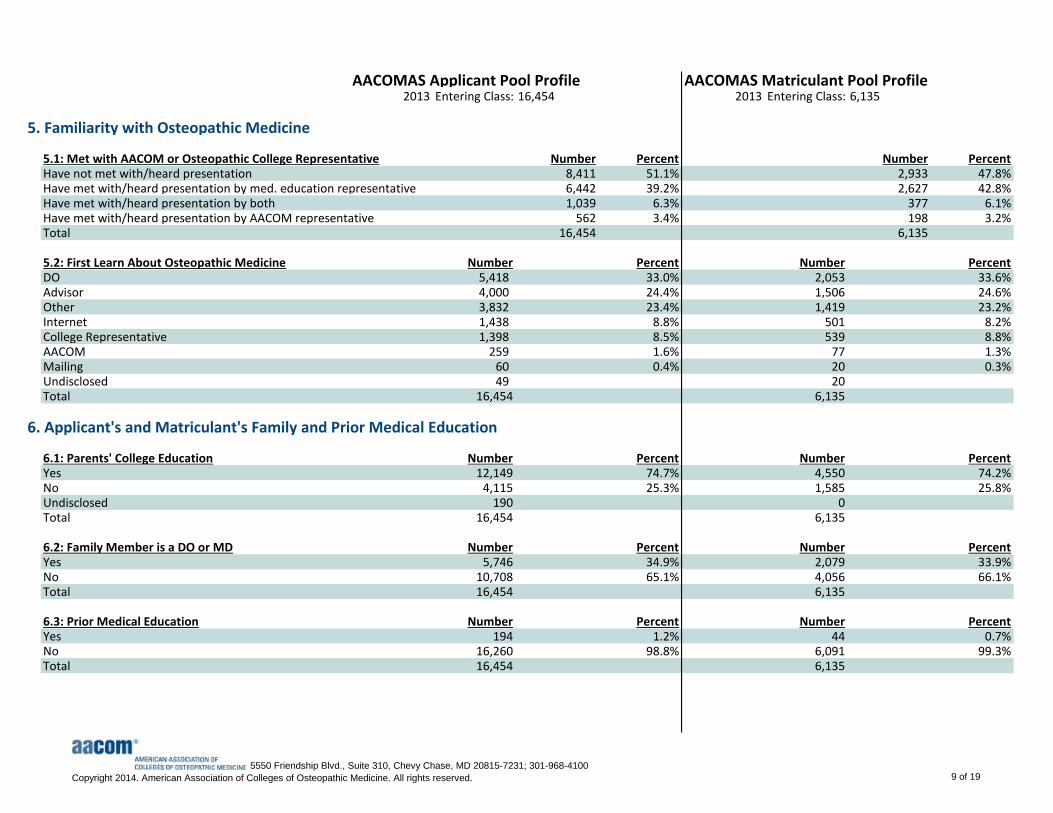
5.1: Met with AACOM or Osteopathic College Representative Number Percent Number PercentHave not met with/heard presentation 8,411 51.1% 2,933 47.8%Have met with/heard presentation by med. education representative 6,442 39.2% 2,627 42.8%Have met with/heard presentation by both 1,039 6.3% 377 6.1%Have met with/heard presentation by AACOM representative 562 3.4% 198 3.2%Total 16,454 6,135
5.2: First Learn About Osteopathic Medicine Number Percent Number PercentDO 5,418 33.0% 2,053 33.6%Advisor 4,000 24.4% 1,506 24.6%Other 3,832 23.4% 1,419 23.2%Internet 1,438 8.8% 501 8.2%College Representative 1,398 8.5% 539 8.8%AACOM 259 1.6% 77 1.3%Mailing 60 0.4% 20 0.3%Undisclosed 49 20Total 16,454 6,135
6. Applicant's and Matriculant's Family and Prior Medical Education
6.1: Parents' College Education Number Percent Number PercentYes 12,149 74.7% 4,550 74.2%No 4,115 25.3% 1,585 25.8%Undisclosed 190 0Total 16,454 6,135
6.2: Family Member is a DO or MD Number Percent Number PercentYes 5,746 34.9% 2,079 33.9%No 10,708 65.1% 4,056 66.1%Total 16,454 6,135
6.3: Prior Medical Education Number Percent Number PercentYes 194 1.2% 44 0.7%No 16,260 98.8% 6,091 99.3%Total 16,454 6,135
5550 Friendship Blvd., Suite 310, Chevy Chase, MD 20815-7231; 301-968-4100
Copyright 2014. American Association of Colleges of Osteopathic Medicine. All rights reserved. 9 of 19
AACOMAS Applicant Pool Profile AACOMAS Matriculant Pool Profile2013 Entering Class: 16,454 2013 Entering Class: 6,135
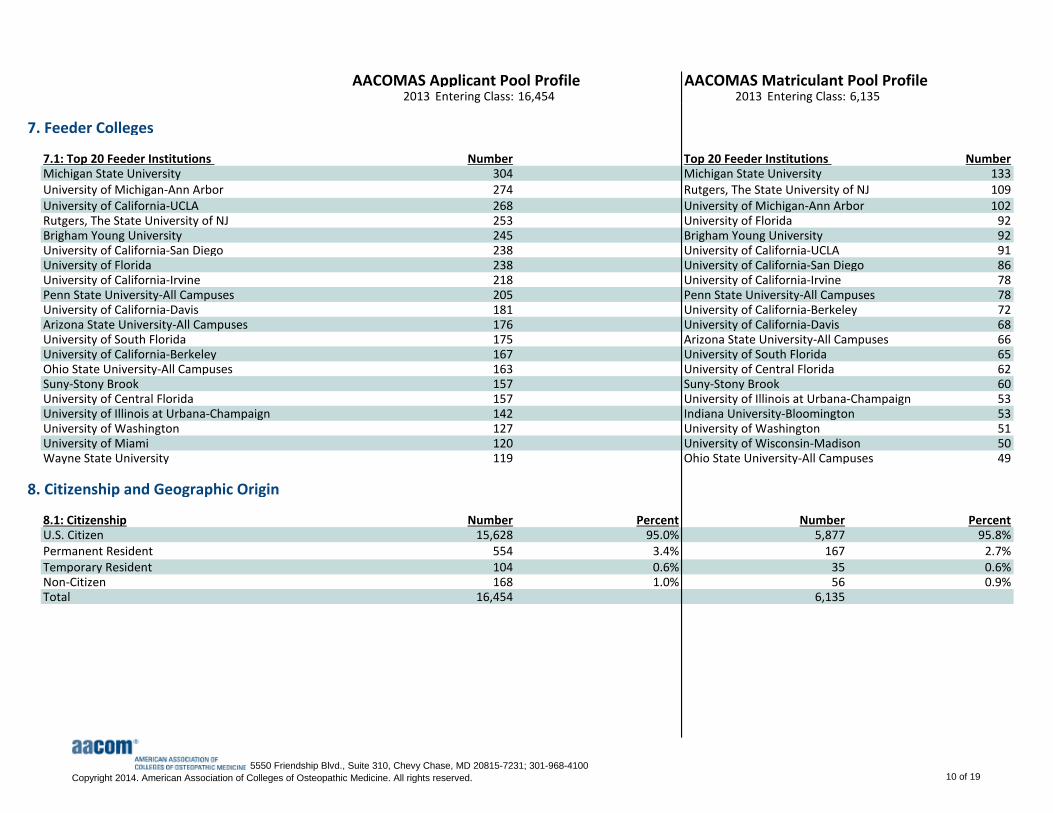
7. Feeder Colleges
7.1: Top 20 Feeder Institutions Number Top 20 Feeder Institutions NumberMichigan State University 304 Michigan State University 133University of Michigan-Ann Arbor 274 Rutgers, The State University of NJ 109University of California-UCLA 268 University of Michigan-Ann Arbor 102Rutgers, The State University of NJ 253 University of Florida 92Brigham Young University 245 Brigham Young University 92University of California-San Diego 238 University of California-UCLA 91University of Florida 238 University of California-San Diego 86University of California-Irvine 218 University of California-Irvine 78Penn State University-All Campuses 205 Penn State University-All Campuses 78University of California-Davis 181 University of California-Berkeley 72Arizona State University-All Campuses 176 University of California-Davis 68University of South Florida 175 Arizona State University-All Campuses 66University of California-Berkeley 167 University of South Florida 65Ohio State University-All Campuses 163 University of Central Florida 62Suny-Stony Brook 157 Suny-Stony Brook 60University of Central Florida 157 University of Illinois at Urbana-Champaign 53University of Illinois at Urbana-Champaign 142 Indiana University-Bloomington 53University of Washington 127 University of Washington 51University of Miami 120 University of Wisconsin-Madison 50Wayne State University 119 Ohio State University-All Campuses 49
8. Citizenship and Geographic Origin
8.1: Citizenship Number Percent Number PercentU.S. Citizen 15,628 95.0% 5,877 95.8%Permanent Resident 554 3.4% 167 2.7%Temporary Resident 104 0.6% 35 0.6%Non-Citizen 168 1.0% 56 0.9%Total 16,454 6,135
5550 Friendship Blvd., Suite 310, Chevy Chase, MD 20815-7231; 301-968-4100
Copyright 2014. American Association of Colleges of Osteopathic Medicine. All rights reserved. 10 of 19
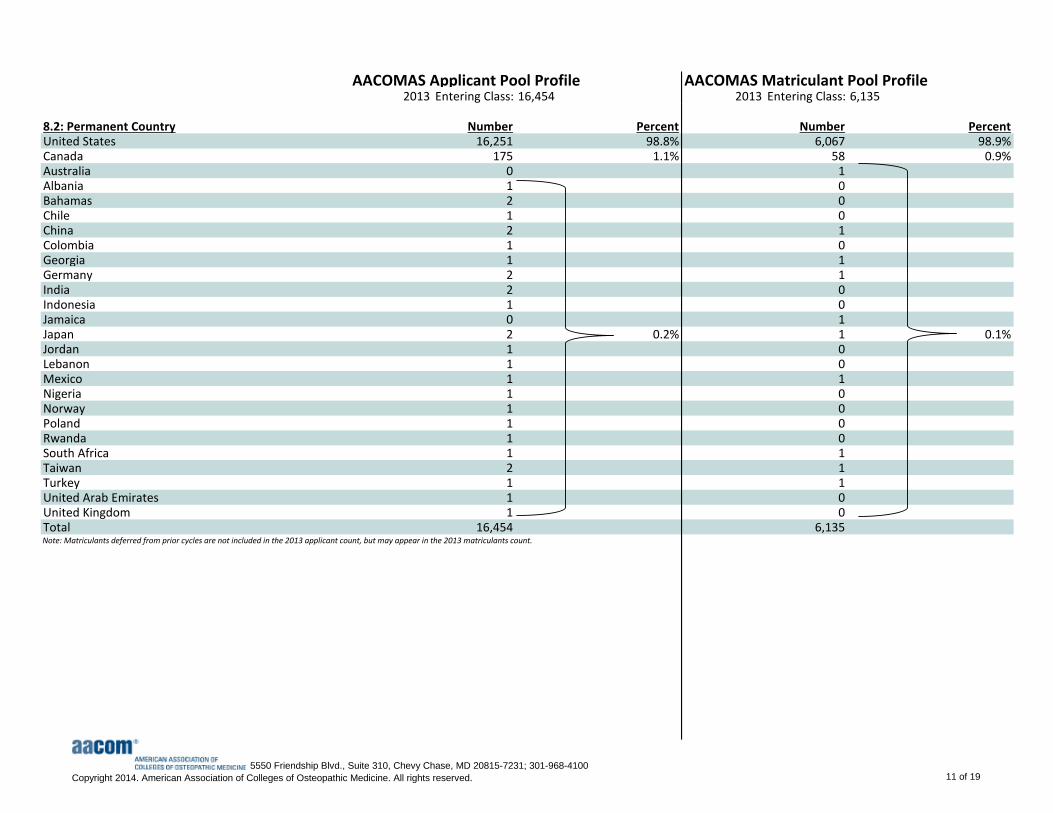
AACOMAS Applicant Pool Profile AACOMAS Matriculant Pool Profile2013 Entering Class: 16,454 2013 Entering Class: 6,135
8.2: Permanent Country Number Percent Number PercentUnited States 16,251 98.8% 6,067 98.9%Canada 175 1.1% 58 0.9%Australia 0 1Albania 1 0Bahamas 2 0Chile 1 0China 2 1Colombia 1 0Georgia 1 1Germany 2 1India 2 0Indonesia 1 0Jamaica 0 1Japan 2 0.2% 1 0.1%Jordan 1 0Lebanon 1 0Mexico 1 1Nigeria 1 0Norway 1 0Poland 1 0Rwanda 1 0South Africa 1 1Taiwan 2 1Turkey 1 1United Arab Emirates 1 0United Kingdom 1 0Total 16,454 6,135Note: Matriculants deferred from prior cycles are not included in the 2013 applicant count, but may appear in the 2013 matriculants count.
5550 Friendship Blvd., Suite 310, Chevy Chase, MD 20815-7231; 301-968-4100
Copyright 2014. American Association of Colleges of Osteopathic Medicine. All rights reserved. 11 of 19
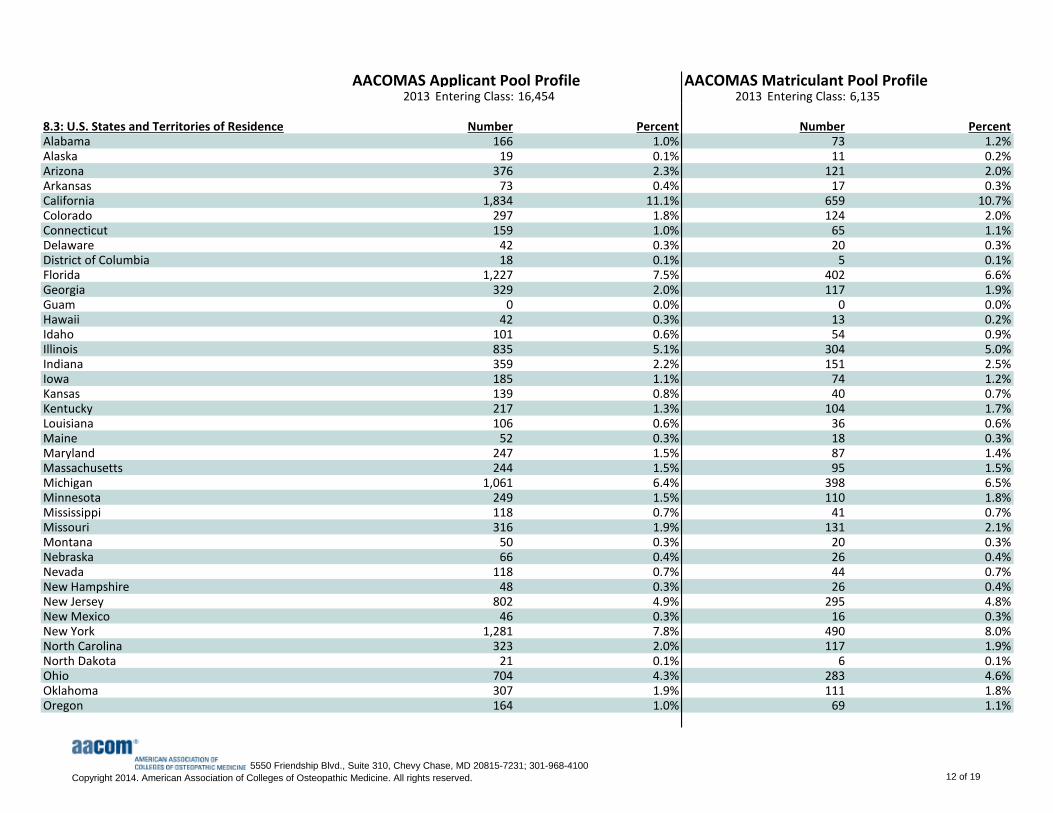
AACOMAS Applicant Pool Profile AACOMAS Matriculant Pool Profile2013 Entering Class: 16,454 2013 Entering Class: 6,135
8.3: U.S. States and Territories of Residence Number Percent Number PercentAlabama 166 1.0% 73 1.2%Alaska 19 0.1% 11 0.2%Arizona 376 2.3% 121 2.0%Arkansas 73 0.4% 17 0.3%California 1,834 11.1% 659 10.7%Colorado 297 1.8% 124 2.0%Connecticut 159 1.0% 65 1.1%Delaware 42 0.3% 20 0.3%District of Columbia 18 0.1% 5 0.1%Florida 1,227 7.5% 402 6.6%Georgia 329 2.0% 117 1.9%Guam 0 0.0% 0 0.0%Hawaii 42 0.3% 13 0.2%Idaho 101 0.6% 54 0.9%Illinois 835 5.1% 304 5.0%Indiana 359 2.2% 151 2.5%Iowa 185 1.1% 74 1.2%Kansas 139 0.8% 40 0.7%Kentucky 217 1.3% 104 1.7%Louisiana 106 0.6% 36 0.6%Maine 52 0.3% 18 0.3%Maryland 247 1.5% 87 1.4%Massachusetts 244 1.5% 95 1.5%Michigan 1,061 6.4% 398 6.5%Minnesota 249 1.5% 110 1.8%Mississippi 118 0.7% 41 0.7%Missouri 316 1.9% 131 2.1%Montana 50 0.3% 20 0.3%Nebraska 66 0.4% 26 0.4%Nevada 118 0.7% 44 0.7%New Hampshire 48 0.3% 26 0.4%New Jersey 802 4.9% 295 4.8%New Mexico 46 0.3% 16 0.3%New York 1,281 7.8% 490 8.0%North Carolina 323 2.0% 117 1.9%North Dakota 21 0.1% 6 0.1%Ohio 704 4.3% 283 4.6%Oklahoma 307 1.9% 111 1.8%Oregon 164 1.0% 69 1.1%
5550 Friendship Blvd., Suite 310, Chevy Chase, MD 20815-7231; 301-968-4100
Copyright 2014. American Association of Colleges of Osteopathic Medicine. All rights reserved. 12 of 19
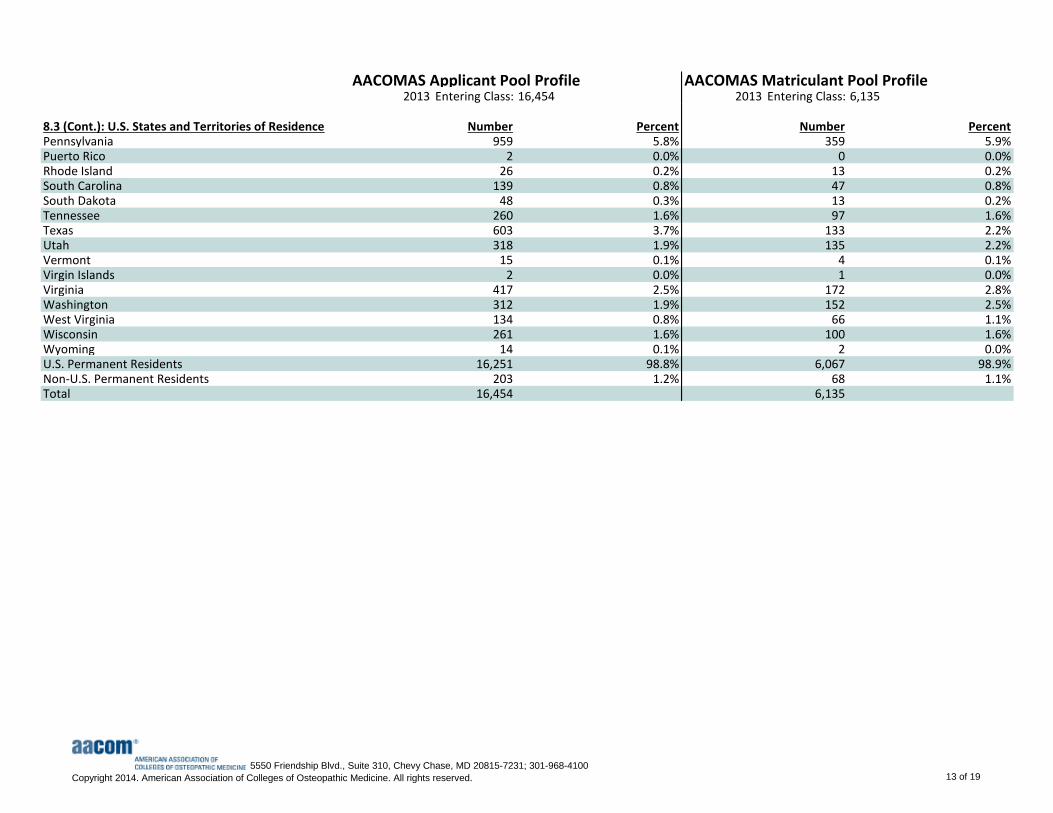
AACOMAS Applicant Pool Profile AACOMAS Matriculant Pool Profile2013 Entering Class: 16,454 2013 Entering Class: 6,135
8.3 (Cont.): U.S. States and Territories of Residence Number Percent Number PercentPennsylvania 959 5.8% 359 5.9%Puerto Rico 2 0.0% 0 0.0%Rhode Island 26 0.2% 13 0.2%South Carolina 139 0.8% 47 0.8%South Dakota 48 0.3% 13 0.2%Tennessee 260 1.6% 97 1.6%Texas 603 3.7% 133 2.2%Utah 318 1.9% 135 2.2%Vermont 15 0.1% 4 0.1%Virgin Islands 2 0.0% 1 0.0%Virginia 417 2.5% 172 2.8%Washington 312 1.9% 152 2.5%West Virginia 134 0.8% 66 1.1%Wisconsin 261 1.6% 100 1.6%Wyoming 14 0.1% 2 0.0%U.S. Permanent Residents 16,251 98.8% 6,067 98.9%Non-U.S. Permanent Residents 203 1.2% 68 1.1%Total 16,454 6,135
5550 Friendship Blvd., Suite 310, Chevy Chase, MD 20815-7231; 301-968-4100
Copyright 2014. American Association of Colleges of Osteopathic Medicine. All rights reserved. 13 of 19

2013 Applicants
2013 Matriculants
2013 Applicants - Male
2013 Matriculants - Male
2013 Applicants - Female
2013 Matriculants - Female
0
200
400
600
800
1,000
1,200
1,400
1,600
1 2 3 4 5 6 7 8 9 10 11 12 13 14 15 16 17 18 19 20 21 22 23 24 25 26 27 28 29 30 31 32
Nu
mb
er
of
Ap
plic
ants
Number of Designations
Figure 1: College Designations
2013 Applicants 2013 Matriculants
60.3%
22.2%
6.6% 5.4% 3.6% 1.5% 0.2% 0.1%
66.3%
21.6%
4.6% 2.8% 3.1% 1.3% 0.2% 0.1%0.0%
10.0%
20.0%
30.0%
40.0%
50.0%
60.0%
70.0%
White Asian American Hispanic/Latino Black/AfricanAmerican
Multiple Races Foreign NativeAmerican/Alaska
Native
Hawaiian/PacificIslander
Figure 2: Race/Ethnicity Percentages - Single Category Response
2013 Applicants 2013 Matriculants
5550 Friendship Blvd., Suite 310, Chevy Chase, MD 20815-7231; 301-968-4100
Copyright 2014. American Association of Colleges of Osteopathic Medicine. All rights reserved. 14 of 19
34
.1%
11
.4%
3.3
%
1.9
%
1.9
%
0.8
%
0.1
%
0.1
%
38
.0%
11
.3%
2.5
%
1.1
%
1.7
%
0.8
%
0.1
%
0.0
%
26
.2%
10
.9%
3.2
%
3.5
%
1.7
%
0.7
%
0.1
%
0.1
%
28
.3%
10
.3%
2.1
%
1.7
%
1.5
%
0.5
%
0.1
%
0.0
%
0.0%
5.0%
10.0%
15.0%
20.0%
25.0%
30.0%
35.0%
40.0%
45.0%
White Asian American Hispanic/Latino Black/African American Multiple Races Foreign Native American/AlaskaNative
Hawaiian/PacificIslander
Figure 3: Race/Ethnicity Percentages by Gender - Single Category Response
2013 Applicants - Male 2013 Matriculants - Male 2013 Applicants - Female 2013 Matriculants - Female
3.28
3.49
3.403.38
3.55
3.48
3.26
3.59
3.45
3.37
3.65
3.53
3.00
3.10
3.20
3.30
3.40
3.50
3.60
3.70
Science Non-science Overall
Figure 4: Mean Undergraduate GPA by Gender
2013 Applicants - Male 2013 Matriculants - Male 2013 Applicants - Female 2013 Matriculants - Female
5550 Friendship Blvd., Suite 310, Chevy Chase, MD 20815-7231; 301-968-4100
Copyright 2014. American Association of Colleges of Osteopathic Medicine. All rights reserved. 15 of 19
8.48
9.27
8.808.76
9.59
9.08
8.34
8.80
8.02
8.66
9.19
8.30
7.00
7.50
8.00
8.50
9.00
9.50
10.00
Verbal Biological Science Physical Science
Figure 5: Mean MCAT Scores by Gender
2013 Applicants - Male 2013 Matriculants - Male 2013 Applicants - Female 2013 Matriculants - Female
5550 Friendship Blvd., Suite 310, Chevy Chase, MD 20815-7231; 301-968-4100
Copyright 2014. American Association of Colleges of Osteopathic Medicine. All rights reserved. 16 of 19

5550 Friendship Blvd., Suite 310, Chevy Chase, MD 20815-7231; 301-968-4100
Copyright 2014. American Association of Colleges of Osteopathic Medicine. All rights reserved. 17 of 19
5550 Friendship Blvd., Suite 310, Chevy Chase, MD 20815-7231; 301-968-4100
Copyright 2014. American Association of Colleges of Osteopathic Medicine. All rights reserved. 18 of 19

2013 Entering Class: 16,454 2013 Entering Class: 6,135
9. Research Question
9.1: Plans to Apply to MD-Granting Medical School
Applicants
Marking Yes
Response
Rate
Applicants
Marking Yes
Response
Rate
In the current application year, I have/am planning to
apply to a U.S. MD-granting medical school47.2% 45.3%
In the current application year, I have/am planning to
apply to an offshore MD-granting medical school7.9% 73.6% 5.6% 69.3%
I have applied to a U.S. MD-granting medical school in a
prior application year16.6% 16.8%
I have applied to an offshore MD-granting medical school
in a prior application year1.9% 1.6%
9.2: Medical Specialty Choice
If you were deciding on a medical specialty today, would
you specialize in one of the primary care specialties:
internal medicine, family medicine or pediatric medicine?
81.4% 72.6% 81.4% 74.0%
9.3: Commercial MCAT Test-Preparation Services
In your preparation for the MCAT, did you make use of any
of the commercial MCAT test-preparation services?77.0% 73.3% 77.6% 74.5%
AACOMAS Matriculant Pool Profile
Percent of all responses Percent of all responses
Percent of valid responses Percent of valid responses
AACOMAS Applicant Pool Profile
5550 Friendship Blvd., Suite 310, Chevy Chase, MD 20815-7231; 301-968-4100
Copyright 2014. American Association of Colleges of Osteopathic Medicine. All rights reserved. 19 of 19