Embed Size (px)
Citation preview
1
Ossiam Emerging Markets Minimum Variance Index NRRebalancing Report - 24-Sep-2018
Stock StatisticsThe Ossiam Emerging Markets Minimum Variance IndexNR rebalances semiannually (March and September), onthe third Friday of the month. The new composition isimplemented at the opening of the next business day afterthe third Friday - usually the next Monday. The weightsare computed using closing prices Monday before the thirdFriday. Both the Ossiam Emerging Markets MinimumVariance Index NR and the benchmark S&P IFCI Index NRare computed in USD. The calculations in the document areperformed by Ossiam using S&P /Datastream source.
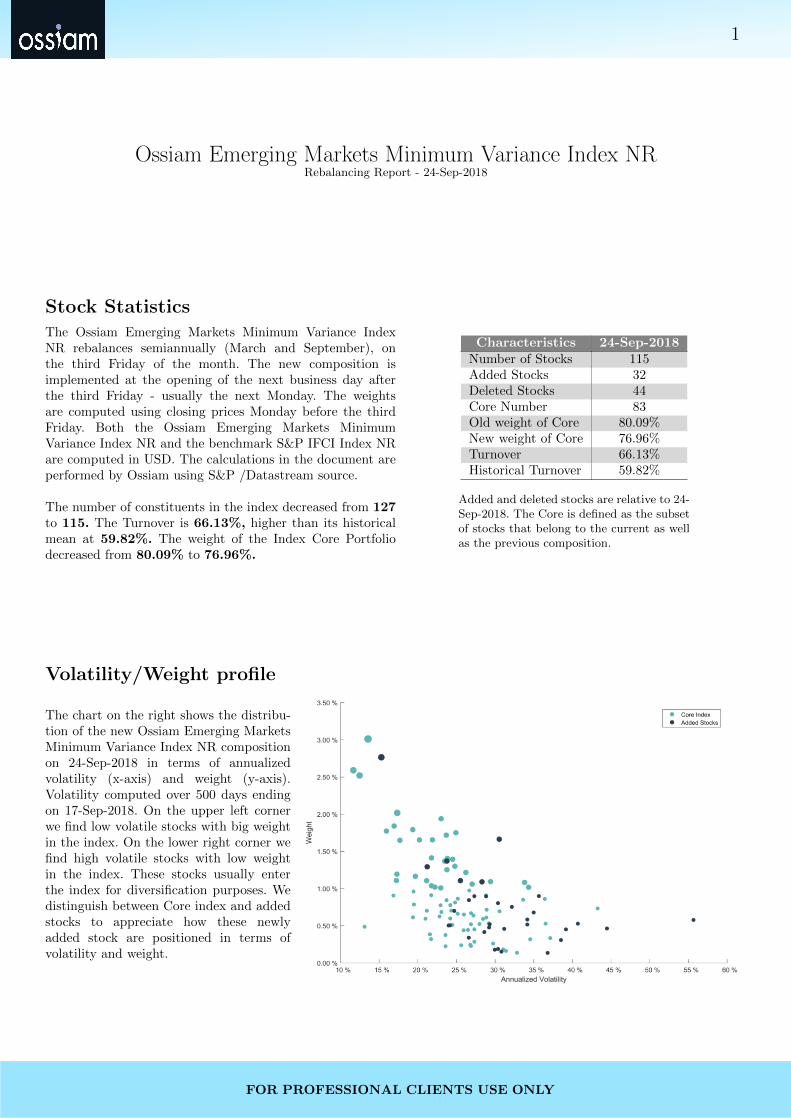
The number of constituents in the index decreased from 127to 115. The Turnover is 66.13%, higher than its historicalmean at 59.82%. The weight of the Index Core Portfoliodecreased from 80.09% to 76.96%.
Characteristics 24-Sep-2018Number of Stocks 115Added Stocks 32Deleted Stocks 44Core Number 83Old weight of Core 80.09%New weight of Core 76.96%Turnover 66.13%Historical Turnover 59.82%
Added and deleted stocks are relative to 24-Sep-2018. The Core is defined as the subsetof stocks that belong to the current as wellas the previous composition.
Volatility/Weight profile
The chart on the right shows the distribu-tion of the new Ossiam Emerging MarketsMinimum Variance Index NR compositionon 24-Sep-2018 in terms of annualizedvolatility (x-axis) and weight (y-axis).Volatility computed over 500 days endingon 17-Sep-2018. On the upper left cornerwe find low volatile stocks with big weightin the index. On the lower right corner wefind high volatile stocks with low weightin the index. These stocks usually enterthe index for diversification purposes. Wedistinguish between Core index and addedstocks to appreciate how these newlyadded stock are positioned in terms ofvolatility and weight.
FOR PROFESSIONAL CLIENTS USE ONLY
2
Sector Allocation
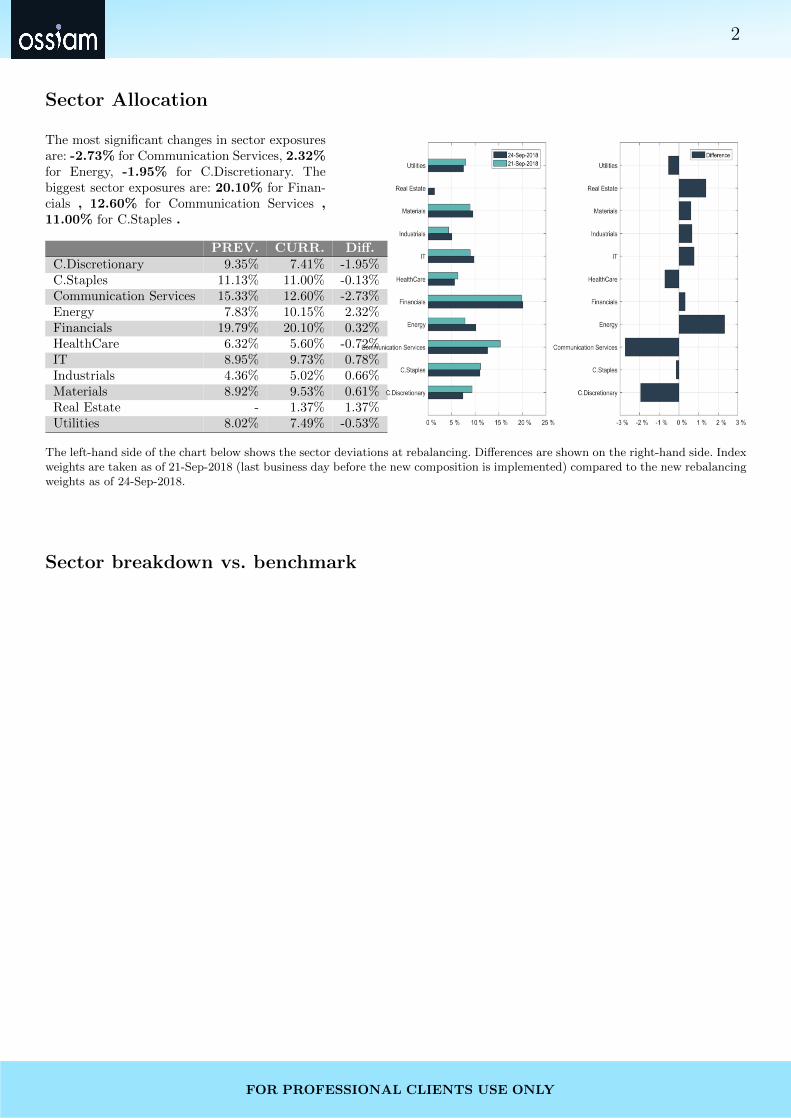
The most significant changes in sector exposuresare: -2.73% for Communication Services, 2.32%for Energy, -1.95% for C.Discretionary. Thebiggest sector exposures are: 20.10% for Finan-cials , 12.60% for Communication Services ,11.00% for C.Staples .
PREV. CURR. Diff.C.Discretionary 9.35% 7.41% -1.95%C.Staples 11.13% 11.00% -0.13%Communication Services 15.33% 12.60% -2.73%Energy 7.83% 10.15% 2.32%Financials 19.79% 20.10% 0.32%HealthCare 6.32% 5.60% -0.72%IT 8.95% 9.73% 0.78%Industrials 4.36% 5.02% 0.66%Materials 8.92% 9.53% 0.61%Real Estate - 1.37% 1.37%Utilities 8.02% 7.49% -0.53%
The left-hand side of the chart below shows the sector deviations at rebalancing. Differences are shown on the right-hand side. Indexweights are taken as of 21-Sep-2018 (last business day before the new composition is implemented) compared to the new rebalancingweights as of 24-Sep-2018.
Sector breakdown vs. benchmark
FOR PROFESSIONAL CLIENTS USE ONLY
3
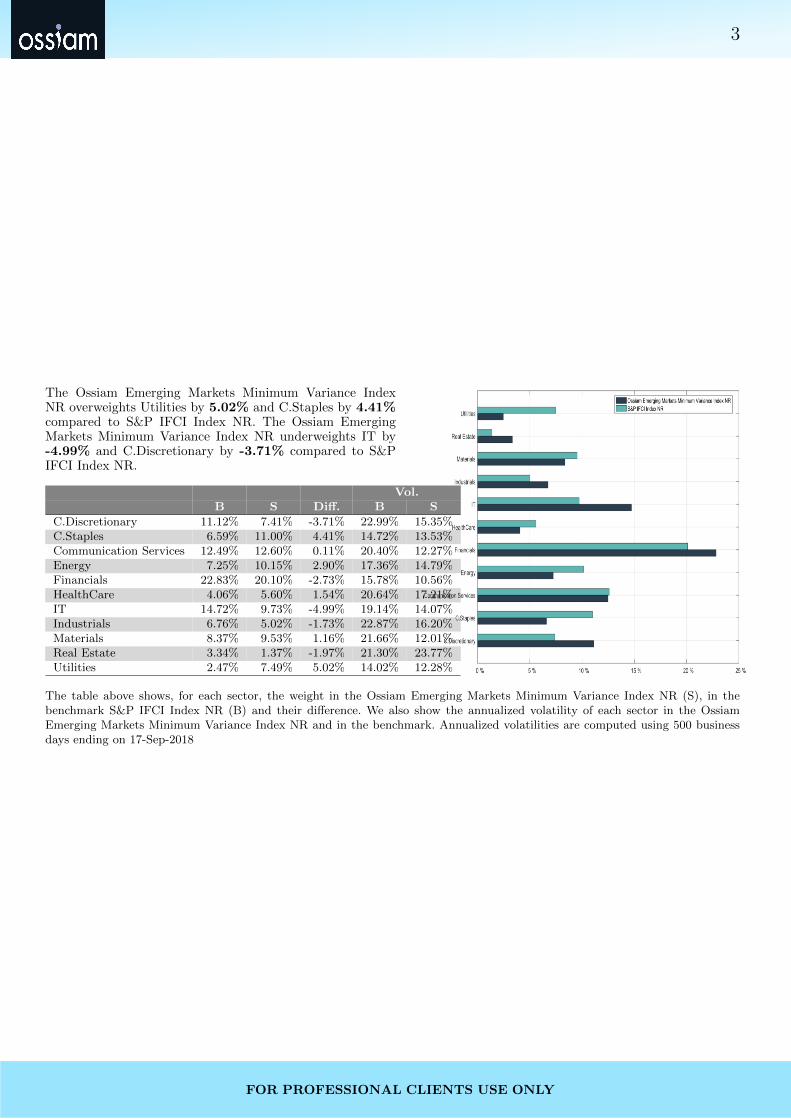
The Ossiam Emerging Markets Minimum Variance IndexNR overweights Utilities by 5.02% and C.Staples by 4.41%compared to S&P IFCI Index NR. The Ossiam EmergingMarkets Minimum Variance Index NR underweights IT by-4.99% and C.Discretionary by -3.71% compared to S&PIFCI Index NR.
Vol.B S Diff. B S
C.Discretionary 11.12% 7.41% -3.71% 22.99% 15.35%C.Staples 6.59% 11.00% 4.41% 14.72% 13.53%Communication Services 12.49% 12.60% 0.11% 20.40% 12.27%Energy 7.25% 10.15% 2.90% 17.36% 14.79%Financials 22.83% 20.10% -2.73% 15.78% 10.56%HealthCare 4.06% 5.60% 1.54% 20.64% 17.21%IT 14.72% 9.73% -4.99% 19.14% 14.07%Industrials 6.76% 5.02% -1.73% 22.87% 16.20%Materials 8.37% 9.53% 1.16% 21.66% 12.01%Real Estate 3.34% 1.37% -1.97% 21.30% 23.77%Utilities 2.47% 7.49% 5.02% 14.02% 12.28%
The table above shows, for each sector, the weight in the Ossiam Emerging Markets Minimum Variance Index NR (S), in thebenchmark S&P IFCI Index NR (B) and their difference. We also show the annualized volatility of each sector in the OssiamEmerging Markets Minimum Variance Index NR and in the benchmark. Annualized volatilities are computed using 500 businessdays ending on 17-Sep-2018
FOR PROFESSIONAL CLIENTS USE ONLY
4
Country Allocation
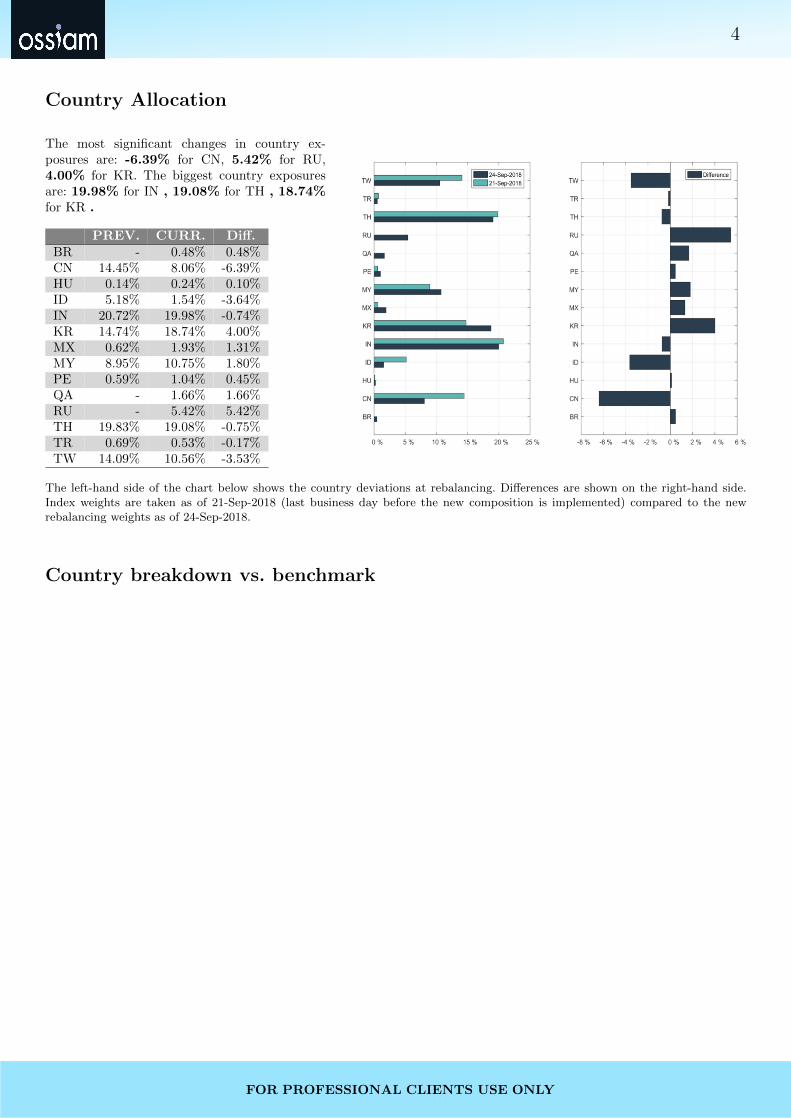
The most significant changes in country ex-posures are: -6.39% for CN, 5.42% for RU,4.00% for KR. The biggest country exposuresare: 19.98% for IN , 19.08% for TH , 18.74%for KR .
PREV. CURR. Diff.BR - 0.48% 0.48%CN 14.45% 8.06% -6.39%HU 0.14% 0.24% 0.10%ID 5.18% 1.54% -3.64%IN 20.72% 19.98% -0.74%KR 14.74% 18.74% 4.00%MX 0.62% 1.93% 1.31%MY 8.95% 10.75% 1.80%PE 0.59% 1.04% 0.45%QA - 1.66% 1.66%RU - 5.42% 5.42%TH 19.83% 19.08% -0.75%TR 0.69% 0.53% -0.17%TW 14.09% 10.56% -3.53%
The left-hand side of the chart below shows the country deviations at rebalancing. Differences are shown on the right-hand side.Index weights are taken as of 21-Sep-2018 (last business day before the new composition is implemented) compared to the newrebalancing weights as of 24-Sep-2018.
Country breakdown vs. benchmark
FOR PROFESSIONAL CLIENTS USE ONLY
5
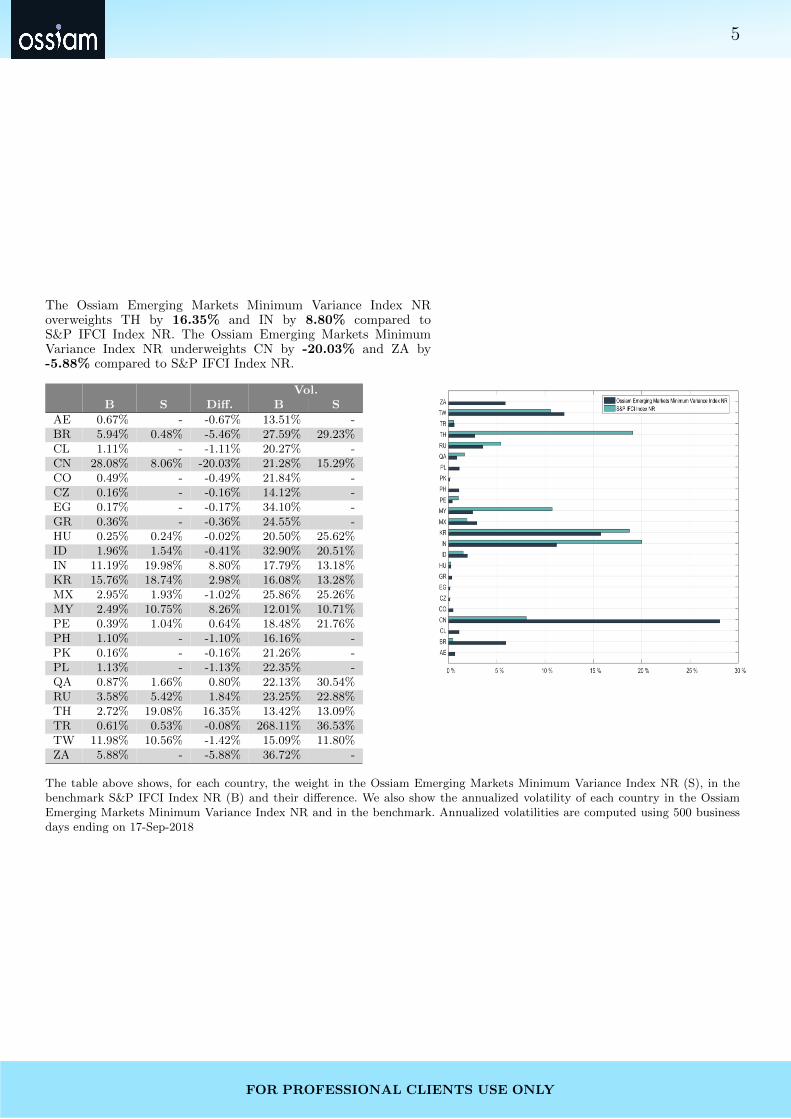
The Ossiam Emerging Markets Minimum Variance Index NRoverweights TH by 16.35% and IN by 8.80% compared toS&P IFCI Index NR. The Ossiam Emerging Markets MinimumVariance Index NR underweights CN by -20.03% and ZA by-5.88% compared to S&P IFCI Index NR.
Vol.B S Diff. B S
AE 0.67% - -0.67% 13.51% -BR 5.94% 0.48% -5.46% 27.59% 29.23%CL 1.11% - -1.11% 20.27% -CN 28.08% 8.06% -20.03% 21.28% 15.29%CO 0.49% - -0.49% 21.84% -CZ 0.16% - -0.16% 14.12% -EG 0.17% - -0.17% 34.10% -GR 0.36% - -0.36% 24.55% -HU 0.25% 0.24% -0.02% 20.50% 25.62%ID 1.96% 1.54% -0.41% 32.90% 20.51%IN 11.19% 19.98% 8.80% 17.79% 13.18%KR 15.76% 18.74% 2.98% 16.08% 13.28%MX 2.95% 1.93% -1.02% 25.86% 25.26%MY 2.49% 10.75% 8.26% 12.01% 10.71%PE 0.39% 1.04% 0.64% 18.48% 21.76%PH 1.10% - -1.10% 16.16% -PK 0.16% - -0.16% 21.26% -PL 1.13% - -1.13% 22.35% -QA 0.87% 1.66% 0.80% 22.13% 30.54%RU 3.58% 5.42% 1.84% 23.25% 22.88%TH 2.72% 19.08% 16.35% 13.42% 13.09%TR 0.61% 0.53% -0.08% 268.11% 36.53%TW 11.98% 10.56% -1.42% 15.09% 11.80%ZA 5.88% - -5.88% 36.72% -
The table above shows, for each country, the weight in the Ossiam Emerging Markets Minimum Variance Index NR (S), in thebenchmark S&P IFCI Index NR (B) and their difference. We also show the annualized volatility of each country in the OssiamEmerging Markets Minimum Variance Index NR and in the benchmark. Annualized volatilities are computed using 500 businessdays ending on 17-Sep-2018
FOR PROFESSIONAL CLIENTS USE ONLY

6Added Stocks
The rebalancing has added 33 new stocks. In the table below, T is the current rebalancing date (24-Sep-2018), while T-1 is the previous rebalancing date (19-Mar-2018). Vol(T-1) and Vol(T) are the annualized volatilities computed over 500 business days ending, respectively, on 17-Sep-2018 and 12-Mar-2018. The average dailyvolumes ADV(T-1) and ADV(T), expressed in mln USD, are computed over 125 business days ending on the same dates as before, with the relative ranking overthe benchmark S&P IFCI Index NR. WW(T) is the stock weight at the current rebalancing date. Finally, the column Reason Excl. details the reasons of exclusionat the previous rebalancing.
Vol ADVName Sector Country WW(T) T-1 T T-1 T Reason Exclusion
51JOB INCO. Industrials CN 0.45% 33.15% 39.16% 12.78(484) 28.33(228) Excl. LiquidityALROSA Materials RU 0.58% 35.70% 34.17% 19.67(359) 20.35(314) Excl. Minimum VarianceAMERICA MOVIL SAB DE CV Communication Services MX 0.15% 36.00% 30.82% 45.69(135) 35.43(171) Excl. Minimum VarianceASE TCHHD.CTD. IT TW 0.49% Inf% 13.12% -Inf(2844) -Inf(2846) NewInBencharkBAJAJ AUTO LTD. C.Discretionary IN 0.50% 22.70% 23.99% 15.60(425) 25.41(252) Excl. LiquidityCHINA RAILWAY GROUP LTD. Industrials CN 0.70% 30.18% 24.73% 17.08(395) 16.03(389) Excl. Minimum VarianceCIPLA LTD. HealthCare IN 0.90% 27.06% 27.32% 13.91(460) 22.66(284) Excl. LiquidityDAELIM INDUSTRIAL CTD. Industrials KR 0.19% 33.85% 30.39% 13.48(470) 17.21(367) Excl. LiquidityEQUATORIAL ENERGIA SA Utilities BR 0.48% 30.83% 29.23% 19.72(358) 18.52(343) Excl. Minimum VarianceGAZPROM OAO Energy RU 1.11% 30.41% 25.51% 68.58(83) 52.85(105) Excl. Minimum VarianceHYUNDAI ELEVATOR CO.LTD. Industrials KR 0.58% 40.32% 55.66% -Inf(2609) 104.28(51) Excl. MarketCapHYUNDAI GLOVIS CTD. Industrials KR 0.75% 29.67% 32.17% 13.24(477) 22.98(280) Excl. LiquidityINTERGLOBE AVIATION Industrials IN 0.68% 38.45% 34.99% 11.94(502) -Inf(2462) Excl. LiquidityLAND AND HOUSES PCL. Real Estate TH 1.37% 23.86% 23.77% -Inf(2227) 18.70(339) Excl. MarketCapLG DISPLAY COMPANY LTD. IT KR 0.52% 35.36% 34.17% 85.59(61) 47.59(121) InPortfolioMAGNIT OPEN PJSC C.Staples RU 0.13% 40.14% 36.80% 38.92(171) 22.71(283) Excl. Minimum VarianceMEDY TOX INCO. HealthCare KR 0.46% 44.02% 44.47% 20.28(346) 21.10(302) Excl. Minimum VarianceMOBILE TELESYSTEMS OJSC Communication Services RU 0.90% 38.20% 35.66% 44.68(145) 26.92(241) Excl. Minimum VarianceNAVER CORPORATION Communication Services KR 0.18% 32.80% 29.96% 76.15(74) 58.82(92) Excl. Minimum VarianceNCSOFT CORP. Communication Services KR 0.53% 42.31% 40.70% 82.98(63) 36.92(162) Excl. Minimum VarianceOJSC MMC NORILSK NICKEL Materials RU 0.46% 31.06% 31.18% 40.75(163) 31.32(196) Excl. Minimum VariancePETRONAS CHEMS.GP.BHD. Materials MY 2.76% 19.30% 15.29% 16.71(404) 16.67(376) Excl. LiquidityPJSC LUKOIL 144A ADR Energy RU 0.84% 32.25% 26.62% 38.53(173) 47.08(125) Excl. Minimum VariancePOSTAL SAVINGS BOC.CTD. Financials CN 0.51% 18.50% 24.17% 25.80(265) 21.70(297) Excl. Missing Price DataPTT EXP.& PRDN.PCL. Energy TH 0.34% 30.61% 26.60% 41.52(157) 55.05(96) Excl. Minimum VarianceQATAR NATIONAL BANK QPSC Financials QA 1.66% 27.87% 30.54% 13.21(478) 24.03(269) Excl. LiquidityROSNEFT OIL OJSC Energy RU 1.09% 35.09% 28.30% 28.93(237) 40.87(147) Excl. Minimum VarianceS-OIL CORP. Energy KR 0.90% 33.27% 28.84% 30.72(222) 26.03(249) Excl. Minimum VarianceSK INNOVATION CTD. Energy KR 0.41% 34.23% 28.61% 45.16(141) 39.83(150) Excl. Minimum VarianceTECH MAHINDRA LTD. IT IN 0.52% 30.61% 29.30% 28.67(240) 35.79(168) InPortfolioWAL MART DE MEX.SDC. C.Staples MX 0.80% 32.36% 30.38% 36.05(181) 43.25(137) Excl. Minimum VarianceWIPRO LTD. IT IN 1.29% 22.08% 21.22% 14.50(444) 15.88(395) Excl. LiquidityX5 RETAIL GROUP NV C.Staples RU 0.31% 40.09% 38.52% 22.76(307) 21.68(298) Excl. Minimum Variance
FO
RP
RO
FE
SS
ION
AL
CL
IEN
TS
US
EO
NLY
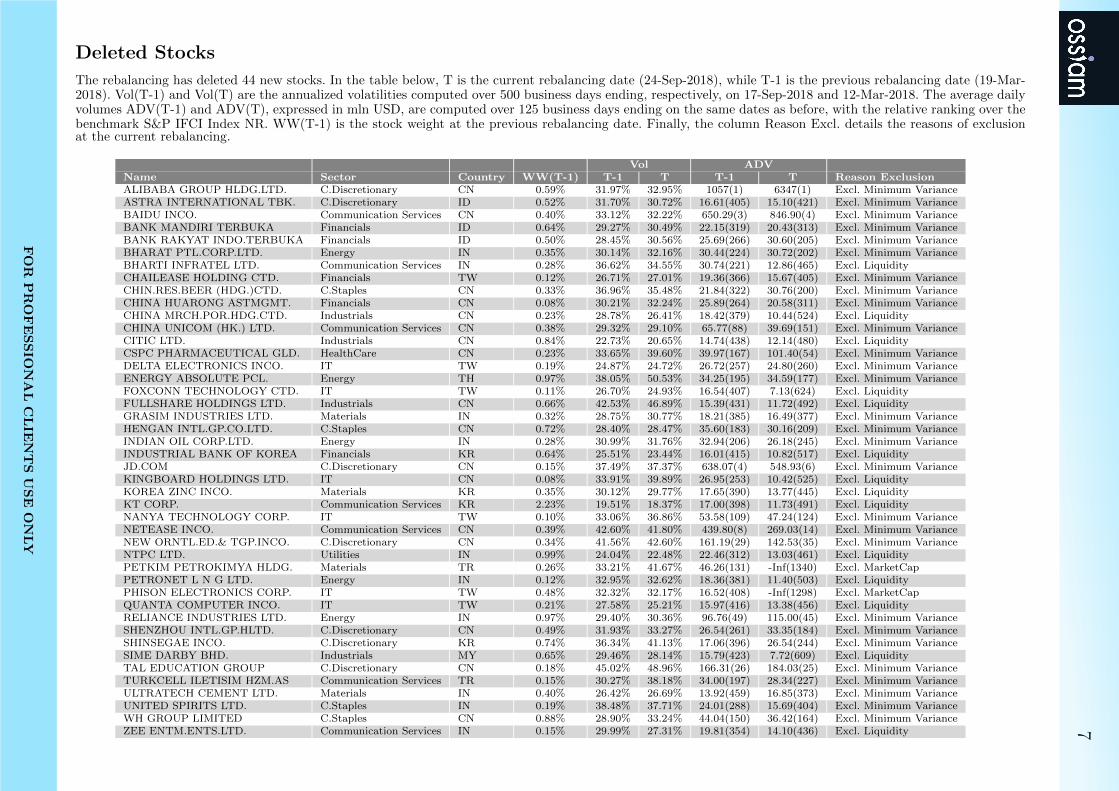
7Deleted Stocks
The rebalancing has deleted 44 new stocks. In the table below, T is the current rebalancing date (24-Sep-2018), while T-1 is the previous rebalancing date (19-Mar-2018). Vol(T-1) and Vol(T) are the annualized volatilities computed over 500 business days ending, respectively, on 17-Sep-2018 and 12-Mar-2018. The average dailyvolumes ADV(T-1) and ADV(T), expressed in mln USD, are computed over 125 business days ending on the same dates as before, with the relative ranking over thebenchmark S&P IFCI Index NR. WW(T-1) is the stock weight at the previous rebalancing date. Finally, the column Reason Excl. details the reasons of exclusionat the current rebalancing.
Vol ADVName Sector Country WW(T-1) T-1 T T-1 T Reason ExclusionALIBABA GROUP HLDG.LTD. C.Discretionary CN 0.59% 31.97% 32.95% 1057(1) 6347(1) Excl. Minimum VarianceASTRA INTERNATIONAL TBK. C.Discretionary ID 0.52% 31.70% 30.72% 16.61(405) 15.10(421) Excl. Minimum VarianceBAIDU INCO. Communication Services CN 0.40% 33.12% 32.22% 650.29(3) 846.90(4) Excl. Minimum VarianceBANK MANDIRI TERBUKA Financials ID 0.64% 29.27% 30.49% 22.15(319) 20.43(313) Excl. Minimum VarianceBANK RAKYAT INDO.TERBUKA Financials ID 0.50% 28.45% 30.56% 25.69(266) 30.60(205) Excl. Minimum VarianceBHARAT PTL.CORP.LTD. Energy IN 0.35% 30.14% 32.16% 30.44(224) 30.72(202) Excl. Minimum VarianceBHARTI INFRATEL LTD. Communication Services IN 0.28% 36.62% 34.55% 30.74(221) 12.86(465) Excl. LiquidityCHAILEASE HOLDING CTD. Financials TW 0.12% 26.71% 27.01% 19.36(366) 15.67(405) Excl. Minimum VarianceCHIN.RES.BEER (HDG.)CTD. C.Staples CN 0.33% 36.96% 35.48% 21.84(322) 30.76(200) Excl. Minimum VarianceCHINA HUARONG ASTMGMT. Financials CN 0.08% 30.21% 32.24% 25.89(264) 20.58(311) Excl. Minimum VarianceCHINA MRCH.POR.HDG.CTD. Industrials CN 0.23% 28.78% 26.41% 18.42(379) 10.44(524) Excl. LiquidityCHINA UNICOM (HK.) LTD. Communication Services CN 0.38% 29.32% 29.10% 65.77(88) 39.69(151) Excl. Minimum VarianceCITIC LTD. Industrials CN 0.84% 22.73% 20.65% 14.74(438) 12.14(480) Excl. LiquidityCSPC PHARMACEUTICAL GLD. HealthCare CN 0.23% 33.65% 39.60% 39.97(167) 101.40(54) Excl. Minimum VarianceDELTA ELECTRONICS INCO. IT TW 0.19% 24.87% 24.72% 26.72(257) 24.80(260) Excl. Minimum VarianceENERGY ABSOLUTE PCL. Energy TH 0.97% 38.05% 50.53% 34.25(195) 34.59(177) Excl. Minimum VarianceFOXCONN TECHNOLOGY CTD. IT TW 0.11% 26.70% 24.93% 16.54(407) 7.13(624) Excl. LiquidityFULLSHARE HOLDINGS LTD. Industrials CN 0.66% 42.53% 46.89% 15.39(431) 11.72(492) Excl. LiquidityGRASIM INDUSTRIES LTD. Materials IN 0.32% 28.75% 30.77% 18.21(385) 16.49(377) Excl. Minimum VarianceHENGAN INTL.GP.CO.LTD. C.Staples CN 0.72% 28.40% 28.47% 35.60(183) 30.16(209) Excl. Minimum VarianceINDIAN OIL CORP.LTD. Energy IN 0.28% 30.99% 31.76% 32.94(206) 26.18(245) Excl. Minimum VarianceINDUSTRIAL BANK OF KOREA Financials KR 0.64% 25.51% 23.44% 16.01(415) 10.82(517) Excl. LiquidityJD.COM C.Discretionary CN 0.15% 37.49% 37.37% 638.07(4) 548.93(6) Excl. Minimum VarianceKINGBOARD HOLDINGS LTD. IT CN 0.08% 33.91% 39.89% 26.95(253) 10.42(525) Excl. LiquidityKOREA ZINC INCO. Materials KR 0.35% 30.12% 29.77% 17.65(390) 13.77(445) Excl. LiquidityKT CORP. Communication Services KR 2.23% 19.51% 18.37% 17.00(398) 11.73(491) Excl. LiquidityNANYA TECHNOLOGY CORP. IT TW 0.10% 33.06% 36.86% 53.58(109) 47.24(124) Excl. Minimum VarianceNETEASE INCO. Communication Services CN 0.39% 42.60% 41.80% 439.80(8) 269.03(14) Excl. Minimum VarianceNEW ORNTL.ED.& TGP.INCO. C.Discretionary CN 0.34% 41.56% 42.60% 161.19(29) 142.53(35) Excl. Minimum VarianceNTPC LTD. Utilities IN 0.99% 24.04% 22.48% 22.46(312) 13.03(461) Excl. LiquidityPETKIM PETROKIMYA HLDG. Materials TR 0.26% 33.21% 41.67% 46.26(131) -Inf(1340) Excl. MarketCapPETRONET L N G LTD. Energy IN 0.12% 32.95% 32.62% 18.36(381) 11.40(503) Excl. LiquidityPHISON ELECTRONICS CORP. IT TW 0.48% 32.32% 32.17% 16.52(408) -Inf(1298) Excl. MarketCapQUANTA COMPUTER INCO. IT TW 0.21% 27.58% 25.21% 15.97(416) 13.38(456) Excl. LiquidityRELIANCE INDUSTRIES LTD. Energy IN 0.97% 29.40% 30.36% 96.76(49) 115.00(45) Excl. Minimum VarianceSHENZHOU INTL.GP.HLTD. C.Discretionary CN 0.49% 31.93% 33.27% 26.54(261) 33.35(184) Excl. Minimum VarianceSHINSEGAE INCO. C.Discretionary KR 0.74% 36.34% 41.13% 17.06(396) 26.54(244) Excl. Minimum VarianceSIME DARBY BHD. Industrials MY 0.65% 29.46% 28.14% 15.79(423) 7.72(609) Excl. LiquidityTAL EDUCATION GROUP C.Discretionary CN 0.18% 45.02% 48.96% 166.31(26) 184.03(25) Excl. Minimum VarianceTURKCELL ILETISIM HZM.AS Communication Services TR 0.15% 30.27% 38.18% 34.00(197) 28.34(227) Excl. Minimum VarianceULTRATECH CEMENT LTD. Materials IN 0.40% 26.42% 26.69% 13.92(459) 16.85(373) Excl. Minimum VarianceUNITED SPIRITS LTD. C.Staples IN 0.19% 38.48% 37.71% 24.01(288) 15.69(404) Excl. Minimum VarianceWH GROUP LIMITED C.Staples CN 0.88% 28.90% 33.24% 44.04(150) 36.42(164) Excl. Minimum VarianceZEE ENTM.ENTS.LTD. Communication Services IN 0.15% 29.99% 27.31% 19.81(354) 14.10(436) Excl. Liquidity
FO
RP
RO
FE
SS
ION
AL
CL
IEN
TS
US
EO
NLY
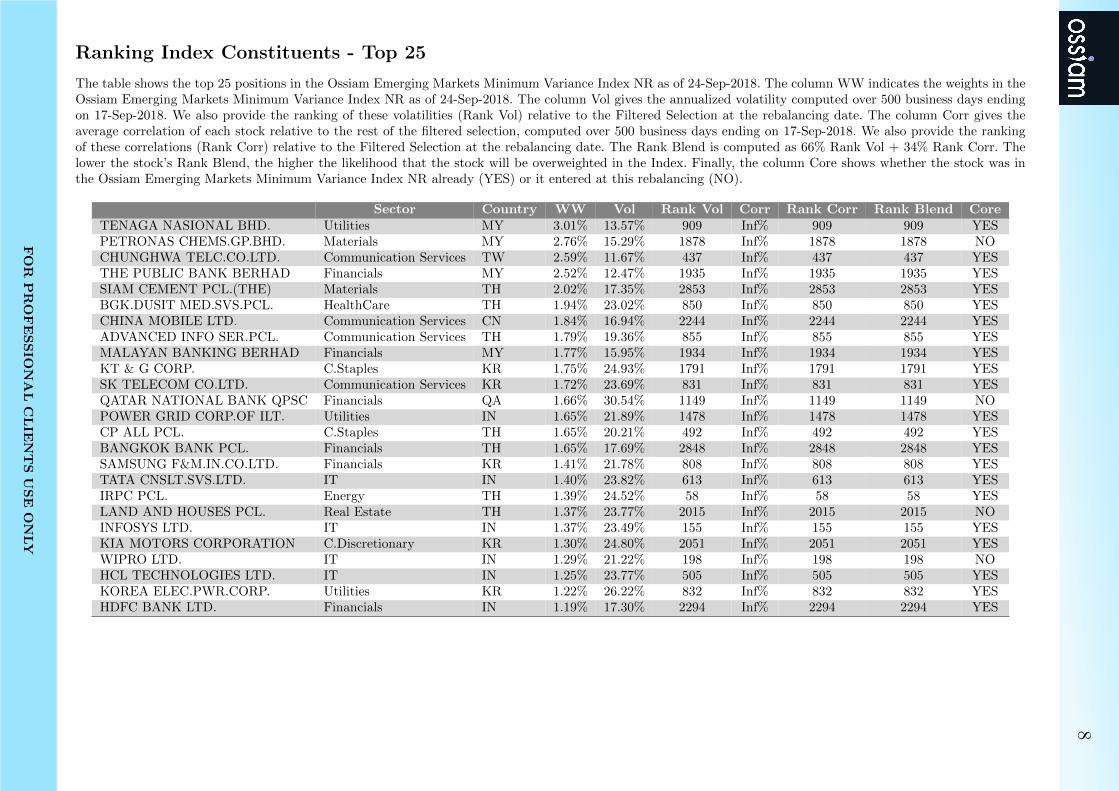
8Ranking Index Constituents - Top 25
The table shows the top 25 positions in the Ossiam Emerging Markets Minimum Variance Index NR as of 24-Sep-2018. The column WW indicates the weights in theOssiam Emerging Markets Minimum Variance Index NR as of 24-Sep-2018. The column Vol gives the annualized volatility computed over 500 business days endingon 17-Sep-2018. We also provide the ranking of these volatilities (Rank Vol) relative to the Filtered Selection at the rebalancing date. The column Corr gives theaverage correlation of each stock relative to the rest of the filtered selection, computed over 500 business days ending on 17-Sep-2018. We also provide the rankingof these correlations (Rank Corr) relative to the Filtered Selection at the rebalancing date. The Rank Blend is computed as 66% Rank Vol + 34% Rank Corr. Thelower the stock’s Rank Blend, the higher the likelihood that the stock will be overweighted in the Index. Finally, the column Core shows whether the stock was inthe Ossiam Emerging Markets Minimum Variance Index NR already (YES) or it entered at this rebalancing (NO).
Sector Country WW Vol Rank Vol Corr Rank Corr Rank Blend CoreTENAGA NASIONAL BHD. Utilities MY 3.01% 13.57% 909 Inf% 909 909 YESPETRONAS CHEMS.GP.BHD. Materials MY 2.76% 15.29% 1878 Inf% 1878 1878 NOCHUNGHWA TELC.CO.LTD. Communication Services TW 2.59% 11.67% 437 Inf% 437 437 YESTHE PUBLIC BANK BERHAD Financials MY 2.52% 12.47% 1935 Inf% 1935 1935 YESSIAM CEMENT PCL.(THE) Materials TH 2.02% 17.35% 2853 Inf% 2853 2853 YESBGK.DUSIT MED.SVS.PCL. HealthCare TH 1.94% 23.02% 850 Inf% 850 850 YESCHINA MOBILE LTD. Communication Services CN 1.84% 16.94% 2244 Inf% 2244 2244 YESADVANCED INFO SER.PCL. Communication Services TH 1.79% 19.36% 855 Inf% 855 855 YESMALAYAN BANKING BERHAD Financials MY 1.77% 15.95% 1934 Inf% 1934 1934 YESKT & G CORP. C.Staples KR 1.75% 24.93% 1791 Inf% 1791 1791 YESSK TELECOM CO.LTD. Communication Services KR 1.72% 23.69% 831 Inf% 831 831 YESQATAR NATIONAL BANK QPSC Financials QA 1.66% 30.54% 1149 Inf% 1149 1149 NOPOWER GRID CORP.OF ILT. Utilities IN 1.65% 21.89% 1478 Inf% 1478 1478 YESCP ALL PCL. C.Staples TH 1.65% 20.21% 492 Inf% 492 492 YESBANGKOK BANK PCL. Financials TH 1.65% 17.69% 2848 Inf% 2848 2848 YESSAMSUNG F&M.IN.CO.LTD. Financials KR 1.41% 21.78% 808 Inf% 808 808 YESTATA CNSLT.SVS.LTD. IT IN 1.40% 23.82% 613 Inf% 613 613 YESIRPC PCL. Energy TH 1.39% 24.52% 58 Inf% 58 58 YESLAND AND HOUSES PCL. Real Estate TH 1.37% 23.77% 2015 Inf% 2015 2015 NOINFOSYS LTD. IT IN 1.37% 23.49% 155 Inf% 155 155 YESKIA MOTORS CORPORATION C.Discretionary KR 1.30% 24.80% 2051 Inf% 2051 2051 YESWIPRO LTD. IT IN 1.29% 21.22% 198 Inf% 198 198 NOHCL TECHNOLOGIES LTD. IT IN 1.25% 23.77% 505 Inf% 505 505 YESKOREA ELEC.PWR.CORP. Utilities KR 1.22% 26.22% 832 Inf% 832 832 YESHDFC BANK LTD. Financials IN 1.19% 17.30% 2294 Inf% 2294 2294 YES
FO
RP
RO
FE
SS
ION
AL
CL
IEN
TS
US
EO
NLY
9
DISCLAIMERS
This document is of a commercial and not of a regulatory nature.
Ossiam, a subsidiary of Natixis Investment Managers, is a French asset manager authorized by the Au-torite des Marches Financiers (Agreement No. GP-10000016). Although information contained herein is fromsources believed to be reliable, Ossiam makes no representation or warranty regarding the accuracy of anyinformation of which it is not the source. The information presented in this document is based on marketdata at a given moment and may change from time to time.
This material has been prepared solely for informational purposes only and it is not intended to be and shouldnot be considered as an offer, or a solicitation of an offer, or an invitation or a personal recommendation tobuy or sell participating shares in any Ossiam Fund, or any security or financial instrument, or to participatein any investment strategy, directly or indirectly. It is intended for use only by those recipients to whom it ismade directly available by Ossiam. Ossiam will not treat recipients of this material as its clients by virtue oftheir receiving this material.
This material reflects the views and opinions of the individual authors at this date and in no way the officialposition or advices of any kind of these authors or of Ossiam and thus does not engage the responsibility ofOssiam nor of any of its officers or employees. Past performance is not a guide to future performance. Anyopinions expressed herein are statements of our judgment on this date and are subject to change withoutnotice. Ossiam assume no fiduciary responsibility or liability for any consequences, financial or otherwise,arising from, an investment in any security or financial instrument described herein or in any other security,or from the implementation of any investment strategy. This information contained herein is not intended fordistribution to, or use by, any person or entity in any country or jurisdiction where to do so would be contraryto law or regulation or which would subject Ossiam to any registration requirements in these jurisdictions.The risks associated with the Fund and the Index are detailed in the “General Risk Considerations’ sectionof the Prospectus, available in English on www.ossiam.com. Investments decision should only be made on thebasis of the Prospectus. Investors should also be well informed about the main characteristics of the Index(number of stocks, sector and or country breakdown, past evolution...) in order to have an overview of therisks and opportunities related to an exposure to the Index.
Ossiam Emerging Markets Minimum Variance Index NR (the Index) is the exclusive property of Ossiam,which has contracted with Standard & Poor’s Financial Services LLC (S&P) to maintain and calculate theIndex. Standard & Poor’s R© and S&P R© are registered trademarks of Standard & Poor’s Financial ServicesLLC - Calculated by S&P Custom Indices- and its related stylized mark(s) are service marks of Standard &Poor’s Financial Services LLC and have been licensed for use by Ossiam. S&P and its affiliates shall have noliability for any errors or omissions in calculating the Index. OSSIAM EMERGING MARKETS MINIMUMVARIANCE NR UCITS ETF is not sponsored, endorsed, sold or promoted by S&P, its affiliates or theirthird party licensors and neither S&P, its affiliates nor their third party licensors make any representationregarding the advisability of investing in OSSIAM EMERGING MARKETS MINIMUM VARIANCE NRUCITS ETF.In order to minimize any potential for conflicts caused by the fact that Ossiam determines the weight ofthe index components at each rebalancing date (and acts as asset manager, Ossiam has retained unaffiliatedthird parties to calculate and publish index, namely S&P.
This material may not be distributed, published, or reproduced, in whole or in part.
FOR PROFESSIONAL CLIENTS USE ONLY