Embed Size (px)
Citation preview
OSS Watch National Software Survey
2010
Jane Alexen Shuyska&
OSS Watch
Acknowledgements
The survey was administered and the reportwritten by Jane Alexen Shuyska. The executivesummary was prepared and written by the OSSWatch team.
We would like to thank the IT directors of the FEand HE institutions, who took the time to respondto the survey and send feedback to us. Also wewould like to thank all the contributors to thebackground survey, Peter Tinson and LauraBeard (UCISA) for their essential guidance withidentifying the recipients of the survey. A furtherthanks to Jean Davis for assistance withadministration and logistics.
Publication information
This survey report is licensed under the CreativeCommons Attribution-ShareAlike 2.0 England &Wales licence.
OSS Watch National Software Survey 2010Jane Alexen Shuyska & OSS Watch
First edition, published March 2011.
Contact OSS Watch
OSS Watch Research Technologies Service
Oxford University Computing Services13 Banbury RoadOxford, OX2 6NNUnited Kingdom
Email: [email protected]
Tel: +44 (0) 1865 283416
Website: http://www.oss-watch.ac.uk
2
Table of Contents
Introduction _________________________________________________________ 3
About OSS Watch _____________________________________________________ 3
Executive summary ___________________________________________________ 4
Study design _________________________________________________________ 6
Survey section 1: General information about institutions______________________ 8
Survey section 2: ICT policy and procurement practice ______________________ 10
Survey section 3: Software running on servers _____________________________ 16
Survey section 4: Software running on desktops____________________________ 27
Survey section 5: Comments by survey respondents ________________________ 35
Appendix 1: Online questionnaire _______________________________________ 37
Appendix 2: Summaries of the data______________________________________ 46
3
IntroductionThis report presents the results of the OSS WatchNational Software Survey 2010. The surveystudies the status of open and closed software inFurther Education (FE) and Higher Education(HE) institutions in the UK. It is the fourth in a rowof biennial national surveys funded by the JointInformation Systems Committee (JISC).
The report opens with a summary of the findingsfollowed by a section on study design andmethodology. The main part of the report presentsthe data in detail and is split into five subsections,each representing one group of questions in theonline questionnaire:
General information about institutions
ICT policy and procurement practice
Software running on servers
Software running on desktops
Comments by survey respondents
Finally an Appendix is included containing a copyof the questionnaire and a summary of the surveydata.
About OSS WatchOSS Watch provides unbiased advice andguidance on the use, development, and licensingof free and open source software. OSS Watch isfunded by the JISC and its services are availablefree-of-charge to UK Higher and FurtherEducation. If you want to find out more aboutopen source software, we're the people to ask.OSS Watch is based at the Oxford UniversityComputing Services.
Here are some things we can help with:
building new or engaging with existingdevelopment communities (for sustainability)
software licence advice
engaging with commercial companies (e.g.software procurement)
finding routes to exploit your outputscommercially (e.g. institutional technologytransfer units)
exploring options for sustainability of softwaredevelopment activities
evaluating the best software solution (eitheropen source or proprietary – we are non-advocacy)

4
Executive summaryIn late 2010 OSS Watch conducted their 4th bi-annual survey of Higher and Further Education ITdirectors’ attitudes towards, and adoption of, opensource software.
In terms of procurement policy we see an ever-increasing awareness of the possibility of usingopen source software. There has been anotherbig increase in the number of institutions thatinclude the consideration of open source in theirprocurement policies, both in Higher Education(HE) and Further Education (FE) (figure 6). Thiswill help creating a more level playing field forsuppliers of open source software.
On the other hand, there is still a relatively largenumber of institutions that indicate they preferclosed source over open source (35% of FE and15% of HE respondents, figure 5). We suspectthis is based on a continued lack of understandingabout open source that needs to be addressed.
The essential differences between open andclosed source are its development and licensingmodel. There is no reason why an open sourcesolution could not have a very strong backing of acommercial entity and open source suppliers arecapable of providing their software with terms verysimilar to those of suppliers of closed sourcesoftware. Suppliers such as Red Hat havedemonstrated this over many years. It may be truethat some suppliers of open source do not matchup to the requirements of a procurement exercisein a major institution, but this holds just as true forclosed source software suppliers. The suitability ofopen source solutions and suppliers needs to beevaluated on a case by case basis. Having apolicy that prefers one model over another, bydefault, is not helpful in this respect.
With respect to the use of open source software ininstitutions, there is another reported increase,both on servers and on desktops. This waspredicted by responses in the 2008 survey. ForFE, the increase is a little less than predicted,whereas for HE, the increase is a little more thanpredicted (figure 15).
For the first time we conducted a separatebackground survey. We asked a broaderspectrum of staff at HE and FE institutions aboutopen source software. Respondents were giventhe option of answering the questions for thewhole institution or for their department only.
There were a few differences in the responsesbetween the regular survey and the backgroundsurvey. For example, when asked about policyrelating to open and closed source software, therewas a less pronounced preference for closed
source software and a more pronouncedpreference for open source software. This wasespecially true at the departmental level.
But one of the most striking results of thebackground survey was the responses to thequestion of whether they contributed to opensource software.
A much higher proportion of the respondentsindicated that they contribute to open sourcesoftware compared to the main survey (figure 8).This is also especially true on the departmentallevel. When IT directors are unaware of theirstaff’s contributions, they have no knowledge of orcontrol over these IP assets generated in theirinstitution. This disconnect needs to be addressedin order to ensure copyright is being correctlymanaged in these contributions.
While there are more contributions than directorsknow about, there are fewer policies thatencourage and manage these contributions. Thesurvey respondents indicate that engagement withopen source is now mentioned in fewer jobdescriptions of IT staff than was the case in theprevious survey in 2008 (figure 13 and figure 27).Most report that this should be done in theemployee’s own time, which means it will not bedone in most cases; there will just be localmodifications.
This indicates a lack of policy towards managingopen source engagement. How do we know thestaff member is allowed to contribute to an opensource project? Who owns the copyright in thesecases? Is the staff member liable when there is adispute? Lack of a managed contribution policycan expose institutions to legal risk.
On the other hand, respondents are expectingmore deployments of open source software ontheir IT infrastructure (figures 16 and 30). Thismakes it even more urgent that engagement withopen source projects is addressed by the ITmanagement. This needs to be done both in thejob description of the IT staff as well as in the day-to-day management of their work.
For efficient and effective management of opensource IT systems it is important that the staffinvolved with the running and maintenance of thesoftware can engage with and contribute to thesoftware project easily and that this is in factencouraged to gain the most benefit out of theproject.
Respondents indicate that several IT systems are
5
due for replacement in close to 50% of institutions(figure 25 and 34). Given the ongoing increase ininstitutional interest in and use of open sourcesoftware alongside the significant open sourceemphasis of government policy on softwareprocurement in the public sector it is crucial thatthe question of how to assess open sourcesoftware in a procurement process is addressed.
The survey examined the criteria that respondentsfind most important when procuring software. Thenumber one issue is the Total Cost of Ownership(TCO) of solutions.
However, when asked for the common reasonsfor rejecting open source software in procurement,most of the top criteria are not related to TCO.Issues that heavily influence TCO, such asmigration costs, do not appear in the top 5.
One of the top five reasons provided was'interoperability and migration problems'.However, the effort of migration to open source iscomparable to, if not less than the effort ofmigrating to another closed source solution. Wetherefore suggest that these respondents werelikely to reject migrating to a new closed sourcesolution for the same reason. Other reasons givenare largely issues of education and supplieravailability.
All in all, this survey supports the idea that opensource software is still on the rise in the UK higherand Further education sector. A number of issuesneed to be addressed, such as providing a meansto perform an accurate and consistent Total Costof Ownership calculation for software, both openand closed source. The survey shows that there isnow a real opportunity for open source suppliersto build offerings suitable for the sector. However,it also shows that institutions need to gain anunderstanding of how to evaluate open sourceproducts and suppliers and how to manage theirengagement with those suppliers or with theprojects themselves.
OSS Watch is continuing its work in these areas.We are developing a Software SustainabilityMaturity Model
1and a process for evaluating the
Total Cost of Ownership of procurement solutions.Developments like these will continue to helpinstitutions assessing open source software andcreate a more level playing field.
1 http://www.oss-watch.ac.uk/resources/ssmm.xml

6
Study designThis year’s study was designed around a mainsurvey and a subsidiary ‘background’ surveywhich ran concurrently, but had different targetpopulations. The main survey repeated previousOSS Watch surveys and was aimed at ITdirectors in FE and HE institutions. The subsidiarysurvey was aimed at providing a broader view ofthe issues surrounding open source software andwas conducted with an expanded sample. Bothsurveys were conducted online usingSurveyMonkey
2.
The main survey
The 2010 OSS Watch National Software Surveyclosely followed the design of the previous surveyalthough the questionnaire was modified slightlyfollowing recommendations in the report on the2008 survey
3. The following modifications were
made:
The respondents were given the option toselect their type of institution more flexibly byallowing them to indicate that their institutionfalls into both the FE and HE sectors.
Questions asking the IT directors to estimatethe number of students and academic staff intheir institution were removed.
Apart from these changes, only minor alterationswere made to the questionnaire and therefore thetwo surveys are overall comparable and provide agood insight into the changes in the status of openand closed software since 2008.
Response rates
A list of FE and HE institutions was compiled onthe basis of a list provided by UCISA
4. This was
supplemented by a list created in the previousyears in order to achieve a full list of institutions,which was as comprehensive as possible. A totalof 619 IT directors (or equivalent positions) of HEand FE institutions in the UK were contacted byletter. A subsequent email containing an invitationto participate in the survey was sent out within aweek. Two further reminder emails to those whohad not yet responded were sent out with aweek’s interval in order to achieve a maximumresponse rate.
The overall response rate for the survey was 18%.
2 http://www.surveymonkey.net/3 http://www.oss-watch.ac.uk/studies/survey2008.pdf4 http://www.ucisa.ac.uk/
However, 120 of the email addresses were nolonger correct suggesting that a number of therecipients had ceased to hold the IT directorpositions or that the email addresses hadchanged for other reasons. The actual responserate is therefore slightly higher.
Not all respondents completed the entire survey;the numbers used for the data analysis aretherefore the following:
3 respondents were excluded on the basis ofthe type of institution they indicated, which didnot fit either an FE or an HE profile
a further 8 respondents quit the survey afteranswering only the first 3 questions - they arealso excluded from the data set
17 respondents quit the survey afterresponding to question 8 - thus they haveanswered the questions about institutionalpolicy - their responses are included inquestions 1-8, thereafter excluded.
5 respondents quit the survey after answeringQ22 - thus they have answered all thequestions about server software - theirresponses are included in questions 1-22,thereafter excluded.
Therefore the response counts are as follows:
Qs 1-8: n=101
Qs 8-22: n=84
Qs 22-31: n=79
Comparisons with the 2008 survey
The 2008 survey had different response/non-response patterns from the current one, whichmust be taken into consideration when comparingthe results. In the present survey most questionswere mandatory and attrition happened betweenpages of the survey. In the previous survey fewerquestions were mandatory wherefore the non-response patterns are different. The 2008 reportindicated in the reporting of every questionwhether the whole pool of respondents was takeninto account or only the ones who had answeredthe particular question.
7
To allow for comparison the following measureswere taken:
In the cases where the 2008 non-responserate is below 6% it will be ignored (this will beindicated in the text).
In the cases where there is a significant levelof non-responses in the previous survey, the2008 results will be recalculated to exclude thenon-respondents in order to provide a moretrue comparison to the 2010 data.
Background survey
The background survey was a new addition to thestudy and was aimed at providing a broaderpicture of the issues concerning open and closedsource software in FE and HE institutions. Thesample for this survey was drawn fromprofessionals, mainly in the HE sector, who areinvolved in ICT in their institution and who haveexpressed an interest in open source software bysubscribing to the OSS Watch mailing list. Thissurvey was also announced on the OSS Watchblog inviting interested parties to take part.
The total number of respondents to this surveywas 153. 15 respondents were excluded on thebasis of the type of institution they indicated,which did not fit either an FE or an HE profile. Thenumber of respondents used for the analysis wasthere 138.
The background survey was similar to the mainsurvey and the majority of the questions wereidentical. However, to provide a better context forthe broader sample of respondents, therespondents were asked to provide additionalinformation about their roles in the institutions.
The respondents represent a mix of IT managers(33), other management staff (13), IT andsoftware development staff (14), library staff (13),learning technologists and e-learning staff (11),teaching and other academic staff and students(23), IT directors (8), support and administrationstaff (7) and other types of staff who have aninterest in the institutional IT systems (16). Most ofthe respondents to the background survey (71%)reported being part of the support staff rather thanteaching staff at their institution.
It was anticipated that some of the respondents tothe background survey may not have fullknowledge about the central IT provision orpolicies in their institution. Therefore they weregiven the option to respond about theirdepartmental policies and provision instead. 54%(74) chose to answer the survey in light of centralICT provision in their institutions and 46% (64)only had knowledge about departmentalconditions. When comparing the results of themain survey to the background survey it will beindicated whether the comparison is made withthe responses about central or departmentalprovision (or both in case there is little differencebetween the two categories).
In contrast to the main survey fewer questions inthe background survey were mandatory in orderto allow for a broader mix of staff roles ofrespondents who may wish to participate in thesurvey, but may only have partial knowledge ofthe issues covered. Therefore the responsepatterns in the background survey are alsodifferent with large non-response numbers in theoptional questions. Where comparisons are madeto the background survey, the number ofrespondents is indicated following the notation: (n= number of respondents).
8
Survey section 1: General information about institutions
Q1: Type of institution
Q1. What type is your institution?
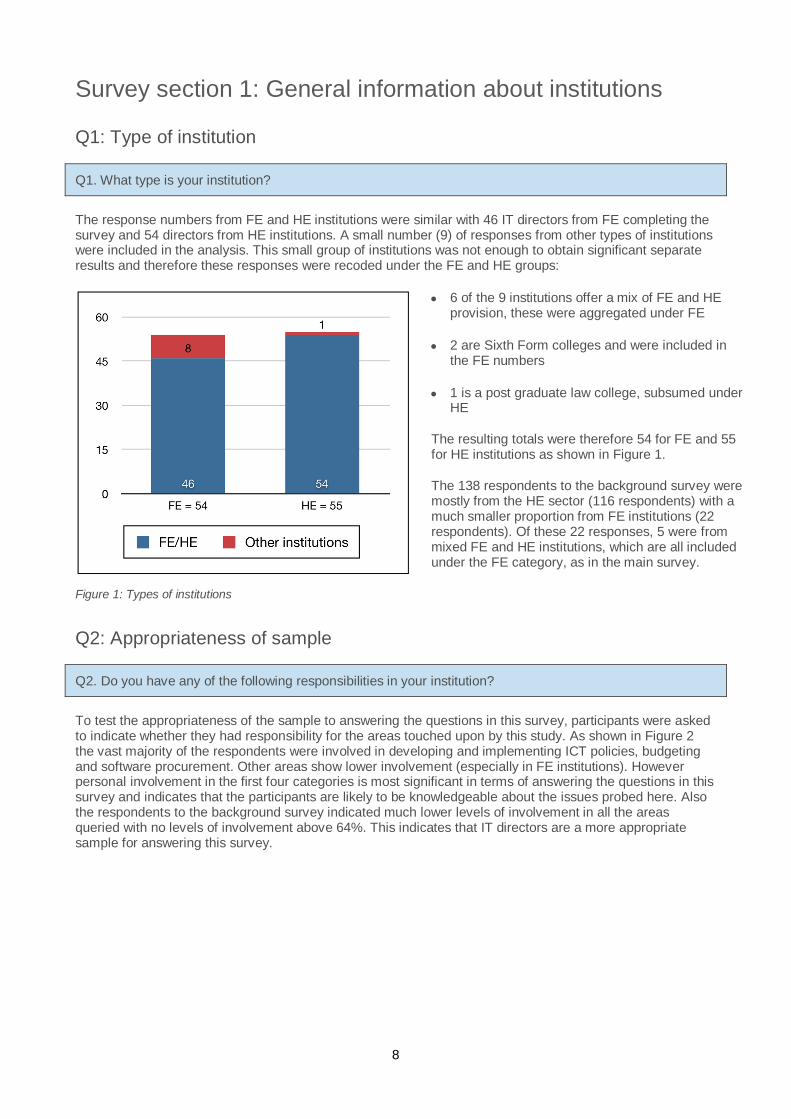
The response numbers from FE and HE institutions were similar with 46 IT directors from FE completing thesurvey and 54 directors from HE institutions. A small number (9) of responses from other types of institutionswere included in the analysis. This small group of institutions was not enough to obtain significant separateresults and therefore these responses were recoded under the FE and HE groups:
Figure 1: Types of institutions
6 of the 9 institutions offer a mix of FE and HEprovision, these were aggregated under FE
2 are Sixth Form colleges and were included inthe FE numbers
1 is a post graduate law college, subsumed underHE
The resulting totals were therefore 54 for FE and 55for HE institutions as shown in Figure 1.
The 138 respondents to the background survey weremostly from the HE sector (116 respondents) with amuch smaller proportion from FE institutions (22respondents). Of these 22 responses, 5 were frommixed FE and HE institutions, which are all includedunder the FE category, as in the main survey.
Q2: Appropriateness of sample
Q2. Do you have any of the following responsibilities in your institution?
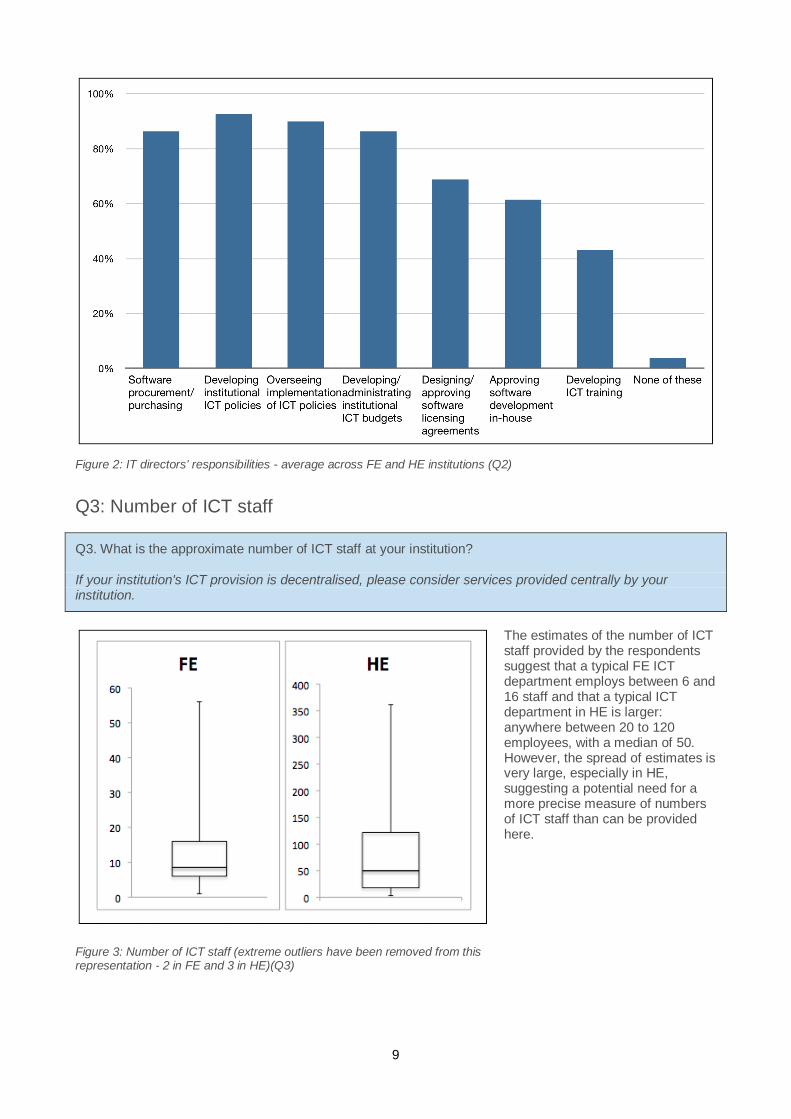
To test the appropriateness of the sample to answering the questions in this survey, participants were askedto indicate whether they had responsibility for the areas touched upon by this study. As shown in Figure 2the vast majority of the respondents were involved in developing and implementing ICT policies, budgetingand software procurement. Other areas show lower involvement (especially in FE institutions). Howeverpersonal involvement in the first four categories is most significant in terms of answering the questions in thissurvey and indicates that the participants are likely to be knowledgeable about the issues probed here. Alsothe respondents to the background survey indicated much lower levels of involvement in all the areasqueried with no levels of involvement above 64%. This indicates that IT directors are a more appropriatesample for answering this survey.
9
Figure 2: IT directors’ responsibilities - average across FE and HE institutions (Q2)
Q3: Number of ICT staff
Q3. What is the approximate number of ICT staff at your institution?
If your institution's ICT provision is decentralised, please consider services provided centrally by yourinstitution.
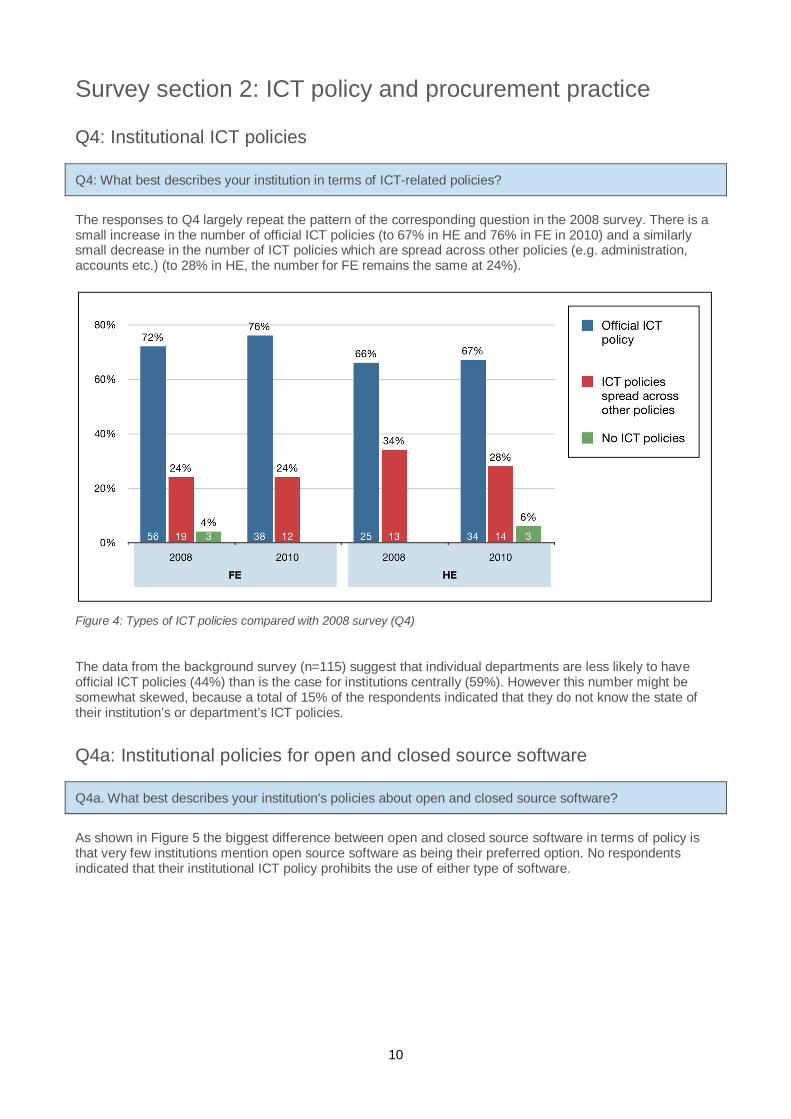
Figure 3: Number of ICT staff (extreme outliers have been removed from thisrepresentation - 2 in FE and 3 in HE)(Q3)
The estimates of the number of ICTstaff provided by the respondentssuggest that a typical FE ICTdepartment employs between 6 and16 staff and that a typical ICTdepartment in HE is larger:anywhere between 20 to 120employees, with a median of 50.However, the spread of estimates isvery large, especially in HE,suggesting a potential need for amore precise measure of numbersof ICT staff than can be providedhere.
10
Survey section 2: ICT policy and procurement practice
Q4: Institutional ICT policies
Q4: What best describes your institution in terms of ICT-related policies?
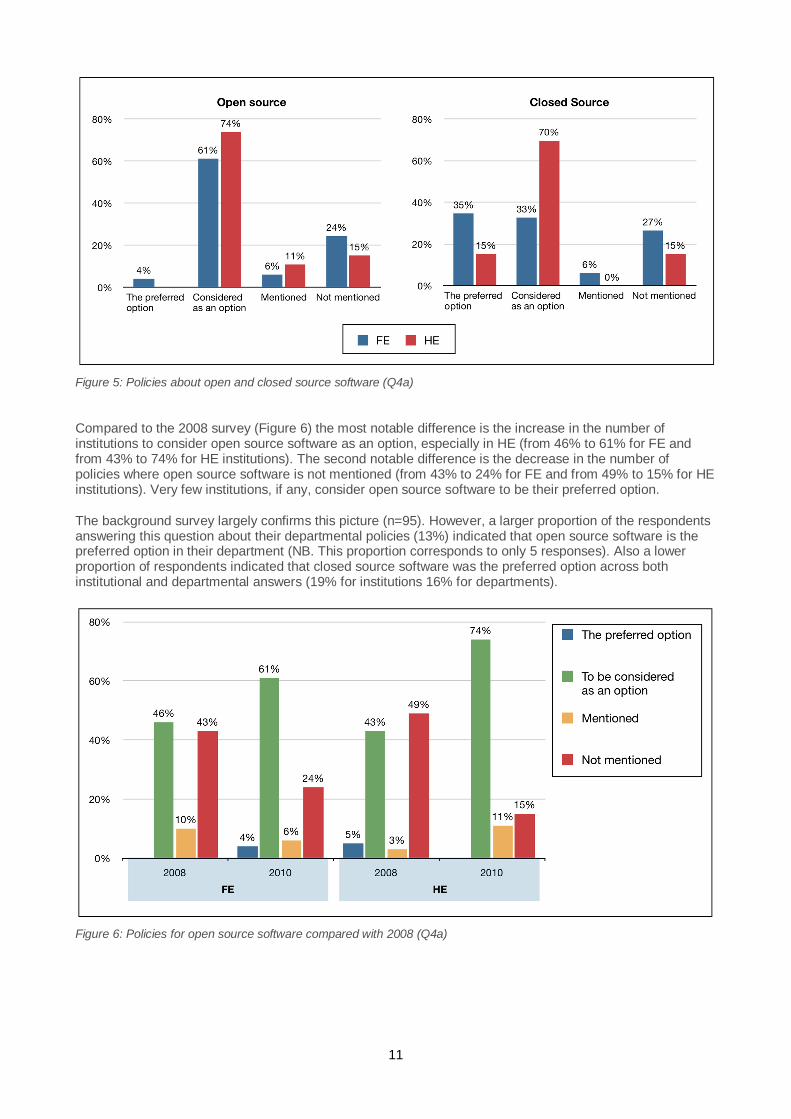
The responses to Q4 largely repeat the pattern of the corresponding question in the 2008 survey. There is asmall increase in the number of official ICT policies (to 67% in HE and 76% in FE in 2010) and a similarlysmall decrease in the number of ICT policies which are spread across other policies (e.g. administration,accounts etc.) (to 28% in HE, the number for FE remains the same at 24%).
Figure 4: Types of ICT policies compared with 2008 survey (Q4)
The data from the background survey (n=115) suggest that individual departments are less likely to haveofficial ICT policies (44%) than is the case for institutions centrally (59%). However this number might besomewhat skewed, because a total of 15% of the respondents indicated that they do not know the state oftheir institution’s or department’s ICT policies.
Q4a: Institutional policies for open and closed source software
Q4a. What best describes your institution's policies about open and closed source software?
As shown in Figure 5 the biggest difference between open and closed source software in terms of policy isthat very few institutions mention open source software as being their preferred option. No respondentsindicated that their institutional ICT policy prohibits the use of either type of software.
11
Figure 5: Policies about open and closed source software (Q4a)
Compared to the 2008 survey (Figure 6) the most notable difference is the increase in the number ofinstitutions to consider open source software as an option, especially in HE (from 46% to 61% for FE andfrom 43% to 74% for HE institutions). The second notable difference is the decrease in the number ofpolicies where open source software is not mentioned (from 43% to 24% for FE and from 49% to 15% for HEinstitutions). Very few institutions, if any, consider open source software to be their preferred option.
The background survey largely confirms this picture (n=95). However, a larger proportion of the respondentsanswering this question about their departmental policies (13%) indicated that open source software is thepreferred option in their department (NB. This proportion corresponds to only 5 responses). Also a lowerproportion of respondents indicated that closed source software was the preferred option across bothinstitutional and departmental answers (19% for institutions 16% for departments).
Figure 6: Policies for open source software compared with 2008 (Q4a)

12
Q5: Software considered for procurement/deployment in practice
Q5. In practice, what software is considered for procurement/deployment in your institution?
In practice almost all institutions include open source software in their considerations whenprocuring/deploying new software and this number has increased since 2008 by about 8% to 94% in FE andto 98% in HE (if the small number of institutions who provided no answer in the 2008 survey are ignored). Itis evident, however, that closed source software continues to dominate in both FE and HE institutions,although there has been a small increase in institutions who consider open and closed source softwareequally since 2008.
Figure 7: Software considered for procurement/deployment in practice (Q5)
While the data from thebackground survey(n=115) confirms thispicture in terms ofcentral ICT provision, itsuggests that on adepartmental levelopen source softwareis more popular. Thus17% of respondentsreplying in terms oftheir departmental ICTprovision indicated thattheir departmentconsiders only ormostly open sourcesoftware.
Q6-8: Staff contribution to software projects
Q6/7. What is your institution's policy regarding staff contributing to open/closed source software projects?
The responses on policies regarding staff contribution to software projects largely follow the picture from theprevious survey. Most of the staff who contribute to both open and closed source software projects do soeither in a casual manner, in their own time, assuming personal responsibility, or because the workingpractice encourages it (without regulating it). This trend is stronger in the present survey, showing a smalldecrease in the number of institutions where contribution is part of the institutional policy. Furthermore in thissurvey no institutions indicated that contribution to software projects was part of staff contracts, which wasthe case for a few institutions in 2008 (however this number was negligible in the 2008 survey). Overall thereis a significant move towards disaggregating staff contribution to open source projects from institutional ordepartmental policies (this result is significant at a confidence interval of 99%). Similarly to the 2008 survey,a large proportion of respondents were not aware of their institution’s practices regarding staff contribution tosoftware projects.
13
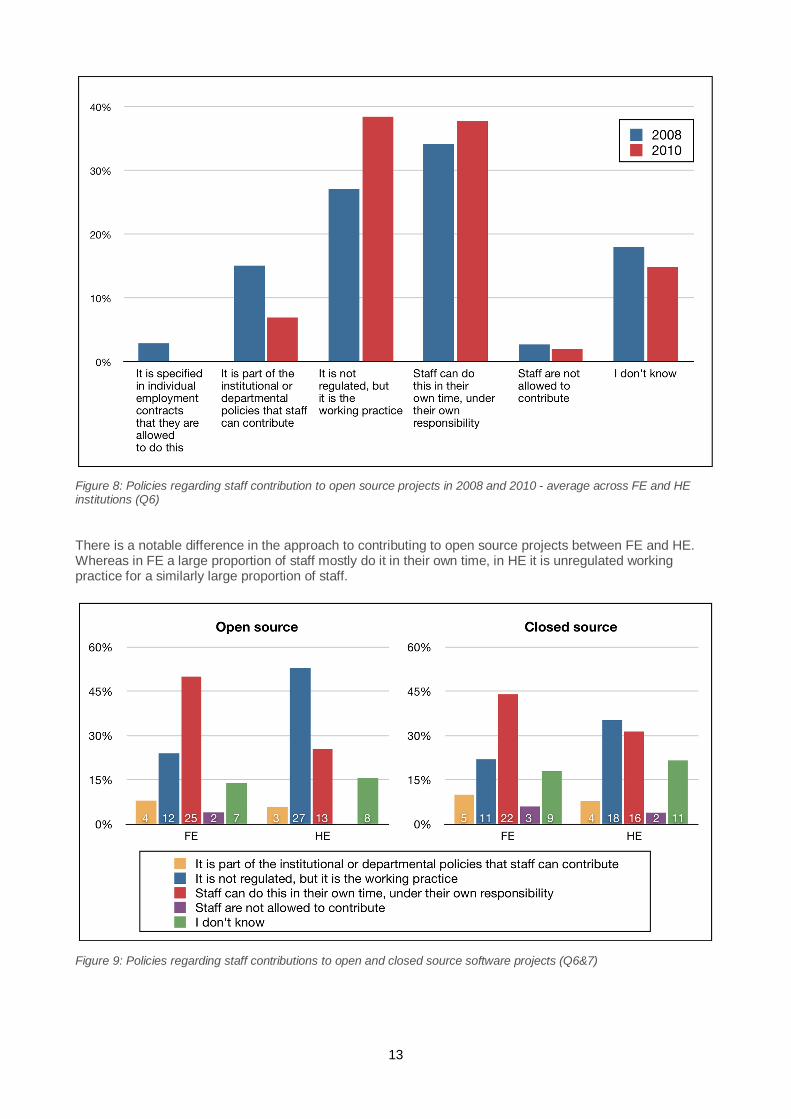
Figure 8: Policies regarding staff contribution to open source projects in 2008 and 2010 - average across FE and HEinstitutions (Q6)
There is a notable difference in the approach to contributing to open source projects between FE and HE.Whereas in FE a large proportion of staff mostly do it in their own time, in HE it is unregulated workingpractice for a similarly large proportion of staff.
Figure 9: Policies regarding staff contributions to open and closed source software projects (Q6&7)
14
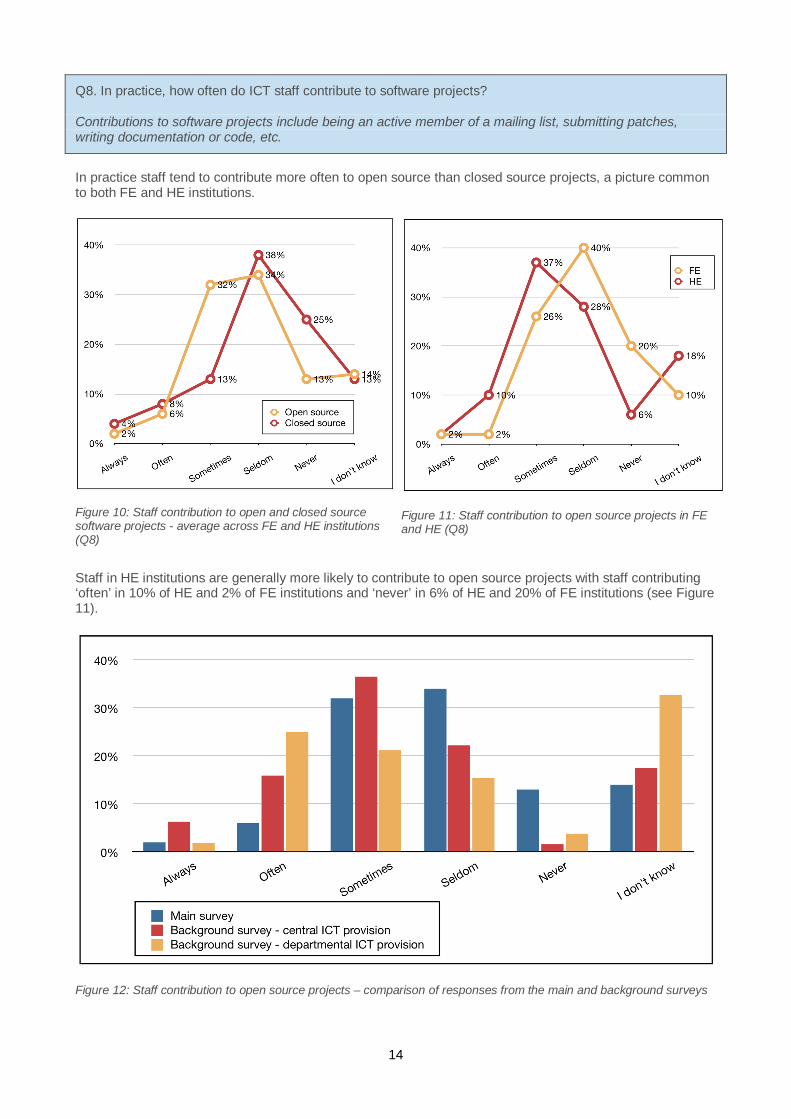
Q8. In practice, how often do ICT staff contribute to software projects?
Contributions to software projects include being an active member of a mailing list, submitting patches,writing documentation or code, etc.
In practice staff tend to contribute more often to open source than closed source projects, a picture commonto both FE and HE institutions.
Figure 10: Staff contribution to open and closed sourcesoftware projects - average across FE and HE institutions(Q8)
Figure 11: Staff contribution to open source projects in FEand HE (Q8)
Staff in HE institutions are generally more likely to contribute to open source projects with staff contributing‘often’ in 10% of HE and 2% of FE institutions and ‘never’ in 6% of HE and 20% of FE institutions (see Figure11).
Figure 12: Staff contribution to open source projects – comparison of responses from the main and background surveys

15
The respondents to the background survey (n=115) indicated a higher rate of contribution to open sourceprojects than did the respondents to the main survey. The difference was especially pronounced ifcomparing the data from the main survey to the responses for the departmental level in the backgroundsurvey. However a large proportion of the respondents answering for their department in the backgroundsurvey indicated that they do not know about the rates of contribution. Nonetheless this data raisesquestions about the reasons for the difference in perception between the two samples, which merit furtherinvestigation.
16
Survey section 3: Software running on servers
Q9&10: Software support for servers
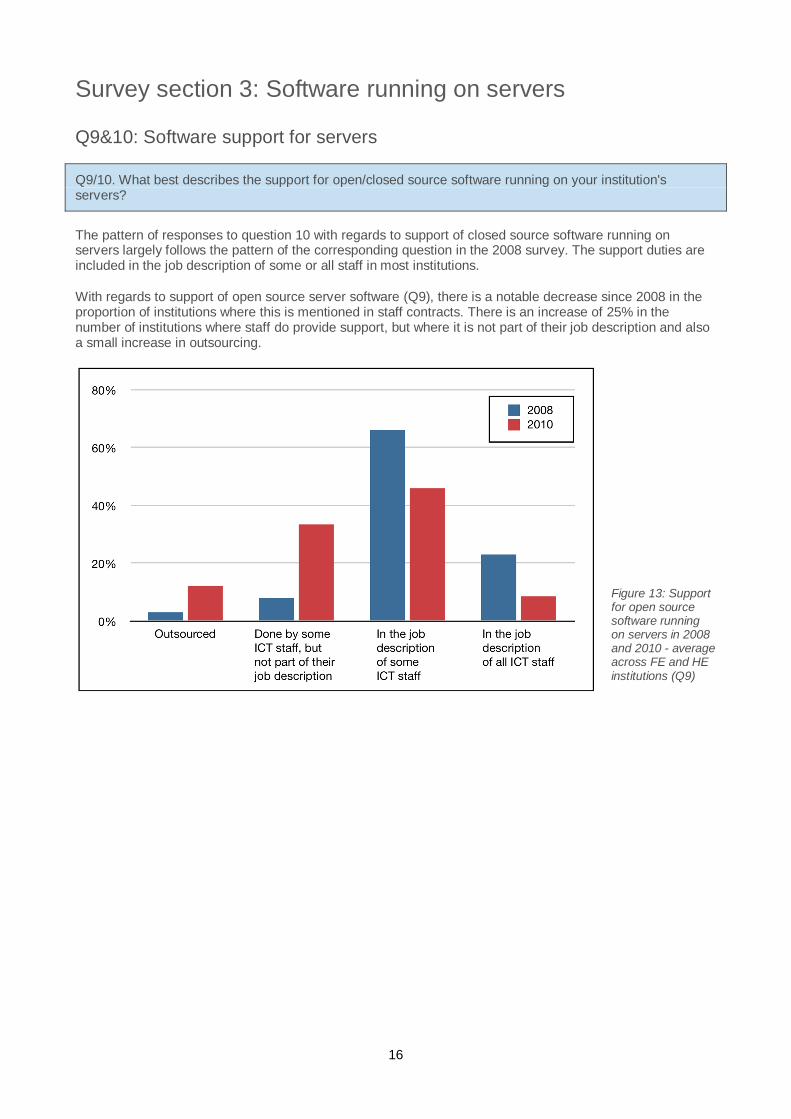
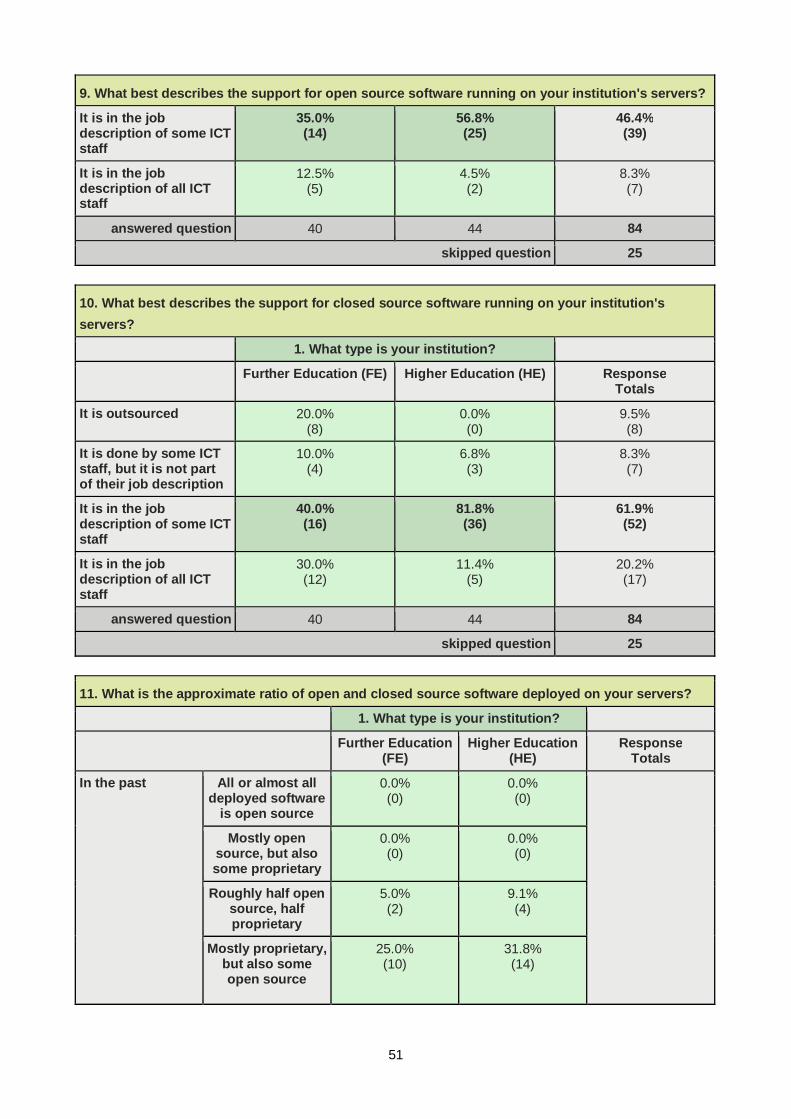
Q9/10. What best describes the support for open/closed source software running on your institution'sservers?
The pattern of responses to question 10 with regards to support of closed source software running onservers largely follows the pattern of the corresponding question in the 2008 survey. The support duties areincluded in the job description of some or all staff in most institutions.
With regards to support of open source server software (Q9), there is a notable decrease since 2008 in theproportion of institutions where this is mentioned in staff contracts. There is an increase of 25% in thenumber of institutions where staff do provide support, but where it is not part of their job description and alsoa small increase in outsourcing.
Figure 13: Supportfor open sourcesoftware runningon servers in 2008and 2010 - averageacross FE and HEinstitutions (Q9)
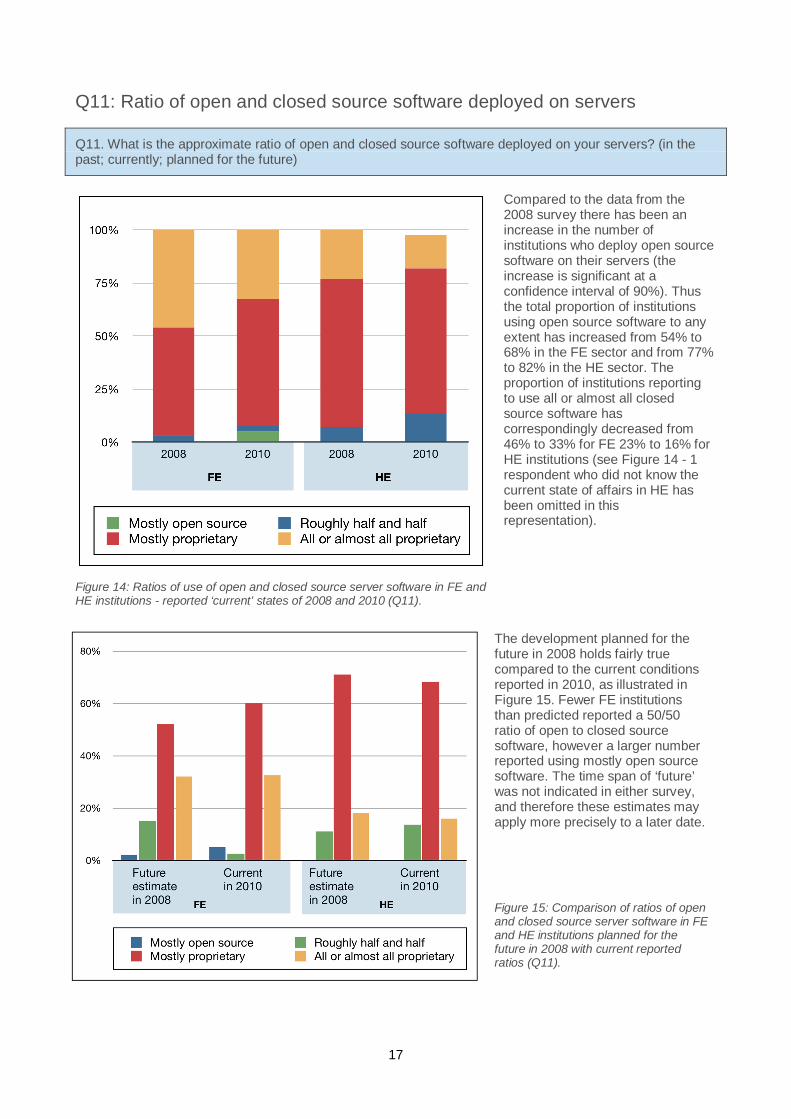
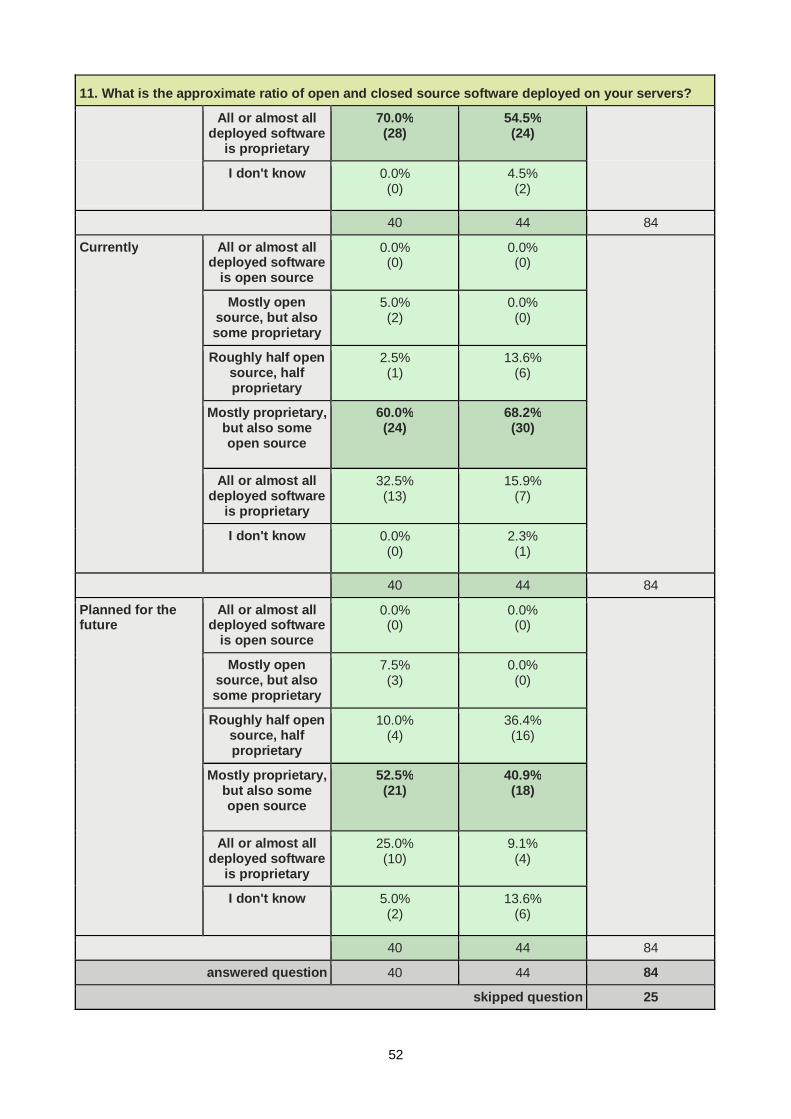
Q11: Ratio of open and closed source software deployed on servers
Q11. What is the approximate ratio of open and closed source software deployed on your servers? (in thepast; currently; planned for the future)
Figure 14: Ratios of use of open and closed source server software in FE andHE institutions - reported ‘current’ states of 2008 and 2010 (Q11).
Compared to the data from the2008 survey there has been anincrease in the number ofinstitutions who deploy open sourcesoftware on their servers (theincrease is significant at aconfidence interval of 90%). Thusthe total proportion of institutionsusing open source software to anyextent has increased from 54% to68% in the FE sector and from 77%to 82% in the HE sector. Theproportion of institutions reportingto use all or almost all closedsource software hascorrespondingly decreased from46% to 33% for FE 23% to 16% forHE institutions (see Figure 14 - 1respondent who did not know thecurrent state of affairs in HE hasbeen omitted in thisrepresentation).
The development planned for the
17
future in 2008 holds fairly truecompared to the current conditionsreported in 2010, as illustrated inFigure 15. Fewer FE institutionsthan predicted reported a 50/50ratio of open to closed sourcesoftware, however a larger numberreported using mostly open sourcesoftware. The time span of ‘future’was not indicated in either survey,and therefore these estimates mayapply more precisely to a later date.
Figure 15: Comparison of ratios of openand closed source server software in FEand HE institutions planned for thefuture in 2008 with current reportedratios (Q11).
18
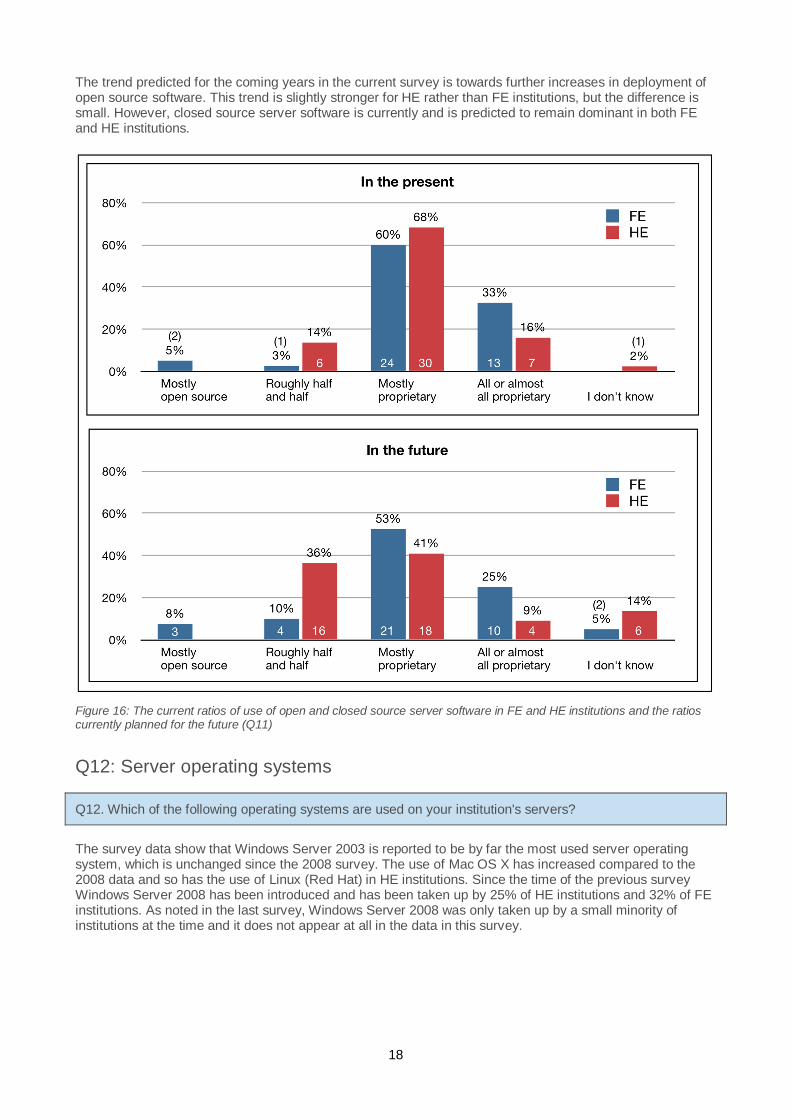
The trend predicted for the coming years in the current survey is towards further increases in deployment ofopen source software. This trend is slightly stronger for HE rather than FE institutions, but the difference issmall. However, closed source server software is currently and is predicted to remain dominant in both FEand HE institutions.
Figure 16: The current ratios of use of open and closed source server software in FE and HE institutions and the ratioscurrently planned for the future (Q11)
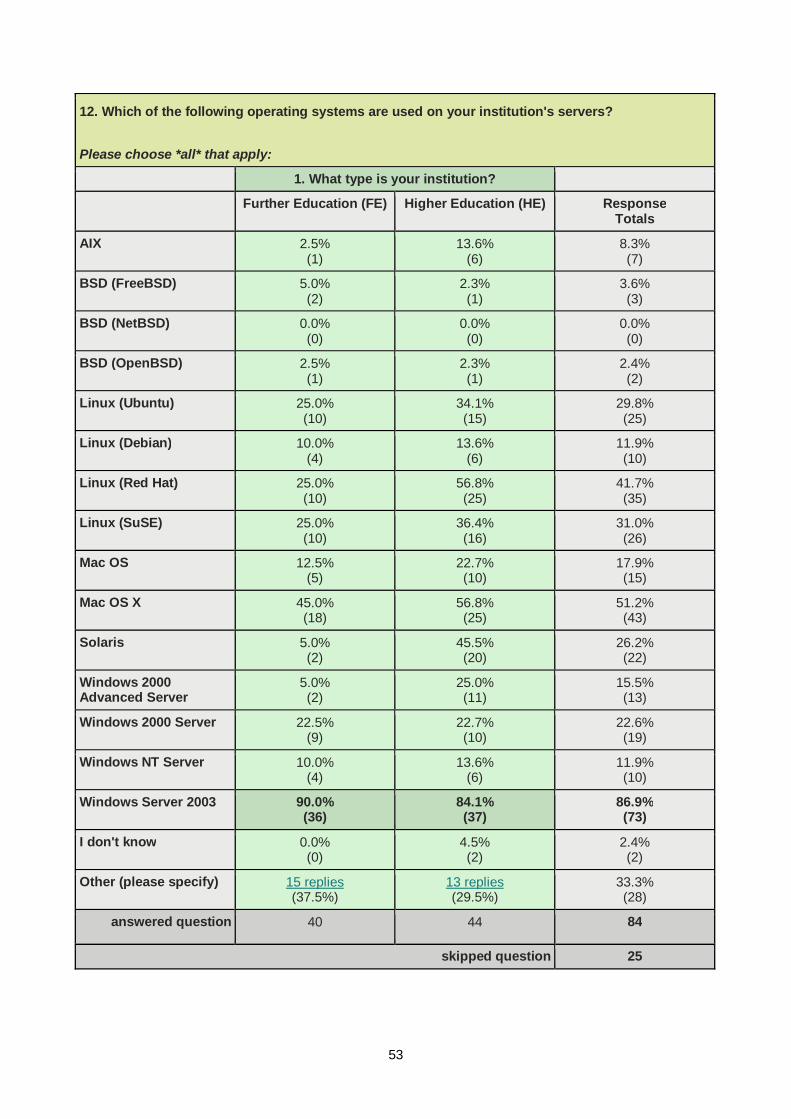
Q12: Server operating systems
Q12. Which of the following operating systems are used on your institution's servers?
The survey data show that Windows Server 2003 is reported to be by far the most used server operatingsystem, which is unchanged since the 2008 survey. The use of Mac OS X has increased compared to the2008 data and so has the use of Linux (Red Hat) in HE institutions. Since the time of the previous surveyWindows Server 2008 has been introduced and has been taken up by 25% of HE institutions and 32% of FEinstitutions. As noted in the last survey, Windows Server 2008 was only taken up by a small minority ofinstitutions at the time and it does not appear at all in the data in this survey.
19
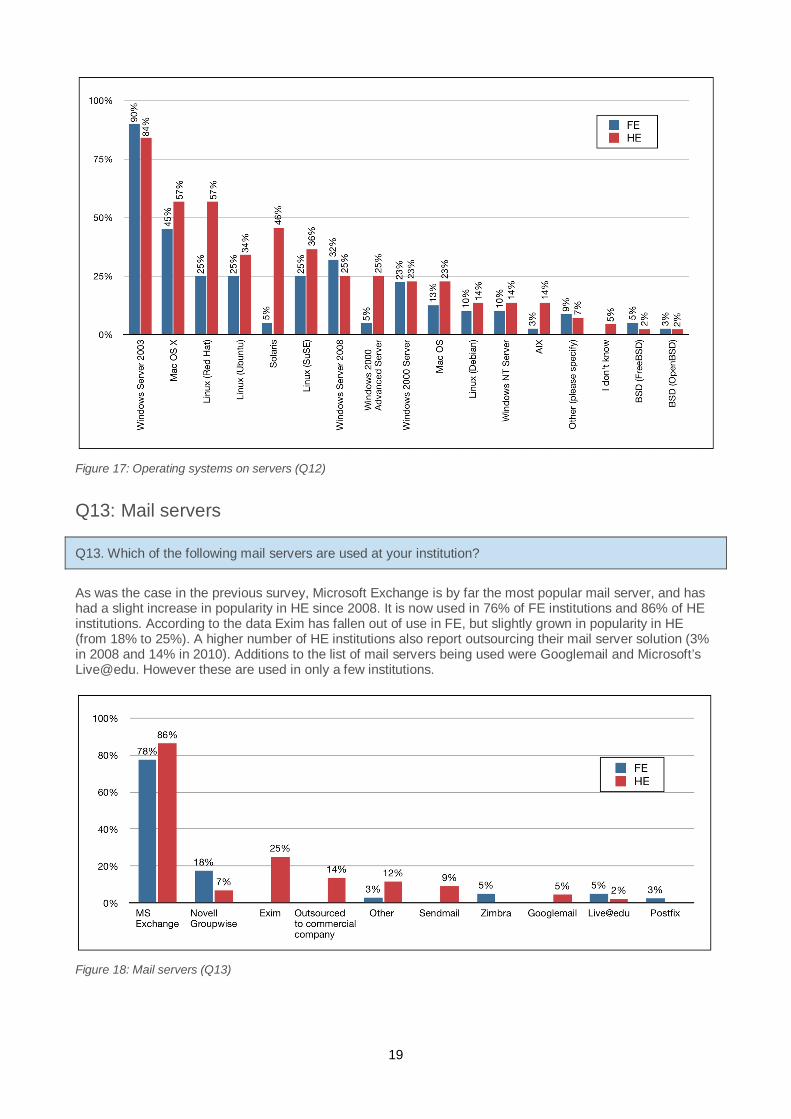
Figure 17: Operating systems on servers (Q12)
Q13: Mail servers
Q13. Which of the following mail servers are used at your institution?
As was the case in the previous survey, Microsoft Exchange is by far the most popular mail server, and hashad a slight increase in popularity in HE since 2008. It is now used in 76% of FE institutions and 86% of HEinstitutions. According to the data Exim has fallen out of use in FE, but slightly grown in popularity in HE(from 18% to 25%). A higher number of HE institutions also report outsourcing their mail server solution (3%in 2008 and 14% in 2010). Additions to the list of mail servers being used were Googlemail and Microsoft’sLive@edu. However these are used in only a few institutions.
Figure 18: Mail servers (Q13)
20
Q14: Webmail systems
Q14. Which of the following webmail systems are used in your institution?
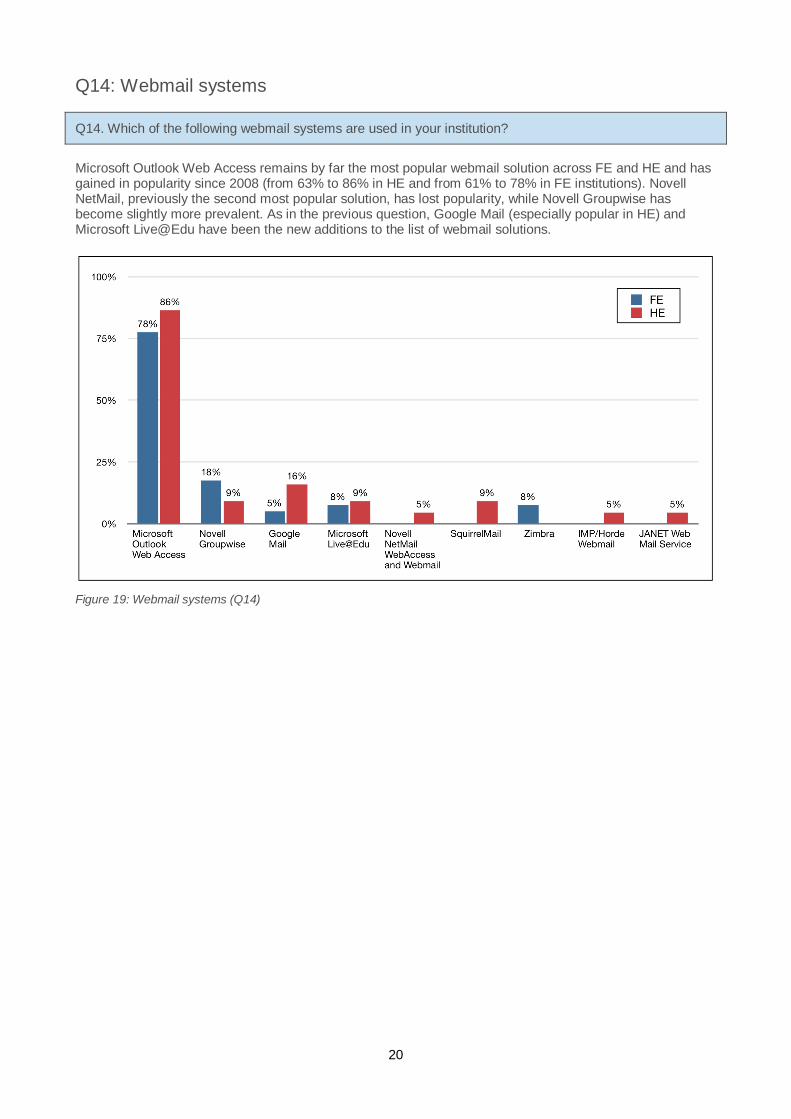
Microsoft Outlook Web Access remains by far the most popular webmail solution across FE and HE and hasgained in popularity since 2008 (from 63% to 86% in HE and from 61% to 78% in FE institutions). NovellNetMail, previously the second most popular solution, has lost popularity, while Novell Groupwise hasbecome slightly more prevalent. As in the previous question, Google Mail (especially popular in HE) andMicrosoft Live@Edu have been the new additions to the list of webmail solutions.
Figure 19: Webmail systems (Q14)
21
Q15: Database servers
Q15. Which of the following database servers are used in your institution?
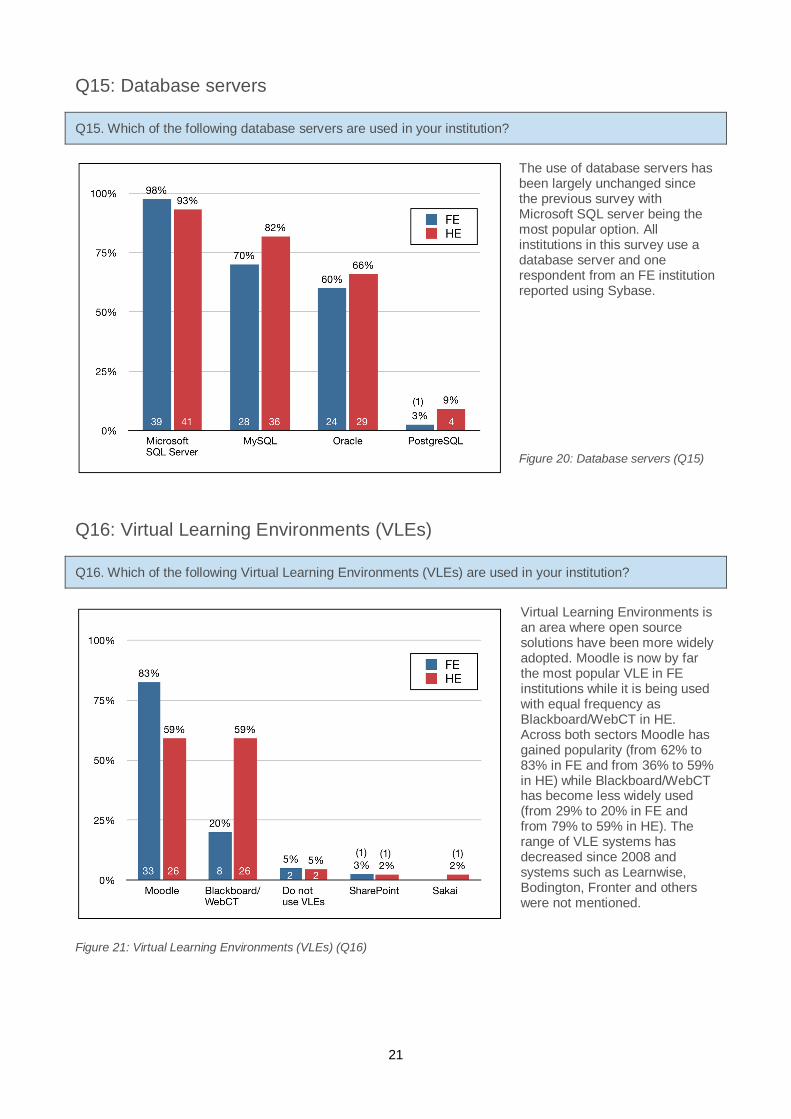
The use of database servers hasbeen largely unchanged sincethe previous survey withMicrosoft SQL server being themost popular option. Allinstitutions in this survey use adatabase server and onerespondent from an FE institutionreported using Sybase.
Figure 20: Database servers (Q15)
Q16: Virtual Learning Environments (VLEs)
Q16. Which of the following Virtual Learning Environments (VLEs) are used in your institution?
Figure 21: Virtual Learning Environments (VLEs) (Q16)
Virtual Learning Environments isan area where open sourcesolutions have been more widelyadopted. Moodle is now by farthe most popular VLE in FEinstitutions while it is being usedwith equal frequency asBlackboard/WebCT in HE.Across both sectors Moodle hasgained popularity (from 62% to83% in FE and from 36% to 59%in HE) while Blackboard/WebCThas become less widely used(from 29% to 20% in FE andfrom 79% to 59% in HE). Therange of VLE systems hasdecreased since 2008 andsystems such as Learnwise,Bodington, Fronter and otherswere not mentioned.
22
Q17: Content Management Systems (CMSs)
Q17. Which of the following Content Management Systems (CMSs) are used in your institution?
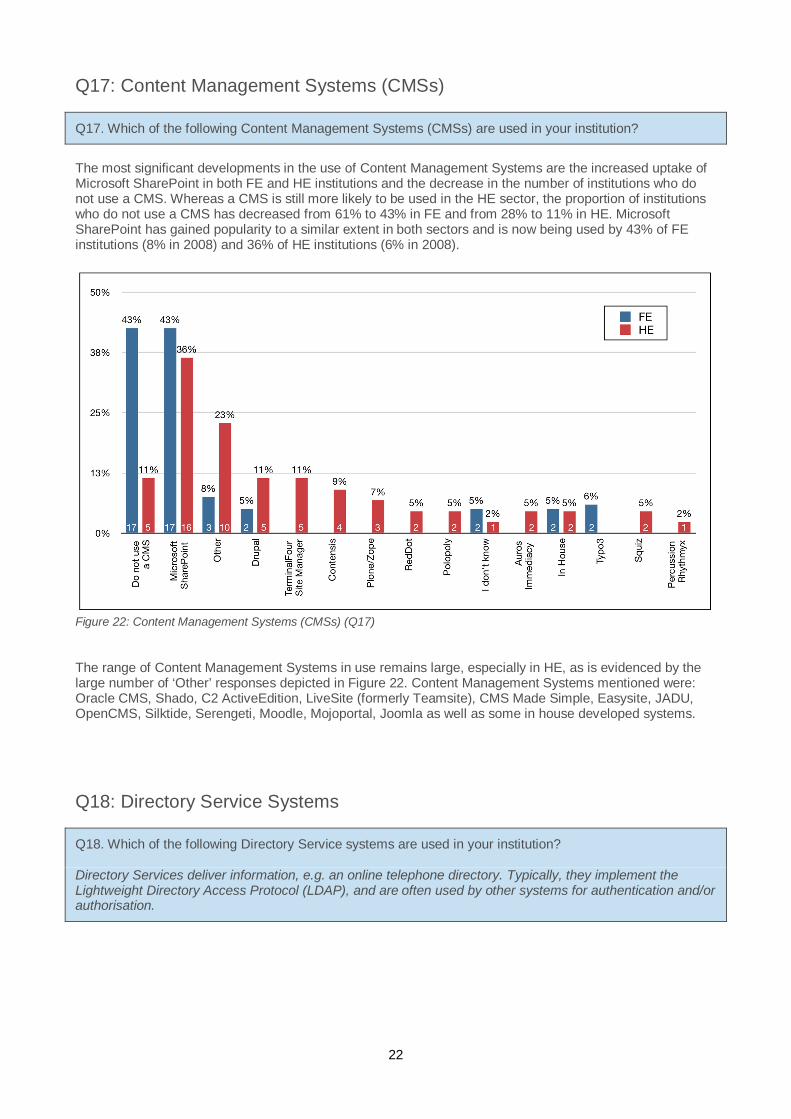
The most significant developments in the use of Content Management Systems are the increased uptake ofMicrosoft SharePoint in both FE and HE institutions and the decrease in the number of institutions who donot use a CMS. Whereas a CMS is still more likely to be used in the HE sector, the proportion of institutionswho do not use a CMS has decreased from 61% to 43% in FE and from 28% to 11% in HE. MicrosoftSharePoint has gained popularity to a similar extent in both sectors and is now being used by 43% of FEinstitutions (8% in 2008) and 36% of HE institutions (6% in 2008).
Figure 22: Content Management Systems (CMSs) (Q17)
The range of Content Management Systems in use remains large, especially in HE, as is evidenced by thelarge number of ‘Other’ responses depicted in Figure 22. Content Management Systems mentioned were:Oracle CMS, Shado, C2 ActiveEdition, LiveSite (formerly Teamsite), CMS Made Simple, Easysite, JADU,OpenCMS, Silktide, Serengeti, Moodle, Mojoportal, Joomla as well as some in house developed systems.
Q18: Directory Service Systems
Q18. Which of the following Directory Service systems are used in your institution?
Directory Services deliver information, e.g. an online telephone directory. Typically, they implement theLightweight Directory Access Protocol (LDAP), and are often used by other systems for authentication and/orauthorisation.
23
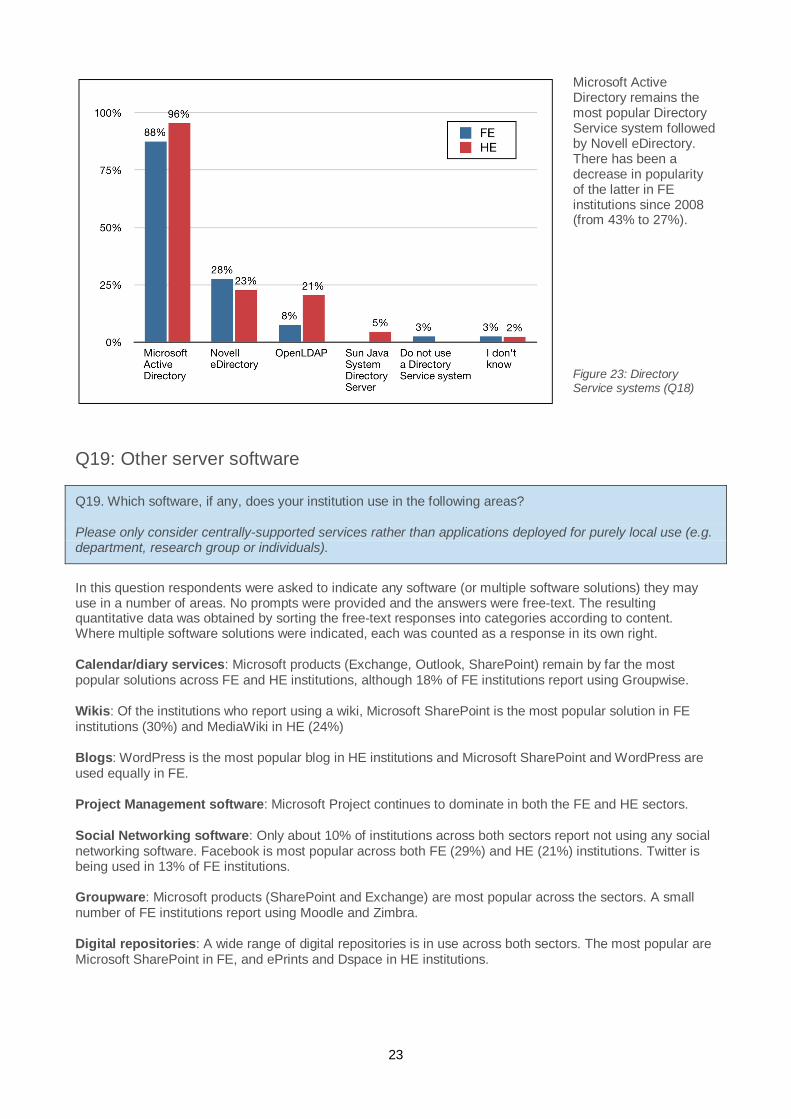
Microsoft ActiveDirectory remains themost popular DirectoryService system followedby Novell eDirectory.There has been adecrease in popularityof the latter in FEinstitutions since 2008(from 43% to 27%).
Figure 23: DirectoryService systems (Q18)
Q19: Other server software
Q19. Which software, if any, does your institution use in the following areas?
Please only consider centrally-supported services rather than applications deployed for purely local use (e.g.department, research group or individuals).
In this question respondents were asked to indicate any software (or multiple software solutions) they mayuse in a number of areas. No prompts were provided and the answers were free-text. The resultingquantitative data was obtained by sorting the free-text responses into categories according to content.Where multiple software solutions were indicated, each was counted as a response in its own right.
Calendar/diary services: Microsoft products (Exchange, Outlook, SharePoint) remain by far the mostpopular solutions across FE and HE institutions, although 18% of FE institutions report using Groupwise.
Wikis: Of the institutions who report using a wiki, Microsoft SharePoint is the most popular solution in FEinstitutions (30%) and MediaWiki in HE (24%)
Blogs: WordPress is the most popular blog in HE institutions and Microsoft SharePoint and WordPress areused equally in FE.
Project Management software: Microsoft Project continues to dominate in both the FE and HE sectors.
Social Networking software: Only about 10% of institutions across both sectors report not using any socialnetworking software. Facebook is most popular across both FE (29%) and HE (21%) institutions. Twitter isbeing used in 13% of FE institutions.
Groupware: Microsoft products (SharePoint and Exchange) are most popular across the sectors. A smallnumber of FE institutions report using Moodle and Zimbra.
Digital repositories: A wide range of digital repositories is in use across both sectors. The most popular areMicrosoft SharePoint in FE, and ePrints and Dspace in HE institutions.
24
Q20: Criteria when procuring software for servers
Q20. Rank the top 5 criteria that your institution considers important when procuring software for yourservers, from most to least important.
Please number 5 of the boxes, 1 being the highest priority
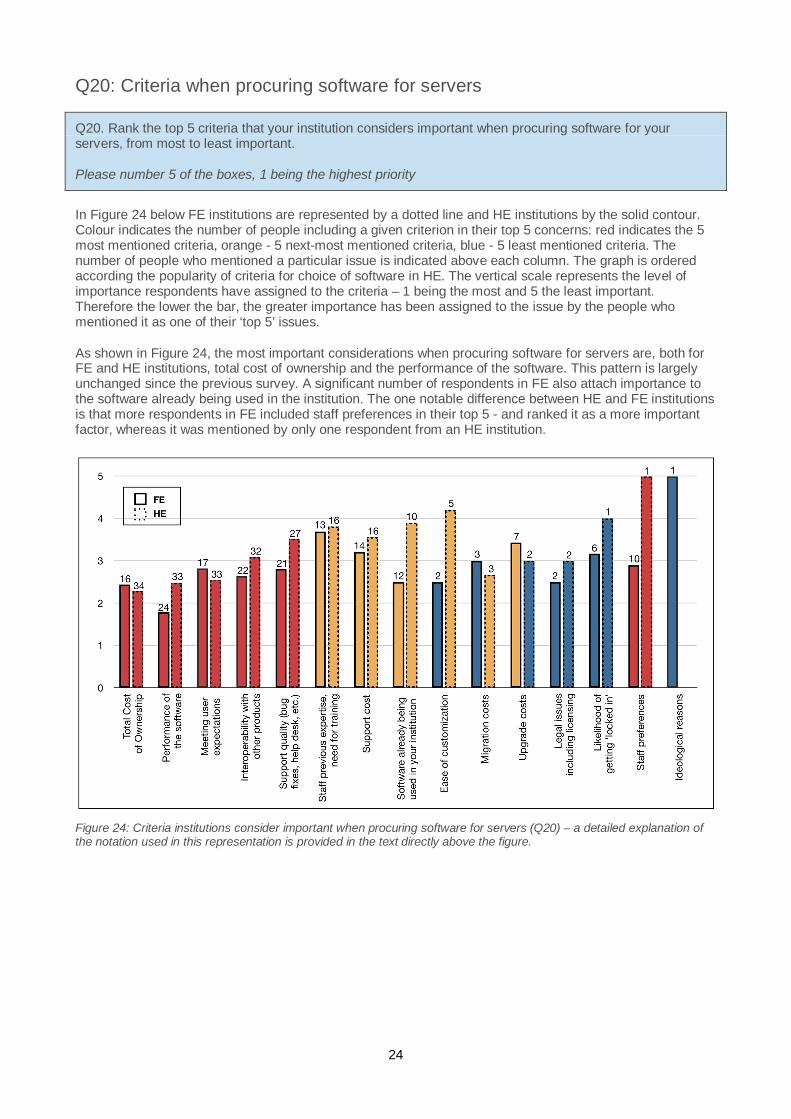
In Figure 24 below FE institutions are represented by a dotted line and HE institutions by the solid contour.Colour indicates the number of people including a given criterion in their top 5 concerns: red indicates the 5most mentioned criteria, orange - 5 next-most mentioned criteria, blue - 5 least mentioned criteria. Thenumber of people who mentioned a particular issue is indicated above each column. The graph is orderedaccording the popularity of criteria for choice of software in HE. The vertical scale represents the level ofimportance respondents have assigned to the criteria – 1 being the most and 5 the least important.Therefore the lower the bar, the greater importance has been assigned to the issue by the people whomentioned it as one of their ‘top 5’ issues.
As shown in Figure 24, the most important considerations when procuring software for servers are, both forFE and HE institutions, total cost of ownership and the performance of the software. This pattern is largelyunchanged since the previous survey. A significant number of respondents in FE also attach importance tothe software already being used in the institution. The one notable difference between HE and FE institutionsis that more respondents in FE included staff preferences in their top 5 - and ranked it as a more importantfactor, whereas it was mentioned by only one respondent from an HE institution.
Figure 24: Criteria institutions consider important when procuring software for servers (Q20) – a detailed explanation ofthe notation used in this representation is provided in the text directly above the figure.
25
Q21: Software considered for procurement/replacement on servers
Q21. Which new server software systems are currently being considered for procurement at your institution?Please also include old systems being considered for replacement.
This could be, for example, because your institution does not have some systems, but would like to procurethem, or because your current systems do not meet your needs.
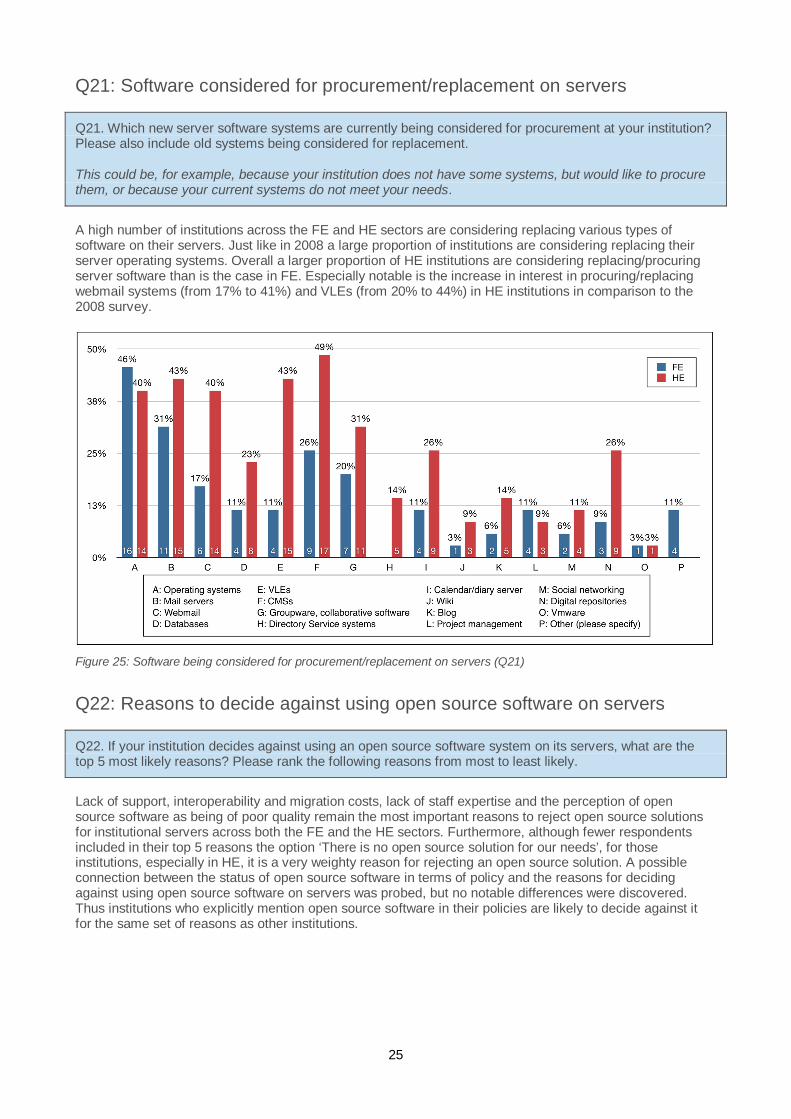
A high number of institutions across the FE and HE sectors are considering replacing various types ofsoftware on their servers. Just like in 2008 a large proportion of institutions are considering replacing theirserver operating systems. Overall a larger proportion of HE institutions are considering replacing/procuringserver software than is the case in FE. Especially notable is the increase in interest in procuring/replacingwebmail systems (from 17% to 41%) and VLEs (from 20% to 44%) in HE institutions in comparison to the2008 survey.
Figure 25: Software being considered for procurement/replacement on servers (Q21)
Q22: Reasons to decide against using open source software on servers
Q22. If your institution decides against using an open source software system on its servers, what are thetop 5 most likely reasons? Please rank the following reasons from most to least likely.
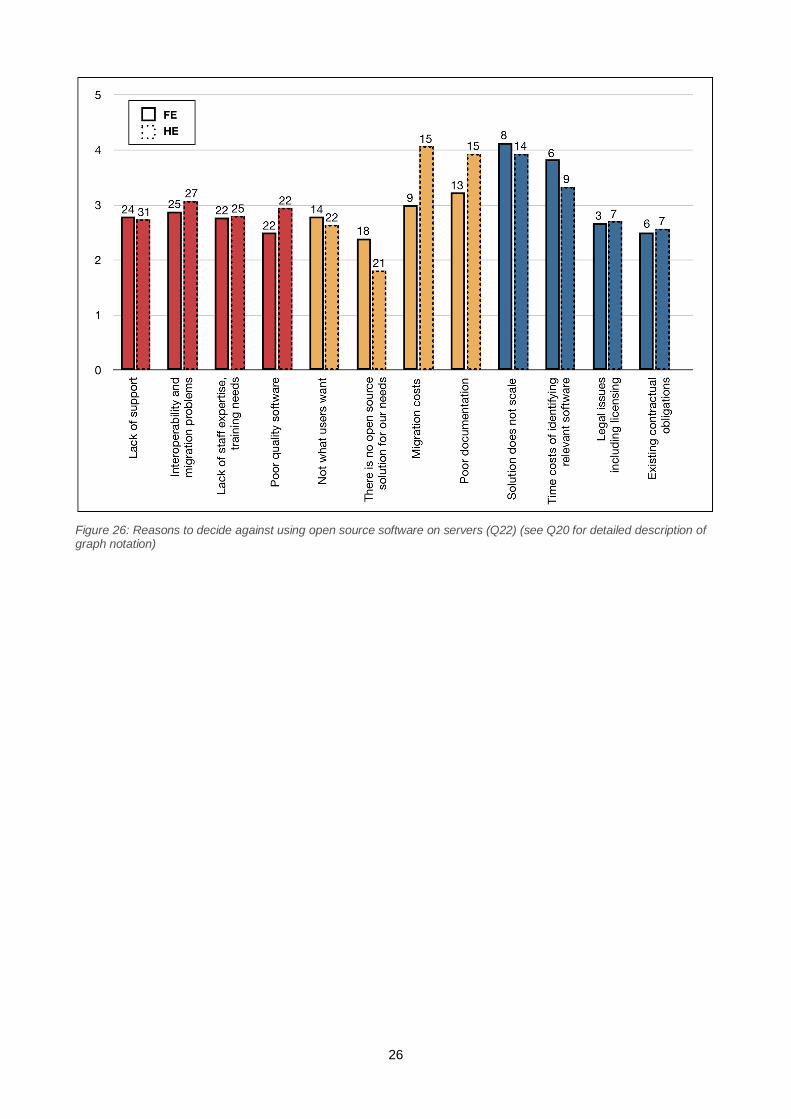
Lack of support, interoperability and migration costs, lack of staff expertise and the perception of opensource software as being of poor quality remain the most important reasons to reject open source solutionsfor institutional servers across both the FE and the HE sectors. Furthermore, although fewer respondentsincluded in their top 5 reasons the option ‘There is no open source solution for our needs’, for thoseinstitutions, especially in HE, it is a very weighty reason for rejecting an open source solution. A possibleconnection between the status of open source software in terms of policy and the reasons for decidingagainst using open source software on servers was probed, but no notable differences were discovered.Thus institutions who explicitly mention open source software in their policies are likely to decide against itfor the same set of reasons as other institutions.
26
Figure 26: Reasons to decide against using open source software on servers (Q22) (see Q20 for detailed description ofgraph notation)
27
Survey section 4: Software running on desktops
Q23/24: Support for software running on desktops
Q23/24. What best describes the support for open/closed source software running on your institution'sdesktops?
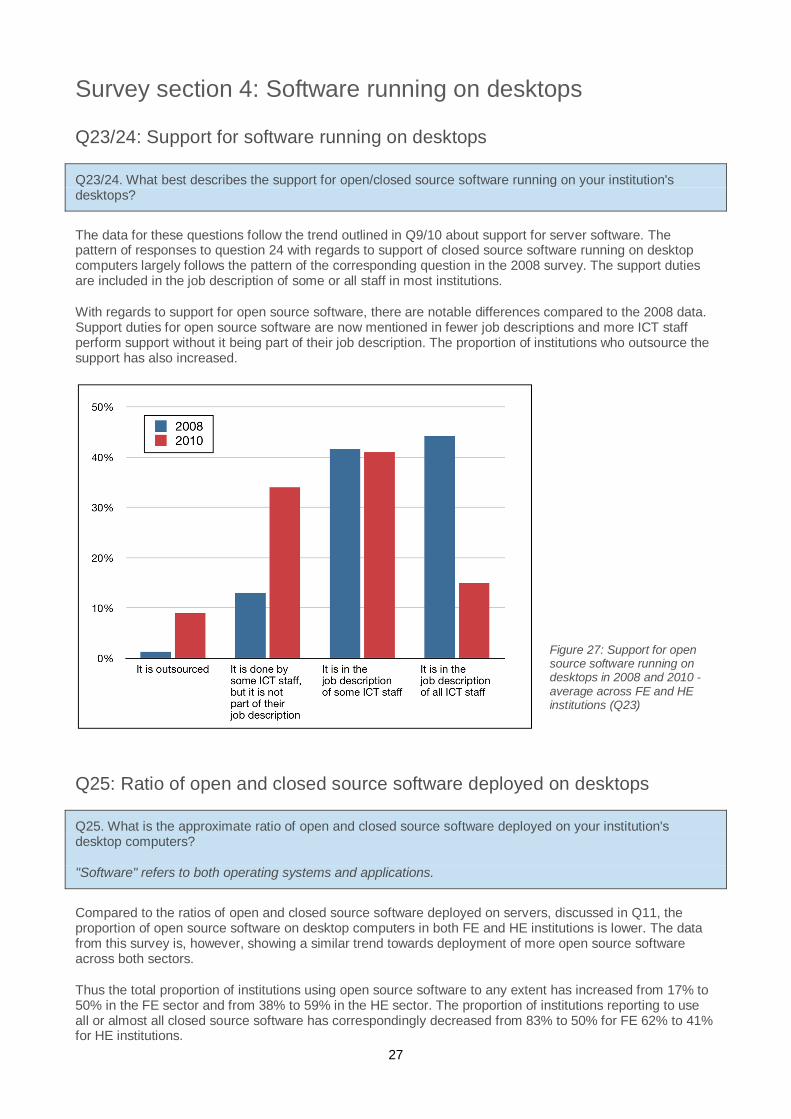
The data for these questions follow the trend outlined in Q9/10 about support for server software. Thepattern of responses to question 24 with regards to support of closed source software running on desktopcomputers largely follows the pattern of the corresponding question in the 2008 survey. The support dutiesare included in the job description of some or all staff in most institutions.
With regards to support for open source software, there are notable differences compared to the 2008 data.Support duties for open source software are now mentioned in fewer job descriptions and more ICT staffperform support without it being part of their job description. The proportion of institutions who outsource thesupport has also increased.
Figure 27: Support for opensource software running ondesktops in 2008 and 2010 -average across FE and HEinstitutions (Q23)
Q25: Ratio of open and closed source software deployed on desktops
Q25. What is the approximate ratio of open and closed source software deployed on your institution'sdesktop computers?
"Software" refers to both operating systems and applications.
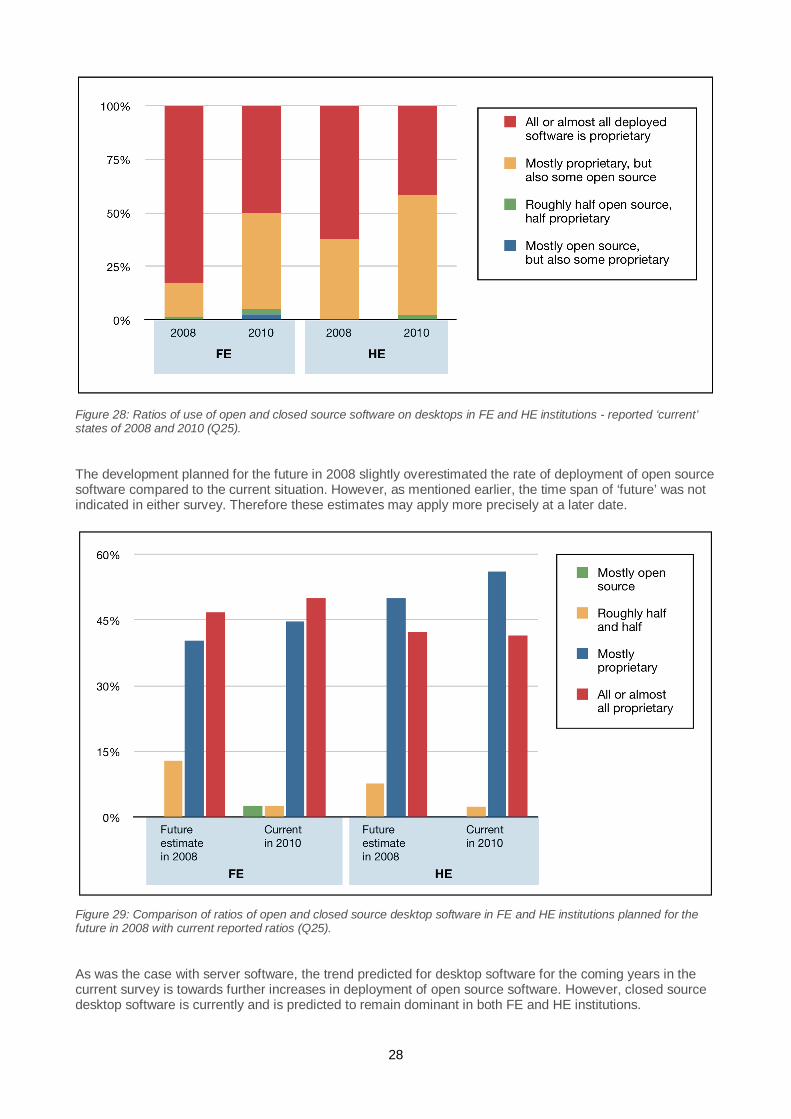
Compared to the ratios of open and closed source software deployed on servers, discussed in Q11, theproportion of open source software on desktop computers in both FE and HE institutions is lower. The datafrom this survey is, however, showing a similar trend towards deployment of more open source softwareacross both sectors.
Thus the total proportion of institutions using open source software to any extent has increased from 17% to50% in the FE sector and from 38% to 59% in the HE sector. The proportion of institutions reporting to useall or almost all closed source software has correspondingly decreased from 83% to 50% for FE 62% to 41%for HE institutions.
28
Figure 28: Ratios of use of open and closed source software on desktops in FE and HE institutions - reported ‘current’states of 2008 and 2010 (Q25).
The development planned for the future in 2008 slightly overestimated the rate of deployment of open sourcesoftware compared to the current situation. However, as mentioned earlier, the time span of ‘future’ was notindicated in either survey. Therefore these estimates may apply more precisely at a later date.
Figure 29: Comparison of ratios of open and closed source desktop software in FE and HE institutions planned for thefuture in 2008 with current reported ratios (Q25).
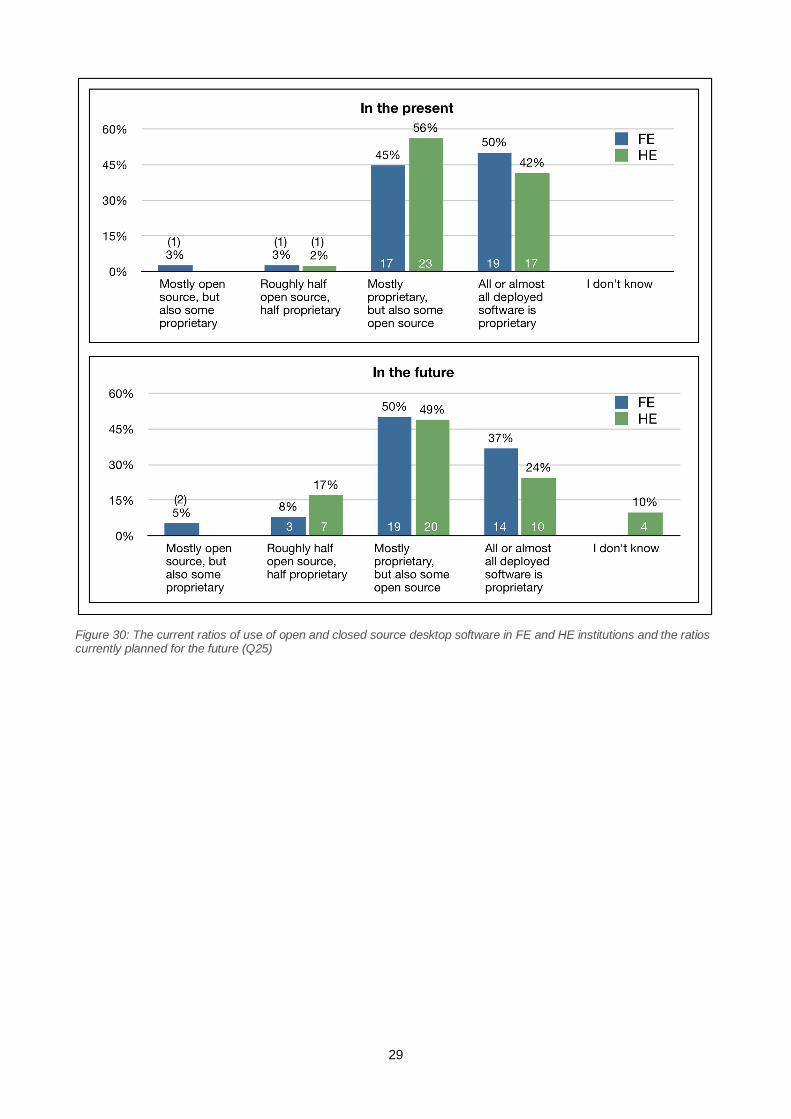
As was the case with server software, the trend predicted for desktop software for the coming years in thecurrent survey is towards further increases in deployment of open source software. However, closed sourcedesktop software is currently and is predicted to remain dominant in both FE and HE institutions.
29
Figure 30: The current ratios of use of open and closed source desktop software in FE and HE institutions and the ratioscurrently planned for the future (Q25)

30
Q26: Operating systems used on desktop computers
Q26. Which of the following operating systems are used on your institution's desktop computers?
Windows XP and Windows 7 are currently the most popular operating systems on desktop computers acrossthe FE and HE sectors. The use of Mac operating systems has increased since 2008 and so has the use ofLinux systems. Linux (Red Hat) is now used in 34% of HE institutions (13% in 2008), Linux (Ubuntu) is usedin 16% of FE institutions (8% in 2008) and 31% of HE institutions (10% in 2008). Overall HE institutions aremore likely to use open source operating systems on their desktop computers that are FE institutions.
Figure 31: Operating systems on desktop computers (Q26)

31
Q27: Software applications on desktops
Q27: Which of the following software applications are used on your institution's desktop computers?
In the most common categories of desktop applications - office suites, internet browsing and email, Microsoftproducts are most popular. The Mozilla Firefox browser is also very popular, especially in HE where it isbeing used by 85% of institutions. The use of Safari has increased since the 2008 survey in both the FE andthe HE sectors (from 30% to 47% in FE and from 37% to 66% in HE institutions). Google Chrome wasintroduced since the last survey and has been taken up by a sizable proportion of institutions across FE andHE. The use of Matlab in HE has grown (from 17% to 42%). The popularity of OpenOffice has increased to alesser extent from 30% to 37% in FE and from 23% to 34 % in HE institutions.
Figure 32: Software applications on desktop computers (Q27)
32
Q28: Criteria when procuring software for desktop computers
Q28. Rank the top 5 criteria that your institution considers important when procuring software for yourdesktop computers, from most to least important.
Please number 5 of the boxes, 1 being the highest priority
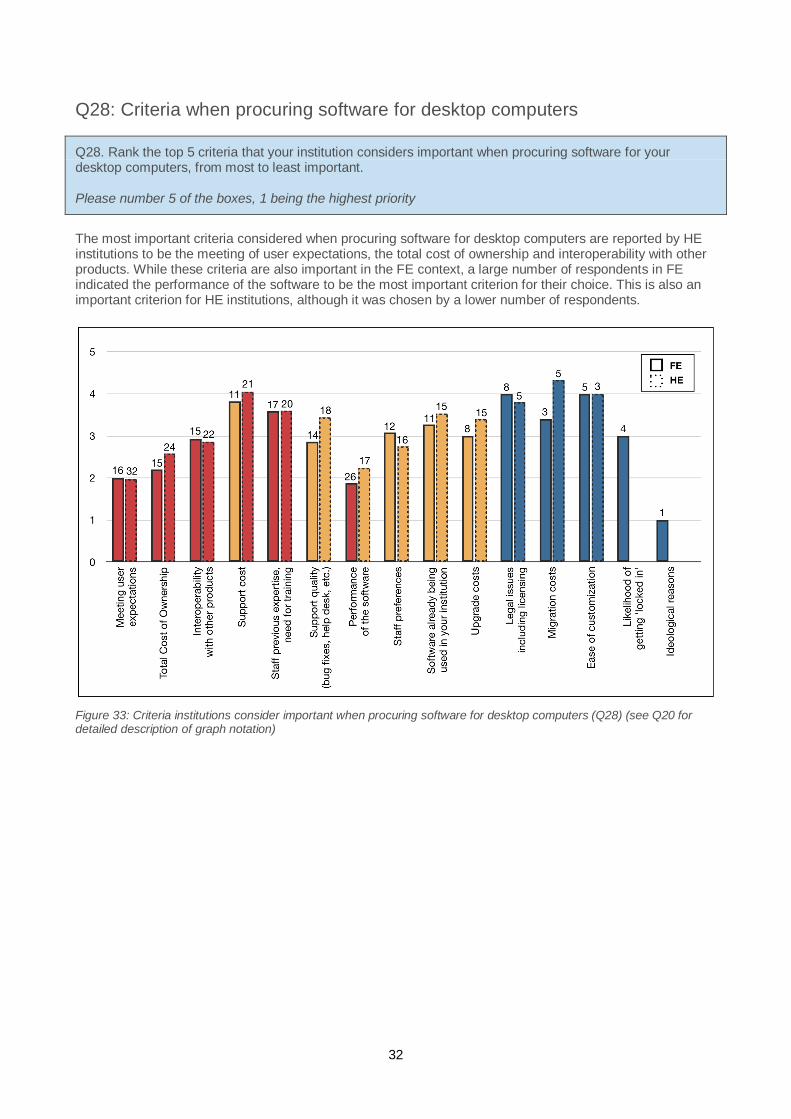
The most important criteria considered when procuring software for desktop computers are reported by HEinstitutions to be the meeting of user expectations, the total cost of ownership and interoperability with otherproducts. While these criteria are also important in the FE context, a large number of respondents in FEindicated the performance of the software to be the most important criterion for their choice. This is also animportant criterion for HE institutions, although it was chosen by a lower number of respondents.
Figure 33: Criteria institutions consider important when procuring software for desktop computers (Q28) (see Q20 fordetailed description of graph notation)

33
Q29: Desktop software systems currently being considered forprocurement/replacement
Q29. Which new desktop software systems are currently being considered for procurement at yourinstitution? Please also include old systems being considered for replacement.
This could be, for example, because your institution does not have some systems, but would like to procurethem, or because your current systems do not meet your needs.
As was the case with server software, operating systems on desktop computers are most frequentlyconsidered for replacement. Many more institutions in FE are considering replacing their operating systemsthan did in 2008 (a rise from 34% to 69%). Across the various other systems HE institutions are more likelyto be considering procuring new software or replacing existing systems than FE institutions.
Figure 34: Software systems currently being considered for procurement/replacement (Q29)
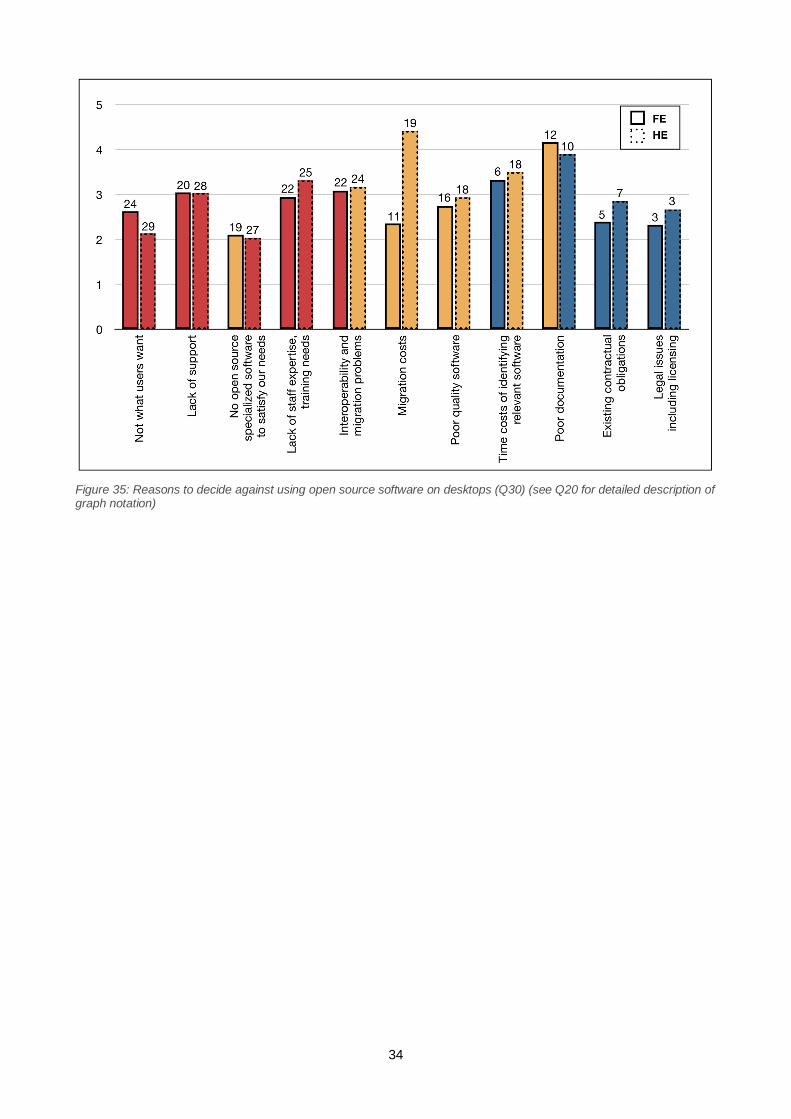
Q30: Reasons to decide against using open source software on desktops
Q30. If your institution decides against using an open source software system in its desktop computers, whatare the top 5 most likely reasons? Please rank the following reasons from most to least likely.
Please number 5 of the boxes, 1 being the most likely reason
The most important reasons for deciding against using open source software on desktop computers are thatit is not what users want, and that there is not open source specialized software to satisfy the needs of theinstitution. Lack of support was mentioned by a high number of respondents both in FE and HE, but was lessimportant. Additionally for some FE institutions, migration costs are a weighty reason, although this wasmentioned by fewer people.
34
Figure 35: Reasons to decide against using open source software on desktops (Q30) (see Q20 for detailed description ofgraph notation)
35
Survey section 5: Comments by survey respondents
Q31: Other comments
Q31. Is there anything you would like to add to the information that you gave in this survey, and that youhave not been able to express?
The last question of the survey allowed survey respondents to contribute their own thoughts in addition to theanswers elicited by our questions. The free-text responses were analysed qualitatively to draw out the mainthemes brought up by the respondents. The results of the analysis are presented below. Not all thecomments have been reproduced here, but the quotes below are illustrative of the issues discussed inQuestion 31.
The comments can be divided into 4 main categories:
comments about plans for looking into open source solutions and examples of existing use of opensource software
comments about reasons for choosing closed source over open source software
comments opposing the rhetoric which juxtaposes open and closed source software
comments about issues not considered in the survey
1. Plans for looking into open source solutions and examples of existing use of open sourcesoftware
A few of the respondents report being involved with or having plans to look further into using (more) opensource software:
“Increasingly, we expect that our needs will be met via 'as a service' models in the cloud.”
Others report success stories with open source projects:
“We use asterix (sic) voip for 200 staff members including many critical users. All developed in house,very very successful.”
“We use a fair number of open source systems in core infrastructure and at the value added end. As well asthe obvious Apache, tomcat, Mysql etc our VL environmet is a combination of Moodle, Mahara, Kaltura,LAMS, Big Blue button, Wookie. We use ZerotoOne helpdesk system.”
2. Reasons for choosing closed source over open source software
A large number of comments concern reasons for choosing closed source over open source solutions. Anumber of respondents state that closed source solutions suit their institutions because they performadequately and furthermore carry education discounts, wherefore they are cost-efficient solutions.Conversely one respondent wrote about open source products not functioning adequately:
“Firefox (our default browser up until the last couple of weeks) has become more unstable and bloatedin recent times. OpenOffice is threatening to implement a ribbon interface in the next version, which Ihaven't heard a good word about with our users who use MSOffice2007. I am now under pressure toremove these products, just leaving IE & MSOffice on our desktops.”
One respondent commented that even though they would like to look more into open source solutions, thesenior management at their institution is against the idea. Another wrote about open source software notfitting with the institution’s overall procurement practices:
36
“Software procurement is (like anything else) subject to tendering processes - the University decides itneeds something, asks suppliers for information (including licensing and support costs), invites tendersand chooses the best fitting products. There is no route through which Open Source software which isnot provided and supported by a supplier can (nor arguably should) break into this competitive andevaluative process.”
A final very important consideration in this category, which was brought up multiple times in the comments, isthe lack of staff resources to dedicate to open source projects in institutions with small teams of ICT staff andthe risk of using non-standard and un-supported products in such institutions:
“In FE colleges, IT teams are relatively small and we cannot rely too heavily on their own knowledge tosupport open source because of the danger of critical staff leaving for higher pay or other reasons. It isbetter to use proprietary software for which support can be purchased in an emergency.”
3. Opposition between open and closed source software?
Several respondents voiced their concern about the tendency to juxtapose open and closed source softwareand called for a more nuanced understanding of the issue. They argued that the decision between open andclosed source software is only a small part of the overall decision making process when choosing softwaretools.
“We don't really engage in a proprietary vs. open source debate for its own sake. Instead we pick theright solution for our needs taking into account user and support expertise, total cost of ownership andcontribution to overall enterprise architecture.”
“I strongly believe that we should allow our students to use the latest and most commonly availableindustry standard software irrelevant to whether it is open or closed source software. This is completelywithout regard to ideological consideration to what I personally feel about what is right and what shouldbe put right in the world of software. That is not my place. Our students and staff should have access tothe best software that works. And when they leave us they have some small head start when usingsoftware in the workplace.”
4. Issues not considered in the survey
A number of respondents suggested other issues they consider when making decisions about open andclosed source software, which were not mentioned in the survey. These issues were:
interoperability between desktop software (such as OpenOffice) and large applications: “we think the MSCampus agreement gives is good value for us”
the need for open source software to meet the requirements of examination bodies and students’ needsin the workplace
use of open source software being hindered due to the general preference across the education sectorfor using closed source formats (PDF, DOC) for information exchange and other communication
questions on virtualization of servers and the desktop
questions of energy and environmental sustainability
other regularly perceived common arguments against choosing open source software, such as the perceived need for customization and issues relating to the pricing model of open source software
Similar types of issues are brought up by many of the respondents to the background survey. However,there is a greater enthusiasm for using and driving the implementation of open source software visible in thebackground survey responses. This is possibly due to the nature of the sample, which was drawn frompeople who had expressed interest in open source issues.
37
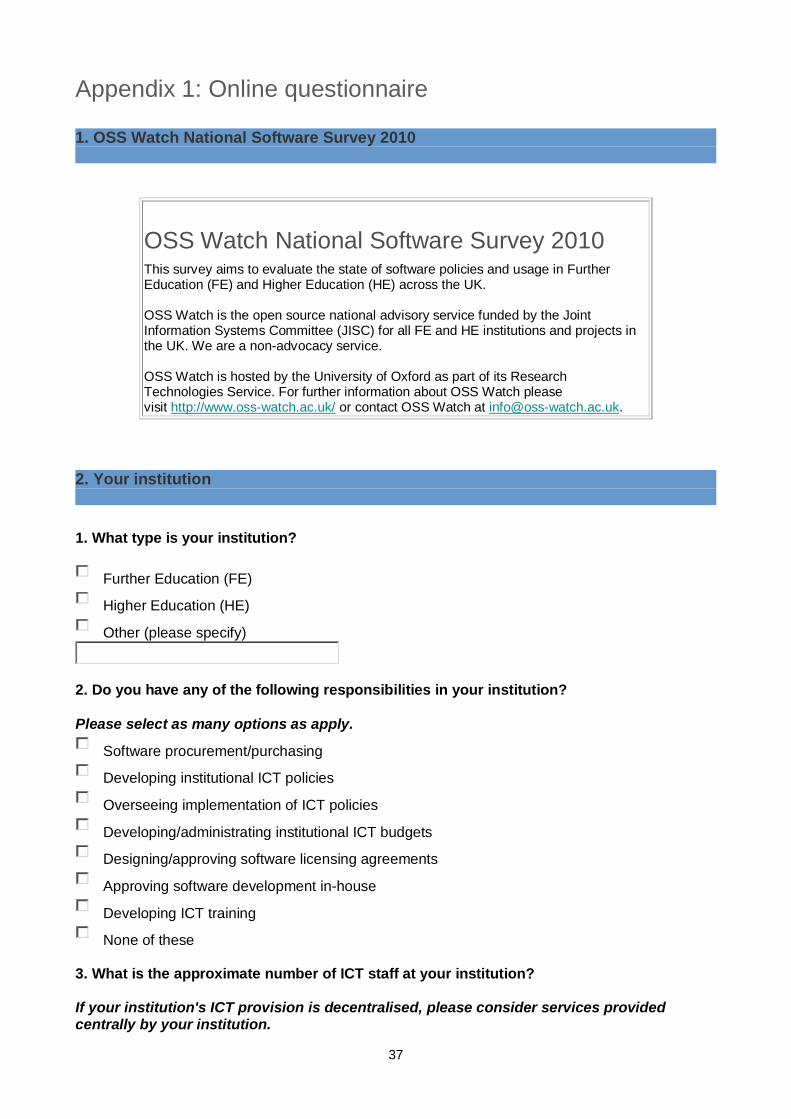
Appendix 1: Online questionnaire
1. OSS Watch National Software Survey 2010
OSS Watch National Software Survey 2010This survey aims to evaluate the state of software policies and usage in FurtherEducation (FE) and Higher Education (HE) across the UK.
OSS Watch is the open source national advisory service funded by the JointInformation Systems Committee (JISC) for all FE and HE institutions and projects inthe UK. We are a non-advocacy service.
OSS Watch is hosted by the University of Oxford as part of its ResearchTechnologies Service. For further information about OSS Watch pleasevisit http://www.oss-watch.ac.uk/ or contact OSS Watch at [email protected].
2. Your institution
1. What type is your institution?
Further Education (FE)
Higher Education (HE)
Other (please specify)
2. Do you have any of the following responsibilities in your institution?
Please select as many options as apply.
Software procurement/purchasing
Developing institutional ICT policies
Overseeing implementation of ICT policies
Developing/administrating institutional ICT budgets
Designing/approving software licensing agreements
Approving software development in-house
Developing ICT training
None of these
3. What is the approximate number of ICT staff at your institution?
If your institution's ICT provision is decentralised, please consider services providedcentrally by your institution.
38
3. ICT-related policies at your institution
This group of questions evaluates the processes followed by FE and HEinstitutions when procuring software, and possibly contributing software toexternal projects.
We have classified software as either open source or closed source.
Open source software (OSS) is software released under one of the licencesapproved by the Open Source Initiative (OSI). Some examples of theselicences are the General Public License (GPL), Apache License, ModifiedBSD License, Mozilla Public License, etc. You may also know of OSS as freesoftware or libre software (loosely speaking). More information about opensource software can be found on our website
4. What best describes your institution in terms of ICT-related policies?
My institution has an official ICT policy
Policies about ICT are spread across other policies, e.g. administration, management,procurement...
My institution has no policies regarding ICT
I don't know whether my institution has any policies regarding ICT
4a. What best describes your institution's policies about open and closed source software?
Only answer this question if you answered 'My institution has an official ICT policy' or'Policies about ICT are spread across other policies, e.g. administration, management,procurement...' to the previous question, otherwise please proceed to question 5
The preferredoption
To beconsideredas an option
MentionedNot
mentionedProhibited
Open source
Closed source
5. In practice, what software is considered for procurement/deployment in your institution?
Only open source software
Mostly open source software, with some closed source software
Open and closed source software equally
Mostly closed source software, with some open source software
Only closed source software
39
I don't know
Other (please specify)
6. What is your institution's policy regarding staff contributing to open source softwareprojects?
It is specified in individual employment contracts that they are allowed to do this
It is part of the institutional or departmental policies that staff can contribute
It is not regulated, but it is the working practice
Staff can do this in their own time, under their own responsibility
Staff are not allowed to contribute
I don't know
7. What is your institution's policy regarding staff contributing to closed source softwareprojects?
It is specified in individual employment contracts that they are allowed to do this
It is part of the institutional or departmental policies that staff can contribute
It is not regulated, but it is the working practice
Staff can do this in their own time, under their own responsibility
Staff are not allowed to contribute
I don't know
8. In practice, how often do ICT staff contribute to software projects?Contributions to software projects include being an active member of a mailing list,submitting patches, writing documentation or code, etc.
Always Often Sometimes Seldom Never I don't know
Open source
Closed source
4. Software on servers
The questions in this group refer to the server machines in your institutionand the software running on them.
9. What best describes the support for open source software running on your institution'sservers?
It is outsourced
It is done by some ICT staff, but it is not part of their job description
It is in the job description of some ICT staff
It is in the job description of all ICT staff
40
10. What best describes the support for closed source software running on yourinstitution's servers?
It is outsourced
It is done by some ICT staff, but it is not part of their job description
It is in the job description of some ICT staff
It is in the job description of all ICT staff
11. What is the approximate ratio of open and closed source software deployed on yourservers?
All or almostall deployedsoftware is
open source
Mostly opensource, butalso someproprietary
Roughly halfopen
source, halfproprietary
Mostlyproprietary,
but alsosome open
source
All or almostall deployedsoftware isproprietary
I don't know
In the past
Currently
Planned for thefuture
12. Which of the following operating systems are used on your institution's servers?
Please choose *all* that apply:
AIX
BSD (FreeBSD)
BSD (NetBSD)
BSD (OpenBSD)
Linux (Ubuntu)
Linux (Debian)
Linux (Red Hat)
Linux (SuSE)
Mac OS
Mac OS X
Solaris
Windows 2000 Advanced Server
Windows 2000 Server
Windows NT Server
Windows Server 2003
I don't know
41
Other (please specify)
13. Which of the following mail servers are used at your institution?
Please choose *all* that apply:
We outsource our email to a commercial company
Exim
MS Exchange
Postfix
Sendmail
Qmail
Novell Groupwise
I don't know
Other (please specify)
14. Which of the following webmail systems are used in your institution?
Please choose *all* that apply:
We don't use webmail
Microsoft Outlook Web Access
Novell NetMail WebAccess and Webmail
IMP/Horde Webmail
SquirrelMail
Oracle Webmail
JANET Web Mail Service
Google Mail
Novell Groupwise
I don't know
Other (please specify)
15. Which of the following database servers are used in your institution?
Please choose *all* that apply:
We don't use database servers
Microsoft SQL Server
MySQL
42
Oracle
PostgreSQL
Informix
I don't know
Other (please specify)
16. Which of the following Virtual Learning Environments (VLEs) are used in yourinstitution?Please choose *all* that apply:
We don't use any VLEs
ATutor
Blackboard/WebCT
Bodington
Moodle
Sakai
I don't know
Other (please specify)
17. Which of the following Content Management Systems (CMSs) are used in yourinstitution?
Please choose *all* that apply:
We don't use any CMSs
Microsoft SharePoint
Drupal
TerminalFour Site Manager
Plone/Zope
RedDot
Percussion Rhythmyx
Polopoly
I don't know
Other (please specify)
18. Which of the following Directory Service systems are used in your institution?
Directory Services deliver information, e.g. an online telephone directory. Typically, they
43
implement the Lightweight Directory Access Protocol (LDAP), and are often used by othersystems for authentication and/or authorisation.
Please choose *all* that apply
We don't use any Directory Service systems
Novell eDirectory
Microsoft Active Directory
Sun Java System Directory Server
OpenLDAP
I don't know
Other (please specify)
19. Which software, if any, does your institution use in the following areas?
Please only consider centrally-supported services rather than applications deployed forpurely local use (e.g. department, research group or individuals).
If you are using multiple solutions for the same function, please separate them withcommas.
Calendar/diary server:
Wiki:
Blog:
Project management:
Social networking:
Groupware, collaborative software:
Digital repositories:
20. Rank the top 5 criteria that your institution considers important when procuringsoftware for your servers, from most to least important.
Please number 5 of the boxes, 1being the highest priority
Performance of the software
Support quality (bug fixes, help desk, etc.)
Total Cost of Ownership (TCO)
Likelihood of getting 'locked in'
Staff preferences
Interoperability with other products
44
Software already being used in your institution
Upgrade costs
Ease of customization
Ideological reasons
Meeting user expectations
Migration costs
Legal issues including licensing
Staff previous expertise, need for training
Support cost
21. Which new server software systems are currently being considered for procurement atyour institution? Please also include old systems being considered for replacement.
This could be, for example, because your institution does not have some systems, butwould like to procure them, or because your current systems do not meet your needs.Please choose *all* that apply:
Operating systems
Mail servers
Webmail
Databases
Virtual Learning Environments (VLEs)
Content Management Systems (CMSs)
Directory Service systems (e.g. LDAP)
Calendar/diary server
Wiki
Blog
Project management
Social networking
Groupware, collaborative software
Digital repositories
Other (please specify)
22. If your institution decides against using an open source software system on its servers,what are the top 5 most likely reasons? Please rank the following reasons from most toleast likely.
Please note that you will have the chance to add comments at the end of the survey.
45
Please number 5 of the boxes, 1being the most likely reason
There is no open source solution for our needs
Legal issues including licensing
Poor quality software
Existing contractual obligations
Interoperability and migration problems
Migration costs
Time costs of identifying relevant software
Lack of support
Lack of staff expertise, training needs
Not what users want
Poor documentation
Solution does not scale
6. Other information
This final question is a chance for you to add your own thoughts.
31. Is there anything you would like to add to the information that you gave in this survey,and that you have not been able to express?
46
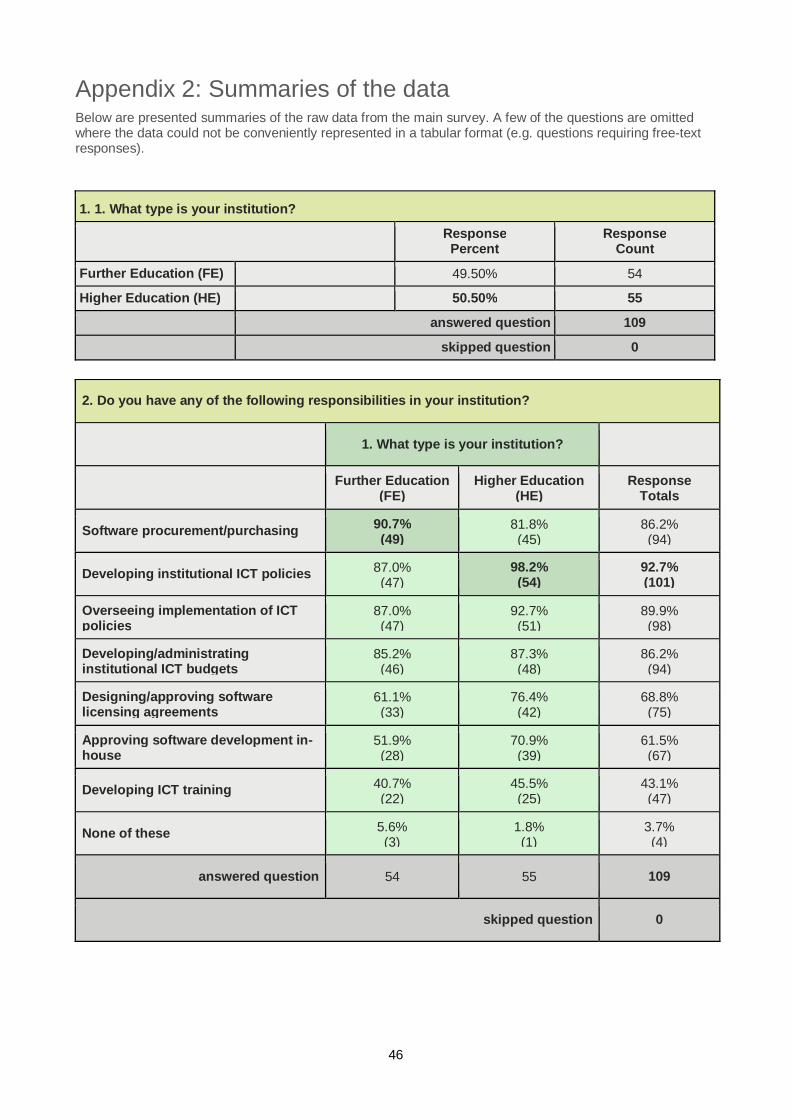
Appendix 2: Summaries of the dataBelow are presented summaries of the raw data from the main survey. A few of the questions are omittedwhere the data could not be conveniently represented in a tabular format (e.g. questions requiring free-textresponses).
1. 1. What type is your institution?
ResponsePercent
ResponseCount
Further Education (FE) 49.50% 54
Higher Education (HE) 50.50% 55
answered question 109
skipped question 0
2. Do you have any of the following responsibilities in your institution?
1. What type is your institution?
Further Education(FE)
Higher Education(HE)
ResponseTotals
Software procurement/purchasing90.7%(49)
81.8%(45)
86.2%(94)
Developing institutional ICT policies 87.0%(47)
98.2%(54)
92.7%(101)
Overseeing implementation of ICTpolicies
87.0%(47)
92.7%(51)
89.9%(98)
Developing/administratinginstitutional ICT budgets
85.2%(46)
87.3%(48)
86.2%(94)
Designing/approving softwarelicensing agreements
61.1%(33)
76.4%(42)
68.8%(75)
Approving software development in-house
51.9%(28)
70.9%(39)
61.5%(67)
Developing ICT training 40.7%(22)
45.5%(25)
43.1%(47)
None of these 5.6%(3)
1.8%(1)
3.7%(4)
answered question 54 55 109
skipped question 0

47
4. What best describes your institution in terms of ICT-related policies?
1. What type is your institution?
FurtherEducation (FE)
Higher Education (HE) ResponseTotals
My institution has an official ICTpolicy
76.0%(38)
66.7%(34)
71.3%(72)
Policies about ICT are spread acrossother policies, e.g. administration,management, procurement...
24.0%(12)
27.5%(14)
25.7%(26)
My institution has no policiesregarding ICT
0.0%(0)
5.9%(3)
3.0%(3)
I don't know whether my institutionhas any policies regarding ICT
0.0%(0)
0.0%(0)
0.0%(0)
answered question 50 51 101
skipped question 8
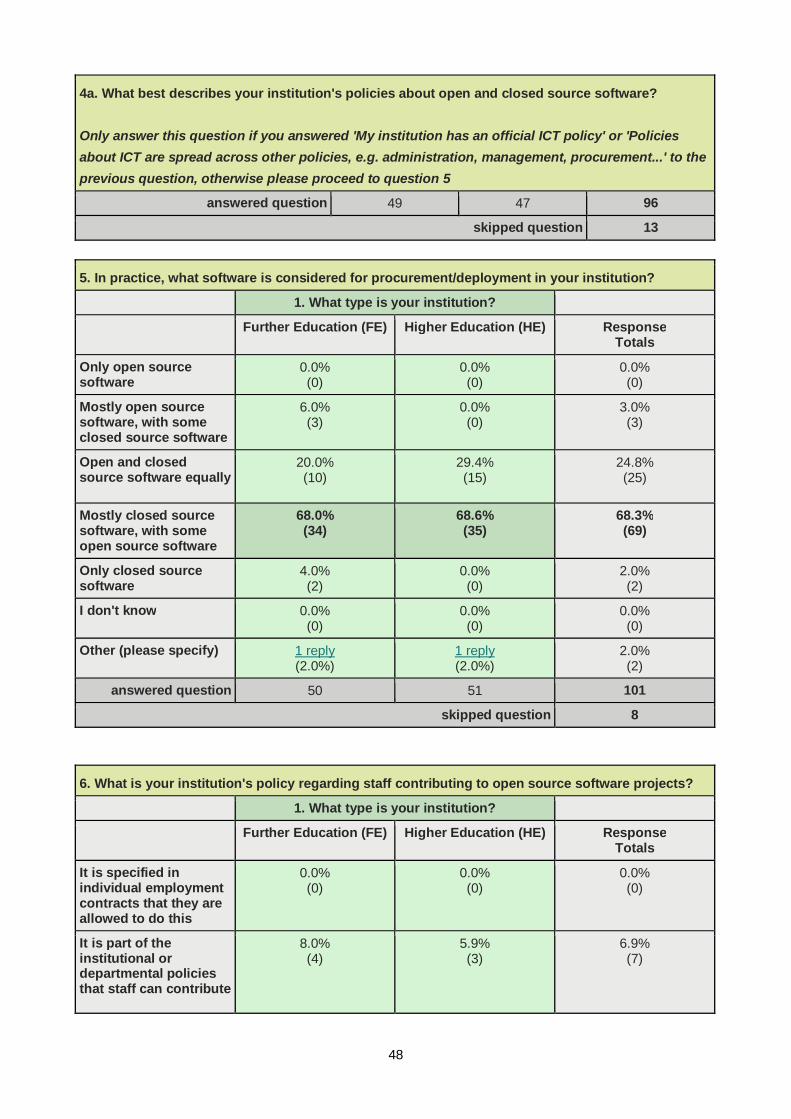
4a. What best describes your institution's policies about open and closed source software?
Only answer this question if you answered 'My institution has an official ICT policy' or 'Policies
about ICT are spread across other policies, e.g. administration, management, procurement...' to the
previous question, otherwise please proceed to question 5
1. What type is your institution?
Further Education(FE)
Higher Education(HE)
ResponseTotals
Open source The preferredoption
4.1%(2)
0.0%(0)
To be consideredas an option
61.2%(30)
73.9%(34)
Mentioned 6.1%(3)
10.9%(5)
Not mentioned 28.6%(14)
15.2%(7)
Prohibited 0.0%(0)
0.0%(0)
49 46 95
Closed source The preferredoption
34.7%(17)
15.2%(7)
To be consideredas an option
32.7%(16)
69.6%(32)
Mentioned 6.1%(3)
0.0%(0)
Not mentioned 26.5%(13)
15.2%(7)
Prohibited 0.0%(0)
0.0%(0)
49 46 95
48
4a. What best describes your institution's policies about open and closed source software?
Only answer this question if you answered 'My institution has an official ICT policy' or 'Policies
about ICT are spread across other policies, e.g. administration, management, procurement...' to the
previous question, otherwise please proceed to question 5
answered question 49 47 96
skipped question 13
5. In practice, what software is considered for procurement/deployment in your institution?
1. What type is your institution?
Further Education (FE) Higher Education (HE) ResponseTotals
Only open sourcesoftware
0.0%(0)
0.0%(0)
0.0%(0)
Mostly open sourcesoftware, with someclosed source software
6.0%(3)
0.0%(0)
3.0%(3)
Open and closedsource software equally
20.0%(10)
29.4%(15)
24.8%(25)
Mostly closed sourcesoftware, with someopen source software
68.0%(34)
68.6%(35)
68.3%(69)
Only closed sourcesoftware
4.0%(2)
0.0%(0)
2.0%(2)
I don't know 0.0%(0)
0.0%(0)
0.0%(0)
Other (please specify) 1 reply(2.0%)
1 reply(2.0%)
2.0%(2)
answered question 50 51 101
skipped question 8
6. What is your institution's policy regarding staff contributing to open source software projects?
1. What type is your institution?
Further Education (FE) Higher Education (HE) ResponseTotals
It is specified inindividual employmentcontracts that they areallowed to do this
0.0%(0)
0.0%(0)
0.0%(0)
It is part of theinstitutional ordepartmental policiesthat staff can contribute
8.0%(4)
5.9%(3)
6.9%(7)
49
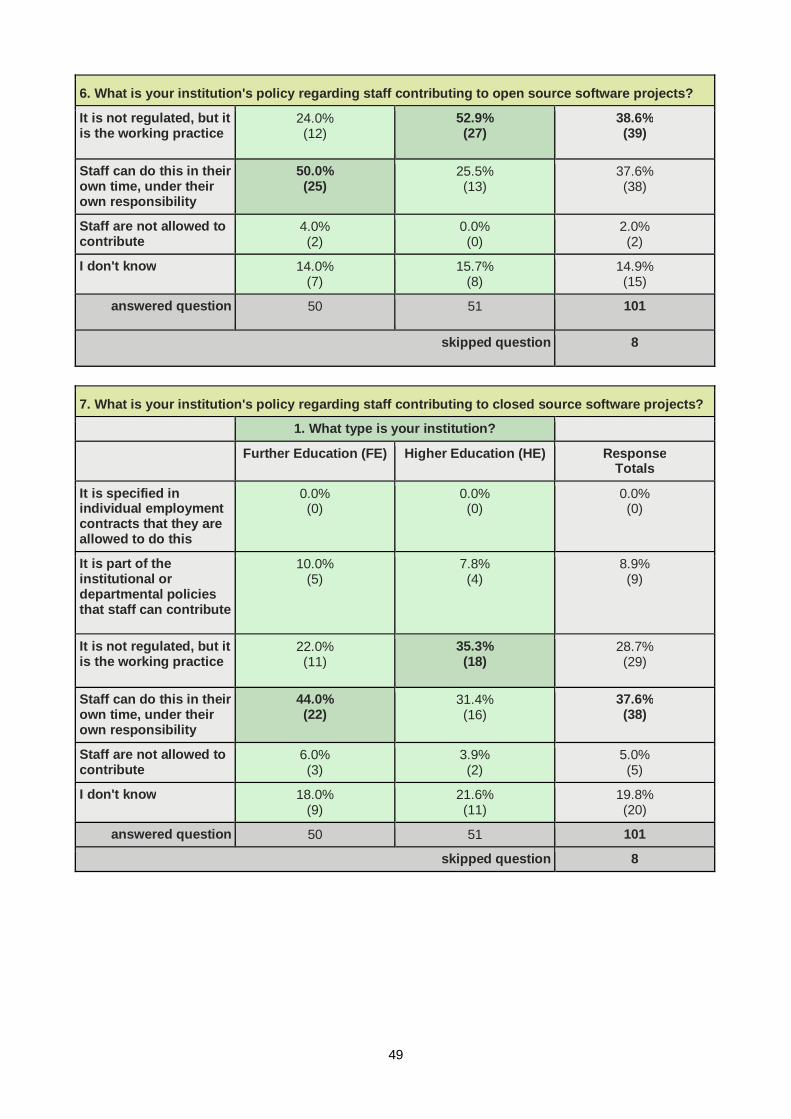
6. What is your institution's policy regarding staff contributing to open source software projects?
It is not regulated, but itis the working practice
24.0%(12)
52.9%(27)
38.6%(39)
Staff can do this in theirown time, under theirown responsibility
50.0%(25)
25.5%(13)
37.6%(38)
Staff are not allowed tocontribute
4.0%(2)
0.0%(0)
2.0%(2)
I don't know 14.0%(7)
15.7%(8)
14.9%(15)
answered question 50 51 101
skipped question 8
7. What is your institution's policy regarding staff contributing to closed source software projects?
1. What type is your institution?
Further Education (FE) Higher Education (HE) ResponseTotals
It is specified inindividual employmentcontracts that they areallowed to do this
0.0%(0)
0.0%(0)
0.0%(0)
It is part of theinstitutional ordepartmental policiesthat staff can contribute
10.0%(5)
7.8%(4)
8.9%(9)
It is not regulated, but itis the working practice
22.0%(11)
35.3%(18)
28.7%(29)
Staff can do this in theirown time, under theirown responsibility
44.0%(22)
31.4%(16)
37.6%(38)
Staff are not allowed tocontribute
6.0%(3)
3.9%(2)
5.0%(5)
I don't know 18.0%(9)
21.6%(11)
19.8%(20)
answered question 50 51 101
skipped question 8
50
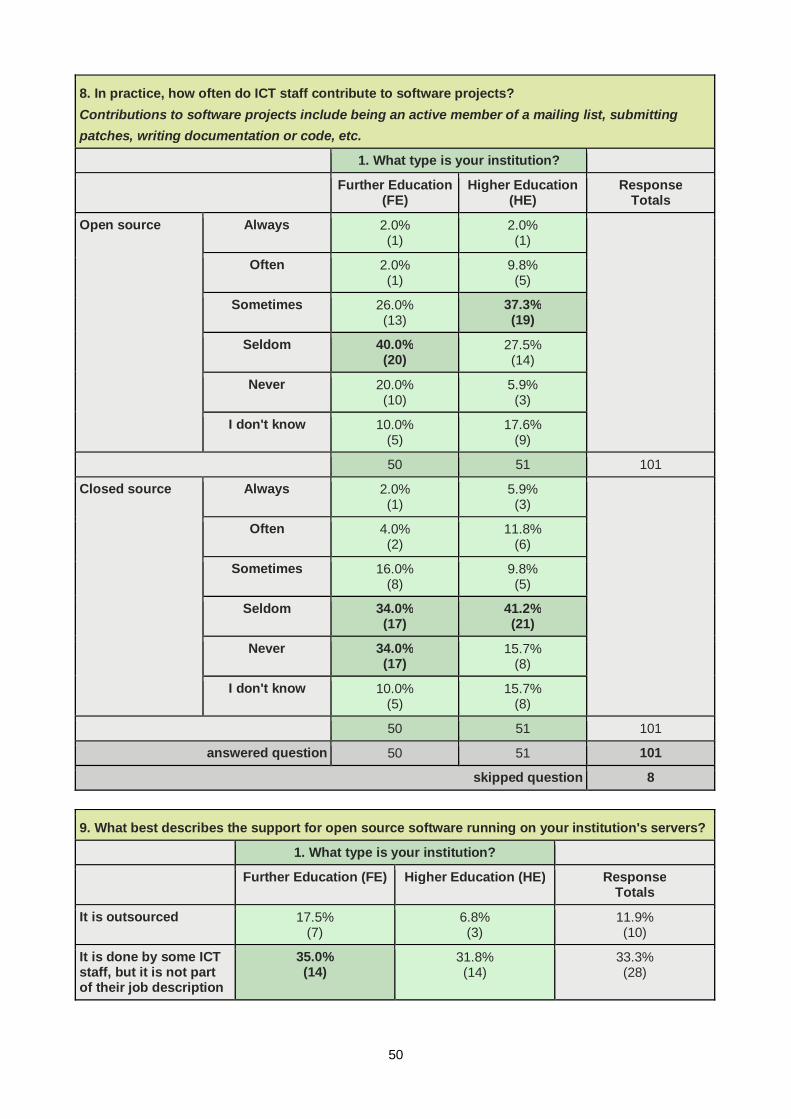
8. In practice, how often do ICT staff contribute to software projects?
Contributions to software projects include being an active member of a mailing list, submitting
patches, writing documentation or code, etc.
1. What type is your institution?
Further Education(FE)
Higher Education(HE)
ResponseTotals
Open source Always 2.0%(1)
2.0%(1)
Often 2.0%(1)
9.8%(5)
Sometimes 26.0%(13)
37.3%(19)
Seldom 40.0%(20)
27.5%(14)
Never 20.0%(10)
5.9%(3)
I don't know 10.0%(5)
17.6%(9)
50 51 101
Closed source Always 2.0%(1)
5.9%(3)
Often 4.0%(2)
11.8%(6)
Sometimes 16.0%(8)
9.8%(5)
Seldom 34.0%(17)
41.2%(21)
Never 34.0%(17)
15.7%(8)
I don't know 10.0%(5)
15.7%(8)
50 51 101
answered question 50 51 101
skipped question 8
9. What best describes the support for open source software running on your institution's servers?
1. What type is your institution?
Further Education (FE) Higher Education (HE) ResponseTotals
It is outsourced 17.5%(7)
6.8%(3)
11.9%(10)
It is done by some ICTstaff, but it is not partof their job description
35.0%(14)
31.8%(14)
33.3%(28)
51
9. What best describes the support for open source software running on your institution's servers?
It is in the jobdescription of some ICTstaff
35.0%(14)
56.8%(25)
46.4%(39)
It is in the jobdescription of all ICTstaff
12.5%(5)
4.5%(2)
8.3%(7)
answered question 40 44 84
skipped question 25
10. What best describes the support for closed source software running on your institution's
servers?
1. What type is your institution?
Further Education (FE) Higher Education (HE) ResponseTotals
It is outsourced 20.0%(8)
0.0%(0)
9.5%(8)
It is done by some ICTstaff, but it is not partof their job description
10.0%(4)
6.8%(3)
8.3%(7)
It is in the jobdescription of some ICTstaff
40.0%(16)
81.8%(36)
61.9%(52)
It is in the jobdescription of all ICTstaff
30.0%(12)
11.4%(5)
20.2%(17)
answered question 40 44 84
skipped question 25
11. What is the approximate ratio of open and closed source software deployed on your servers?
1. What type is your institution?
Further Education(FE)
Higher Education(HE)
ResponseTotals
In the past All or almost alldeployed software
is open source
0.0%(0)
0.0%(0)
Mostly opensource, but alsosome proprietary
0.0%(0)
0.0%(0)
Roughly half opensource, halfproprietary
5.0%(2)
9.1%(4)
Mostly proprietary,but also someopen source
25.0%(10)
31.8%(14)
52
11. What is the approximate ratio of open and closed source software deployed on your servers?
All or almost alldeployed software
is proprietary
70.0%(28)
54.5%(24)
I don't know 0.0%(0)
4.5%(2)
40 44 84
Currently All or almost alldeployed software
is open source
0.0%(0)
0.0%(0)
Mostly opensource, but alsosome proprietary
5.0%(2)
0.0%(0)
Roughly half opensource, halfproprietary
2.5%(1)
13.6%(6)
Mostly proprietary,but also someopen source
60.0%(24)
68.2%(30)
All or almost alldeployed software
is proprietary
32.5%(13)
15.9%(7)
I don't know 0.0%(0)
2.3%(1)
40 44 84
Planned for thefuture
All or almost alldeployed software
is open source
0.0%(0)
0.0%(0)
Mostly opensource, but alsosome proprietary
7.5%(3)
0.0%(0)
Roughly half opensource, halfproprietary
10.0%(4)
36.4%(16)
Mostly proprietary,but also someopen source
52.5%(21)
40.9%(18)
All or almost alldeployed software
is proprietary
25.0%(10)
9.1%(4)
I don't know 5.0%(2)
13.6%(6)
40 44 84
answered question 40 44 84
skipped question 25
53
12. Which of the following operating systems are used on your institution's servers?
Please choose *all* that apply:
1. What type is your institution?
Further Education (FE) Higher Education (HE) ResponseTotals
AIX 2.5%(1)
13.6%(6)
8.3%(7)
BSD (FreeBSD) 5.0%(2)
2.3%(1)
3.6%(3)
BSD (NetBSD) 0.0%(0)
0.0%(0)
0.0%(0)
BSD (OpenBSD) 2.5%(1)
2.3%(1)
2.4%(2)
Linux (Ubuntu) 25.0%(10)
34.1%(15)
29.8%(25)
Linux (Debian) 10.0%(4)
13.6%(6)
11.9%(10)
Linux (Red Hat) 25.0%(10)
56.8%(25)
41.7%(35)
Linux (SuSE) 25.0%(10)
36.4%(16)
31.0%(26)
Mac OS 12.5%(5)
22.7%(10)
17.9%(15)
Mac OS X 45.0%(18)
56.8%(25)
51.2%(43)
Solaris 5.0%(2)
45.5%(20)
26.2%(22)
Windows 2000Advanced Server
5.0%(2)
25.0%(11)
15.5%(13)
Windows 2000 Server 22.5%(9)
22.7%(10)
22.6%(19)
Windows NT Server 10.0%(4)
13.6%(6)
11.9%(10)
Windows Server 2003 90.0%(36)
84.1%(37)
86.9%(73)
I don't know 0.0%(0)
4.5%(2)
2.4%(2)
Other (please specify) 15 replies(37.5%)
13 replies(29.5%)
33.3%(28)
answered question 40 44 84
skipped question 25
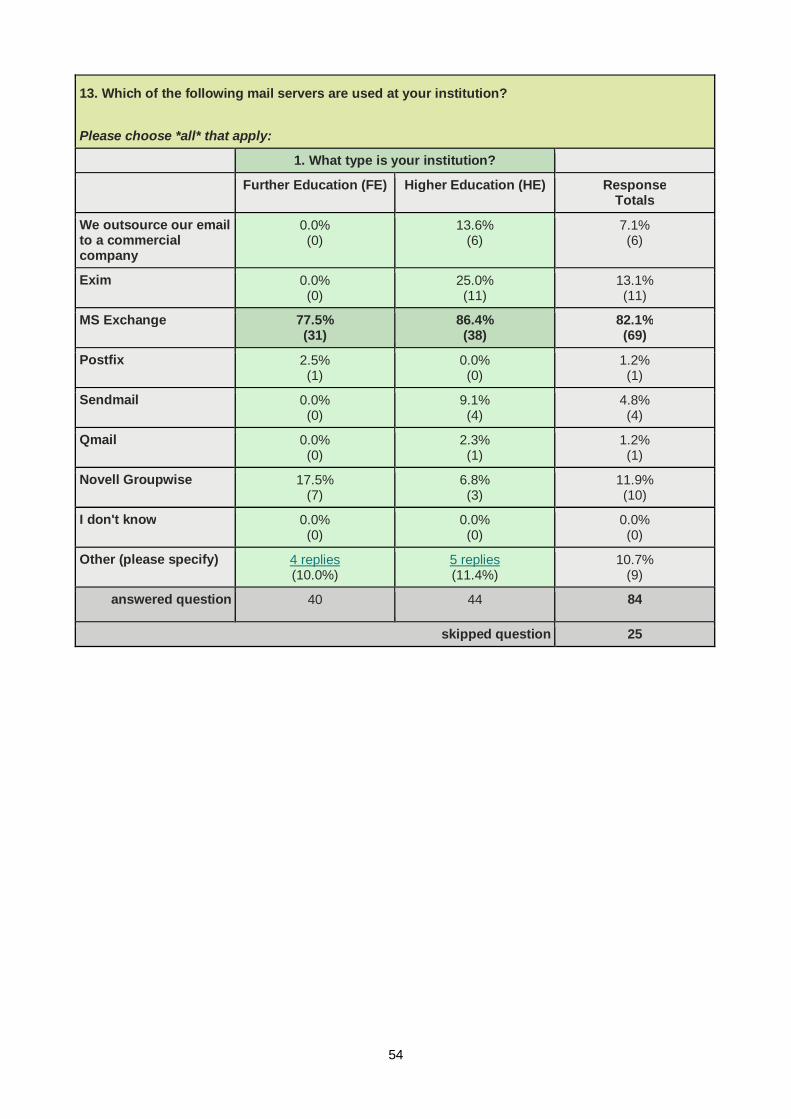
54
13. Which of the following mail servers are used at your institution?
Please choose *all* that apply:
1. What type is your institution?
Further Education (FE) Higher Education (HE) ResponseTotals
We outsource our emailto a commercialcompany
0.0%(0)
13.6%(6)
7.1%(6)
Exim 0.0%(0)
25.0%(11)
13.1%(11)
MS Exchange 77.5%(31)
86.4%(38)
82.1%(69)
Postfix 2.5%(1)
0.0%(0)
1.2%(1)
Sendmail 0.0%(0)
9.1%(4)
4.8%(4)
Qmail 0.0%(0)
2.3%(1)
1.2%(1)
Novell Groupwise 17.5%(7)
6.8%(3)
11.9%(10)
I don't know 0.0%(0)
0.0%(0)
0.0%(0)
Other (please specify) 4 replies(10.0%)
5 replies(11.4%)
10.7%(9)
answered question 40 44 84
skipped question 25