Embed Size (px)
Citation preview
OSNR monitoring technique based on cascaded long-period fiber grating with
optically tunable phase shifter
Sie-Wook Jeon1, Young Ho Kim1, Byeong Ha Lee1, Min A Jung2 and
Chang-Soo Park1*
1Department of Information and Communications, Gwangju Institute of Science and Technology, 1, Oryong-dong, Buk-Gu, Gwangju 500-712 Republic of Korea
2Department of Computer Education, Mokpo National University, 61 Dorim-ri, Cheonggye-myeon, Muan-gun, jeonnam, Republic of Korea
*Corresponding author: [email protected]
Abstract: An optical signal-to-noise ratio (OSNR) monitoring technique using a cascaded long-period fiber grating with a tunable phase shifter is proposed for non return-to-zero on-off-keying (NRZ-OOK) and differential phase shift keying (DPSK) signals. This method is based on two key points: first, the cascaded long period fiber grating (CLPG) acts as an optical delay interferometer (ODI) by Mach-Zehnder configuration consisting of the core and cladding modes inside the CLPG. Secondly, an optically tunable phase shifter using an Yb3+ doped optical fiber (YDF) is inserted between the CLPG. The phase of the modulated signal propagating along the core mode of YDF is controlled by adjusting pumping power of 976-nm laser diode (LD). By combining the CLPG with the optically tunable phase shifter, the OSNR monitoring could be successfully executed.
©2008 Optical Society of America
OCIS codes: (060.2340) Fiber optics components; (060.2330) Fiber optics communications; (060.4510) Optical communications.
References and links
1. J. H. Lee, H. Y. Choi, S. K. Shin, and Y. C. Chung, “A review of the polarization-nulling technique for monitoring optical-signal-to-noise ratio in dynamic WDM networks,” J. Lightwave Technol. 24, 4162-4171 (2006).
2. M. Petersson, H. Sunnerud, M. Karlsson, and B.-E. Olsson, “Performance monitoring in optical networks using Stokes parameters,” Photon. Technol. Lett. 16, 686 -688 (2004).
3. M. D. Feuer, “Measurement of OSNR in the presence of partially polarized ASE,” Photon. Technol. Lett. 17, 435-437 (2005).
4. C. Xie, D. C. Kilper, L. Möller, and R. Ryf, “Orthogonal-polarization heterodyne OSNR monitoring insensitive to polarization-mode dispersion and nonlinear polarization scattering,” J. Lightwave Technol. 25, 177-183 (2007).
5. Z. Tao, Z. Chen, L. Fu, D. Wu, and A. Xu, “Monitoring of OSNR by using a Mach-Zehnder interferometer,” Microw. and Opt. Technol. Lett. 30, 63-65 (2001).
6. X. Liu, Y.-H. Kao, S. Chandrasekhar, I. Kang, S. Cabot, and L. L. Buhl, “OSNR monitoring method for OOK and DPSK based on optical delay interferometer,” Photon. Technol. Lett. 19, 1172 -1174 (2007).
7. Y.-C. Ku, C.-K. Chan, and L.-K. Chen, “A novel robust OSNR monitoring technique with 40-dB dynamic range using phase modulator embedded fiber loop mirror,” in Optical Fiber Communication Conference (OFC’2006), Anaheim, USA, Paper OWN6 (2006).
8. T.-Y. Kim, M. Hanawa, Y. Chung, W.-T. Han, and C.-S. Park, “Cascaded long period fibre grating-based DPSK demodulator with optically tunable phase shifter,” in European Conference on Optical Communications (ECOC’2007), Berlin, Germany, Paper 9.4.5 (2007).
(C) 2008 OSA 8 December 2008 / Vol. 16, No. 25 / OPTICS EXPRESS 20603#102822 - $15.00 USD Received 15 Oct 2008; revised 24 Nov 2008; accepted 24 Nov 2008; published 26 Nov 2008
9. T. J. Ahn, B. H. Lee, Y. Chung, U. C. Paek and W. T. Han, “Measurement of refractive index change upon
UV irradiation of optical fiber using a LPG pair,” in Opto-Electronics and Communications Conference (OECC’2000), Chiba, Japan, Tech. Dig., 12P-45, 276-277, (2000).
1. Introduction
In fiber optic system, performance monitoring such as channel power, chromatic dispersion and signal-to-noise ratio (SNR) are important to assess system performance. Performance monitoring has been done in the electrical domain. However, in optical networks, optical performance monitoring is crucial because it guarantees optical transparency to bit rates and data formats of the incoming signal. Furthermore, optical signal-to-noise ratio (OSNR) monitoring provides a vital means to directly measure the quality of the optical signal on the wavelength propagating through the amplified WDM networks. Recently, several OSNR monitoring methods have been proposed for in-band OSNR because out-of-band OSNR can be varied due to the channel crosstalk and the erbium doped fiber amplifier (EDFA) gain profile. The polarization-nulling method [1] and degree-of-polarization (DOP) [2] were introduced to distinguish in-band signal and noise power. The amplified spontaneous emission (ASE) was selected by removing the polarized laser signal using a linear polarizer and a quarter-wave plate under the assumption that the signal is fully polarized, and the ASE noise is completely unpolarized. When the ASE noise has nonzero DOP or the signal is depolarized by polarization-mode dispersion (PMD), errors occur in the measured OSNR [3]. To increase immunity to PMD, another method based on orthogonal-polarization heterodyne mixing of two spectral components of signals orthogonally polarized to each other has been proposed [4]. This method also assumed that the ASE noise is completely depolarized. Other approaches used the interference pattern formed by adopting Mach-Zehnder interferometer (MZI) [5], a 1-bit optical delay interferometer (ODI) [6], and a phase modulator embedded fiber loop mirror [7]. These monitoring techniques are insensitive to PMD and chromatic dispersion (CD). They also monitor the OSNR by measuring maximum and minimum power at the constructive and destructive interference, respectively.
In this paper, a novel OSNR monitoring technique based on the cascaded long period fiber grating (CLPG) with an optically tunable phase shifter using an Yb3+ doped optical fiber (YDF) is proposed. Differentially from the conventional waveguide-type MZI; it uses two light paths along the core and cladding modes inside the CLPG as two different arms. By using the phase shifter inserted in the CLPG, the phase difference of the lights in the core and cladding regions can be exactly controlled, thereby, the OSNR measurement is possible by changing the phase difference more than π. This proposed method is independent of PMD, CD, and bit rate. Moreover, it is insensitive to environmental fluctuations compared to any other optical delay interferometers because the two modes undergo almost same perturbation along the fiber. In the following section, we show the feasibility through OSNR experimental measurement from NRZ-OOK and DPSK signals at 1, 2.5, and 10-Gb/s bit rate.
2. Operating principle
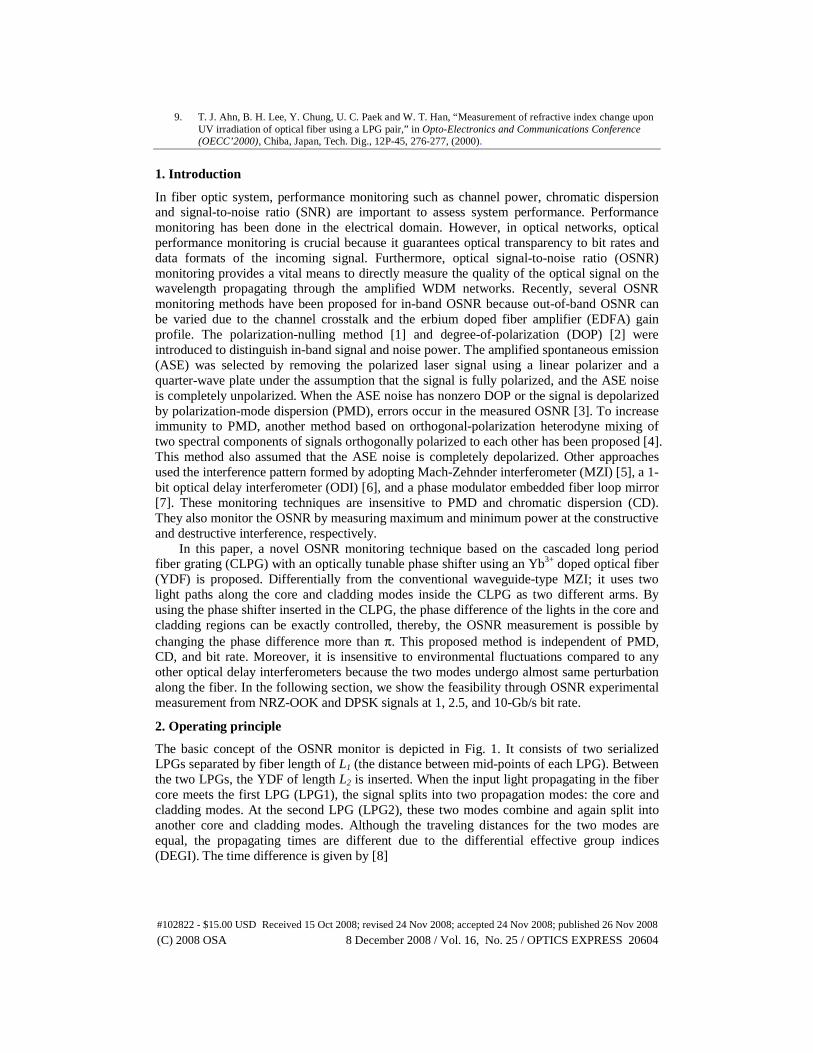
The basic concept of the OSNR monitor is depicted in Fig. 1. It consists of two serialized LPGs separated by fiber length of L1 (the distance between mid-points of each LPG). Between the two LPGs, the YDF of length L2 is inserted. When the input light propagating in the fiber core meets the first LPG (LPG1), the signal splits into two propagation modes: the core and cladding modes. At the second LPG (LPG2), these two modes combine and again split into another core and cladding modes. Although the traveling distances for the two modes are equal, the propagating times are different due to the differential effective group indices (DEGI). The time difference is given by [8]
(C) 2008 OSA 8 December 2008 / Vol. 16, No. 25 / OPTICS EXPRESS 20604#102822 - $15.00 USD Received 15 Oct 2008; revised 24 Nov 2008; accepted 24 Nov 2008; published 26 Nov 2008
( )
c
effΔmL
effΔmLL
Δt YDFSMF )(2
)(21 +−
= , (1)
where )(SMFeffmΔ and
)(YDFeffmΔ are the DEGI between the two modes in the SMF and YDF
respectively. The definition of the DEGI is cladeff
coreeffeff nnm −=Δ , where core
effn and clad
effn are the
effective index of fiber core and cladding respectively. c is the speed of light in the vacuum, L1 is the distance between the LPGs and L2 is the length of the YDF. Also, the FSR can be calculated by taking the inverse form of the time difference. When a pumping light of 976-nm LD is launched into the YDF through the WDM coupler, the refractive index of the core of the YDF is changed, thus, the relative phase between core and cladding mode is changed. The relative phase by an LPG pair is well known as the following equation [9]
( ) 1Lclco ββ −−≈Φ , (2)
in which βco , βcl are propagation constants of core and cladding modes. The definition of the propagation constants are λπβ /2 core
effco n= and λπβ /2 cladeffcl n= respectively. By using the Eq.
(2), the relative phase (Φ) of the two modes can be optically controlled by the pump power of
976-nm LD. If the relative phase (Φ) is set to π, the minimum power including only incoherent ASE noise is extracted in the destructive interference. On the other hand, the maximum power (the coherent optical signal and the ASE noise) is extracted in the constructive interference when the phase difference is 0. By applying the low-frequency sinusoidal signal to the pump LD, the maximum and minimum powers can be periodically measured. The detected powers can be used to calculate the OSNR, and the equation is given by [7]
( ) ( )sigsiga
aOSNR
γγ +−−−=
11
1 , (3)
where a = Pmax / Pmin and γsig is the distinctness of the signal interference.
L1LPG1 LPG2
WDMOptical
Power Meter
Optical Bandpass
FilterL2
SMF SMFYDF
FunctionGenerator
PumpLD
WDM
Isolator
Fig. 1. Schematic diagram and working principle for OSNR monitoring.
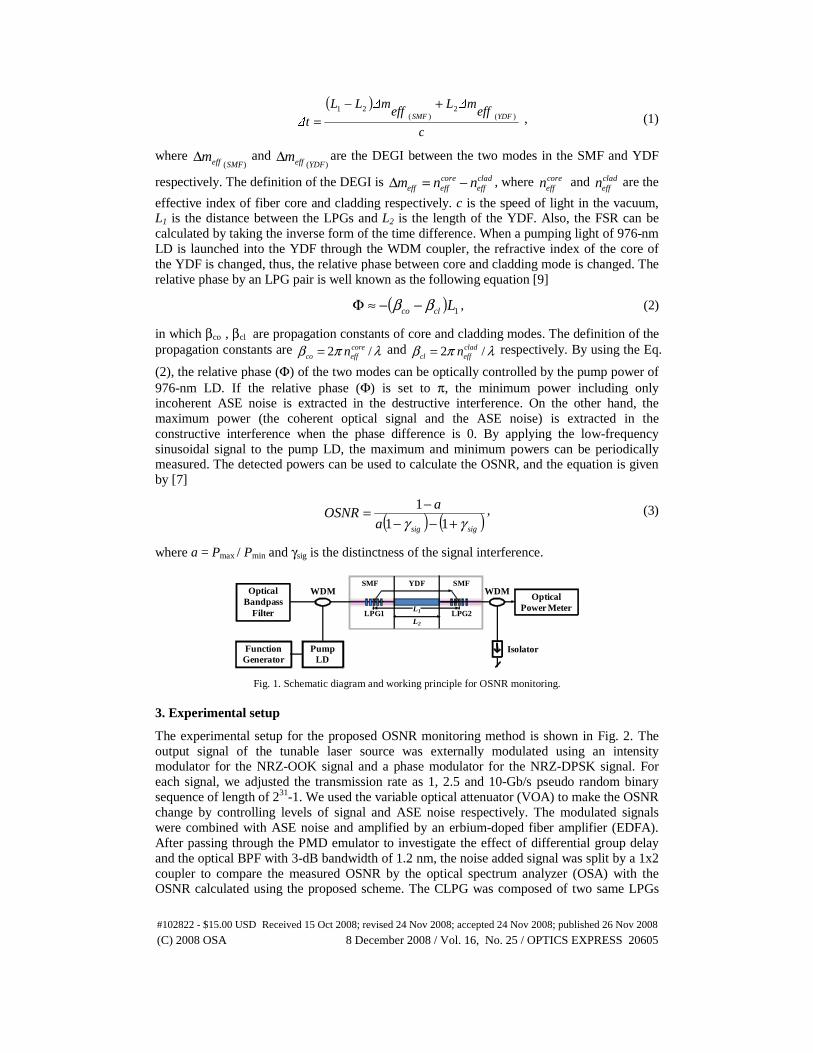
3. Experimental setup
The experimental setup for the proposed OSNR monitoring method is shown in Fig. 2. The output signal of the tunable laser source was externally modulated using an intensity modulator for the NRZ-OOK signal and a phase modulator for the NRZ-DPSK signal. For each signal, we adjusted the transmission rate as 1, 2.5 and 10-Gb/s pseudo random binary sequence of length of 231-1. We used the variable optical attenuator (VOA) to make the OSNR change by controlling levels of signal and ASE noise respectively. The modulated signals were combined with ASE noise and amplified by an erbium-doped fiber amplifier (EDFA). After passing through the PMD emulator to investigate the effect of differential group delay and the optical BPF with 3-dB bandwidth of 1.2 nm, the noise added signal was split by a 1x2 coupler to compare the measured OSNR by the optical spectrum analyzer (OSA) with the OSNR calculated using the proposed scheme. The CLPG was composed of two same LPGs
(C) 2008 OSA 8 December 2008 / Vol. 16, No. 25 / OPTICS EXPRESS 20605#102822 - $15.00 USD Received 15 Oct 2008; revised 24 Nov 2008; accepted 24 Nov 2008; published 26 Nov 2008
and an YDF. The length, L1, of the fabricated CLPG was about 16 cm consisting of conventional SMF with 6 cm length and YDF with 10 cm length, i.e. L2=10 cm and L1 - L2=6 cm. The DEGIs of the used SMF and YDF are 7.5x10⁻³ and 1.38x10⁻² at 1550 nm respectively. Thus, the calculated time difference is 6.1 ps from Eq. (1) and the corresponding FSR is 163.9 GHz, 1.31 nm in wavelength at 1550 nm. Grating was written on a conventional single mode fiber (SMF) by irradiation of a KrF excimer laser beam through a uniform phase mask of
550 μm period. Before writing the LPG, the SMF was hydrogen loaded at 100℃ under a pressure of 10 MPa for a week. After writing the LPG on the bare fiber, fibers were annealed
at 100℃ for 24 h. The 976-nm pumping light driven by the sinusoidal signal of 500 mHz was launched into the YDF through a 980/1550-nm WDM coupler. At high pumping power, the residual pump power influenced the measurement accuracy. For this reason, we used two WDM couplers after the CLPG in a cascaded form to get narrower pass band. The sweeping speed was limited below 500 mHz for the reproducibility of the measured value. It samples the output power from the CLPG every 10 ms and gives the maximum and the minimum values for the calculation of OSNR.
TLSPC
PhaseModulator
10 Gb/s PRBS
IntensityModulator
PPG
EDFA
OSA
VOA
BPF
ISO
ASE
3dBPMD
Emulator
Function Generator
980nmPump
10
90Yb3+
PowerMeter WDM
LPG1 LPG2WDM
VOA
Fig. 2. Experimental setup. TLS: tunable laser source, PC: polarization controller, EDFA: erbium-doped fiber amplifier, PPG: pulse pattern generator, LPG: long-period fiber grating VOA: variable optical attenuator, BPF: optical bandpass filter, WDM: 980/1550 WDM coupler, OSA: optical spectrum analyzer, ISO: isolator.
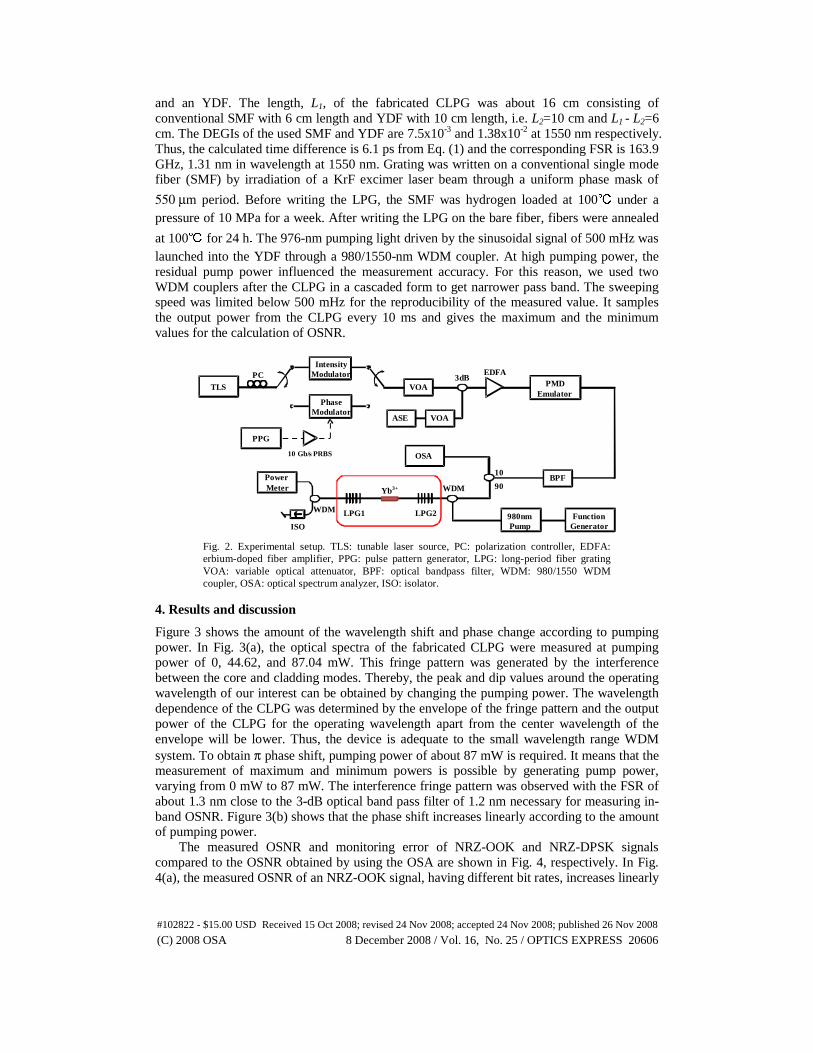
4. Results and discussion
Figure 3 shows the amount of the wavelength shift and phase change according to pumping power. In Fig. 3(a), the optical spectra of the fabricated CLPG were measured at pumping power of 0, 44.62, and 87.04 mW. This fringe pattern was generated by the interference between the core and cladding modes. Thereby, the peak and dip values around the operating wavelength of our interest can be obtained by changing the pumping power. The wavelength dependence of the CLPG was determined by the envelope of the fringe pattern and the output power of the CLPG for the operating wavelength apart from the center wavelength of the envelope will be lower. Thus, the device is adequate to the small wavelength range WDM system. To obtain π phase shift, pumping power of about 87 mW is required. It means that the measurement of maximum and minimum powers is possible by generating pump power, varying from 0 mW to 87 mW. The interference fringe pattern was observed with the FSR of about 1.3 nm close to the 3-dB optical band pass filter of 1.2 nm necessary for measuring in-band OSNR. Figure 3(b) shows that the phase shift increases linearly according to the amount of pumping power.
The measured OSNR and monitoring error of NRZ-OOK and NRZ-DPSK signals compared to the OSNR obtained by using the OSA are shown in Fig. 4, respectively. In Fig. 4(a), the measured OSNR of an NRZ-OOK signal, having different bit rates, increases linearly
(C) 2008 OSA 8 December 2008 / Vol. 16, No. 25 / OPTICS EXPRESS 20606#102822 - $15.00 USD Received 15 Oct 2008; revised 24 Nov 2008; accepted 24 Nov 2008; published 26 Nov 2008
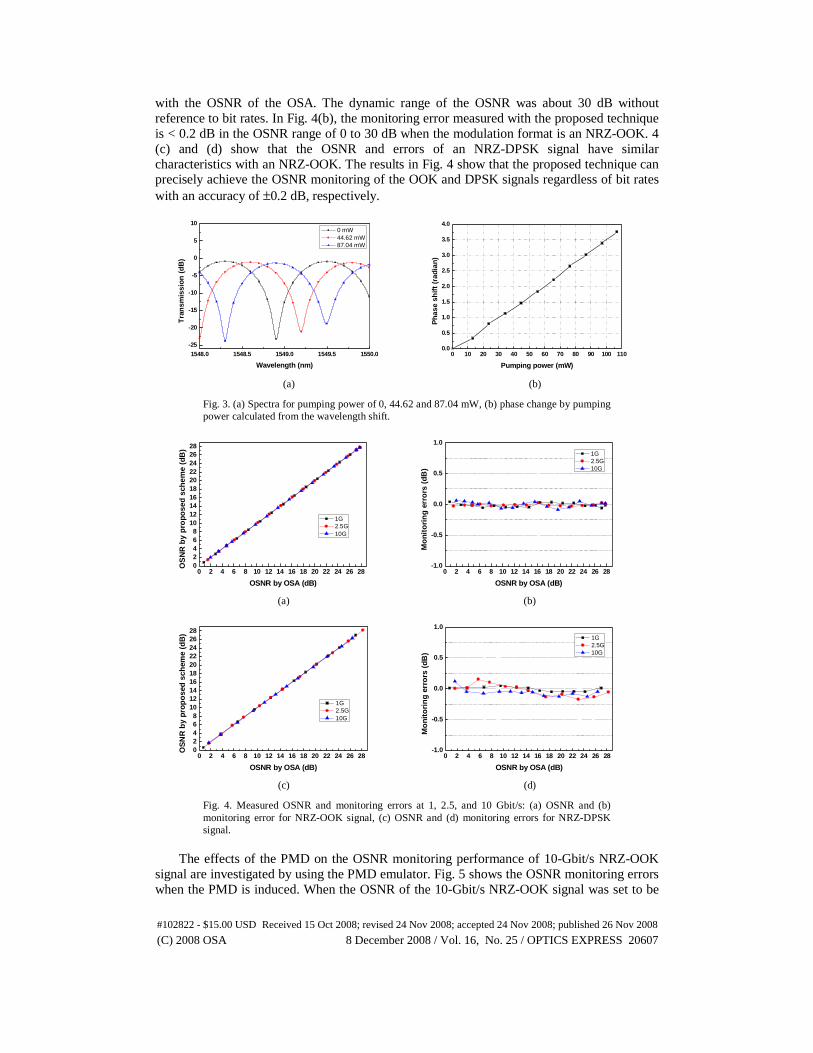
with the OSNR of the OSA. The dynamic range of the OSNR was about 30 dB without reference to bit rates. In Fig. 4(b), the monitoring error measured with the proposed technique is < 0.2 dB in the OSNR range of 0 to 30 dB when the modulation format is an NRZ-OOK. 4 (c) and (d) show that the OSNR and errors of an NRZ-DPSK signal have similar characteristics with an NRZ-OOK. The results in Fig. 4 show that the proposed technique can precisely achieve the OSNR monitoring of the OOK and DPSK signals regardless of bit rates with an accuracy of ±0.2 dB, respectively.
1548.0 1548.5 1549.0 1549.5 1550.0
-25
-20
-15
-10
-5
0
5
10
Tra
nsm
issi
on (
dB
)
Wavelength (nm)
0 mW 44.62 mW 87.04 mW
0 10 20 30 40 50 60 70 80 90 100 110
0.0
0.5
1.0
1.5
2.0
2.5
3.0
3.5
4.0
Pha
se s
hift
(ra
dian
)
Pumping power (mW)
(a) (b)
Fig. 3. (a) Spectra for pumping power of 0, 44.62 and 87.04 mW, (b) phase change by pumping power calculated from the wavelength shift.
0 2 4 6 8 10 12 14 16 18 20 22 24 26 2802468
10121416182022242628
1G 2.5G 10G
OS
NR
by
pro
pose
d s
chem
e (d
B)
OSNR by OSA (dB)
0 2 4 6 8 10 12 14 16 18 20 22 24 26 28-1.0
-0.5
0.0
0.5
1.0
Mo
nito
rin
g e
rro
rs (
dB)
OSNR by OSA (dB)
1G 2.5G 10G
(a) (b)
0 2 4 6 8 10 12 14 16 18 20 22 24 26 2802468
10121416182022242628
OS
NR
by
prop
ose
d s
chem
e (d
B)
OSNR by OSA (dB)
1G 2.5G 10G
0 2 4 6 8 10 12 14 16 18 20 22 24 26 28-1.0
-0.5
0.0
0.5
1.0
Mo
nito
rin
g e
rro
rs (
dB)
OSNR by OSA (dB)
1G 2.5G 10G
(c) (d)
Fig. 4. Measured OSNR and monitoring errors at 1, 2.5, and 10 Gbit/s: (a) OSNR and (b) monitoring error for NRZ-OOK signal, (c) OSNR and (d) monitoring errors for NRZ-DPSK signal.
The effects of the PMD on the OSNR monitoring performance of 10-Gbit/s NRZ-OOK
signal are investigated by using the PMD emulator. Fig. 5 shows the OSNR monitoring errors when the PMD is induced. When the OSNR of the 10-Gbit/s NRZ-OOK signal was set to be
(C) 2008 OSA 8 December 2008 / Vol. 16, No. 25 / OPTICS EXPRESS 20607#102822 - $15.00 USD Received 15 Oct 2008; revised 24 Nov 2008; accepted 24 Nov 2008; published 26 Nov 2008
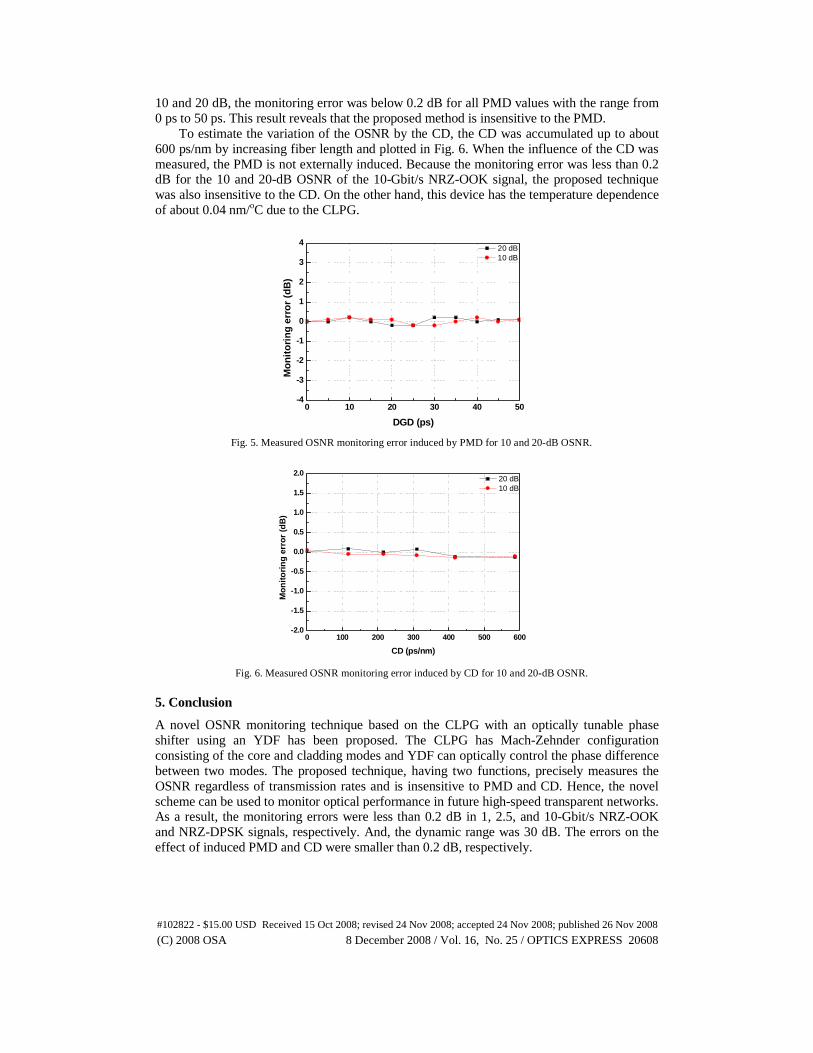
10 and 20 dB, the monitoring error was below 0.2 dB for all PMD values with the range from 0 ps to 50 ps. This result reveals that the proposed method is insensitive to the PMD.
To estimate the variation of the OSNR by the CD, the CD was accumulated up to about 600 ps/nm by increasing fiber length and plotted in Fig. 6. When the influence of the CD was measured, the PMD is not externally induced. Because the monitoring error was less than 0.2 dB for the 10 and 20-dB OSNR of the 10-Gbit/s NRZ-OOK signal, the proposed technique was also insensitive to the CD. On the other hand, this device has the temperature dependence of about 0.04 nm/oC due to the CLPG.
0 10 20 30 40 50-4
-3
-2
-1
0
1
2
3
4
Mo
nit
ori
ng
err
or
(dB
)
DGD (ps)
20 dB 10 dB
Fig. 5. Measured OSNR monitoring error induced by PMD for 10 and 20-dB OSNR.
0 100 200 300 400 500 600-2.0
-1.5
-1.0
-0.5
0.0
0.5
1.0
1.5
2.0
Mo
nit
ori
ng
err
or
(dB
)
CD (ps/nm)
20 dB 10 dB
Fig. 6. Measured OSNR monitoring error induced by CD for 10 and 20-dB OSNR.
5. Conclusion
A novel OSNR monitoring technique based on the CLPG with an optically tunable phase shifter using an YDF has been proposed. The CLPG has Mach-Zehnder configuration consisting of the core and cladding modes and YDF can optically control the phase difference between two modes. The proposed technique, having two functions, precisely measures the OSNR regardless of transmission rates and is insensitive to PMD and CD. Hence, the novel scheme can be used to monitor optical performance in future high-speed transparent networks. As a result, the monitoring errors were less than 0.2 dB in 1, 2.5, and 10-Gbit/s NRZ-OOK and NRZ-DPSK signals, respectively. And, the dynamic range was 30 dB. The errors on the effect of induced PMD and CD were smaller than 0.2 dB, respectively.
(C) 2008 OSA 8 December 2008 / Vol. 16, No. 25 / OPTICS EXPRESS 20608#102822 - $15.00 USD Received 15 Oct 2008; revised 24 Nov 2008; accepted 24 Nov 2008; published 26 Nov 2008

Acknowledgments
This work is supported by ITRC through grant No. IITA-2008-C1090-0804 -0007 and by KOSEF through grant No. R01-2006-000-11088-0 from the Basic Program.
(C) 2008 OSA 8 December 2008 / Vol. 16, No. 25 / OPTICS EXPRESS 20609#102822 - $15.00 USD Received 15 Oct 2008; revised 24 Nov 2008; accepted 24 Nov 2008; published 26 Nov 2008


![Optical Signal to Noise Ratio (OSNR) - Optiwave · Optical Signal to Noise Ratio (OSNR) [dB] is the measure of the ratio of signal power to noise power in an optical channel. International](https://img.pdfslide.us/doc/110x75/5e82df92497562069a7d7b0e/optical-signal-to-noise-ratio-osnr-optiwave-optical-signal-to-noise-ratio-osnr.jpg)