Embed Size (px)
Citation preview
Pictorial essay Medical Ultrasonography2010, Vol. 12, no. 4, 323-335
Abstract This paper tries to describe reasons, pathophysiological sequence of events, including the sequelae, and location of the
traumatic tears of the ossification center of the tibial tuberosity in adolescents. Ultrasonographic features characteristically seen in the traction type of Osgood-Schlatter disease (OSD) are presented in a pictorial. The classification and definitions used is based on the three types of OSD described by Czyrny&Greenspan in 2009.
Keywords: ultrasonography, Osgood-Schlatter disease, tibial tuberosity
RezumatAcest eseu în imagini incearcă să descrie motivele, secvenţa fiziopatologică a evenimentelor şi localizarea rupturilor
traumatice ale centrului de osificare din tuberozitatea tibială la adolescenţi. Modificările ecografice caracteristice ce se pot evidenţia în boala Osgood-Schlatter sunt prezentate pe larg. Clasificarea şi definiţiile utilizate se bazează pe cele trei tipuri de boala Osgood-Schlatter descries de Czyrny&Greenspan în 2009.
Cuvinte cheie: ecografie, boala Osgood-Schlatter, tuberozitatea tibială
Osgood-Schlatter disease in ultrasound diagnostics – a pictorial essay
Zbigniew Czyrny
M.D. Private Practice, Michalow Grabina, Poland
Received 04.10.2010 Accepted 12.10.2010 Med Ultrason 2010, Vol. 12, No 4, 323-335 Address for correspondence: Zbigniew Czyrny, M.D. Private Practice, Michalow Grabina, Poland www.czyrny.pl E-mail: [email protected]
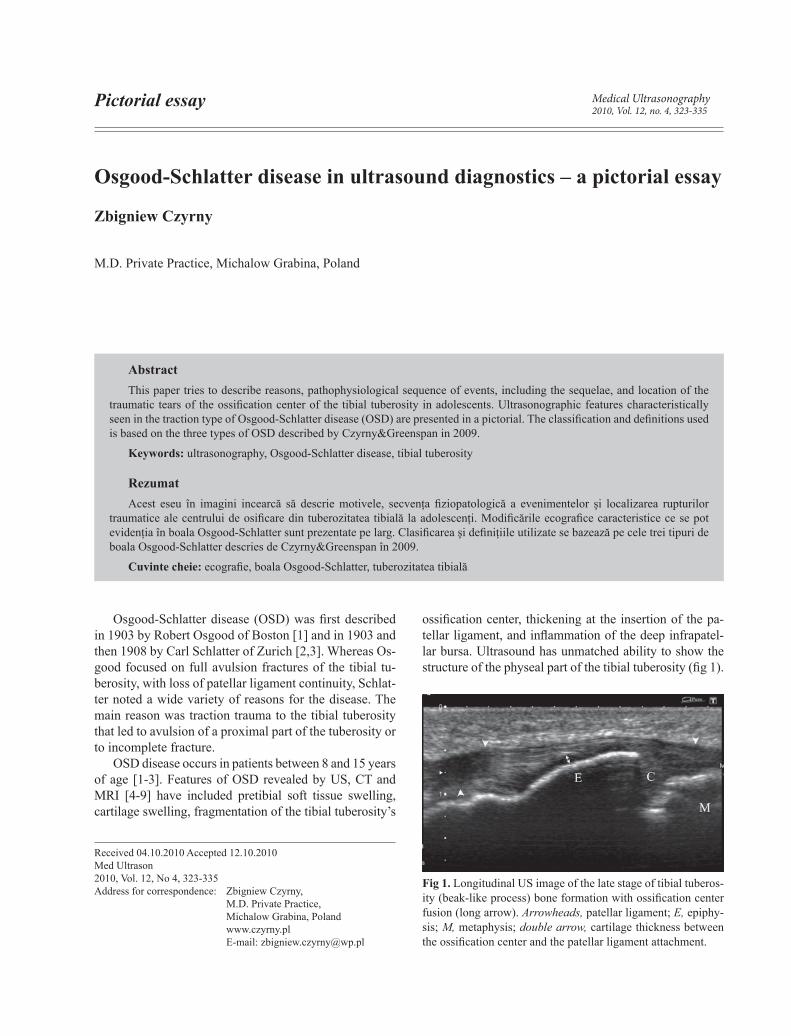
Osgood-Schlatter disease (OSD) was first described in 1903 by Robert Osgood of Boston [1] and in 1903 and then 1908 by Carl Schlatter of Zurich [2,3]. Whereas Os-good focused on full avulsion fractures of the tibial tu-berosity, with loss of patellar ligament continuity, Schlat-ter noted a wide variety of reasons for the disease. The main reason was traction trauma to the tibial tuberosity that led to avulsion of a proximal part of the tuberosity or to incomplete fracture.
OSD disease occurs in patients between 8 and 15 years of age [1-3]. Features of OSD revealed by US, CT and MRI [4-9] have included pretibial soft tissue swelling, cartilage swelling, fragmentation of the tibial tuberosity’s
ossification center, thickening at the insertion of the pa-tellar ligament, and inflammation of the deep infrapatel-lar bursa. Ultrasound has unmatched ability to show the structure of the physeal part of the tibial tuberosity (fig 1).
Fig 1. Longitudinal US image of the late stage of tibial tuberos-ity (beak-like process) bone formation with ossification center fusion (long arrow). Arrowheads, patellar ligament; E, epiphy-sis; M, metaphysis; double arrow, cartilage thickness between the ossification center and the patellar ligament attachment.
324 Zbigniew Czyrny et al Osgood-Schlatter disease in ultrasound diagnostics – a pictorial essay
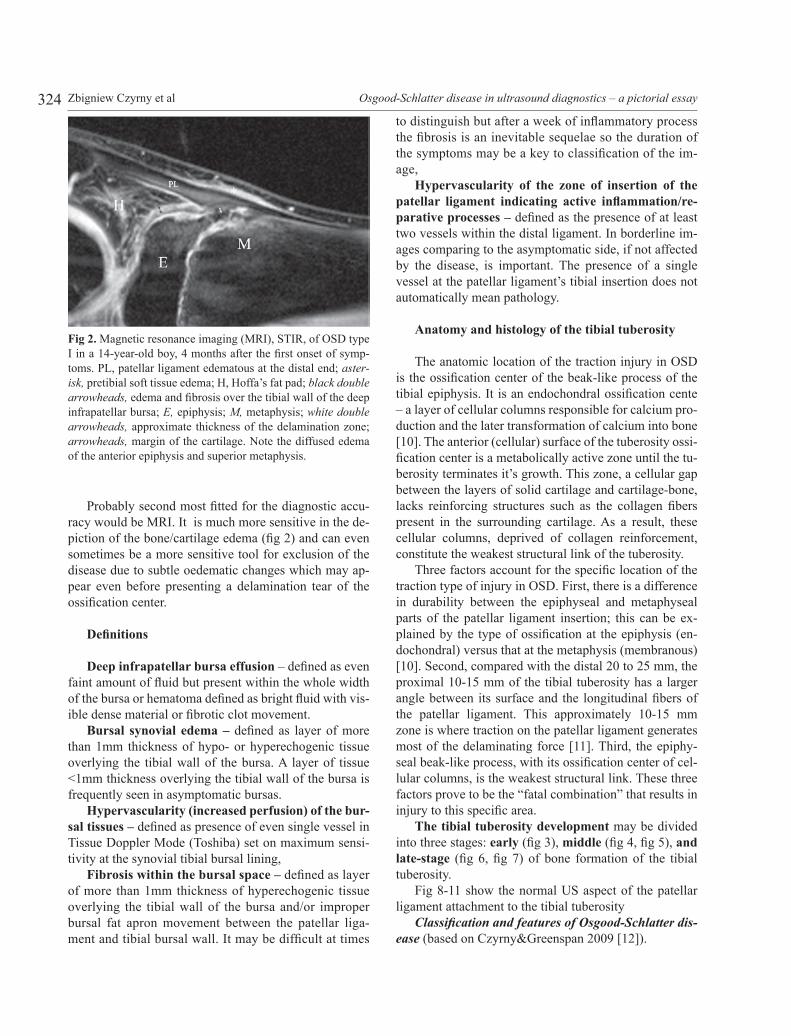
Probably second most fitted for the diagnostic accu-racy would be MRI. It is much more sensitive in the de-piction of the bone/cartilage edema (fig 2) and can even sometimes be a more sensitive tool for exclusion of the disease due to subtle oedematic changes which may ap-pear even before presenting a delamination tear of the ossification center.
Definitions
Deep infrapatellar bursa effusion – defined as even faint amount of fluid but present within the whole width of the bursa or hematoma defined as bright fluid with vis-ible dense material or fibrotic clot movement.
Bursal synovial edema – defined as layer of more than 1mm thickness of hypo- or hyperechogenic tissue overlying the tibial wall of the bursa. A layer of tissue <1mm thickness overlying the tibial wall of the bursa is frequently seen in asymptomatic bursas.
Hypervascularity (increased perfusion) of the bur-sal tissues – defined as presence of even single vessel in Tissue Doppler Mode (Toshiba) set on maximum sensi-tivity at the synovial tibial bursal lining,
Fibrosis within the bursal space – defined as layer of more than 1mm thickness of hyperechogenic tissue overlying the tibial wall of the bursa and/or improper bursal fat apron movement between the patellar liga-ment and tibial bursal wall. It may be difficult at times
to distinguish but after a week of inflammatory process the fibrosis is an inevitable sequelae so the duration of the symptoms may be a key to classification of the im-age,
Hypervascularity of the zone of insertion of the patellar ligament indicating active inflammation/re-parative processes – defined as the presence of at least two vessels within the distal ligament. In borderline im-ages comparing to the asymptomatic side, if not affected by the disease, is important. The presence of a single vessel at the patellar ligament’s tibial insertion does not automatically mean pathology.
Anatomy and histology of the tibial tuberosity
The anatomic location of the traction injury in OSD is the ossification center of the beak-like process of the tibial epiphysis. It is an endochondral ossification cente – a layer of cellular columns responsible for calcium pro-duction and the later transformation of calcium into bone [10]. The anterior (cellular) surface of the tuberosity ossi-fication center is a metabolically active zone until the tu-berosity terminates it’s growth. This zone, a cellular gap between the layers of solid cartilage and cartilage-bone, lacks reinforcing structures such as the collagen fibers present in the surrounding cartilage. As a result, these cellular columns, deprived of collagen reinforcement, constitute the weakest structural link of the tuberosity.
Three factors account for the specific location of the traction type of injury in OSD. First, there is a difference in durability between the epiphyseal and metaphyseal parts of the patellar ligament insertion; this can be ex-plained by the type of ossification at the epiphysis (en-dochondral) versus that at the metaphysis (membranous) [10]. Second, compared with the distal 20 to 25 mm, the proximal 10-15 mm of the tibial tuberosity has a larger angle between its surface and the longitudinal fibers of the patellar ligament. This approximately 10-15 mm zone is where traction on the patellar ligament generates most of the delaminating force [11]. Third, the epiphy-seal beak-like process, with its ossification center of cel-lular columns, is the weakest structural link. These three factors prove to be the “fatal combination” that results in injury to this specific area.
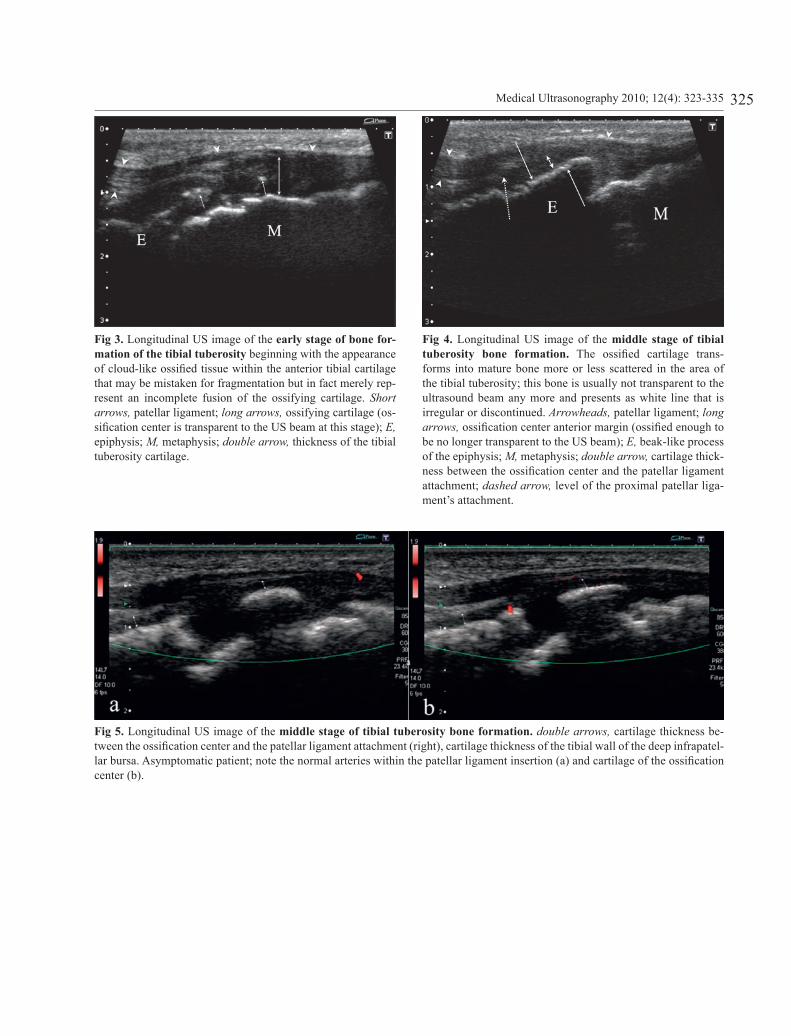
The tibial tuberosity development may be divided into three stages: early (fig 3), middle (fig 4, fig 5), and late-stage (fig 6, fig 7) of bone formation of the tibial tuberosity.
Fig 8-11 show the normal US aspect of the patellar ligament attachment to the tibial tuberosity
Classification and features of Osgood-Schlatter dis-ease (based on Czyrny&Greenspan 2009 [12]).
Fig 2. Magnetic resonance imaging (MRI), STIR, of OSD type I in a 14-year-old boy, 4 months after the first onset of symp-toms. PL, patellar ligament edematous at the distal end; aster-isk, pretibial soft tissue edema; H, Hoffa’s fat pad; black double arrowheads, edema and fibrosis over the tibial wall of the deep infrapatellar bursa; E, epiphysis; M, metaphysis; white double arrowheads, approximate thickness of the delamination zone; arrowheads, margin of the cartilage. Note the diffused edema of the anterior epiphysis and superior metaphysis.
325Medical Ultrasonography 2010; 12(4): 323-335
Fig 3. Longitudinal US image of the early stage of bone for-mation of the tibial tuberosity beginning with the appearance of cloud-like ossified tissue within the anterior tibial cartilage that may be mistaken for fragmentation but in fact merely rep-resent an incomplete fusion of the ossifying cartilage. Short arrows, patellar ligament; long arrows, ossifying cartilage (os-sification center is transparent to the US beam at this stage); E, epiphysis; M, metaphysis; double arrow, thickness of the tibial tuberosity cartilage.
Fig 5. Longitudinal US image of the middle stage of tibial tuberosity bone formation. double arrows, cartilage thickness be-tween the ossification center and the patellar ligament attachment (right), cartilage thickness of the tibial wall of the deep infrapatel-lar bursa. Asymptomatic patient; note the normal arteries within the patellar ligament insertion (a) and cartilage of the ossification center (b).
Fig 4. Longitudinal US image of the middle stage of tibial tuberosity bone formation. The ossified cartilage trans-forms into mature bone more or less scattered in the area of the tibial tuberosity; this bone is usually not transparent to the ultrasound beam any more and presents as white line that is irregular or discontinued. Arrowheads, patellar ligament; long arrows, ossification center anterior margin (ossified enough to be no longer transparent to the US beam); E, beak-like process of the epiphysis; M, metaphysis; double arrow, cartilage thick-ness between the ossification center and the patellar ligament attachment; dashed arrow, level of the proximal patellar liga-ment’s attachment.
326 Zbigniew Czyrny et al Osgood-Schlatter disease in ultrasound diagnostics – a pictorial essay
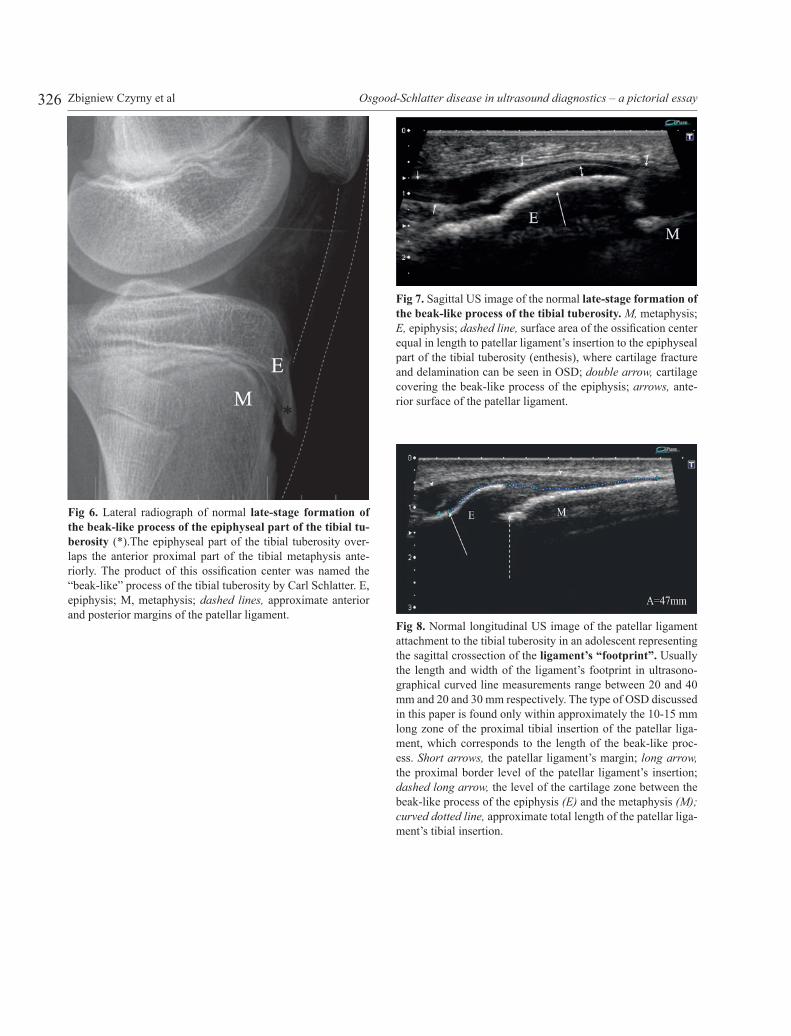
Fig 7. Sagittal US image of the normal late-stage formation of the beak-like process of the tibial tuberosity. M, metaphysis; E, epiphysis; dashed line, surface area of the ossification center equal in length to patellar ligament’s insertion to the epiphyseal part of the tibial tuberosity (enthesis), where cartilage fracture and delamination can be seen in OSD; double arrow, cartilage covering the beak-like process of the epiphysis; arrows, ante-rior surface of the patellar ligament.
Fig 8. Normal longitudinal US image of the patellar ligament attachment to the tibial tuberosity in an adolescent representing the sagittal crossection of the ligament’s “footprint”. Usually the length and width of the ligament’s footprint in ultrasono-graphical curved line measurements range between 20 and 40 mm and 20 and 30 mm respectively. The type of OSD discussed in this paper is found only within approximately the 10-15 mm long zone of the proximal tibial insertion of the patellar liga-ment, which corresponds to the length of the beak-like proc-ess. Short arrows, the patellar ligament’s margin; long arrow, the proximal border level of the patellar ligament’s insertion; dashed long arrow, the level of the cartilage zone between the beak-like process of the epiphysis (E) and the metaphysis (M); curved dotted line, approximate total length of the patellar liga-ment’s tibial insertion.
Fig 6. Lateral radiograph of normal late-stage formation of the beak-like process of the epiphyseal part of the tibial tu-berosity (*).The epiphyseal part of the tibial tuberosity over-laps the anterior proximal part of the tibial metaphysis ante-riorly. The product of this ossification center was named the “beak-like” process of the tibial tuberosity by Carl Schlatter. E, epiphysis; M, metaphysis; dashed lines, approximate anterior and posterior margins of the patellar ligament.
327Medical Ultrasonography 2010; 12(4): 323-335
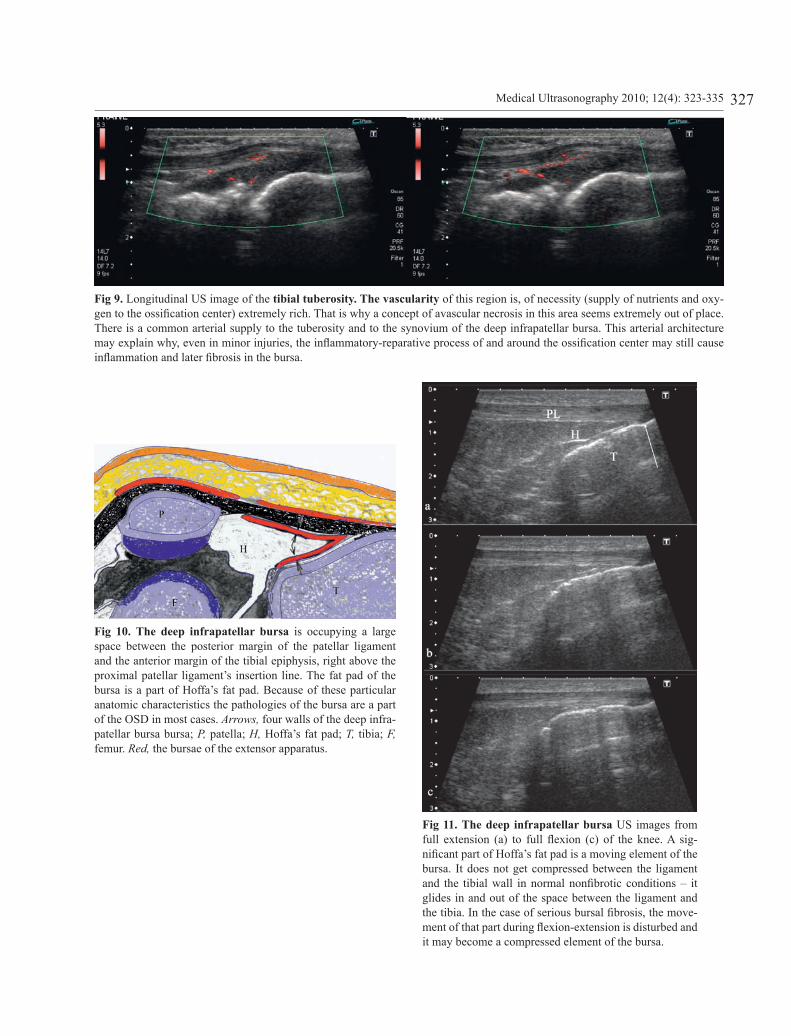
Fig 9. Longitudinal US image of the tibial tuberosity. The vascularity of this region is, of necessity (supply of nutrients and oxy-gen to the ossification center) extremely rich. That is why a concept of avascular necrosis in this area seems extremely out of place. There is a common arterial supply to the tuberosity and to the synovium of the deep infrapatellar bursa. This arterial architecture may explain why, even in minor injuries, the inflammatory-reparative process of and around the ossification center may still cause inflammation and later fibrosis in the bursa.
Fig 10. The deep infrapatellar bursa is occupying a large space between the posterior margin of the patellar ligament and the anterior margin of the tibial epiphysis, right above the proximal patellar ligament’s insertion line. The fat pad of the bursa is a part of Hoffa’s fat pad. Because of these particular anatomic characteristics the pathologies of the bursa are a part of the OSD in most cases. Arrows, four walls of the deep infra-patellar bursa bursa; P, patella; H, Hoffa’s fat pad; T, tibia; F, femur. Red, the bursae of the extensor apparatus.
Fig 11. The deep infrapatellar bursa US images from full extension (a) to full flexion (c) of the knee. A sig-nificant part of Hoffa’s fat pad is a moving element of the bursa. It does not get compressed between the ligament and the tibial wall in normal nonfibrotic conditions – it glides in and out of the space between the ligament and the tibia. In the case of serious bursal fibrosis, the move-ment of that part during flexion-extension is disturbed and it may become a compressed element of the bursa.
328 Zbigniew Czyrny et al Osgood-Schlatter disease in ultrasound diagnostics – a pictorial essay
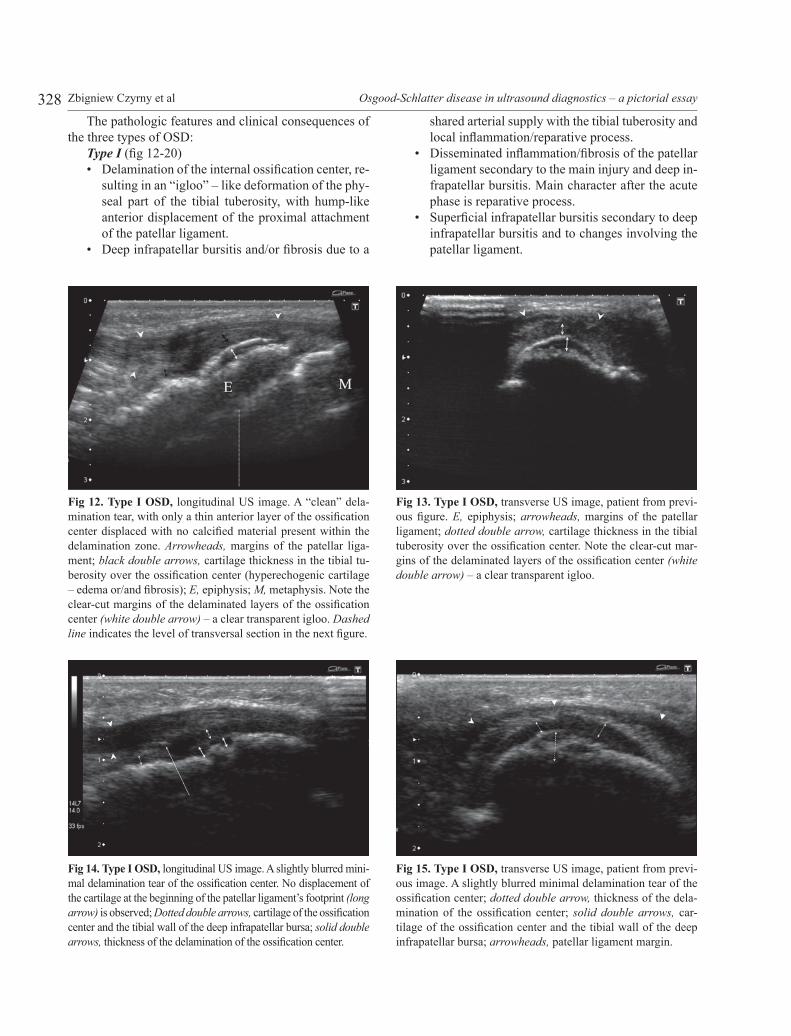
The pathologic features and clinical consequences of the three types of OSD:
Type I (fig 12-20)• Delamination of the internal ossification center, re-
sulting in an “igloo” – like deformation of the phy-seal part of the tibial tuberosity, with hump-like anterior displacement of the proximal attachment of the patellar ligament.
• Deep infrapatellar bursitis and/or fibrosis due to a
Fig 12. Type I OSD, longitudinal US image. A “clean” dela-mination tear, with only a thin anterior layer of the ossification center displaced with no calcified material present within the delamination zone. Arrowheads, margins of the patellar liga-ment; black double arrows, cartilage thickness in the tibial tu-berosity over the ossification center (hyperechogenic cartilage – edema or/and fibrosis); E, epiphysis; M, metaphysis. Note the clear-cut margins of the delaminated layers of the ossification center (white double arrow) – a clear transparent igloo. Dashed line indicates the level of transversal section in the next figure.
Fig 14. Type I OSD, longitudinal US image. A slightly blurred mini-mal delamination tear of the ossification center. No displacement of the cartilage at the beginning of the patellar ligament’s footprint (long arrow) is observed; Dotted double arrows, cartilage of the ossification center and the tibial wall of the deep infrapatellar bursa; solid double arrows, thickness of the delamination of the ossification center.
Fig 15. Type I OSD, transverse US image, patient from previ-ous image. A slightly blurred minimal delamination tear of the ossification center; dotted double arrow, thickness of the dela-mination of the ossification center; solid double arrows, car-tilage of the ossification center and the tibial wall of the deep infrapatellar bursa; arrowheads, patellar ligament margin.
Fig 13. Type I OSD, transverse US image, patient from previ-ous figure. E, epiphysis; arrowheads, margins of the patellar ligament; dotted double arrow, cartilage thickness in the tibial tuberosity over the ossification center. Note the clear-cut mar-gins of the delaminated layers of the ossification center (white double arrow) – a clear transparent igloo.
shared arterial supply with the tibial tuberosity and local inflammation/reparative process.
• Disseminated inflammation/fibrosis of the patellar ligament secondary to the main injury and deep in-frapatellar bursitis. Main character after the acute phase is reparative process.
• Superficial infrapatellar bursitis secondary to deep infrapatellar bursitis and to changes involving the patellar ligament.

329Medical Ultrasonography 2010; 12(4): 323-335
Fig 16. Type I OSD, longitudinal US image, patient from pre-vious image. Hyperperfusion of the patellar ligament at the in-sertion. Most likely the “cousin” of the reparative process at the delaminated ossification center.
Fig 18. Type I OSD, longitudinal US image. Patient from pre-vious figure. Effusion (*) and fibrosis (arrows) due to inflam-mation can be observed within the deep infrapatellar bursa. Ar-rowheads, patellar ligament; Hoffa’s fat pad retracted by fluid; double arrowhead, ossification center cartilage layer.
Fig 19. US images of the type I OSD with a “blurred igloo”. Patellar ligament edematous and hyperperfused (Doppler frame) at the distal end/insertion, most likely representing a reparative process. A lot of vessels enter the ligament from the superficial arterial network but there is no inflammation of the superficial infrapatellar bursa. They seem to reach the depth of the internal arteries of the ossification center. Double arrow, thickness of the intact cartilage overlying the ossification center; double dashed arrow, approxi-mate thickness of the delamination zone.
Fig 17. Type I OSD, longitudinal US image. A “blurred” dela-mination of the epiphyseal ossification center which occurs when ossified tissue of the center is torn within and displaced in a scattered manner with only the “roof” of the igloo being smooth. No fracture and anterior transfer of the proximal part of the tuberosity is present (dashed arrow at the level of the proxi-mal ligament’s attachment) which is a key difference from type II. Short arrow, the anterior margin of the patellar ligament; short double arrow, cartilage thickness in the tibial tuberosity; short double dotted arrow, fibrosis within the deep infrapatellar bursa; arrowheads, anterior margin of the delaminated ossifi-cation center. Note the uneven distribution of calcified tissue within the delaminated area (long double arrow) – a blurred igloo.
330 Zbigniew Czyrny et al Osgood-Schlatter disease in ultrasound diagnostics – a pictorial essay
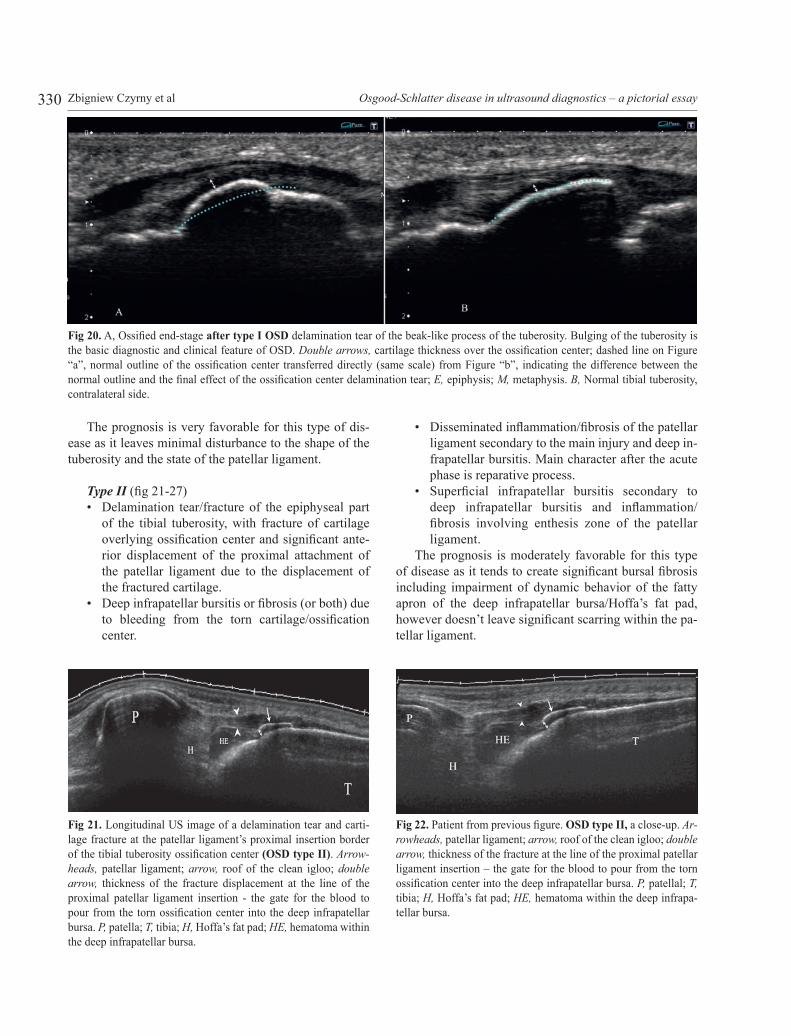
The prognosis is very favorable for this type of dis-ease as it leaves minimal disturbance to the shape of the tuberosity and the state of the patellar ligament.
Type II (fig 21-27)• Delamination tear/fracture of the epiphyseal part
of the tibial tuberosity, with fracture of cartilage overlying ossification center and significant ante-rior displacement of the proximal attachment of the patellar ligament due to the displacement of the fractured cartilage.
• Deep infrapatellar bursitis or fibrosis (or both) due to bleeding from the torn cartilage/ossification center.
• Disseminated inflammation/fibrosis of the patellar ligament secondary to the main injury and deep in-frapatellar bursitis. Main character after the acute phase is reparative process.
• Superficial infrapatellar bursitis secondary to deep infrapatellar bursitis and inflammation/fibrosis involving enthesis zone of the patellar ligament.
The prognosis is moderately favorable for this type of disease as it tends to create significant bursal fibrosis including impairment of dynamic behavior of the fatty apron of the deep infrapatellar bursa/Hoffa’s fat pad, however doesn’t leave significant scarring within the pa-tellar ligament.
Fig 20. A, Ossified end-stage after type I OSD delamination tear of the beak-like process of the tuberosity. Bulging of the tuberosity is the basic diagnostic and clinical feature of OSD. Double arrows, cartilage thickness over the ossification center; dashed line on Figure “a”, normal outline of the ossification center transferred directly (same scale) from Figure “b”, indicating the difference between the normal outline and the final effect of the ossification center delamination tear; E, epiphysis; M, metaphysis. B, Normal tibial tuberosity, contralateral side.
Fig 21. Longitudinal US image of a delamination tear and carti-lage fracture at the patellar ligament’s proximal insertion border of the tibial tuberosity ossification center (OSD type II). Arrow-heads, patellar ligament; arrow, roof of the clean igloo; double arrow, thickness of the fracture displacement at the line of the proximal patellar ligament insertion - the gate for the blood to pour from the torn ossification center into the deep infrapatellar bursa. P, patella; T, tibia; H, Hoffa’s fat pad; HE, hematoma within the deep infrapatellar bursa.
Fig 22. Patient from previous figure. OSD type II, a close-up. Ar-rowheads, patellar ligament; arrow, roof of the clean igloo; double arrow, thickness of the fracture at the line of the proximal patellar ligament insertion – the gate for the blood to pour from the torn ossification center into the deep infrapatellar bursa. P, patellal; T, tibia; H, Hoffa’s fat pad; HE, hematoma within the deep infrapa-tellar bursa.

331Medical Ultrasonography 2010; 12(4): 323-335
Fig 23. Patient from previous figure. OSD type II, a further close-up. Arrowheads, patellar ligament; double arrow, thickness of the frac-ture at the line of the proximal patellar ligament insertion - the gate for the blood to pour from the torn ossification center into the deep infra-patellar bursa. P, patellal; T, tibia; H, Hoffa’s fat pad; HE, hematoma within the deep infrapatellar bursa; F, fibrotic clot separating the frac-tured ossification center cartilage from the deep infrapatellar bursa.
Fig 25. US longitudinal type II OSD. Patient from previous im-age. Double arrow right, distance of anterior displacement of the proximal fractured proximal cartilage of the beak-like proc-ess; double arrows (two left), fibrotic layers induced by previous hematoma from fractured cartilage and ossification center; long dashed arrow, the route of blood from the fractured ossification center into the deep infrapatellar bursa.
Fig 26. US transverse type II OSD. Patient from previous image. Double arrowt, maximum delamination distance of the beak-like process; arrowheads, patellar ligament margins.
Fig 27. US longitudinal type II OSD. Patient from previous im-age. b: contralateral side.
Fig 24. US longitudinal type II OSD. Arrowheads, patellar liga-ment margin; double black arrow, the thickness of the anteriorly displaced part of the ossification center; double white arrow, dis-tance of anterior displacement of the proximal fractured cartilage; long arrow, proximal, anteriorly transferred, insertion of the patel-lar ligament. Note the disturbance of tibial wall of the deep infra-patellar bursa filled with bright fibrotic tissue (short arrows).
332 Zbigniew Czyrny et al Osgood-Schlatter disease in ultrasound diagnostics – a pictorial essay
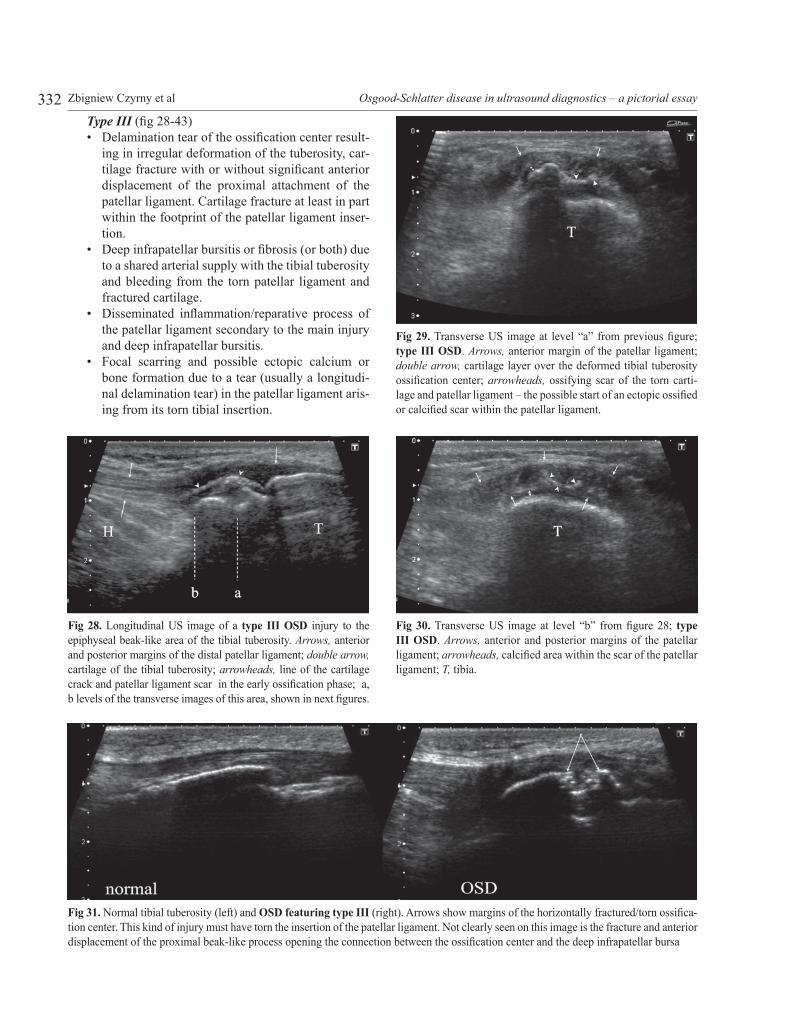
Type III (fig 28-43)• Delamination tear of the ossification center result-
ing in irregular deformation of the tuberosity, car-tilage fracture with or without significant anterior displacement of the proximal attachment of the patellar ligament. Cartilage fracture at least in part within the footprint of the patellar ligament inser-tion.
• Deep infrapatellar bursitis or fibrosis (or both) due to a shared arterial supply with the tibial tuberosity and bleeding from the torn patellar ligament and fractured cartilage.
• Disseminated inflammation/reparative process of the patellar ligament secondary to the main injury and deep infrapatellar bursitis.
• Focal scarring and possible ectopic calcium or bone formation due to a tear (usually a longitudi-nal delamination tear) in the patellar ligament aris-ing from its torn tibial insertion.
Fig 28. Longitudinal US image of a type III OSD injury to the epiphyseal beak-like area of the tibial tuberosity. Arrows, anterior and posterior margins of the distal patellar ligament; double arrow, cartilage of the tibial tuberosity; arrowheads, line of the cartilage crack and patellar ligament scar in the early ossification phase; a, b levels of the transverse images of this area, shown in next figures.
Fig 29. Transverse US image at level “a” from previous figure; type III OSD. Arrows, anterior margin of the patellar ligament; double arrow, cartilage layer over the deformed tibial tuberosity ossification center; arrowheads, ossifying scar of the torn carti-lage and patellar ligament – the possible start of an ectopic ossified or calcified scar within the patellar ligament.
Fig 30. Transverse US image at level “b” from figure 28; type III OSD. Arrows, anterior and posterior margins of the patellar ligament; arrowheads, calcified area within the scar of the patellar ligament; T, tibia.
Fig 31. Normal tibial tuberosity (left) and OSD featuring type III (right). Arrows show margins of the horizontally fractured/torn ossifica-tion center. This kind of injury must have torn the insertion of the patellar ligament. Not clearly seen on this image is the fracture and anterior displacement of the proximal beak-like process opening the connection between the ossification center and the deep infrapatellar bursa
333Medical Ultrasonography 2010; 12(4): 323-335
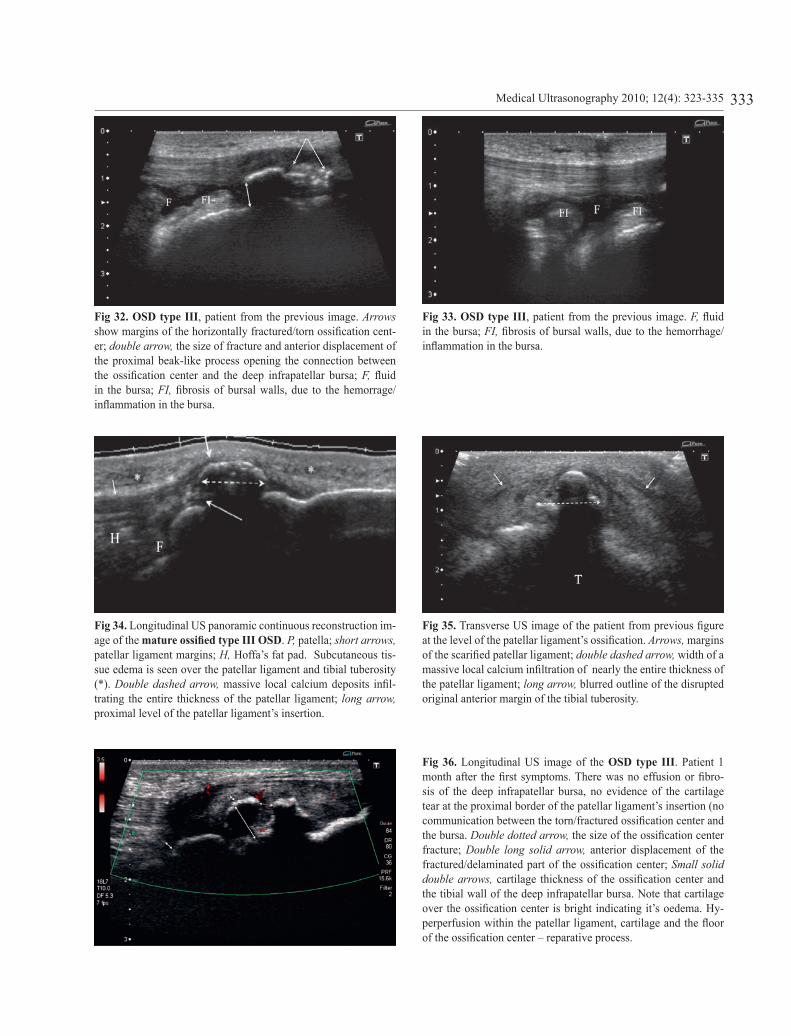
Fig 32. OSD type III, patient from the previous image. Arrows show margins of the horizontally fractured/torn ossification cent-er; double arrow, the size of fracture and anterior displacement of the proximal beak-like process opening the connection between the ossification center and the deep infrapatellar bursa; F, fluid in the bursa; FI, fibrosis of bursal walls, due to the hemorrage/inflammation in the bursa.
Fig 34. Longitudinal US panoramic continuous reconstruction im-age of the mature ossified type III OSD. P, patella; short arrows, patellar ligament margins; H, Hoffa’s fat pad. Subcutaneous tis-sue edema is seen over the patellar ligament and tibial tuberosity (*). Double dashed arrow, massive local calcium deposits infil-trating the entire thickness of the patellar ligament; long arrow, proximal level of the patellar ligament’s insertion.
Fig 36. Longitudinal US image of the OSD type III. Patient 1 month after the first symptoms. There was no effusion or fibro-sis of the deep infrapatellar bursa, no evidence of the cartilage tear at the proximal border of the patellar ligament’s insertion (no communication between the torn/fractured ossification center and the bursa. Double dotted arrow, the size of the ossification center fracture; Double long solid arrow, anterior displacement of the fractured/delaminated part of the ossification center; Small solid double arrows, cartilage thickness of the ossification center and the tibial wall of the deep infrapatellar bursa. Note that cartilage over the ossification center is bright indicating it’s oedema. Hy-perperfusion within the patellar ligament, cartilage and the floor of the ossification center – reparative process.
Fig 35. Transverse US image of the patient from previous figure at the level of the patellar ligament’s ossification. Arrows, margins of the scarified patellar ligament; double dashed arrow, width of a massive local calcium infiltration of nearly the entire thickness of the patellar ligament; long arrow, blurred outline of the disrupted original anterior margin of the tibial tuberosity.
Fig 33. OSD type III, patient from the previous image. F, fluid in the bursa; FI, fibrosis of bursal walls, due to the hemorrhage/inflammation in the bursa.
334 Zbigniew Czyrny et al Osgood-Schlatter disease in ultrasound diagnostics – a pictorial essay
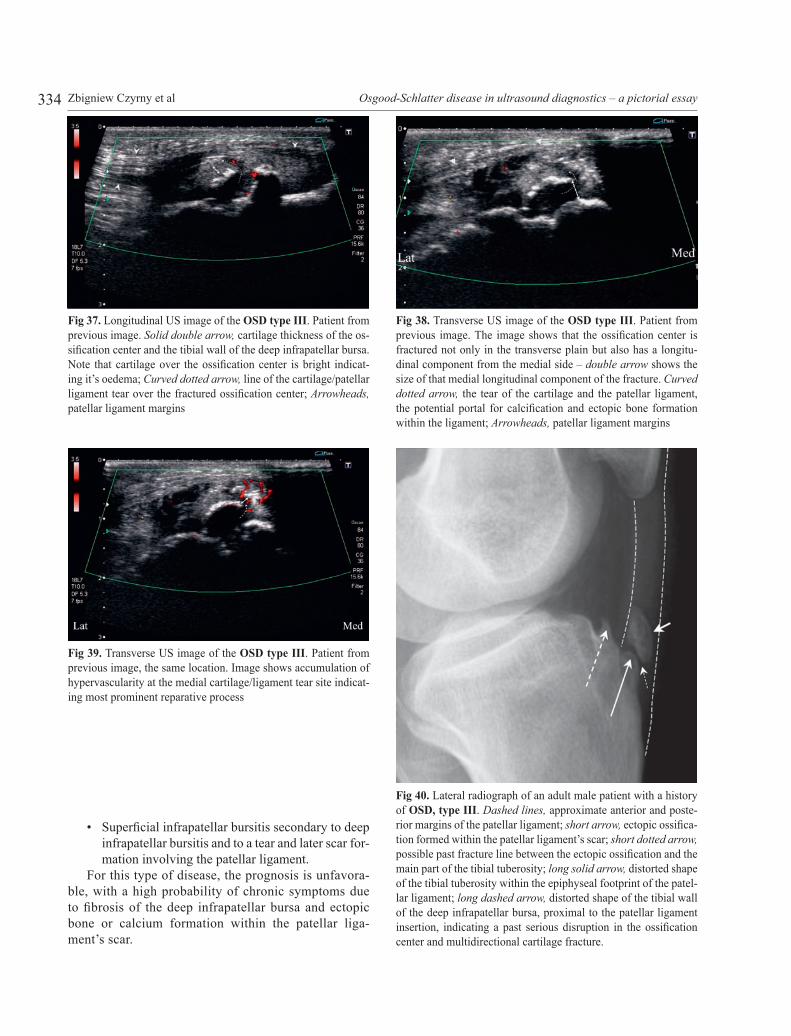
• Superficial infrapatellar bursitis secondary to deep infrapatellar bursitis and to a tear and later scar for-mation involving the patellar ligament.
For this type of disease, the prognosis is unfavora-ble, with a high probability of chronic symptoms due to fibrosis of the deep infrapatellar bursa and ectopic bone or calcium formation within the patellar liga-ment’s scar.
Fig 37. Longitudinal US image of the OSD type III. Patient from previous image. Solid double arrow, cartilage thickness of the os-sification center and the tibial wall of the deep infrapatellar bursa. Note that cartilage over the ossification center is bright indicat-ing it’s oedema; Curved dotted arrow, line of the cartilage/patellar ligament tear over the fractured ossification center; Arrowheads, patellar ligament margins
Fig 39. Transverse US image of the OSD type III. Patient from previous image, the same location. Image shows accumulation of hypervascularity at the medial cartilage/ligament tear site indicat-ing most prominent reparative process
Fig 40. Lateral radiograph of an adult male patient with a history of OSD, type III. Dashed lines, approximate anterior and poste-rior margins of the patellar ligament; short arrow, ectopic ossifica-tion formed within the patellar ligament’s scar; short dotted arrow, possible past fracture line between the ectopic ossification and the main part of the tibial tuberosity; long solid arrow, distorted shape of the tibial tuberosity within the epiphyseal footprint of the patel-lar ligament; long dashed arrow, distorted shape of the tibial wall of the deep infrapatellar bursa, proximal to the patellar ligament insertion, indicating a past serious disruption in the ossification center and multidirectional cartilage fracture.
Fig 38. Transverse US image of the OSD type III. Patient from previous image. The image shows that the ossification center is fractured not only in the transverse plain but also has a longitu-dinal component from the medial side – double arrow shows the size of that medial longitudinal component of the fracture. Curved dotted arrow, the tear of the cartilage and the patellar ligament, the potential portal for calcification and ectopic bone formation within the ligament; Arrowheads, patellar ligament margins
335Medical Ultrasonography 2010; 12(4): 323-335
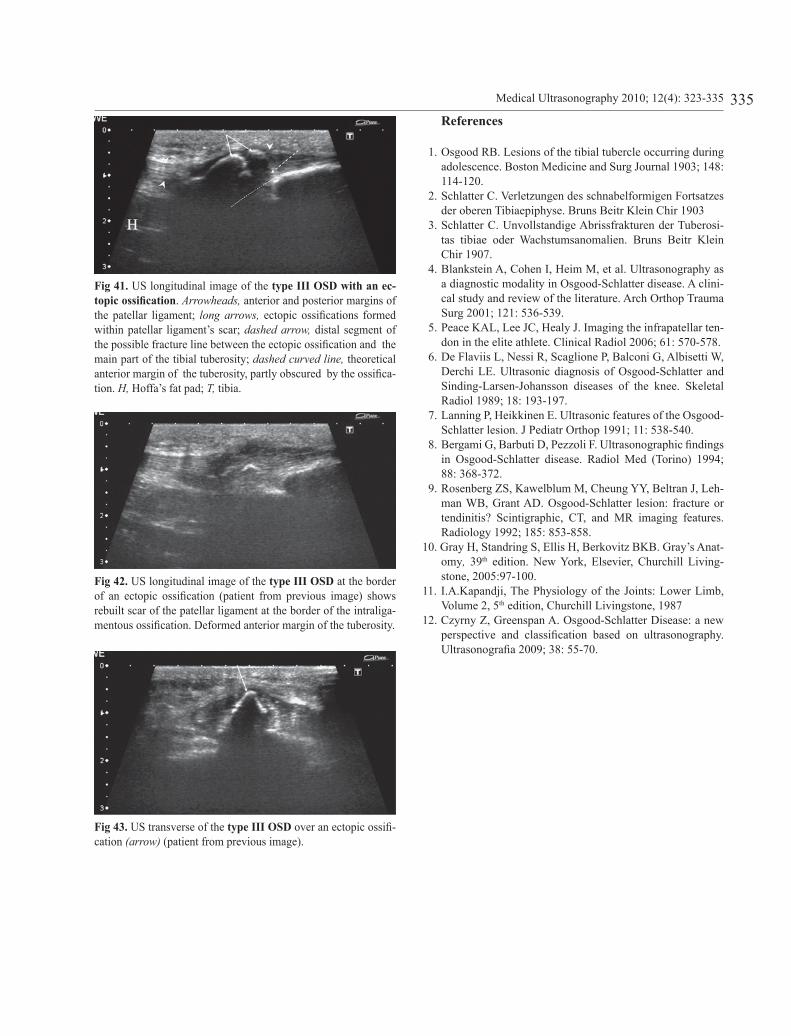
Fig 41. US longitudinal image of the type III OSD with an ec-topic ossification. Arrowheads, anterior and posterior margins of the patellar ligament; long arrows, ectopic ossifications formed within patellar ligament’s scar; dashed arrow, distal segment of the possible fracture line between the ectopic ossification and the main part of the tibial tuberosity; dashed curved line, theoretical anterior margin of the tuberosity, partly obscured by the ossifica-tion. H, Hoffa’s fat pad; T, tibia.
Fig 42. US longitudinal image of the type III OSD at the border of an ectopic ossification (patient from previous image) shows rebuilt scar of the patellar ligament at the border of the intraliga-mentous ossification. Deformed anterior margin of the tuberosity.
Fig 43. US transverse of the type III OSD over an ectopic ossifi-cation (arrow) (patient from previous image).
References
1. Osgood RB. Lesions of the tibial tubercle occurring during adolescence. Boston Medicine and Surg Journal 1903; 148: 114-120.
2. Schlatter C. Verletzungen des schnabelformigen Fortsatzes der oberen Tibiaepiphyse. Bruns Beitr Klein Chir 1903
3. Schlatter C. Unvollstandige Abrissfrakturen der Tuberosi-tas tibiae oder Wachstumsanomalien. Bruns Beitr Klein Chir 1907.
4. Blankstein A, Cohen I, Heim M, et al. Ultrasonography as a diagnostic modality in Osgood-Schlatter disease. A clini-cal study and review of the literature. Arch Orthop Trauma Surg 2001; 121: 536-539.
5. Peace KAL, Lee JC, Healy J. Imaging the infrapatellar ten-don in the elite athlete. Clinical Radiol 2006; 61: 570-578.
6. De Flaviis L, Nessi R, Scaglione P, Balconi G, Albisetti W, Derchi LE. Ultrasonic diagnosis of Osgood-Schlatter and Sinding-Larsen-Johansson diseases of the knee. Skeletal Radiol 1989; 18: 193-197.
7. Lanning P, Heikkinen E. Ultrasonic features of the Osgood-Schlatter lesion. J Pediatr Orthop 1991; 11: 538-540.
8. Bergami G, Barbuti D, Pezzoli F. Ultrasonographic findings in Osgood-Schlatter disease. Radiol Med (Torino) 1994; 88: 368-372.
9. Rosenberg ZS, Kawelblum M, Cheung YY, Beltran J, Leh-man WB, Grant AD. Osgood-Schlatter lesion: fracture or tendinitis? Scintigraphic, CT, and MR imaging features. Radiology 1992; 185: 853-858.
10. Gray H, Standring S, Ellis H, Berkovitz BKB. Gray’s Anat-omy, 39th edition. New York, Elsevier, Churchill Living-stone, 2005:97-100.
11. I.A.Kapandji, The Physiology of the Joints: Lower Limb, Volume 2, 5th edition, Churchill Livingstone, 1987
12. Czyrny Z, Greenspan A. Osgood-Schlatter Disease: a new perspective and classification based on ultrasonography. Ultrasonografia 2009; 38: 55-70.


![Patella Alta and Trochlea Dysplasia Is Associated with ... · cause of chondromalacia[7] as well as being associated with Osgood -Schlatter disease and Sinding-Larsen Jo-hansson’s](https://img.pdfslide.us/doc/110x75/5f11c8b997ae953bf3489f8f/patella-alta-and-trochlea-dysplasia-is-associated-with-cause-of-chondromalacia7.jpg)


![Acute Patella Tendon Rupture: A Case Report › oroaj › pdf › OROAJ.MS.ID... · 2018-12-10 · such as Osgood-Schlatter disease are also considered major risk factors [2]. We](https://img.pdfslide.us/doc/110x75/5f11ccb2cb62ab1fb830196b/acute-patella-tendon-rupture-a-case-report-a-oroaj-a-pdf-a-oroajmsid.jpg)