Embed Size (px)
Citation preview

TABLE R4. Number of nonfatal occupational injuries and illnesses involving days away from work1 by industry and selected eventsor exposures leading to injury or illness, 1997
Industry2 SICcode3
Totalcases
Event or exposure leading to injury or illness4
Contact with objects
Fallto
lowerlevel
Fallon
samelevel
Slipsor
tripswithout
fallTotal
Struckby
object
Struckagainstobject
Caughtin orcom-
pressedor
crushed
Private industry6 ..................................... 1,833,380 494,428 239,341 128,860 80,600 99,882 198,128 57,425
Agriculture, forestry, and fishing6 .............. 40,513 13,942 6,264 3,886 2,121 3,394 3,554 904
Agricultural production6 ................................ 01-02 18,123 6,028 2,729 1,663 868 1,575 1,714 421
Agricultural production— crops6 ................. 01 13,242 4,337 1,897 1,234 611 1,123 1,110 323Cash grains6 ........................................... 011 377 191 – 101 – – – –Field crops, except cash grains6 ............ 013 1,224 543 156 180 137 119 – –Vegetables and melons6 ........................ 016 1,802 603 304 87 95 75 139 –Fruits and tree nuts6 ............................... 017 4,738 1,556 629 579 130 724 349 134Horticultural specialties6 ......................... 018 4,090 1,101 558 257 158 153 494 130General farms, primarily crop6 ................ 019 1,011 343 180 – – – 75 –
Agricultural production— livestock 6 ........... 02 4,880 1,692 832 429 257 452 604 98Livestock, except dairy and poultry6 ....... 021 2,301 851 501 193 96 207 258 –Dairy farms6 ............................................ 024 793 242 110 – – – 134 –Poultry and eggs6 ................................... 025 1,239 486 178 138 108 68 137 26Animal specialties6 ................................. 027 335 58 33 – – 69 – –
Agricultural services ................................... 07 21,441 7,609 3,435 2,099 1,212 1,797 1,482 469Crop services ......................................... 072 2,995 1,238 370 266 511 176 248 57Veterinary services ................................. 074 2,503 – – – – – 191 –Animal services, except veterinary ......... 075 719 235 135 68 – 41 39 –Farm labor and management services ... 076 2,628 1,055 442 418 83 497 147 132Landscape and horticultural services ..... 078 12,596 4,968 2,444 1,289 604 1,084 857 258
Forestry ...................................................... 08 438 241 78 107 17 14 29 13Timber tracts .......................................... 081 148 67 – – – – – –Forestry services .................................... 085 246 174 64 103 – – 18 –
Mining7 .......................................................... 18,069 8,529 4,632 1,514 2,235 1,756 1,183 364Metal mining7 .............................................. 10 800 290 133 104 52 73 59 –
Iron ores7 ................................................ 101 227 59 24 30 5 13 14 –Copper ores7 .......................................... 102 170 65 35 18 12 17 16 –Lead and zinc ores7 ................................ 103 45 16 9 6 – – – –Gold and silver ores7 .............................. 104 262 109 49 36 23 30 21 –Ferroalloy ores, except vanadium7 ......... 106 31 11 – 8 – – – –Miscellaneous metal ores7 ..................... 109 65 30 15 6 9 5 – –
Coal mining7 ............................................... 12 4,987 2,342 1,228 635 468 336 382 –Bituminous coal and lignite mining7 ........ 122 4,889 2,308 1,219 624 454 321 375 –Anthracite mining7 .................................. 123 98 34 9 11 14 15 7 –
Oil and gas extraction ................................. 13 9,550 4,855 2,758 537 1,427 951 541 353Crude petroleum and natural gas ........... 131 1,551 670 518 – 87 137 115 –Oil and gas field services ....................... 138 7,894 4,135 2,189 484 1,340 813 426 332
Nonmetallic minerals, except fuels7 ........... 14 2,732 1,042 513 238 288 396 201 –Dimension stone7 ................................... 141 174 76 45 8 23 11 11 –Crushed and broken stone7 .................... 142 1,271 487 239 116 130 206 92 –Sand and gravel7 .................................... 144 744 299 155 71 72 120 53 –Clay, ceramic, and refractoryminerals6 .............................................. 145 216 74 27 15 32 24 16 –
Chemical and fertilizer minerals7 ............ 147 199 60 30 13 17 24 17 –Miscellaneous nonmetallic minerals7 ..... 149 128 46 17 15 14 11 12 –
Construction ................................................. 189,839 66,087 36,502 14,356 7,748 21,982 13,317 5,682General building contractors ...................... 15 36,947 12,686 7,556 2,805 954 4,984 2,449 1,396
Residential building construction ............ 152 18,071 6,334 3,721 1,599 235 2,615 928 866Nonresidential building construction ....... 154 18,216 6,281 3,797 1,199 704 2,182 1,342 529
Heavy construction, except building ........... 16 26,132 9,316 5,522 1,647 1,388 1,913 1,954 959Highway and street construction ............ 161 8,767 3,004 1,887 453 436 693 465 279Heavy construction, except highway ...... 162 17,365 6,312 3,635 1,194 952 1,219 1,488 681
Special trade contractors ............................ 17 126,761 44,084 23,424 9,904 5,406 15,085 8,915 3,327
See footnotes at end of table.
Page 1

TABLE R4. Number of nonfatal occupational injuries and illnesses involving days away from work1 by industry and selected events orexposures leading to injury or illness, 1997 — Continued
Industry2
Event or exposure leading to injury or illness4
Overexertion
Repeti-tive
motion
Expo-sureto
harmfulsub-
stanceor
environ-ment
Trans-portation
acci-dents
Firesand
explo-sions
Assaults and violent acts
Allother
events5Total In lifting Total Byperson
Allother
assaults
Private industry6 ..................................... 507,520 297,317 75,188 83,441 74,134 3,716 27,060 21,329 5,731 212,460
Agriculture, forestry, and fishing6 .............. 6,868 3,776 735 2,508 1,606 – 2,380 – 2,350 4,583
Agricultural production6 ................................ 3,096 1,662 251 1,031 855 38 548 – 544 2,566
Agricultural production— crops6 ................. 2,471 1,359 154 797 726 – 122 – 122 2,065Cash grains6 ........................................... – – – – – – – – – –Field crops, except cash grains6 ............ 225 173 – – – – – – – 211Vegetables and melons6 ........................ 278 173 – 199 79 – – – – 350Fruits and tree nuts6 ............................... 582 228 – 288 296 – – – – 732Horticultural specialties6 ......................... 1,081 647 97 182 184 – – – – 641General farms, primarily crop6 ................ 274 117 – – 120 – – – – 101
Agricultural production— livestock 6 ........... 625 303 97 233 128 – 425 – 421 502Livestock, except dairy and poultry6 ....... 325 137 – 126 51 – 184 – 184 237Dairy farms6 ............................................ – – – 19 – – 183 – 183 89Poultry and eggs6 ................................... 227 126 41 61 34 – 36 – 32 122Animal specialties6 ................................. – – – – – – – – – 51
Agricultural services ................................... 3,672 2,054 461 1,447 718 – 1,831 – 1,805 1,952Crop services ......................................... 502 300 231 139 161 – – – – 209Veterinary services ................................. 441 199 – – – – 1,538 – 1,538 –Animal services, except veterinary ......... 134 88 17 – – – 202 – 177 42Farm labor and management services ... 347 269 – 127 120 – – – – 201Landscape and horticultural services ..... 2,247 1,198 173 1,082 427 – – – – 1,445
Forestry ...................................................... 51 22 15 13 33 – – – – 27Timber tracts .......................................... – – – – – – – – – –Forestry services .................................... 16 – – – – – – – – 15
Mining7 .......................................................... 3,946 1,523 106 663 577 84 27 8 19 834Metal mining7 .............................................. 314 95 – 31 8 – – – – 18
Iron ores7 ................................................ 131 33 – – – – – – – –Copper ores7 .......................................... 54 16 – 12 – – – – – –Lead and zinc ores7 ................................ 18 6 – – – – – – – –Gold and silver ores7 .............................. 80 27 – 15 – – – – – 5Ferroalloy ores, except vanadium7 ......... 10 – – – – – – – – –Miscellaneous metal ores7 ..................... 21 11 – – – – – – – –
Coal mining7 ............................................... 1,635 598 11 131 22 – – – – 125Bituminous coal and lignite mining7 ........ 1,606 587 11 122 22 – – – – 122Anthracite mining7 .................................. 29 11 – 9 – – – – – –
Oil and gas extraction ................................. 1,136 519 – 331 538 – – – – 644Crude petroleum and natural gas ........... 203 113 – – – – – – – 126Oil and gas field services ....................... 882 406 – 276 456 – – – – 518
Nonmetallic minerals, except fuels7 ........... 861 311 – 170 9 – – – – 47Dimension stone7 ................................... 65 33 – 6 – – – – – –Crushed and broken stone7 .................... 389 131 – 77 – – – – – 16Sand and gravel7 .................................... 200 76 – 50 5 – – – – 14Clay, ceramic, and refractoryminerals6 .............................................. 81 28 – 12 – – – – – 9
Chemical and fertilizer minerals7 ............ 79 26 – 16 – – – – – –Miscellaneous nonmetallic minerals7 ..... 47 17 – 9 – – – – – –
Construction ................................................. 44,317 25,500 2,806 7,020 5,674 536 529 222 307 21,889General building contractors ...................... 9,223 6,093 463 1,137 965 – 98 – 65 3,492
Residential building construction ............ 4,517 3,172 130 530 685 – – – – 1,390Nonresidential building construction ....... 4,657 2,879 317 606 269 – – – – 1,956
Heavy construction, except building ........... 5,426 2,937 385 1,364 1,683 182 93 – 69 2,857Highway and street construction ............ 1,895 1,015 135 559 732 57 – 16 – 925Heavy construction, except highway ...... 3,532 1,922 250 805 951 125 70 – 63 1,932
Special trade contractors ............................ 29,667 16,470 1,957 4,519 3,027 300 339 166 173 15,540
See footnotes at end of table.
Page 2

TABLE R4. Number of nonfatal occupational injuries and illnesses involving days away from work1 by industry and selected eventsor exposures leading to injury or illness, 1997 — Continued
Industry2 SICcode3
Totalcases
Event or exposure leading to injury or illness4
Contact with objects
Fallto
lowerlevel
Fallon
samelevel
Slipsor
tripswithout
fallTotal
Struckby
object
Struckagainstobject
Caughtin orcom-
pressedor
crushed
Plumbing, heating, air-conditioning ........ 171 29,269 9,474 4,559 2,626 1,156 2,541 2,134 865Painting and paper hanging ................... 172 5,373 1,540 593 316 347 1,367 240 66Electrical work ........................................ 173 19,803 6,425 3,233 1,741 547 2,886 1,228 613Masonry, stonework, and plastering ....... 174 18,850 6,136 3,162 1,569 493 2,755 1,339 501Carpentry and floor work ........................ 175 11,330 5,615 3,744 1,003 486 1,014 726 134Roofing, siding, and sheet metal work ... 176 9,694 2,762 1,394 818 248 1,786 451 274Concrete work ........................................ 177 10,485 4,223 2,640 663 373 885 1,297 246Miscellaneous special tradecontractors ............................................ 179 18,854 6,430 3,441 1,128 988 1,784 1,492 627
Manufacturing ............................................... 446,109 150,957 63,234 35,255 37,150 14,402 33,960 11,368
Durable goods .............................................. 292,625 104,425 45,832 23,871 22,585 8,696 19,390 7,423Lumber and wood products ........................ 24 31,055 14,259 7,808 2,829 2,940 1,416 2,335 800
Logging ................................................... 241 3,883 1,783 1,305 – 356 113 458 248Sawmills and planing mills ..................... 242 8,482 3,710 1,947 732 879 325 1,002 160
Sawmills and planing mills, general ... 2421 7,141 3,014 1,596 613 722 313 889 125Hardwood dimension and flooringmills .................................................. 2426 1,221 600 340 120 111 – 113 35
Millwork, plywood and structuralmembers .............................................. 243 9,015 3,925 1,835 947 907 502 401 145Millwork .............................................. 2431 4,121 1,547 604 461 425 267 156 70Wood kitchen cabinets ....................... 2434 1,967 1,007 491 243 228 86 112 –Hardwood veneer and plywood .......... 2435 665 304 126 56 89 8 35 28Softwood veneer and plywood ........... 2436 459 142 72 21 45 28 32 17Structural wood members, n.e.c. ....... 2439 1,803 925 540 167 121 113 66 –
Wood containers .................................... 244 3,368 2,178 1,298 500 296 – 71 –Wood pallets and skids ...................... 2448 2,971 1,914 1,133 443 265 – – –
Wood buildings and mobile homes ........ 245 4,013 1,629 969 380 172 366 300 114Mobile homes ..................................... 2451 3,121 1,235 741 291 110 320 259 83Prefabricated wood buildings ............. 2452 893 393 228 89 61 46 41 31
Miscellaneous wood products ................ 249 2,293 1,033 454 217 329 75 103 82Wood preserving ................................ 2491 266 123 77 30 12 – 13 18Reconstituted wood products ............. 2493 414 149 70 – 63 – – –Wood products, n.e.c. ....................... 2499 1,613 761 307 175 254 52 65 41
Furniture and fixtures ................................. 25 14,322 5,749 2,328 1,275 1,563 354 735 176Household furniture ................................ 251 7,572 2,863 1,123 684 725 189 402 89
Wood household furniture .................. 2511 3,741 1,613 567 421 448 112 220 44Upholstered household furniture ........ 2512 1,371 509 248 114 110 19 81 –Metal household furniture ................... 2514 431 173 63 34 66 10 15 –Mattresses and bedsprings ................ 2515 1,739 461 209 78 68 – 68 –
Office furniture ........................................ 252 1,418 511 240 92 108 61 54 12Wood office furniture .......................... 2521 742 245 156 41 – – 32 –
Public building and related furniture ....... 253 1,271 401 186 94 77 – 77 26Partitions and fixtures ............................. 254 3,310 1,662 660 319 563 47 148 35
Wood partitions and fixtures ............... 2541 2,181 1,291 502 227 473 – 88 –Partitions and fixtures, except wood ... 2542 1,129 371 158 92 90 19 60 –
Miscellaneous furniture and fixtures ....... 259 751 312 120 84 91 51 54 13Drapery hardware and blinds andshades .............................................. 2591 448 177 76 37 63 – – –
Stone, clay, and glass products ................. 32 18,477 5,744 2,386 1,238 1,476 805 1,527 479Flat glass ................................................ 321 426 153 74 51 16 7 19 7Glass and glassware, pressed orblown .................................................... 322 1,680 489 211 145 81 69 133 58Glass containers ................................. 3221 648 146 40 40 45 30 64 38Pressed and blown glass, n.e.c. ........ 3229 1,031 344 172 105 36 39 69 20
Products of purchased glass .................. 323 1,607 590 285 116 112 19 83 10Cement, hydraulic .................................. 324 279 59 – – – – – –Structural clay products .......................... 325 1,340 421 141 128 131 60 79 42
See footnotes at end of table.
Page 3

TABLE R4. Number of nonfatal occupational injuries and illnesses involving days away from work1 by industry and selected events orexposures leading to injury or illness, 1997 — Continued
Industry2
Event or exposure leading to injury or illness4
Overexertion
Repeti-tive
motion
Expo-sureto
harmfulsub-
stanceor
environ-ment
Trans-portation
acci-dents
Firesand
explo-sions
Assaults and violent acts
Allother
events5Total In lifting Total Byperson
Allother
assaults
Plumbing, heating, air-conditioning ........ 7,680 3,318 362 1,579 834 – – – – 3,653Painting and paper hanging ................... 893 529 – 260 81 – – – – 848Electrical work ........................................ 4,151 2,184 341 784 489 144 – – – 2,703Masonry, stonework, and plastering ....... 4,708 3,045 463 251 380 – 113 81 – 2,175Carpentry and floor work ........................ 2,234 1,437 167 188 91 – – – – 1,162Roofing, siding, and sheet metal work ... 2,381 1,370 158 520 129 – – – 20 1,184Concrete work ........................................ 1,894 1,099 133 222 414 – – – – 1,148Miscellaneous special tradecontractors ............................................ 4,305 2,481 233 701 606 – – – – 2,617
Manufacturing ............................................... 117,310 64,768 35,902 24,382 8,474 791 1,034 629 405 47,529
Durable goods .............................................. 76,083 42,188 23,587 15,773 4,475 519 536 311 225 31,717Lumber and wood products ........................ 6,786 3,325 1,187 537 393 64 47 – – 3,232
Logging ................................................... 404 – 185 97 112 – – – – 470Sawmills and planing mills ..................... 1,857 723 218 113 80 – – – – 970
Sawmills and planing mills, general ... 1,647 615 114 94 76 – – – – 834Hardwood dimension and flooring
mills .................................................. 211 108 99 16 – – – – – 120Millwork, plywood and structuralmembers .............................................. 2,420 1,242 445 164 111 – 15 15 – 883Millwork .............................................. 1,300 832 193 62 43 – – – – 479Wood kitchen cabinets ....................... 392 169 139 45 – – – – – 143Hardwood veneer and plywood .......... 157 60 45 16 – – – – – 71Softwood veneer and plywood ........... 145 18 26 25 14 – – – – 30Structural wood members, n.e.c. ....... 427 164 – – – – – – – 159
Wood containers .................................... 681 384 – – – – – – – 227Wood pallets and skids ...................... 610 338 – – – – – – – 195
Wood buildings and mobile homes ........ 875 517 129 88 33 – – – – 469Mobile homes ..................................... 687 389 66 88 – – – – – 345Prefabricated wood buildings ............. 188 128 62 – – – – – – 124
Miscellaneous wood products ................ 548 386 163 55 18 – – – – 212Wood preserving ................................ 62 34 15 – – – – – – 27Reconstituted wood products ............. 101 73 – – – – – – – –Wood products, n.e.c. ....................... 385 279 146 – – – – – – 136
Furniture and fixtures ................................. 4,354 2,760 951 362 263 14 – – – 1,338Household furniture ................................ 2,405 1,623 487 212 182 – – – – 728
Wood household furniture .................. 1,037 726 144 142 103 – – – – 318Upholstered household furniture ........ 380 276 138 34 71 – – – – 120Metal household furniture ................... 139 69 26 16 – – 6 6 – 37Mattresses and bedsprings ................ 778 507 160 – – – – – – 235
Office furniture ........................................ 455 239 139 32 – – – – – 128Wood office furniture .......................... 272 185 71 16 – – – – – 72
Public building and related furniture ....... 373 223 176 20 26 – – – – 164Partitions and fixtures ............................. 892 567 118 76 32 – – – – 279
Wood partitions and fixtures ............... 458 311 53 45 – – – – – 139Partitions and fixtures, except wood ... 434 256 65 31 – – – – – 140
Miscellaneous furniture and fixtures ....... 228 108 31 – – – – – – 40Drapery hardware and blinds andshades .............................................. 144 51 17 – – – – – – –
Stone, clay, and glass products ................. 5,377 3,139 868 821 809 18 – – – 2,004Flat glass ................................................ 115 74 47 6 – – – – – 66Glass and glassware, pressed orblown .................................................... 452 210 163 97 30 – – – – 186Glass containers ................................. 169 81 39 61 11 – – – – 88Pressed and blown glass, n.e.c. ........ 283 129 123 36 19 – – – – 98
Products of purchased glass .................. 519 299 76 123 61 – – – – 126Cement, hydraulic .................................. 60 – – – – – – – – –Structural clay products .......................... 473 266 86 31 31 – – – – 113
See footnotes at end of table.
Page 4

TABLE R4. Number of nonfatal occupational injuries and illnesses involving days away from work1 by industry and selected eventsor exposures leading to injury or illness, 1997 — Continued
Industry2 SICcode3
Totalcases
Event or exposure leading to injury or illness4
Contact with objects
Fallto
lowerlevel
Fallon
samelevel
Slipsor
tripswithout
fallTotal
Struckby
object
Struckagainstobject
Caughtin orcom-
pressedor
crushed
Ceramic wall and floor tile .................. 3253 471 114 17 – 51 – – –Vitreous plumbing fixtures .................. 3261 329 46 29 – – – 14 –Pottery products, n.e.c. ..................... 3269 611 – – – – – – –
Concrete, gypsum, and plasterproducts ................................................ 327 9,673 3,011 1,141 606 872 547 940 300Concrete block and brick .................... 3271 927 404 – – – – – –Concrete products, n.e.c. .................. 3272 3,591 1,310 697 201 321 163 267 117Ready-mixed concrete ....................... 3273 4,994 1,242 316 312 344 353 556 177Gypsum products ............................... 3275 109 – – – 14 – – –
Miscellaneous nonmetallic mineralproducts ................................................ 329 1,391 416 180 105 108 61 125 19Abrasive products ............................... 3291 533 – – – – – – –Mineral wool ....................................... 3296 389 80 – 40 – 20 62 –
Primary metal industries ............................. 33 27,620 10,183 4,091 2,249 2,443 797 1,570 948Blast furnace and basic steel products ... 331 7,290 2,473 1,109 594 540 333 591 445
Blast furnaces and steel mills ............. 3312 4,331 1,322 649 304 242 250 418 239Steel wire and related products .......... 3315 757 314 112 84 100 15 27 24Cold finishing of steel shapes ............. 3316 982 320 145 91 78 – – 147Steel pipe and tubes ........................... 3317 1,142 497 190 112 115 34 100 –
Iron and steel foundries .......................... 332 7,565 3,355 1,016 902 694 152 325 199Gray and ductile iron foundries .......... 3321 5,351 2,602 677 758 507 77 245 114Malleable iron foundries ..................... 3322 143 46 – – – – – –Steel investment foundries ................. 3324 680 174 68 53 34 31 32 58Steel foundries, n.e.c. ........................ 3325 1,391 534 270 68 153 45 48 15
Primary nonferrous metals ..................... 333 1,189 239 111 59 40 54 53 31Primary copper ................................... 3331 70 24 – 14 6 7 8 –Primary aluminum .............................. 3334 894 191 96 44 26 38 37 31Primary nonferrous metals, n.e.c. ..... 3339 226 – 15 – – 8 – –
Secondary nonferrous metals ................ 334 901 225 108 52 – – 55 –Nonferrous rolling and drawing .............. 335 4,286 1,597 672 236 597 82 256 133
Copper rolling and drawing ................ 3351 981 396 195 38 152 14 58 38Aluminum sheet, plate, and foil .......... 3353 – – 14 – – – 15 –Aluminum extruded products .............. 3354 1,128 496 210 61 194 22 106 24Nonferrous rolling and drawing,n.e.c. ................................................ 3356 437 168 50 16 94 – – 29
Nonferrous wiredrawing andinsulating .......................................... 3357 1,522 457 201 96 129 37 72 33
Nonferrous foundries (castings) ............. 336 4,969 1,689 817 293 418 131 155 87Aluminum die— castings .................... 3363 1,918 672 239 158 224 41 81 49Nonferrous die— casting exceptaluminum .......................................... 3364 537 192 138 13 25 – 10 –
Aluminum foundries ............................ 3365 1,603 517 230 89 128 50 54 –Miscellaneous primary metal products ... 339 1,420 605 258 112 124 – 136 –
Metal heat treating .............................. 3398 1,053 427 210 – 109 – 106 –Primary metal products, n.e.c. ........... 3399 366 178 – 77 – – – –
Fabricated metal products .......................... 34 53,627 21,632 9,387 4,607 4,759 1,214 2,951 1,047Metal cans and shipping containers ....... 341 1,050 382 198 – 138 – 93 –
Metal cans .......................................... 3411 623 134 60 39 – – 69 –Cutlery, handtools, and hardware .......... 342 3,106 1,032 430 215 314 57 193 57
Cutlery ................................................ 3421 287 110 61 34 13 – 14 –Hand and edge tools, n.e.c. .............. 3423 803 275 96 49 104 13 32 11Saw blades and handsaws ................. 3425 167 62 – – 40 – – –Hardware, n.e.c. ................................ 3429 1,848 586 264 122 157 40 121 32
Plumbing and heating, except electric .... 343 1,770 756 298 139 126 – 97 –Metal sanitary ware ............................ 3431 761 386 – – – – – –Plumbing fixture fittings and trim ........ 3432 311 74 – – 35 – 16 –
Fabricated structural metal products ...... 344 20,590 9,626 4,668 1,763 1,818 638 769 334Fabricated structural metal ................. 3441 4,382 2,046 1,075 238 420 230 209 78Metal doors, sash, and trim ................ 3442 2,699 1,164 488 304 215 74 103 67
See footnotes at end of table.
Page 5

TABLE R4. Number of nonfatal occupational injuries and illnesses involving days away from work1 by industry and selected events orexposures leading to injury or illness, 1997 — Continued
Industry2
Event or exposure leading to injury or illness4
Overexertion
Repeti-tive
motion
Expo-sureto
harmfulsub-
stanceor
environ-ment
Trans-portation
acci-dents
Firesand
explo-sions
Assaults and violent acts
Allother
events5Total In lifting Total Byperson
Allother
assaults
Ceramic wall and floor tile .................. 195 73 – – – – – – – 44Vitreous plumbing fixtures .................. 152 92 46 9 – – – – – 51Pottery products, n.e.c. ..................... – – – – – – – – – –
Concrete, gypsum, and plasterproducts ................................................ 2,473 1,455 170 456 669 – – – – 1,082Concrete block and brick .................... – – – – – – – – – 201Concrete products, n.e.c. .................. 977 400 112 187 101 – – – – 350Ready-mixed concrete ....................... 1,302 968 52 240 546 – – – – 514Gypsum products ............................... 37 – – – – – – – – 17
Miscellaneous nonmetallic mineralproducts ................................................ 510 316 – 56 – – – – – 163Abrasive products ............................... – – – – – – – – – –Mineral wool ....................................... 166 124 – – – – – – – 38
Primary metal industries ............................. 6,536 2,672 1,609 2,426 472 143 55 45 – 2,881Blast furnace and basic steel products ... 1,841 549 201 508 118 79 13 – – 687
Blast furnaces and steel mills ............. 1,013 278 111 364 89 58 – – – 462Steel wire and related products .......... 234 80 48 27 – – – – – 63Cold finishing of steel shapes ............. 289 66 – – – – – – – 62Steel pipe and tubes ........................... 279 112 – 59 19 18 – – – 92
Iron and steel foundries .......................... 1,692 780 380 581 127 20 – – – 725Gray and ductile iron foundries .......... 1,217 519 174 374 110 – – – – 427Malleable iron foundries ..................... – – – – – – – – – –Steel investment foundries ................. 183 128 137 26 – – – – – 37Steel foundries, n.e.c. ........................ 263 116 39 178 15 – – – – 237
Primary nonferrous metals ..................... 342 118 76 134 29 15 – – – 218Primary copper ................................... 18 17 – – – – – – – 8Primary aluminum .............................. 263 67 62 107 20 12 – – – 132Primary nonferrous metals, n.e.c. ..... 61 35 14 – 9 – – – – 77
Secondary nonferrous metals ................ 197 114 – 206 – – – – – 110Nonferrous rolling and drawing .............. 1,194 552 270 183 117 – 12 12 – 440
Copper rolling and drawing ................ 243 91 50 39 14 – – – – 122Aluminum sheet, plate, and foil .......... – – – 19 – – – – – –Aluminum extruded products .............. 271 131 50 36 43 – – – – 80Nonferrous rolling and drawing,n.e.c. ................................................ 103 27 19 39 17 – – – – 54
Nonferrous wiredrawing andinsulating .......................................... 511 269 143 49 38 – – – – 174
Nonferrous foundries (castings) ............. 1,014 405 604 700 40 – 14 14 – 529Aluminum die— castings .................... 412 184 175 280 17 – – – – 175Nonferrous die— casting exceptaluminum .......................................... 97 33 100 57 – – – – – 66
Aluminum foundries ............................ 360 98 184 259 – – – – – 150Miscellaneous primary metal products ... 255 153 – 114 – – – – – 172
Metal heat treating .............................. 209 141 – 83 – – – – – 155Primary metal products, n.e.c. ........... – – – – – – – – – –
Fabricated metal products .......................... 14,341 8,255 2,937 3,333 660 83 71 58 – 5,358Metal cans and shipping containers ....... 206 54 – – – – – – – 212
Metal cans .......................................... 182 54 – 16 39 – – – – 133Cutlery, handtools, and hardware .......... 826 494 395 113 44 – – – – 381
Cutlery ................................................ 88 48 18 – – – – – – 43Hand and edge tools, n.e.c. .............. 280 183 93 30 13 – – – – 58Saw blades and handsaws ................. 35 – – – – – – – – 16Hardware, n.e.c. ................................ 423 240 277 71 26 – – – – 264
Plumbing and heating, except electric .... 529 432 81 119 – – – – – 168Metal sanitary ware ............................ 234 – – – – – – – – –Plumbing fixture fittings and trim ........ 134 111 42 – – – – – – 29
Fabricated structural metal products ...... 5,230 2,997 784 1,254 161 – – – – 1,755Fabricated structural metal ................. 994 471 134 238 – – – – – 441Metal doors, sash, and trim ................ 763 405 155 86 46 – 17 17 – 223
See footnotes at end of table.
Page 6

TABLE R4. Number of nonfatal occupational injuries and illnesses involving days away from work1 by industry and selected eventsor exposures leading to injury or illness, 1997 — Continued
Industry2 SICcode3
Totalcases
Event or exposure leading to injury or illness4
Contact with objects
Fallto
lowerlevel
Fallon
samelevel
Slipsor
tripswithout
fallTotal
Struckby
object
Struckagainstobject
Caughtin orcom-
pressedor
crushed
Fabricated plate work (boiler shops) .. 3443 4,783 2,186 1,146 396 418 53 192 126Sheet metalwork ................................. 3444 6,140 3,037 1,364 574 586 156 152 –Architectural metal work ..................... 3446 1,183 536 281 77 – – – –Prefabricated metal buildings ............. 3448 1,019 469 246 116 57 86 – –Miscellaneous metal work .................. 3449 384 188 67 57 55 14 28 –
Screw machine products, bolts, etc. ....... 345 3,012 1,131 311 356 242 – 243 86Screw machine products .................... 3451 1,694 769 165 307 106 – 128 61Bolts, nuts, rivets, and washers .......... 3452 1,318 362 146 49 136 16 115 –
Metal forgings and stampings ................ 346 10,236 3,988 1,645 882 1,014 208 721 228Iron and steel forgings ........................ 3462 1,525 596 326 33 139 62 61 –Automotive stampings ........................ 3465 5,023 1,706 614 544 381 86 423 161Metal stampings, n.e.c. ..................... 3469 3,287 1,487 637 288 394 45 229 33
Metal services, n.e.c. ............................. 347 5,104 1,445 543 425 229 110 357 116Plating and polishing .......................... 3471 2,736 615 283 165 115 67 123 70Metal coating and allied services ....... 3479 2,368 831 260 260 114 – 234 –
Ordnance and accessories, n.e.c. ......... 348 550 134 51 40 32 9 30 15Ammunition, except for small arms,n.e.c. ................................................ 3483 225 31 7 16 – 8 22 5
Small arms ......................................... 3484 195 74 23 23 23 – – 8Ordnance and accessories, n.e.c. ..... 3489 15 – – – – – – –
Miscellaneous fabricated metalproducts ................................................ 349 8,209 3,138 1,243 747 846 141 447 195Industrial valves .................................. 3491 632 254 99 71 70 25 19 9Fluid power valves and hose fittings .. 3492 694 339 137 99 100 – 12 9Valves and pipe fittings, n.e.c. ........... 3494 792 385 260 – 85 – 53 –Wire springs ....................................... 3495 265 47 – – – – – –Miscellaneous fabricated wireproducts ............................................ 3496 1,858 681 176 177 259 67 190 –
Fabricated pipe and fittings ................ 3498 1,260 513 202 152 133 18 62 54Fabricated metal products, n.e.c. ...... 3499 2,445 878 313 217 185 – 65 45
Industrial machinery and equipment .......... 35 51,115 19,991 8,984 4,250 4,191 1,341 2,908 1,109Engines and turbines .............................. 351 1,763 358 146 78 84 51 108 52
Turbines and turbine generator sets .. 3511 363 74 40 16 – 9 22 10Internal combustion engines, n.e.c. ... 3519 1,400 284 106 62 78 42 86 43
Farm and garden machinery .................. 352 3,315 1,289 571 225 349 91 91 85Farm machinery and equipment ......... 3523 2,826 1,131 513 162 322 89 48 79
Construction and related machinery ....... 353 8,377 3,433 1,859 403 629 199 372 153Construction machinery ...................... 3531 3,563 1,454 794 176 189 95 182 53Mining machinery ............................... 3532 649 210 108 – 46 – 43 –Oil and gas field machinery ................ 3533 1,222 564 239 94 211 – – –Elevators and moving stairways ......... 3534 177 67 53 – 10 – – –Conveyors and conveyingequipment ......................................... 3535 1,277 674 385 70 97 18 48 36
Industrial trucks and tractors .............. 3537 1,214 396 259 – – – – –Metalworking machinery ......................... 354 6,924 3,343 1,284 1,056 720 159 410 120
Machine tools, metal cutting types ..... 3541 774 390 137 115 97 34 34 23Machine tools, metal forming types .... 3542 505 229 104 – 77 – – –Special dies, tools, jigs and fixtures ... 3544 3,293 1,854 735 609 330 68 184 55Machine tool accessories ................... 3545 989 400 108 204 74 – 81 –Power-driven handtools ...................... 3546 377 101 40 10 38 – 23 –Welding apparatus ............................. 3548 374 99 53 16 20 – – –Metalworking machinery, n.e.c. ......... 3549 246 118 – 37 59 – 28 –
Special industry machinery .................... 355 4,284 1,396 736 129 306 59 357 120Textile machinery ............................... 3552 255 86 38 23 8 – 20 –Woodworking machinery .................... 3553 223 117 48 9 19 14 11 –Paper industries machinery ................ 3554 429 150 105 22 12 8 65 13Printing trades machinery ................... 3555 – – – – 11 – – –Special industry machinery, n.e.c. ..... 3559 2,519 731 337 – 234 – 218 79
General industrial machinery .................. 356 6,960 2,649 1,036 561 645 242 419 164
See footnotes at end of table.
Page 7

TABLE R4. Number of nonfatal occupational injuries and illnesses involving days away from work1 by industry and selected events orexposures leading to injury or illness, 1997 — Continued
Industry2
Event or exposure leading to injury or illness4
Overexertion
Repeti-tive
motion
Expo-sureto
harmfulsub-
stanceor
environ-ment
Trans-portation
acci-dents
Firesand
explo-sions
Assaults and violent acts
Allother
events5Total In lifting Total Byperson
Allother
assaults
Fabricated plate work (boiler shops) .. 1,184 684 207 347 – – – – – 452Sheet metalwork ................................. 1,727 1,173 205 476 – – – – – 303Architectural metal work ..................... 263 148 67 – – – – – – 169Prefabricated metal buildings ............. 220 76 – – – – – – – 136Miscellaneous metal work .................. 80 40 12 – – – – – – 31
Screw machine products, bolts, etc. ....... 1,009 670 122 132 71 – – – – 185Screw machine products .................... 449 381 79 122 – – – – – 65Bolts, nuts, rivets, and washers .......... 560 289 43 – 66 – – – – 120
Metal forgings and stampings ................ 2,741 1,420 571 492 226 19 – – – 1,028Iron and steel forgings ........................ 396 203 84 75 – 15 – – – 197Automotive stampings ........................ 1,406 688 350 219 154 – – – – 502Metal stampings, n.e.c. ..................... 892 500 109 151 57 – – – – 282
Metal services, n.e.c. ............................. 1,400 708 274 436 74 – – – – 870Plating and polishing .......................... 610 365 184 219 57 – – – – 787Metal coating and allied services ....... 790 343 – 217 – – – – – –
Ordnance and accessories, n.e.c. ......... 150 92 92 18 – 32 – – – 69Ammunition, except for small arms,n.e.c. ................................................ 55 38 38 5 – 30 – – – 28
Small arms ......................................... 46 29 32 9 – – – – – 24Ordnance and accessories, n.e.c. ..... 6 – – – – – – – – –
Miscellaneous fabricated metalproducts ................................................ 2,250 1,389 572 732 37 – – – – 689Industrial valves .................................. 174 97 53 – – – – – – 89Fluid power valves and hose fittings .. 118 62 53 83 – – – – – 73Valves and pipe fittings, n.e.c. ........... 130 86 40 37 – – – – – 108Wire springs ....................................... 102 84 45 – – – – – – –Miscellaneous fabricated wire
products ............................................ 598 356 102 60 16 – – – – 119Fabricated pipe and fittings ................ 338 129 115 97 – – – – – 56Fabricated metal products, n.e.c. ...... 662 507 159 445 – – – – – 159
Industrial machinery and equipment .......... 13,861 8,032 3,418 2,697 493 47 125 12 113 5,124Engines and turbines .............................. 604 286 187 98 20 – – – – 284
Turbines and turbine generator sets .. 95 43 22 26 – – – – – 105Internal combustion engines, n.e.c. ... 509 243 165 72 20 – – – – 179
Farm and garden machinery .................. 995 676 231 193 53 16 – – – 272Farm machinery and equipment ......... 893 614 165 167 16 16 – – – 223
Construction and related machinery ....... 2,301 1,330 358 470 79 – 98 – 98 907Construction machinery ...................... 908 441 200 241 63 – 33 – 33 329Mining machinery ............................... 147 64 40 – – – – – – 155Oil and gas field machinery ................ 301 158 – 75 – – – – – 96Elevators and moving stairways ......... 81 31 – 11 – – – – – 7Conveyors and conveyingequipment ......................................... 213 149 53 – – – – – – 183
Industrial trucks and tractors .............. 555 452 – 73 – – – – – 87Metalworking machinery ......................... 1,603 896 370 356 45 – – – – 512
Machine tools, metal cutting types ..... 189 123 46 27 – – – – – 33Machine tools, metal forming types .... 158 75 – – – – – – – –Special dies, tools, jigs and fixtures ... 642 301 126 199 – – – – – 154Machine tool accessories ................... 226 156 – 49 – – – – – 155Power-driven handtools ...................... 95 56 95 15 – – – – – 45Welding apparatus ............................. 170 94 35 – – – – – – –Metalworking machinery, n.e.c. ......... 55 43 – – – – – – – 33
Special industry machinery .................... 1,014 611 293 326 – – – – – 693Textile machinery ............................... 82 54 8 11 – – – – – 41Woodworking machinery .................... 38 31 11 – – – – – – 23Paper industries machinery ................ 130 77 16 10 – – – – – 32Printing trades machinery ................... – – 14 – – – – – – –Special industry machinery, n.e.c. ..... 580 341 135 283 – – – – – 473
General industrial machinery .................. 1,975 1,165 409 372 39 14 – – – 668
See footnotes at end of table.
Page 8

TABLE R4. Number of nonfatal occupational injuries and illnesses involving days away from work1 by industry and selected eventsor exposures leading to injury or illness, 1997 — Continued
Industry2 SICcode3
Totalcases
Event or exposure leading to injury or illness4
Contact with objects
Fallto
lowerlevel
Fallon
samelevel
Slipsor
tripswithout
fallTotal
Struckby
object
Struckagainstobject
Caughtin orcom-
pressedor
crushed
Pumps and pumping equipment ......... 3561 600 181 75 – – – 82 –Ball and roller bearings ....................... 3562 841 257 93 46 87 41 70 30Air and gas compressors .................... 3563 397 123 55 26 29 6 29 7Blowers and fans ................................ 3564 1,212 424 206 104 71 57 74 –Speed changers, drives, and gears .... 3566 677 256 73 119 – – – –Industrial furnaces and ovens ............ 3567 583 278 174 – – – – –Power transmission equipment,n.e.c. ................................................ 3568 517 184 82 16 61 8 19 13
General industrial machinery, n.e.c. .. 3569 1,544 672 222 84 148 49 66 –Computer and office equipment ............. 357 2,666 552 218 173 94 61 339 56
Electronic computers .......................... 3571 1,098 226 106 58 29 29 129 25Computer peripheral equipment,n.e.c. ................................................ 3577 874 157 48 82 – – 96 –
Office machines, n.e.c. ...................... 3579 341 98 36 13 44 13 38 –Refrigeration and service machinery ...... 358 5,390 1,796 894 486 314 220 286 130
Automatic vending machines ............. 3581 214 145 14 110 16 – 11 –Refrigeration and heatingequipment ......................................... 3585 3,652 1,142 603 265 205 100 215 97
Measuring and dispensing pumps ...... 3586 70 – – 10 – – 8 –Service industry machinery, n.e.c. .... 3589 1,200 417 242 77 74 117 48 –
Industrial machinery, n.e.c. ................... 359 11,436 5,176 2,240 1,139 1,049 259 525 229Carburetors, pistons, rings, valves ..... 3592 466 144 37 60 36 8 26 10Fluid power cylinders and actuators ... 3593 636 277 163 38 50 24 12 –Scales and balances, exceptlaboratory ......................................... 3596 115 23 – – – – 10 –
Industrial machinery, n.e.c. ............... 3599 8,632 4,023 1,598 928 887 170 382 193Electronic and other electric equipment ..... 36 24,734 6,443 2,469 1,755 1,573 599 1,956 539
Electric distribution equipment ............... 361 1,893 581 262 98 155 – 84 –Transformers, except electronic ......... 3612 1,106 335 206 39 71 18 37 15Switchgear and switchboardapparatus ......................................... 3613 787 246 57 60 85 – 47 –
Electrical industrial apparatus ................ 362 2,826 724 237 133 272 42 212 52Motors and generators ....................... 3621 1,558 488 148 84 203 26 96 28Relays and industrial controls ............ 3625 850 93 34 14 18 – – –Electrical industrial apparatus,n.e.c. ................................................ 3629 116 – – – 10 – 53 –
Household appliances ............................ 363 2,686 745 318 263 129 45 219 69Household refrigerators andfreezers ............................................ 3632 506 82 49 9 17 13 46 16
Electric housewares and fans ............ 3634 547 144 54 41 43 14 56 17Household vacuum cleaners .............. 3635 – – 20 19 12 10 – –Household appliances, n.e.c. ............ 3639 490 205 86 94 19 – – –
Electric lighting and wiring equipment .... 364 3,587 1,107 436 323 242 75 203 80Current-carrying wiring devices .......... 3643 999 326 78 102 113 – 88 31Vehicular lighting equipment .............. 3647 412 99 63 – – – – 12
Household audio and video equipmentand audio recordings ............................ 365 1,481 361 183 71 85 24 116 78Household audio and videoequipment ......................................... 3651 1,054 257 151 33 58 9 91 57
Prerecorded records and tapes .......... 3652 427 104 32 37 27 15 24 –Communications equipment ................... 366 2,271 447 150 150 93 98 230 45
Telephone and telegraph apparatus .. 3661 685 124 65 34 20 36 136 13Radio and TV communicationsequipment ......................................... 3663 1,306 219 77 58 59 61 88 –
Electronic components andaccessories .......................................... 367 7,436 1,771 605 518 388 250 708 157Electron tubes .................................... 3671 842 265 129 52 – – 37 15Printed circuit boards .......................... 3672 1,850 455 164 138 113 56 203 79
See footnotes at end of table.
Page 9

TABLE R4. Number of nonfatal occupational injuries and illnesses involving days away from work1 by industry and selected events orexposures leading to injury or illness, 1997 — Continued
Industry2
Event or exposure leading to injury or illness4
Overexertion
Repeti-tive
motion
Expo-sureto
harmfulsub-
stanceor
environ-ment
Trans-portation
acci-dents
Firesand
explo-sions
Assaults and violent acts
Allother
events5Total In lifting Total Byperson
Allother
assaults
Pumps and pumping equipment ......... 130 95 85 – – – – – – –Ball and roller bearings ....................... 268 172 40 33 18 – – – – 82Air and gas compressors .................... 135 80 54 8 – – – – – 30Blowers and fans ................................ 324 169 – 130 – – – – – 138Speed changers, drives, and gears .... 253 145 – – – – – – – –Industrial furnaces and ovens ............ 189 87 – – – – – – – –Power transmission equipment,n.e.c. ................................................ 174 97 89 – – – – – – 25
General industrial machinery, n.e.c. .. 325 200 48 137 – – – – – 206Computer and office equipment ............. 629 388 408 146 88 – – – – 387
Electronic computers .......................... 314 188 170 33 18 – – – – 155Computer peripheral equipment,n.e.c. ................................................ 137 102 168 81 – – – – – 172
Office machines, n.e.c. ...................... 81 50 28 – 26 – – – – 26Refrigeration and service machinery ...... 1,570 851 543 209 73 – 10 – 9 551
Automatic vending machines ............. – – – – – – – – – 15Refrigeration and heatingequipment ......................................... 1,101 561 457 126 28 – 10 – – 377
Measuring and dispensing pumps ...... 12 – – – – – – – – 18Service industry machinery, n.e.c. .... 340 245 33 60 34 – – – – 123
Industrial machinery, n.e.c. ................... 3,172 1,828 619 527 71 – – – – 852Carburetors, pistons, rings, valves ..... 119 54 54 40 – – – – – 57Fluid power cylinders and actuators ... 188 111 30 19 – – – – – 77Scales and balances, exceptlaboratory ......................................... 65 55 – – – – – – – –
Industrial machinery, n.e.c. ............... 2,342 1,368 412 428 66 – – – – 615Electronic and other electric equipment ..... 6,953 4,205 3,440 1,593 369 32 68 60 – 2,741
Electric distribution equipment ............... 605 264 229 148 – – – – – 192Transformers, except electronic ......... 331 118 180 77 – – – – – 111Switchgear and switchboardapparatus ......................................... 274 146 50 72 – – – – – 81
Electrical industrial apparatus ................ 906 515 461 178 11 – – – – 240Motors and generators ....................... 445 225 240 98 – – – – – 130Relays and industrial controls ............ 370 247 180 68 – – – – – 82Electrical industrial apparatus,n.e.c. ................................................ 19 – – – – – – – – –
Household appliances ............................ 791 391 414 75 68 – – – – 261Household refrigerators andfreezers ............................................ 116 43 117 17 23 – – – – 76
Electric housewares and fans ............ 200 127 50 20 19 – – – – 27Household vacuum cleaners .............. – 20 – 10 – – – – – 13Household appliances, n.e.c. ............ 108 83 70 – – – – – – 75
Electric lighting and wiring equipment .... 1,081 657 375 154 145 – – – – 360Current-carrying wiring devices .......... 268 158 151 46 18 – – – – 67Vehicular lighting equipment .............. 97 54 102 38 – – – – – 34
Household audio and video equipmentand audio recordings ............................ 367 205 207 112 – – – – – 209Household audio and video
equipment ......................................... 232 128 183 73 – – – – – 148Prerecorded records and tapes .......... 135 77 25 38 – – – – – 61
Communications equipment ................... 649 443 330 178 26 – – – – 266Telephone and telegraph apparatus .. 187 122 90 29 6 – – – – 63Radio and TV communicationsequipment ......................................... 365 238 203 146 20 – – – – 172
Electronic components andaccessories .......................................... 1,947 1,369 1,029 563 78 – 10 – – 919Electron tubes .................................... 298 217 82 – 16 – – – – 93Printed circuit boards .......................... 492 354 115 180 17 – – – – 251
See footnotes at end of table.
Page 10

TABLE R4. Number of nonfatal occupational injuries and illnesses involving days away from work1 by industry and selected eventsor exposures leading to injury or illness, 1997 — Continued
Industry2 SICcode3
Totalcases
Event or exposure leading to injury or illness4
Contact with objects
Fallto
lowerlevel
Fallon
samelevel
Slipsor
tripswithout
fallTotal
Struckby
object
Struckagainstobject
Caughtin orcom-
pressedor
crushed
Semiconductors and relateddevices ............................................. 3674 1,915 261 91 118 27 104 280 43
Electronic capacitors .......................... 3675 199 64 18 12 28 13 27 –Electronic resistors ............................. 3676 102 28 8 7 10 – – –Electronic coils and transformers ....... 3677 234 – – – – – – –Electronic connectors ......................... 3678 387 – – – – – – –Electronic components, n.e.c. ........... 3679 1,907 545 150 129 149 59 139 18
Miscellaneous electrical equipment andsupplies ................................................ 369 2,553 707 277 198 210 46 184 35Storage batteries ................................ 3691 350 114 35 43 36 12 28 7Engine electrical equipment ............... 3694 1,271 335 160 53 103 21 64 13Magnetic and optical recordingmedia ................................................ 3695 317 – – 17 – – 20 –
Electrical equipment and supplies,n.e.c. ................................................ 3699 433 – – – – – – –
Transportation equipment .......................... 37 53,568 15,190 6,429 4,159 2,442 1,639 3,957 1,911Motor vehicles and equipment ............... 371 32,397 9,008 3,674 2,508 1,689 664 2,150 1,202
Motor vehicles and car bodies ............ 3711 14,111 3,053 1,141 1,010 395 246 1,054 489Truck and bus bodies ......................... 3713 2,063 764 333 178 173 95 130 49Motor vehicle parts and accessories .. 3714 14,277 4,424 1,833 1,114 1,031 264 867 614Truck trailers ....................................... 3715 1,562 598 291 139 65 45 74 48
Aircraft and parts .................................... 372 8,299 2,151 948 687 333 258 639 259Aircraft ................................................ 3721 4,325 862 323 360 127 150 327 135Aircraft engines and engine parts ....... 3724 1,361 453 249 118 74 13 105 81Aircraft parts and equipment, n.e.c. .. 3728 2,614 836 376 210 132 95 207 43
Ship and boat building and repairing ...... 373 8,805 2,733 1,214 661 189 630 840 355Ship building and repairing ................. 3731 5,805 1,591 792 444 120 514 582 224Boat building and repairing ................. 3732 3,000 1,142 422 216 68 116 258 131
Railroad equipment ................................ 374 861 296 129 69 59 43 36 44Motorcycles, bicycles, and parts ............ 375 607 135 61 40 15 – 52 11Guided missiles, space vehicles, parts .. 376 719 221 97 55 42 21 80 12
Guided missiles and space vehicles .. 3761 420 98 – – – – 57 –Miscellaneous transportationequipment ............................................. 379 1,880 645 306 139 115 24 161 28Travel trailers and campers ................ 3792 590 181 116 32 30 16 41 16Tanks and tank components .............. 3795 42 11 – – – – – –Transportation equipment, n.e.c. ....... 3799 1,248 453 186 104 82 – 120 12
Instruments and related products ............... 38 9,978 2,480 837 666 694 274 877 202Search and navigation equipment .......... 381 872 156 51 48 29 45 121 32Measuring and controlling devices ......... 382 3,161 807 305 223 235 44 276 74
Laboratory apparatus and furniture .... 3821 284 61 10 36 11 – 23 –Environmental controls ....................... 3822 659 191 51 60 70 16 66 –Process control instruments ............... 3823 412 116 71 16 – – 18 –Fluid meters and counting devices ..... 3824 182 39 18 13 8 – – 7Instruments to measure electricity ...... 3825 586 117 53 16 34 6 76 18Analytical instruments ........................ 3826 368 – – – – – – –Optical instruments and lenses .......... 3827 340 – – – – – – –Measuring and controlling devices,n.e.c. ................................................ 3829 329 82 – – – – – 12
Medical instruments and supplies .......... 384 4,168 1,191 374 319 326 85 319 48Surgical and medical instruments ...... 3841 1,949 571 98 197 257 65 130 –Surgical appliances and supplies ....... 3842 1,642 484 205 84 52 – 137 –Dental equipment and supplies .......... 3843 – – – – – – – –Electromedical equipment .................. 3845 280 60 30 19 – 8 19 –
Ophthalmic goods .................................. 385 399 70 25 20 25 19 47 7Photographic equipment and supplies ... 386 1,232 214 78 47 67 72 90 –Watches, clocks, watchcases andparts ..................................................... 387 147 41 – 10 11 9 24 17
Miscellaneous manufacturing industries .... 39 8,130 2,754 1,113 845 505 257 575 212
See footnotes at end of table.
Page 11
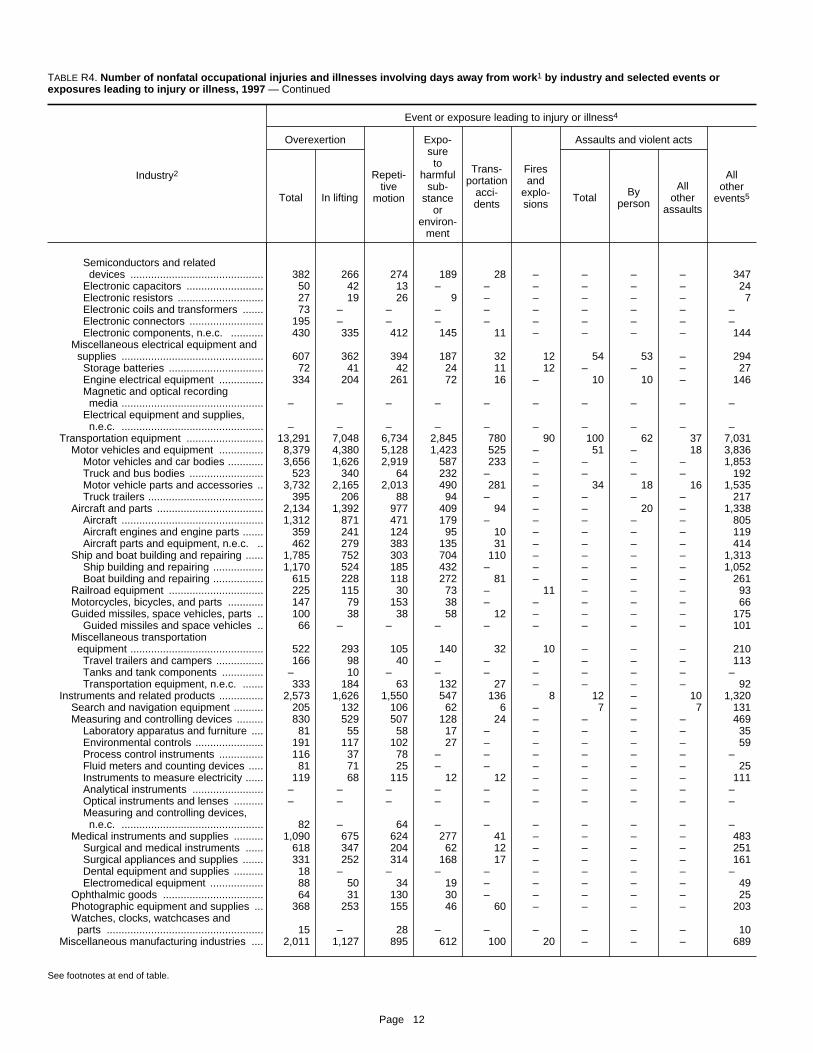
TABLE R4. Number of nonfatal occupational injuries and illnesses involving days away from work1 by industry and selected events orexposures leading to injury or illness, 1997 — Continued
Industry2
Event or exposure leading to injury or illness4
Overexertion
Repeti-tive
motion
Expo-sureto
harmfulsub-
stanceor
environ-ment
Trans-portation
acci-dents
Firesand
explo-sions
Assaults and violent acts
Allother
events5Total In lifting Total Byperson
Allother
assaults
Semiconductors and relateddevices ............................................. 382 266 274 189 28 – – – – 347
Electronic capacitors .......................... 50 42 13 – – – – – – 24Electronic resistors ............................. 27 19 26 9 – – – – – 7Electronic coils and transformers ....... 73 – – – – – – – – –Electronic connectors ......................... 195 – – – – – – – – –Electronic components, n.e.c. ........... 430 335 412 145 11 – – – – 144
Miscellaneous electrical equipment andsupplies ................................................ 607 362 394 187 32 12 54 53 – 294Storage batteries ................................ 72 41 42 24 11 12 – – – 27Engine electrical equipment ............... 334 204 261 72 16 – 10 10 – 146Magnetic and optical recording
media ................................................ – – – – – – – – – –Electrical equipment and supplies,n.e.c. ................................................ – – – – – – – – – –
Transportation equipment .......................... 13,291 7,048 6,734 2,845 780 90 100 62 37 7,031Motor vehicles and equipment ............... 8,379 4,380 5,128 1,423 525 – 51 – 18 3,836
Motor vehicles and car bodies ............ 3,656 1,626 2,919 587 233 – – – – 1,853Truck and bus bodies ......................... 523 340 64 232 – – – – – 192Motor vehicle parts and accessories .. 3,732 2,165 2,013 490 281 – 34 18 16 1,535Truck trailers ....................................... 395 206 88 94 – – – – – 217
Aircraft and parts .................................... 2,134 1,392 977 409 94 – – 20 – 1,338Aircraft ................................................ 1,312 871 471 179 – – – – – 805Aircraft engines and engine parts ....... 359 241 124 95 10 – – – – 119Aircraft parts and equipment, n.e.c. .. 462 279 383 135 31 – – – – 414
Ship and boat building and repairing ...... 1,785 752 303 704 110 – – – – 1,313Ship building and repairing ................. 1,170 524 185 432 – – – – – 1,052Boat building and repairing ................. 615 228 118 272 81 – – – – 261
Railroad equipment ................................ 225 115 30 73 – 11 – – – 93Motorcycles, bicycles, and parts ............ 147 79 153 38 – – – – – 66Guided missiles, space vehicles, parts .. 100 38 38 58 12 – – – – 175
Guided missiles and space vehicles .. 66 – – – – – – – – 101Miscellaneous transportationequipment ............................................. 522 293 105 140 32 10 – – – 210Travel trailers and campers ................ 166 98 40 – – – – – – 113Tanks and tank components .............. – 10 – – – – – – – –Transportation equipment, n.e.c. ....... 333 184 63 132 27 – – – – 92
Instruments and related products ............... 2,573 1,626 1,550 547 136 8 12 – 10 1,320Search and navigation equipment .......... 205 132 106 62 6 – 7 – 7 131Measuring and controlling devices ......... 830 529 507 128 24 – – – – 469
Laboratory apparatus and furniture .... 81 55 58 17 – – – – – 35Environmental controls ....................... 191 117 102 27 – – – – – 59Process control instruments ............... 116 37 78 – – – – – – –Fluid meters and counting devices ..... 81 71 25 – – – – – – 25Instruments to measure electricity ...... 119 68 115 12 12 – – – – 111Analytical instruments ........................ – – – – – – – – – –Optical instruments and lenses .......... – – – – – – – – – –Measuring and controlling devices,n.e.c. ................................................ 82 – 64 – – – – – – –
Medical instruments and supplies .......... 1,090 675 624 277 41 – – – – 483Surgical and medical instruments ...... 618 347 204 62 12 – – – – 251Surgical appliances and supplies ....... 331 252 314 168 17 – – – – 161Dental equipment and supplies .......... 18 – – – – – – – – –Electromedical equipment .................. 88 50 34 19 – – – – – 49
Ophthalmic goods .................................. 64 31 130 30 – – – – – 25Photographic equipment and supplies ... 368 253 155 46 60 – – – – 203Watches, clocks, watchcases andparts ..................................................... 15 – 28 – – – – – – 10
Miscellaneous manufacturing industries .... 2,011 1,127 895 612 100 20 – – – 689
See footnotes at end of table.
Page 12

TABLE R4. Number of nonfatal occupational injuries and illnesses involving days away from work1 by industry and selected eventsor exposures leading to injury or illness, 1997 — Continued
Industry2 SICcode3
Totalcases
Event or exposure leading to injury or illness4
Contact with objects
Fallto
lowerlevel
Fallon
samelevel
Slipsor
tripswithout
fallTotal
Struckby
object
Struckagainstobject
Caughtin orcom-
pressedor
crushed
Jewelry, silverware, and plated ware ..... 391 389 116 28 47 – 11 38 –Jewelry, precious metal ...................... 3911 – – – – – – – –
Musical instruments ................................ 393 305 109 73 14 19 – 9 –Toys and sporting goods ........................ 394 2,167 664 226 214 133 58 195 –
Games, toys, and children’svehicles ............................................ 3944 766 209 55 90 42 18 93 16
Sporting and athletic goods, n.e.c. .... 3949 – – – – – – – –Pens, pencils, office, and art supplies .... 395 512 205 53 44 81 – 34 –
Lead pencils and art goods ................ 3952 122 35 16 – 9 – 9 –Costume jewelry and notions ................. 396 764 189 – 137 – – – –
Costume jewelry ................................. 3961 595 – – – – – – –Fasteners, buttons, needles, andpins ................................................... 3965 169 52 13 – 14 – – –
Miscellaneous manufactures .................. 399 3,993 1,470 703 389 228 124 246 117Brooms and brushes .......................... 3991 384 120 31 36 38 – 27 –Signs and advertising specialities ...... 3993 1,514 595 260 184 82 71 73 72Burial caskets ..................................... 3995 364 104 – 33 – 18 18 –Hard surface floor coverings, n.e.c. ... 3996 102 – 7 8 – 8 9 –Manufacturing industries, n.e.c. ........ 3999 1,629 630 381 128 95 – 120 34
Nondurable goods ........................................ 153,484 46,532 17,403 11,384 14,565 5,706 14,569 3,945Food and kindred products ......................... 20 53,752 15,336 6,321 3,770 4,167 2,539 5,667 1,438
Meat products ......................................... 201 13,646 4,696 2,243 1,030 1,113 491 1,234 338Meat packing plants ........................... 2011 5,526 1,878 979 393 393 252 401 156Sausages and other preparedmeats ................................................ 2013 4,147 1,488 604 334 422 92 355 116
Poultry slaughtering and processing .. 2015 3,973 1,329 661 303 298 147 478 66Dairy products ........................................ 202 6,477 1,359 435 426 467 426 866 203
Creamery butter ................................. 2021 50 19 – 9 10 – 7 –Cheese, natural and processed ......... 2022 1,494 291 64 106 108 84 167 41Dry, condensed, evaporatedproducts ............................................ 2023 648 124 46 54 22 51 33 15
Ice cream and frozen desserts ........... 2024 453 156 – – – – – –Fluid milk ............................................ 2026 3,831 769 264 206 281 248 608 137
Preserved fruits and vegetables ............. 203 6,507 2,023 812 433 616 390 804 232Canned specialties ............................. 2032 320 84 41 14 26 19 29 23Canned fruits and vegetables ............. 2033 2,421 717 280 155 216 169 322 72Dehydrated fruits, vegetables,soups ................................................ 2034 482 145 61 17 40 – 77 14
Pickles, sauces, and saladdressings .......................................... 2035 719 221 85 63 – – 51 18
Frozen fruits and vegetables .............. 2037 1,593 551 230 137 168 130 207 90Frozen specialities, n.e.c. .................. 2038 973 305 116 48 138 43 118 15
Grain mill products ................................. 204 3,925 1,087 450 237 329 240 440 92Cereal breakfast foods ....................... 2043 393 116 36 20 45 31 24 23Wet corn milling .................................. 2046 113 34 16 – 17 21 – 8Dog and cat food ................................ 2047 530 194 65 58 69 – 50 –Prepared feeds, n.e.c. ....................... 2048 1,203 263 – – – – 139 –
Bakery products ..................................... 205 5,936 1,712 573 430 601 238 715 161Bread, cake, and related products ..... 2051 4,261 1,275 479 273 456 192 569 138Cookies and crackers ......................... 2052 1,445 375 82 157 105 32 110 –Frozen bakery products, exceptbread ................................................ 2053 230 – – – – – – –
Sugar and confectionery products .......... 206 2,123 500 153 106 208 44 265 70Raw cane sugar ................................. 2061 129 47 26 – 10 – 22 –Candy and other confectioneryproducts ............................................ 2064 1,112 298 90 – 138 20 145 –
Chocolate and cocoa products ........... 2066 208 – – – – – – –Fats and oils ........................................... 207 774 183 70 – – 87 74 –
See footnotes at end of table.
Page 13

TABLE R4. Number of nonfatal occupational injuries and illnesses involving days away from work1 by industry and selected events orexposures leading to injury or illness, 1997 — Continued
Industry2
Event or exposure leading to injury or illness4
Overexertion
Repeti-tive
motion
Expo-sureto
harmfulsub-
stanceor
environ-ment
Trans-portation
acci-dents
Firesand
explo-sions
Assaults and violent acts
Allother
events5Total In lifting Total Byperson
Allother
assaults
Jewelry, silverware, and plated ware ..... 89 69 60 41 – – – – – 30Jewelry, precious metal ...................... 19 – – – – – – – – 19
Musical instruments ................................ 62 31 58 32 – – – – – 30Toys and sporting goods ........................ 492 307 300 143 49 – – – – 236
Games, toys, and children’svehicles ............................................ 145 69 147 26 32 – – – – 74
Sporting and athletic goods, n.e.c. .... – – – – 18 – – – – –Pens, pencils, office, and art supplies .... 105 63 91 – – – – – – 47
Lead pencils and art goods ................ 38 – – – – – – – – –Costume jewelry and notions ................. 189 92 – 116 – – – – – –
Costume jewelry ................................. – – – – – – – – – –Fasteners, buttons, needles, andpins ................................................... 49 – – – – – – – – –
Miscellaneous manufactures .................. 1,074 565 318 259 46 15 – – – 320Brooms and brushes .......................... 54 36 152 – – – – – – 27Signs and advertising specialities ...... 344 211 80 145 – – – – – 127Burial caskets ..................................... 144 85 44 12 – – – – – 19Hard surface floor coverings, n.e.c. ... 48 14 – – – – – – – 9Manufacturing industries, n.e.c. ........ 484 220 40 99 46 – – – – 137
Nondurable goods ........................................ 41,227 22,580 12,315 8,609 3,999 271 498 318 180 15,812Food and kindred products ......................... 13,879 7,466 3,963 3,463 1,663 63 234 119 115 5,508
Meat products ......................................... 2,576 1,276 1,869 892 347 11 91 26 65 1,102Meat packing plants ........................... 936 397 770 453 159 – 35 – – 486Sausages and other prepared
meats ................................................ 958 509 496 186 83 – 40 – 40 329Poultry slaughtering and processing .. 682 370 603 253 105 – 16 16 – 287
Dairy products ........................................ 2,087 975 291 394 227 – – – – 618Creamery butter ................................. 11 11 – 8 – – – – – –Cheese, natural and processed ......... 438 235 162 126 – – – – – 163Dry, condensed, evaporatedproducts ............................................ 221 137 26 95 – – – – – 78
Ice cream and frozen desserts ........... – 19 – 15 18 – – – – 73Fluid milk ............................................ 1,350 572 82 150 182 – – – – 301
Preserved fruits and vegetables ............. 1,323 711 383 490 148 – – – – 712Canned specialties ............................. 94 30 – 15 – – – – – 49Canned fruits and vegetables ............. 555 311 91 194 70 – – – – 232Dehydrated fruits, vegetables,soups ................................................ 87 39 14 42 – – – – – 78
Pickles, sauces, and saladdressings .......................................... 230 126 71 38 – – – – – 76
Frozen fruits and vegetables .............. 202 100 74 128 47 – – – – 163Frozen specialities, n.e.c. .................. 155 105 126 73 – – – – – 115
Grain mill products ................................. 1,265 744 176 181 83 – 32 32 – 322Cereal breakfast foods ....................... 96 46 27 10 11 – – – – 55Wet corn milling .................................. 22 18 13 7 – – – – – –Dog and cat food ................................ 96 52 – 60 – – – – – 51Prepared feeds, n.e.c. ....................... 552 378 – – – – – – – –
Bakery products ..................................... 1,582 886 366 238 132 – 17 12 – 765Bread, cake, and related products ..... 1,115 639 192 161 98 – – – – 515Cookies and crackers ......................... 412 215 140 67 34 11 12 12 – 228Frozen bakery products, exceptbread ................................................ – – – – – – – – – –
Sugar and confectionery products .......... 619 380 117 188 99 – 39 – 39 161Raw cane sugar ................................. 11 – – 13 – – – – – 13Candy and other confectioneryproducts ............................................ 301 213 87 106 – 17 – – – 90
Chocolate and cocoa products ........... – – – – – – – – – –Fats and oils ........................................... 114 79 – 167 – – – – – 98
See footnotes at end of table.
Page 14

TABLE R4. Number of nonfatal occupational injuries and illnesses involving days away from work1 by industry and selected eventsor exposures leading to injury or illness, 1997 — Continued
Industry2 SICcode3
Totalcases
Event or exposure leading to injury or illness4
Contact with objects
Fallto
lowerlevel
Fallon
samelevel
Slipsor
tripswithout
fallTotal
Struckby
object
Struckagainstobject
Caughtin orcom-
pressedor
crushed
Beverages .............................................. 208 7,512 1,436 549 414 272 260 616 144Malt beverages ................................... 2082 1,120 147 – 107 – – – –Wines, brandy, and brandy spirits ...... 2084 868 241 90 29 48 34 72 20Bottled and canned soft drinks ........... 2086 4,807 861 390 205 185 145 439 98Flavoring extracts and syrups,n.e.c. ................................................ 2087 491 155 – – – – – –
Miscellaneous food and kindredproducts ................................................ 209 6,853 2,340 1,036 635 507 363 654 165Canned and cured fish andseafoods ........................................... 2091 288 78 29 15 9 20 38 15
Fresh or frozen prepared fish ............. 2092 2,332 846 397 251 124 106 202 20Roasted coffee ................................... 2095 344 108 53 18 – – 59 19Potato chips and similar snacks ......... 2096 1,270 323 142 130 – 105 94 –Food preparations, n.e.c. .................. 2099 1,983 741 295 182 227 50 165 53
Tobacco products ....................................... 21 651 190 51 51 66 36 53 12Cigarettes ............................................... 211 397 113 36 29 40 14 35 12Cigars ..................................................... 212 93 43 – 18 22 – 10 –
Textile mill products .................................... 22 6,564 2,164 958 407 649 237 591 152Broadwoven fabric mills, cotton .............. 221 – – – – – – – –Broadwoven fabric mills, manmade ....... 222 610 204 113 – 50 20 84 –Broadwoven fabric mills, wool ................ 223 196 47 28 7 12 – 33 –Narrow fabric mills .................................. 224 269 104 14 20 58 – 19 –Knitting mills ........................................... 225 2,111 682 287 177 157 106 143 40
Women’s hosiery, except socks ......... 2251 188 51 33 14 – 11 23 –Hosiery, n.e.c. ................................... 2252 308 77 40 10 25 – 27 15Knit outerwear mills ............................ 2253 635 162 48 45 31 22 32 –Knit underwear mills ........................... 2254 154 29 11 16 – – – 14Weft knit fabric mills ........................... 2257 468 210 79 72 40 – 10 –Lace and warp knit fabric mills ........... 2258 307 137 72 17 48 35 – –
Textile finishing, except wool .................. 226 1,209 402 228 67 96 44 137 27Finishing plants, cotton ....................... 2261 513 132 51 – 51 32 44 12Finishing plants, manmade ................ 2262 380 150 76 29 41 12 40 –Finishing plants, n.e.c. ....................... 2269 316 119 101 – – – – –
Carpets and rugs .................................... 227 341 – – – – – – 17Yarn and thread mills ............................. 228 520 185 66 20 72 33 61 11
Yarn spinning mills ............................. 2281 307 103 28 15 39 9 46 11Throwing and winding mills ................ 2282 163 61 – – – 20 – –
Miscellaneous textile goods ................... 229 1,033 354 152 58 124 13 58 10Textile goods, n.e.c. .......................... 2299 379 96 41 18 – – 30 –
Apparel and other textile products .............. 23 12,018 3,362 1,133 973 1,067 286 1,278 213Men’s and boys’ suits and coats ............ 231 592 128 42 60 20 17 35 –Men’s and boys’ furnishings ................... 232 3,235 749 296 175 236 62 260 27
Men’s and boys’ shirts ........................ 2321 458 106 47 – – – 19 –Men’s and boys’ underwear andnightwear .......................................... 2322 193 49 23 17 8 7 15 –
Men’s and boys’ trousers andslacks ............................................... 2325 1,204 257 103 76 64 19 63 14
Men’s and boys’ work clothing ........... 2326 708 160 66 23 63 – 79 –Men’s and boys’ clothing, n.e.c. ........ 2329 601 159 53 31 72 27 54 –
Women’s and misses’ outerwear ........... 233 2,894 813 309 350 102 37 386 97Women’s and misses’ suits andcoats ................................................. 2337 355 94 47 27 14 – 77 –
Women’s and misses’ outerwear,n.e.c. ................................................ 2339 1,725 481 159 228 80 – 166 80
Women’s and children’sundergarments ..................................... 234 421 100 37 11 49 11 55 7Women’s and children’s underwear ... 2341 275 89 29 9 46 – 40 –Bras, girdles, and allied garments ...... 2342 146 12 7 – – 7 15 –
Girls’ and children’s outerwear ............... 236 403 131 34 67 28 10 28 –
See footnotes at end of table.
Page 15

TABLE R4. Number of nonfatal occupational injuries and illnesses involving days away from work1 by industry and selected events orexposures leading to injury or illness, 1997 — Continued
Industry2
Event or exposure leading to injury or illness4
Overexertion
Repeti-tive
motion
Expo-sureto
harmfulsub-
stanceor
environ-ment
Trans-portation
acci-dents
Firesand
explo-sions
Assaults and violent acts
Allother
events5Total In lifting Total Byperson
Allother
assaults
Beverages .............................................. 2,675 1,588 284 456 466 – 37 31 – 1,136Malt beverages ................................... 229 – – 249 92 – – – – 251Wines, brandy, and brandy spirits ...... 177 92 68 34 32 – – – – 190Bottled and canned soft drinks ........... 2,021 1,253 135 140 330 – 32 – – 606Flavoring extracts and syrups,n.e.c. ................................................ 143 131 18 – – – – – – 69
Miscellaneous food and kindredproducts ................................................ 1,639 829 470 457 160 – – – – 593Canned and cured fish and
seafoods ........................................... 53 25 16 23 – – – – – 44Fresh or frozen prepared fish ............. 405 236 233 188 87 – – – – 239Roasted coffee ................................... 90 71 – – 16 – – – – –Potato chips and similar snacks ......... 421 188 118 – – – – – – 136Food preparations, n.e.c. .................. 542 263 98 154 39 – – – – 139
Tobacco products ....................................... 219 116 20 12 11 – – – – 92Cigarettes ............................................... 129 64 8 7 8 – – – – 72Cigars ..................................................... 21 21 – – – – – – – 10
Textile mill products .................................... 1,816 919 434 289 107 8 21 19 – 746Broadwoven fabric mills, cotton .............. – – – 14 – – – – – –Broadwoven fabric mills, manmade ....... 166 95 15 – 31 – – – – 66Broadwoven fabric mills, wool ................ 57 20 32 11 – – – – – 10Narrow fabric mills .................................. 75 14 – – – – – – – 38Knitting mills ........................................... 564 342 237 86 31 – – – – 214
Women’s hosiery, except socks ......... 51 40 32 – – – – – – 13Hosiery, n.e.c. ................................... 42 18 63 38 – – – – – 44Knit outerwear mills ............................ 201 124 94 28 20 – – – – 71Knit underwear mills ........................... 29 – – – – – – – – 27Weft knit fabric mills ........................... 148 86 – 12 – – – – – 29Lace and warp knit fabric mills ........... 77 40 – – – – – – – –
Textile finishing, except wool .................. 342 158 43 126 11 – – – – 74Finishing plants, cotton ....................... 189 89 18 56 – – – – – –Finishing plants, manmade ................ 94 40 12 42 – – – – – 30Finishing plants, n.e.c. ....................... – – – – – – – – – –
Carpets and rugs .................................... – – – – – – – – – –Yarn and thread mills ............................. 122 57 15 – – – – – – 45
Yarn spinning mills ............................. 78 33 10 – 17 – 7 7 – 24Throwing and winding mills ................ – 18 – 13 – – – – – 15
Miscellaneous textile goods ................... 296 168 42 18 – – 8 8 – 231Textile goods, n.e.c. .......................... 93 52 – – – – – – – 146
Apparel and other textile products .............. 2,857 1,694 2,287 494 100 – 18 – 12 1,122Men’s and boys’ suits and coats ............ 121 71 161 36 7 – – – – 84Men’s and boys’ furnishings ................... 829 578 803 143 – – – – – 354
Men’s and boys’ shirts ........................ 189 139 52 27 – – – – – 59Men’s and boys’ underwear andnightwear .......................................... 59 36 20 20 – – – – – 21
Men’s and boys’ trousers andslacks ............................................... 282 189 429 43 – – – – – 97
Men’s and boys’ work clothing ........... 116 60 216 39 6 – – – – 84Men’s and boys’ clothing, n.e.c. ........ 167 137 85 – – – – – – 93
Women’s and misses’ outerwear ........... 644 389 547 81 35 – – – – 256Women’s and misses’ suits andcoats ................................................. 107 78 18 – – – – – – 48
Women’s and misses’ outerwear,n.e.c. ................................................ 323 208 409 44 18 – – – – 179
Women’s and children’sundergarments ..................................... 128 87 72 19 – – – – – 25Women’s and children’s underwear ... 68 59 31 13 – – – – – 24Bras, girdles, and allied garments ...... 59 28 41 – – – – – – –
Girls’ and children’s outerwear ............... 113 87 86 14 – – – – – 18
See footnotes at end of table.
Page 16

TABLE R4. Number of nonfatal occupational injuries and illnesses involving days away from work1 by industry and selected eventsor exposures leading to injury or illness, 1997 — Continued
Industry2 SICcode3
Totalcases
Event or exposure leading to injury or illness4
Contact with objects
Fallto
lowerlevel
Fallon
samelevel
Slipsor
tripswithout
fallTotal
Struckby
object
Struckagainstobject
Caughtin orcom-
pressedor
crushed
Girls’ and children’s outerwear,n.e.c. ................................................ 2369 257 94 31 45 16 8 20 –
Miscellaneous apparel andaccessories .......................................... 238 657 230 – – 118 – – –
Miscellaneous fabricated textileproducts ................................................ 239 3,588 1,138 346 244 479 142 451 62Housefurnishings, n.e.c. .................... 2392 633 256 77 51 108 – – –Textile bags ........................................ 2393 172 73 – 11 56 – 12 –Canvas and related products ............. 2394 486 89 – – – – 94 –Pleating and stitching ......................... 2395 187 95 29 – 57 – 17 –Automotive and apparel trimmings ..... 2396 879 240 88 – 120 27 120 36Fabricated textile products, n.e.c. ..... 2399 756 253 98 70 79 – 134 –
Paper and allied products ........................... 26 13,468 4,907 1,573 1,265 1,799 571 1,039 415Paper mills .............................................. 262 2,296 741 249 146 282 112 181 151Paperboard mills .................................... 263 769 228 93 59 58 46 67 43Paperboard containers and boxes ......... 265 4,927 1,761 549 457 630 198 460 111
Corrugated and solid fiber boxes ....... 2653 3,000 1,106 330 294 434 176 311 71Fiber cans, drums and similarproducts ............................................ 2655 289 119 19 – – – – –
Folding paperboard boxes .................. 2657 998 325 130 81 92 – 65 –Miscellaneous converted paperproducts ................................................ 267 5,350 2,133 661 596 818 207 323 111Paper coated and laminated,packaging ......................................... 2671 491 217 34 107 77 – – –
Paper coated and laminated, n.e.c. ... 2672 740 279 135 61 77 – 51 11Bags: plastics, laminated, andcoated ............................................... 2673 1,083 500 167 142 182 84 47 11
Die-cut paper and board ..................... 2675 271 73 – – – 41 – –Sanitary paper products ..................... 2676 584 230 65 62 89 10 – 9Envelopes ........................................... 2677 545 204 67 20 99 – – –Converted paper products, n.e.c. ...... 2679 907 368 109 130 129 – 43 –
Printing and publishing ............................... 27 23,994 7,450 2,354 1,773 2,970 741 2,395 531Newspapers ........................................... 271 6,621 1,612 561 479 503 269 1,015 241Periodicals .............................................. 272 994 211 100 43 52 89 107 40Books ..................................................... 273 2,094 532 166 152 187 45 235 13
Book publishing .................................. 2731 929 180 37 86 50 24 172 –Book printing ...................................... 2732 1,166 352 129 66 138 – 63 9
Commercial printing ............................... 275 10,467 3,615 1,014 819 1,577 279 738 205Commercial printing, lithographic ....... 2752 6,741 2,339 707 532 972 221 432 152Commercial printing, gravure ............. 2754 394 159 34 41 79 5 22 8Commercial printing, n.e.c. ................ 2759 3,331 1,118 273 246 527 53 283 45
Manifold business forms ......................... 276 668 280 118 44 115 13 39 –Greeting cards ........................................ 277 171 55 16 13 24 – 15 –Blankbooks and bookbinding ................. 278 1,631 722 265 – 399 – 75 –
Blankbooks and looseleaf binders ...... 2782 456 83 23 14 46 – 27 7Printing trade services ............................ 279 617 187 – 106 63 – – –
Typesetting ......................................... 2791 368 – – – – – – –Platemaking services ......................... 2796 249 100 – – – – – –
Chemicals and allied products ................... 28 11,225 2,912 1,023 795 843 607 1,137 303Industrial inorganic chemicals ................ 281 1,291 304 126 81 74 61 102 46
Alkalies and chlorine .......................... 2812 – 7 – – – 6 – –Inorganic pigments ............................. 2816 221 – – – – – – –Industrial inorganic chemicals,n.e.c. ................................................ 2819 838 189 51 71 45 49 62 37
Plastics materials and synthetics ........... 282 1,230 310 75 116 83 89 98 32Plastics materials and resins .............. 2821 634 134 – 71 – 72 57 14Organic fibers, noncellulosic .............. 2824 174 72 11 14 47 – 15 –
Drugs ...................................................... 283 2,614 706 199 280 206 105 266 47Pharmaceutical preparations .............. 2834 2,074 580 148 256 161 93 216 30
See footnotes at end of table.
Page 17
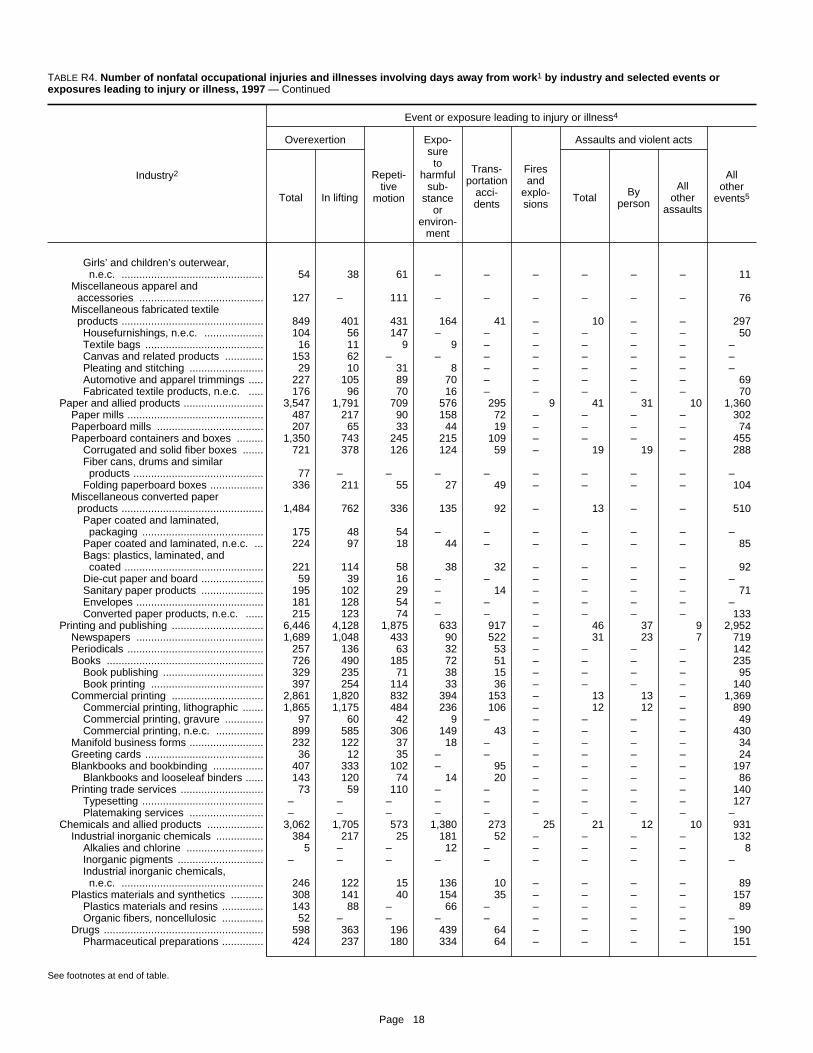
TABLE R4. Number of nonfatal occupational injuries and illnesses involving days away from work1 by industry and selected events orexposures leading to injury or illness, 1997 — Continued
Industry2
Event or exposure leading to injury or illness4
Overexertion
Repeti-tive
motion
Expo-sureto
harmfulsub-
stanceor
environ-ment
Trans-portation
acci-dents
Firesand
explo-sions
Assaults and violent acts
Allother
events5Total In lifting Total Byperson
Allother
assaults
Girls’ and children’s outerwear,n.e.c. ................................................ 54 38 61 – – – – – – 11
Miscellaneous apparel andaccessories .......................................... 127 – 111 – – – – – – 76
Miscellaneous fabricated textileproducts ................................................ 849 401 431 164 41 – 10 – – 297Housefurnishings, n.e.c. .................... 104 56 147 – – – – – – 50Textile bags ........................................ 16 11 9 9 – – – – – –Canvas and related products ............. 153 62 – – – – – – – –Pleating and stitching ......................... 29 10 31 8 – – – – – –Automotive and apparel trimmings ..... 227 105 89 70 – – – – – 69Fabricated textile products, n.e.c. ..... 176 96 70 16 – – – – – 70
Paper and allied products ........................... 3,547 1,791 709 576 295 9 41 31 10 1,360Paper mills .............................................. 487 217 90 158 72 – – – – 302Paperboard mills .................................... 207 65 33 44 19 – – – – 74Paperboard containers and boxes ......... 1,350 743 245 215 109 – – – – 455
Corrugated and solid fiber boxes ....... 721 378 126 124 59 – 19 19 – 288Fiber cans, drums and similarproducts ............................................ 77 – – – – – – – – –
Folding paperboard boxes .................. 336 211 55 27 49 – – – – 104Miscellaneous converted paperproducts ................................................ 1,484 762 336 135 92 – 13 – – 510Paper coated and laminated,
packaging ......................................... 175 48 54 – – – – – – –Paper coated and laminated, n.e.c. ... 224 97 18 44 – – – – – 85Bags: plastics, laminated, andcoated ............................................... 221 114 58 38 32 – – – – 92
Die-cut paper and board ..................... 59 39 16 – – – – – – –Sanitary paper products ..................... 195 102 29 – 14 – – – – 71Envelopes ........................................... 181 128 54 – – – – – – –Converted paper products, n.e.c. ...... 215 123 74 – – – – – – 133
Printing and publishing ............................... 6,446 4,128 1,875 633 917 – 46 37 9 2,952Newspapers ........................................... 1,689 1,048 433 90 522 – 31 23 7 719Periodicals .............................................. 257 136 63 32 53 – – – – 142Books ..................................................... 726 490 185 72 51 – – – – 235
Book publishing .................................. 329 235 71 38 15 – – – – 95Book printing ...................................... 397 254 114 33 36 – – – – 140
Commercial printing ............................... 2,861 1,820 832 394 153 – 13 13 – 1,369Commercial printing, lithographic ....... 1,865 1,175 484 236 106 – 12 12 – 890Commercial printing, gravure ............. 97 60 42 9 – – – – – 49Commercial printing, n.e.c. ................ 899 585 306 149 43 – – – – 430
Manifold business forms ......................... 232 122 37 18 – – – – – 34Greeting cards ........................................ 36 12 35 – – – – – – 24Blankbooks and bookbinding ................. 407 333 102 – 95 – – – – 197
Blankbooks and looseleaf binders ...... 143 120 74 14 20 – – – – 86Printing trade services ............................ 73 59 110 – – – – – – 140
Typesetting ......................................... – – – – – – – – – 127Platemaking services ......................... – – – – – – – – – –
Chemicals and allied products ................... 3,062 1,705 573 1,380 273 25 21 12 10 931Industrial inorganic chemicals ................ 384 217 25 181 52 – – – – 132
Alkalies and chlorine .......................... 5 – – 12 – – – – – 8Inorganic pigments ............................. – – – – – – – – – –Industrial inorganic chemicals,n.e.c. ................................................ 246 122 15 136 10 – – – – 89
Plastics materials and synthetics ........... 308 141 40 154 35 – – – – 157Plastics materials and resins .............. 143 88 – 66 – – – – – 89Organic fibers, noncellulosic .............. 52 – – – – – – – – –
Drugs ...................................................... 598 363 196 439 64 – – – – 190Pharmaceutical preparations .............. 424 237 180 334 64 – – – – 151
See footnotes at end of table.
Page 18

TABLE R4. Number of nonfatal occupational injuries and illnesses involving days away from work1 by industry and selected eventsor exposures leading to injury or illness, 1997 — Continued
Industry2 SICcode3
Totalcases
Event or exposure leading to injury or illness4
Contact with objects
Fallto
lowerlevel
Fallon
samelevel
Slipsor
tripswithout
fallTotal
Struckby
object
Struckagainstobject
Caughtin orcom-
pressedor
crushed
Biological products exceptdiagnostic ......................................... 2836 – – – – 14 – – –
Soap, cleaners, and toilet goods ............ 284 2,333 644 243 149 187 90 332 91Soap and other detergents ................. 2841 621 134 51 – 41 11 100 49Polishes and sanitation goods ............ 2842 364 95 46 22 15 – 27 –Toilet preparations .............................. 2844 1,200 362 116 91 125 55 189 38
Paints and allied products ...................... 285 961 200 99 15 50 50 73 19Industrial organic chemicals ................... 286 905 202 106 20 40 92 85 12
Industrial organic chemicals, n.e.c. ... 2869 616 140 66 20 18 72 60 10Agricultural chemicals ............................ 287 675 248 93 – 106 67 54 –Miscellaneous chemical products ........... 289 1,216 298 82 93 97 55 127 31
Adhesives and sealants ..................... 2891 407 120 – – 63 – – –Printing ink .......................................... 2893 173 47 – 19 17 – – –Chemical preparations, n.e.c. ............ 2899 457 99 39 42 11 – 72 19
Petroleum and coal products ...................... 29 1,909 255 98 70 60 138 338 95Petroleum refining .................................. 291 677 91 35 – 20 63 57 71Asphalt paving and roofing materials ..... 295 800 140 – – – – 59 –
Asphalt paving mixtures and blocks ... 2951 411 96 – – – – – –Miscellaneous petroleum and coalproducts ................................................ 299 431 – – – – – 221 –
Rubber and miscellaneous plasticsproducts .................................................... 30 28,003 9,319 3,642 2,141 2,719 531 1,940 732Tires and inner tubes .............................. 301 2,221 688 228 131 263 16 143 51Rubber and plastics footwear ................. 302 230 66 – – – – – –Hose and belting and gaskets andpacking ................................................. 305 1,594 553 251 90 193 12 105 42Rubber and plastics hose andbelting ............................................... 3052 652 256 90 59 93 – 47 17
Gaskets, packing and sealingdevices ............................................. 3053 943 296 161 32 100 12 57 25
Fabricated rubber products, n.e.c. ........ 306 3,725 1,228 567 176 391 139 193 52Mechanical rubber goods ................... 3061 1,609 446 187 95 147 35 82 –Fabricated rubber products, n.e.c. .... 3069 2,116 782 380 82 244 104 110 –
Miscellaneous plasticsproducts, n.e.c. .................................... 308 20,233 6,784 2,586 1,719 1,851 356 1,495 586Unsupported plastics film and sheet .. 3081 1,722 677 197 160 274 – 98 43Laminated plastics plate and sheet .... 3083 617 233 74 97 56 – 60 –Plastics pipe ....................................... 3084 646 252 123 59 55 – 53 –Plastics bottles ................................... 3085 904 325 149 81 79 – 54 –Plastics foam products ....................... 3086 1,045 481 185 145 88 – 52 –Custom compound purchasedresins ................................................ 3087 537 158 57 43 44 15 55 –
Plastics plumbing fixtures ................... 3088 836 281 204 – – – – –Plastics products, n.e.c. .................... 3089 13,323 4,128 1,485 1,014 1,186 244 1,045 396
Leather and leather products ..................... 31 1,901 638 250 141 225 21 132 53Leather tanning and finishing ................. 311 642 239 139 44 56 – 52 –Footwear, except rubber ........................ 314 737 241 64 53 106 15 40 15
Men’s footwear, except athletic .......... 3143 454 173 48 42 76 – 15 15Women’s footwear, except athletic ..... 3144 137 – – – 10 – 12 –
Luggage ................................................. 316 – – 15 – 15 – – –Handbags and personal leather goods .. 317 79 21 12 7 – – 9 –
Personal leather goods, n.e.c. ........... 3172 59 21 12 7 – – 9 –
Transportation and public utilities7 ............ 220,607 46,132 22,765 12,919 6,203 15,677 20,681 7,324Railroad transportation7 .............................. 40 5,448 1,266 543 378 142 1,283 77 163Local and interurban passenger transit ...... 41 11,379 1,560 597 494 91 476 1,231 461
Local and suburban transportation ......... 411 7,397 912 276 327 47 321 727 353Taxicabs ................................................. 412 425 66 18 39 – 16 26 –Intercity and rural bus transportation ...... 413 671 144 75 26 – 17 101 31
See footnotes at end of table.
Page 19

TABLE R4. Number of nonfatal occupational injuries and illnesses involving days away from work1 by industry and selected events orexposures leading to injury or illness, 1997 — Continued
Industry2
Event or exposure leading to injury or illness4
Overexertion
Repeti-tive
motion
Expo-sureto
harmfulsub-
stanceor
environ-ment
Trans-portation
acci-dents
Firesand
explo-sions
Assaults and violent acts
Allother
events5Total In lifting Total Byperson
Allother
assaults
Biological products exceptdiagnostic ......................................... – – – – – – – – – –
Soap, cleaners, and toilet goods ............ 637 374 171 199 43 – 15 12 – 111Soap and other detergents ................. 228 99 52 34 – – – – – –Polishes and sanitation goods ............ 106 72 43 48 14 – – – – 24Toilet preparations .............................. 266 176 72 104 22 – 12 8 – 81
Paints and allied products ...................... 388 201 31 87 – – – – – 81Industrial organic chemicals ................... 230 110 31 149 23 – – – – 79
Industrial organic chemicals, n.e.c. ... 140 72 27 89 22 – – – – 55Agricultural chemicals ............................ 121 82 – 51 15 – – – – 69Miscellaneous chemical products ........... 396 216 57 121 17 – – – – 113
Adhesives and sealants ..................... 120 71 – – – – – – – –Printing ink .......................................... 65 40 13 – – – – – – –Chemical preparations, n.e.c. ............ 141 74 – 55 – – – – – 42
Petroleum and coal products ...................... 366 166 44 186 195 15 – – – 277Petroleum refining .................................. 110 35 34 95 12 15 – – – 128Asphalt paving and roofing materials ..... 207 108 – – 156 – – – – 126
Asphalt paving mixtures and blocks ... 123 – – – 76 – – – – –Miscellaneous petroleum and coalproducts ................................................ – – – – – – – – – –
Rubber and miscellaneous plasticsproducts .................................................... 8,556 4,393 2,182 1,530 427 142 113 93 20 2,531Tires and inner tubes .............................. 838 374 118 61 53 – 10 – 10 242Rubber and plastics footwear ................. 98 53 – – – – – – – –Hose and belting and gaskets and
packing ................................................. 585 401 120 24 – – – – – 146Rubber and plastics hose and
belting ............................................... 241 175 49 – – – – – – 40Gaskets, packing and sealingdevices ............................................. 345 225 72 23 – – – – – 106
Fabricated rubber products, n.e.c. ........ 1,282 541 358 158 42 12 – – – 261Mechanical rubber goods ................... 608 298 104 80 26 12 – – – 193Fabricated rubber products, n.e.c. .... 674 243 254 77 16 – – – – 68
Miscellaneous plasticsproducts, n.e.c. .................................... 5,752 3,024 1,575 1,277 326 130 103 93 – 1,849Unsupported plastics film and sheet .. 481 197 82 79 – – – – – 204Laminated plastics plate and sheet .... 98 59 65 76 – – – – – 66Plastics pipe ....................................... 196 108 – – – – – – – 62Plastics bottles ................................... 327 132 62 – – – – – – 57Plastics foam products ....................... 227 133 – 41 – – – – – 138Custom compound purchased
resins ................................................ 139 67 30 59 13 – – – – 39Plastics plumbing fixtures ................... 262 110 76 – – – – – – –Plastics products, n.e.c. .................... 3,846 2,098 1,194 910 175 119 91 88 – 1,175
Leather and leather products ..................... 479 202 229 46 9 – – – – 294Leather tanning and finishing ................. 180 41 – 17 – – – – – 95Footwear, except rubber ........................ 190 78 138 20 – – – – – 77
Men’s footwear, except athletic .......... 111 43 72 11 – – – – – 52Women’s footwear, except athletic ..... – – – – – – – – – –
Luggage ................................................. – – 18 – – – – – – –Handbags and personal leather goods .. 10 10 14 – 7 – – – – 15
Personal leather goods, n.e.c. ........... 10 10 7 – – – – – – 9
Transportation and public utilities7 ............ 66,845 37,640 5,152 6,691 20,553 392 1,334 776 559 29,826Railroad transportation7 .............................. 751 – 46 220 645 – 71 70 – 926Local and interurban passenger transit ...... 3,322 2,081 123 400 2,338 38 212 200 12 1,217
Local and suburban transportation ......... 2,689 1,752 59 252 1,241 19 70 64 – 755Taxicabs ................................................. 46 35 – 32 159 14 37 37 – 25Intercity and rural bus transportation ...... 180 129 – 12 82 – 11 11 – 91
See footnotes at end of table.
Page 20

TABLE R4. Number of nonfatal occupational injuries and illnesses involving days away from work1 by industry and selected eventsor exposures leading to injury or illness, 1997 — Continued
Industry2 SICcode3
Totalcases
Event or exposure leading to injury or illness4
Contact with objects
Fallto
lowerlevel
Fallon
samelevel
Slipsor
tripswithout
fallTotal
Struckby
object
Struckagainstobject
Caughtin orcom-
pressedor
crushed
Bus charter service ................................. 414 593 126 90 14 – 33 75 –School buses .......................................... 415 2,232 298 124 87 9 90 302 65
Trucking and warehousing ......................... 42 74,079 14,433 7,633 3,700 1,893 6,530 7,613 1,922Trucking and courier services, exceptair ......................................................... 421 68,944 12,718 6,715 3,318 1,581 6,291 7,330 1,878
Public warehousing and storage ............ 422 4,843 1,524 894 382 144 216 250 45Water transportation ................................... 44 7,107 2,353 1,159 586 361 560 660 367
Freight transportation on the GreatLakes .................................................... 443 114 54 – – – – – –
Water transportation of freight, n.e.c. .... 444 445 130 51 14 64 – – –Water transportation services ................. 449 5,998 2,105 1,075 507 294 511 588 312
Transportation by air .................................. 45 80,041 18,123 9,009 5,168 2,594 2,362 6,715 2,349Air transportation, scheduled .................. 451 75,131 16,594 8,170 4,891 2,438 2,151 6,238 2,251Air transportation, nonscheduled ............ 452 1,296 264 197 – – – 201 –Airports, flying fields, and services ......... 458 3,614 1,266 641 214 155 174 275 –
Transportation services .............................. 47 5,312 1,486 844 273 290 454 610 190Freight transportation arrangement ........ 473 3,372 920 508 175 179 261 386 126Miscellaneous transportation services ... 478 1,406 524 320 86 101 137 150 51
Communications ......................................... 48 19,554 3,015 1,027 1,345 262 2,398 2,164 782Telephone communications ................... 481 13,528 2,167 632 1,095 192 1,440 1,331 468Radio and television broadcasting ......... 483 1,158 168 97 – – 103 210 75Cable and other pay televisionservices ................................................ 484 4,397 668 297 208 64 758 548 237
Communication services, n.e.c. ............ 489 437 – – – – – – –Electric, gas, and sanitary services ............ 49 17,580 3,887 1,953 965 570 1,611 1,610 1,089
Electric services ..................................... 491 4,540 866 439 192 179 572 387 360Gas production and distribution .............. 492 2,933 601 359 164 – 235 342 140Combination utility services .................... 493 1,968 315 125 76 22 153 216 110Sanitary services .................................... 495 6,805 1,747 774 497 306 617 609 294
Wholesale and retail trade ........................... 452,094 125,653 63,218 37,304 16,443 21,327 59,814 15,478
Wholesale trade ........................................... 138,180 37,244 17,653 9,852 6,539 8,172 11,050 4,430Wholesale trade— durable goods .............. 50 70,616 21,639 11,018 5,044 3,601 4,045 5,178 1,878
Motor vehicles, parts, and supplies ........ 501 11,844 3,370 1,574 1,198 281 411 850 302Furniture and homefurnishings ............... 502 2,647 722 253 249 134 – – 448Lumber and construction materials ........ 503 9,115 2,721 1,499 460 497 731 575 213Professional and commercialequipment ............................................. 504 8,591 1,364 592 470 169 597 746 203
Metals and minerals, except petroleum .. 505 5,704 2,815 1,685 604 391 248 415 –Electrical goods ...................................... 506 4,839 1,011 453 267 227 492 469 –Hardware, plumbing and heatingequipment ............................................. 507 5,566 2,482 1,450 387 395 263 272 –
Machinery, equipment, and supplies ...... 508 15,489 5,299 2,558 1,024 1,188 959 1,226 375Miscellaneous durable goods ................. 509 6,821 1,854 953 384 319 283 536 265
Wholesale trade— nondurable goods ........ 51 67,563 15,605 6,635 4,808 2,938 4,127 5,872 2,553Paper and paper products ...................... 511 3,955 754 380 286 85 545 282 –Drugs, proprietaries, and sundries ......... 512 2,322 526 339 97 – 80 263 –Apparel, piece goods, and notions ......... 513 1,665 328 152 104 56 58 146 –Groceries and related products .............. 514 34,708 8,541 3,629 2,531 1,813 1,378 2,932 1,167Farm-product raw materials ................... 515 2,320 689 212 – – 167 278 121Chemicals and allied products ............... 516 2,804 629 – – 289 316 281 593Petroleum and petroleum products ........ 517 2,354 494 285 153 – 96 286 129Beer, wine, and distilled beverages ........ 518 7,049 1,380 697 412 186 688 452 221Miscellaneous nondurable goods ........... 519 10,387 2,265 714 1,115 321 800 950 211
Retail trade ................................................... 313,915 88,409 45,565 27,452 9,904 13,156 48,764 11,048Building materials and garden supplies ...... 52 25,055 7,872 4,564 1,715 1,033 1,972 1,834 550
Lumber and other building materials ...... 521 18,600 6,120 3,550 1,307 804 1,498 1,367 378
See footnotes at end of table.
Page 21

TABLE R4. Number of nonfatal occupational injuries and illnesses involving days away from work1 by industry and selected events orexposures leading to injury or illness, 1997 — Continued
Industry2
Event or exposure leading to injury or illness4
Overexertion
Repeti-tive
motion
Expo-sureto
harmfulsub-
stanceor
environ-ment
Trans-portation
acci-dents
Firesand
explo-sions
Assaults and violent acts
Allother
events5Total In lifting Total Byperson
Allother
assaults
Bus charter service ................................. 127 52 14 – 86 – – – – 95School buses .......................................... 250 83 47 68 770 – 88 82 6 252
Trucking and warehousing ......................... 20,361 10,683 935 1,101 11,583 – 322 261 – 9,274Trucking and courier services, exceptair ......................................................... 19,112 9,947 676 1,033 11,070 – 245 241 – 8,591
Public warehousing and storage ............ 1,232 727 258 59 496 – 77 – 57 683Water transportation ................................... 1,274 466 73 157 654 63 – – – 944
Freight transportation on the GreatLakes .................................................... – – – – – – – – – –
Water transportation of freight, n.e.c. .... 144 – 13 16 – – – – – 71Water transportation services ................. 937 354 51 108 512 63 – – – 809
Transportation by air .................................. 32,300 19,989 1,550 2,966 2,911 160 334 122 212 10,271Air transportation, scheduled .................. 30,946 19,170 1,514 2,782 2,472 – 326 115 212 9,858Air transportation, nonscheduled ............ 413 310 – 80 81 – – – – 140Airports, flying fields, and services ......... 942 509 – 104 358 158 – – – 273
Transportation services .............................. 1,242 709 165 171 395 – 24 16 – 567Freight transportation arrangement ........ 899 487 81 19 313 – – 14 – 338Miscellaneous transportation services ... 250 139 13 107 47 – – – – 126
Communications ......................................... 3,502 1,685 1,688 831 1,114 – 193 85 108 3,857Telephone communications ................... 2,521 1,200 1,389 560 652 – 141 70 71 2,856Radio and television broadcasting ......... 220 124 90 – 97 – – 13 – 133Cable and other pay televisionservices ................................................ 696 331 209 234 365 – 32 – 30 650
Communication services, n.e.c. ............ – – – – – – – – – –Electric, gas, and sanitary services ............ 4,073 2,016 566 839 889 108 176 18 158 2,732
Electric services ..................................... 995 380 143 232 174 13 39 – 34 760Gas production and distribution .............. 569 154 126 232 211 71 18 – 16 388Combination utility services .................... 476 198 145 98 86 9 23 – 16 337Sanitary services .................................... 1,818 1,134 137 206 407 – – – – 947
Wholesale and retail trade ........................... 121,267 81,254 13,478 21,546 17,770 1,196 4,212 3,379 833 50,352
Wholesale trade ........................................... 43,366 28,476 4,391 3,959 8,007 186 835 454 381 16,541Wholesale trade— durable goods .............. 20,492 13,097 2,487 2,175 4,034 143 306 131 175 8,241
Motor vehicles, parts, and supplies ........ 3,825 2,500 265 335 1,390 – – – – 1,065Furniture and homefurnishings ............... 673 384 – – – – – – – 485Lumber and construction materials ........ 2,933 1,637 180 317 252 – – – – 1,111Professional and commercial
equipment ............................................. 2,491 1,465 481 214 1,109 – 81 74 – 1,307Metals and minerals, except petroleum .. 1,173 687 82 – 249 – – – – 595Electrical goods ...................................... 1,401 938 591 217 224 – – – – 408Hardware, plumbing and heatingequipment ............................................. 1,626 1,302 196 – – – – – – 544
Machinery, equipment, and supplies ...... 4,307 2,754 363 716 314 – – – – 1,877Miscellaneous durable goods ................. 2,063 1,431 302 199 357 79 – – – 849
Wholesale trade— nondurable goods ........ 22,874 15,379 1,904 1,784 3,973 – 529 323 206 8,301Paper and paper products ...................... 1,329 1,089 100 – 258 – – – – 558Drugs, proprietaries, and sundries ......... 833 545 110 123 69 – – – – 269Apparel, piece goods, and notions ......... 418 309 131 – 241 – – – – 307Groceries and related products .............. 12,470 8,261 923 597 2,176 – 250 174 – 4,276Farm-product raw materials ................... 528 259 – – 143 – – – – 245Chemicals and allied products ............... 257 – – 382 – – – – – –Petroleum and petroleum products ........ 739 335 86 131 162 – – – – 201Beer, wine, and distilled beverages ........ 3,029 1,975 170 53 282 – 62 43 19 713Miscellaneous nondurable goods ........... 3,274 2,425 325 385 505 – 100 73 – 1,557
Retail trade ................................................... 77,902 52,778 9,087 17,587 9,763 1,011 3,377 2,925 452 33,811Building materials and garden supplies ...... 8,330 5,792 549 530 849 – 110 67 – 2,444
Lumber and other building materials ...... 6,460 4,526 168 205 554 – 87 – – 1,763
See footnotes at end of table.
Page 22

TABLE R4. Number of nonfatal occupational injuries and illnesses involving days away from work1 by industry and selected eventsor exposures leading to injury or illness, 1997 — Continued
Industry2 SICcode3
Totalcases
Event or exposure leading to injury or illness4
Contact with objects
Fallto
lowerlevel
Fallon
samelevel
Slipsor
tripswithout
fallTotal
Struckby
object
Struckagainstobject
Caughtin orcom-
pressedor
crushed
Paint, glass, and wallpaper stores .......... 523 1,296 362 258 – – 146 – –Hardware stores ..................................... 525 2,313 738 282 252 172 56 98 109Retail nurseries and garden stores ........ 526 1,886 474 350 – – 134 125 –Mobile home dealers .............................. 527 960 – – – – – – –
General merchandise stores ...................... 53 51,237 15,434 9,687 4,002 1,204 2,525 6,574 1,329Department stores .................................. 531 46,507 13,883 8,672 3,726 1,112 2,177 6,177 1,241Variety stores ......................................... 533 2,326 871 641 141 – 77 245 81Miscellaneous general merchandisestores .................................................... 539 2,404 680 373 136 52 271 151 –
Food stores ................................................ 54 69,039 20,877 9,470 7,001 3,860 1,451 7,887 2,381Grocery stores ........................................ 541 65,648 19,740 8,775 6,774 3,714 1,306 7,533 2,186Fruit and vegetable markets ................... 543 397 114 63 34 13 53 28 –Dairy products stores ............................. 545 127 – – – – – – –Retail bakeries ........................................ 546 1,104 286 78 126 77 – 135 85Miscellaneous food stores ...................... 549 987 474 413 – – – – –
Automotive dealers and service stations .... 55 38,992 12,138 5,640 3,328 1,305 1,224 4,876 1,409New and used car dealers ...................... 551 18,949 6,565 2,638 2,162 599 499 2,139 713Used car dealers .................................... 552 444 148 114 – – – – –Auto and home supply stores ................. 553 9,664 3,205 1,933 395 422 282 742 134Gasoline service stations ....................... 554 8,130 1,781 731 602 238 329 1,758 520Boat dealers ........................................... 555 568 106 – – – – – –Recreational vehicle dealers .................. 556 317 98 48 – – 61 43 –Motorcycle dealers ................................. 557 511 – – – – – – –
Apparel and accessory stores .................... 56 7,597 2,062 1,344 486 169 760 1,213 184Men’s and boys’ clothing stores ............. 561 316 – – – – – 115 –Women’s clothing stores ........................ 562 1,378 454 379 28 – 60 219 14Family clothing stores ............................. 565 3,521 894 587 176 88 213 598 124
Furniture and homefurnishings stores ........ 57 14,051 3,875 2,162 1,086 364 752 1,050 328Furniture and homefurnishings stores .... 571 9,794 2,907 1,785 689 238 559 670 229Household appliance stores ................... 572 1,437 281 105 168 – – 132 –Radio, television, and computer stores .. 573 2,819 687 273 230 123 169 247 69
Eating and drinking places ......................... 58 80,524 20,301 9,232 8,280 1,457 3,111 21,329 3,952Miscellaneous retail .................................... 59 27,420 5,850 3,466 1,555 513 1,362 4,001 915
Drug stores and proprietary stores ......... 591 4,156 799 584 136 – 158 496 124Liquor stores ........................................... 592 378 149 88 – – – – –Used merchandise stores ....................... 593 2,230 365 252 – – – 436 154Miscellaneous shopping goods stores ... 594 7,756 2,173 1,377 523 219 427 864 175Nonstore retailers ................................... 596 5,272 848 450 230 127 206 867 99Fuel dealers ............................................ 598 3,373 507 158 232 – 159 631 224Retail stores, n.e.c. ................................ 599 4,255 1,008 557 350 – 344 685 137
Finance, insurance, and real estate ............ 42,699 7,639 4,188 2,153 663 3,236 6,719 1,648Depository institutions ................................ 60 8,384 1,391 564 674 119 725 1,632 460
Central reserve depositories .................. 601 226 59 15 31 12 5 22 10Commercial banks .................................. 602 5,900 1,107 427 548 101 426 1,186 210Savings institutions ................................. 603 1,305 – – – – 208 285 161Credit unions .......................................... 606 708 109 – – – – – –
Nondepository institutions .......................... 61 1,816 115 – – – 424 347 66Business credit institutions ..................... 615 327 38 17 21 – – 104 54Mortgage bankers and brokers .............. 616 891 – – – – – – –
Security and commodity brokers ................ 62 947 148 – – 15 – – 13Insurance carriers ....................................... 63 7,453 541 302 150 51 623 1,282 277
Life insurance ......................................... 631 2,176 150 91 36 10 110 376 159Medical service and health insurance .... 632 1,749 167 89 46 24 143 360 34Fire, marine, and casualty insurance ..... 633 2,914 210 121 64 – 128 482 77Title insurance ........................................ 636 172 – – – – – – –
Insurance agents, brokers, and service ..... 64 2,299 139 101 – – – 778 –Real estate ................................................. 65 20,949 5,064 3,005 1,147 420 1,300 2,487 777
Real estate operators and lessors .......... 651 10,489 2,093 1,001 669 234 584 1,539 364
See footnotes at end of table.
Page 23

TABLE R4. Number of nonfatal occupational injuries and illnesses involving days away from work1 by industry and selected events orexposures leading to injury or illness, 1997 — Continued
Industry2
Event or exposure leading to injury or illness4
Overexertion
Repeti-tive
motion
Expo-sureto
harmfulsub-
stanceor
environ-ment
Trans-portation
acci-dents
Firesand
explo-sions
Assaults and violent acts
Allother
events5Total In lifting Total Byperson
Allother
assaults
Paint, glass, and wallpaper stores .......... 490 451 – – – – – – – 152Hardware stores ..................................... 603 401 298 187 – – – – – 187Retail nurseries and garden stores ........ 486 181 83 121 95 – – – – 297Mobile home dealers .............................. – – – – – – – – – –
General merchandise stores ...................... 16,014 10,666 1,172 1,190 980 – 600 511 89 5,395Department stores .................................. 14,283 9,424 1,119 1,078 908 – 597 509 89 5,022Variety stores ......................................... 739 584 – 88 – – – – – 145Miscellaneous general merchandisestores .................................................... 992 658 – – – – – – – 228
Food stores ................................................ 19,932 13,940 2,772 2,206 1,612 – 809 797 – 9,091Grocery stores ........................................ 19,226 13,427 2,620 1,941 1,525 – 763 752 – 8,792Fruit and vegetable markets ................... 40 20 – – 26 – – – – 81Dairy products stores ............................. – – – – – – – – – –Retail bakeries ........................................ 239 102 – 152 – – – – – –Miscellaneous food stores ...................... 119 – – – – – – – – 124
Automotive dealers and service stations .... 8,682 5,336 427 2,039 2,835 542 320 306 – 4,501New and used car dealers ...................... 3,874 2,144 207 921 1,571 100 81 – – 2,281Used car dealers .................................... – – – – – – – – – –Auto and home supply stores ................. 2,758 1,894 55 320 631 300 – – – 1,192Gasoline service stations ....................... 1,676 1,051 138 701 228 – 193 188 – 777Boat dealers ........................................... 94 – – – – 99 – – – 117Recreational vehicle dealers .................. 48 40 – – – – – – – 42Motorcycle dealers ................................. – – – – – – – – – –
Apparel and accessory stores .................... 1,884 1,310 168 95 130 – 85 78 – 1,015Men’s and boys’ clothing stores ............. – – – – – – – – – –Women’s clothing stores ........................ 390 315 17 13 19 – – – – 167Family clothing stores ............................. 950 618 62 78 40 – 56 49 – 505
Furniture and homefurnishings stores ........ 5,299 3,367 206 278 802 – 165 130 – 1,295Furniture and homefurnishings stores .... 3,648 2,359 106 151 556 – 75 – – 892Household appliance stores ................... 608 333 82 89 88 – – – – 76Radio, television, and computer stores .. 1,043 675 17 39 159 – 62 60 – 327
Eating and drinking places ......................... 10,242 7,516 2,689 9,952 976 318 803 755 – 6,852Miscellaneous retail .................................... 7,519 4,851 1,105 1,297 1,580 89 484 280 205 3,219
Drug stores and proprietary stores ......... 1,323 960 222 225 130 – 94 94 – 585Liquor stores ........................................... 96 92 – – – – – – – –Used merchandise stores ....................... 641 379 – 134 237 – – – – 171Miscellaneous shopping goods stores ... 2,529 1,636 206 221 171 67 – – – 892Nonstore retailers ................................... 1,499 945 461 183 328 – – – – 773Fuel dealers ............................................ 518 244 133 263 433 – 169 131 – 335Retail stores, n.e.c. ................................ 912 595 – 241 278 – 171 – 164 407
Finance, insurance, and real estate ............ 9,498 6,070 4,356 1,747 2,239 108 376 324 51 5,133Depository institutions ................................ 1,467 1,070 957 367 471 – 147 134 13 766
Central reserve depositories .................. 41 22 33 10 – – – – – 41Commercial banks .................................. 1,050 761 687 341 263 – 84 78 – 545Savings institutions ................................. 177 157 94 – 192 – – – – 114Credit unions .......................................... 161 93 117 – – – – – – –
Nondepository institutions .......................... 158 85 361 91 101 – – – – 146Business credit institutions ..................... 26 20 61 16 – – – – – 22Mortgage bankers and brokers .............. – – – – – – – – – –
Security and commodity brokers ................ 181 157 178 – – – – – – –Insurance carriers ....................................... 1,017 739 1,878 298 470 10 – – – 1,051
Life insurance ......................................... 308 200 593 35 181 – – – – 261Medical service and health insurance .... 250 211 448 59 45 – – – – 240Fire, marine, and casualty insurance ..... 427 321 730 192 210 – – – – 457Title insurance ........................................ – – – – – – – – – –
Insurance agents, brokers, and service ..... 287 190 335 – 199 – – – – 419Real estate ................................................. 6,248 3,764 578 857 797 97 208 172 – 2,537
Real estate operators and lessors .......... 3,747 2,542 296 423 348 – 104 90 – 972
See footnotes at end of table.
Page 24

TABLE R4. Number of nonfatal occupational injuries and illnesses involving days away from work1 by industry and selected eventsor exposures leading to injury or illness, 1997 — Continued
Industry2 SICcode3
Totalcases
Event or exposure leading to injury or illness4
Contact with objects
Fallto
lowerlevel
Fallon
samelevel
Slipsor
tripswithout
fallTotal
Struckby
object
Struckagainstobject
Caughtin orcom-
pressedor
crushed
Real estate agents and managers ......... 653 7,982 2,072 1,362 358 131 594 829 388Subdividers and developers ................... 655 2,432 891 634 119 – 122 119 –
Services ......................................................... 423,449 75,489 38,538 21,472 8,036 18,109 58,900 14,657Hotels and other lodging places ................. 70 31,601 8,288 4,658 2,352 586 1,452 6,441 1,026
Hotels and motels ................................... 701 31,162 8,199 4,598 2,343 586 1,332 6,385 1,025Personal services ....................................... 72 11,345 2,474 1,246 651 441 565 975 483
Laundry, cleaning, and garmentservices ................................................ 721 8,127 1,644 791 415 319 353 542 391
Photographic studios, portrait ................. 722 569 – – – – – 104 –Beauty shops .......................................... 723 1,481 432 376 – – – 272 –Funeral service and crematories ............ 726 335 143 – 99 – – – –
Business services ....................................... 73 59,267 13,842 6,607 3,481 1,814 4,431 8,128 2,269Mailing, reproduction, stenographic ....... 733 1,573 474 118 – 284 – 238 –Services to buildings .............................. 734 16,578 3,317 1,434 1,016 354 1,806 2,468 503Miscellaneous equipment rental andleasing .................................................. 735 5,287 1,301 794 – – 489 806 –
Personnel supply services ...................... 736 9,282 3,676 2,359 455 334 276 641 133Computer and data processingservices ................................................ 737 3,001 581 166 346 62 100 564 89
Miscellaneous business services ........... 738 20,853 3,963 1,587 968 626 1,428 3,124 1,127Auto repair, services, and parking .............. 75 21,895 7,314 3,838 1,282 567 1,216 2,286 1,259
Automotive rentals, no drivers ................ 751 3,946 764 375 271 61 302 448 189Automotive services, except repair ........ 754 4,047 1,092 497 345 156 411 689 97
Miscellaneous repair services .................... 76 7,412 2,450 1,277 558 359 596 683 140Electrical repair shops ............................ 762 2,241 532 187 254 34 339 252 –Reupholstery and furniture repair ........... 764 194 – – – – – – –Miscellaneous repair shops .................... 769 4,954 1,819 1,028 268 326 257 364 111
Motion pictures ........................................... 78 2,551 575 340 79 110 118 448 –Motion picture production and services .. 781 1,561 416 237 55 79 118 159 –Motion picture theaters ........................... 783 523 – – – – – 279 –Video tape rental .................................... 784 276 103 – – – – – –
Amusement and recreation services .......... 79 19,748 4,544 2,218 1,429 594 1,124 2,414 976Producers, orchestras, entertainers ....... 792 1,426 304 71 65 161 157 91 40Bowling centers ...................................... 793 560 266 95 – 153 – 65 –Miscellaneous amusement, recreationservices ................................................ 799 14,317 3,145 1,491 1,127 264 766 1,859 837
Health services ........................................... 80 194,740 22,709 11,629 7,521 2,240 3,873 25,563 5,747Offices and clinics of medical doctors .... 801 6,015 684 449 126 – 177 940 89Offices and clinics of dentists ................. 802 1,285 – – – – – – –Offices of other health practitioners ........ 804 2,028 – – – – 340 474 –Nursing and personal care facilities ....... 805 72,601 7,704 4,211 2,302 895 653 9,731 2,128Hospitals ................................................. 806 90,000 12,116 5,893 4,198 1,248 1,653 11,035 2,700Medical and dental laboratories ............. 807 2,100 414 181 137 – 141 252 68Home health care services ..................... 808 16,289 909 383 423 – 703 2,230 618Health and allied services, n.e.c. ........... 809 4,372 386 185 175 – 150 792 65
Legal services ............................................ 81 2,199 264 131 52 71 168 324 68Educational services .................................. 82 10,242 2,196 1,068 700 270 680 1,554 379
Elementary and secondary schools ....... 821 3,103 717 421 125 154 144 323 97Colleges and universities ....................... 822 6,042 1,256 605 429 99 451 1,092 265Libraries .................................................. 823 141 41 – – – 31 12 –Vocational schools ................................. 824 331 – – – – – – –Schools and educational services,n.e.c. .................................................... 829 626 182 – – – – – –
Social services ........................................... 83 38,642 5,912 3,197 1,837 610 2,222 6,835 1,321Individual and family services ................. 832 7,530 1,131 508 266 272 638 1,172 266Job training and related services ............ 833 5,688 1,231 627 472 61 200 884 115Child day care services .......................... 835 3,550 530 300 200 – 416 951 186Residential care ...................................... 836 19,876 2,691 1,669 712 226 837 3,358 715
See footnotes at end of table.
Page 25

TABLE R4. Number of nonfatal occupational injuries and illnesses involving days away from work1 by industry and selected events orexposures leading to injury or illness, 1997 — Continued
Industry2
Event or exposure leading to injury or illness4
Overexertion
Repeti-tive
motion
Expo-sureto
harmfulsub-
stanceor
environ-ment
Trans-portation
acci-dents
Firesand
explo-sions
Assaults and violent acts
Allother
events5Total In lifting Total Byperson
Allother
assaults
Real estate agents and managers ......... 1,766 960 242 372 302 78 91 75 – 1,249Subdividers and developers ................... 732 260 – 62 147 – – – – 315
Services ......................................................... 137,469 76,787 12,652 18,885 17,241 568 17,167 15,960 1,207 52,314Hotels and other lodging places ................. 6,390 3,746 888 2,086 234 130 215 196 – 4,451
Hotels and motels ................................... 6,342 3,721 888 2,086 196 73 203 192 – 4,433Personal services ....................................... 2,601 1,234 1,548 717 598 – 43 31 – 1,341
Laundry, cleaning, and garmentservices ................................................ 2,171 912 860 578 432 – 29 19 11 1,127
Photographic studios, portrait ................. 192 126 – – – – – – – –Beauty shops .......................................... 78 71 391 99 – – – – – –Funeral service and crematories ............ 93 83 – – – – – – – –
Business services ....................................... 14,005 8,762 1,609 1,735 4,026 – 839 821 – 8,377Mailing, reproduction, stenographic ....... 282 230 139 – 251 – – – – 114Services to buildings .............................. 4,979 3,100 142 279 950 – – – – 2,098Miscellaneous equipment rental andleasing .................................................. 931 478 – 583 – – – – – 626
Personnel supply services ...................... 2,579 1,632 158 155 350 – – – – 1,268Computer and data processingservices ................................................ 635 539 432 116 131 – – – – 350
Miscellaneous business services ........... 4,013 2,416 633 541 1,991 – 704 687 – 3,329Auto repair, services, and parking .............. 3,962 1,852 294 806 2,147 136 – – – 2,400
Automotive rentals, no drivers ................ 754 425 120 182 704 – – 15 – 459Automotive services, except repair ........ 540 119 – 252 385 – – – – 497
Miscellaneous repair services .................... 1,676 958 180 410 274 – 16 – – 965Electrical repair shops ............................ 547 346 42 114 134 – – – – 238Reupholstery and furniture repair ........... – – – – – – – – – –Miscellaneous repair shops .................... 1,081 575 138 295 140 15 – – – 727
Motion pictures ........................................... 666 289 123 128 55 – – – – 403Motion picture production and services .. 514 264 – – – – – – – 262Motion picture theaters ........................... – – – – – – – – – –Video tape rental .................................... – – – – – – – – – –
Amusement and recreation services .......... 3,675 2,151 643 1,098 609 57 227 68 159 4,379Producers, orchestras, entertainers ....... 215 153 85 – – – – – – 508Bowling centers ...................................... – – – – – – – – – –Miscellaneous amusement, recreationservices ................................................ 2,703 1,772 377 974 548 57 158 53 105 2,893
Health services ........................................... 85,740 47,593 4,141 8,924 5,689 161 11,883 11,501 383 20,310Offices and clinics of medical doctors .... 1,531 1,150 717 463 243 – 143 143 – 1,028Offices and clinics of dentists ................. – – – – – – – – – –Offices of other health practitioners ........ 581 308 – – – – – – – –Nursing and personal care facilities ....... 37,512 21,240 714 2,627 483 – 4,783 4,744 – 6,170Hospitals ................................................. 38,492 20,573 2,122 4,501 1,444 56 5,585 5,385 200 10,296Medical and dental laboratories ............. 337 263 122 103 302 – – – – 327Home health care services ..................... 6,411 3,525 200 317 2,630 – 485 353 131 1,776Health and allied services, n.e.c. ........... 832 496 71 340 440 – 754 749 – 541
Legal services ............................................ 437 230 542 – 80 – – – – 268Educational services .................................. 2,784 1,607 383 470 324 – 181 169 12 1,290
Elementary and secondary schools ....... 1,093 634 – 98 – – 128 128 – 395Colleges and universities ....................... 1,409 741 274 304 184 – 45 33 12 759Libraries .................................................. 15 – – – – – – – – 34Vocational schools ................................. – – – – – – – – – –Schools and educational services,n.e.c. .................................................... 160 150 – – – – – – – –
Social services ........................................... 10,685 5,271 491 1,459 1,895 – 2,999 2,928 71 4,797Individual and family services ................. 2,223 1,212 54 179 787 – 434 388 46 642Job training and related services ............ 1,474 819 174 205 314 – 339 339 – 742Child day care services .......................... 554 336 78 151 145 – – – – 483Residential care ...................................... 6,060 2,678 144 849 527 – 2,123 2,116 – 2,560
See footnotes at end of table.
Page 26

TABLE R4. Number of nonfatal occupational injuries and illnesses involving days away from work1 by industry and selected eventsor exposures leading to injury or illness, 1997 — Continued
Industry2 SICcode3
Totalcases
Event or exposure leading to injury or illness4
Contact with objects
Fallto
lowerlevel
Fallon
samelevel
Slipsor
tripswithout
fallTotal
Struckby
object
Struckagainstobject
Caughtin orcom-
pressedor
crushed
Social services, n.e.c. ............................ 839 1,998 329 92 188 – 130 470 –Museums, botanical, zoological gardens ... 84 1,494 427 155 182 42 64 172 184
Museums and art galleries ..................... 841 689 189 73 81 15 54 75 41Botanical and zoological gardens ........... 842 805 238 82 100 – – 97 143
Membership organizations ......................... 86 7,319 1,383 640 383 99 506 1,297 197Business associations ............................ 861 876 – – – – – – –Civic and social associations .................. 864 4,427 1,046 461 281 82 287 895 155Religious organizations .......................... 866 659 85 53 – – 52 140 –Membership organizations, n.e.c. ......... 869 602 124 50 63 – – 66 –
Engineering and management services ..... 87 14,683 3,036 1,532 905 231 1,032 1,685 597Engineering and architectural services .. 871 5,079 1,167 499 405 – 562 510 177Accounting, auditing, and bookkeeping .. 872 943 105 50 49 – 86 136 85Research and testing services ............... 873 3,450 686 309 203 134 168 438 124Management and public relations .......... 874 5,211 1,078 675 248 39 216 601 210
See footnotes at end of table.
Page 27

TABLE R4. Number of nonfatal occupational injuries and illnesses involving days away from work1 by industry and selected events orexposures leading to injury or illness, 1997 — Continued
Industry2
Event or exposure leading to injury or illness4
Overexertion
Repeti-tive
motion
Expo-sureto
harmfulsub-
stanceor
environ-ment
Trans-portation
acci-dents
Firesand
explo-sions
Assaults and violent acts
Allother
events5Total In lifting Total Byperson
Allother
assaults
Social services, n.e.c. ............................ 373 227 – 75 122 – 50 – – 369Museums, botanical, zoological gardens ... 348 172 41 46 14 – 53 – 53 144
Museums and art galleries ..................... 146 94 41 29 12 – 34 – 34 67Botanical and zoological gardens ........... 202 78 – – – – 19 – 19 78
Membership organizations ......................... 1,294 712 562 305 218 – 317 101 216 1,237Business associations ............................ – – – – – – – – – –Civic and social associations .................. 779 415 160 262 125 – 98 75 – 618Religious organizations .......................... 226 112 – – – – – – – 99Membership organizations, n.e.c. ......... 87 58 19 – – – 184 – 184 67
Engineering and management services ..... 3,185 2,190 1,207 660 1,077 17 295 71 224 1,893Engineering and architectural services .. 919 733 192 265 420 – 94 – 89 774Accounting, auditing, and bookkeeping .. 168 95 82 38 111 – 11 – – 121Research and testing services ............... 792 543 282 213 214 – 77 22 54 453Management and public relations .......... 1,307 819 651 145 332 – 114 – 77 545
1 Days-away-from-work cases include those which result in days away fromwork with or without restricted work activity.
2 Totals include data for industries not shown separately.3 Standard Industrial Classification Manual, 1987 Edition. 4 Data shown in columns correspond to the following Event codes: Contact
with objects, Total = 00-09; Struck by object = 020-029; Struck against object =010-019; Caught in or compressed or crushed = 030-049; Fall to lower level =110-119; Fall on same level = 130-139; Slips or trips without fall = 215;Overexertion, Total = 220-229; In lifting = 221; Repetitive motion = 230-239;Exposure to harmful substance or environment = 30-39; Transportation accidents= 40-49; Fires and explosions = 50-52; Assaults and violent acts, Total = 60-63; Byperson = 61; All other assaults = 60, 62, and 63; All other events = all remainingcodes, including 9999 (Nonclassifiable). These codes are based on the 1992Occupational Injury and Illness Classification System developed by the Bureau of
Labor Statistics.5 Includes nonclassifiable responses. 6 Excludes farms with fewer than 11 employees.7 Data conforming to OSHA definitions for mining operators in coal, metal, and
nonmetal mining and for employers in railroad transportation are provided to BLSby the Mine Safety and Health Administration, U.S. Department of Labor; and bythe Federal Railroad Administration, U.S. Department of Transportation. Independent mining contractors are excluded from the coal, metal, and nonmetalindustries.
NOTE: Dashes indicate data that are not available. Because of rounding, datamay not sum to totals. n.e.c. = not elsewhere classified.
SOURCE: Bureau of Labor Statistics, U.S. Department of Labor
Page 28