Embed Size (px)
Citation preview
Energy Transformations(for the world and at Stanford)
Lynn Orr
Woods and Precourt InstitutesAffiliates Meeting
September 12, 2008
Observations
• Energy is an essential component of modern societies, strongly linked to agriculture and food production, communications, transportation, …
• Energy is a primary way humans interact with global systems.
• We humans mostly take both the natural systems and their services as well as the availability of energy supplies completely for granted.
• It’s time to do better!
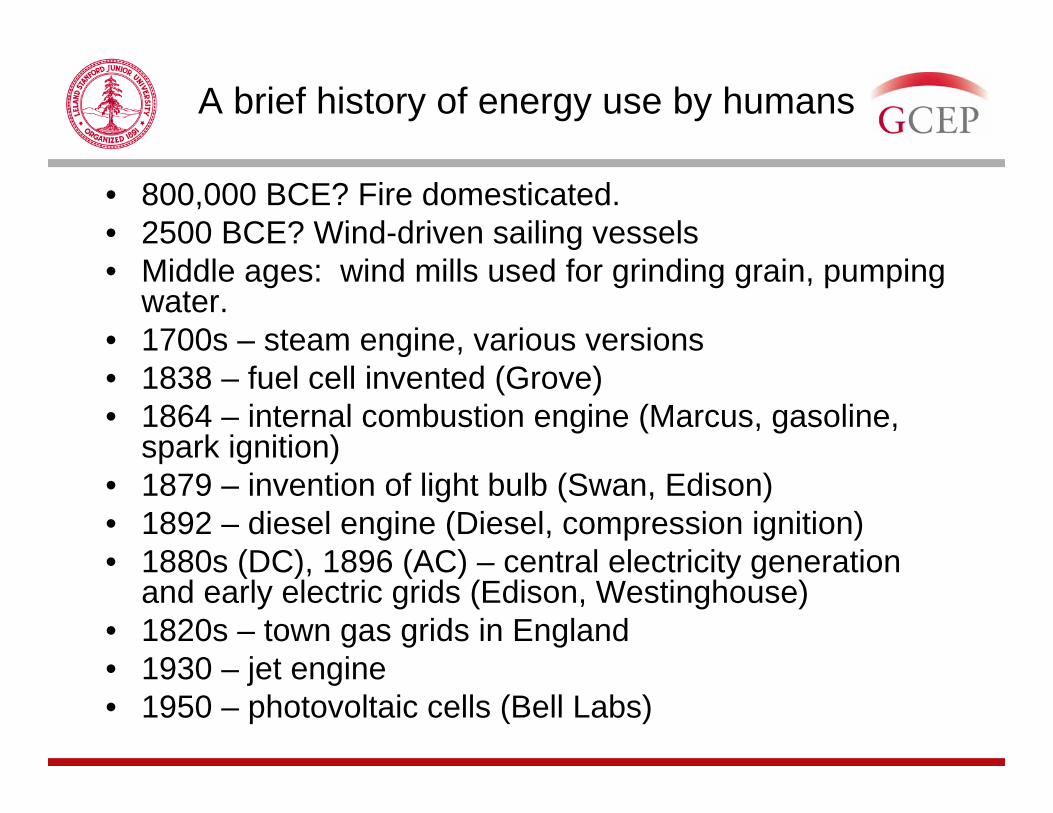
A brief history of energy use by humans
• 800,000 BCE? Fire domesticated.• 2500 BCE? Wind-driven sailing vessels• Middle ages: wind mills used for grinding grain, pumping
water.• 1700s – steam engine, various versions• 1838 – fuel cell invented (Grove)• 1864 – internal combustion engine (Marcus, gasoline,
spark ignition)• 1879 – invention of light bulb (Swan, Edison)• 1892 – diesel engine (Diesel, compression ignition)• 1880s (DC), 1896 (AC) – central electricity generation
and early electric grids (Edison, Westinghouse)• 1820s – town gas grids in England• 1930 – jet engine• 1950 – photovoltaic cells (Bell Labs)
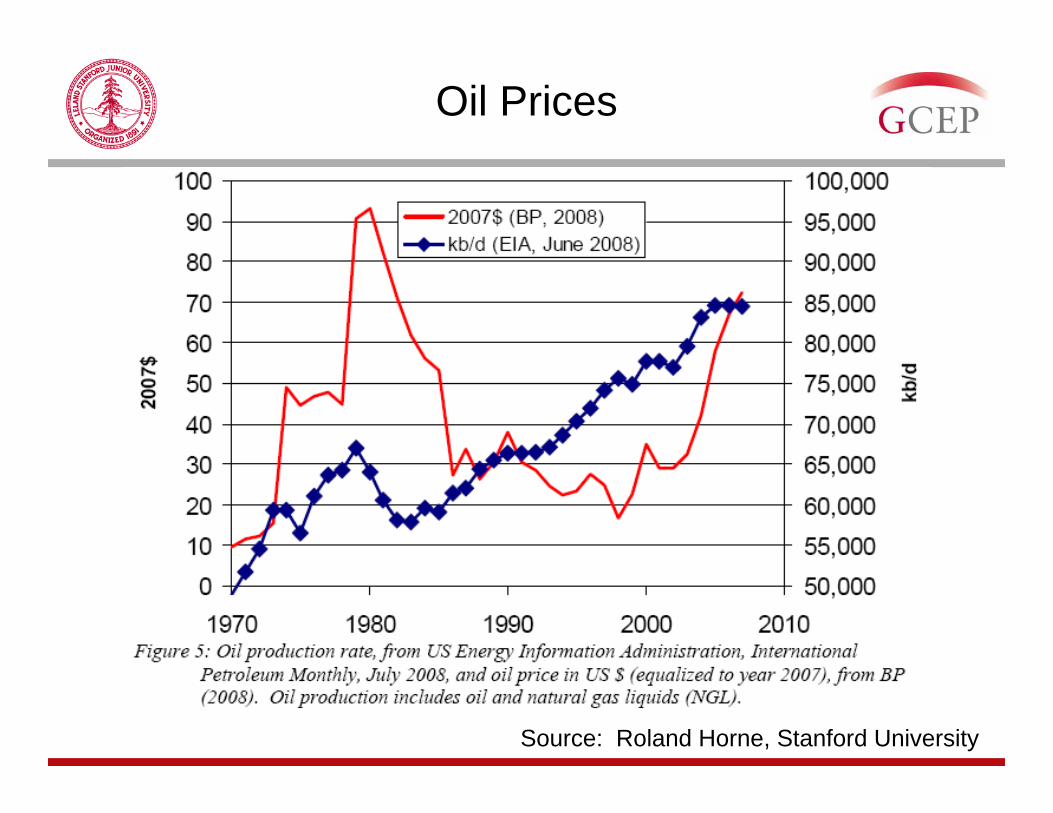
Oil Prices
Source: Roland Horne, Stanford University
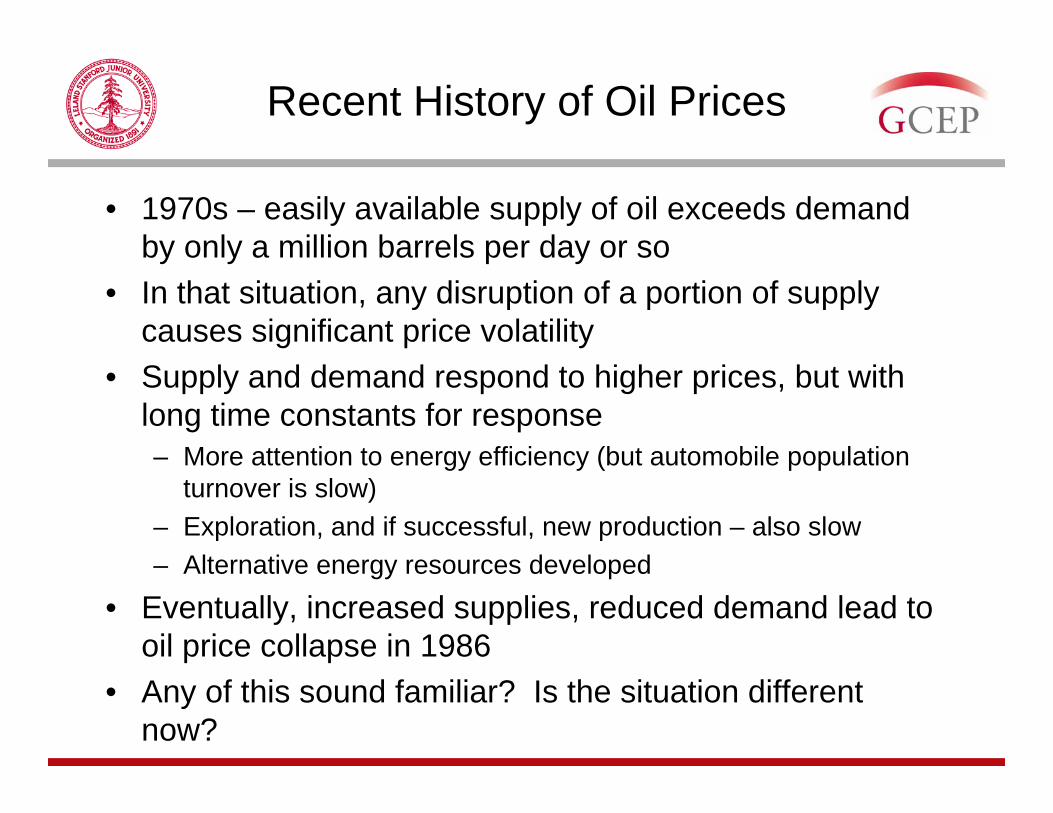
Recent History of Oil Prices
• 1970s – easily available supply of oil exceeds demand by only a million barrels per day or so
• In that situation, any disruption of a portion of supply causes significant price volatility
• Supply and demand respond to higher prices, but with long time constants for response– More attention to energy efficiency (but automobile population
turnover is slow)– Exploration, and if successful, new production – also slow– Alternative energy resources developed
• Eventually, increased supplies, reduced demand lead to oil price collapse in 1986
• Any of this sound familiar? Is the situation different now?
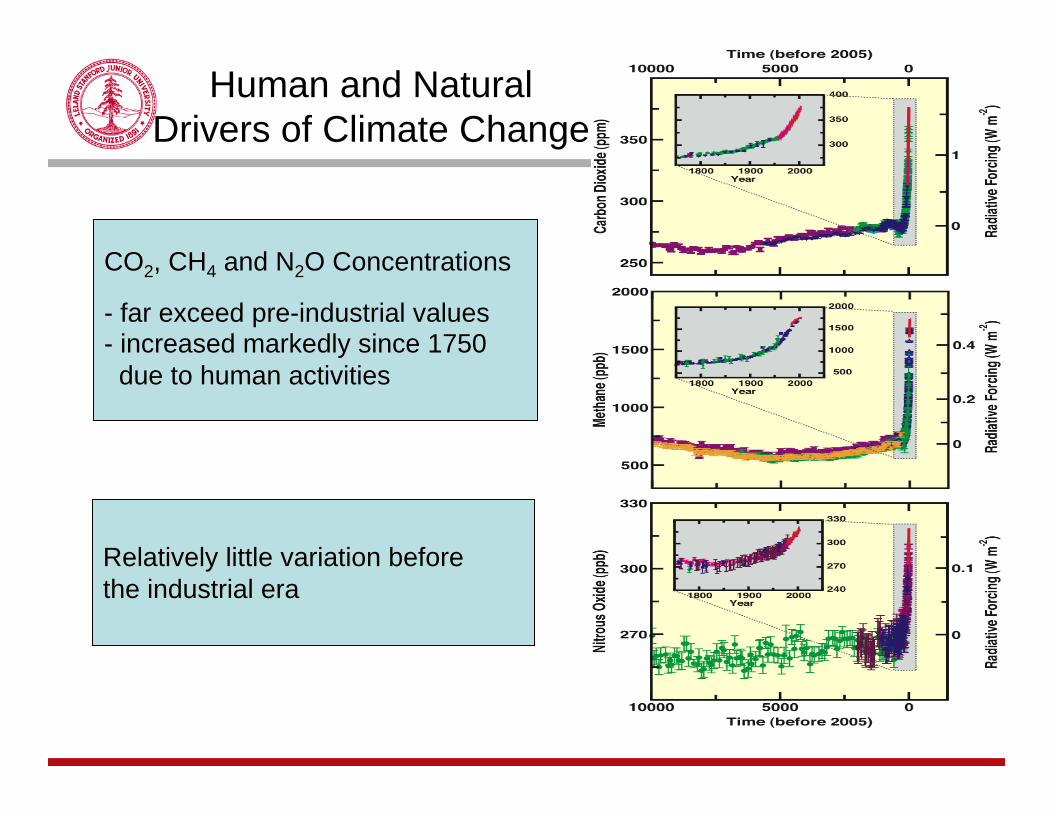
CO2, CH4 and N2O Concentrations
- far exceed pre-industrial values- increased markedly since 1750due to human activities
Relatively little variation beforethe industrial era
Human and Natural Drivers of Climate Change
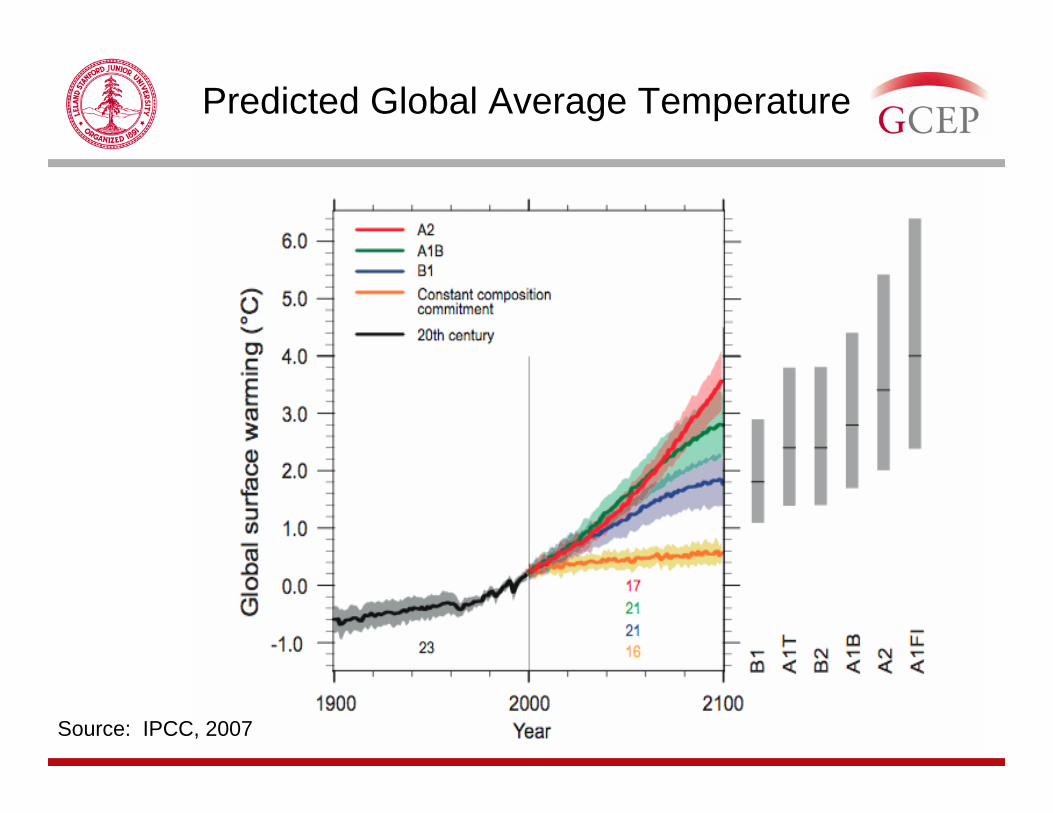
Predicted Global Average Temperature
Source: IPCC, 2007
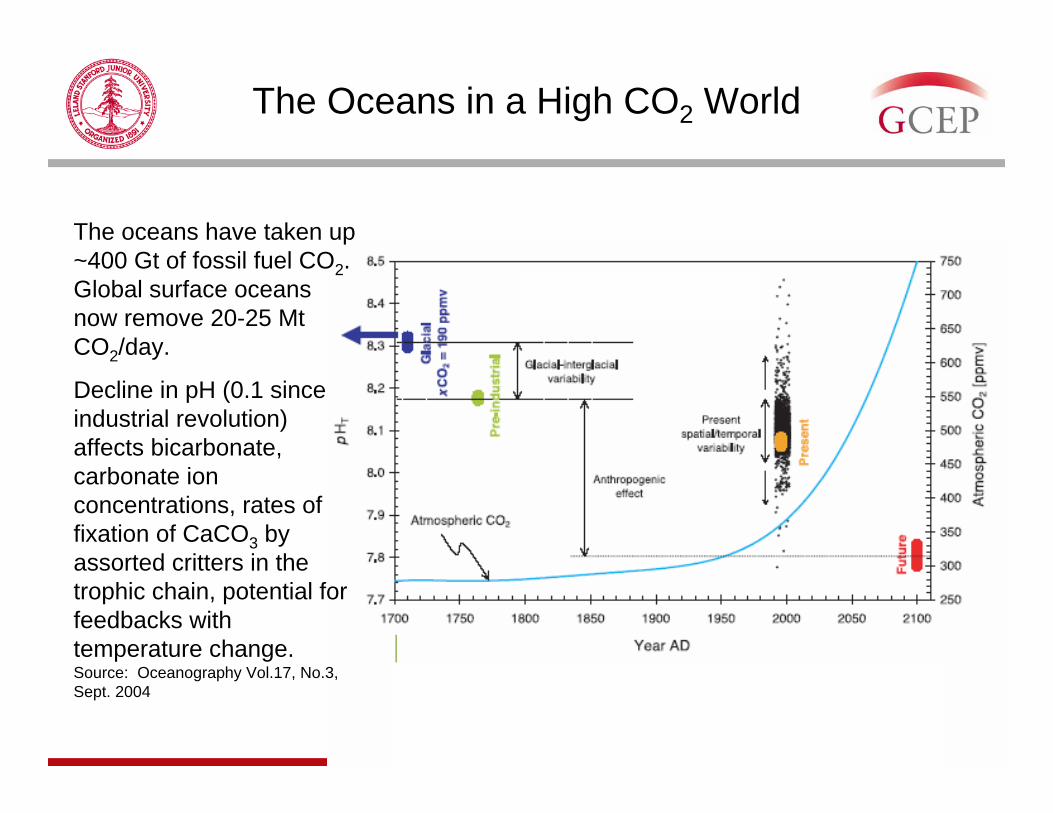
The Oceans in a High CO2 World
The oceans have taken up ~400 Gt of fossil fuel CO2. Global surface oceans now remove 20-25 Mt CO2/day.
Decline in pH (0.1 since industrial revolution) affects bicarbonate, carbonate ion concentrations, rates of fixation of CaCO3 by assorted critters in the trophic chain, potential for feedbacks with temperature change. Source: Oceanography Vol.17, No.3, Sept. 2004
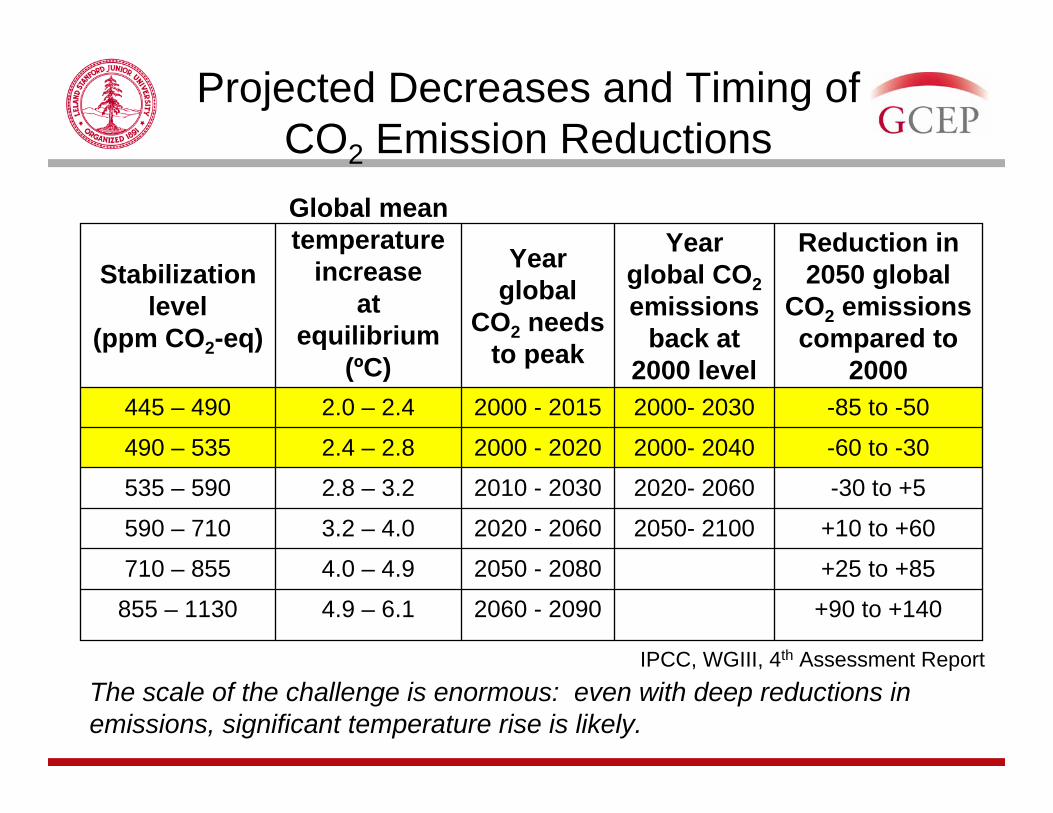
Projected Decreases and Timing of CO2 Emission Reductions
2050- 2100
2020- 2060
2000- 2040
2000- 2030
Year global CO2emissions
back at 2000 level
+90 to +1402060 - 20904.9 – 6.1855 – 1130
+25 to +852050 - 20804.0 – 4.9710 – 855
+10 to +602020 - 20603.2 – 4.0590 – 710
-30 to +52010 - 20302.8 – 3.2535 – 590
-60 to -302000 - 20202.4 – 2.8490 – 535
-85 to -502000 - 20152.0 – 2.4445 – 490
Reduction in 2050 global
CO2 emissions compared to
2000
Year global
CO2 needs to peak
Global mean temperature
increase at
equilibrium(ºC)
Stabilization level
(ppm CO2-eq)
The scale of the challenge is enormous: even with deep reductions in emissions, significant temperature rise is likely.
IPCC, WGIII, 4th Assessment Report
So what do we do about this?
• Look for energy efficiency at every turn – there is plenty of room for efficiency improvement with technologies we have today, especially in the US (lots of near-term opportunities in buildings, lighting, vehicles, etc).
• But growth in demand, particularly in the developing world, will require that new technologies be brought on line if greenhouse gases emissions are to be reduced at the same time.
• The challenges go well beyond the technical issues! We need behavioral changes, better policies for energy, and plenty of international effort.
• Above all, we need plenty of ideas and talented people to put them to work.
• Universities like Stanford have an important role to play.
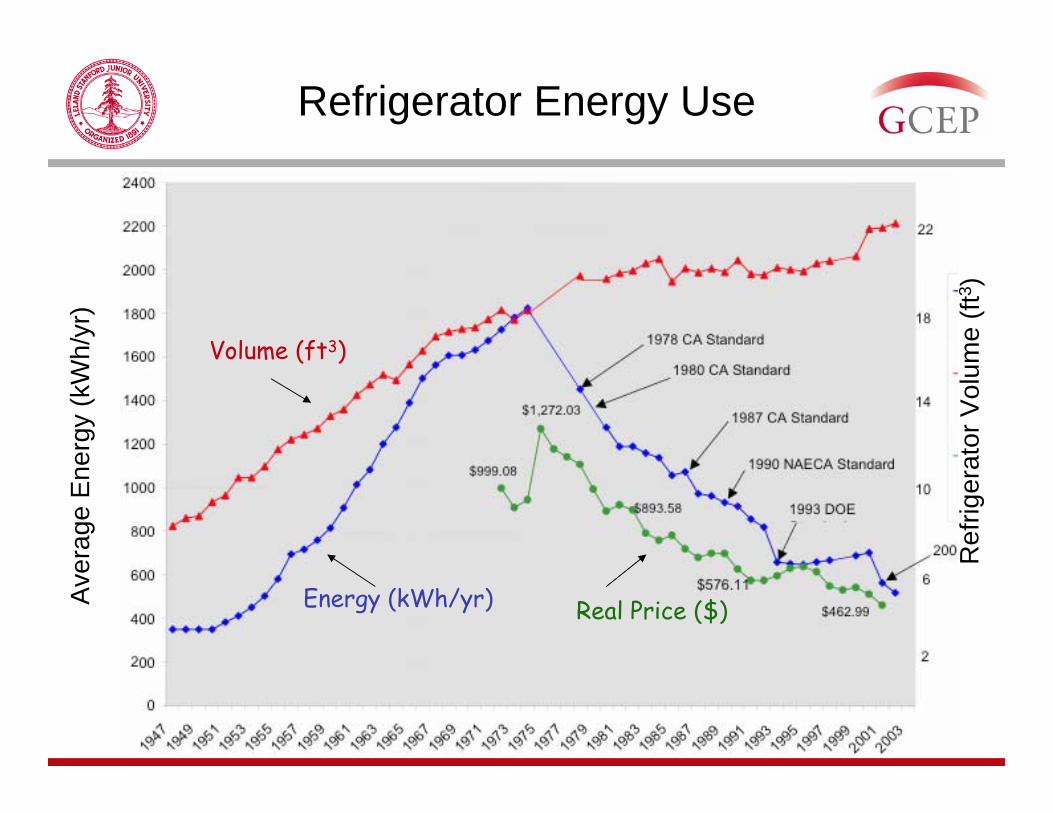
Refrigerator Energy Use
Energy (kWh/yr)
Volume (ft3)
Real Price ($)Ave
rage
Ene
rgy
(kW
h/yr
)
Re f
riger
ator
Vol
ume
( ft3 )
0.1
1.0
10.0
100.0
1600 1700 1800 1900 2000 2100Time (Years A.D.)
Firs
t-Law
Effi
cien
cy (%
) .
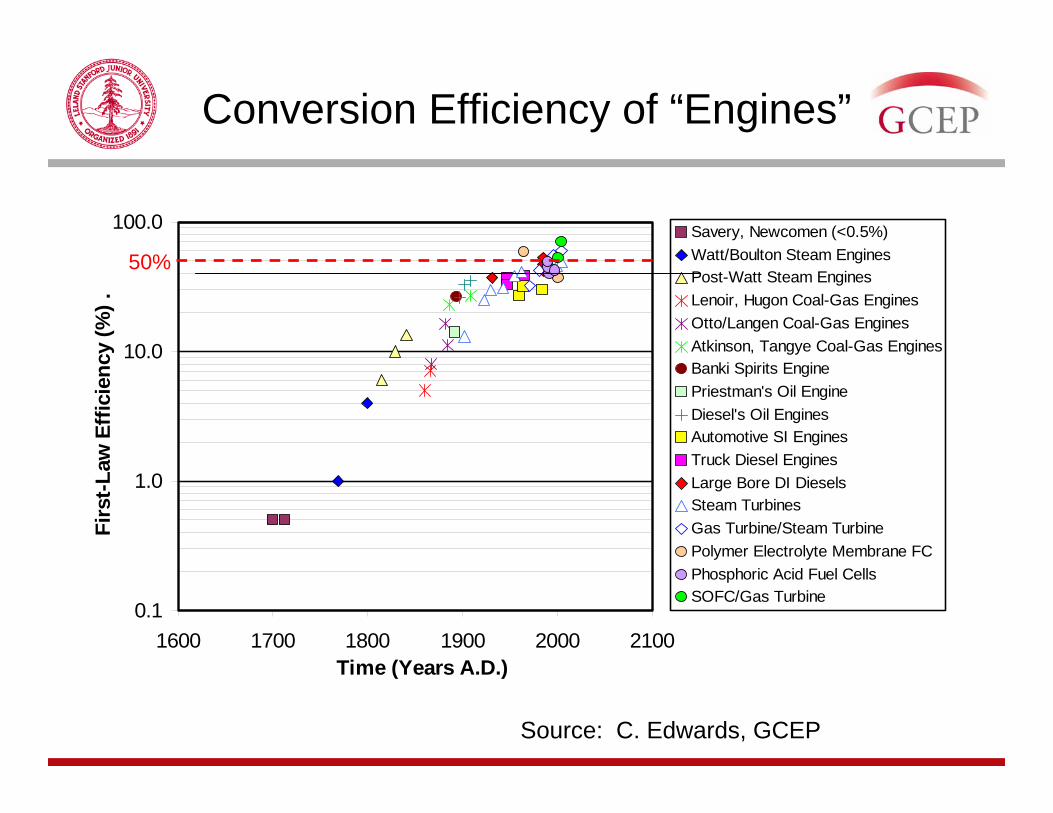
Savery, Newcomen (<0.5%)Watt/Boulton Steam EnginesPost-Watt Steam EnginesLenoir, Hugon Coal-Gas EnginesOtto/Langen Coal-Gas EnginesAtkinson, Tangye Coal-Gas EnginesBanki Spirits EnginePriestman's Oil EngineDiesel's Oil EnginesAutomotive SI EnginesTruck Diesel EnginesLarge Bore DI DieselsSteam TurbinesGas Turbine/Steam TurbinePolymer Electrolyte Membrane FCPhosphoric Acid Fuel CellsSOFC/Gas Turbine
Conversion Efficiency of “Engines”
50%
Source: C. Edwards, GCEP
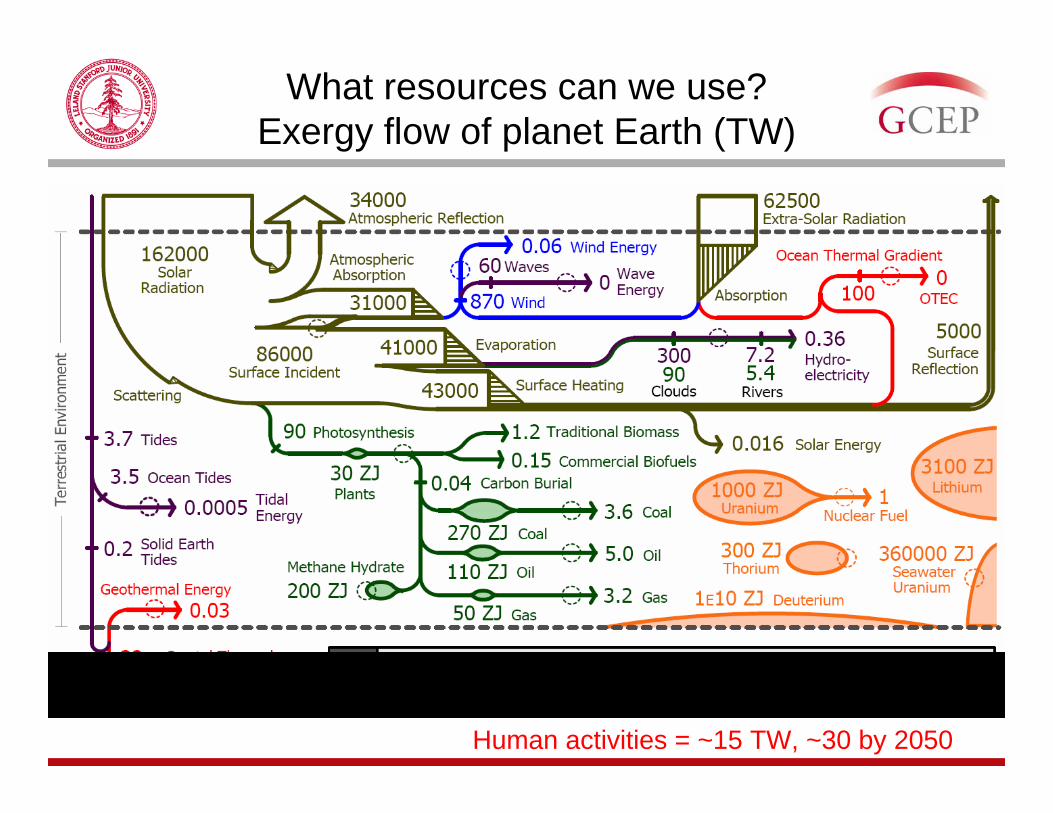
What resources can we use?Exergy flow of planet Earth (TW)
Human activities = ~15 TW, ~30 by 2050
Renewable Global Exergy Flows
Exergy sources scaled to average consumption in 2004 (15 TW)From Hermann, 2006: Quantifying Global Exergy Resources, Energy 31 (2006) 1349–1366
HumanUse of Energy(15 TW)
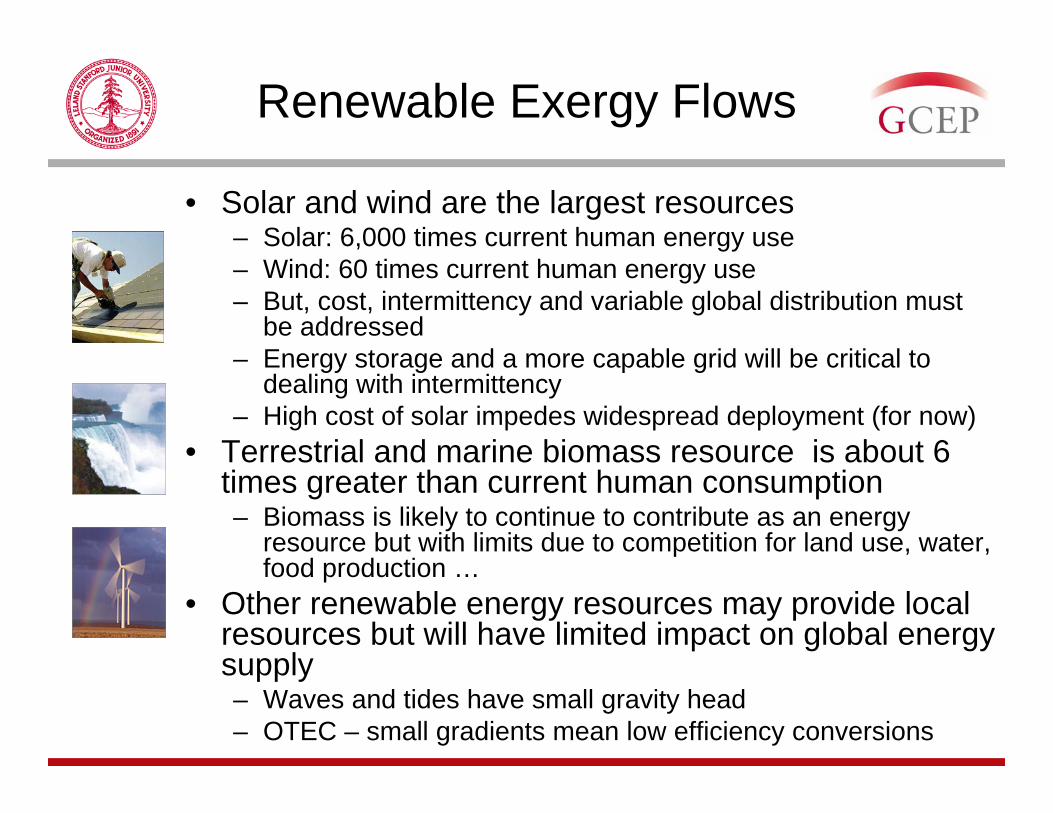
Renewable Exergy Flows
• Solar and wind are the largest resources– Solar: 6,000 times current human energy use– Wind: 60 times current human energy use– But, cost, intermittency and variable global distribution must
be addressed– Energy storage and a more capable grid will be critical to
dealing with intermittency– High cost of solar impedes widespread deployment (for now)
• Terrestrial and marine biomass resource is about 6 times greater than current human consumption– Biomass is likely to continue to contribute as an energy
resource but with limits due to competition for land use, water,food production …
• Other renewable energy resources may provide local resources but will have limited impact on global energy supply– Waves and tides have small gravity head– OTEC – small gradients mean low efficiency conversions
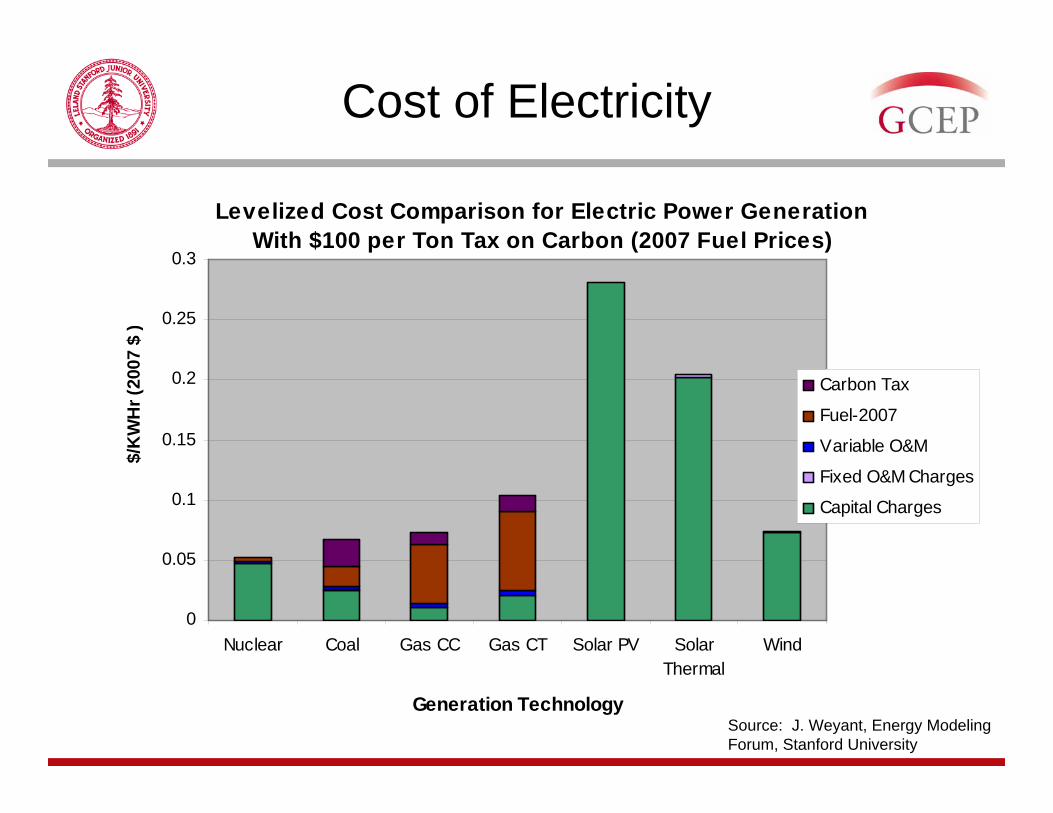
Cost of Electricity
Source: J. Weyant, Energy Modeling Forum, Stanford University
Levelized Cost Comparison for Electric Power GenerationWith $100 per Ton Tax on Carbon (2007 Fuel Prices)
0
0.05
0.1
0.15
0.2
0.25
0.3
Nuclear Coal Gas CC Gas CT Solar PV SolarThermal
Wind
Generation Technology
Carbon Tax
Fuel-2007
Variable O&M
Fixed O&M Charges
Capital Charges
$/K
WH
r (20
07 $
)
Grid Issues
• Current grid grew from connections among regional grids
• Addition of large fractions of wind and solar electric power generation will require changes:– Many widely distributed, modest size intermittent
sources – new architectures?– Need capacity over longer distances, distributed
sensing, active controls, storage …• Policy and regulatory issues abound

Global Exergy Stores
From Hermann, 2006: Quantifying Global Exergy Resources, Energy 31 (2006) 1349–1366
0
1
10
100
1000
10000
100000
Geothermal E
nergy*
Deuterium–trit
ium (from Li)
Uranium
Thorium
Coal
Gas Hydrates Oil
Gas
Yearly Human Consumptio
n
Exer
gy (
ZJ)
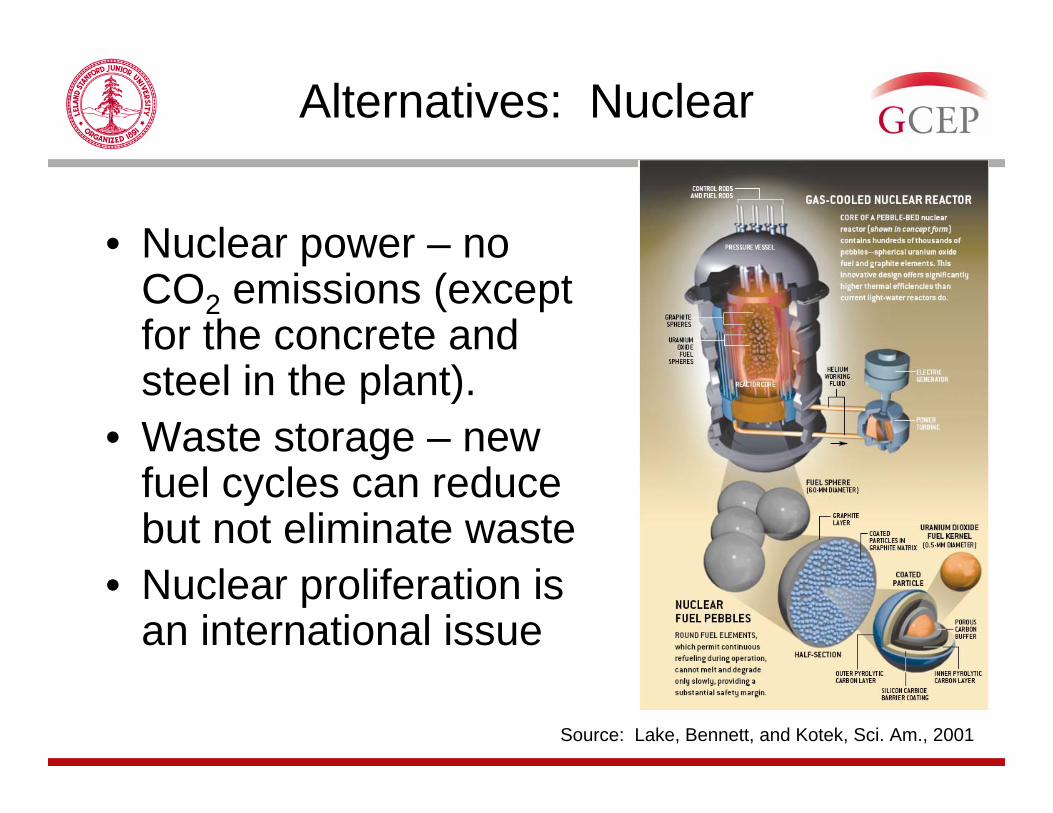
Alternatives: Nuclear
• Nuclear power – no CO2 emissions (except for the concrete and steel in the plant).
• Waste storage – new fuel cycles can reduce but not eliminate waste
• Nuclear proliferation is an international issue
Source: Lake, Bennett, and Kotek, Sci. Am., 2001
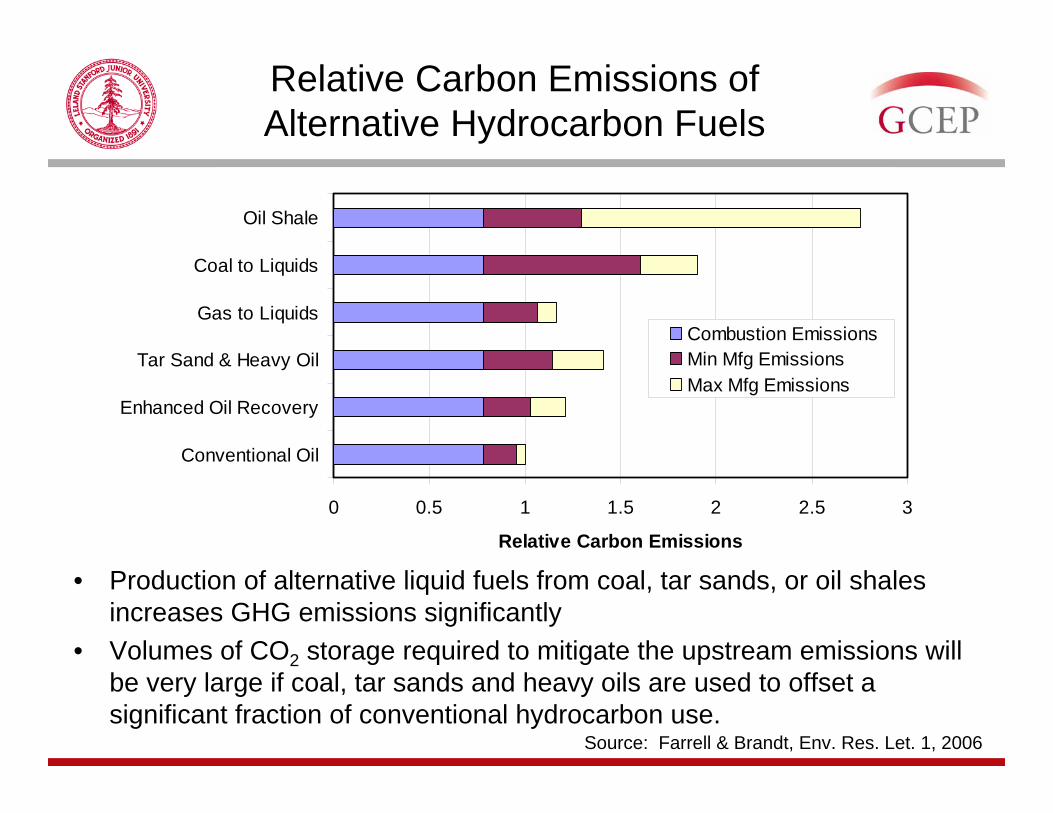
Relative Carbon Emissions of Alternative Hydrocarbon Fuels
• Production of alternative liquid fuels from coal, tar sands, or oil shalesincreases GHG emissions significantly
• Volumes of CO2 storage required to mitigate the upstream emissions will be very large if coal, tar sands and heavy oils are used to offset a significant fraction of conventional hydrocarbon use.
Source: Farrell & Brandt, Env. Res. Let. 1, 2006
0 0.5 1 1.5 2 2.5 3
Conventional Oil
Enhanced Oil Recovery
Tar Sand & Heavy Oil
Gas to Liquids
Coal to Liquids
Oil Shale
Relative Carbon Emissions
Combustion EmissionsMin Mfg EmissionsMax Mfg Emissions
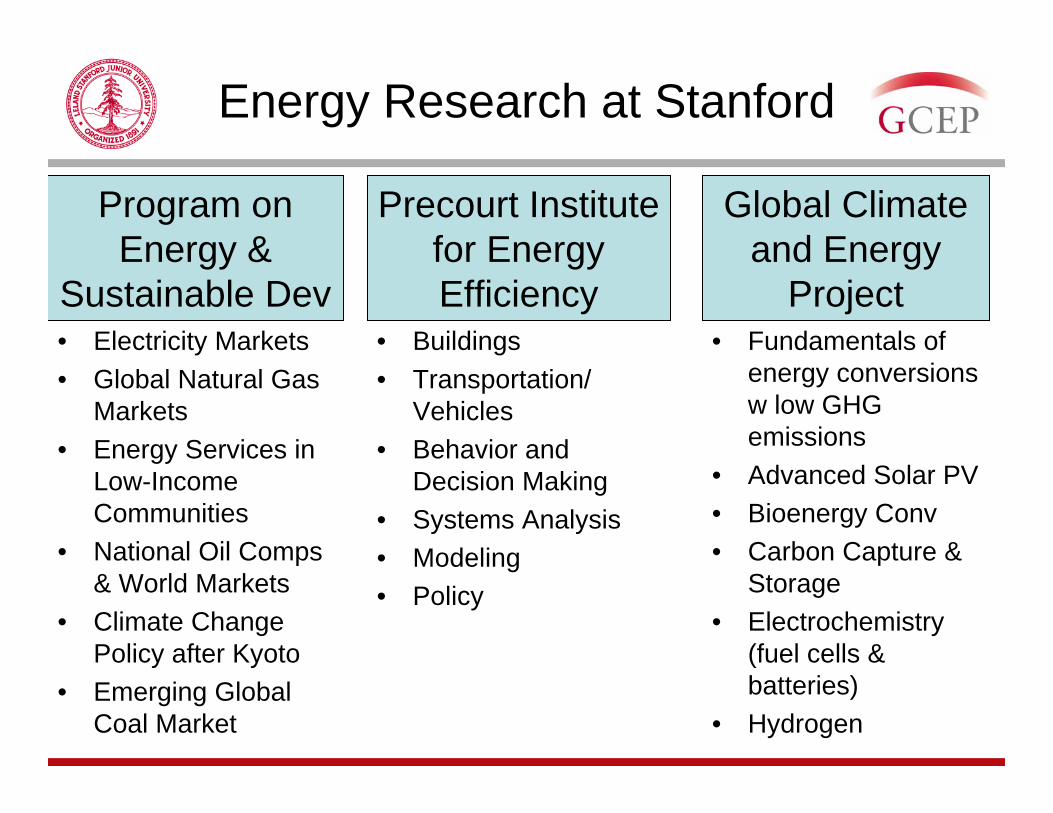
Energy Research at Stanford
• Electricity Markets• Global Natural Gas
Markets• Energy Services in
Low-Income Communities
• National Oil Comps & World Markets
• Climate Change Policy after Kyoto
• Emerging Global Coal Market
• Buildings• Transportation/
Vehicles• Behavior and
Decision Making• Systems Analysis• Modeling• Policy
• Fundamentals of energy conversions w low GHG emissions
• Advanced Solar PV• Bioenergy Conv• Carbon Capture &
Storage• Electrochemistry
(fuel cells & batteries)
• Hydrogen
Program on Energy &
Sustainable Dev
Precourt Institute for Energy Efficiency
Global Climate and Energy
Project
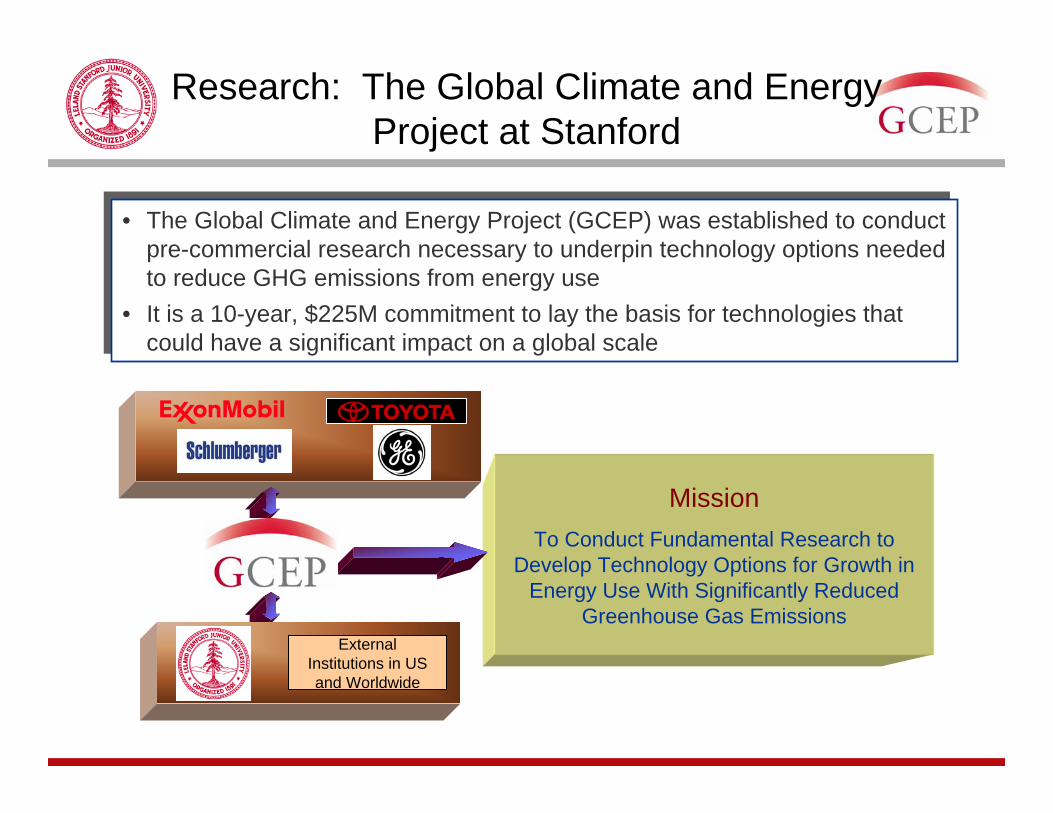
Research: The Global Climate and Energy Project at Stanford
• The Global Climate and Energy Project (GCEP) was established to conduct pre-commercial research necessary to underpin technology options needed to reduce GHG emissions from energy use
• It is a 10-year, $225M commitment to lay the basis for technologies that could have a significant impact on a global scale
MissionTo Conduct Fundamental Research to
Develop Technology Options for Growth in Energy Use With Significantly Reduced
Greenhouse Gas EmissionsExternal
Institutions in US and Worldwide
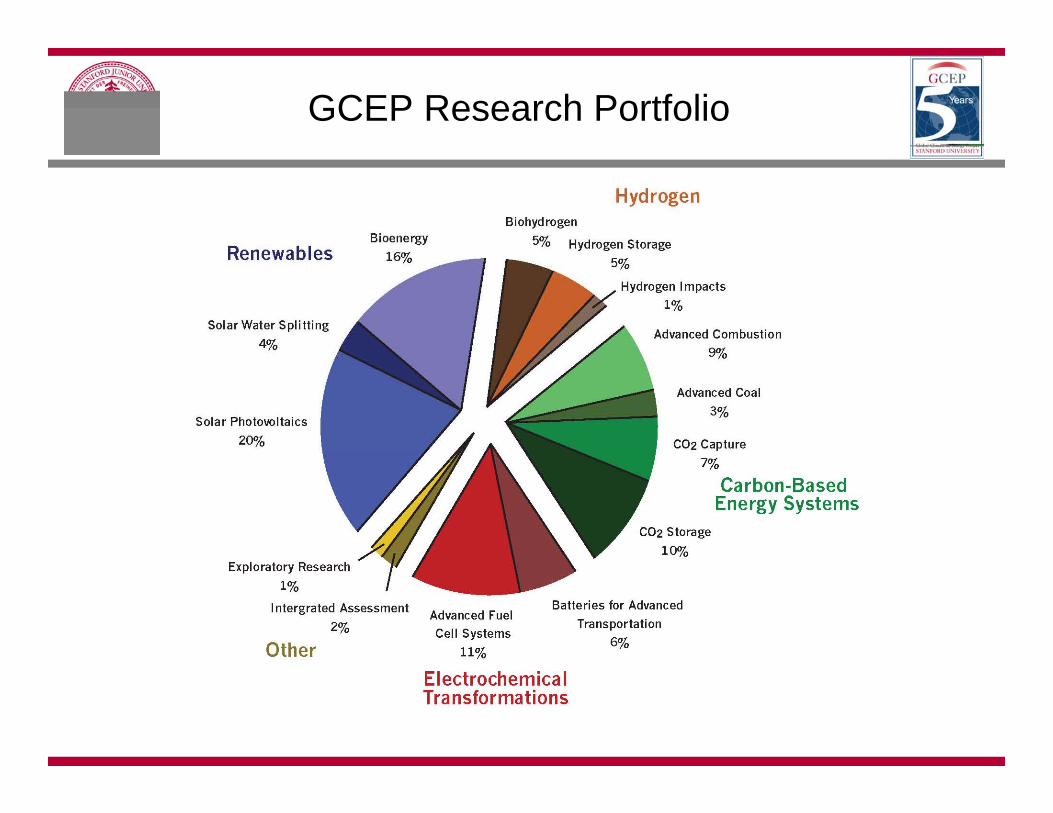
GCEP Research Portfolio
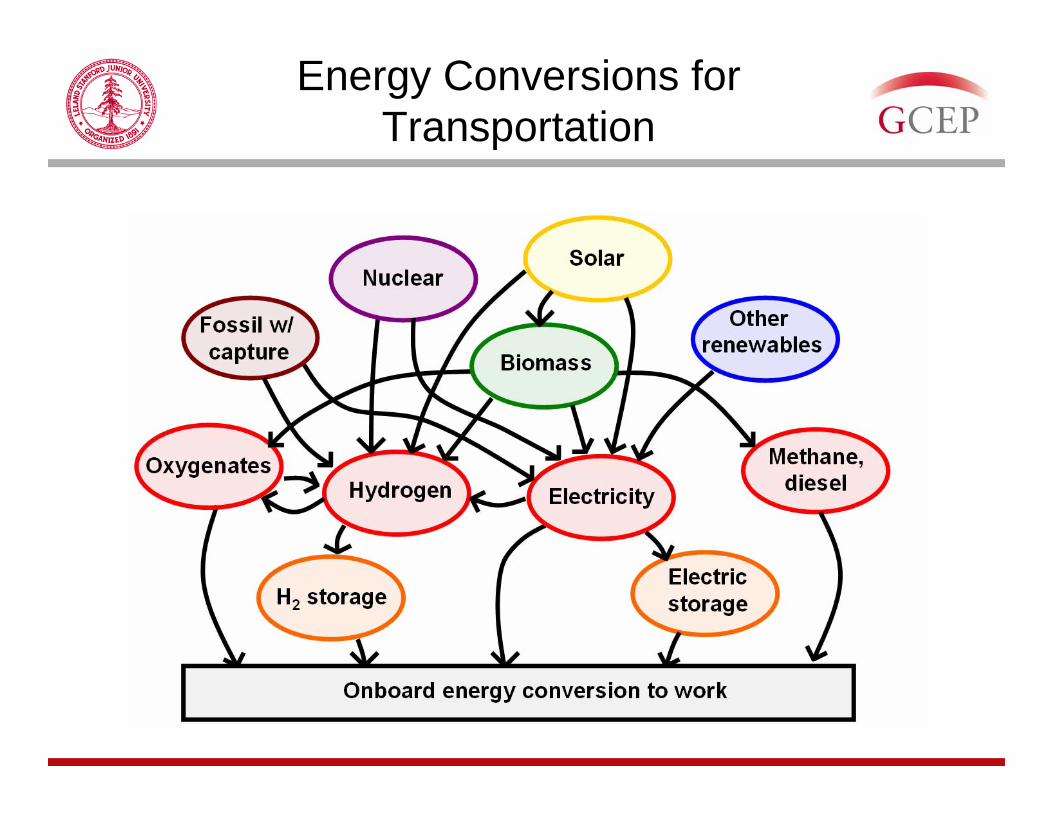
Energy Conversions for Transportation
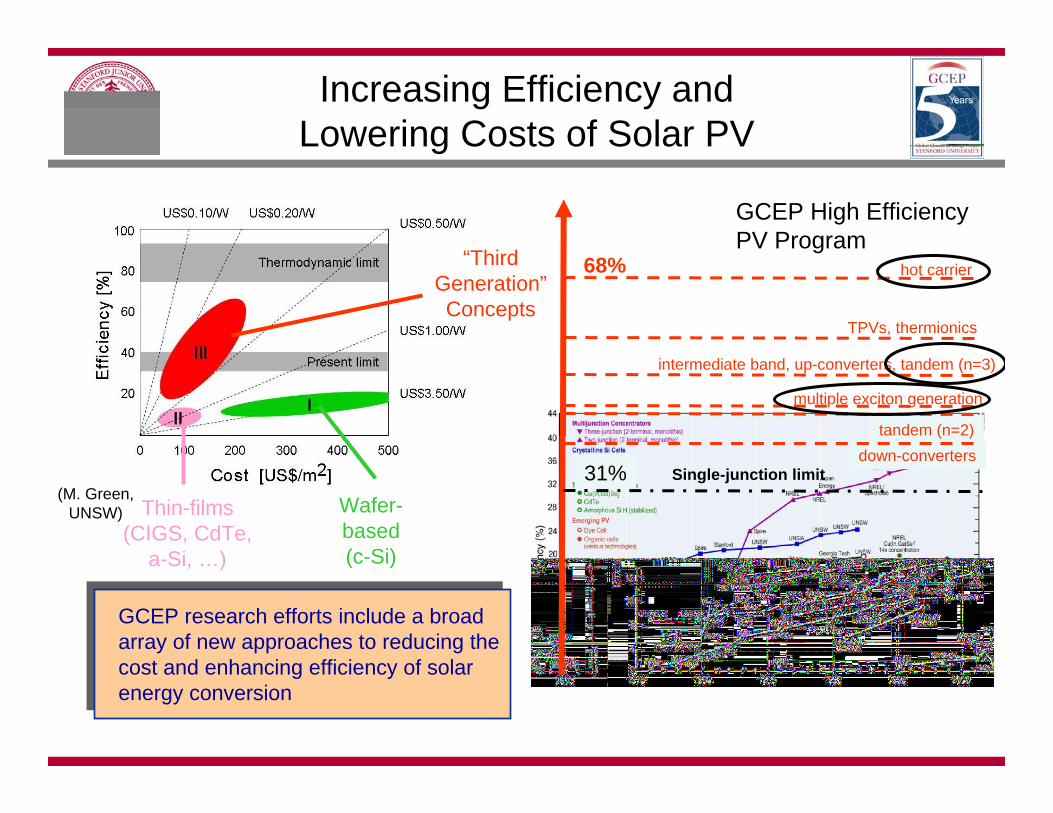
Increasing Efficiency and Lowering Costs of Solar PV
(M. Green, UNSW) Wafer-
based (c-Si)
Thin-films (CIGS, CdTe,
a-Si, …)
“Third Generation”Concepts
GCEP research efforts include a broad array of new approaches to reducing the cost and enhancing efficiency of solar energy conversion
GCEP research efforts include a broad array of new approaches to reducing the cost and enhancing efficiency of solar energy conversion
intermediate band, up-converters, tandem (n=3)
hot carrier
TPVs, thermionics
tandem (n=2)
multiple exciton generation
31%down-converters
68%
Single-junction limit
GCEP High EfficiencyPV Program
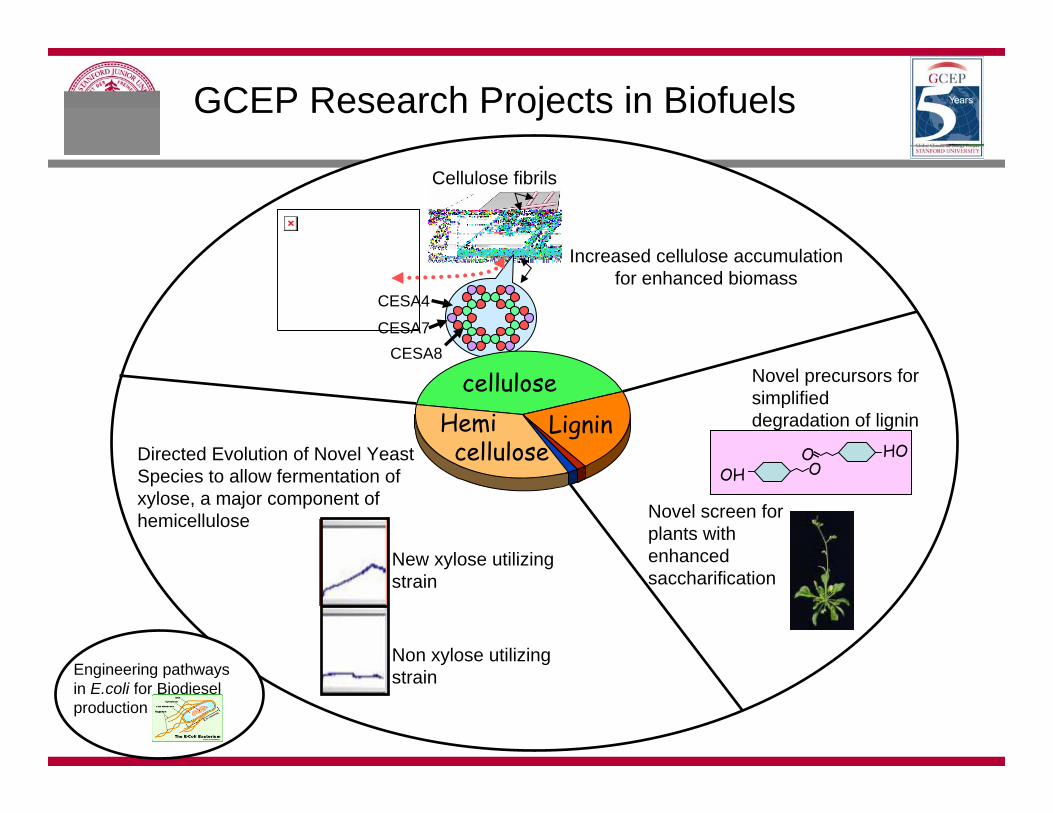
Directed Evolution of Novel Yeast Species to allow fermentation of xylose, a major component of hemicellulose
OH
OH OO
Novel precursors for simplified degradation of lignin
GCEP Research Projects in Biofuels
New xylose utilizing strain
Non xylose utilizing strain
Novel screen for plants with enhanced saccharification
Cellulose fibrils
CESA4
CESA7CESA8
Increased cellulose accumulation for enhanced biomass
Engineering pathways in E.coli for Biodiesel production
Lignincellulose
Hemicellulose
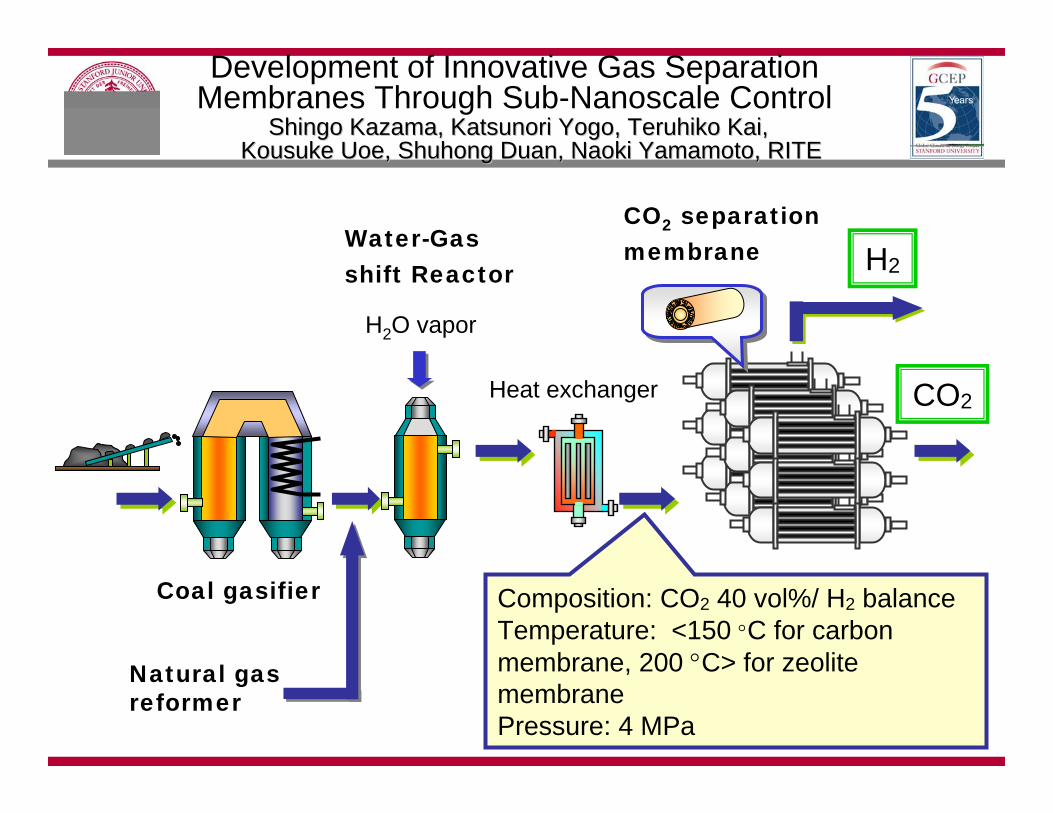
Development of Innovative Gas Separation Membranes Through Sub-Nanoscale Control
Shingo Shingo KazamaKazama, , KatsunoriKatsunori YogoYogo, , TeruhikoTeruhiko Kai, Kai, KousukeKousuke UoeUoe, , ShuhongShuhong DuanDuan, Naoki Yamamoto, Naoki Yamamoto, RITE, RITE
H2O vapor
Natural gasreformer
Heat exchanger
Composition: CO2 40 vol%/ H2 balanceTemperature: <150 °C for carbon membrane, 200 °C> for zeolite membranePressure: 4 MPa
H2
CO2
Coal gasifier
Water-Gasshift Reactor
CO2 separationmembrane
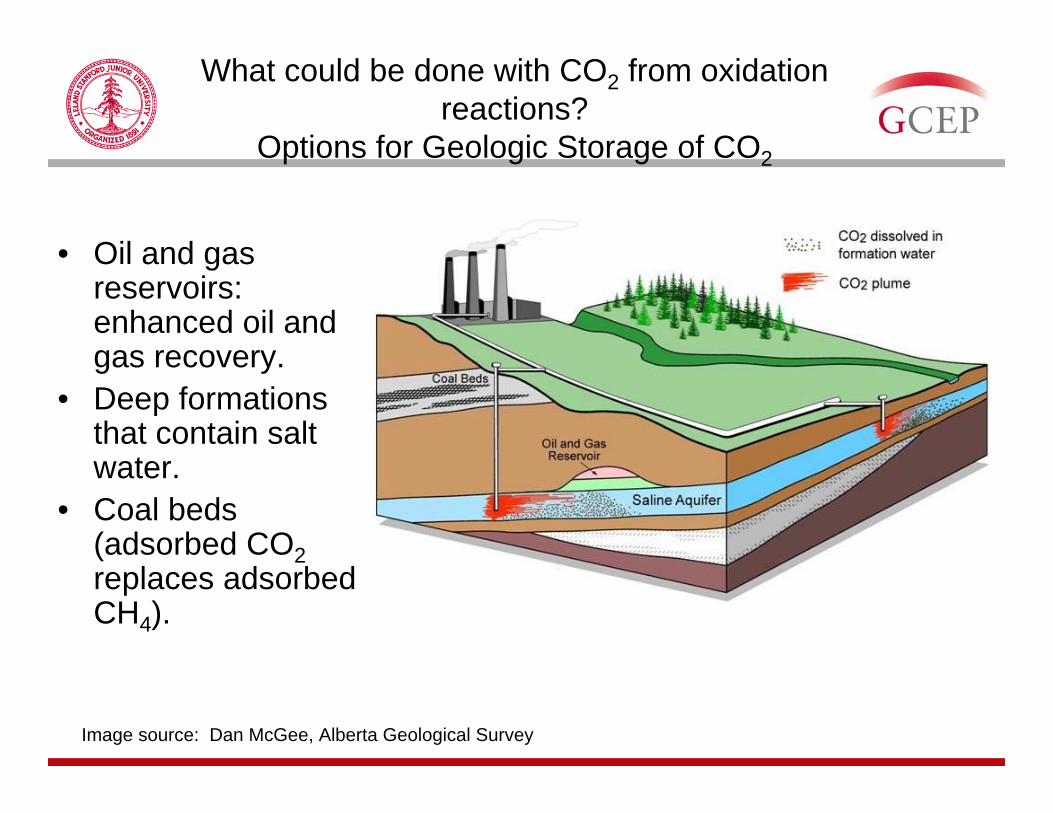
What could be done with CO2 from oxidation reactions?
Options for Geologic Storage of CO2
• Oil and gas reservoirs: enhanced oil and gas recovery.
• Deep formations that contain salt water.
• Coal beds (adsorbed CO2replaces adsorbed CH4).
Image source: Dan McGee, Alberta Geological Survey
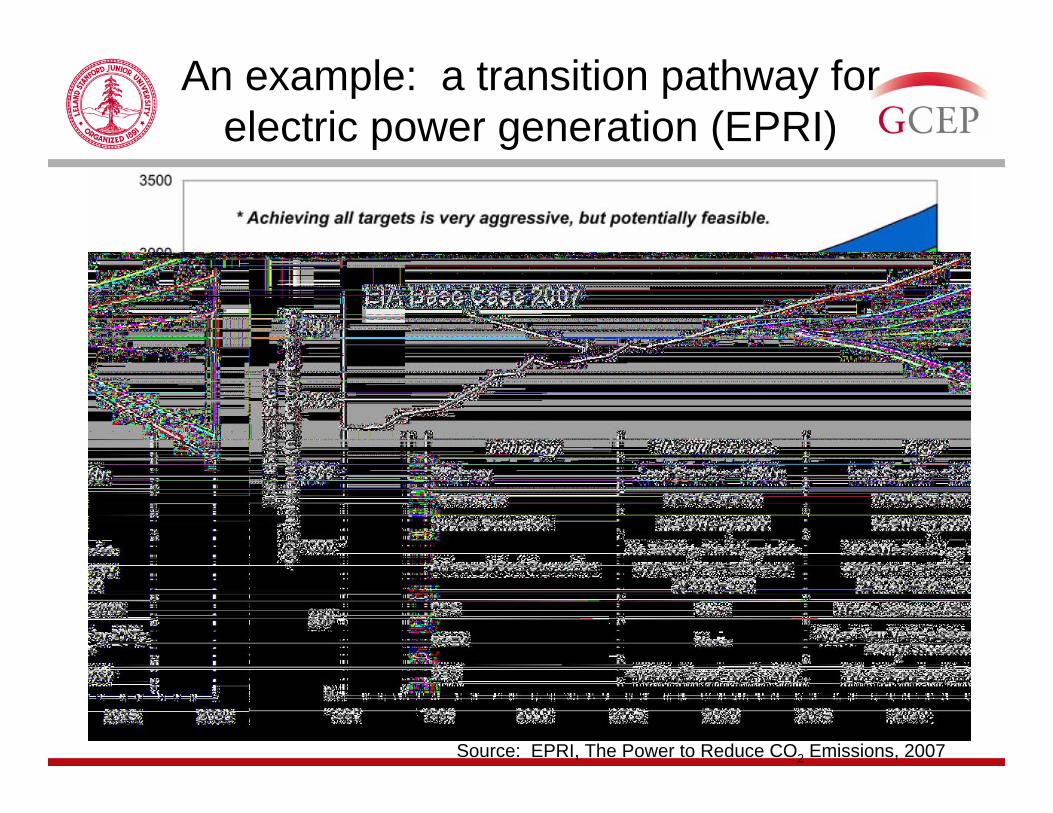
An example: a transition pathway for electric power generation (EPRI)
Source: EPRI, The Power to Reduce CO2 Emissions, 2007
Conclusions
• Changing the world’s energy systems to reduce GHG emissions is a big challenge, but it can by met by a sustained effort on many fronts (including universities).
• There is way too much coal and heavy oil in the world –avoiding relying on it, or capturing and storing the CO2from it, is essential if we are to control atmospheric concentrations of CO2.
• There is no single, simple solution to this challenge.• There is much to do, but there is much that can be done,
on a variety of time scales:– Much better energy efficiency now– Adding more renewable and low GHG technologies available now
to the energy mix – Research on a wide-ranging portfolio of energy resources and
conversion methods for applications in the long term– Work on the policy and regulatory structures at all levels that will
make these transformations possible