Embed Size (px)
Citation preview
32 of 44 Commercial In Confidence
Appendices
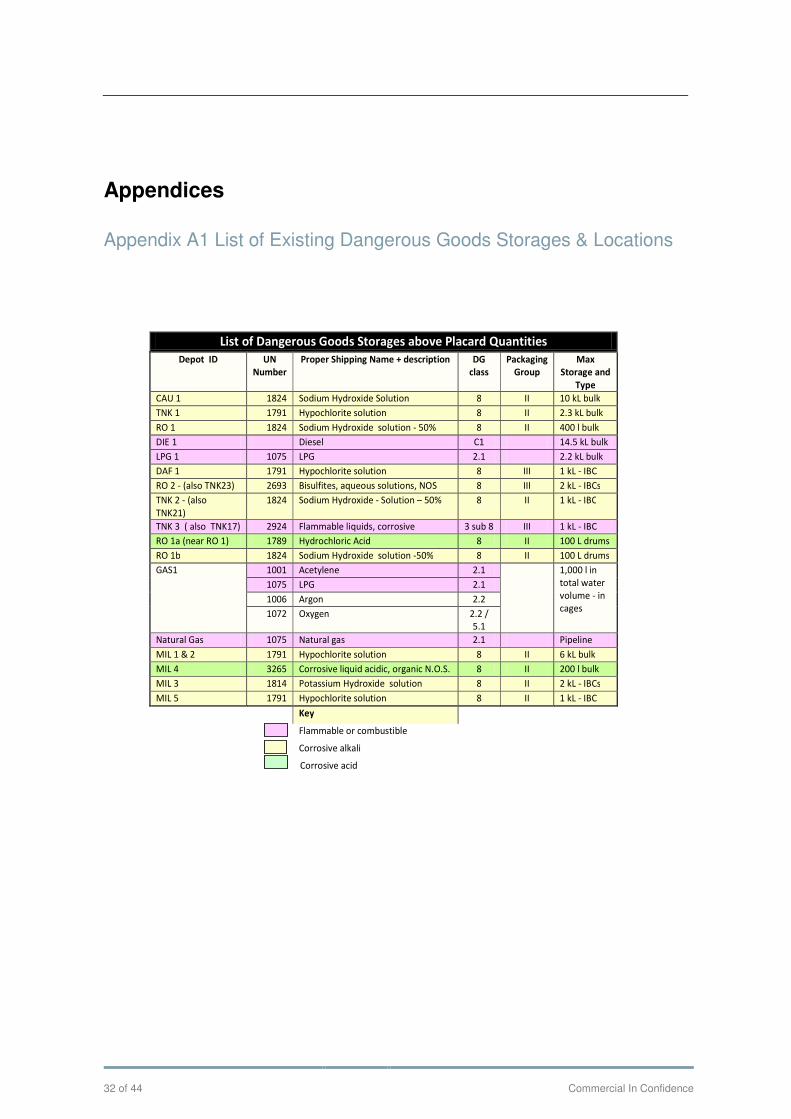
Appendix A1 List of Existing Dangerous Goods Storages & Locations
List of Dangerous Goods Storages above Placard Quantities
Depot ID UN
Number
Proper Shipping Name + description DG
class
Packaging
Group
Max
Storage and
Type
CAU 1 1824 Sodium Hydroxide Solution 8 II 10 kL bulk
TNK 1 1791 Hypochlorite solution 8 II 2.3 kL bulk
RO 1 1824 Sodium Hydroxide solution - 50% 8 II 400 l bulk
DIE 1 Diesel C1 14.5 kL bulk
LPG 1 1075 LPG 2.1 2.2 kL bulk
DAF 1 1791 Hypochlorite solution 8 III 1 kL - IBC
RO 2 - (also TNK23) 2693 Bisulfites, aqueous solutions, NOS 8 III 2 kL - IBCs
TNK 2 - (also
TNK21)
1824 Sodium Hydroxide - Solution – 50% 8 II 1 kL - IBC
TNK 3 ( also TNK17) 2924 Flammable liquids, corrosive 3 sub 8 III 1 kL - IBC
RO 1a (near RO 1) 1789 Hydrochloric Acid 8 II 100 L drums
RO 1b 1824 Sodium Hydroxide solution -50% 8 II 100 L drums
GAS1 1001 Acetylene 2.1 1,000 l in
total water
volume - in
cages
1075 LPG 2.1
1006 Argon 2.2
1072 Oxygen 2.2 /
5.1
Natural Gas 1075 Natural gas 2.1 Pipeline
MIL 1 & 2 1791 Hypochlorite solution 8 II 6 kL bulk
MIL 4 3265 Corrosive liquid acidic, organic N.O.S. 8 II 200 l bulk
MIL 3 1814 Potassium Hydroxide solution 8 II 2 kL - IBCs
MIL 5 1791 Hypochlorite solution 8 II 1 kL - IBC
Key
Flammable or combustible
Corrosive alkali
Corrosive acid
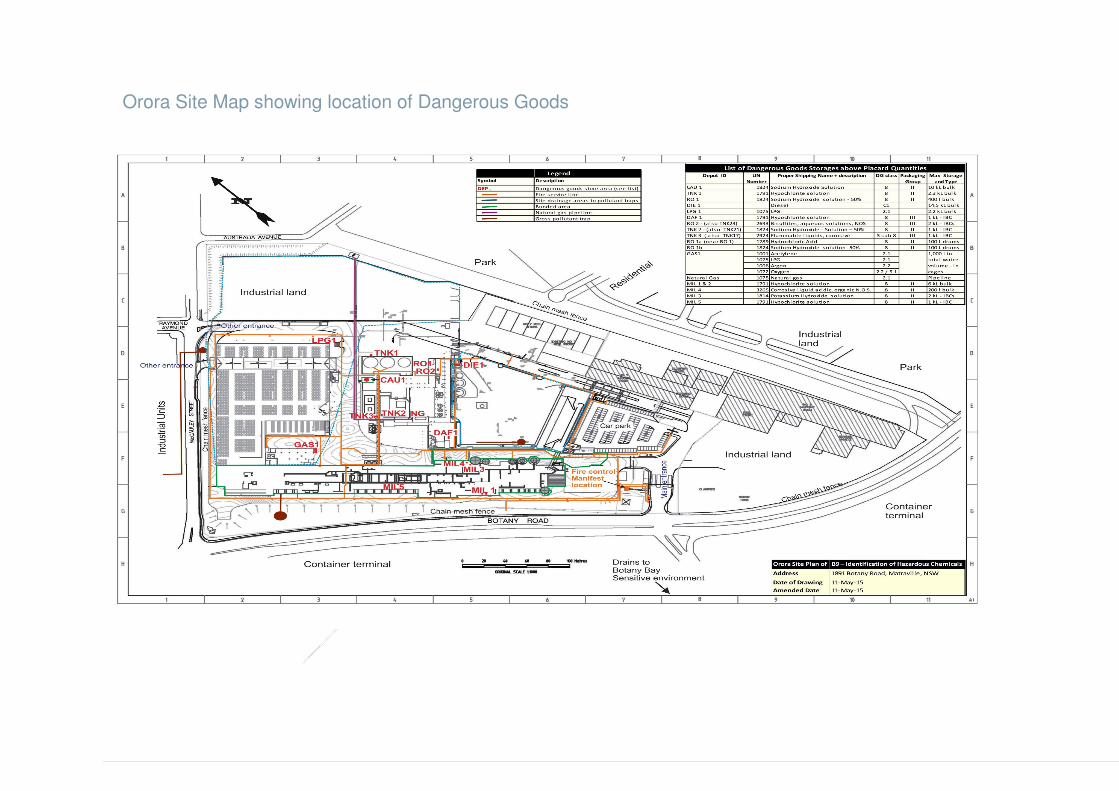
Orora Site Map showing location of Dangerous Goods
Appendix A2 Gas Holder Blast Curve Selection
Blast Curve Selection by Kinsella (1993)
Kinsella [1993] provides guidance on curve selection based on review of major accidents. It
has been found that the major influencing factors on blast strength (curve selection) are:
� Degree of obstruction by obstacles inside the vapour cloud. � Ignition energy. � Degree of confinement.
Increasing obstructions gives rise to increased blast strength due to the turbulence created by the obstructions. This increased turbulence at the blast front promotes an increased rate of combustion due to the exposure of more uncombusted fuel to the flame front. These three blast source strength factors are defined as follows.
1. Ignition Energy: High or Low � High
The ignition source is, for instance, a confined vented explosion. This may be due to the ignition of part of the cloud by a low energy source, for example, inside a building or in this case the gas holder enclosure
� Low The ignition source is spark, flame, hot surface, etc., such as a nearby car Hence Ignition energy strength is considered HIGH in this case
2. Degree of Obstruction: High , Low or None � High
Closely packed obstacles within gas cloud giving an overall volume blockage fraction (i.e. the ratio of the volume if the obstructed area occupied by the obstacles and the total volume of the obstructed area itself) in excess of 30% and with the spacing between obstacles less than 3 m
� Low Obstacles in gas cloud but with overall blockage fraction less than 30% and/or spacing between obstacles larger than 3 m.
� None No obstacles within gas cloud. Typically the degree of obstruction for a gas holder can be considered an enclosed– hence HIGH is selected here. Not also there are a number of structures close by (existing boiler house, etc.)
3. Degree of (Parallel Plane) Confinement: � With presence of confinement
Gas clouds, or parts of it, are confined by walls/barriers on two or three sides. � Without presence of confinement
Gas cloud is not confined, other than by the ground.
Given the location of the Gas Enclosure, and noting other building potentially buildings in the
flame path then we would set the degree of parallel confinement as (C) - i.e. confined,
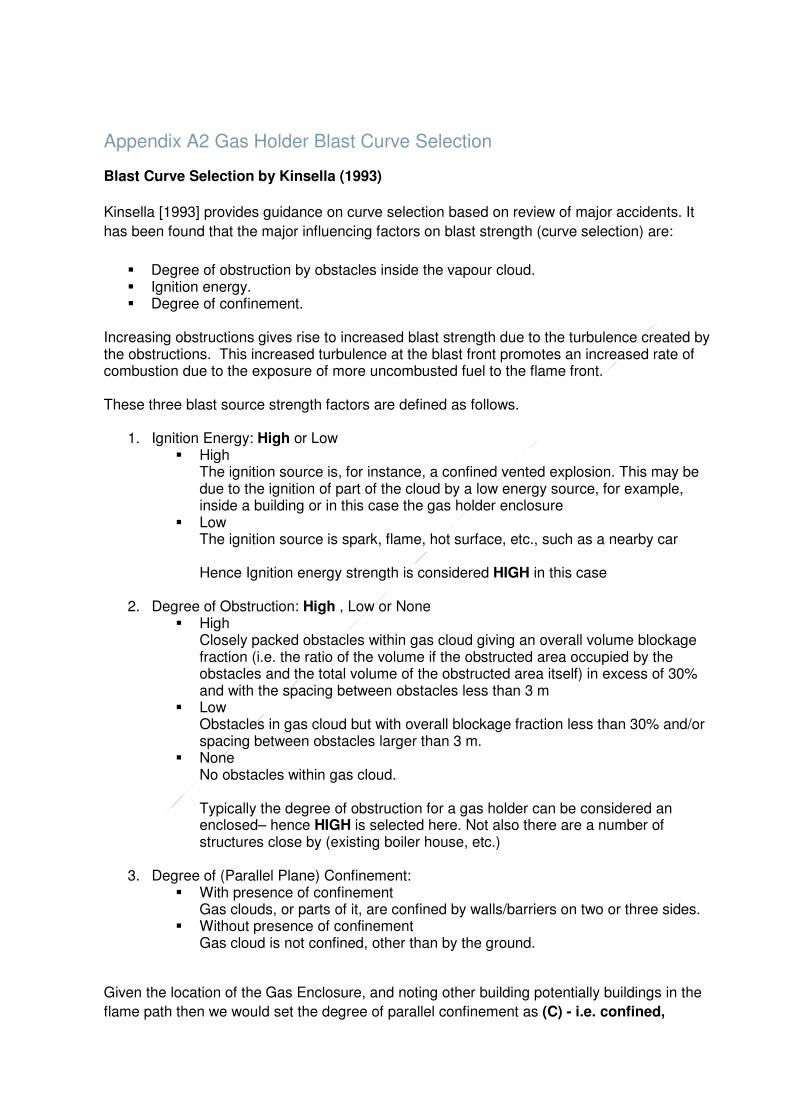
From Kinsella Blast Energy Strength table we find the Blast Curve selected is 7 – 10. Hence to
be conservative we would select a Blast Strength of 8.
Blast Curve Selection Table from Kinsella (1993)
Model: Explosion (Multi Energy model) version: v2016.03.10697 (29/03/2016) Based on the yellow book State: the model is tested Reference: Yellow Book CPR14E 3rd Edition - Chapter 5: Vapour cloud explosions Mercx, W.P.M, van den Berg, A.C., van Leeuwen, D, "Application of correlations to quantify the source strength of vapour cloud explosions in realistic situations Final report for the project GAMES, October 1998, TNO- report PML 1998-C53 (1998)
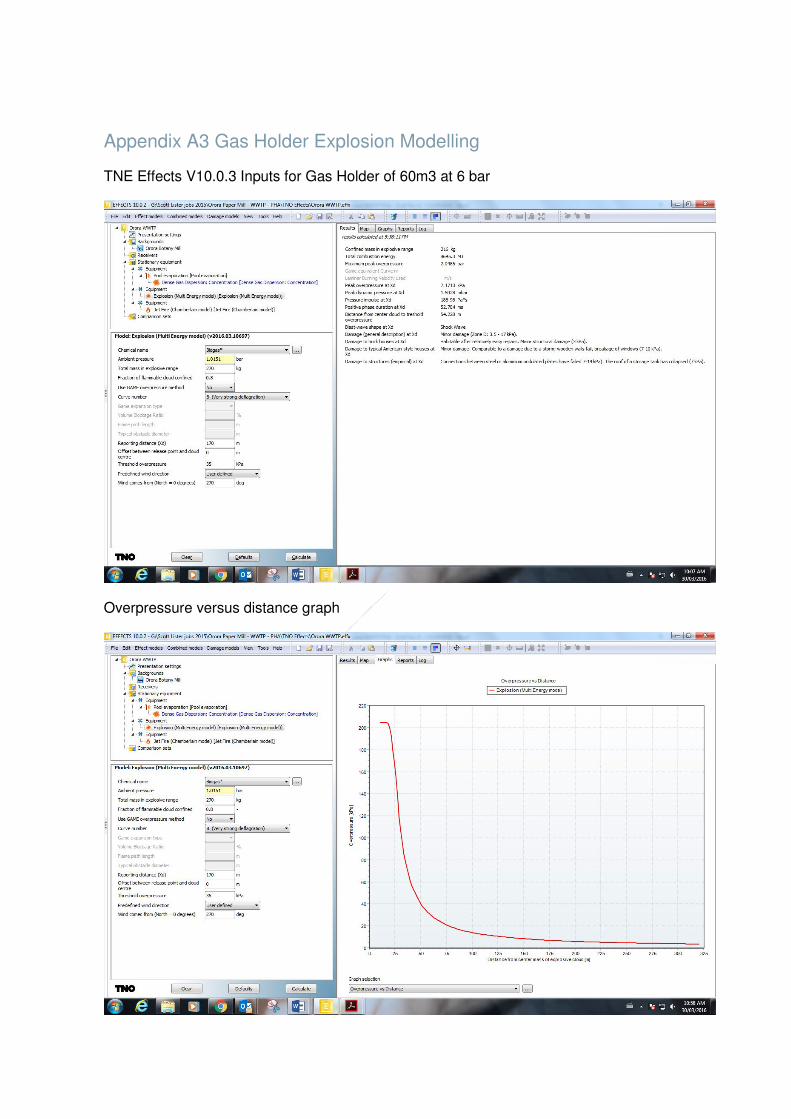
Appendix A3 Gas Holder Explosion Modelling
TNE Effects V10.0.3 Inputs for Gas Holder of 60m3 at 6 bar
Overpressure versus distance graph
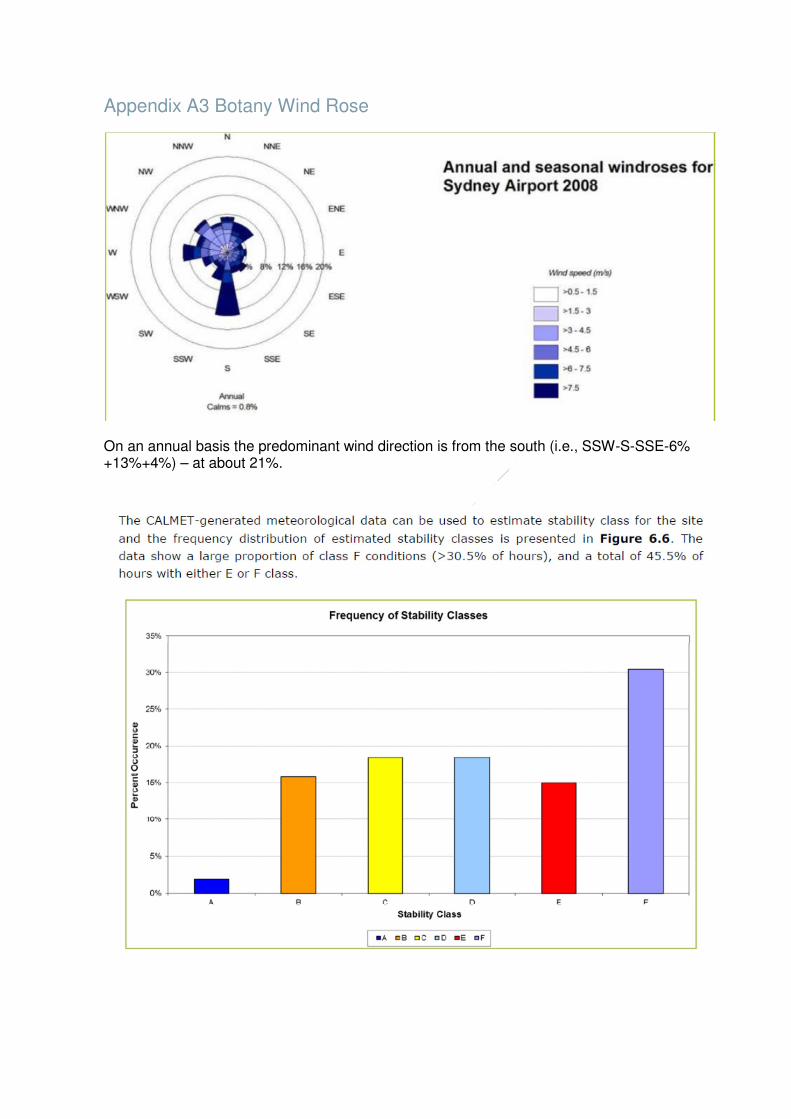
Appendix A3 Botany Wind Rose
On an annual basis the predominant wind direction is from the south (i.e., SSW-S-SSE-6% +13%+4%) – at about 21%.
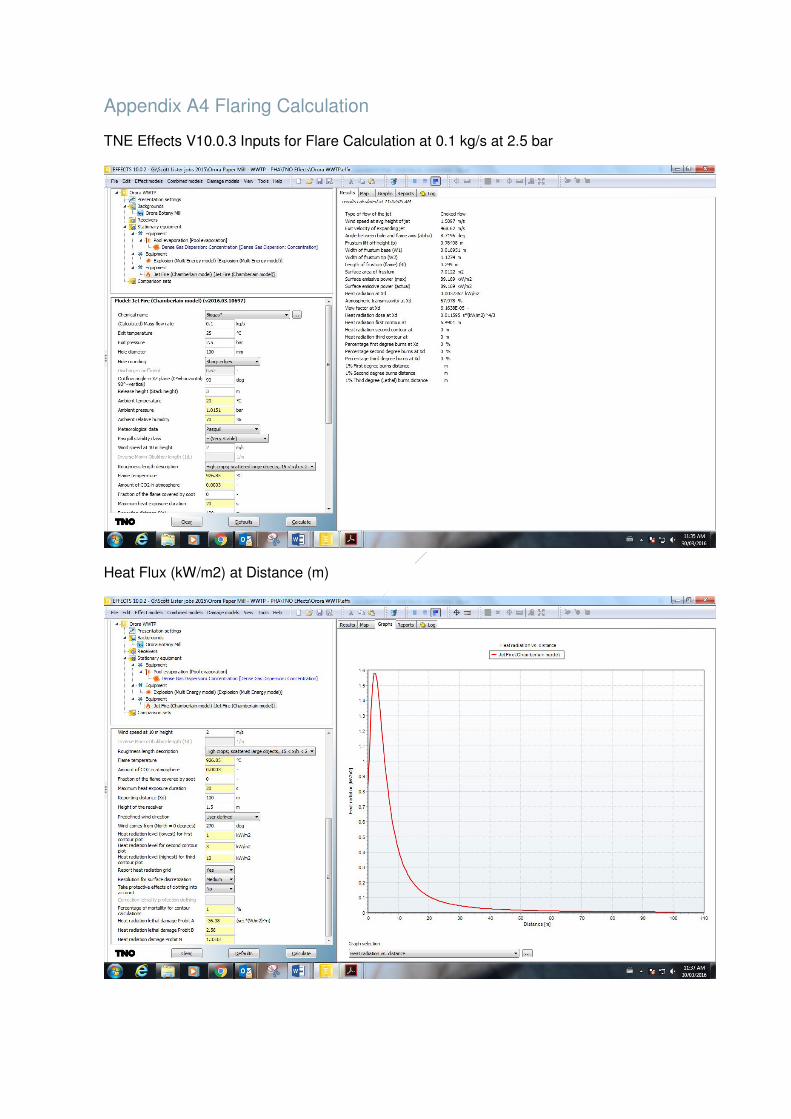
Appendix A4 Flaring Calculation
TNE Effects V10.0.3 Inputs for Flare Calculation at 0.1 kg/s at 2.5 bar
Heat Flux (kW/m2) at Distance (m)
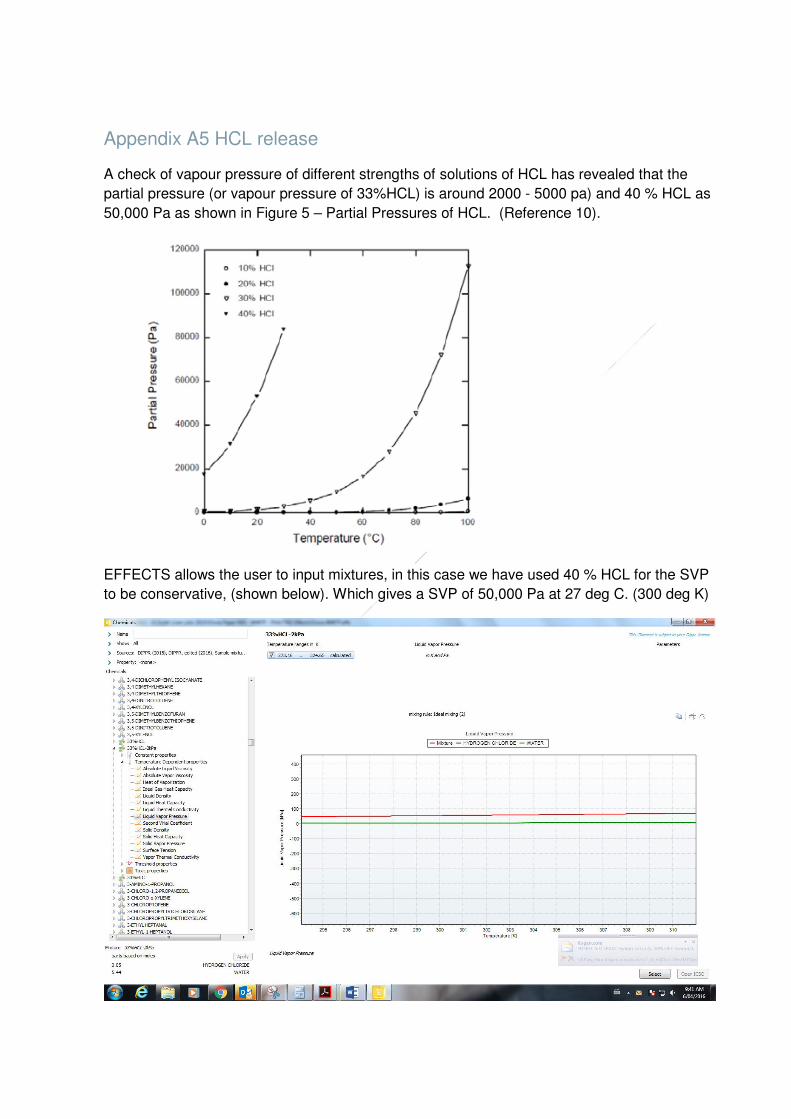
Appendix A5 HCL release
A check of vapour pressure of different strengths of solutions of HCL has revealed that the
partial pressure (or vapour pressure of 33%HCL) is around 2000 - 5000 pa) and 40 % HCL as
50,000 Pa as shown in Figure 5 – Partial Pressures of HCL. (Reference 10).
EFFECTS allows the user to input mixtures, in this case we have used 40 % HCL for the SVP
to be conservative, (shown below). Which gives a SVP of 50,000 Pa at 27 deg C. (300 deg K)
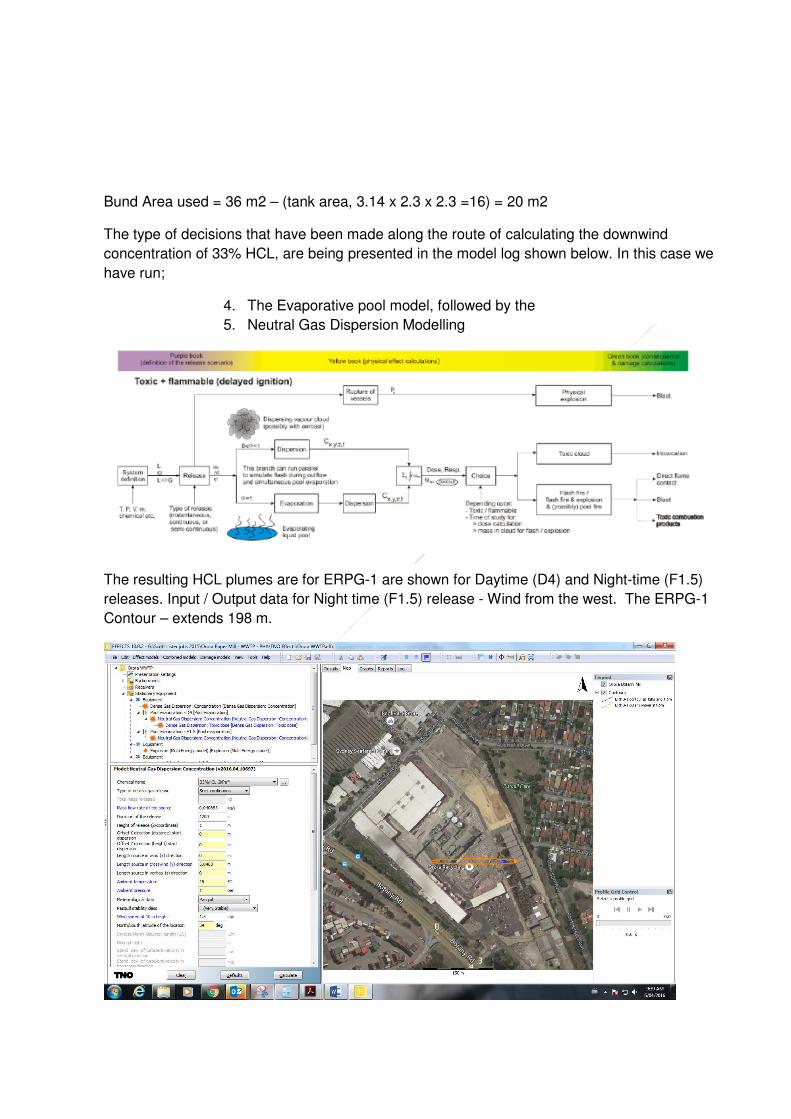
Bund Area used = 36 m2 – (tank area, 3.14 x 2.3 x 2.3 =16) = 20 m2
The type of decisions that have been made along the route of calculating the downwind
concentration of 33% HCL, are being presented in the model log shown below. In this case we
have run;
4. The Evaporative pool model, followed by the
5. Neutral Gas Dispersion Modelling
The resulting HCL plumes are for ERPG-1 are shown for Daytime (D4) and Night-time (F1.5)
releases. Input / Output data for Night time (F1.5) release - Wind from the west. The ERPG-1
Contour – extends 198 m.
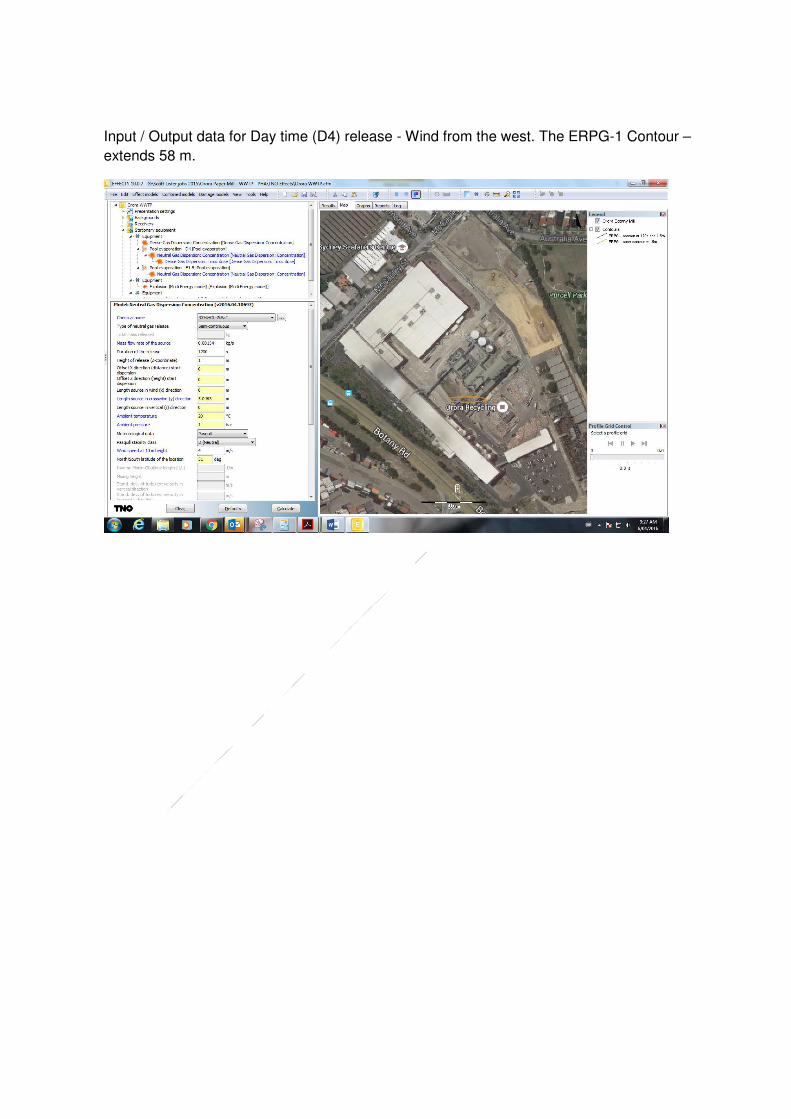
Input / Output data for Day time (D4) release - Wind from the west. The ERPG-1 Contour –
extends 58 m.
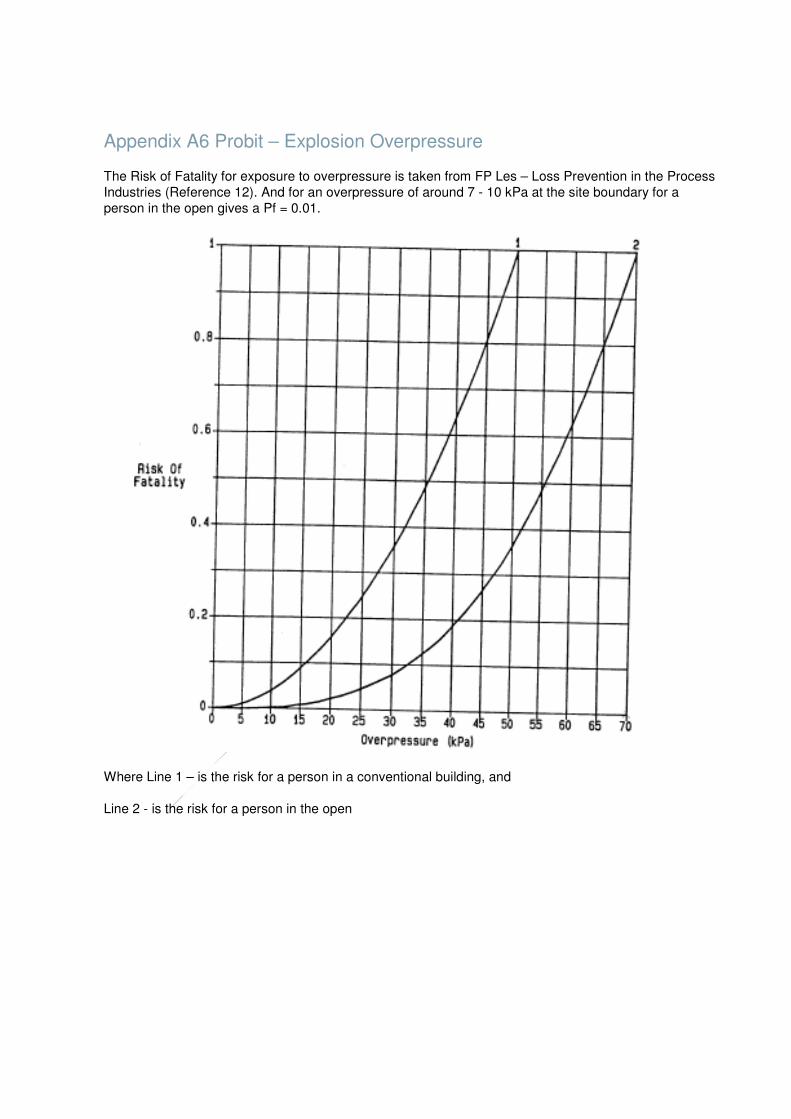
Appendix A6 Probit – Explosion Overpressure
The Risk of Fatality for exposure to overpressure is taken from FP Les – Loss Prevention in the Process
Industries (Reference 12). And for an overpressure of around 7 - 10 kPa at the site boundary for a
person in the open gives a Pf = 0.01.
Where Line 1 – is the risk for a person in a conventional building, and
Line 2 - is the risk for a person in the open
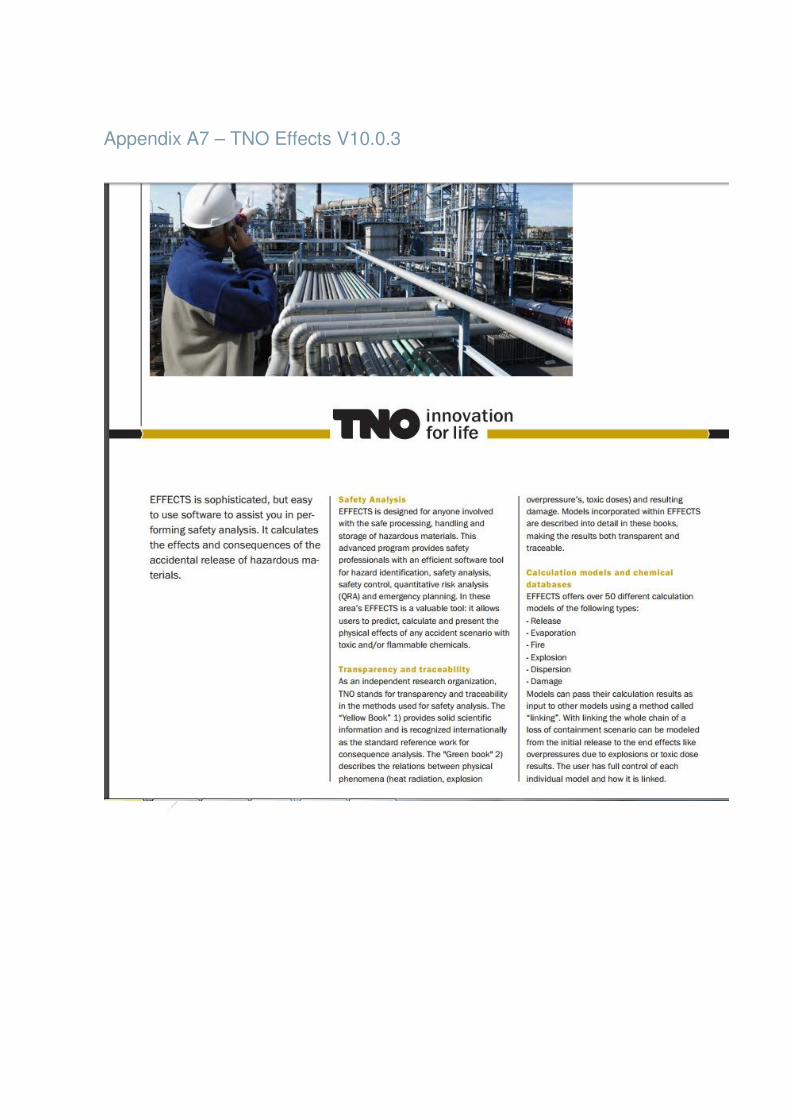
Appendix A7 – TNO Effects V10.0.3
CCHHEEMMIICCAALL EENNGGIINNEEEERRIINNGG TTRRAANNSSAACCTTIIOONNSS
VOL. 32, 2013
A publication of
The Italian Association of Chemical Engineering
www.aidic.it/cet Chief Editors: Sauro Pierucci, Jiří J. Klemeš Copyright © 2013, AIDIC Servizi S.r.l., ISBN 978-88-95608-23-5; ISSN 1974-9791
HazMat Liquid Release Following a Tank Truck Accident: Cross-Check Modelling and Field Data Validation
Tomaso Vairoa, Renato Pastorinob, Andrea P. Reverberic, Bruno Fabianob* a ARPAL – UTCR Grandi Rischi, via Bombrini 8 – 16149 Genoa, Italy b DICCA Civil, Chemical and Environmental Eng. Dept. – University of Genoa, via Opera Pia 15 – 16145 Genoa, Italy c DCCI Chemistry and Industrial Chemistry Dept.- University of Genoa, via Dodecaneso 31– 16145 Genoa, Italy *[email protected]
In this paper, after discussing QRA uncertainties connected to consequence modeling (release rates, evaporation, and dispersion), we consider an hazardous release of hydrochloric acid due to a loss of containment of a tank truck. Following the source term characterization, we applied widely used integral approaches, providing modeling for the combination of all physical phenomena involved after the release. The applicative phase of this work, representing its main appeal, is the validation of the simulation results against field data sets in the near field, directly collected during emergency response activities. More advanced modeling can be performed by a computational fluid dynamics method (CFD) to solve the Navier-Stokes equations, together with specific model equations. Quantitative conclusions are drawn about the cross-check validation performed. The comparison based on experimental data evidences the ability and limitations of the adopted models in estimating the actual post-release gas behavior, as well as the implications for hazard predictions that support decision makers in emergency planning and response.
1. Introduction
The science of process safety and risk analysis and related approaches require further progress, as illustrated by the sequence of major hazard accidents, e.g. in the downstream oil industry (Fabiano and Currò, 2012). Notwithstanding the use of risk assessment has become rather widespread and more decision making depends on it, as amply recognized the methodology produces still unsatisfactory results: choices, complexity, available computing time, limited knowledge and experience contribute all to unavoidable spread. Variance of outcomes of an analysis is high and can cover in some cases two orders of magnitude in risk, defined as the product of expected event frequency and likely damage. Many of the available consequence models are of the “integral” type, allowing many complex problems to be solved with limited input data. A specific cause of result spread is consequence modelling (release rates, evaporation, dispersion), while reliability of software forms a sector of science in itself (Pasman and Fabiano, 2008). Ditali et al. (2006) reported examples of how outcomes of pure physical models of release, vaporisation and dispersion can differ with at least a factor 2. Starting from it, in Table 1, some results are reproduced and updated with results modelled by EFFECTS 5.5 (TNO, The Netherlands) and PHAST, thus contributing to obtain an overall picture. Mean value and standard deviation are calculated as well, evidencing the significant output variability. The relative error of the near and far field estimation, by adopting suitable dispersion simulation, can be quantified in a first approximation as the sum of the relative error of the source term and of the dispersion model. In addition, damage probit parameters, based on dose-response rates obtained by experimental trials and actual accidents, are also object of much discussion. Furthermore, from one side the probit constants for a given toxic compound differ according to different authors, so that the extent of hazard range varies substantially (Fabiano and Pasman, 2010). From the other side, the knowledge of the fluctuations around the average concentration induced by turbulence is required for the accurate application of a toxicity model sensitive to the time dependence of the exposure.
97
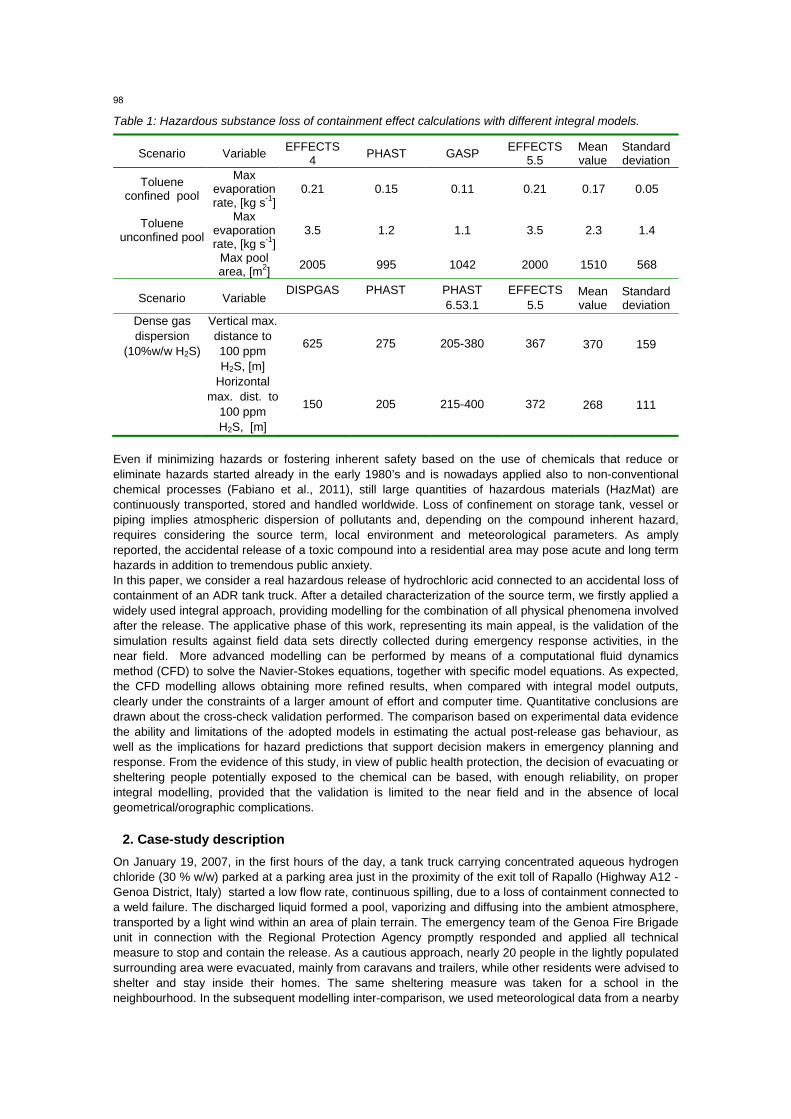
Table 1: Hazardous substance loss of containment effect calculations with different integral models.
Scenario Variable EFFECTS 4 PHAST GASP EFFECTS
5.5 Mean value
Standard deviation
Toluene confined pool
Max evaporation rate, [kg s-1]
0.21 0.15 0.11 0.21 0.17 0.05
Toluene unconfined pool
Max evaporation rate, [kg s-1]
3.5 1.2 1.1 3.5 2.3 1.4
Max pool area, [m2] 2005 995 1042 2000 1510 568
Scenario Variable DISPGAS PHAST PHAST
6.53.1 EFFECTS
5.5 Mean value
Standard deviation
Dense gas dispersion
(10%w/w H2S)
Vertical max. distance to 100 ppm H2S, [m]
625 275 205-380 367 370 159
Horizontal max. dist. to
100 ppm H2S, [m]
150 205 215-400 372 268 111
Even if minimizing hazards or fostering inherent safety based on the use of chemicals that reduce or eliminate hazards started already in the early 1980’s and is nowadays applied also to non-conventional chemical processes (Fabiano et al., 2011), still large quantities of hazardous materials (HazMat) are continuously transported, stored and handled worldwide. Loss of confinement on storage tank, vessel or piping implies atmospheric dispersion of pollutants and, depending on the compound inherent hazard, requires considering the source term, local environment and meteorological parameters. As amply reported, the accidental release of a toxic compound into a residential area may pose acute and long term hazards in addition to tremendous public anxiety. In this paper, we consider a real hazardous release of hydrochloric acid connected to an accidental loss of containment of an ADR tank truck. After a detailed characterization of the source term, we firstly applied a widely used integral approach, providing modelling for the combination of all physical phenomena involved after the release. The applicative phase of this work, representing its main appeal, is the validation of the simulation results against field data sets directly collected during emergency response activities, in the near field. More advanced modelling can be performed by means of a computational fluid dynamics method (CFD) to solve the Navier-Stokes equations, together with specific model equations. As expected, the CFD modelling allows obtaining more refined results, when compared with integral model outputs, clearly under the constraints of a larger amount of effort and computer time. Quantitative conclusions are drawn about the cross-check validation performed. The comparison based on experimental data evidence the ability and limitations of the adopted models in estimating the actual post-release gas behaviour, as well as the implications for hazard predictions that support decision makers in emergency planning and response. From the evidence of this study, in view of public health protection, the decision of evacuating or sheltering people potentially exposed to the chemical can be based, with enough reliability, on proper integral modelling, provided that the validation is limited to the near field and in the absence of local geometrical/orographic complications.
2. Case-study description
On January 19, 2007, in the first hours of the day, a tank truck carrying concentrated aqueous hydrogen chloride (30 % w/w) parked at a parking area just in the proximity of the exit toll of Rapallo (Highway A12 -Genoa District, Italy) started a low flow rate, continuous spilling, due to a loss of containment connected to a weld failure. The discharged liquid formed a pool, vaporizing and diffusing into the ambient atmosphere, transported by a light wind within an area of plain terrain. The emergency team of the Genoa Fire Brigade unit in connection with the Regional Protection Agency promptly responded and applied all technical measure to stop and contain the release. As a cautious approach, nearly 20 people in the lightly populated surrounding area were evacuated, mainly from caravans and trailers, while other residents were advised to shelter and stay inside their homes. The same sheltering measure was taken for a school in the neighbourhood. In the subsequent modelling inter-comparison, we used meteorological data from a nearby
98
station to run the models, so as to predict the average pollutant concentration, within the context of emergency planning.
2.1 Materials and Methods Hydrogen chloride is a colourless gas with a pungent odour, and has a vapour pressure of 42,200 hPa at 20°C and a water solubility of 823 g/L at 0°C. Its aqueous solution (hydrochloric acid) possesses strong acidity, and reacts with most metals producing explosive hydrogen gas. Hydrogen chloride is readily dissociated in water into hydrated protons and chloride ion. The physico-chemical properties indicate that hydrogen chloride released into the environment is distributed into air and water. Hydrochloric acid can pose a moderate to severe risk to users due to its predisposition to emit significant amounts of HCl fumes even with moderately dilute solutions. Inhalation exposure to high concentrations of HCl fumes may result in coughing, choking sensation, burning of the respiratory tract, and pulmonary edema (Proctor et al., 1991). Short-term exposure to airborne concentration up to 1.8 ppm did not cause irritation to the respiratory tract of sensitive asthmatic volunteers (Stevens et al. 1992). The American Industrial Hygiene Association (AIHA) lists the Emergency Response Planning Guideline – 1 (ERPG-1) for HCl to be about 3 parts per million (ppm); the ERPG-1 is the highest concentration where a worker can be exposed to it for up to an hour and have no perceivable negative consequences acute or chronic. The AIHA lists the Emergency Response Planning Guideline – 2 (ERPG-2) for hydrochloric acid to be 19 ppm. The ERPG-2 is a measurement of the highest concentration at which 1 hour of exposure will not cause permanent or life threatening injury. Finally, the National Institute for Occupational Safety and Health (NIOSH) has set the Immediately Dangerous to Life or Health (IDLH) limit for hydrochloric acid at 48 ppm. The IDLH is the minimum level at which life threatening or permanently debilitating injuries would occur immediately on exposure (ACGIH, 2001). Gaseous samples were taken on a triplicate basis and analyzed by different techniques. We use chemical tubes (Dreager, Aqua Air Industries, Louisiana, USA) to carry out a preliminary air testing. In addition to personal sampling, fixed-point sampling was carried out at a number of positions to determine the concentration of hazardous substances in the air at these positions and to compare the performance of different methods for sampling HCl. it was hoped that the results would give an indication of the likely inter-comparability of results obtained by the different methods. Airborne hydrogen chloride samples were collected according to the method n° 7903 (inorganic acids) (NIOSH, 1994) using a treated silica gel tube at a flow rate of 0.5 L/minute and subsequent analysis by ion chromatography. Each analysis was made in triplicate with the median of HCl measurements performed by the two methods not dissimilar especially in the immediate proximity of the source term.
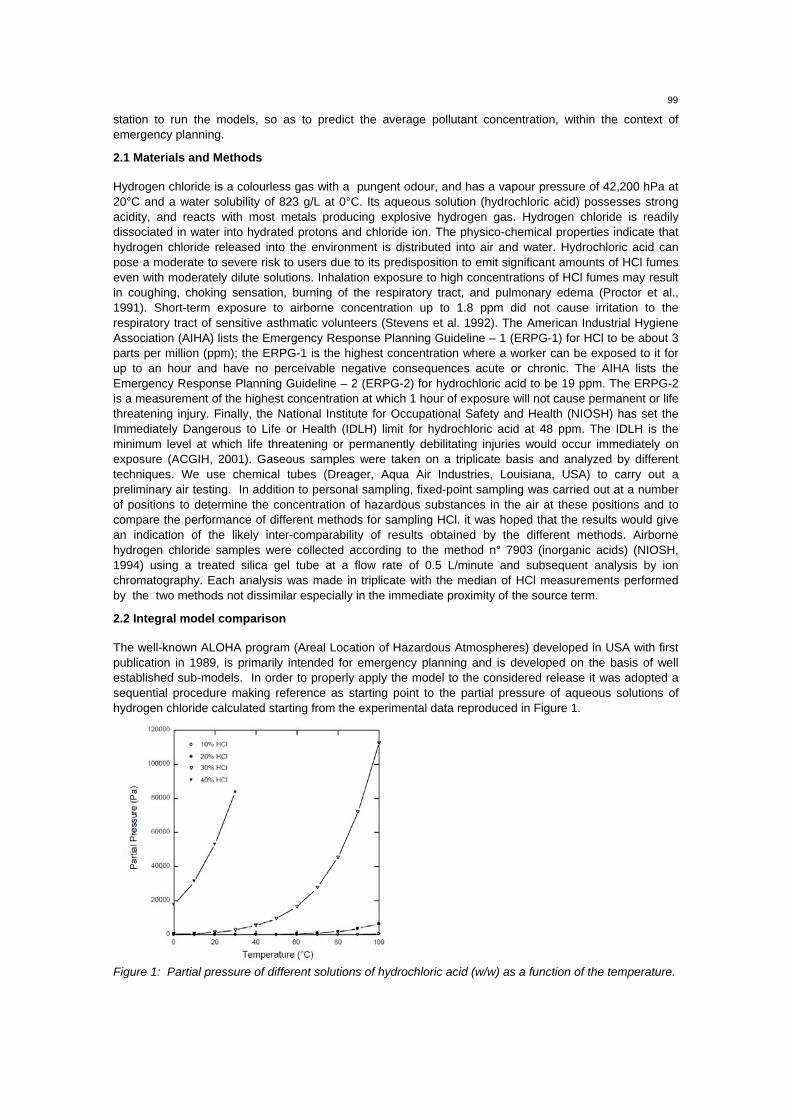
2.2 Integral model comparison The well-known ALOHA program (Areal Location of Hazardous Atmospheres) developed in USA with first publication in 1989, is primarily intended for emergency planning and is developed on the basis of well established sub-models. In order to properly apply the model to the considered release it was adopted a sequential procedure making reference as starting point to the partial pressure of aqueous solutions of hydrogen chloride calculated starting from the experimental data reproduced in Figure 1.
Figure 1: Partial pressure of different solutions of hydrochloric acid (w/w) as a function of the temperature.
99
Starting from the accidental event, we considered as the source term a circular pool resulting from field observation and proper definition of the pool spread according to Webber (1990). Following local and meteorological conditions were considered, according to BNL (Brookhaven National Laboratory): wind speed: 5 m/s ground temperature: 293 K atmospheric stability: class D relative humidity: 50% surface roughness: rural type cloudy conditions. The evaporation rate was calculated adopting eq. (1) (Kawamura and Mackay, 1985):
=RT
PMKAE VW
M (1)
where: E = evaporation rate kg/s; PV = vapour pressure, Pa A = pool area, m2; R = universal gas constant, 8314 J/kmol K; MW= molar mass ( HCl =36.5 kg/kmol); T = temperature, K. The mass transport coefficient of hydrochloric acid KM [m/s] was evaluated according to eq. (2) (Mackay and Matsugu 1973):
32919700480 ///M ScZu.K −= (2)
where: u = wind velocity at 10 m, m/s; SC = v/DM Z = pool diameter, m; v = air kinematic viscosivity, m2/s; The diffusivity in air, DM [m2/s] is evaluated by eq (3), (Thibodeaux 1996), starting from the water diffusivity DH2O = 2.4 · 10-5 m2/s at 281 K ,
MW
OHWOHM M
MDD 2
2= (3)
The second integral model utilized was EFFECTS 5.5, mainly based on the well-known Yellow Book (TNO, The Netherlands). The employed sub-model allowed direct evaluation of the dispersion from the evaporating pool. In addition, we performed also a calculation of the spread of hydrochloric liquid on ground, utilizing the suggested Webber model, solving a self similar pool surface profile. Comparing experimental evidence with calculated pool spread it was evidenced an overestimation by a large factor (ca. 30 %) of the pool spreading, even in the rather simplified geometry here considered. As a general observation, when dealing with small spills, the momentum of the falling liquid can become the driving factor in determining the spreading.
3. Results and discussion
It must be observed that the theory of pool evaporation adopted by the utilized models do not take into account the reduced vapour pressure of hydrophilic compounds in water.
0,001
0,01
0,1
1
10
100
1000
10000
0,001 0,01 0,1 1 10 100 1000 10000
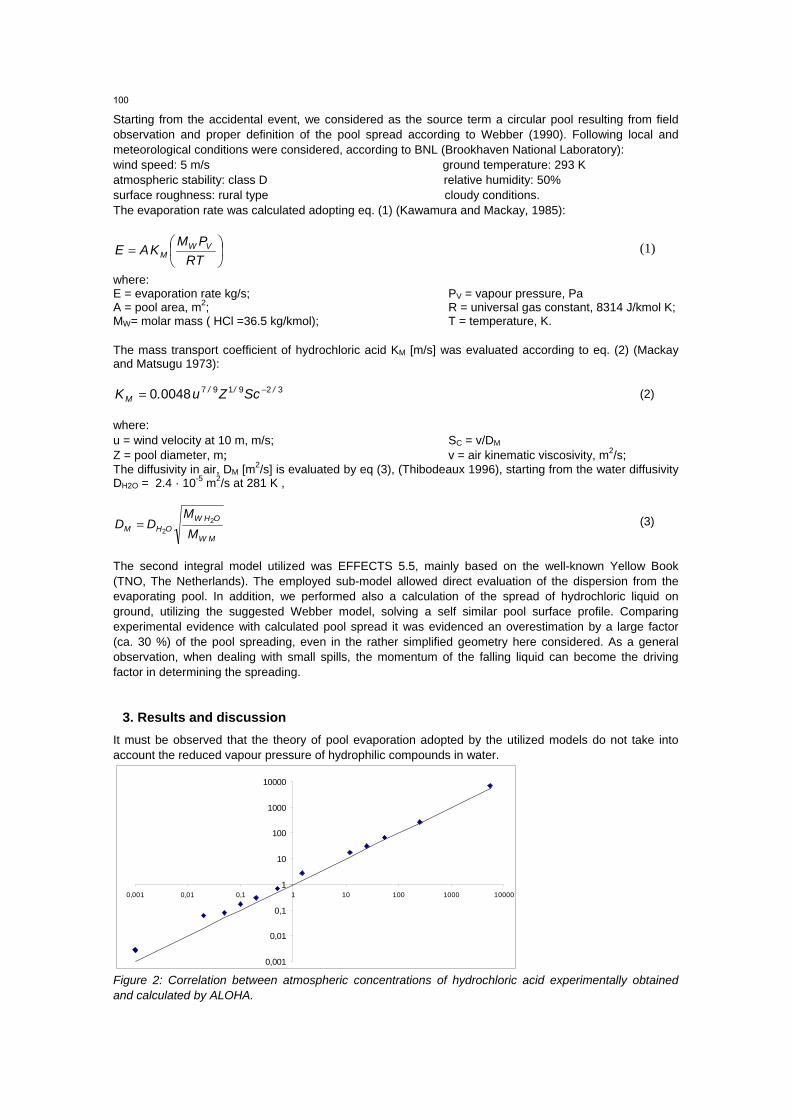
Figure 2: Correlation between atmospheric concentrations of hydrochloric acid experimentally obtained and calculated by ALOHA.
100
0,001
0,01
0,1
1
10
100
1000
10000
0,001 0,01 0,1 1 10 100 1000 10000
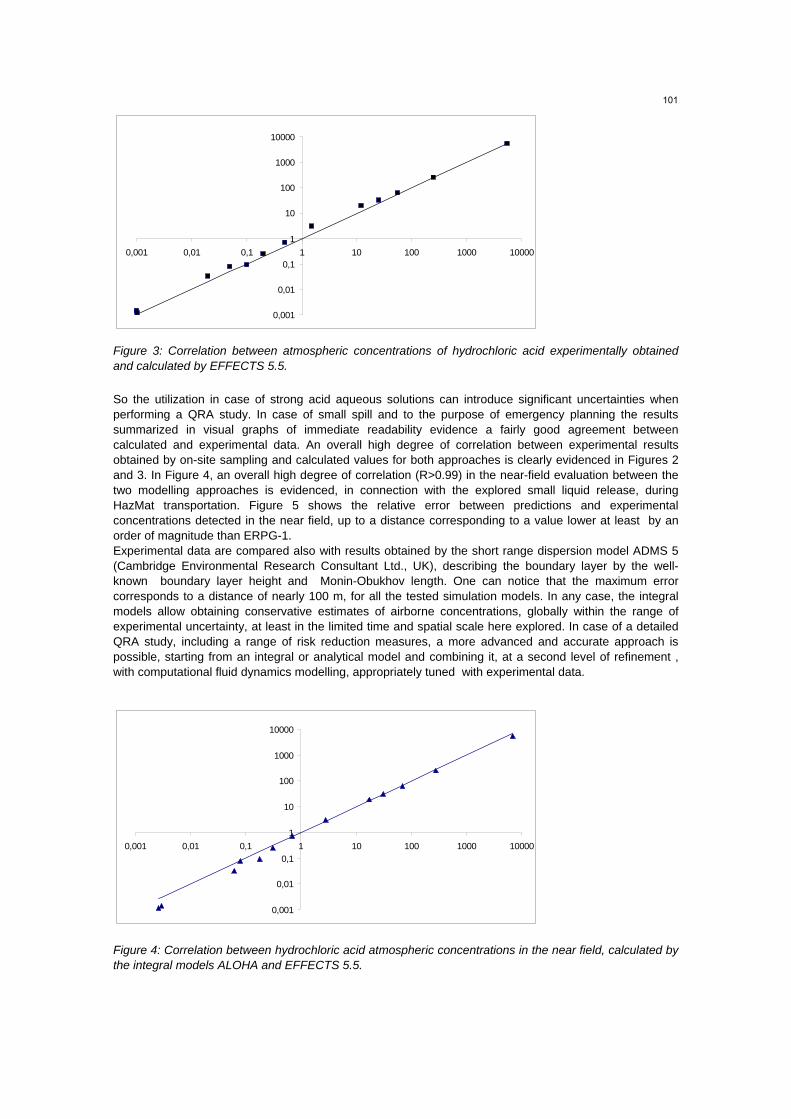
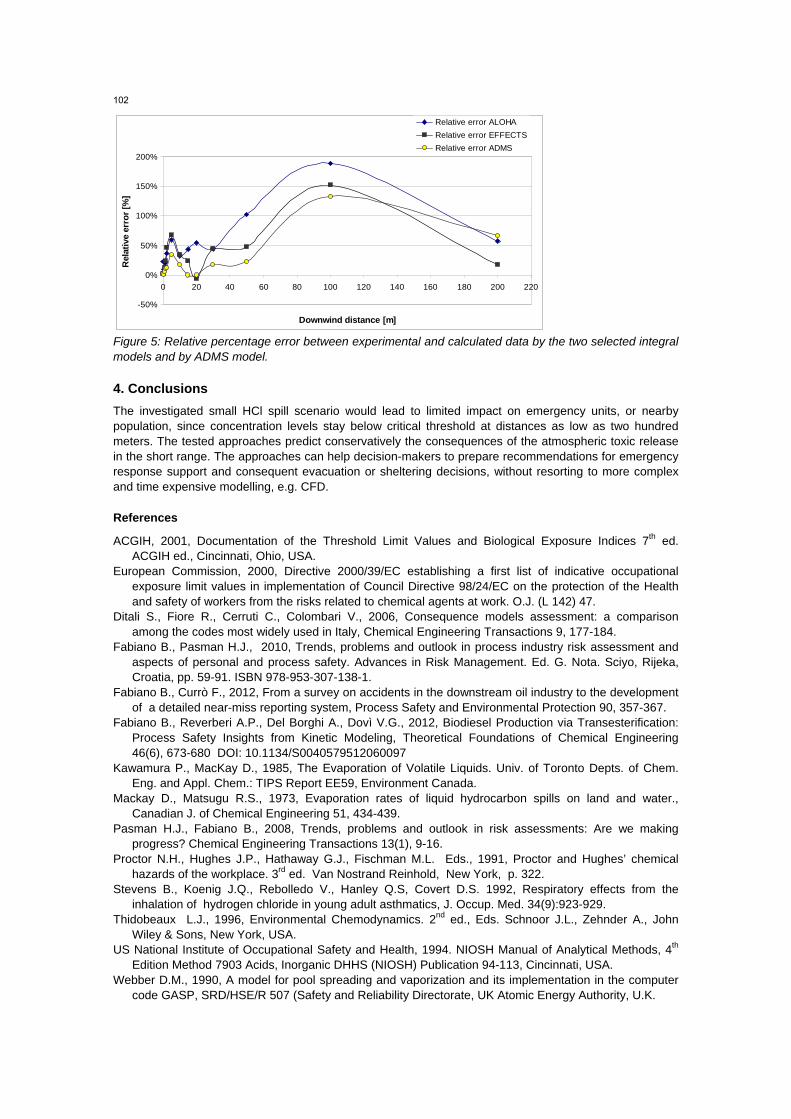
Figure 3: Correlation between atmospheric concentrations of hydrochloric acid experimentally obtained and calculated by EFFECTS 5.5. So the utilization in case of strong acid aqueous solutions can introduce significant uncertainties when performing a QRA study. In case of small spill and to the purpose of emergency planning the results summarized in visual graphs of immediate readability evidence a fairly good agreement between calculated and experimental data. An overall high degree of correlation between experimental results obtained by on-site sampling and calculated values for both approaches is clearly evidenced in Figures 2 and 3. In Figure 4, an overall high degree of correlation (R>0.99) in the near-field evaluation between the two modelling approaches is evidenced, in connection with the explored small liquid release, during HazMat transportation. Figure 5 shows the relative error between predictions and experimental concentrations detected in the near field, up to a distance corresponding to a value lower at least by an order of magnitude than ERPG-1. Experimental data are compared also with results obtained by the short range dispersion model ADMS 5 (Cambridge Environmental Research Consultant Ltd., UK), describing the boundary layer by the well-known boundary layer height and Monin-Obukhov length. One can notice that the maximum error corresponds to a distance of nearly 100 m, for all the tested simulation models. In any case, the integral models allow obtaining conservative estimates of airborne concentrations, globally within the range of experimental uncertainty, at least in the limited time and spatial scale here explored. In case of a detailed QRA study, including a range of risk reduction measures, a more advanced and accurate approach is possible, starting from an integral or analytical model and combining it, at a second level of refinement , with computational fluid dynamics modelling, appropriately tuned with experimental data.
0,001
0,01
0,1
1
10
100
1000
10000
0,001 0,01 0,1 1 10 100 1000 10000
Figure 4: Correlation between hydrochloric acid atmospheric concentrations in the near field, calculated by the integral models ALOHA and EFFECTS 5.5.
101
-50%
0%
50%
100%
150%
200%
0 20 40 60 80 100 120 140 160 180 200 220
Downwind distance [m]
Rel
ativ
e er
ror
[%]
Relative error ALOHARelative error EFFECTSRelative error ADMS
Figure 5: Relative percentage error between experimental and calculated data by the two selected integral models and by ADMS model.
4. Conclusions
The investigated small HCl spill scenario would lead to limited impact on emergency units, or nearby population, since concentration levels stay below critical threshold at distances as low as two hundred meters. The tested approaches predict conservatively the consequences of the atmospheric toxic release in the short range. The approaches can help decision-makers to prepare recommendations for emergency response support and consequent evacuation or sheltering decisions, without resorting to more complex and time expensive modelling, e.g. CFD.
References
ACGIH, 2001, Documentation of the Threshold Limit Values and Biological Exposure Indices 7th ed. ACGIH ed., Cincinnati, Ohio, USA.
European Commission, 2000, Directive 2000/39/EC establishing a first list of indicative occupational exposure limit values in implementation of Council Directive 98/24/EC on the protection of the Health and safety of workers from the risks related to chemical agents at work. O.J. (L 142) 47.
Ditali S., Fiore R., Cerruti C., Colombari V., 2006, Consequence models assessment: a comparison among the codes most widely used in Italy, Chemical Engineering Transactions 9, 177-184.
Fabiano B., Pasman H.J., 2010, Trends, problems and outlook in process industry risk assessment and aspects of personal and process safety. Advances in Risk Management. Ed. G. Nota. Sciyo, Rijeka, Croatia, pp. 59-91. ISBN 978-953-307-138-1.
Fabiano B., Currò F., 2012, From a survey on accidents in the downstream oil industry to the development of a detailed near-miss reporting system, Process Safety and Environmental Protection 90, 357-367.
Fabiano B., Reverberi A.P., Del Borghi A., Dovì V.G., 2012, Biodiesel Production via Transesterification: Process Safety Insights from Kinetic Modeling, Theoretical Foundations of Chemical Engineering 46(6), 673-680 DOI: 10.1134/S0040579512060097
Kawamura P., MacKay D., 1985, The Evaporation of Volatile Liquids. Univ. of Toronto Depts. of Chem. Eng. and Appl. Chem.: TIPS Report EE59, Environment Canada.
Mackay D., Matsugu R.S., 1973, Evaporation rates of liquid hydrocarbon spills on land and water., Canadian J. of Chemical Engineering 51, 434-439.
Pasman H.J., Fabiano B., 2008, Trends, problems and outlook in risk assessments: Are we making progress? Chemical Engineering Transactions 13(1), 9-16.
Proctor N.H., Hughes J.P., Hathaway G.J., Fischman M.L. Eds., 1991, Proctor and Hughes’ chemical hazards of the workplace. 3rd ed. Van Nostrand Reinhold, New York, p. 322.
Stevens B., Koenig J.Q., Rebolledo V., Hanley Q.S, Covert D.S. 1992, Respiratory effects from the inhalation of hydrogen chloride in young adult asthmatics, J. Occup. Med. 34(9):923-929.
Thidobeaux L.J., 1996, Environmental Chemodynamics. 2nd ed., Eds. Schnoor J.L., Zehnder A., John Wiley & Sons, New York, USA.
US National Institute of Occupational Safety and Health, 1994. NIOSH Manual of Analytical Methods, 4th Edition Method 7903 Acids, Inorganic DHHS (NIOSH) Publication 94-113, Cincinnati, USA.
Webber D.M., 1990, A model for pool spreading and vaporization and its implementation in the computer code GASP, SRD/HSE/R 507 (Safety and Reliability Directorate, UK Atomic Energy Authority, U.K.
102