Embed Size (px)
Citation preview
Oropharyngeal (Oral) Cancer Statistics in Virginia - Maps
July 2011 4
Oropharyngeal (Oral) Cancer Statistics in Virginia - Maps
July 2011 5
Oropharyngeal (Oral) Cancer Statistics in Virginia - Maps
July 2011 6
Oropharyngeal (Oral) Cancer Statistics in Virginia - Maps
July 2011 7
Oropharyngeal (Oral) Cancer Statistics in Virginia - Notes
July 2011 8
Sources: Incidence and percent local staging (VA Cancer Registry); mortality (VDH Division of Health Statistics); risk factor prevalence (Behavioral Risk Factor
Surveillance System).
1 Based on combined 2004-2008 data. Rates are age- adjusted to the 2000 U.S. standard population. Districts are ranked in terms of incidence rates from highest (=1) to
lowest (=35). Districts with lower rankings (i.e. higher incidence rates) are at greater risk.
Source for national rate: Howlader N, Noone AM, Krapcho M, Neyman N, Aminou R, Waldron W, Altekruse SF, Kosary CL, Ruhl J, Tatalovich Z, Cho H, Mariotto A,
Eisner MP, Lewis DR, Chen HS, Feuer EJ, Cronin KA, Edwards BK (eds). SEER Cancer Statistics Review, 1975-2008, National Cancer Institute. Bethesda, MD,
http://seer.cancer.gov/csr/1975_2008/, based on November 2010 SEER data submission, posted to the SEER web site, 2011. Based on combined data from 2004-2008.
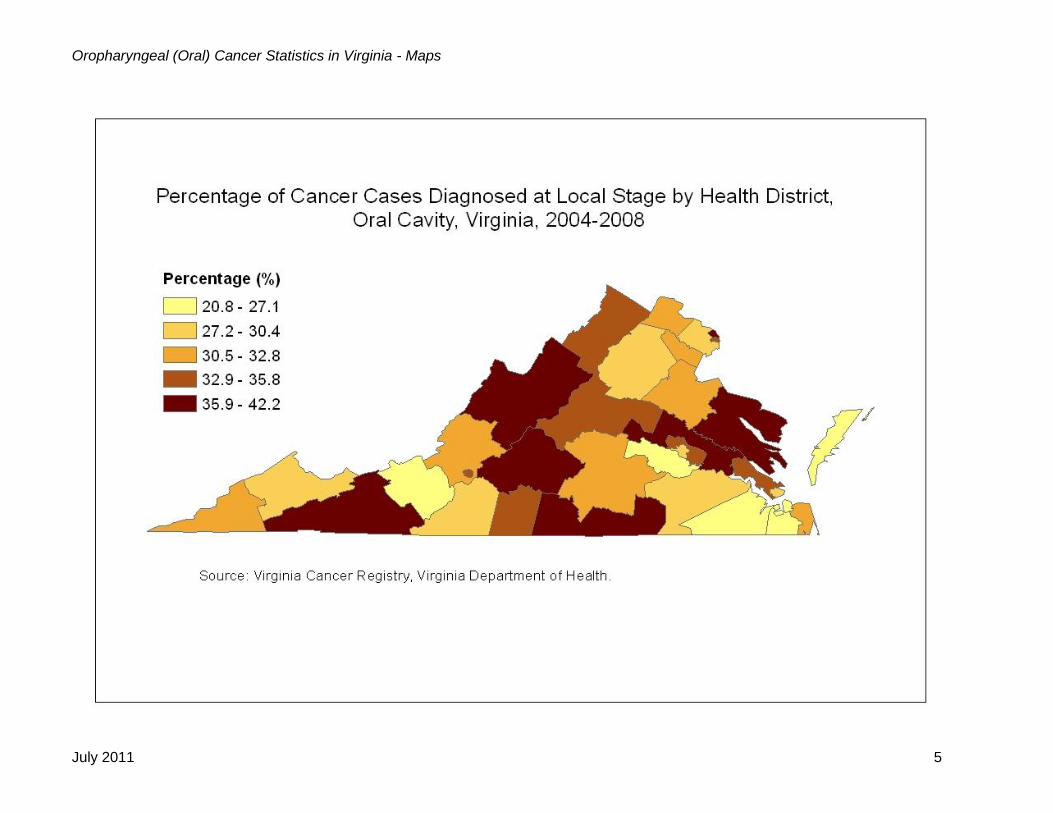
Rates are age-adjusted to the 2000 U.S. standard population. 2 Based on combined 2004-2008 data. Percentage of Local Stage cancers are reported using the Summary Staging System. Districts are ranked in terms of percentage of
cases diagnosed early (local) from lowest (=1) to highest (=35). Districts with lower rankings (i.e. lower early stage percentages) are at greater risk.
Source for national average: Howlader N, Noone AM, Krapcho M, Neyman N, Aminou R, Waldron W, Altekruse SF, Kosary CL, Ruhl J, Tatalovich Z, Cho H, Mariotto
A, Eisner MP, Lewis DR, Chen HS, Feuer EJ, Cronin KA, Edwards BK (eds). SEER Cancer Statistics Review, 1975-2008, National Cancer Institute. Bethesda, MD,
http://seer.cancer.gov/csr/1975_2008/, based on November 2010 SEER data submission, posted to the SEER web site, 2011. Based on combined data from 2001-2007. 3 Based on combined 2005-2009 data. Rates are age- adjusted to the 2000 U.S. standard population. Districts are ranked in terms of mortality rates from highest (=1) to
lowest (=35). Districts with lower rankings (i.e. higher mortality rates) are at greater risk.
Source for national rate: Xu JQ, Kochanek KD, Murphy SL, Tejada-Vera B. Deaths: Final data for 2007. National vital statistics reports; vol 58 no 19. Hyattsville, MD:
National Center for Health Statistics. 2010. Available from: http://www.cdc.gov/nchs/data/nvsr/nvsr58/nvsr58_19.pdf. National rate is the 2007 age-adjusted rate, which
is comparable to the state five-year interval midpoint.
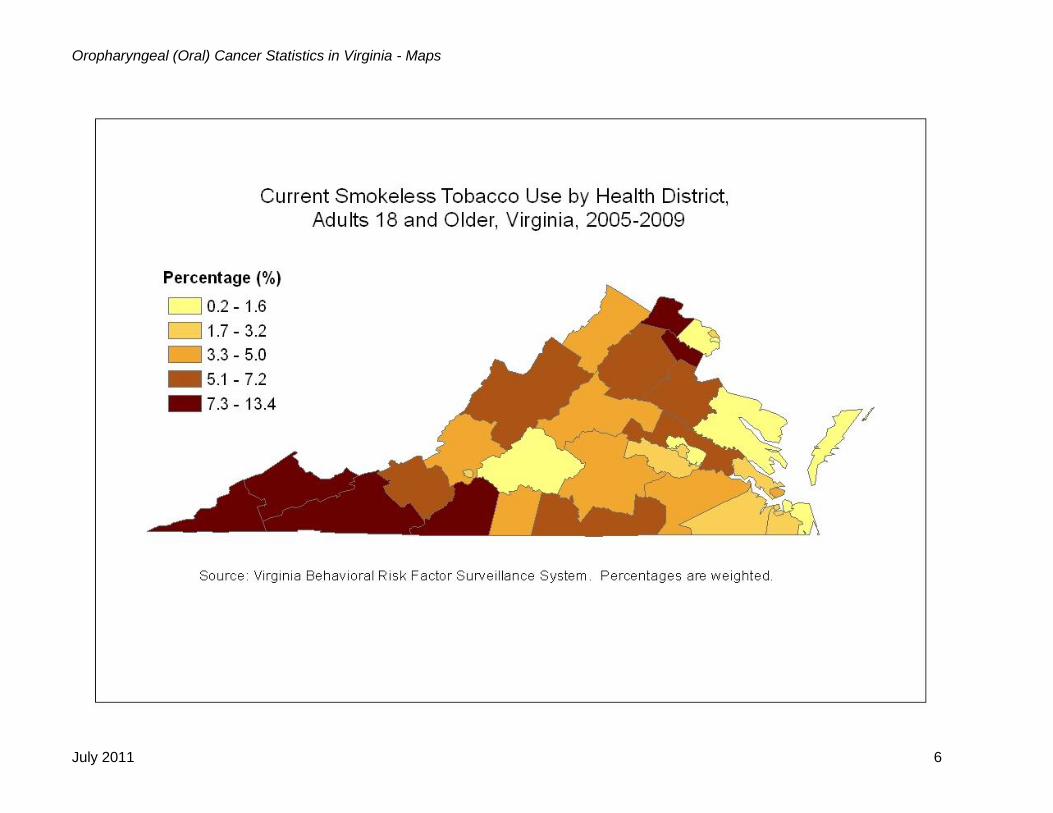
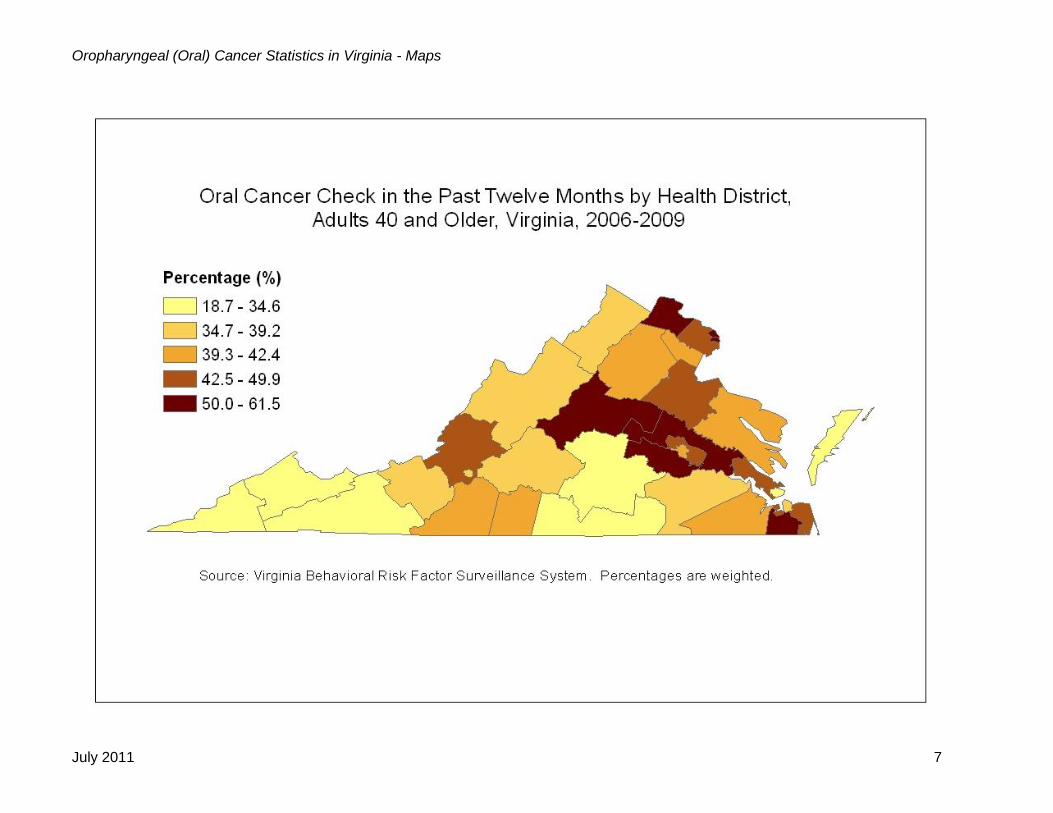
~Mortality rate is not reported if 25 or fewer deaths. 4 Behavioral Risk Factor Surveillance System is a national telephone survey of adults 18+. District and state estimates are based on 2005 and 2009 (pooled) data for
smokeless tobacco use and on 2006 and 2009 (pooled) data for oral cancer screening. Percentages are population-weighted. Corresponding national comparisons not
available.
Smokeless Tobacco Use = Percentage of adults 18+ years reporting currently using smokeless tobacco.
Districts are ranked in terms of prevalence of smokeless tobacco use from highest (=1) to lowest (=35). Districts with lower rankings (i.e. higher smokeless tobacco use)
are at greater risk.
Oral Cancer Screening = Percentage of adults age 40+ reporting an oral cancer check by a doctor or dentist within the past 12 months.
Districts are ranked in terms of oral cancer screening prevalence from lowest (=1) to highest (=35). Districts with lower rankings (i.e. lower oral cancer screening
prevalence) are at greater risk 5 Summary score is computed by adding rank score for incidence, local staging, screening prevalence (oral cancer screening), and risk factor prevalence (smokeless
tobacco use). Lower score indicates higher risk.
Top five districts with the highest risk (i.e. lowest rank) are highlighted.
Maps illustrate rates or percentages in quantiles. Mortality map for oral cancer is not presented due to low mortality numbers.
This publication was supported by the Cooperative Agreement Number #5U58DP000780 from the Centers for Disease Control and Prevention. Its contents are solely the responsibility of the authors and do not necessarily represent official views of the Centers for Disease Control and Prevention.