Embed Size (px)
Citation preview

ANNUAL REPORT2018
For
per
sona
l use
onl
y

2
For
per
sona
l use
onl
y

Contents
Overview
4 Highlights 2017-2018
6 Letter from the Chair
8 Orocobre at a glance
9 Where we are
10 Corporate Strategy
12 Sustainability & Our Communities
Operating & Financial Review
15 Performance Overview
18 Assets Overview
24 Olaroz Lithium Facility & the Lithium Market
28 Borax Argentina S.A. & the Borates Market
34 Advantage Lithium & Cauchari JV
36 Health, Safety & Community
Directors’ Report
39 Executive Leadership Team
48 Remuneration Report
65 Auditor’s Independence Declaration
66 Corporate Governance Statements
Financial Report
69 Financial Statements
121 Directors’ Declaration
122 Independent Auditor’s Report
Additional Information
128 Resources & Reserves
138 Schedule of Tenements
Shareholder & ASX Information
146 Shareholder Information
153 Corporate Directory
OROCOBRE ANNUAL REPORT 2018 3
For
per
sona
l use
onl
y
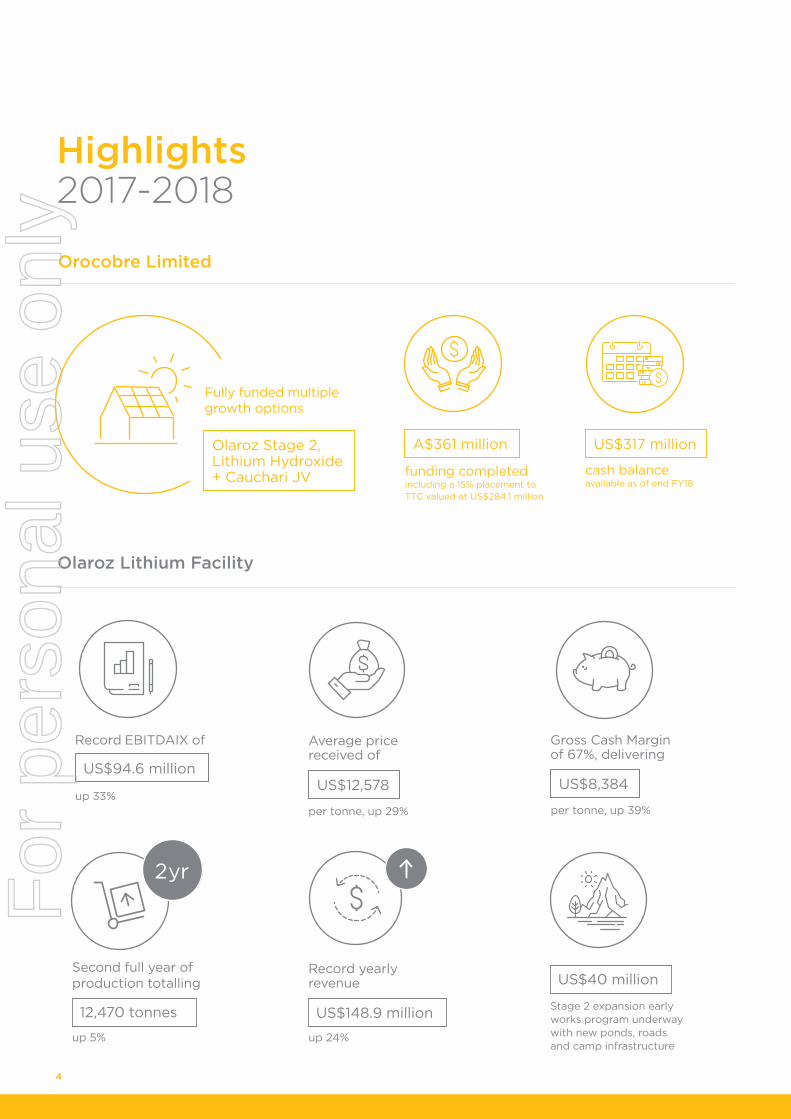
Highlights 2017-2018
funding completed including a 15% placement to TTC valued at US$284.1 million
cash balance available as of end FY18
A$361 million US$317 million
Fully funded multiple growth options
Olaroz Stage 2, Lithium Hydroxide + Cauchari JV
Second full year of production totalling
2yr
Gross Cash Margin of 67%, delivering
Record yearly revenue
US$148.9 million
US$40 million
12,470 tonnes
up 5% up 24%
Record EBITDAIX of Average price received of
up 33%per tonne, up 29% per tonne, up 39%
US$94.6 millionUS$12,578 US$8,384
Stage 2 expansion early works program underway with new ponds, roads and camp infrastructure
Olaroz Lithium Facility
Orocobre Limited
4
For
per
sona
l use
onl
y

at both Tincalayu and the Boric Acid plant at Campo Quijano
potential expansion
An expansion study to evaluate
Significant potential for additional
of the inferred resource to 3 Mt Lithium Carbonate Equivalent (LCE) at Cauchari
has commenced to upgrade the inferred resource and measured and indicated resources for the Feasibility Study
A study was completed by Advantage Lithium in accordance with Canadian standards and
to Feasibility Study level investigations which are expected to be completed in June quarter 2019
the project has advanced
resource expansion
Phase III drilling
Record production Plant & Equipment
+6-fold increase
Cauchari Joint Venture
Borax Argentina S.A.
of the Tincalayu refined borates operation is currently underway
written down to nil value recognising financial performance
at depth
OROCOBRE ANNUAL REPORT 2018 5
For
per
sona
l use
onl
y

Dear Fellow Shareholder,
I am pleased to report that the 2018 financial year (FY18) has been another watershed year in Orocobre’s vision to become a leading and sustainable global supplier of high grade, high value lithium chemicals.
The end of FY18 saw Orocobre in a strong financial, strategic and operational position. Sales de Jujuy S.A. (SDJ), the operator of the Olaroz Lithium Facility (Olaroz), increased total sales revenue by 24% to US$148.9 million (on a 100% basis) from production of 12,470 tonnes of lithium carbonate.
For the full financial year, Orocobre recorded a statutory net profit after tax from continuing operations of US$1.9 million (FY17: US$4.6 million) which was impacted by non-cash foreign currency losses, asset impairment write-downs and additional deferred tax expense resulting from changes to tax law in Argentina.
Our balance sheet is strong with available cash of US$316.7 million and net cash of US$229 million after deducting Orocobre’s share of project debt. Our operations continue to generate strong operating cashflow ensuring we are funded to achieve all our growth plans. Market fundamentals for lithium chemicals also remain strong.
In January 2018 we welcomed Toyota Tsusho Corporation (TTC) to our register as a 15% shareholder when we conducted a strategic placement and rights issue which raised US$284.1 million (updated from US$282.4 million due to FX effect). This capital
raising placed Orocobre on a sound financial footing and ensures that subject to Board and joint venture partner approvals the Stage 2 Olaroz expansion and Naraha Lithium Hydroxide Plant are both fully funded.
Orocobre continues to expand its operational capabilities at Olaroz, leveraging lessons learned through its first two years of commercial production. Following the adverse weather conditions during FY18 which resulted in production shortfalls, we are developing methods to better manage and mitigate climate impacts on our operations. These will be incorporated into Stage 2 design to optimise future production.
Olaroz finished the year on a high with production for the June quarter the second highest on record at 3,596 tonnes of lithium carbonate.
We have an exciting few years ahead of us as we deliver our growth projects with TTC who have proven to be an excellent joint venture partner and who share our vision for Olaroz and approach to sustainability. Early works have already commenced on the 25,000 tonnes per annum (tpa) Stage 2 expansion of Olaroz with new ponds, roads and camp infrastructure. In addition, plans are well advanced for the 10,000 tpa Naraha Lithium Hydroxide Plant to be built in Japan. These two projects will not only
Letter from the Chair
The end of FY18 saw Orocobre in a strong financial, strategic and operational position.
“
6
For
per
sona
l use
onl
y

significantly increase the scale of our business but also diversify our product range to ensure we are well placed to benefit from future lithium battery market growth.
The strategy to pass the parallel development of the Cauchari Joint Venture Project to Advantage Lithium has been well rewarded. An updated resource estimate for the project was released during the June quarter detailing a +6-fold increase of the inferred resource to 3.0 Mt Lithium Carbonate Equivalent. The updated resource covers a significantly larger brine resource area of 92.6 km2 and extends to greater depths, with potential for additional resource expansion. The brine has excellent chemistry for processing with a Mg/Li ratio of 2.5, which is very similar to the Olaroz operation. A Preliminary Economic Assessment has been released and a Feasibility Study is expected to be completed by early 2019. Orocobre maintains an effective 46% interest in the project through the joint venture and its shareholding in Advantage Lithium.
While Borax Argentina S.A. (Borax) improved its performance in FY18, low product prices throughout the year and the poor Brazilian economic environment continued to affect the financial results. In recognition of this we have taken the decision to write-down the value of plant and equipment at Borax to nil. To enable continuous improvement despite these external pressures, Borax maintains its focus on customer and product development and improved operational performance.
The safety and well-being of our staff remains our number one priority.
As of 30 June 2018 the Borax Sijes mine reported 1021 days of operation without a Lost Time Injury, a major milestone for Borax. Both SDJ and Borax continued to strengthen employee safety with thorough risk assessment and training courses helping to reinforce the importance of our robust safety culture.
Effective environmental, social and governance performance is integral to the sustainability of our operations and the success of Orocobre. Our goals and achievements in this area were set out in our inaugural Sustainability Report in 2017. In 2018 both SDJ and Borax gained recertification for their Integrated Quality, Environment, Health and Safety Management System (ISO9001/ISO14001/OHSAS18001), a testament to our commitment to protecting the wellbeing of our people, production processes and the environment.
I am also pleased to report that in 2018 we joined the United Nations Global Compact, which we believe will complement our existing involvement with the activities of the World Business Council for Sustainable Development in Argentina (CEADS). Involvement with the Global Compact reinforces our focus and commitment to best practice with regards to anti-corruption, environment, human rights, and labour practices. This also supports the alignment of our activities with the broader UN Sustainable Development Goals.
With expansion activities at Olaroz generating additional opportunities for direct and indirect employment, this past year has heralded significant growth and
development opportunities for our local communities. Orocobre now employs over 285 people from the local communities (52% of our total workforce, 43% of our SDJ workforce), with an additional 250 people employed indirectly through our local contractors and suppliers. We are continuing to deliver support and development programs across our local communities in accordance with the five pillars of our shared value strategy: education, empowerment, transparency, natural resources and production, and health. We look forward to sharing greater detail of these programs in the 2018 Sustainability Report.
Orocobre is the only ASX listed company producing high grade, high value lithium chemicals for the growing global battery and technical markets. We continue to progress our growth and expansion strategies to fully leverage our low-cost, high-margin lithium chemical operations.
I would like to express my appreciation to the management team and staff in both Australia and in Argentina, our joint venture partners, TTC and the Jujuy Government, and my colleagues on the board. I reserve my final thanks to our shareholders for your patience and support on the Orocobre journey. We look forward to keeping you updated in 2019.
Robert Hubbard Chair of the Orocobre Board August 2018
OROCOBRE ANNUAL REPORT 2018 7
For
per
sona
l use
onl
y

Orocobre is a dynamic global lithium chemicals supplier and an established producer of boron.
The key assets of Orocobre Limited (the Company or the Group) are the Olaroz Lithium Facility, the boron mines and processing facilities of Borax Argentina S.A., the Cauchari Lithium Project Joint Venture and our 33.5% investment in Advantage Lithium. All of our operations are located in northern Argentina.
The Company’s lithium assets at Olaroz are owned and held by Argentine company, Sales de Jujuy S.A. (SDJ) (ORE 66.5%) and contain those properties associated with the Olaroz Lithium Facility. Orocobre’s partners in SDJ are Toyota Tsusho Corporation (TTC) (25%) and Jujuy Energia y Minera Sociedad del Estado (JEMSE) (8.5%).
The Company holds a 25% interest in the Cauchari Lithium Project Joint Venture with Advantage Lithium Corp (TSXV:AAL). On July 2, 2018 the Cauchari Joint Venture inferred resource was officially upgraded with the release of a NI43-101 Technical Report. The report increased the inferred resource’s size 6-fold, to 3.02 million tonnes of Lithium Carbonate Equivalent (LCE).
The Company’s boron mineral assets are held through its 100% owned subsidiary, Borax Argentina S.A.
Orocobre at a glance
8
For
per
sona
l use
onl
y

Olaroz
Cauchari25% JV
Sijes - Santa RosaSijes Plant
Ratones
Tincalayuand Plant
CampoQuijano
20KM
SAN SALVADORDE JUJUY
SAN ANTONIODE LOS COBRE
OLACAPATO
SALTA
Diablillos
Argentina
PorvenirPlant not in operation
Orocobre Lithium Projects
Advantage Lithium Projects
Borax Argentina Plants
Borax Argentina Mines/Projects
Road Access to Projects
LEGEND
Where we are
OROCOBRE ANNUAL REPORT 2018 9
For
per
sona
l use
onl
y

Corporate Strategy
Value chain
• Quality assurance
• Supply chain management
Long-term outlook
• Active risk management
• Stakeholder relations
Communities
• Community empowerment• Community investment
• Human rights
Meet growing demand through sustainable development
• Grow supply in a sustainable, enduring way
• Deliver quality products that meet client-specific requirements
• Ensure an ethical and responsible supply chain
Create long-term value for shareholders
• Maximise the long-term value of the project through staged expansions and prudent financing and investment
• Develop and maintain strong, strategic partnerships
• Consider interests of all stakeholders
Ensure long and lasting benefits to communities
• Drive community empowerment and integration
• Invest in and deliver collective and individual benefits to our communities
• Improve the quality of life in our communities
1
1
2
2
3
3
Our Corporate Strategy is centred on six strategic priorities and a corresponding set of objectives. The priority areas are mutually dependent and no objective can be achieved in isolation. Ongoing focus and commitment to each and every component of this strategy is critical to our success. Orocobre’s Sustainability focus areas, directly aligned to our Strategic priorities and objectives, were defined as part of a broader materiality process and enable us to more effectively manage, measure, monitor and communicate our sustainability performance.
Sustainability Focus Areas
Corporate Strategic Priorities and Objectives
10
For
per
sona
l use
onl
y

Environment
• Impact of climate• Energy and emissions• Water management and quality• Waste management• Biodiversity
People and capability
• Training and development• Satisfaction and retention• Innovation• Collaboration
• Continuous improvement
Culture
• Culture management• Health and safety• Reporting, Analysis and Action
Optimise environmental outcomes
• Optimise lithium recovery through the system overall
• Promote natural resource efficiency and productivity
• Ensure responsible land use and rehabilitation
Develop our people and capability
• Commit to personal and professional development
• Inspire, value and retain our people• Be at the forefront of innovation
and technology• Share knowledge and collaborate
across departments• Drive operational excellence
through continuous improvement
Prioritise safety
• Continuously improve safety performance
• Embed a safety focussed workforce culture
4
4
5
5
6
6
OROCOBRE ANNUAL REPORT 2018 11
For
per
sona
l use
onl
y

Respecting and prioritising people and environment, Orocobre produces minerals that enable the global transition to a clean energy future, while socially and economically empowering communities in the regions where we operate.
We have been delivering collaborative social and environmental programs in our local communities for years, and have a deep respect for the people and the land around our operations.
Our pursuit of best practice operations ensures a strong focus on social and environmental performance. We are proud of the achievements we have made to date, but we acknowledge there is always opportunity to improve and we are committed to that process.
In our corporate sustainability report we provide detailed information about our engagement with communities,
our relationship with the environment, our management of natural resources, our responsiveness to our customers, and the development, support and safety of our people, suppliers and communities.
As a signatory to the UN Global Compact we respect and support the 10 principles across Environment, Labour, Human Rights and Anti-Corruption and are committed to monitoring, managing and communicating our contribution to society and to the UN Sustainable Development Goals (UN SDGs) over the years ahead.
Sustainability
12
For
per
sona
l use
onl
y

San Antonio de los Cobres
Olaroz Lithium Facility
Community
Towns
Road Accessto Projects
Orocobre Lithium Projects
LEGEND
Susques
Pastos Chicos
San Juan Quillayes
Coranzuli
El Toro
Olaroz Chico
Jama
Catua
Huancar
Puesto Sey
Cobres
Chile
Jujuy212km
Purmamarca
Casabindo
Abra Pampa
Salar de Pocitos Santa Rosa
de los Pastos Grandes
Reserva Nacional Los Flamercos
Santa Rosa de Tastil
Our Communities
OROCOBRE ANNUAL REPORT 2018 13
For
per
sona
l use
onl
y

Operating & Financial Review
14
For
per
sona
l use
onl
y

To assist readers to better understand the financial results of the Company, the financial information in this Operating and Financial Review includes non-IFRS financial information.
The Olaroz Joint Venture is operated through SDJ a 91.5% owned subsidiary of Sales de Jujuy Pte. Ltd (SDJ Pte), a Singaporean company in which both Orocobre (72.68%) and TTC (27.32%) are shareholders directly and indirectly respectively. The effective Olaroz Lithium Facility equity interest is Orocobre 66.5%, TTC 25.0% and Jujuy Energia y Minera Sociedad del Estado (JEMSE) 8.5%. See page 20 for a diagram of the joint venture.
Since the creation of the joint venture between the Company and TTC, the Company has recognised its interest in the joint venture as an equity accounted investment. Under the equity method of accounting, Orocobre’s interest in the joint venture was recognised on the balance sheet at fair value. This carrying amount was then adjusted for subsequent equity investments and the Company’s share of profit or loss of the joint venture.
Performance Overview
Orocobre is the only ASX listed company producing high grade, high value lithium chemicals for the growing global battery and technical markets.
“
OROCOBRE ANNUAL REPORT 2018 15
For
per
sona
l use
onl
y

Summary of results for the year ended 30 June 2018 (US$)
GROUP RESULTS SDJ PTE (100%)
2018 2017 2018 2017
Summary of results for the year ended 30 June 2018 US$000’s US$000’s US$000’s US$000’s
Revenue1 17,379 17,199 148,896 120,065
EBITDAIX2 (9,432) (8,306) 94,580 71,173
Less depreciation & amortisation (1,782) (1,743) (8,772) (8,760)
EBITIX3 (11,214) (10,049) 85,808 62,413
Less interest 4,358 1,789 (12,984) (10,588)
EBTIX4 (6,856) (8,260) 72,824 51,825
Less impairment (8,046) (8,105) - -
Add foreign currency (losses)/ gains (2,936) 625 (10,057) (867)
Add share of profit of joint ventures, net of tax 19,758 21,480 - -
Segment profit/(loss) for the year from continuing operations before tax 1,920 5,740 62,767 50,958
Income tax - (1,108) (31,935) (18,655)
Total profit/(loss) for the year from continuing operations after tax 1,920 4,632 30,832 32,303
Total profit/(loss) for the year from discontinued operations - 14,784 - -
Net profit/(loss) after tax 1,920 19,416 30,832 32,303
Share of profit of joint venture (66.5%) 19,758 21,480
Cash and cash equivalent5 316,690 51,632 19,465 4,091
Net assets 502,104 218,020 140,994 95,147
Net cash/(Net debt) 315,953 50,682 (206,477) (261,894)
Gearing (net cash to equity) (159%) (23%) 146% 275%
Cashflow from/(used in) operating activities (13,974) (6,413) 71,165 56,490
Lithium carbonate produced - - 12,470 11,862
Lithium carbonate sold - - 11,837 12,296
Realised lithium carbonate price - - 12,578 9,763
Gross cash margin Lithium - - 8,384 6,053
Cash operating costs Lithium carbonate - - 4,194 3,710
*The Olaroz project (Sales de Jujuy Pte. Ltd) or ‘SDJ PTE’) is equity accounted for it in the Group results therefore presented as a separate item in the Income statement.1 Revenue includes revenue from continuing operations2 ‘EBITDAIX is ‘Earnings before interest, tax, depreciation and amortisation, impairment, and foreign currency gains / (losses)’3 ‘EBITIX is ‘Earnings before interest, tax, impairment and foreign currency gains / (losses)’4 ‘EBTIX is ‘Earnings before tax, impairment and foreign currency gains / (losses)’5 Cash and cash equivalents exclude “other financial assets” of US$17.1M as at 30 June 2018 which is restricted cash guaranteeing project financing. These measures are non-IFRS financial information and have not been subject to audit by the Company’s external auditor.
16
For
per
sona
l use
onl
y

Group Profit Overview
The Group produced a net profit from continuing operations after tax of US$1.9 million (2017: US$4.6 million).
The Group’s net profit was adversely impacted by an impairment write-down of Borax assets of US$8 million (2017: US$8.1 million), US$1 million of M&A expenses and share of net losses of associates of US$1.5 million (Advantage Lithium).
Share of net gains from the joint venture of US$19.8 million (2017: US$21.5 million) includes foreign exchange losses of US$10.1 million (2017: US$0.9 million) due to the impact of the Argentinean peso devaluation.
The events mentioned above affected the overall performance of the Group’s net profit from continuing operations.
The net assets of the Orocobre Group increased to US$502.1 million as at 30 June 2018 (2017: US$218 million), including cash balances of US$316.7 million (2017: US$51.6 million). The main reasons for the increase in net assets are the strategic placement to TTC and the retail entitlement offer for a total of US$284.1 million net of transaction costs as explained in the following section.
Group exploration and evaluation expenditure for the year totaled US$6.5 million (2017: US$0.5 million).
Capital Raising
The 2018 Financial Year saw Orocobre Limited successfully raise over A$361 million of capital to fund the expansion of the Olaroz Lithium Project Stage 2 and construction of a lithium hydroxide plant in Japan. A 15% strategic placement to TTC completed in Q3 raised A$281.6 million, with a further A$79.3 million being raised from a retail entitlement offer.
The placement to TTC was completed at an issue price of A$7.50 per share, a 17% premium to the 30 day VWAP. The retail entitlement offer was made at A$6.55 per share.
This capital raising has provided Orocobre with an appropriate level of cash liquidity as the Company undertakes the Stage 2 expansion and the Naraha Lithium Hydroxide plant project.
SDJ Pte Performance
SDJ Pte produced net profit after tax of US$30.8 million (2017: US$32.3 million).
Revenues of US$148.9 million (2017: US$120 million) were achieved on sales of 11,837 tonnes of lithium carbonate (2017: 12,296) at an average price of US$12,578/tonne (2017: US$9,763).
EBITDAIX of US$94.6 million (2017: US$71.2 million) and profit margins of 67% (2017: 57%) were mainly as a result of price improvements year on year of 29%.
Foreign currency losses for the period were US$10.1 million (2017: US$0.9 million) were mainly generated by the effect of a 73% devaluation of the Argentinean peso on the Value Added Tax receivables balance which is peso based.
Income tax expense of US$31.9 million (2017: US$18.7 million) was also affected by Argentinean peso devaluation and by new tax legislation effective from January 2018.
OROCOBRE ANNUAL REPORT 2018 17
For
per
sona
l use
onl
y

Assets Overview
18
For
per
sona
l use
onl
y

The Olaroz Lithium Facility (Olaroz) is located in the Jujuy Province of northern Argentina, approximately 230 kilometres northwest of the capital city of Jujuy. The operations are at 3,900 metres above sea level and produce lithium carbonate. Olaroz is unique as it incorporates a large-scale purification circuit and produces battery grade lithium carbonate on site.
The plant has been operating since early 2015 and produces a range of highly sought-after lithium carbonate
products that are sold into global markets. Demand for our products continued to increase throughout FY18 reflecting the continued growth in the world’s appetite for electric vehicles (EV) and both residential and commercial grade Energy Storage Systems (ESS) grows. The wholesale adoption of EV technology, further battery capacity expansions and growing government investment supporting EV uptake and ESS development are helping drive this unprecedented growth in lithium demand.
During the first quarter of FY18 cumulative production at Olaroz reached 20,000 tonnes of lithium carbonate since operations commenced in 2015. This milestone is testament to the efforts of the operational team at Olaroz who have constructed, commissioned and operated the first new large scale lithium production facility in 20 years. These development and operating skills provide an on-going competitive advantage for Orocobre as the Company progresses the multi-phase development of Olaroz.
Increase in production for FY18 from FY17
World class brine resource capable of supporting multiple phases of expansion
High growth industry, with improving fundamentals
Approaching final investment decision (FID) to more than double capacity to 42,500 tpa lithium carbonate at Olaroz with a 10,000 tpa lithium hydroxide plant at Naraha in Japan
Demand Growth 2017-2022 @ ~21% CAGR
Plant optimisation expected to decrease operating cash costs
A low cost, high margin brine based lithium carbonate producer
Sustained market prices of more than US$12,500/tonne lithium carbonate equivalent and an average Gross Cash Margin of 67% in FY18
5%
~21%
Olaroz Lithium Facility (66.5%)
Second full year of production…
OROCOBRE ANNUAL REPORT 2018 19
For
per
sona
l use
onl
y

Joint Venture Structure
The Olaroz Lithium Facility Joint Venture is managed through the operating company, SDJ. The shareholders are Sales de Jujuy Pte Ltd (SDJ PTE), a Singaporean company that is the joint venture vehicle for Orocobre, TTC and JEMSE, the mining investment company owned by the provincial government of Jujuy, Argentina.
Orocobre(Australia)
Guarantor(JOGMEC)
Toyota Tsusho (TTC)(Japan)
JEMSE(Jujuy, Argentina)
TTC is the exclusive sales agent with Orocobre and
TTC exercising joint control over marketing, product
allocation and terms.
Holding Company — Sales de Jujuy Pte. Ltd(Singapore)
Project Company — Sales de Jujuy S.A.(Jujuy, Argentina)
72.68%(SDJ S.A. 66.5%)
27.32%(SDJ S.A. 25%)
15%
91.5% (Common Share)
Lender(Mizuho)
Debt Guarantee
8.5% (Class B Share)
*TTC – 15% equity holding in Orocobre
20
For
per
sona
l use
onl
y

Throughout the year the focus has remained on pond management both from the perspective of inter-pond brine transfer, operational controls and monitoring. The pond system is operating in a stable manner subject to the seasonal variations in weather and the impact of abnormal events.
Production for FY18 increased to 12,470 tonnes, a 5% increase as operations continued to improve over the previous year. Operations continued to be impacted by low evaporation rates related to the severe winter weather conditions at the end of the previous financial year. Production was affected by low evaporation rates in Q3 FY18, caused by reduced solar radiation from cloudy conditions and above normal rainfall.
The February mean evaporation rate was the lowest recorded since 2011 and less than half that of February 2017 resulting in lower than expected brine concentrations at the beginning of March.
Disciplined pond operating practices throughout Q3 allowed production to recover significantly in Q4 FY18, delivering the second highest quarterly production achieved to date.
A design and upgrade for an improved transfer and pumping network, requiring the installation of six new pumps, remote monitoring network and additional water cleaning lines for a revised capital cost of US$2.7 million was successfully completed in Q2 FY18.
The primary processing plant continues to achieve consistently strong performance and Orocobre continues to actively manage the business to produce the best possible economic outcome while considering long-term strategic objectives.
Strong contract pricing has been achieved throughout the year for both prime and purified products and the joint venture maintains a strategy to offer a mix of short and long-term contracts to develop a sustainable customer base for the future.
The identification and development of key customers across a range of geographies and market segments is a core objective with particular attention given to the development of long-term relationships in high growth market segments such as the battery sector.
Sales revenue for FY18 increased to US$148.9 million, a 24% increase on the prior year with higher production volumes and higher average prices despite slightly lower sales volumes which were down 3.7% on a like for like basis due to timing of shipments. EBITDAIX was US$94.6 million versus FY17 of US$71.2 million. Cost of goods sold as a percentage of sales increased by 13% when compared to last year due to the pond issues experienced at the start of the year.
Highly Competitive Industry Position
The Company is one of the world’s lowest cost producers. Olaroz produces lithium carbonate at an average operating cash cost of US$4,194/tonne in FY18, well below the cost of producing lithium from the conversion of hard rock sourced spodumene.
Ongoing process optimisation and improvements in recoveries, reagent usage and logistics will result in lower operating cash costs.
Product Specifications
Olaroz continues to sell purified and primary lithium carbonate to a diverse customer base of more than 70 customers in Asia, Europe and North America.
The main markets for primary grade product are the ceramic, chemical and glass markets, with purified grade typically sold to cathode manufacturers.
OROCOBRE ANNUAL REPORT 2018 21
For
per
sona
l use
onl
y

Salt Harvesting
During Q3 FY18 the first cycle of salt harvesting commenced from the harvestable ponds, the final eight ponds in the pond system. This process occurs approximately every three years and involves the removal of the majority of salt (mainly halite and sylvite) which has precipitated through the evaporative process.
This process involves the sequential draining of the ponds prior to removal of the majority of the contained salts. The salt drainage and harvesting process is forecast to take approximately eight months. At the end of Q4 FY18 three of the final eight harvest ponds had been cleared of harvestable salts. Construction of a salt stock pile area has commenced to the west of the existing harvest ponds where the mined salts will be stored.
Although evaporative area is lost during this process, the recovery of stored brine from the salts through the drainage process and the addition of three new harvest ponds fully compensated for the impact of a reduced evaporation area.
Expansion Plans
The Stage 2 Expansion of Olaroz became fully funded with a combination of cash and proposed debt arrangements in Q3 FY18. The final investment decision remains subject to Orocobre and TTC board approvals, although work has commenced on several long lead projects as noted below.
Revised Scope of Stage 2 Expansion
In Q2 FY18 Orocobre announced the increase of Stage 2 Expansion to 25,000 tpa (total 42,500 tpa) from the previously announced 17,500 tpa. Engineering studies for the enlarged Stage 2 were completed during the same quarter.
The increased Stage 2 uses a simplified design including a primary lithium carbonate circuit but excluding a purification circuit. The planned product mix for the Olaroz Lithium facility will be 17,500 tpa purified lithium carbonate (>99.5%) from the existing purification circuit and 25,000 tpa Prime grade lithium carbonate (avg. 99.0%) of which 10,000 tpa will be used as feedstock for the planned Lithium Hydroxide Plant in Naraha, Japan.
This expansion plan will result in capital expenditure of approximately US$285 million including a US$25 million contingency and retains the lower risk of implementation as the project is based around a simple duplication of bores, ponds and primary circuit of Stage 1 at Olaroz.
The capital cost intensity of the 25,000 tpa expansion increased from the previous 17,500 tpa principally due to the increased accuracy with the engineering study compared to the previous scoping level, additional redundancy in the design, increases in indirect costs and inflationary pressures. However, this capital remains extremely competitive when compared with greenfield developments.
Multinational engineering firm GHD continues to undertake engineering design and procurement activities for the Olaroz Stage 2 Expansion.
All necessary permits have been granted for process water, brine extraction, additional bores, new pond and plant construction from the Jujuy Provincial Government for the expansion. By the end of FY18 the Orocobre and TTC Joint Venture had committed to a US$40 million early works program to be funded out of operating cashflow. This capital forms part of the overall US$285 million total capital program for Stage 2. This first phase of the early works activities included the construction of new roads, vegetation clearing and construction of new evaporation ponds, the expansion of existing site infrastructure including a new sewage treatment plant and camp accommodation.
22
For
per
sona
l use
onl
y

Lithium Hydroxide Plant
Update on Progress
Throughout FY18 Orocobre and TTC progressed plans for a 10,000 tpa Lithium Hydroxide Plant to be built in Naraha, Japan. The proposed location is well situated near potential customers and reduces the risks of caking and degradation of product when lithium hydroxide is transported / exposed to humidity and atmospheric air.
The proposed treatment process at the Naraha Lithium Hydroxide Plant will utilise primary grade lithium carbonate sourced from Olaroz together with locally sourced Japanese lime. Test work has demonstrated that a very high-quality, battery grade, lithium hydroxide can be produced.
Contract negotiations continued during H2 FY18 to determine which engineering firm would be awarded the engineering, procurement and construction contract. The selection criteria for the engineering contractor include turn-key commissioning and personnel training with process, product quality and performance guarantees. These contract negotiations are expected to be completed in Q1 FY19.
Negotiations are continuing with TTC regarding the commercial arrangements of the joint venture structure. Staffing and management of the construction phase are also being determined. Financing arrangements have advanced with a term sheet being provided from Japanese banks. Subsidies of US$27 million have been secured from the Japanese Government.
Following extensive studies and the customisation of plant design, the capital expenditure for the Naraha Lithium Hydroxide Plant is expected to be approximately US$60-70 million (100% basis, pre-subsidies).
Operating costs (excluding lithium carbonate feedstock) for the Naraha Lithium Hydroxide Plant are forecast to be approximately US$1,500/tonne.
A FID remains subject to Orocobre and TTC Boards’ approval.
Test work has demonstrated that a very high-quality, battery grade, lithium hydroxide can be produced.
“
OROCOBRE ANNUAL REPORT 2018 23
For
per
sona
l use
onl
y
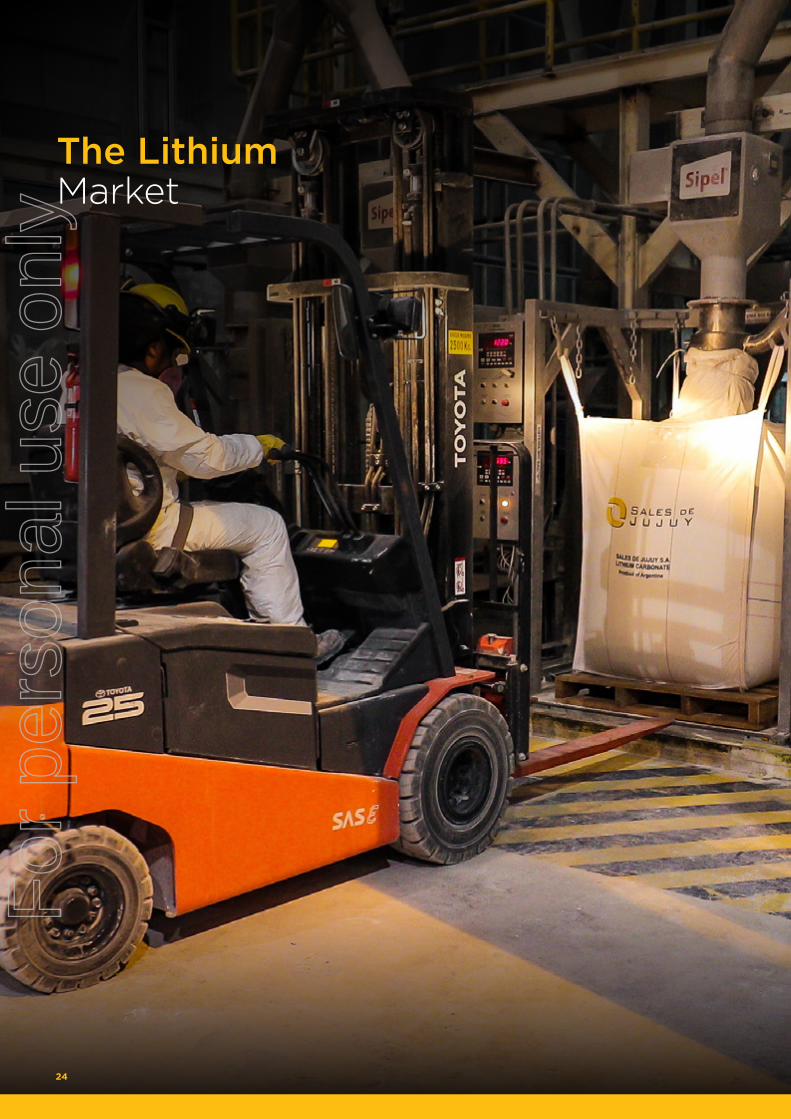
The Lithium Market
24
For
per
sona
l use
onl
y

The lithium market experienced strong demand during FY18 encouraged by upward revisions to key forward indicators including EV plans of car manufacturers, further battery capacity expansions and growing government investment supporting EV uptake and ESS development.
This sentiment was reflected by seaborne import prices of key customer markets including Japan, South Korea, Europe and China, which continued to trend upward throughout the year due to robust demand for contracted tonnage.
The market had forecast a prompt supply response given announced production targets of Australian hard rock projects, ongoing shipping of direct shipping ore (DSO) and widespread conversion capacity expansions announced with short construction and commissioning time lines. But despite growing exports of Australian material, the downstream processing bottleneck persisted for some time as Chinese conversion plants underestimated the time required to construct and commission capacity with new, unfamiliar feedstock.
There were reports of growing stockpiles of both concentrate and DSO throughout the supply chain at ports, warehouses and conversion plants challenged by limited technical knowledge, inefficient plants and
lower grade feedstock compared with the benchmark 6% Li20 grade concentrate set by Greenbushes’ Talison hard rock operation. As of the end of CY17 approximately 24 kt LCE spodumene concentrate and almost 70 kt LCE DSO was stockpiled in China with most conversion plants operating below 70% capacity.
Given only ~5% of Chinese imports of ‘non-Greenbushes’ material was at or above 6% during Q1 CY18, several new hard rock producers announced ongoing efforts to improve grade during H1 CY18 via supplementary plant and equipment.
Furthermore, the leading DSO supplier announced plans to progressively decrease supply for the remainder of the year. This decision comes after 12 months of market speculation regarding the technical and economic viability of DSO.
24 kt
470 GWh
Growth from 115 GWh in 2017 to 470 GWh in 2025 for battery manufacturing
The market had forecast improved supply conditions with expansions expected
Lithium carbonate equivalent (LCE) spodumene concentrate stockpiled as of CY17
OROCOBRE ANNUAL REPORT 2018 25
For
per
sona
l use
onl
y

The supply effect of converted new Australian material is reported to be increased industrial or technical grade product with little change in availability of battery grade lithium carbonate and hydroxide. Additionally, reports emerged of increased production from brine operations and lepidolite and spodumene converters. This new supply of largely non-battery specification material created some excess inventory pressuring spot prices in China. A change to the EV subsidy policy has also impacted spot market prices as many cathode and
battery manufacturers are required to adjust operations and retool to meet the new requirements favouring higher nickel format batteries rather than the previous cobalt-dominant format.
The revised EV policy which came into effect early June after a transition period from February, supports improvements to battery technology through higher valued subsidies available to larger batteries with increased energy density and longer range.
The results achieved by the Company
to date for contracted business indicate continued strength in the contract market for high quality lithium carbonate chemicals.
The differing sentiment between the contract and spot markets is supported by the convergence in the two indicative prices. It is the Company’s view that the recent softening in China’s spot price does not represent underlying long-term market dynamics. Long established producers SQM and Albemarle attest to strong demand growth rates of 20%
Source: Chinese Spot Pricing – Asian Metals; Import Prices – GTIS. Note: May to August 2018 import prices were unavailable at the time of drafting.
Lithium Carbonate Import Prices of Key Markets CIF (USD/t) & Chinese Lithium Carbonate ‘spot’ price Delivered Ex-VAT (USD/t)
$25,000
$20,000
$15,000
$10,000
$5,000
$0Jan 16 Mar 16 May 16 Jul 16 Sep 16 Nov 16 Jan 17 Mar 17 May 17 Jul 17 Sep 17 Nov 17 Jan 18 Mar 18 May 18 Jul 18
China ‘Spot’ Price 99.5% Lithium Carbonate Delivered USD/t Ex-Vat
China Lithium Carbonate Import Price USD/t CIF
Japan Lithium Carbonate Import Price USD/t CIF
South Korea Lithium Carbonate Import Price USD/t CIF
Europe Lithium Carbonate Import Price USD/t CIF
26
For
per
sona
l use
onl
y

and 18% CAGR to 2025 respectively, based on their customers’ long-term order books.
This view is echoed downstream by the battery supply chain with continued investment in additional capacity buoyed by car manufacturer targets. Battery manufacturing capacity is expected to more than quadruple, growing from 115 GWh in 2017 to 470 GWh in 2025 although continued expansion beyond this is likely (Benchmark Minerals, 2018). The Company expects that further
expansion announcements will occur given both car manufacturer and Government targets exceed the current battery manufacturing capacity plans.
As downstream cathode and battery manufacturers progress expansions to manufacturing facilities largely in line with expected timelines, it has become increasingly apparent that a deficit of lithium carbonate and hydroxide is likely to persist due to slower-than-expected ramp-up of new supply. Significant technical
improvements are required to lift lithium carbonate output and unlock persisting bottlenecks particularly in the conversion of spodumene concentrate to lithium compounds given future supply relies heavily on this source. On this basis, it is the Company’s view that the market will continue to experience robust demand growth particularly for battery-grade carbonate and hydroxide with some periods of lumpiness or variability to be expected in supply and demand as the market grows.
Source: Battery Capacity Announcements – Benchmark Minerals 2018; Govt Target EV30@30, Govt Mandates, Car Manufacturer Targets – International Environmental Agency EV Outlook 2018.
Methodology Note for Car Manufacturer Targets: Mid-point of lower & upper range of EV targets.
Lithium Demand LCE tpa
2017 2018F 2019F 2020F 2021F 2022F
700,000
600,000
500,000
400,000
300,000
200,000
100,000
0
2017 Government Initiative
ORE Pessimistic
Broker Concensus
Battery Manufacturer Capacity Announcements
2018 Government Initiative Car Manufacturer Announced Targets
2018 Government Initiative: Global EV30@30 campaign launched in December 2017 by a consortium of Governments with a goal to achieve 30% EV penetration by 2030
Car Manufacturer Targets: The International Energy Agency quantified all public announcements by car manufacturers regarding EV sales, % share of fleet & model targets to find the total EV sales sits between the 2017 and 2018 Government mandates
Battery Capacity: Projected lithium requirements on the basis of battery capacity projects announced
Government Mandates: EV sales calculated on the basis of Government mandates
OROCOBRE ANNUAL REPORT 2018 27
For
per
sona
l use
onl
y

Borax Argentina S.A. (100%)
28
For
per
sona
l use
onl
y

GDP growth in Latin America is projected to be 1.8% in 2018 rising to 2.5% in 2019
Borax Argentina S.A. has operated in the Salta-Jujuy region for over 50 years and its operations include two open pit mines, concentrators, refining capacity and significant land holdings. The mining operations are located in Tincalayu and Sijes.
Borax products can be divided into three groups being: minerals, refined products and boric acid. The minerals historically produced are ulexite, colemanite and hydroboracite. Ulexite has traditionally been used as a feedstock to produce boric acid, however hydroboracite is now the primary feedstock allowing for a lower cost of production and a product with a lower chloride content to be produced. Hydroboracite and colemanite are supplied into the
ceramic market with hydroboracite also supplied into agricultural and oil and gas markets. The refined products are comprised of borax decahydrate, borax pentahydrate and borax anhydrous. These refined products have applications in a wide range of markets from agriculture, ceramics, glass, insulation fibreglass, textile fibreglass, smelting fluxes and a number of other specialty applications.
Combined Product Sales Volume Year on Year*
Financial Year Combined Product Sales (tonnes)
June 2014 40,098
June 2015 34,091
June 2016 35,482
June 2017 41,777
June 2018 36,553
* Combined product sales volumes include borax chemicals, boric acid and boron minerals and does not include sales of tincal ore of 4,021 tonnes in September 2014 quarter, 4,225 tonnes in the December 2014 quarter and 2,061 tonnes in the June 2015 quarter, for a total of 10,307 tonnes.
Plant & Equipment written down to nil value recognising financial performance
OROCOBRE ANNUAL REPORT 2018 29
For
per
sona
l use
onl
y

Operations
Borax is on a path of restructuring and transformation to becoming a sustainable operational and financial business unit. There has been focus on key areas including production cost efficiency and optimisation, developing business with higher value, more profitable products and the development of products with sound value propositions for customers and attractive and sustainable financial metrics.
During H1 FY18 production rates increased with record production achieved at both Tincalayu and the Boric Acid plant at Campo Quijano.
The strategy of shifting to a product mix that will drive higher average pricing, improved margins and reducing unit costs at full production rates has demonstrated traction with steadily improving sales results achieved during the last quarter of the year.
Sales revenue, which is US$ denominated/ pegged, increased by 1% from the prior year. EBITDAIX (excluding asset sales) improved to breakeven versus a FY17 loss of US$1.7 million.
Operating Environment
A substantial portion of Borax’s costs are Argentine (ARS) Peso based (~60%). For the financial year devaluation of the ARS$ against the US$ was ~73% versus inflation of ~30.0% thereby helping US$ costs to be lower for ARS denominated expenses. The effect of such devaluation was only seen towards the end of FY18 when the peso devalued substantially.
A devaluing ARS benefits Borax as ARS costs become cheaper in US$, and US$ sales revenues translate to more ARS. A downside of a devaluing ARS is that ARS denominated assets such as recoverable VAT devalues in terms of US$. Whilst a book forex loss is incurred on assets, a book forex gain would be achieved on ARS liabilities.
Impairment of Assets
As a result of the impairment assessment of Borax, the carrying value of its Plant and Equipment was written down to nil. For the year ended 30 June 2018, this resulted in a total impairment charge amounting to US$8 million.
Production Performance
The focus for Borax has continued to be on improving manufacturing efficiency and achieving reductions in the unit cost of production. Despite the economic environment hurdles over the past year the business has demonstrated a track record of consistently reducing the unit cost of production across the Tincalayu, Campo Quijano boric acid plant and Sijes operations.
The Tincalayu operation produces refined sodium borate products of borax decahydrate and borax pentahydrate.
Refined Borates Expansion Study
An expansion study to evaluate a potential expansion of the Tincalayu refined borates operation from its current production capacity of 30,000 tpa to 100-120,000 tpa borax decahydrate equivalent and a 40,000 tpa boric acid plant is currently under
review. It is anticipated that the potential expansion will significantly increase efficiencies in the production of refined borates at Tincalayu and contribute to providing a step change improvement in unit costs.
Approvals were received in the first quarter for a new gas pipeline to supply the expanded plant.
Market & Customers
Borax is the only South American based boron producer with a wide range of refined products and relatively unique mineral products.
The value proposition to customers is that Borax is a local high-quality manufacturer and supplier of boron products well positioned to provide value particularly in the form of security of supply to businesses predominantly in South America and to the operations of these companies and other key customers offshore.
Market prices continue to be subdued. GDP growth in Latin America is projected to be 1.8% in 2018 rising to 2.5% in 2019. These conditions underline the importance of product innovation and generating creative customer and market solutions in order to create value.
30
For
per
sona
l use
onl
y

Operations in FY18 have continued to focus on maintaining healthy stock levels with all finished product inventory levels being maintained above the minimum threshold.
Sales volumes in the first quarter were 8,543 tonnes of combined product, a reduction from the previous quarter following the strategic exit of a loss making, high volume mineral product line for the Agricultural market in Brazil. A decision was made to exit this business as it was no longer commercially attractive.
Sales then began to steadily improve in H2 FY18 when the recent product and market development projects began to gain traction. Sales volume in the June quarter was up 16.6% on the March quarter. Sales revenue has improved markedly in the last four months of FY18 to be ~12% above the corresponding period last year and ~30% above the monthly average compared to the first eight months of FY18. The focus on production cost efficiency and optimisation, developing business with higher value, more profitable products and the
development of products with sound value propositions for customers and attractive and sustainable financial metrics has begun to deliver results and this momentum has been carried over into FY19.
The positive seasonal influence of the Brazil agriculture market will be of significance in the back half of CY18. The Brazil agriculture sector has significantly outperformed when compared to GDP growth over the past year.
4,000
3,000
2,000
1,000
0
2500
2000
1500
1000
500
0
Jul 1
7
Aug
17
Sep
17
Oct
17
Nov
17
Dec
17
Jan
18
Feb
18
Mar
18
Ap
r 18
May
18
Jun
18
1000
800
600
400
200
0
Jul 1
7
Aug
17
Sep
17
Oct
17
Nov
17
Dec
17
Jan
18
Feb
18
Mar
18
Ap
r 18
May
18
Jun
18
Jul 17 Aug 17 Sep 17 Oct 17 Nov 17 Dec 17 Jan 18 Feb 18 Mar 18 Apr 18 May 18 Jun 18
Sales Volume (tonnes)
Tincalayu Production (tonnes) Boric Acid Production (tonnes)
OROCOBRE ANNUAL REPORT 2018 31
For
per
sona
l use
onl
y

The Borates Market
The global borates market is over 2 million tonnes of B2O3 equivalent per year with the key traditional industries being glass, ceramics, agriculture and detergents.
32
For
per
sona
l use
onl
y

Key demand drivers in the borates market are growth in urbanisation (global housing market), energy and food supply. Market growth is expected to be in the 2-5% per annum range over the next few years dependent upon the market segment, geography and global GDP growth profiles.
There are two major producers of boron in the global market accounting for approximately 80% of the market share, Rio Tinto Borates in the US holds ~30% market share and ETi MADEN of Turkey with greater than 50% market share.
Glass manufacturing is a key market for borates accounting for greater than 50% of global consumption, predominantly comprised of fibreglass (both insulation and electronics) and borosilicate glasses where it is used
for strength and resistance to thermal shock.
Borates are also used extensively in the ceramics industry in the manufacture of frits, a ceramic composition that is fused in a special fusing oven, quenched to form a glass, and then granulated. Frits form an important part of the batches used in compounding enamels and ceramic glazes.
Agricultural markets account for a significant share (~15%) of the
total global consumption. Borates are an essential, non-substitutable micronutrient which help in the transfer of water and nutrition within plants. They are essential for cell division (creation of new plant cells) and promotes reproductive growth (for fruit and seed development, pollination).
Asia continues to maintain its position as the largest regional consumer of borates accounting for greater than 50% of total global consumption.
Borates Production by Region Borates Consumption by Industry Borates Consumption by Region
Turkey
South America
Asia
Americas
Europe
Glass
Fertilisers
Ceramics
51%
25%
56%
19%
13%
51%
3%
10%
12%
27%
18%
12%
1% 1%
Middle East
Africa
US
Asia
Detergents
Other
Source: Eti Maden, 2016
Turkey
South America
Asia
Americas
Europe
Glass
Fertilisers
Ceramics
51%
25%
56%
19%
13%
51%
3%
10%
12%
27%
18%
12%
1% 1%
Middle East
Africa
US
Asia
Detergents
Other
Turkey
South America
Asia
Americas
Europe
Glass
Fertilisers
Ceramics
51%
25%
56%
19%
13%
51%
3%
10%
12%
27%
18%
12%
1% 1%
Middle East
Africa
US
Asia
Detergents
Other
OROCOBRE ANNUAL REPORT 2018 33
For
per
sona
l use
onl
y

Advantage Lithium & Cauchari JV
Advantage Lithium Corp (TSXV:AAL) manages a 85,543 hectare portfolio of high quality assets in Argentina, including the Cauchari Joint Venture, in which Orocobre holds a 25% interest and a 100% interest in five other lithium properties.
Orocobre now holds approximately 33.5% of Advantage Lithium Corp (Advantage) common shares following the Company’s C$5 million participation in a subscription agreement as part of a private placement offered by Advantage in July 2018 to raise C$12 million gross through the issuance of 15,585,000 common shares at an issue price of C$0.77 per share.
Operational Update
FY18 was a highly productive year for Advantage as they continued their focus on extensive drilling and testing at the flagship Cauchari Project. The objective of work at Cauchari in FY18 was to rapidly advance the property through exploration and towards development.
On 2 July 2018 Advantage released a NI43-101 Technical Report on the resource upgrade of the Cauchari Lithium Project in Jujuy, Argentina. The report, prepared by FloSolutions S.A.C., increased the inferred resource to a volume of approximately 1,200 million cubic metres of brine at
average grades of 450 mg/l lithium and 4,028 mg/l potassium for 3.02 Mt of LCE and was the basis for a study Advantage subsequently released in accordance with Canadian 43-101 standards to the TSXV in Q1 FY19.
Further resource definition drilling is currently underway at the Cauchari project site supported by a new drill rig (large diameter drilling capacity to beyond 600m). This program will include additional diamond holes in the NW and SE Sectors and is designed to provide combined borehole density data required to upgrade the current Inferred resources to the Indicated and Measured categories. Drilling undertaken at depths greater than 450m will also aim to further define resources in the deep sand units and the base of the Cauchari salar basin.
Advantage is fully funded through to the completion of a Feasibility Study in the June quarter of 2019.
Hold ~33.5% of Advantage Lithium Corp (Advantage) common shares
Advantage is fully funded to complete a definitive Feasibility Study
~33.5%
34
For
per
sona
l use
onl
y

Cauchari 2018 Resource Outlines – Phase II & Historical Drill Holes (June 27, 2018)
OlarozLithiumFacility
Orocobre Olaroz Property
Argentina
5KM
LAC Resource
SE Resource1,490,000 tonnes LCE57.4km2
CAU07-07M
CAU16
CAU21D
CAU07-07M
CAU18CAU20D
CAU17
CAU09
CAU13 CAU14
CAU26D
CAU22D
CAU25D
CAU27D
CAU11-11MCAU15
CAU23D
CAU24D
CAU19DCAU06-06M
CAU08
CAU10
CAU12
Olaroz Plant
SAS 2011 Drill Holes
2018 Drill Program
Phase 3 Drill Targets
2017 DDH Program
2017 Rotary Holes
Cauchari JV Property
Ganfeng/LAC Property
LEGEND
SECTION LINE
NW Resource 1,530,000 tonnes LCE35.2km2
Total Resource 3,020,000 tonnes LCE
NW
SE
OROCOBRE ANNUAL REPORT 2018 35
For
per
sona
l use
onl
y

Health & Safety
Orocobre fosters a “zero harm” approach when it comes to the safety of our employees and project contractors.
We are committed to reducing workplace risks and incidents, and consistently review our management and reporting systems to enhance the safety of our operations.
The improvement in our safety statistics over the last year is testament to our focus and commitment to safety. The Total Recordable Injury Frequency Rates (TRIFR) for Borax and SDJ are presented on the following page.
The TRIFR has improved across both operations, which is a strong endorsement of the Company’s commitment to continuous improvement. For SDJ, which has now completed its second full year of commercial production, this is also a strong indication of the operation’s increasing maturity.
As we increase construction and commissioning activities at SDJ with the Stage 2 expansion, our key focus will be on reinforcing safety management, reporting and engagement initiatives to ensure our TRIFR remains low.
As of 30 June 2018 the Borax Sijes mine had achieved more than 1020 days without a Lost Time Injury (LTI), in the same period Tincalayu had recorded more than 430 days without a LTI and Campo Quijano had
achieved more than 113 days without a LTI.
SDJ and Borax have both achieved ISO accreditation recertification for ISO 9001 Quality Management Systems and ISO 14001 Environmental Management. Both subsidiary companies continue to comply with the OHSAS 18001 Occupational Health and Safety Standard.
In addition, a detailed safety audit was conducted at SDJ to gain an in-depth understanding of the opportunities to strengthen their safety performance. This included employee safety training to reinforce the importance of risk management and workplace safety, and a review of systems facilitating risk assessments and incident reporting.
Health, Safety & Commmunity
36
For
per
sona
l use
onl
y
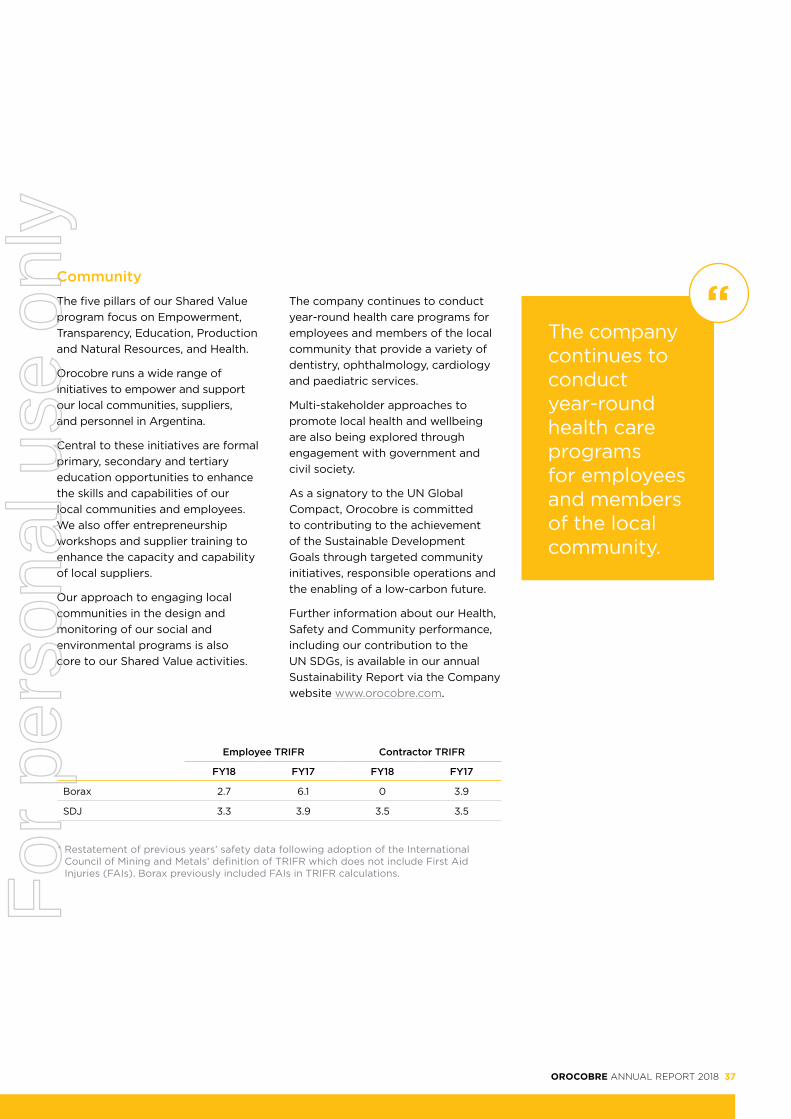
Community
The five pillars of our Shared Value program focus on Empowerment, Transparency, Education, Production and Natural Resources, and Health.
Orocobre runs a wide range of initiatives to empower and support our local communities, suppliers, and personnel in Argentina.
Central to these initiatives are formal primary, secondary and tertiary education opportunities to enhance the skills and capabilities of our local communities and employees. We also offer entrepreneurship workshops and supplier training to enhance the capacity and capability of local suppliers.
Our approach to engaging local communities in the design and monitoring of our social and environmental programs is also core to our Shared Value activities.
The company continues to conduct year-round health care programs for employees and members of the local community that provide a variety of dentistry, ophthalmology, cardiology and paediatric services.
Multi-stakeholder approaches to promote local health and wellbeing are also being explored through engagement with government and civil society.
As a signatory to the UN Global Compact, Orocobre is committed to contributing to the achievement of the Sustainable Development Goals through targeted community initiatives, responsible operations and the enabling of a low-carbon future.
Further information about our Health, Safety and Community performance, including our contribution to the UN SDGs, is available in our annual Sustainability Report via the Company website www.orocobre.com.
Employee TRIFR Contractor TRIFR
FY18 FY17 FY18 FY17
Borax 2.7 6.1 0 3.9
SDJ 3.3 3.9 3.5 3.5
* Restatement of previous years’ safety data following adoption of the International Council of Mining and Metals’ definition of TRIFR which does not include First Aid Injuries (FAIs). Borax previously included FAIs in TRIFR calculations.
The company continues to conduct year-round health care programs for employees and members of the local community.
“
OROCOBRE ANNUAL REPORT 2018 37
For
per
sona
l use
onl
y

Directors’ Report
The Company’s directors have significant public company management experience, together with a strong background in mineral exploration, project development, operations management, financial markets, accounting and finance. Their experience covers many resource sectors within Australia and internationally. The names and qualifications of the Directors in office during or since the financial year are summarised on the following pages.
38
For
per
sona
l use
onl
y

Robert was appointed a Director in November 2012 and appointed Chair of the Orocobre Board in July 2016. Robert was a partner at PricewaterhouseCoopers for over 20 years until 2013. During his time as a PwC partner, he served as auditor and adviser for some of Australia’s largest resource companies with activities throughout Australia, Papua New Guinea, West Africa and South America.
Robert is a non-executive Director of Bendigo and Adelaide Bank Limited and Chairman of Primary Health Care Limited. Robert is Chair of the Related Party Committee and a member of the Remuneration Committee.
Directorships held in other ASX listed companies in the last three years:
• Bendigo and Adelaide Bank Ltd (Apr 2013 – Present)
• Primary Health Care Limited (December 2014 – Present)
• Central Petroleum Limited (December 2013 - May 2018)
Richard joined the Board of Orocobre as Managing Director in 2007, when it was an unlisted Argentinian explorer, chaired by Neil Stuart. Neil and Richard took Orocobre through to listing on the ASX in December 2007.
Richard is a mining geologist and geotechnical engineer and has over 35 years’ experience in exploration, development and production, and nearly 25 years in the corporate field as a Director involved in resource development funding through both debt and equity with companies listed on ASX, TSX and AIM.
Richard has managed Orocobre’s growth from an explorer to become a successful producer of lithium carbonate at the Olaroz project, the first new major producer from brine in 20 years.
Richard was instrumental in negotiating the Toyota Tsusho Joint Venture in 2010 and has been key to the management of the relationship since.
He is a graduate of Imperial College London and James Cook University in North Queensland and holds a Bachelor of Science degree with Honours in Mining Geology and a Master of Engineering Science in Rock Engineering.
Directorships held in other listed companies in the last three years:
• Elementos Limited (Nov 2013 – Oct 2015)
• Advantage Lithium (Feb 2017 – Present)
Robert Hubbard BA (Hons), FCA
Non-Executive Chair
Richard P. Seville BSc (Hons) Mining Geology, MEngSc Rock
Engineering, MAusIMM, ARSM
Managing Director & Chief Executive Officer
Executive Leadership TeamCompany Directors
OROCOBRE ANNUAL REPORT 2018 39
For
per
sona
l use
onl
y
Fernando was appointed a Director in June 2010.
Fernando is a highly successful business leader with a history of developing and operating large enterprises within Argentina and has a reputation for upholding integrity and social responsibility in his business practices.
He began his career in 1970 with large trading company Continental Grain, working in the USA, Spain, Switzerland, Brazil and Argentina eventually rising through the ranks to be responsible for all of Latin America.
As Chief Executive of S.A. San Miguel, Fernando was widely credited with turning the company into the largest and most profitable lemon products company in the world. The process
of restructuring included listing S.A. San Miguel on the Buenos Aires Stock Exchange in 1997.
Fernando was Chief Executive and significant shareholder of Avex S.A. from 2004 to 2012.
He has also held the role of Director of Patagonia Gold Ltd.
He holds a Masters of Public Administration from The Kennedy School of Government at Harvard University.
In January 2018 Fernando was appointed Argentina’s ambassador to the United States of America by President Mauricio Macri.
Directorships held in other ASX listed companies in the last three years: Nil
Federico was appointed a Director in September 2010.
Federico has been a member of the Board of Ledesma, a diversified Argentine agro-industrial producer since 1991, also serving as Executive Director until June 2014.
He is currently Chairman of CEADS (Consejo Empresario Argentino para el Desarrollo Sustentable), an Argentinian local division of WBCSD (World Business Council for Sustainable Development), and president of La Payana S.A.
Additional positions held throughout his career include President of Argentine North Regional Center and President of Chacra Experimental Agricola Santa Rosa for 19 years, Vice President of the Argentine Pulp and
Paper Association, Deputy Secretary of the Food Industries Association, and Vice President of the Argentine Corn Starch and Syrups Chamber, Vice President of the Argentine Industrial Union (UIA) for fourteen consecutive years (1999 - 2013), and President of the National Industrial Movement.
Federico has been a Board member of various sports organisations, including Mar del Plata Golf Club among others, where he was the president from 2002 to 2009. Since graduating from the University of Buenos Aires with a Law qualification, Federico has continued his association with the institution. Federico is also a member of the Company’s Remuneration Committee.
Directorships held in other ASX listed companies in the last three years: Nil
Fernando Oris de Roa MPA, Harvard Kennedy School
of Government
Non-Executive Director
Federico Nicholson LLB
Non-Executive Director
Company Directors
40
For
per
sona
l use
onl
y

John was appointed a Director in March 2010. John is a recognised leader in the energy technology and services industry with more than 25 years of global energy experience. John is currently Chairman, Energy Technology for Tudor, Pickering, Holt & Company - an energy focused investment and merchant bank headquartered in Houston, Texas.
John was previously the Chief Executive Officer of Tervita Corporation, a major Canadian environmental and oil field services company. Prior to joining Tervita, John served as Chief Executive Officer of an enterprise software solutions company serving oil and gas industry clients and has held senior positions with the Halliburton Group
of Companies, including President of Halliburton’s Energy Services Group. John serves on the Boards of Directors of Blue Spark Energy Inc. and I-Pulse Inc. He is a member of the University of Houston Energy Advisory Committee, visiting committee of the University of Texas Bureau of Economic Geology, and the national board of KickStart Kids.
John holds a Bachelor of Science from Auburn University and a Master of Science from the University of Houston and is a member of several professional societies.
John is a member of the Audit Committee.
Directorships held in other ASX listed companies in the last three years: Nil
Courtney was appointed a Director in March 2010. Courtney has enjoyed a 40-year career at the helm of some of Canada’s top industrial businesses, particularly in the energy, minerals, and mining sectors. From 2004 to 2006, he was President and CEO of Stelco, a major Canadian steel producer, guiding it through a court supervised restructuring, and then served as Stelco’s Chairman until the company’s sale to the US Steel Corporation in 2007.
Courtney has previously served as the President and CEO of Toronto Hydro, North America’s largest municipally owned electricity distributor. He also served as President and subsequently as Chairman of Noranda Inc., a global diversified natural resource company headquartered in Toronto.
In this capacity he served as a Director of Noranda Minerals Inc., Falconbridge Ltd., Battle Mountain Gold Company, Noranda Forest Inc., (Chairman), Norcen Energy Resources Limited and Canadian Hunter Exploration Limited. Courtney served as Chairman and Chief Executive Officer of the Toronto Region Research Alliance to March 2010.
He is also a board member of MD Financial Holdings and Chairman of CMA Holdings, the physician services arm of the Canadian Medical Association.
Courtney was awarded the Order of Canada in January 1999. He is currently Chair of the Remuneration Committee and a member of the Related Party Committee.
Directorships held in other ASX listed companies in the last three years: Nil
Courtney PrattNon-Executive Director
John W. Gibson, Jr. BSc Geology, MSc Geology
Non-Executive Director
Company Directors
OROCOBRE ANNUAL REPORT 2018 41
For
per
sona
l use
onl
y

Leanne was appointed a Director in September 2016. Leanne is an executive and leader with over 25 years corporate experience in the mining sector, including 10 years with Rio Tinto. Her experience includes strategic marketing, business finance and compliance and she has led organisational restructures, disposals and acquisitions.
Additionally, she has had significant experience in complex cross-cultural negotiations and international customer and stakeholder relationship management (including governments, communities and investment partners). Leanne holds a Bachelor of Business (Accounting) from Charles Sturt University and an MBA from the
Melbourne Business School, University of Melbourne. She is a member of the Australian Institute of Company Director’s and CPA Australia.
Leanne is a senior marketing executive with Inenco Industrial Services, a non-executive Director for the Australian Meat Processor Corporation and is a member of the NSW Council for Women’s Economic Opportunity.
Leanne is Chair of the Audit Committee and a member of the Related Party Committee.
Directorships held in other ASX listed companies in the last three years: Nil
Masaharu was appointed a Director in April 2018 following the strategic placement of Orocobre shares to Toyota Tsusho Corporation (TTC), under the terms of which TTC is entitled to appoint a representative to the Orocobre Board of Directors (see ASX announcement 16 January 2018).
Masaharu’s experience includes risk management, resource development and marketing strategy development with exposure to a variety of industries throughout India, Canada, Morocco, France, Vietnam and Japan.
Masaharu holds a Bachelor of Mechanical Engineering from Kobe University. He has been working for TTC since 1995 and is currently General Manager of Resource Development.
Masaharu is a member of the Audit Committee.
Directorships held in other ASX listed companies in the last three years: Nil
Masaharu Katayama BA (ME)
Non-Executive Director
Leanne Heywood BBUS MBA CPA AICD
Non-Executive Director
Company Directors
42
For
per
sona
l use
onl
y

Neil was appointed Chief Financial Officer in January 2013 and Company Secretary in July 2013. Neil is a Chartered Accountant and brings a wealth of knowledge to the Company with over 25 years of experience in managerial and finance positions obtained on four different continents.
Neil’s experience in the resources sector was achieved working in executive financial roles for Glencore International and formerly TSX listed company Coalcorp Mining, both based in Colombia.
Neil holds a Bachelor of Accountancy degree from the University of the Witwatersrand in South Africa and is a member of both the Institute of Chartered Accountants in Australia (ICAA) and South African Institute of Chartered Accountants (SAICA).
Rick joined Orocobre in 2015. Rick is a lawyer with over 30 years’ experience in both corporate and commercial law practicing exclusively in the resource sector. He has worked both as a director and adviser to numerous resource companies and has extensive project planning, acquisition and development, capital raising and corporate governance skills.
Neil Kaplan BAcc, CA
Chief Financial Officer & Joint Company Secretary
Rick Anthon BA LLB
Corporate Development Manager, General Counsel & Joint Company Secretary
Company Secretaries
OROCOBRE ANNUAL REPORT 2018 43
For
per
sona
l use
onl
y

Dividends
No dividend has been proposed or paid since the start of the year.
Directors’ interests as at 30 June 2018 and Performance Rights
The relevant interest of each Director held directly or indirectly in shares, Performance Rights issued by the Company at the date of this report is as follows:
Directors Shares Performance Rights
Richard P. Seville 5,371,973 560,870
Federico Nicholson 121,500 –
Fernando Oris de Roa 100,000 –
Robert Hubbard 70,293 –
Courtney Pratt 59,651 –
John W. Gibson 37,900 –
Leanne Heywood 14,050 –
Unissued Shares
As at 30 June 2018 there were 2,017,638 unissued ordinary shares relating to Performance Rights (PR). Since the end of the financial year, there have been no unissued ordinary shares under Performance Rights or options that have lapsed in accordance with the terms of their grant.
Refer to the Remuneration Report for further details of the PR outstanding and to Additional Information for further details on the unissued ordinary shares under PR and the corresponding lapse dates. PR holders do not have any right, by virtue of the instrument, to participate in any share issue of the Company or any related body corporate.
Shares Issued as a Result of the Exercise of Options and Performance Rights
During the financial year, employees and executives exercised 100,000 options and 429,488 Performance Rights.
Refer to the Remuneration Report for details of the Performance Rights outstanding and to Additional Information for the unissued ordinary shares under Performance Rights and the corresponding lapse dates.
“
44
For
per
sona
l use
onl
y

Directors
The Directors of the Company at any time during or since the end of the financial year are listed below. During the year there were 11 Board meetings. The Board and Committee meetings attended by each Director were:
Board Audit Committee Remuneration Committee Related Party Committee
Directors Meetings Attendance Meetings Attendance Meetings Attendance Meetings Attendance
Richard Seville 11 11 – – – – – –
John Gibson 11 11 4 2 – – – –
Courtney Pratt 11 10 – – 2 2 2 2
Fernando Oris de Roa 11 10 3 2 – – – –
Federico Nicholson 11 10 – – 2 2 – –
Masaharu Katayama1 2 2 1 1 – – – –
Robert Hubbard 11 10 – – 2 2 2 2
Leanne Heywood 11 11 4 4 – – 2 2
Committee Membership
At the date of this report the Company has an Audit Committee, a Remuneration Committee, and a Related Party Committee. When Masaharu Katayama joined the Audit Committee in April 2018 Fernando Oris de Roa stepped down. Members are as follows:
Audit Committee Remuneration Committee Related Party Committee
L. Heywood (C) C. Pratt (C) R. Hubbard (C)
J. Gibson R. Hubbard L. Heywood
M. Katayama F. Nicholson C. Pratt
(c) Designated the Chair of the committee1 Orocobre Limited appointed Masaharu Katayama to the Board of Directors on 12 April 2018 following the strategic placement of Orocobre shares to TTC (ASX announcement 16 January 2018), under the terms of which TTC is entitled to appoint a representative to the Orocobre Board of Directors.
OROCOBRE ANNUAL REPORT 2018 45
For
per
sona
l use
onl
y

Indemnification of Officers
During the financial year the Company paid an insurance premium in respect of a contract insuring the Company’s past, present and future Directors, secretary or officer of the Company against liabilities arising as a result of work performed in their capacity as Director, secretary or officer of the Company. The Directors have not included details of the nature of the liabilities covered or the amount of the premium paid in respect of Directors and officers liability insurance contracts as such disclosure is prohibited under the terms of the contract. The Company Constitution also contains an indemnity provision in favour of each Director, Company Secretary and executive officers (or former officers) against liability incurred in this capacity, to the extent permitted by law.
Indemnification of Auditors
The Company’s auditor is Ernst & Young. The Company has agreed with Ernst & Young, as part of its terms of engagement, to indemnify Ernst & Young against certain liabilities to third parties arising from the audit engagement. The indemnity does not extend to any liability resulting from a negligent, wrongful or wilful act or omission by Ernst & Young. During the financial year, the Company has not paid any premium in respect to any insurance for Ernst & Young or a body corporate related to Ernst & Young and there were no officers of the Company who were former partners or directors of Ernst & Young, whilst Ernst & Young conducted audits of the Company.
Principal Activities
The principal activities of the Group during the year were the exploration, development and production of lithium at the Company’s flagship Olaroz Lithium Facility and the operation of Borax.
Operating & Financial Review
The operations, financial position, business strategies and prospects for future financial years of the consolidated entity are detailed in the Operating and Financial Review section of this Annual Report, on pages 15 to 37, and in the Financial Report section, on pages 69 to 127.
Significant Changes in the State of Affairs
Other than matters mentioned in this report, there were no significant changes in the state of affairs of the Company during the financial year.
Significant Events after Balance Sheet Date
There were no significant events after Balance Sheet Date other than as detailed in Note 27 of the financial statements.
Likely Developments and Expected Results
Refer to the Operating and Financial Review for information on likely developments and future prospects of the Group.
Risk Management
Orocobre’s business faces certain risks that could affect the success of the strategies and the outlook for future financial years. These include, but are not limited to, the continuing development and improvement of good operating practices at the Olaroz Lithium Facility, the optimisation of plant performance and the associated production rate ramp up; production of product within the required specification at the Olaroz Lithium Facility, the achievement of the design production rate for lithium carbonate, the brine grade, the expected operating costs and recoveries at the Olaroz Lithium Facility and the comparison of these costs to global operating costs, the ongoing working relationship between Sales de Jujuy S.A. and the Province of Jujuy (JEMSE), and the meeting of all relevant banking covenants in respect to the operation of the Olaroz Lithium Facility. With respect to Borax the risks associated with the business are the weaknesses in the Company’s traditional markets and strong competition from other producers in these markets, challenges in developing new markets, and the implementation of unit cost reduction measures, local inflation and production. Other risks applicable to all of Orocobre’s operations include Argentina sovereign risk both at a national and provincial level, changes in government regulations, policies or legislation, fluctuations or decreases in product prices and currency, the impact of inflation on local costs, the ongoing impact of devaluation of the AR$ and risks associated with adverse weather patterns and consequent potential negative
46
For
per
sona
l use
onl
y

impacts on production rates. Readers are cautioned that the foregoing list is not exhaustive of all factors and assumptions which may have been used. Please also refer to the Caution Regarding Forward Looking Information statement.
The Company has in place risk management policies and systems to mitigate these risks wherever possible, including monitoring ongoing exploration results, monthly review of operational results for SDJ and Borax and continued discussions with JV partners and the government of Argentina. Within its operations in Argentina, the Company has instituted ISO 31000, Risk Management, to act comprehensively on all its areas of activity.
Environmental Regulation and Performance
The Company has operations in two provinces in Argentina, Jujuy and Salta. In Salta there are Provincial and National environmental regulations: Provincial Constitution (art. 30, 81, 82 y 83), Environmental Protection Provincial Law No. 7070 and Provincial Decree No 3097/00 and 1587/03 among others, Law No. 7017 of Waters Code of Salta Province and its regulatory decree, Provincial Law No 7141 of the Mining Procedure Code, National Constitution (art 41 and 124 among others), General National Environmental Law No. 25.675 and National Law 1919 and 24.585. The applicable authority in Salta is the Mining Secretary of the Province of Salta and the Environmental Secretary of the Province of Salta.
In Jujuy there are both provincial and national environmental regulations: Provincial Constitution (art.22), Water Code of Jujuy, Law 3820 Wildlife Reserve of Fauna & Flora, Law 6002 Dangerous Residues Regulation, Decree 5772-P-2010, Provincial Environmental Law No. 5063, National Constitution (art 41), General National Environmental Law No. 25.675, National Law 24.585 and National Law Dangerous Residues Regulation.
The applicable authority in Jujuy is the Provincial Department of Mining and Energy Resources (Dirección Provincial de Mineria y Recursos Energeticos) and the Provincial Department of Environmental Quality (Dirección Provincial de Calidad Ambiental).
There have been no reportable environmental events under the regulations in Jujuy or Salta due to the Company’s activities.
Within its’ operations in Argentina, the Company has instituted ISO 31000, Risk Management. This complements ISO 9001, Quality Assurance, ISO 14001 Environmental Management and OHSAS 18001 Occupational Health and Safety Management System which had already been implemented in FY12. Borax is already accredited under ISO 9001 and ISO 14001 plus SALTA ECOSELLO regarding environmental management.
Non-Audit Services
The Group’s auditor, Ernst & Young, did not undertake any non-audit services for Orocobre Limited during the current or prior year.
Rounding of Amounts
The amounts contained in this report and in the financial statements have been rounded to the nearest thousand dollars unless otherwise stated (where rounding is applicable) under the option available to the Company under ASIC Corporations (Rounding in Financial/Directors’ Reports) Instrument 2016/191. The Company is an entity to which the instrument applies.
Auditor Independence
A copy of the auditor’s independence declaration as required under section 307C of the Corporations Act 2001 is contained within this report.
OROCOBRE ANNUAL REPORT 2018 47
For
per
sona
l use
onl
y

Dear Shareholder,
We are writing this letter to provide introductory comments to this year’s remuneration report. Needless to say, we were pleased with the 96% yes vote for last year’s report. We hope that this year’s report will elicit equally strong support for our remuneration philosophy, plans and practices.
Executive Key Management Personnel (Executive KMPs) should receive total remuneration at approximately the median level for similar sized companies in comparable businesses.
Masaharu Katayama was appointed to the Board in April 2018. There were no other changes to our Executive KMP group.
Remuneration outcomes and changes
During the year, Mercer Consulting was re-appointed as remuneration consultant to our board. On the basis of their review of KMP remuneration, the Chief Executive Officer (CEO), Chief Financial Officer (CFO), Corporate Development Manager (CDM) and Chief Operating Officer (COO) received increases in fixed remuneration of 7%, 6%, 9% and 12% respectively, to bring their fixed remuneration in line with our philosophy.
We have also reviewed the at risk variable compensation of the KMP’s by reducing the STI as a percentage of TFR while increasing in the same proportion the LTI. The objective of shifting to a higher LTI is to further align Orocobre’s executive team with shareholders’ interests and incentivise staff retention.
We continue to be committed to communicating KMP and Non-Executive Director remuneration arrangements in a simple, clear and transparent manner.
We once again assure you that the responsibility for governance and remuneration rests solely with the board, supported by the Remuneration Committee. The objectives of this governance approach continue to ensure that the practices and processes of the Group are sound and are driven by our guiding principles to deliver a world class, low cost industrial minerals and chemicals company for the benefit of our shareholders and other stakeholders.
The board continues to be strongly committed to remuneration philosophy, policies and practices that are fair, competitive, effective and responsible and to their transparent and clear communication. We will continue to work diligently to ensure that these standards are met.
Courtney Pratt Non-Executive Director Chair of the Orocobre Remuneration Committee
Remuneration ReportLetter from the Chair
48
For
per
sona
l use
onl
y
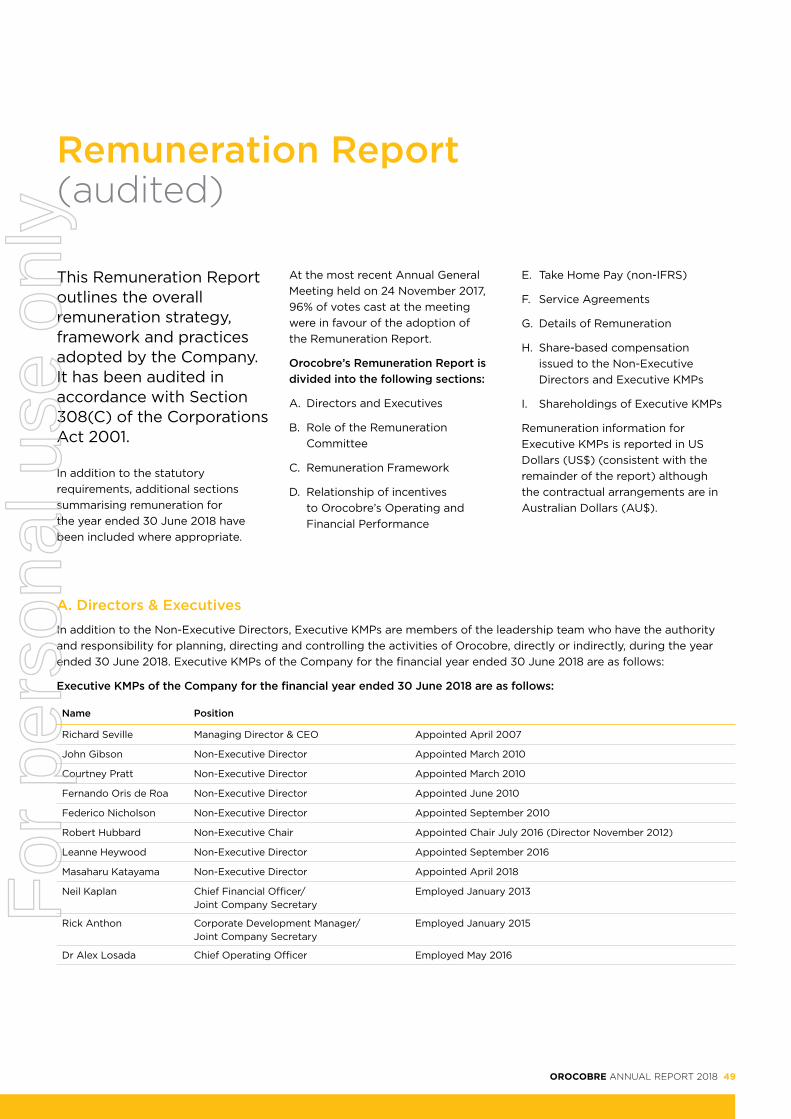
Remuneration Report(audited)
This Remuneration Report outlines the overall remuneration strategy, framework and practices adopted by the Company. It has been audited in accordance with Section 308(C) of the Corporations Act 2001.
In addition to the statutory requirements, additional sections summarising remuneration for the year ended 30 June 2018 have been included where appropriate.
At the most recent Annual General Meeting held on 24 November 2017, 96% of votes cast at the meeting were in favour of the adoption of the Remuneration Report.
Orocobre’s Remuneration Report is divided into the following sections:
A. Directors and Executives
B. Role of the Remuneration Committee
C. Remuneration Framework
D. Relationship of incentives to Orocobre’s Operating and Financial Performance
E. Take Home Pay (non-IFRS)
F. Service Agreements
G. Details of Remuneration
H. Share-based compensation issued to the Non-Executive Directors and Executive KMPs
I. Shareholdings of Executive KMPs
Remuneration information for Executive KMPs is reported in US Dollars (US$) (consistent with the remainder of the report) although the contractual arrangements are in Australian Dollars (AU$).
A. Directors & Executives
In addition to the Non-Executive Directors, Executive KMPs are members of the leadership team who have the authority and responsibility for planning, directing and controlling the activities of Orocobre, directly or indirectly, during the year ended 30 June 2018. Executive KMPs of the Company for the financial year ended 30 June 2018 are as follows:
Executive KMPs of the Company for the financial year ended 30 June 2018 are as follows:
Name Position
Richard Seville Managing Director & CEO Appointed April 2007
John Gibson Non-Executive Director Appointed March 2010
Courtney Pratt Non-Executive Director Appointed March 2010
Fernando Oris de Roa Non-Executive Director Appointed June 2010
Federico Nicholson Non-Executive Director Appointed September 2010
Robert Hubbard Non-Executive Chair Appointed Chair July 2016 (Director November 2012)
Leanne Heywood Non-Executive Director Appointed September 2016
Masaharu Katayama Non-Executive Director Appointed April 2018
Neil Kaplan Chief Financial Officer/ Joint Company Secretary
Employed January 2013
Rick Anthon Corporate Development Manager/ Joint Company Secretary
Employed January 2015
Dr Alex Losada Chief Operating Officer Employed May 2016
OROCOBRE ANNUAL REPORT 2018 49
For
per
sona
l use
onl
y

B. Role of the Remuneration Committee
In accordance with best practice, the Remuneration Committee is comprised of Non-Executive Directors of which a majority are independent. It is chaired by an Independent Non-Executive Director other than the Chair. The membership of the committee is comprised of Mr Courtney Pratt — Committee Chair, Mr Robert Hubbard and Mr Federico Nicholson as detailed in the Directors’ Report.
The Remuneration Committee’s role and interaction with the Board, internal and external advisors, is determined by its Charter:
The Board reviews, applies judgment and, as appropriate, approves the Remuneration Committee’s recommendations
The Remuneration Committee operates under the delegated authority of the Board. The Remuneration Committee is able to source internal resources and to obtain independent professional advice it considers necessary to enable it to make recommendations to the Board on the following:
• Remuneration policy, strategy, quantum and mix of remuneration for executive KMP
• Remuneration policy and quantum for Non-Executive Directors
• People and talent management, policies and practices
• Superannuation arrangements
• Performance target setting and measurement for executive KMP
• Design and approval of employee and executive short and long-term incentive programs
For each annual remuneration review cycle, the Remuneration Committee considers whether to appoint a remuneration consultant and, if so, their scope of work. During the year the remuneration consultant Mercer Consulting (Australia) Pty Ltd was re-appointed. Remuneration recommendations and other related remuneration advice were provided by Mercer to the Remuneration Committee, including market benchmarking.
The Board and Mercer are satisfied that the advice received from Mercer is free from undue influence from the Executive KMPs to whom the remuneration recommendations apply. Mercer was paid a total of US$10,080 (AU$13,000) (2017: US$25,637 / AU$34,000) for remuneration related services.
C. Remuneration Framework
Remuneration for the Executive KMPs is determined by reviewing what is paid for similar roles in Australia and internationally for a company that has operations in South America in order to provide a holistic view of Orocobre’s market for executive talent. The Company’s remuneration philosophy is articulated in Orocobre’s Corporate Governance Charter Section D — Remuneration Committee Charter which provides that the Remuneration Committee will in accordance with clause D4 (a) of this Charter, ensure that the remuneration policies:
1. Motivate Directors and Management to pursue the long- term growth and success of the Company within an appropriate control framework; and
2. Demonstrate a clear relationship between key executive
performance and remuneration.
Under clause D3 (b) paragraph (1) and (3) the Charter also states that:
1. Management should be remunerated at an appropriate balance of fixed remuneration and performance-based remuneration; and
2. Any performance-based remuneration should be clearly linked to specific performance targets which are aligned to the Company’s short and long-term performance objectives.
The Remuneration Committee has once again undertaken a detailed evaluation of its remuneration practices to ensure it remains contemporary and meets the objectives set out above. Orocobre endeavours to adopt a fair and equitable approach to all remuneration decisions, mindful of the complexities of retaining and motivating an experienced team operating across diverse geographies, different time zones and in a complex operating environment.
In implementing this philosophy, Orocobre needs to consider many variables, including:
1. The remuneration paid by the Company’s peers (by reference to industry, market capitalisation and relevant geographic location);
2. The Company’s performance over the relevant period;
3. How to link remuneration to successful implementation of the Company’s strategy, including the annual targets which need to be achieved to implement that strategy;
Remuneration Report(audited)
50
For
per
sona
l use
onl
y

4. Internal relativities and differentiation of pay based on performance;
5. The demands placed on certain executives to work considerable periods of time overseas and outside normal working hours;
6. The size, scale, location and complexity of the operations of the Company; and
Market developments and changes in remuneration practices.
Non-Executive Directors
The maximum aggregate remuneration of Non-Executive Directors is determined by the shareholders at a general meeting. The current aggregate fee pool is AU$850,000 (US$659,120) (2017: AU$600,000 / US$452,420)1 which was established and approved at the 2017 AGM.
The Chair fee and Non-Executive Directors Fees were increased by 25%2. The previous increase occurred 3 years ago on 1 January 2015. The total fees paid are within the current aggregate fee pool as detailed above. The increases reflect the growing complexity and size of Orocobre’s
activities. They were based on external benchmarking by Mercer of listed companies of similar market capitalisation, complexity and stage development of Orocobre.
From March to October 2017, Fernando Oris de Roa, a director, provided an expanded role encompassing specific tasks in Argentina as advised by the CEO. For such role, he was paid US$27,934. Other Non-Executive Directors are paid a base fee only. No separate Committee fees are paid.
Non-Executive Directors receive reimbursement for any costs incurred directly related to Orocobre business on an approved basis.
Annualised fees (including Superannuation) for the relevant periods were as follows:
30 June 2018 1,2 30 June 2017 1,2
US$ AU$ US$ AU$
Position – Non-Executive Directors
Chair 145,394 187,500 113,105 150,000
Other Non-Executive Directors 77,543 100,000 60,236 80,000
1 Average exchange rates as at date of payment used for the conversion from A$ to US$ are as follows: July 2017 – June 2018 – 1 US$: 1.2896 AU$ July 2016 – June 2017 – 1 US$: 1.3262 AU$
2 Increases were effective from 1 January 2018
OROCOBRE ANNUAL REPORT 2018 51
For
per
sona
l use
onl
y

Managing Director and Other Executive KMPs
Orocobre intends to provide an appropriate mix of remuneration components balanced between fixed and ‘at risk’ components. During the financial year, the Remuneration Committee commenced a review of the balance of short-term incentives (STIs) and long-term incentives (LTIs) to appropriately motivate its Executive KMPs and align their interests more closely with shareholders. This review considered the opportunities available to Orocobre, the state of the lithium market, the retention benefits of LTI plans and was supported by comparative benchmarking by Mercer. Overall the Non-Executive Directors believe shareholders would benefit from greater alignment between Executive KMP reward and growth in shareholder value and hence greater balance to the LTI component.
The planned remuneration and composition can be illustrated as follows:
Position
Fixed Remuneration 1 STI 2 LTI
2018 2017 2018 2017 2018 2017
CEO / Managing Director (CEO) 41% 41% 11% 31% 48% 28%
Other Executives
Chief Financial Officer (CFO) 47% 54% 5% 17% 48% 29%
Corporate Development Manager (CDM) 47% 54% 5% 17% 48% 29%
Chief Operating Officer (COO) 47% 55% 5% 18% 48% 27%
Position
Fixed Remuneration 1 STI 2 LTI
2018US $
2017US $
2018US $
2017US $
2018US $
2017US $
CEO / Managing Director (CEO) 521,480 490,122 134,732 367,592 604,839 335,700
Other Executives
Chief Financial Officer (CFO) 322,106 298,767 33,115 91,327 331,149 160,609
Corporate Development Manager (CDM) 284,332 262,036 29,719 79,196 297,185 142,512
Chief Operating Officer (COO) 308,846 259,039 32,690 84,829 326,904 154,940
1 Salary increases effective 1 January 2018. For FY18 Executive KMPs were paid 50% of CY17 and 50% of CY18 from the above fixed remuneration.2 Excluding discretionary additional bonus described within STIs section C Average exchange rates used for the conversion from AU$ to US$ are as follows: July 2017 – June 2018 – 1 US$: 1.2896 AU$ July 2016 – June 2017 – 1 US$: 1.3262 AU$
Remuneration Report(audited)
52
For
per
sona
l use
onl
y

Fixed remuneration (summary of contracts)
The Remuneration Committee approved increases to fixed remuneration during the year, as shown below, to reflect the growing complexity and size of Orocobre’s activities. These increases were based on external benchmarking by Mercer of listed companies of similar market capitalisation, complexity and stage development to Orocobre. In considering the extent of the increases the Committee has placed most attention on the current complexity of Orocobre, its development objectives and the demands placed upon the executive team. The Committee appreciates that whilst market capitalisation is one factor, lithium price expectations are a major driver of this and this is outside of management’s control. Consequently, share price growth has been a secondary factor in deriving fixed remuneration.
Name/Position % Increase in AU$1
Fixed Remuneration
30 June 2018 30 June 2017
US$2 AU$ US$ 2 AU$
Richard Seville (CEO) 7% 538,927 695,000 490,122 650,000
Neil Kaplan (CFO) 6% 331,149 427,050 304,422 403,725
Rick Anthon (CDM) 9% 297,185 383,250 263,987 350,099
Dr Alex Losada (COO) 12% 326,904 421,575 282,763 375,000
1 Salary increases were effective from 1 January 20182 Average exchange rates for the conversion from AU$ to US$ are as follows: July 2017 – June 2018 – 1 US$: 1.2896 AU$ July 2016 – June 2017 – 1 US$: 1.3262 AU$
OROCOBRE ANNUAL REPORT 2018 53
For
per
sona
l use
onl
y

Short-term incentives
The cash STI component of executive incentives was reduced in proportion to the increase in the LTI component in 2018. For all Executive KMPs the maximum pool available for STI is $230,256 excluding the special bonus paid following the successful completion of the TTC strategic placement. Consequently, the drivers of the STI now more substantively reflect individual goals of Executive KMPs integral to achieving the strategic corporate objectives of Orocobre and its annual business plan and budget. By way of examples individual goals include items such as successful implementation of technology projects, specific business improvement and business growth
initiatives, efficient management of related party shareholder interests and stakeholder relationships. Individual executive goals are defined and measurable. The award of STIs based on achievement of these individual goals is also viewed in the context of the overall operating and financial performance of Orocobre. Performance against the annual business plan and budget has been considered in three broad areas of annual production, unit cost and sustainability goals in relation to safety, environment and social performance.
Whilst in 2018 the production and cost goals were not achieved, partly
due to the adverse weather conditions suffered in early 2018, operations moved to a more stable footing with enhanced systems maturity improved operational expertise and understanding. Sustainability goals, a key management focus, where largely reached as the Company continued to build a consistent culture of sustainability. The Company in now considered a lithium industry leader in this area. Significant progress was also made on expansion projects including the propose Stage 2 expansion and the Naraha Lithium Hydroxide plant which will lay the foundation for ongoing near and medium-term production and revenue growth.
The following percentage of STI targets have been awarded for 2018:
Name/Position FY
STI OpportunitySTI Accrued /
PaidAchieved Forfeited
US$1,2 % of FR US$1,2,3 % %
Richard Seville (CEO)2018 134,732 25% 36,913 27% 73%
2017 367,592 75% 113,105 31% 69%
Neil Kaplan (CFO)2018 33,115 10% 15,121 46% 54%
2017 91,327 30% 60,323 66% 34%
Rick Anthon (CDM)2018 29,719 10% 13,570 46% 54%
2017 79,196 30% 60,323 76% 24%
Dr Alex Losada (COO) 2018 32,690 10% 14,927 46% 54%
2017 84,829 30% 60,323 71% 29%
1 Average exchange rates for the conversion from AU$ to US$ are as follows: July 2017 – June 2018 – 1 US$: 1.2896 AU$ July 2016 – June 2017 – 1 US$: 1.3262 AU$
2 Based on salary including Superannuation contributions3 Exclude discretionary bonus described below
Remuneration Report(audited)
54
For
per
sona
l use
onl
y

Discretionary additional bonus
In addition to the STI presented above, the Executive KMPs mentioned below were allocated a one-off bonus as a result of the successful strategic placement to Toyota Tsusho Corporation. These amounts have been included in the STI disclosure in section G.
2018
Name/Position US$1 AU$
Richard Seville (CEO) 86,310 109,500
Neil Kaplan (CFO) 51,785 65,700
Rick Anthon (CDM) 103,570 131,400
1 Average exchange rates as at date of payment used for the conversion from AU$ to US$ are as follows:
February 2018 – 1 US$: 1.2687 AU$
OROCOBRE ANNUAL REPORT 2018 55
For
per
sona
l use
onl
y

Long-term incentives
For FY18, the Company provided the LTI to Executive KMPs through the Performance Rights and Option Plan (PROP). This plan was approved by shareholders at the 2012 Annual General Meeting. The Managing Director’s LTI grant was approved at a General Meeting of shareholders held on 24 November 2017. There are no options outstanding at 30 June 2018.
The objective of the grant of Performance Rights (PR) is to provide an incentive to Executive KMPs which promotes both the long-term performance and growth of the Company and encourages the retention of the Company’s executives and the attraction of new executives to the Company.
The remuneration table in Section H provide details of LTI grants to Executive KMPs. The tables also detail the vesting periods and lapsing of Performance Rights.
Remuneration Report(audited)
The following table summarises the key features of the Performance Rights issued to the Executive KMPs for the year ended 30 June 2018.
Performance Rights
Description It is a contemporary risk equity long-term incentive plan which allows the Company to provide Performance Rights to eligible and invited employees, subject to the terms of the plan. PR are supported by the Orocobre Employee Share Scheme Trust which has been established to facilitate and manage the issue or acquisition of shares on the settlement of vested Rights, if any.
Grant date The Rights were granted on 24 November 2017 and 2 March 2018
Performance period/ Exercise price
There is a 3-year vesting period.The vesting date for the Performance Rights is the later of 31 August 2020 or date of release of the Company’s financial results for the 2020 financial year. Vesting of the 2018 Performance Rights are subject to the matrix of outcomes. The shares acquired on vesting of Performance Rights, if any, will be at no cost to the Executive KMPs as long as they meet the conditions.Whether the Company settles Rights from a new issue or by on-market purchase will usually be determined by the Board, at the time of vesting and exercise.
Retesting Performance conditions will be tested at the vesting date and if the performance conditions have not been met, the Rights will lapse.
Forfeited Unless the Board otherwise determines, the Rights will lapse on the earlier of:The cessation of the employment of the participant.The vesting conditions are not achieved or are incapable of being achieved by the participant.The Board determines that the vesting conditions have not been met prior to the expiry date.The expiry date (last exercise date).
Dividends Performance Rights are not entitled to dividends nor other distributions. Shares acquired on vesting and exercise of Performance Rights will be ordinary securities and entitled to dividends, if any. No dividends apply before vesting and exercise.
Restrictions Participants cannot secure, mortgage or create a lien in respect of their interests in PROP.
All Executive KMPs have been advised that under section 206J of the Corporations Act it is an offence for them to hedge unvested grants made under the PROP.
Change of control In the event of a takeover or change of control, any unvested Performance Rights will vest immediately.
Dilution The issue of shares under the PROP can have a small dilutionary impact. Currently, the number of Performance Rights or Options granted under this Plan must not exceed, when aggregated with any shares issued during the previous 5 years pursuant to any other employee share scheme operated by the Company, a maximum of 5% of the total issued capital of the Company at the time of the grant, excluding unregulated offers. Offers made, that rely on Class Order 14/1000 (effective from October 2014) will not exceed 5% of shares on issue as a result of any offers made during the previous 3 year period.
56
For
per
sona
l use
onl
y

The performance conditions applicable to each grant are summarised as follows:
TSR Hurdle: Absolute (50% of LTI Grant) FY 2018 results TSR Hurdle: Relative (50% of LTI Grant) FY 2018 results
TSR performance over the Measurement Period and subject to meeting the following compound
annual rate thresholds:
TSR performance over the Measurement Period relative to the constituent companies of the ASX300 Resources
Index subject to the following thresholds:
Target return per annum % Vesting% Achieved
2015 PR1 Target percentile % Vesting% Achieved
2015 PR
Greater than 12.5% 100%Starting at 2.72Adding 12.5%Year 1: 3.06Year 2: 3.44Year 3: 3.87
Greater than 75th 100% Per Independent Third Party calculation,
70th percentile was achieved
Greater than 10.0% 75% Equal to or greater than 50th 50%
At least 7.5% 50% Less than 50th 0%
Less than 7.5% 0%
Interpolated vesting on a straight line where the return per annum is between
7.5% and 12.5%.
Achieved: 3.86 or 99%
Interpolated vesting on a straight line between the 50th and 75th percentile.
Achieved: 90%
1 The starting position for the Absolute TSR Hurdle is the VWAP of the shares for the 5 day period immediately following the release of the Annual Report: FY 2016 - 1.6726 FY 2017 - 3.7500
Long-term equity incentive grants to selected key executives, including Executive KMPs, are considered on an annual basis. They are subject to a three-year performance period. The value granted of LTI grants are calculated on a set percentage of fixed remuneration.
Position FYNumber of PR granted1
Face value2
A$Face value3
US$
Fair Value of LTI Granted
during the year4
US$Value as a % of FR
Richard Seville (CEO)2018 197,769 780,000 604,839 756,996 120%5
2017 118,721 445,204 335,700 262,726 75%
Neil Kaplan (CFO)2018 108,278 427,050 331,149 386,317 100%
2017 56,800 213,000 160,609 53,188 60%
Rick Anthon (CDM)2018 97,173 383,250 297,185 346,697 100%
2017 50,400 189,000 142,512 47,195 60%
Dr Alex Losada (COO)2018 106,890 421,575 326,904 381,365 100%
2017 54,795 205,481 154,940 51,310 60%
1 The 2018 number of rights granted is equal to the LTI value divided by the Company’s 5 day VWAP of the Company’s Shares of AU$3.944 for the period ended 7 September 2017
2 Face value represents the LTI amount achieved used to calculate the number of PR’s granted.3 Converted at the same average rate consistent with other tables4 The value at grant date calculated in accordance with AASB 2 Share-based Payment of awards granted during the year as part of remuneration. More information is available in section H.
5 R Seville’s LTI was calculated as a percentage of FY17 Fixed Remuneration.
OROCOBRE ANNUAL REPORT 2018 57
For
per
sona
l use
onl
y

D. Relationship of Incentives to Orocobre’s Operating and Financial Performance
The fundamental aim of Orocobre is to create benefit for shareholders by establishing operations that produce high quality products from relatively low capital and low operating cost operations. The Company is equally committed to achieving excellence in sustainability practices ensuring the safety, health and wellbeing of its
employees, and responsibly managing the impacts to the communities and the environment within which it operates. Accordingly, remuneration is linked to sustainability performance at all levels of the organisation to reinforce sustainability as a core value. In terms of Orocobre’s performance over the course of FY18, besides the strategic corporate objectives and the annual business plan and budget, the individual goals, as detailed under Short-term incentives
on page 54, are also viewed in in the context of the overall operating and financial performance of Orocobre. Performance against the annual business plan and budget has been considered in three broad areas of annual production, unit cost and sustainability goals in relation to safety, environment, and social performance.
Remuneration Report(audited)
The table below shows the actual proportion of the total remuneration that is linked to performance and the proportion that is fixed:
Name
Fixed remuneration At risk – STI 1 At risk – LTI Total
2018 2017 2018 2017 2018 2017 2018 2017
% % % % % % % %
CEO/Managing Director
Richard Seville (CEO) 57% 61% 4% 13% 39% 26% 100% 100%
Other executive KMP
Neil Kaplan (CFO) 65% 67% 3% 12% 32% 21% 100% 100%
Rick Anthon (CDM) 62% 63% 3% 14% 35% 23% 100% 100%
Dr Alex Losada (COO) 70% 79% 3% 17% 27% 4% 100% 100%
1 Excluding the discretionary additional bonus described in section C
58
For
per
sona
l use
onl
y

The graph below shows the complete historical movement in the share price and market capitalisation against the evolution of the ASX 200 Index. Over the past 12 months the market capitalisation has increased by 140% and share price has increased by 49% in comparison to the prior year in AU$ terms.
Orocobre Limited Historical Share Price, Market Capitalization and S&P ASX 200 Index (Rebased):
1400
1200
1000
800
600
400
200
0
6
5
4
3
2
1
0
Mar
ket
Cap
ital
isat
ion
(A$
M)
A$
sha
re p
rice
/reb
ased
ind
ex
Jun 08 Jun 09 Jun 10 Jun 11 Jun 12 Jun 13 Jun 14 Jun 15 Jun 16 Jun 17 Jun 18
A$ Market Capitalization A$ Per Share S&P ASX 200 Index (Rebased)
Year 30-Jun-14 30-Jun-15 30-Jun-16 30-Jun-17 30-Jun-18
A$ per share $2.26 $2.10 $4.79 $3.47 $5.17
US$ market capitalisation (‘000) $280.94 $244.85 $746.49 $561.91 $1,348.00
Basic Earnings / Loss Per Share (EPS) (US cents)* $(4.03) $(0.59) $(11.91) $9.19 $0.83
US$ profit/(loss) (‘000) $(5,093) $(845) $(21,913) $19,439 $1,920
S&P ASX 200 5396 5459 5233 5722 6195* Basic EPS is calculated as net profit/(loss) after tax and non-controlling interests (statutory profit/(loss)) divided by the weighted average number of ordinary shares.
OROCOBRE ANNUAL REPORT 2018 59
For
per
sona
l use
onl
y
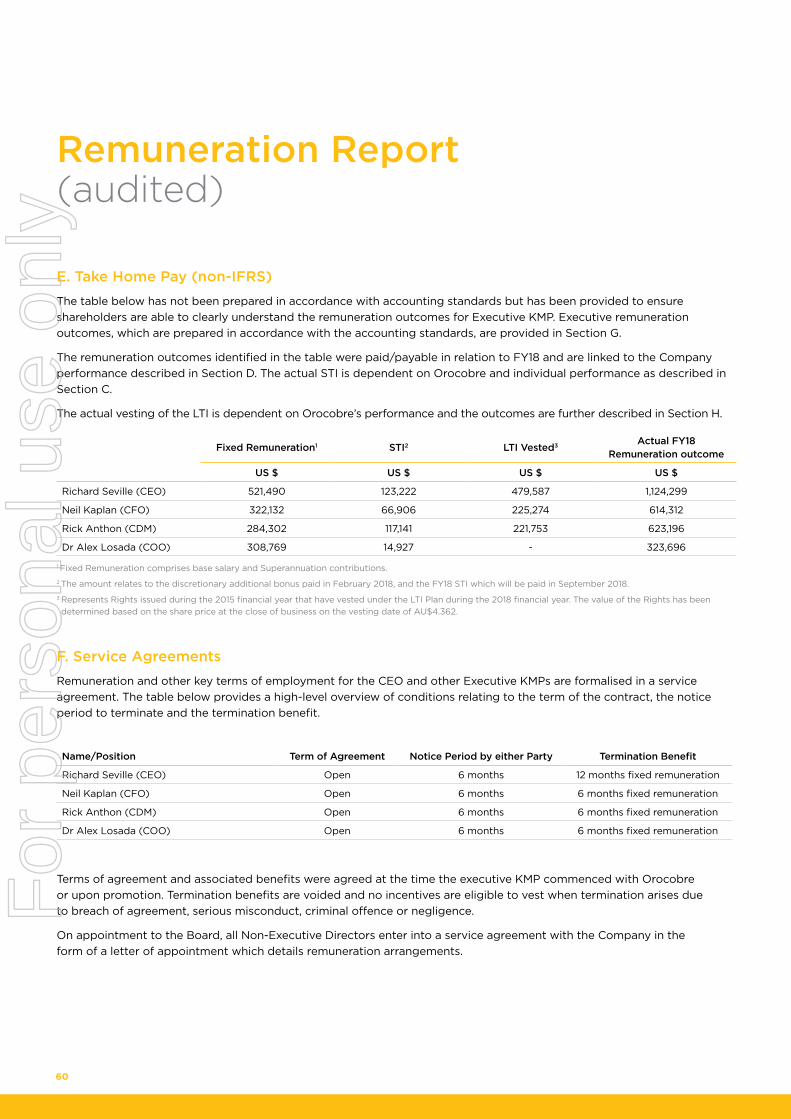
E. Take Home Pay (non-IFRS)
The table below has not been prepared in accordance with accounting standards but has been provided to ensure shareholders are able to clearly understand the remuneration outcomes for Executive KMP. Executive remuneration outcomes, which are prepared in accordance with the accounting standards, are provided in Section G.
The remuneration outcomes identified in the table were paid/payable in relation to FY18 and are linked to the Company performance described in Section D. The actual STI is dependent on Orocobre and individual performance as described in Section C.
The actual vesting of the LTI is dependent on Orocobre’s performance and the outcomes are further described in Section H.
Fixed Remuneration1 STI2 LTI Vested3 Actual FY18 Remuneration outcome
US $ US $ US $ US $
Richard Seville (CEO) 521,490 123,222 479,587 1,124,299
Neil Kaplan (CFO) 322,132 66,906 225,274 614,312
Rick Anthon (CDM) 284,302 117,141 221,753 623,196
Dr Alex Losada (COO) 308,769 14,927 - 323,696
1 Fixed Remuneration comprises base salary and Superannuation contributions. 2 The amount relates to the discretionary additional bonus paid in February 2018, and the FY18 STI which will be paid in September 2018. 3 Represents Rights issued during the 2015 financial year that have vested under the LTI Plan during the 2018 financial year. The value of the Rights has been determined based on the share price at the close of business on the vesting date of AU$4.362.
F. Service Agreements
Remuneration and other key terms of employment for the CEO and other Executive KMPs are formalised in a service agreement. The table below provides a high-level overview of conditions relating to the term of the contract, the notice period to terminate and the termination benefit.
Name/Position Term of Agreement Notice Period by either Party Termination Benefit
Richard Seville (CEO) Open 6 months 12 months fixed remuneration
Neil Kaplan (CFO) Open 6 months 6 months fixed remuneration
Rick Anthon (CDM) Open 6 months 6 months fixed remuneration
Dr Alex Losada (COO) Open 6 months 6 months fixed remuneration
Terms of agreement and associated benefits were agreed at the time the executive KMP commenced with Orocobre or upon promotion. Termination benefits are voided and no incentives are eligible to vest when termination arises due to breach of agreement, serious misconduct, criminal offence or negligence.
On appointment to the Board, all Non-Executive Directors enter into a service agreement with the Company in the form of a letter of appointment which details remuneration arrangements.
Remuneration Report(audited)
60
For
per
sona
l use
onl
y

G. Details of Remuneration
Details of the nature and amount of each major element of the remuneration of each KMP is as follows:
Short-Term Employee BenefitsPost-
Employment Benefits
Long-Term Employee Benefits
Equity Settled Options
Name
Directors’ Fees/Base
Salary US $
Annual Leave
movementUS $
Short-Term
Incentive1
US $
Non-monetary Benefits
US $
Super-annuation
US $
Long service leaveUS $
Share-based
Payments2
US $
Total Remuneration
US $
Non-Executive Directors
James Calaway (Resigned 19 July 2016)
2018 - - - - - - - -
2017 9,975 - - - - - - 9,975
Courtney Pratt2018 69,053 - - - - - - 69,053
2017 60,257 - - - - - - 60,257
John Gibson2018 69,053 - - - - - - 69,053
2017 60,257 - - - - - - 60,257
Fernando Oris de Roa2018 84,987 - - - - - - 84,987
2017 72,257 - - - - - - 72,257
Federico Nicholson2018 69,053 - - - - - - 69,053
2017 60,257 - - - - - - 60,257
Masaharu Katayama2018 16,219 - - - - - - 16,219
2017 - - - - - - - -
Robert Hubbard2018 118,241 - - - 11,233 - - 129,474
2017 100,723 - - - 9,569 - - 110,292
Leanne Heywood2018 63,062 - - - 5,991 - - 69,053
2017 42,248 - - - 4,847 - - 47,095
Total Non-Executive Directors
2018 489,668 - - - 17,224 - - 506,892
2017 405,974 - - - 14,416 - - 420,390
CEO/Managing Director
Richard Seville (CEO)2018 501,972 15,154 123,222 1,933 19,518 19,267 379,566 1,060,632
2017 469,268 12,060 113,105 3,949 26,440 10,834 230,446 866,102
Other Executive KMP
Neil Kaplan (CFO)2018 302,661 (6,973) 66,906 2,918 19,471 8,847 161,373 555,203
2017 279,655 - 60,323 3,091 22,680 7,621 101,954 475,324
Rick Anthon (CDM)2018 264,798 7,312 117,141 2,879 19,504 7,767 171,588 590,989
2017 239,336 (6,486) 60,323 3,348 23,376 5,963 101,798 427,658
Dr Alex Losada (COO)2018 289,282 4,599 14,927 889 19,487 7,929 123,106 460,219
2017 243,779 20,862 60,323 794 23,159 6,421 14,051 369,389
Total Managing Director & Other Exec. KMP
2018 1,358,714 20,092 322,196 8,619 77,979 43,810 835,633 2,667,043
2017 1,232,038 26,436 294,074 11,182 95,655 30,839 448,249 2,138,473
‡ The average exchange rates used for the conversion from A$ to US$ are as follows: July 2017 – June 2018 – 1 USD: 1.2896 AUD | July 2016 – June 2017 – 1 USD: 1.3262 AUD
1 For the breakdown of the Short-Term Incentives, please see Section C for details. 2 The value for Long-Term Incentives presented in the table above is calculated in accordance with AASB 2 Share Based Payment and represents instruments granted under the LTI equity plans that have been expensed during the current year. The fair values of LTIs have been calculated by an independent third party.
OROCOBRE ANNUAL REPORT 2018 61
For
per
sona
l use
onl
y

H. Share-based compensation issues to the Non-Executive Directors and Executive KMPs
The table below highlights the movement in Rights for the Executive KMP in 2018.
Movement during the year
Grant Date1 Vesting DateBalance at 1 July 2017
Rights granted3
Rights exercised
Rights lapsed
Balance at 30 June
2018
Unvested4 As at 30
June 2018
Richard Seville (CEO)
21/11/14 31/08/17 150,039 - (141,787) (8,252) - -
06/11/15 31/08/18 244,380 - - - 244,380 244,380
23/11/16 31/08/19 118,721 - - - 118,721 118,721
24/11/17 31/08/20 - 197,769 - - 197,769 197,769
Total Number 513,140 197,769 (141,787) (8,252) 560,870 560,870
Total value US$2 698,211 756,996 (198,534) (12,610) 1,208,730 1,208,730
Neil Kaplan (CFO)
21/01/15 31/08/17 70,477 - (66,601) (3,876) - -
06/11/15 31/08/18 114,791 - - - 114,791 114,791
31/03/17 31/08/19 56,800 - - - 56,800 56,800
02/03/18 31/08/20 - 108,278 - - 108,278 108,278
Total Number 242,068 108,278 (66,601) (3,876) 279,869 279,869
Total value US$2 258,062 386,317 (93,967) (5,993) 523,330 523,330
Rick Anthon (CDM)
21/01/15 31/08/17 69,376 - (65,560) (3,816) - -
06/11/15 31/08/18 188,330 - - - 188,330 188,330
31/03/17 31/08/19 50,400 - - - 50,400 50,400
02/03/18 31/08/20 - 97,173 - - 97,173 97,173
Total Number 308,106 97,173 (65,560) (3,816) 335,903 335,903
Total value US$2 319,710 346,697 (92,498) (5,899) 546,262 546,262
Dr Alex Losada (COO)
31/03/17 31/08/19 54,795 - - - 54,795 54,795
02/03/18 31/08/20 - 106,890 - - 106,890 106,890
Total Number 54,795 106,890 - - 161,685 161,685
Total value US$2 51,630 381,365 - - 413,021 413,021
1 Rights exercised during the current financial year at a nil exercise price.2 Total value in US$ is based on grant date fair value, not current market value. The value at grant date reflects the fair value of the Right multiplied by the number of Rights granted during the period converted using the exchange rate at the date of grant.
3 The fair values of long-term incentives have been calculated by an independent third-party valuer.4 All Rights become exercisable upon the vesting date. There are no vested and exercisable rights as at 30 June 2018.
Remuneration Report(audited)
62
For
per
sona
l use
onl
y

The table below summarises the details of the grants and assumptions that were used in determining the fair value of Rights on the grant date. A Monte Carlo Simulation is used to value the Performance Rights.
Input Variable Performance Rights
Grant Date 6/11/15 6/11/15 23/11/16 23/11/15 31/03/17 31/03/17 24/11/17 24/11/17 2/03/18 2/03/18
Vesting Date 31/08/18 31/08/18 31/08/19 31/08/19 31/08/19 31/08/19 31/08/20 31/08/20 31/08/20 31/08/20
Expiry Date 30/09/18 30/09/18 30/09/19 30/09/19 30/09/19 30/09/19 30/09/20 30/09/20 30/09/20 30/09/20
Exercise Price (AU$)
0.00 0.00 0.00 0.00 0.00 0.00 0.00 0.00 0.00 0.00
Share Price (Date terms agreed) (AU$)
1.79 1.79 4.27 4.27 2.78 2.78 6.20 6.20 5.88 5.88
Expected Life (Days)
1,095 1,095 1,095 1,095 1,095 1,095 1,095 1,095 1,095 1,095
Expected Volatility
50% 50% 47% 47% 47% 47% 47% 47% 47% 47%
Expected Dividend Yield
0% 0% 0% 0% 0% 0% 0% 0% 0% 0%
Expected Risk Free Rate
1.97% 1.97% 1.85% 1.85% 1.82% 1.82% 1.87% 1.87% 2.01% 2.01%
Performance Conditions
Market (TSR
Absolute)
Market (TSR
Relative)
Market (TSR
Absolute)
Market (TSR
Relative)
Market (TSR
Absolute)
Market (TSR
Relative)
Market (TSR
Absolute)
Market (TSR
Relative)
Market (TSR
Absolute)
Market (TSR
Relative)
Fair Value (Average) (AU$)
1.08 1.37 2.64 3.15 1.03 1.42 5.31 4.73 4.85 4.35
OROCOBRE ANNUAL REPORT 2018 63
For
per
sona
l use
onl
y

I. Shareholdings of Executive KMP
Minimum shareholding guidelines
The Board has no approved minimum shareholding guidelines for Non-Executive Directors at the date of this Report. However, generally Non-Executive Directors have appropriate shareholdings and the Board will continue to review investor expectations in relation to this matter. The Company does not have a formal policy requiring executives to own shares. However, the Directors regularly monitor investor expectations in this regard.
Opening Balance
1-Jul-17 Rights Converted Acquired/(Sold)Closing Balance
30-Jun-18
Richard P. Seville 5,191,829 141,787 38,357 5,371,973
John W. Gibson 37,900 - - 37,900
Courtney Pratt 56,810 - 2,841 59,651
Fernando Oris de Roa 100,000 - - 100,000
Federico Nicholson 100,000 - 21,500 121,500
Robert Hubbard 52,183 - 18,110 70,293
Leanne Heywood - - 14,050 14,050
Neil Kaplan 199,423 66,601 13,303 279,327
Rick Anthon 730,444 65,560 29,004 825,008
Dr Alex Losada 3,540 - 177 3,717
Total 6,472,129 273,948 137,342 6,883,419
The Director’s Report incorporating the Remuneration Report is signed in accordance with a resolution of the Board of Directors.
Robert Hubbard R P. Seville Chairman Managing Director
Signed: 28th day of August 2018
Remuneration Report(audited)
64
For
per
sona
l use
onl
y

A member firm of Ernst & Young Global LimitedLiability limited by a scheme approved under Professional Standards Legislation
Auditor’s Independence Declaration to the Directors of OrocobreLimited
As lead auditor for the audit of Orocobre Limited for the financial year ended 30 June 2018, I declareto the best of my knowledge and belief, there have been:
a) no contraventions of the auditor independence requirements of the Corporations Act 2001 inrelation to the audit; and
b) no contraventions of any applicable code of professional conduct in relation to the audit.
This declaration is in respect of Orocobre Limited and the entities it controlled during the financialyear.
Ernst & Young
Kellie McKenziePartner28 August 2018
Ernst & Young111 Eagle StreetBrisbane QLD 4000 AustraliaGPO Box 7878 Brisbane QLD 4001
Tel: +61 7 3011 3333Fax: +61 7 3011 3100ey.com/au
OROCOBRE ANNUAL REPORT 2018 65
For
per
sona
l use
onl
y

Corporate Governance Statements
Corporate Governance Statement
The Company’s Corporate Governance Statement is structured with reference to the Australian Securities Exchange Corporate Governance Council’s “Corporate Governance Principles and Recommendations, 3rd Edition”.
Corporate Code of Conduct
Orocobre’s Code of Conduct sets out the standard which the Board, Management and employees of the Company are encouraged to comply with when dealing with each other, shareholders and the broader community.
Process for Performance Evaluation
The Chair in conjunction with the Lead Independent Director evaluates the performance of the Board by way of ongoing review with reference to the composition of the Board and its suitability to carry out the Company’s objectives. The Chair reports back to the Board as to its performance at least annually.
Communications with Investors
The Company is committed to (subject to commercial and confidentiality constraints) providing transparent, timely and accurate communications with all shareholders and encouraging their participation at general meetings.
Audit and Risk Management Committee Charter
The Audit and Risk Management Committee Charter sets out the role, responsibilities, composition, authority and membership requirements of the Committee.
Corporate Ethics Policy
To assist Directors in discharging their duty to the Company in compliance with the relevant laws to which they are subject, the Company has adopted a Corporate Ethics Policy.
Related Party Committee Charter
Orocobre’s Related Party Committee Charter defines the purpose, authority and responsibility of the Orocobre Related Party Committee.
Sustainability Report 2017
The Orocobre Sustainability Report seeks to reflect the Company’s ongoing commitment to the local communities in which Orocobre operates, the environment and responsible management of natural resources and the safety of our people, suppliers and communities.
The Government of Canada has proclaimed into force the Extractive Sector Transparency Measures Act (the Act). The Act requires entities engaged in the commercial development of oil, gas and minerals to disclose payments made to all levels of government, both in Canada and internationally.
Extractive Sector Transparency Measures Act Report
The Company’s Corporate Governance Statements are summarized below. All of these documents can be viewed publicly on the Company’s website www.orocobre.com.
66
For
per
sona
l use
onl
y

Disclosure Policy
Orocobre Limited is listed on the Australian Securities Exchange (ASX) and Toronto Stock Exchange and must comply with the Corporations Act, the ASX Listing Rules and the Toronto Stock Exchange Rule Book and Policies.
Orocobre Constitution
The Orocobre Constitution specifies rules that govern the activities of the Company, its Directors and shareholders.
Remuneration Committee Charter
The Orocobre Remuneration Committee Charter sets out the role, responsibilities, composition, authority and membership requirements of the Remuneration Committee.
Diversity Policy
The Company respects and values the competitive advantage of diversity (which includes but is not limited to gender, age, disability, ethnicity, marital or family status, religious or cultural background, sexual orientation and gender identity), and the benefit of its integration throughout the Company in order to enrich the Company’s perspective, improve corporate performance, increase shareholder value and maximise the probability of achievement of the Company’s goals.
Trading Policy
The Orocobre Trading Policy is intended to ensure that persons who are discharging managerial responsibilities including but not limited to Directors, do not abuse, and do not place themselves under suspicion of abusing Inside Information that they may be thought to have, especially in periods leading up to an announcement of the Company.
Orocobre Limited Board Charter
Orocobre’s Board Charter sets out the main principles adopted by the Board of Directors of the Company to implement and maintain a culture of good corporate governance both internally and in its dealings with outsiders. The Board of the Company is committed to administering the policies and procedures with openness and integrity, pursuing the true spirit of corporate governance commensurate with the Company’s needs.
OROCOBRE ANNUAL REPORT 2018 67
For
per
sona
l use
onl
y

Financial Report
68
For
per
sona
l use
onl
y

Financial Statements for the year ended 30 June 2018
Contents Consolidated statement of profit or loss ...................................................................................................................... 70
Consolidated statement of comprehensive income ..................................................................................................... 71
Consolidated statement of financial position ............................................................................................................... 72
Consolidated statement of changes in equity .............................................................................................................. 73
Consolidated statement of cash flows .......................................................................................................................... 74
Note 1: Segment reporting ....................................................................................................................................... 77
Note 2: Expenses, finance income and finance costs ............................................................................................... 80
Note 3: Impairment of assets .................................................................................................................................... 81
Note 4: Discontinued operation................................................................................................................................ 82
Note 5: Income tax .................................................................................................................................................... 82
Note 6: Earnings per share ........................................................................................................................................ 84
Note 7: Trade and other receivables ........................................................................................................................ 85
Note 8: Inventories ................................................................................................................................................... 86
Note 9: Property, plant and equipment .................................................................................................................... 87
Note 10: Exploration, evaluation and development assets ...................................................................................... 88
Note 11: Investment in joint ventures ...................................................................................................................... 89
Note 12: Trade and other payables .......................................................................................................................... 98
Note 13: Provisions ................................................................................................................................................... 98
Note 14: Equity and reserves .................................................................................................................................. 100
Note 15: Net debt ................................................................................................................................................... 102
Note 16: Financial risk management ...................................................................................................................... 103
Note 17: Key management personnel .................................................................................................................... 108
Note 18: Share‐based payments ............................................................................................................................. 108
Note 19: Information relating to subsidiaries ......................................................................................................... 112
Note 20: Investment in associates .......................................................................................................................... 112
Note 21: Parent entity information ........................................................................................................................ 114
Note 22: Reconciliation of profit for the year to net cash used in operating activities .......................................... 115
Note 23: Auditors’ remuneration ........................................................................................................................... 115
Note 24: Related party disclosures ......................................................................................................................... 116
Note 25: Summary of other significant accounting policies ................................................................................... 117
Note 26: Commitments ........................................................................................................................................... 120
Note 27: Subsequent events ................................................................................................................................... 120
OROCOBRE ANNUAL REPORT 2018 69
For
per
sona
l use
onl
y

These statements should be read in conjunction with the accompanying notes 70
Consolidated statement of profit or loss for the year ended 30 June 2018
2018 2017
Note US $'000 US $'000
Revenue 1 17,379 17,199 Cost of sales (14,204) (15,873)
Gross profit 3,175 1,326
Other income 389 240 Corporate expenses 2a (8,843) (5,431) Administrative expenses 2b (5,056) (4,441) Depreciation expense 9 (1,782) (1,743) Impairment of assets 3 (8,046) (8,105) Gain on sale of assets 10 2,435 ‐ Share of net gains of joint ventures 11 19,758 21,480 Share of net losses of associates 20 (1,532) ‐
Foreign currency gain/(loss) 2c (2,936) 625
Profit/(loss) before interest and income tax (2,438) 3,951
Finance income 2d 5,147 3,603 Finance costs 2e (789) (1,814)
Profit before income tax 1,920 5,740
Income tax expense 5 ‐ (1,108)
Profit for the year from continuing operations 1,920 4,632 Profit for the year from discontinued operation 4 ‐ 14,784
Profit for the year 1,920 19,416
Profit for the year attributable to: Owners of the parent entity 1,920 19,439 Non‐controlling interests ‐ (23)
1,920 19,416
Earnings per share for profit attributable to the ordinary equity holders of the Company
Basic earnings per share (cents per share) 6 0.83 9.19
Diluted earnings per share (cents per share) 6 0.83 9.17
Earnings per share for profit from continuing operations attributable to the ordinary equity holders of the Company
Basic earnings per share (cents per share) 6 0.83 2.20
Diluted earnings per share (cents per share) 6 0.83 2.19
For
per
sona
l use
onl
y

These statements should be read in conjunction with the accompanying notes 71
Consolidated statement of comprehensive income for the year ended 30 June 2018
2018 2017
Note US $'000 US $'000
Profit for the year 1,920 19,416
Other comprehensive income / (loss)
(Items that may be reclassified subsequently to profit or loss)
Translation losses on foreign operations (5,089) (1,587) Net gain on revaluation of derivatives 14b 1,732 1,473
Other comprehensive loss for the year, net of tax (3,357) (114)
Total comprehensive income/(loss) for the year, net of tax (1,437) 19,302
Total comprehensive income/(loss) attributable to:
Owners of the parent entity (1,437) 19,341
Non‐controlling interests ‐ (39)
(1,437) 19,302
For
per
sona
l use
onl
y

These statements should be read in conjunction with the accompanying notes 72
Consolidated statement of financial position as at 30 June 2018
2018 2017
Current assets Note US $'000 US $'000
Cash and cash equivalents 15 316,690 51,632
Trade and other receivables 7 52,449 23,710
Inventory 8 6,506 6,436
Other financial assets 16a ‐ 9,792
Total current assets 375,645 91,570
Non‐current assets
Trade and other receivables 7 34,240 58,464
Inventory 8 700 434
Property, plant and equipment 9 73 9,064
Exploration, evaluation and development assets 10 7,428 1,449
Investment in joint ventures 11 84,778 57,686
Investment in associates 20 19,954 21,476
Total non‐current assets 147,173 148,573
Total assets 522,818 240,143
Current liabilities
Trade and other payables 12 7,457 9,307
Loans and borrowings 15 737 877
Provisions 13 630 412
Total current liabilities 8,824 10,596
Non‐current liabilities
Trade and other payables 12 559 551
Loans and borrowings 15 ‐ 73
Provisions 13 11,331 10,903
Total non‐current liabilities 11,890 11,527
Total liabilities 20,714 22,123
Net assets 502,104 218,020
Equity
Issued capital 14a 527,364 243,184
Reserves 14b (106,923) (104,907)
Retained earnings 81,663 79,743
Total equity 502,104 218,020
For
per
sona
l use
onl
y

These statements should be read in conjunction with the accompanying notes 73
Consolidated statement of changes in equity for the year ended 30 June 2018
Issued capital
Retained earnings Reserves
Non‐controlling interests Total
Note US $'000 US $'000 US $'000 US $'000 US $'000
Balance as at 1 July 2016 242,248 60,304 (111,813) (1,312) 189,427 Profit/(loss) for the year ‐ 19,439 ‐ (23) 19,416 Other comprehensive loss for the year 14b ‐ ‐ (98) (16) (114)
Total comprehensive profit/(loss) ‐ 19,439 (98) (39) 19,302 Shares issued during the year 14a 936 ‐ ‐ ‐ 936 Share‐based payments ‐ ‐ 704 ‐ 704 Decrease in wealth tax ‐ ‐ 15 ‐ 15 Disposal of subsidiary ‐ ‐ 6,285 1,351 7,636
Balance as at 30 June 2017 243,184 79,743 (104,907) ‐ 218,020
Balance as at 1 July 2017 243,184 79,743 (104,907) ‐ 218,020 Profit for the year ‐ 1,920 ‐ ‐ 1,920 Other comprehensive loss for the year 14b ‐ ‐ (3,357) ‐ (3,357)
Total comprehensive profit/(loss) ‐ 1,920 (3,357) ‐ (1,437) Shares issued during the year 14a 284,180 ‐ ‐ ‐ 284,180 Share‐based payments ‐ ‐ 1,341 ‐ 1,341
Balance as at 30 June 2018 527,364 81,663 (106,923) ‐ 502,104
For
per
sona
l use
onl
y
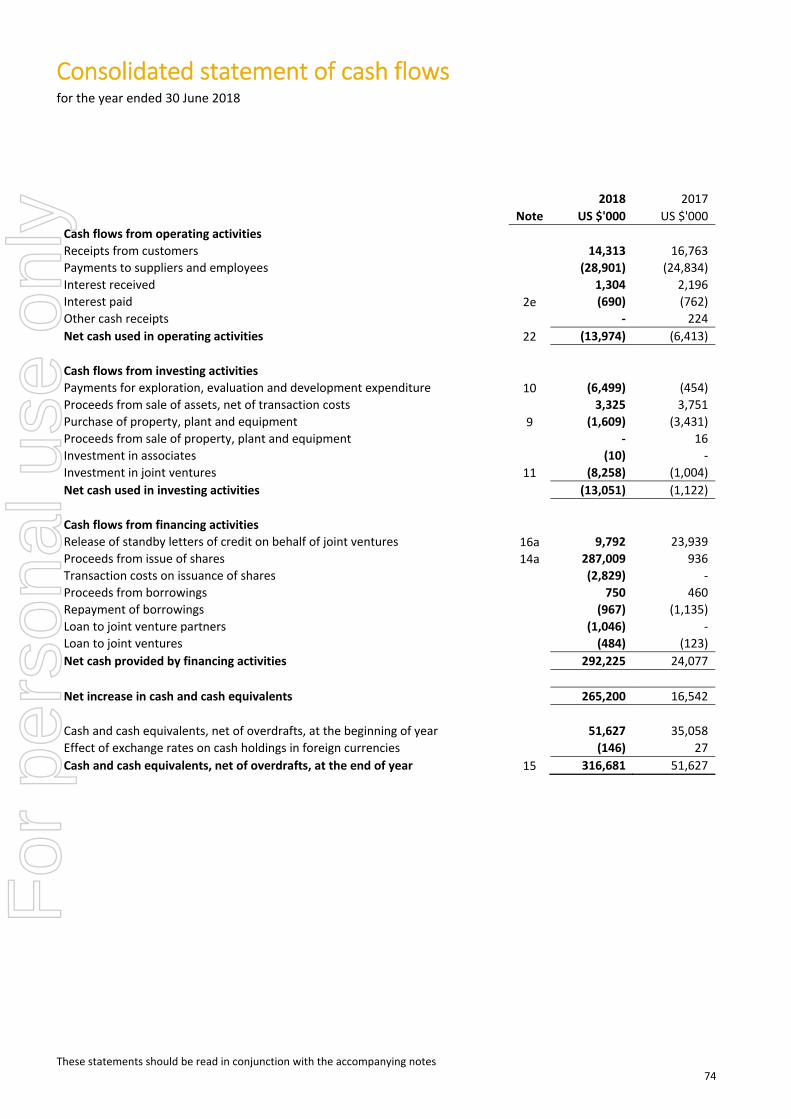
These statements should be read in conjunction with the accompanying notes 74
Consolidated statement of cash flows for the year ended 30 June 2018
2018 2017
Note US $'000 US $'000
Cash flows from operating activities
Receipts from customers 14,313 16,763
Payments to suppliers and employees (28,901) (24,834)
Interest received 1,304 2,196
Interest paid 2e (690) (762)
Other cash receipts ‐ 224
Net cash used in operating activities 22 (13,974) (6,413)
Cash flows from investing activities
Payments for exploration, evaluation and development expenditure 10 (6,499) (454)
Proceeds from sale of assets, net of transaction costs 3,325 3,751
Purchase of property, plant and equipment 9 (1,609) (3,431)
Proceeds from sale of property, plant and equipment ‐ 16
Investment in associates (10) ‐
Investment in joint ventures 11 (8,258) (1,004)
Net cash used in investing activities (13,051) (1,122)
Cash flows from financing activities
Release of standby letters of credit on behalf of joint ventures 16a 9,792 23,939
Proceeds from issue of shares 14a 287,009 936
Transaction costs on issuance of shares (2,829) ‐
Proceeds from borrowings 750 460
Repayment of borrowings (967) (1,135)
Loan to joint venture partners (1,046) ‐
Loan to joint ventures (484) (123)
Net cash provided by financing activities 292,225 24,077
Net increase in cash and cash equivalents 265,200 16,542
Cash and cash equivalents, net of overdrafts, at the beginning of year 51,627 35,058
Effect of exchange rates on cash holdings in foreign currencies (146) 27
Cash and cash equivalents, net of overdrafts, at the end of year 15 316,681 51,627
For
per
sona
l use
onl
y

Notes to the consolidated financial statements for the year ended 30 June 2018
75
About this report
Orocobre Limited is a company limited by shares, incorporated in Australia and is a for‐profit entity for the purposes of preparing the financial statements. The financial statements are for the consolidated entity consisting of Orocobre Limited (the ‘Company’ or the ‘Parent’) and its subsidiaries and together are referred to as the ‘Group’ or ‘Orocobre’. The registered office and principal place of business is: Level 1, 349 Coronation Drive, Milton, Queensland 4064, Australia. The financial statements were authorised for issue on 28 August 2018 by the Directors of the Company. The financial statements are general purpose financial statements which: ‐ Have been prepared in accordance with the requirements of the Corporations Act 2001, Australian Accounting
Standards and Interpretations issued by the Australian Accounting Standards Board (AASB) and International Financial Reporting Standards (IFRS) issued by the International Accounting Standards Board (IASB),
‐ Have been prepared under the historical cost convention, as modified by the revaluation of financial assets and liabilities (including derivative instruments) at fair value,
‐ Are presented in US Dollars, with all amounts in the financial report being rounded off in accordance with ASIC Corporations (Rounding in Financial/Directors’ Reports) Instrument 2016/191 to the nearest thousand Dollars, unless otherwise indicated,
‐ Where necessary, comparative information has been restated to conform with changes in presentation in the current year,
‐ Adopt all new and amended Accounting Standards and Interpretations issued by the AASB that are relevant to the operations of the Group and effective for reporting periods beginning on or after 1 July 2017, and
‐ Equity account for associates and joint ventures listed in Notes 11 and 20. Significant and other accounting policies that summarise the measurement basis used and that are relevant to an understanding of the financial statements are provided throughout the notes to the financial statements and in Note 25. Significant judgements and estimates
The Group has identified a number of critical accounting policies under which significant judgements, estimates and assumptions are made. Actual results may differ for these estimates under different assumptions and conditions. This may materially affect financial results and the carrying amount of assets and liabilities to be reported in the next and future periods. Additional information relating to these critical accounting policies is embedded within the following notes: Note Critical accounting policy 3 Impairment 5 Deferred taxation 8 Inventory 13 Provision for rehabilitation 18 Share‐based payments
Reserve estimates
Reserves are estimates of the amount of product that can be economically and legally extracted, processed and sold from the Group’s properties under current and foreseeable economic conditions. The Group determines, and reports ore reserves under the standards incorporated in the Australasian Code for Reporting Exploration Results, Mineral Resources and Ore Reserves, 2012 edition (the JORC Code). The determination of ore reserves includes estimates and assumptions about a range of geological, technical and economic factors, including: quantities, grades, production techniques, recovery rates, production costs, transport costs, commodity demand, commodity prices and exchange rates.
For
per
sona
l use
onl
y

Notes to the consolidated financial statements for the year ended 30 June 2018
76
Changes in ore reserves impact the assessment of recoverability of exploration and evaluation assets, property, plant and equipment, the carrying amount of assets depreciated on a units of production basis, provision for site restoration and the recognition of deferred tax assets, including tax losses. Estimating the quantity and/or grade of reserves requires the size, shape and depth of ore or brine bodies to be determined by analysing geological data. This process may require complex and difficult geological judgements to interpret the data. Additional information on the Group’s reserves and resources can be viewed on page 128. This information is unaudited and does not form part of these Financial Statements.
Reserve impact on financial reporting Estimates of reserves may change from period‐to‐period as the economic assumptions used to estimate reserves change and additional geological data is generated during the course of operations. Changes in reserves may affect the Group’s financial results and financial position in a number of ways, including: ‐ asset carrying values may be affected due to changes in estimated future production levels, ‐ depreciation, depletion and amortisation charged in the statement of profit or loss may change where such charges
are determined on the units of production basis, or where the useful economic lives of assets change, ‐ decommissioning, site restoration and environmental provisions may change where changes in estimated reserves
affect expectations about the timing or cost of these activities, ‐ the carrying amount of deferred tax assets may change due to changes in estimates of the likely recovery of the tax
benefits. Foreign currency translation The functional currency of the entities within the Group is USD, with exception of Borax Argentina S.A. (ARS), and Advantage Lithium Corp. (CAD). In preparation of the financial statements the following exchange rates have been used to translate from the functional currency of each entity to the presentational currency of the Group:
Spot Rates 30 June 2018 30 June 2017 Movement (%)
ARS ‐> USD 1 28.8500 16.6300 (73.48%) ARS ‐> AUD 1 21.3230 12.7913 (66.70%) AUD ‐> USD 1 1.3530 1.3001 (4.07%) CAD ‐> USD 1 1.3220 ‐ ‐
Average Rates (12 months) 30 June 2018 30 June 2017 Movement (%)
ARS ‐> USD 1 19.4817 15.4492 (26.10%) ARS ‐> AUD 1 15.0774 11.6505 (29.41%) AUD ‐> USD 1 1.2903 1.3262 2.71% CAD ‐> USD 1 1.2694 ‐ ‐
For
per
sona
l use
onl
y

Notes to the consolidated financial statements for the year ended 30 June 2018
77
Note 1: Segment reporting The Group operates primarily in Argentina. The Group's primary focus is on exploration for and development of lithium deposits. The Group also includes the operations of Borax. The Group has three reportable segments, being Corporate, the Olaroz project and Borax. In determining operating segments, the Group has had regard to the information and reports the Chief Operating Decision maker (COD) uses to make strategic decisions regarding resources. The Chief Executive Officer (CEO) is considered to be the COD and is empowered by the Board of Directors to allocate resources and assess the performance of the Group. The COD assesses and reviews the business using the operating segments below. Segment performance is evaluated based on the performance criteria parameters agreed for each segment. These include, but are not limited to: financial performance, exploration activity, production volumes and cost controls. Transfer prices between operating segments are on an arm's length basis in a manner similar to transactions with third parties. The following tables present revenue and profit information for the Group's operating segments: For the year ended 30 June 2018
Corporate Olaroz i) Note 11 Borax
Elimination ‐ Olaroz i)
Add back equity
accounting of Olaroz i)
Elimination ‐ other
Total Group
US $'000 US $'000 US $'000 US $'000 US $'000 US $'000 US $'000
Revenue ‐ 148,896 17,379 (148,896) ‐ ‐ 17,379
EBITDAIX1 (11,913) 94,580 2,481 (94,580) ‐ ‐ (9,432) Less depreciation & amortisation (33) (8,772) (1,749) 8,772 ‐ ‐ (1,782)
EBITIX2 (11,946) 85,808 732 (85,808) ‐ ‐ (11,214) Less interest 7,688 (12,984) (674) 12,984 ‐ (2,656) 4,358
EBTIX3 (4,258) 72,824 58 (72,824) ‐ (2,656) (6,856) Less impairment ‐ ‐ (8,046) ‐ ‐ ‐ (8,046) Add foreign currency gains/(losses) (1,680) (10,057) (1,256) 10,057 ‐ ‐ (2,936) Add share of profit of joint ventures, net of tax ‐ ‐ ‐ ‐ 19,758 ‐ 19,758
Segment profit/(loss) for the year from continuing operations before tax (5,938) 62,767 (9,244) (62,767) 19,758 (2,656) 1,920 Income tax ‐ (31,935) ‐ 31,935 ‐ ‐ ‐
Total profit/(loss) for the year from continuing operations after tax (5,938) 30,832 (9,244) (30,832) 19,758 (2,656) 1,920
i) The Olaroz project represents the results of the joint venture at 100% as this reflects how the COD reviews the results. As the joint venture is equity accounted for, it is eliminated from the Group results and replaced by the equity accounted interest to reconcile with the revenue and profit information reported on the statement of profit or loss. 1 EBITDAIX ‐ Segment earnings before interest, taxes, depreciation, amortisation, impairment, and foreign currency gains/(losses). Included within Borax EBITDAIX is US $1,900 gain on sale
of assets (Note 10).
2 EBITIX ‐ Segment earnings before interest, taxes, impairment, and foreign currency gains/(losses)
3 EBTIX ‐ Segment earnings before taxes, impairment, and foreign currency gains/(losses)
For
per
sona
l use
onl
y

Notes to the consolidated financial statements for the year ended 30 June 2018
78
Note 1: Segment reporting (continued)
For the year ended 30 June 2017
Corporate Olaroz i) Note 11 Borax
Elimination ‐ Olaroz i)
Add back equity
accounting of Olaroz i)
Elimination ‐ other
Total Group
US $'000 US $'000 US $'000 US $'000 US $'000 US $'000 US $'000
Revenue ‐ 120,065 17,199 (120,065) ‐ ‐ 17,199
EBITDAIX1 (6,655) 71,173 (1,651) (71,173) ‐ ‐ (8,306) Less depreciation & amortisation (30) (8,760) (1,713) 8,760 ‐ ‐ (1,743)
EBITIX2 (6,685) 62,413 (3,364) (62,413) ‐ ‐ (10,049) Less interest 4,317 (10,588) (1,180) 10,588 ‐ (1,348) 1,789
EBTIX3 (2,368) 51,825 (4,544) (51,825) ‐ (1,348) (8,260) Less impairment ‐ ‐ (8,105) ‐ ‐ ‐ (8,105) Add foreign currency gains/(losses) 232 (867) 472 867 ‐ (79) 625 Add share of profit of joint ventures, net of tax ‐ ‐ ‐ ‐ 21,480 ‐ 21,480
Segment profit/(loss) for the year from continuing operations before tax (2,136) 50,958 (12,177) (50,958) 21,480 (1,427) 5,740 Income tax ‐ (18,655) (1,108) 18,655 ‐ ‐ (1,108)
Total profit/(loss) for the year from continuing operations after tax (2,136) 32,303 (13,285) (32,303) 21,480 (1,427) 4,632
The following tables present assets and liabilities of the Group's operating segments:
For the year ended 30 June 2018
Corporate Olaroz i) Note 11 Borax
Elimination ‐ Olaroz i)
Elimination ‐ other
Total Group
Note US $'000 US $'000 US $'000 US $'000 US $'000 US $'000
Assets
Segment assets 507,926 489,971 16,482 (489,971) (1,590) 522,818
Liabilities
Segment liabilities 4,820 348,978 17,484 (348,978) (1,590) 20,714
Other disclosures
Investment in joint ventures 11 84,778 ‐ ‐ ‐ ‐ 84,778
Investment in associates 20 19,954 ‐ ‐ ‐ ‐ 19,954
Capital and development expenditure
9,10 (6,525) ‐ (1,583) ‐ ‐ (8,108)
i) The Olaroz project represents the assets and liabilities of the joint venture at 100% as this reflects how the COD reviews them. As the joint venture is equity accounted for, it is eliminated from the Group results and replaced by the equity accounted interest to reconcile with the assets and liabilities reported on the statement of financial position.
For
per
sona
l use
onl
y

Notes to the consolidated financial statements for the year ended 30 June 2018
79
Note 1: Segment reporting (continued)
For the year ended 30 June 2017
Corporate Olaroz i) Note 11 Borax
Elimination ‐ Olaroz i)
Elimination ‐ other
Total Group
US $'000 US $'000 US $'000 US $'000 US $'000 US $'000
Assets
Segment assets 244,230 431,504 30,848 (431,504) (34,935) 240,143
Liabilities
Segment liabilities 1,683 336,356 43,495 (336,356) (23,055) 22,123
Other disclosures
Investment in joint ventures 11 57,686 ‐ ‐ ‐ ‐ 57,686
Investment in associates 20 21,476 ‐ ‐ ‐ ‐ 21,476
Capital and development expenditure
9,10 (454) ‐ (3,431) ‐ ‐ (3,885)
Segment accounting policies are consistent with those adopted in the annual financial statements of the Group. Geographic information 2018 2017
US $'000 US $'000
Revenue from external customers Argentina 17,379 17,199
Total revenue 17,379 17,199
Segment non‐current assets
Australia 59,807 79,183
Argentina 87,366 69,390
Total 147,173 148,573
The revenue information above is based on the location of production.
Revenue accounting policy Recognition and measurement Revenue is measured at the fair value of the consideration received or receivable, net of returns and allowances, trade discounts, and volume rates. Revenue from the sale of products is recognised when the significant risk and rewards of ownership shifts from seller to buyer as dictated by the Incoterms specified in the sales contract.
For
per
sona
l use
onl
y

Notes to the consolidated financial statements for the year ended 30 June 2018
80
Note 2: Expenses, finance income and finance costs
2018 2017
US $'000 US $'000
2a) Corporate expenses
Employee benefit expenses (3,777) (2,588)
Legal and consulting fees i) (1,810) (552)
Share‐based payments (1,236) (602)
Other costs (2,020) (1,689)
Total corporate expenses (8,843) (5,431)
i) Legal and consulting fees includes US $727,000 of costs relating to the strategic placement in February 2018.
2b) Administrative expenses Employee benefit expenses (2,901) (2,572)
Local taxes (143) (294)
Other costs (2,012) (1,575)
Total administrative expenses (5,056) (4,441)
Administrative expenses relate to Borax Argentina S.A.
2c) Foreign currency gain/(loss) Total foreign currency gain/(loss) (2,936) 625
Foreign currency amounts relate to AUD denominated balances in corporate entities and USD/ARS fluctuations in Borax S.A.
2d) Finance income Interest income on loans receivable i) 2,066 1,365
Interest income from short term deposits 3,081 2,238
Total finance income 5,147 3,603
i) Interest income on loans receivable is non‐cash and will be recovered on ultimate repayment of the loans (Note 24).
2e) Finance costs Interest expense on loans and borrowings (690) (762)
Change in fair value of financial assets and liabilities (99) (1,052)
Total finance costs (789) (1,814)
Recognition and measurement
Interest income For all financial instruments measured at amortised cost and interest‐bearing financial assets, interest income or expense is recorded using the effective interest rate (EIR). EIR is the rate that exactly discounts the estimated future cash payments or receipts over the expected life of the financial instrument or a shorter period, where appropriate, to the net carrying amount of the financial asset or liability. Interest income is included in finance income in the statement of profit or loss.
For
per
sona
l use
onl
y

Notes to the consolidated financial statements for the year ended 30 June 2018
81
Note 3: Impairment of assets
2018 2017
Note US $'000 US $'000
Impairment of assets during the year: Specific doubtful debts provision i) 7 (1,889) (678)
Inventory write downs and reduction to net realisable value ii) ‐ (1,506)
Impairment of property, plant and equipment iii) 9 (6,157) (5,921)
Total (8,046) (8,105)
i) During the current and prior financial year, the Group recognised provision for impairment loss of Borax Argentina’s trade receivables. This impairment has been recognised due to deterioration of market conditions in South America with two sizeable customers experiencing difficulties sustaining ongoing trade activities. This resulted in one of these customers applying for bankruptcy protection and the other significantly reducing their level of production. ii) Borax Argentina's inventory was reviewed in 2017 with certain product lines removed and overall volumes to be reduced other than in the normal course of business. Consequently, inventory was impaired. iii) During the current and prior financial year, the Group recognised an impairment loss of Borax Argentina's property, plant, and equipment as a result of its annual impairment testing. This impairment has been recognised due to lower boron prices, reduction in production levels and other market factors. Carrying value of Borax cash‐generating unit (“CGU”) (after eliminating intercompany transactions) post impairment write down is as follows:
2018 2017 US $'000 US $'000
Trade and other receivables 7,050 8,509
Inventories 7,206 6,870
Plant and equipment ‐ 9,064
Accounts payable (5,258) (8,993)
Rehabilitation provision (10,133) (9,553)
Net carrying value (1,135) 5,897
The recoverable amount used in the impairment test is based on a value in use methodology applying the Board approved budget and a pre‐tax discount rate of 10%. Following the impairment, the residual carrying value of the plant and equipment as at 30 June 2018 is nil (2017: US $9,064,000). In the prior period the material assumptions in the discounted cash flow model to which the Borax operation is most sensitive to are sales tonnes, selling price, cost assumptions and the discount rate used (10.5% post tax in the prior period). Impairment of non‐financial assets The Group assesses, at each reporting date, whether there is an indication that an asset may be impaired. If any indication exists, or when annual impairment testing for an asset is required, the Group estimates the asset’s recoverable amount. An asset’s recoverable amount is the higher of an asset’s or CGUs fair value less costs of disposal and its value in use. Recoverable amount is determined for an individual asset, unless the asset does not generate cash inflows that are largely independent of those from other assets or groups of assets in which case the asset is allocated to its appropriate CGU. When the carrying amount of an asset or CGU exceeds its recoverable amount, the asset or CGU is considered impaired and is written down to its recoverable amount.
For
per
sona
l use
onl
y

Notes to the consolidated financial statements for the year ended 30 June 2018
82
Note 3: Impairment of assets (continued) In assessing impairment, Orocobre have applied value in use models. The estimated future cash flows are discounted to their present value using a post‐tax discount rate that reflects current market assessments of the time value of money and the risks specific to the asset. In determining fair value less costs of disposal, recent market transactions are taken into account. If no such transactions can be identified, an appropriate valuation model is used. These calculations are corroborated by valuation multiples, quoted share prices for publicly traded companies or other available fair value indicators. The Group bases its impairment calculation on budgets and forecast calculations, which are prepared separately for each of the Group’s CGUs to which the individual assets are allocated. Significant judgements and estimates The Group considers annually whether there have been any indicators of impairment and then tests whether non‐current assets, including investments in joint ventures and property, plant and equipment, have suffered any impairment. The recoverable amounts of cash‐generating units have been determined based on value in use calculations or fair value less cost of disposal. These calculations require the use of assumptions and estimates.
Note 4: Discontinued operation On 28 March 2017, the Group divested a number of lithium brine exploration projects which were held through their 85% interest in South American Salar Minerals Pty Ltd ("SASM"). Advantage Lithium Corp. ("AAL") issued 46,325,000 common shares to Orocobre Ltd in consideration for the acquisition of the exploration projects, and Orocobre has retained 42.5% interest (50% less 8.5% minority interest) and a 1% gross royalty in the Cauchari Project. On 4 June 2017, the Salinas Grandes Project was sold to LSC Lithium Corporation in consideration of cash, a promissory note payable over a 3‐year period, and 3 properties at Olaroz. With SASM being classified as discontinued operations, the South American Salars segment is no longer presented in the segment note. A profit from discontinued operation of US$14,783,988 was recorded during the financial year ended 30 June 2017. Additional information on the discontinued operation can be viewed in Note 4 of the 2017 Financial Statements.
Note 5: Income tax The major components of income tax expense are:
2018 2017
US $'000 US $'000
Deferred tax
Relating to origination and reversal of temporary differences ‐ 1,108
Income tax expense reported in the statement of profit or loss ‐ 1,108
For
per
sona
l use
onl
y

Notes to the consolidated financial statements for the year ended 30 June 2018
83
Note 5: Income tax expense (continued)
A reconciliation between tax expense and the product of accounting profit multiplied by Australia's domestic tax rate is as follows:
2018 2017 US $'000 US $'000
Profit from continuing operations before income tax expense 1,920 5,740
Profit from discontinued operation before income tax expense ‐ 14,784
Profit before income tax 1,920 20,524
Tax expense at Australian tax rate of 30% (2017: 30%) 576 6,157
Tax effect of amounts which are not deductible/(taxable) in calculating taxable income:
Share‐based payments 403 134
Gain on sale of assets (154) ‐
Share of loss of associates 460 ‐
Share of profit of joint ventures (5,130) (7,518)
Other (447) 361
Gain on sale of subsidiary, net of transaction costs ‐ (4,400)
Derecognition of deferred tax balances ‐ 6,886
Tax losses and temporary differences for the year not recognised 4,283 ‐
Differences in tax rates (foreign subsidiaries) (462) (675)
Foreign exchange 471 163
Income tax expense ‐ 1,108
The Group is in a tax loss position and therefore income tax expense was not recognised during the period. Expenses incurred during the year relates to the derecognition of the deferred tax asset (DTA) following from the Borax impairment. The Group has tax losses which arose in Australia of US $33,000,000 (2017: US $28,000,000) that are available indefinitely for offsetting against future taxable profits of the companies in which the losses arose. The Group has tax losses which arose in Argentina of US $3,560,126 (ARS 102,709,641) (2017: US $ 6,176,166 / ARS 102,709,641) that are available indefinitely for offsetting against future taxable profits of the companies in which the losses arose.
Recognition and measurement Current income tax Current income tax assets and liabilities for the current period are measured at the amount expected to be recovered from or paid to the taxation authorities. The tax rates and tax laws used to compute the amount are those that are enacted or substantively enacted, at the reporting date in the countries where the Group operates and generates taxable income. Current income tax relating to items recognised directly in equity is recognised in equity and not in the statement of profit or loss. Management periodically evaluates positions taken in the tax returns with respect to situations in which applicable tax regulations are subject to interpretation and establishes provisions where appropriate. Deferred tax Deferred tax is provided using the liability method on temporary differences between the tax bases of assets and liabilities and their carrying amounts for financial reporting purposes at the reporting date. Deferred tax assets and liabilities are measured at the tax rates that are expected to apply in the year when the asset is realised, or the liability is settled, based on tax rates (and tax laws) that have been enacted or substantively enacted at the reporting date. Deferred tax items are recognised in correlation to the underlying transaction.
For
per
sona
l use
onl
y
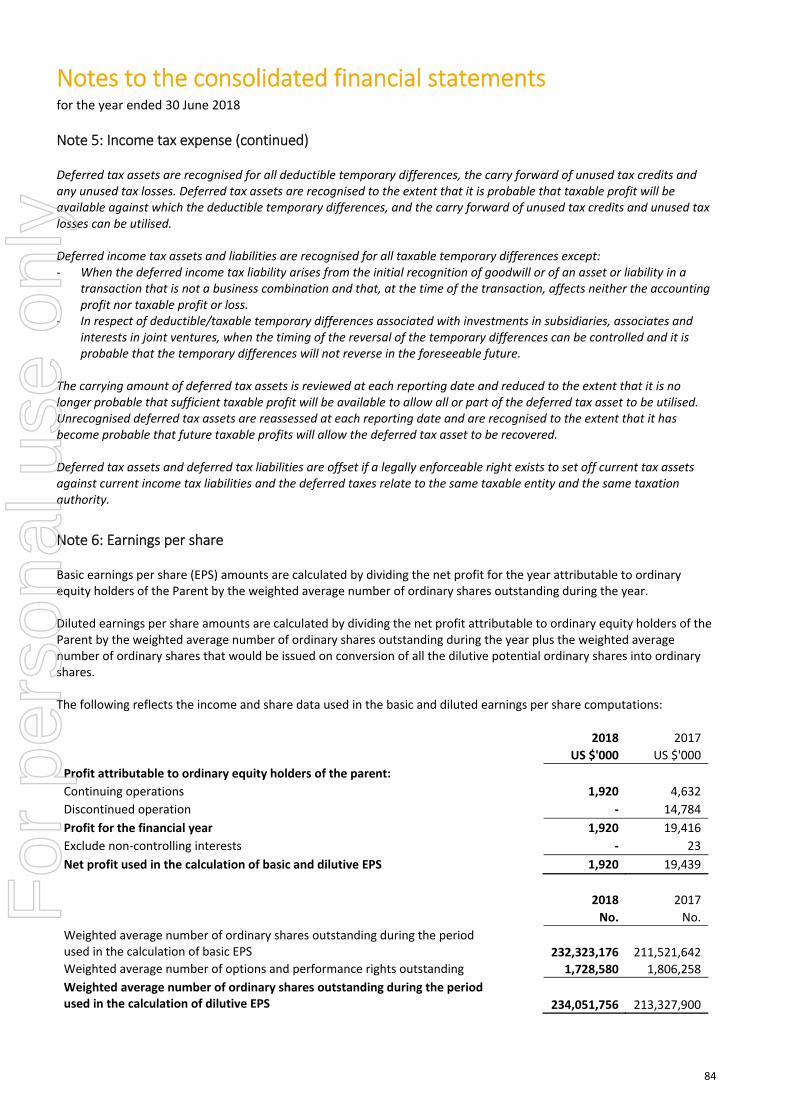
Notes to the consolidated financial statements for the year ended 30 June 2018
84
Note 5: Income tax expense (continued)
Deferred tax assets are recognised for all deductible temporary differences, the carry forward of unused tax credits and any unused tax losses. Deferred tax assets are recognised to the extent that it is probable that taxable profit will be available against which the deductible temporary differences, and the carry forward of unused tax credits and unused tax losses can be utilised. Deferred income tax assets and liabilities are recognised for all taxable temporary differences except: ‐ When the deferred income tax liability arises from the initial recognition of goodwill or of an asset or liability in a
transaction that is not a business combination and that, at the time of the transaction, affects neither the accounting profit nor taxable profit or loss.
‐ In respect of deductible/taxable temporary differences associated with investments in subsidiaries, associates and interests in joint ventures, when the timing of the reversal of the temporary differences can be controlled and it is probable that the temporary differences will not reverse in the foreseeable future.
The carrying amount of deferred tax assets is reviewed at each reporting date and reduced to the extent that it is no longer probable that sufficient taxable profit will be available to allow all or part of the deferred tax asset to be utilised. Unrecognised deferred tax assets are reassessed at each reporting date and are recognised to the extent that it has become probable that future taxable profits will allow the deferred tax asset to be recovered. Deferred tax assets and deferred tax liabilities are offset if a legally enforceable right exists to set off current tax assets against current income tax liabilities and the deferred taxes relate to the same taxable entity and the same taxation authority.
Note 6: Earnings per share Basic earnings per share (EPS) amounts are calculated by dividing the net profit for the year attributable to ordinary equity holders of the Parent by the weighted average number of ordinary shares outstanding during the year. Diluted earnings per share amounts are calculated by dividing the net profit attributable to ordinary equity holders of the Parent by the weighted average number of ordinary shares outstanding during the year plus the weighted average number of ordinary shares that would be issued on conversion of all the dilutive potential ordinary shares into ordinary shares. The following reflects the income and share data used in the basic and diluted earnings per share computations:
2018 2017
US $'000 US $'000
Profit attributable to ordinary equity holders of the parent: Continuing operations 1,920 4,632
Discontinued operation ‐ 14,784
Profit for the financial year 1,920 19,416
Exclude non‐controlling interests ‐ 23
Net profit used in the calculation of basic and dilutive EPS 1,920 19,439
2018 2017
No. No.
Weighted average number of ordinary shares outstanding during the period used in the calculation of basic EPS 232,323,176 211,521,642 Weighted average number of options and performance rights outstanding 1,728,580 1,806,258
Weighted average number of ordinary shares outstanding during the period used in the calculation of dilutive EPS 234,051,756 213,327,900
For
per
sona
l use
onl
y
Notes to the consolidated financial statements for the year ended 30 June 2018
85
Note 7: Trade and other receivables
2018 2017
US $'000 US $'000
Current
Trade receivables (net of provision) 3,828 5,120
Deferred consideration receivable i) 968 957
Receivable from joint ventures 44,724 15,960
Other receivables 2,682 1,174
VAT tax credits ii) 247 499
Total current 52,449 23,710
Non‐current
Trade receivables ‐ 715
Deferred consideration receivable i) 875 1,744
Receivable from joint ventures 23,495 47,924
Receivable from joint venture partners 7,815 6,580
Other receivables 954 10
VAT tax credits ii) 1,101 1,491
Total non‐current 34,240 58,464
i) Includes US $1,842,514 (2017: US $2,700,449) deferred consideration to be received from the sale of SASM Pty Ltd (Note 4).
ii) The Group has a total of US $1,348,268 (2017: US $1,990,178) of VAT recoveries due from the Argentine revenue authority. Credit risk — trade and other receivables Following a detailed review of trade receivables: ‐ a provision of US $1,889,000 (2017: US $678,000) was recognised during the year, and ‐ customers in receivership with an outstanding balance of US $660,000 (2017: US $254,000) were written off as
uncollectible. As such, US $1,653,000 (2017: US $424,000) pertaining to slow paying customers, encountering difficult economic situations has been provided. It is expected all other balances will be received when due. The carrying value of receivables approximate fair value.
2018 2017
US $'000 US $'000
Balance at the beginning of year 424 ‐
Provision for impairment recognised during the year 1,889 678
Receivables written off during the year as uncollectable (660) (254)
Balance at end of year 1,653 424
Receivables from joint ventures and joint venture partners Receivables from joint ventures and joint venture partners relate to amounts receivable in respect of the Olaroz project (see Note 11). All amounts are denominated in US $ and US $68,218,804 (2017: US $63,884,534) is interest bearing. The receivables will be recovered from cashflows from the Olaroz project (see Note 24).
Recognition and measurement The carrying values of the receivables from joint ventures and joint venture partners approximate fair value.
For
per
sona
l use
onl
y

Notes to the consolidated financial statements for the year ended 30 June 2018
86
Note 8: Inventories
2018 2017
US $'000 US $'000
Current Finished products 2,408 903
Work in progress 3,726 5,247
Materials and spare parts 372 286
Total current 6,506 6,436
Non‐current Materials and spare parts 700 434
Total non‐current 700 434
Recognition and measurement The Company states inventories at the lower of cost and net realisable value. The cost price of finished products and work in progress includes the direct cost of materials and, when applicable, labour costs, indirect costs incurred to transform raw materials into finished products, and general expenses incurred in carrying inventories to their current location and conditions. The method used to determine the cost of inventories is weighted average cost. Commercial discounts, rebates obtained, and other similar entries are deducted in the determination of the acquisition price. The net realisable value represents the estimate of the sales price, less all finishing estimated costs and costs which will be incurred in commercialisation, sales, and distribution processes. The Company conducts an evaluation of the net realisable value of inventories at the end of each year, recording an estimate with a charge to income when these are overstated. The valuation of obsolete, impaired or slow‐moving products relates to their net realisable value. Raw materials, supplies and materials are recorded at the lower of acquisition cost or net realisable value. Acquisition cost is calculated according to the average price method. Significant judgements and estimates Net realisable value The computation of net realisable value for work in progress and finished products involves significant judgements and estimates in relation to timing and cost of processing, commodity prices, foreign exchange rates, recoveries and the timing of sale of the products. A change in any of these assumptions will alter the estimated net realisable value and may therefore impact the carrying value of inventory.
For
per
sona
l use
onl
y

Notes to the consolidated financial statements for the year ended 30 June 2018
87
Note 9: Property, plant and equipment
Land &
buildings Plant &
equipment Total
US $'000 US $'000 US $'000
At cost 4,855 15,016 19,871
Accumulated depreciation (2,941) (1,945) (4,886)
Accumulated impairment ‐ (5,921) (5,921)
Total as at 30 June 2017 1,914 7,150 9,064
At cost 4,518 11,267 15,785
Accumulated depreciation (1,288) (2,347) (3,635)
Accumulated impairment (3,157) (8,920) (12,077)
Total as at 30 June 2018 73 ‐ 73
Reconciliation of the carrying amounts for property, plant and equipment is set out below:
2018 2017
Note US $'000 US $'000
Balance at the beginning of year 9,064 14,977
Additions ‐ cash 1,609 3,431
Additions ‐ non‐cash 1,111 1,040
Impairment 3 (6,157) (5,921)
Disposals (374) ‐
Depreciation expense ‐ continuing operations (1,782) (1,743)
Depreciation expense ‐ discontinued operations ‐ (4)
Foreign currency translation movement (3,398) (2,716)
Balance at the end of year 73 9,064
Recognition and measurement Tangible property, plant and equipment assets are stated at acquisition cost, net of the related accumulated depreciation, amortisation and impairment losses that they might have experienced. Cost includes expenditure directly attributable to the acquisition and commissioning of the plant and equipment. The useful lives used for the depreciation and amortisation of assets included in property, plant and equipment are presented below:
Buildings and infrastructure: 20 to 30 years, and Plant and equipment: 5 to 10 years.
Borax Argentina S.A. uses the units of production basis when depreciating specific assets which results in a depreciation charge proportional to the depletion of the anticipated remaining life of mine production. Each item's economic life, which is assessed annually, has due regard to both its physical life limitations and to present assessments of economically recoverable reserves of the mine property at which it is located. The residual values, useful lives and methods of depreciation of property, plant and equipment are reviewed at each financial year end and adjusted prospectively, if appropriate.
For
per
sona
l use
onl
y

Notes to the consolidated financial statements for the year ended 30 June 2018
88
Note 10: Exploration, evaluation and development assets Exploration, evaluation and development expenditure carried forward in respect of areas of interest are:
2018 2017
US $'000 US $'000
Movement in exploration and evaluation assets ‐ at cost:
Balance at beginning of year 1,449 6,168
Capitalised exploration expenditure 6,499 454
Additions ‐ non‐cash ‐ 78
Decrease on disposal of assets i) (520) ‐
Decrease on disposal of subsidiary ‐ (5,392)
Foreign currency translation movement ‐ 141
Balance at the end of year 7,428 1,449
2018
US $'000
Gain on sale of Diablillos tenements i) 2,152
Gain on sale of Lithium X shares ii) 283
2,435
i) On 5 October 2017, the Group executed an agreement with Lithium X Energy Corp ("Lithium X") in respect of tenure
held at Salar de Diablillos. Lithium X acquired the tenements for consideration of US $1,000,000 cash and 650,000
common shares, and also taking responsibility for the rehabilitation previously recorded as a provision US $630,388 (see
note 13b for further details on the provision).
ii) In March 2018, Orocobre sold its share in Lithium X for a consideration of US $1,324,770.
Cauchari Project
On March 28, 2017, Advantage Lithium Corp. (“AAL”) acquired an initial 50% interest in the Cauchari Project. The Company increased its interest to 75% in the project by spending a further US $5,000,000 in exploration. All subsequent costs incurred have been funded by AAL and Orocobre based on their respective interests. Orocobre retains a 1% gross revenue royalty on the Cauchari Project and has a right of first refusal on brine production. Contributions made by Orocobre into the Cauchari Project during the year ended 30 June 2018 amount to US $1,280,250. Recognition and measurement Exploration and evaluation expenditures incurred are capitalised in respect of each identifiable area of interest. These costs are only capitalised to the extent that they are expected to be recovered through the successful development of the area or where activities in the area have not yet reached a stage that permits reasonable assessment of the existence of economically recoverable reserves or sale. Accumulated costs in relation to an abandoned area are written off in full against profit in the year in which the decision to abandon the area is made. When production commences, the accumulated costs for the relevant area of interest are amortised over the life of the area according to the rate of depletion of the economically recoverable reserves using a units of production method. A regular review is undertaken of each area of interest to determine the appropriateness of continuing to capitalise costs in relation to that area of interest. If, after expenditure is capitalised, information becomes available suggesting that the recovery of expenditure is unlikely, the amount capitalised is written off to profit or loss in the period when the new information becomes available.
For
per
sona
l use
onl
y

Notes to the consolidated financial statements for the year ended 30 June 2018
89
Note 11: Investment in joint ventures
2018 2017
US $'000 US $'000
Balance at the beginning of year 57,686 35,061
Profit from equity accounted investment in joint ventures 19,758 21,480
Additional investment in joint ventures 8,258 1,004
Other comprehensive income 1,732 1,489
Elimination of unrealised intercompany transactions (2,656) (1,348)
Balance at the end of year 84,778 57,686
The Group has a 72.68% interest in Sales de Jujuy Pte Ltd. The country of incorporation is Singapore and the principal place of business is Singapore. Sales de Jujuy Pte Ltd owns 91.5% of Sales de Jujuy S.A., the owner and operator of the Olaroz lithium project. The effective equity interest in the Olaroz Lithium Facility Joint Venture is Orocobre 66.5%, Toyota Tsusho (TTC) 25% and JEMSE 8.5%. Recognition and measurement The Group’s investments in its joint ventures are accounted for using the equity method. A joint venture is a type of joint arrangement whereby the parties that have joint control of the arrangement have rights to the net assets of the joint venture. Joint control is the contractually agreed sharing of control of an arrangement, which exists only when decisions about the relevant activities require unanimous consent of the parties sharing control. The considerations made in determining significant influence or joint control are similar to those necessary to determine control over subsidiaries as outlined in Note 19. Under the equity method, the investment in a joint venture is initially recognised at cost. The carrying amount of the investment is adjusted to recognise changes in the Group’s share of net assets of the joint venture since the acquisition date. Goodwill relating to the joint venture is included in the carrying amount of the investment and is neither amortised nor individually tested for impairment. The statement of profit or loss reflects the Group’s share of the results of operations of the joint venture. Any change in other comprehensive income of those investees is presented as part of the Group's other comprehensive income. In addition, when there has been a change recognised directly in the equity of the joint venture, the Group recognises its share of any changes, when applicable, in the statement of changes in equity. Unrealised gains and losses resulting from transactions between the Group and the joint venture are eliminated to the extent of the interest in the associate or joint venture. The aggregate of the Group’s share of profit or loss of a joint venture is shown on the face of the statement of profit or loss within operating profit and represents profit or loss after tax and non‐controlling interests in the subsidiaries of the joint venture. The financial statements of the joint venture are prepared for the same reporting period as the Group. When necessary, adjustments are made to bring the accounting policies in line with those of the Group. Upon loss of joint control over the joint venture, the Group measures and recognises any retained investment at its fair value. Any difference between the carrying amount of the joint venture upon loss of joint control and the fair value of the retained investment and proceeds from disposal is recognised in profit or loss. The tables below provide summarised financial information for the joint venture of the group. The information disclosed reflects the amount presented in the financial statements of the joint venture and not Orocobre Limited's share of those amounts. They have been amended to reflect adjustments made by the entity when using the equity method, including fair value adjustments and modifications for differences in accounting policy.
For
per
sona
l use
onl
y

Notes to the consolidated financial statements for the year ended 30 June 2018
90
Note 11: Investment in joint ventures (continued)
Statement of profit or loss
2018 2017
Note US $'000 US $'000
Revenue 148,896 120,065
Cost of sales (40,432) (36,825)
Gross profit 108,464 83,240
Administrative expenses (13,884) (12,067)
Depreciation 11c (8,772) (8,760)
Foreign currency loss (10,057) (867)
Profit before interest and income tax 75,751 61,546
Finance income 1,163 4,031
Finance costs (14,147) (14,619)
Profit before income tax 62,767 50,958
Income tax expense 11d (31,935) (18,655)
Profit for the year 30,832 32,303
Profit for the year attributable to:
Sales de Jujuy Pte. Ltd 27,185 29,554
Non‐controlling interest of Sales de Jujuy S.A. (8.5% ownership) 3,647 2,749 30,832 32,303
Group’s share of profit for the year 19,758 21,480
Share of the joint venture's other comprehensive income:
Net gain on revaluation of derivative 1,732 1,473
Share of total other comprehensive income for the year 1,732 1,473
Share of total comprehensive income for the year 21,490 22,953
For
per
sona
l use
onl
y

Notes to the consolidated financial statements for the year ended 30 June 2018
91
Note 11: Investment in joint ventures (continued)
Statement of Financial Position
2018 2017 Note US $'000 US $'000
Current assets
Cash and cash equivalents 11e 19,465 4,091
Trade and other receivables 11,102 11,071
VAT receivable 11a 10,768 18,491
Inventory 11b 31,509 22,365
Prepayments 7,257 3,838
Total current assets 80,101 59,856
Non‐current assets
Trade and other receivables 1,042 676
Inventory 11b 34,598 19,723
Prepayments 105 272
Property, plant and equipment 11c 339,661 333,682
Intangible assets 17,293 17,293
Financial assets 11e 17,171 ‐
Total non‐current assets 409,870 371,646
Total assets 489,971 431,502
Current liabilities
Trade and other payables 27,245 22,034
Loans & borrowings 11e 59,528 59,460
Related party loans 11e 49,667 15,222
Derivatives 11f 1,266 1,886
Total current liabilities 137,706 98,602
Non‐current liabilities
Trade and other payables 1,464 917
Loans & borrowings 11e 109,805 132,746
Related party loans 11e 24,113 58,557
Deferred tax liabilities 11d 60,584 26,801
Derivatives 11f 4,256 8,256
Provisions 11,049 10,476
Total non‐current liabilities 211,271 237,753
Total liabilities 348,977 336,355
Net assets 140,994 95,147
Equity
Equity attributable to Sales de Jujuy Pte. Ltd 132,455 91,523
Non‐controlling interests of Sales de Jujuy S.A. (8.5% ownership) 8,539 3,624
Total equity 1 140,994 95,147
Equity attributable to Sales de Jujuy Pte. Ltd 132,455 91,523
Elimination of unrealised intercompany transactions (15,809) (12,153)
Carrying amount i) 116,646 79,370
Proportion of the Group's ownership 72.68% 72.68%
Carrying amount of the investment 84,778 57,686
1 Sales de Jujuy PTE LTD cannot distribute profits until it obtains the consent from the two joint venture partners.
For
per
sona
l use
onl
y

Notes to the consolidated financial statements for the year ended 30 June 2018
92
Note 11: Investment in joint ventures (continued)
2018 2017
US $'000 US $'000
i) Reconciliation to carrying amount
Balance of net assets at the beginning of year 79,370 48,240
Capital investment 11,364 1,381
Profit for the period 27,185 29,554
Other comprehensive income 2,383 2,048
Elimination of unrealised intercompany transactions (3,656) (1,853)
Carrying amount of net assets at the end of year 116,646 79,370
11a) VAT receivable
2018 2017
US $'000 US $'000
Current VAT receivable 10,768 18,491
Total current 10,768 18,491
VAT is charged on goods and services (including capital goods) at rates between 10.5% and 27.0%, with 21.0% being the standard charge. VAT is claimed back based on 21.0% of FOB export sales. VAT receivable is retained in ARS. Due to the devaluation of the ARS to USD during the financial year, the foreign exchange loss resulted in a reduction of the USD value of the VAT receivable by US $8,708,891 (2017: US $1,792,823). 11b) Inventory
2018 2017
US $'000 US $'000
Current Lithium carbonate ‐ finished product 5,343 3,886
Lithium in brine ‐ work in progress 12,304 11,972
Raw materials and spare parts 13,862 6,507
Total current 31,509 22,365
Non‐current
Lithium in brine ‐ work in progress 34,598 19,723
Total non‐current 34,598 19,723
Brine inventory costs Brine inventory costs consist largely of lime, energy, maintenance, labour and depreciation. Fixed and variable production overhead costs are allocated to brine inventory based on the proportion of services rendered. Brine production costs are transferred to lithium carbonate production at average cost per tonne based on brine flow transferred to the processing plant. Brine not utilised in the production process and recovered from the plant is returned to the ponds to be reprocessed in the future. The carrying value of inventory is reviewed on annual basis to assess whether there are indicators that its carrying value is higher than its recoverable amount. Any excess in carrying value is recognised as cost of sales during the period.
See Note 8 for further details on the Group’s accounting policy on inventory.
For
per
sona
l use
onl
y

Notes to the consolidated financial statements for the year ended 30 June 2018
93
Note 11: Investment in joint ventures (continued)
11c) Property, plant and equipment
Under
construction Plant &
equipment Total
US $'000 US $'000 US $'000
At cost 10,306 343,892 354,198
Accumulated depreciation ‐ (20,516) (20,516)
Total as at 30 June 2017 10,306 323,376 333,682
At cost 19,920 352,316 372,236
Accumulated depreciation ‐ (32,575) (32,575)
Total as at 30 June 2018 19,920 319,741 339,661
Reconciliation of the carrying amounts for property, plant and equipment is set out below:
2018 2017
US $'000 US $'000
Balance at the beginning of year
333,682 331,473
Additions ‐ cash 17,659 12,596
Additions ‐ non‐cash 1,024 ‐
Depreciation transferred to Inventory (3,932) (1,627)
Depreciation expense (8,772) (8,760)
Balance at the end of year 339,661 333,682
Recognition and measurement Depreciation of property, plant and equipment The useful lives used for the depreciation and amortisation of assets included in property, plant and equipment are presented below:
Building & infrastructure: 25 to 40 years. Plant and equipment: 5 to 25 years.
See Note 9 for further details on the Group’s accounting policy on property, plant and equipment.
11d) Income tax
2018 2017
US $'000 US $'000
Deferred tax expense 31,935 18,655
Income tax expense 31,935 18,655
For
per
sona
l use
onl
y

Notes to the consolidated financial statements for the year ended 30 June 2018
94
Note 11: Investment in joint ventures (continued) A reconciliation between tax expense and the product of accounting profit multiplied by Argentina's domestic tax rate is as follows:
2018 2017 US $'000 US $'000
Profit before income tax 62,767 50,958
Tax expense at Argentinian tax rate of 35% (2017: 35%) 21,968 17,835
Exchange differences 3,514 ‐
Change in income tax rates (4,075) ‐
Withholding tax on net assets held in Argentina (13%) 13,060 820
Other (2,532) ‐
Income tax expense 31,935 18,655
Deferred tax
2018 2017
US $'000 US $'000
Deferred tax assets
Carry forward tax losses i) 47,941 77,651
Financial liabilities 1,533 3,461
Accounts payable 3,652 3,161
Other non‐financial liabilities 497 820
Total deferred tax assets 53,623 85,093
Deferred tax liabilities
Property, plant and equipment (93,253) (108,190)
Inventories (7,818) (3,548)
Other financial assets (76) (156)
Withholding tax on net assets held in Argentina (13,060) ‐
Total deferred tax liabilities (114,207) (111,894)
Net deferred tax liabilities (60,584) (26,801)
i) The Company has tax losses which arose in Argentina of US $ 159,802,217 / ARS 4,610,293,946 (2017: US $ 221,858,773 / ARS 3,689,511,401) that are available indefinitely for offsetting against future taxable profits.
For
per
sona
l use
onl
y

Notes to the consolidated financial statements for the year ended 30 June 2018
95
Note 11: Investment in joint ventures (continued) 11e) Net debt
2018 2017
US $'000 US $'000
Loans and borrowings – current i) 59,528 59,460
Related party loans – current ii) 49,667 15,222
Total current debt 109,195 74,682
Loans and borrowings – non‐current i) 109,805 132,746
Related party loans – non‐current ii) 24,113 58,557
Total non‐current debt 133,918 191,303
Total debt 243,113 265,985
Cash and cash equivalents (19,465) (4,091)
Financial assets ‐ non‐current (17,171) ‐
Net debt 206,477 261,894
The non‐current financial assets are long term cash deposits funded by shareholders to partially secure borrowings from the Joint Venture. These deposits are non‐interest bearing and are generally held until the borrowings have been repaid. The carrying value approximates fair value. i) Loan and borrowings
2018 2017
Interest rate Maturity US $'000 US $'000
Current Project loan LIBOR + 0.80% 2018‐2019 23,028 22,260
Working capital facility 3.5% 2018 36,500 37,200
Total current 59,528 59,460
Non‐current
Project loan LIBOR + 0.80% 2019‐2024 109,805 132,746
Total non‐current 109,805 132,746
The total Project loan facility is US $191.9m. Sales de Jujuy Pte. Ltd has provided security in favour of Mizuho Bank over the shares it owns in Sales de Jujuy S.A. The carrying amounts of the loans and borrowings approximate fair value. Fair value has been determined using a discounted cash flow valuation technique based on contractual and expected cash flows and current market interest rates.
For
per
sona
l use
onl
y

Notes to the consolidated financial statements for the year ended 30 June 2018
96
Note 11: Investment in joint ventures (continued)
ii) Related party loans
2018 2017
US $'000 US $'000
Current Orocobre Ltd 37,250 12,500
Toyota Tsusho Corporation 12,417 2,722
Total current 49,667 15,222
Non‐current
Orocobre Ltd 22,590 47,340
Toyota Tsusho Corporation 1,523 11,217
Total non‐current 24,113 58,557
Loan repayable to Orocobre
Loan component 1 ‐ (Principal US $18,112,734) (2017: US $18,112,734) is interest bearing at LIBOR + 1.00% per annum and will be repaid during the period the Group is operational and after satisfaction of the minimum requirements of the project finance facility.
Loan component 2 ‐ (Principal US $34,250,000) (2017: US $34,250,000) is interest bearing at LIBOR + 5.00% per annum and will be repaid in twelve consecutive monthly and equal instalments from September 2018.
Loan component 3 ‐ (Principal US $726,800) (2017: US $726,800) is interest bearing at LIBOR + 0.75% per annum and will be repaid in full before 24 July 2028.
Loan component 4 ‐ (Principal US $6,750,000) (2017: US $6,750,000) is interest bearing at LIBOR + 5.00% per annum and will be repaid in twelve consecutive monthly and equal instalments from March 2019.
Loan repayable to Toyota Tsusho Corporation
Loan component 1 ‐ (Principal US $11,416,667) (2017: US $11,416,667) is interest bearing at LIBOR + 5.00% per annum and will be repaid in twelve consecutive monthly and equal instalments from September 2018.
Loan component 2 ‐ (Principal US $273,200) (2017: US $273,200) is interest bearing at LIBOR + 0.75% per annum and will be repaid in full before 24 July 2028.
Loan component 3 ‐ (Principal US $2,250,000) (2017: US $2,250,000) is interest bearing at LIBOR + 5.00% per annum and will be repaid in twelve consecutive monthly and equal instalments from March 2019.
11f) Derivatives 2018 2017
US $'000 US $'000
Current Derivatives 1,266 1,886
Total current 1,266 1,886
Non‐current
Derivatives 4,256 8,256
Total non‐current 4,256 8,256
During FY2016 a swap was entered into by Sales de Jujuy S.A. in order to manage interest rate exposure on the project debt, which bears interest at LIBOR + 0.8%. The swap has been designated in a hedge relationship, and hedge accounting has been adopted.
For
per
sona
l use
onl
y

Notes to the consolidated financial statements for the year ended 30 June 2018
97
Note 11: Investment in joint ventures (continued)
The interest rate swap receives floating interest equal to LIBOR, pays a fixed rate of interest of between .601% p.a. and 4.896% p.a., and matures on 10 September 2024. Swaps currently in place cover 100% of the variable loan principal outstanding and are timed to expire as each loan repayment falls due. The gain or loss from remeasuring the hedging instruments at fair value is recognised in other comprehensive income and deferred in equity in the hedging reserve, to the extent that the hedge is effective. It is reclassified into profit or loss when the hedged interest expense is recognised. There was no hedge ineffectiveness in the current year. The fair value of the interest rate swaps is calculated as the present value of the estimated future cash flows based on observable yield curves (Level 2). Recognition and measurement Derivative financial instruments and hedge accounting Initial recognition and subsequent measurement The Group uses derivative financial instruments, such as interest rate swaps, to hedge its interest rate risks. Such derivative financial instruments are initially recognised at fair value on the date on which a derivative contract is entered and are subsequently re‐measured at fair value. Derivatives are carried as financial assets when the fair value is positive and as financial liabilities when the fair value is negative. For cash flow hedges The effective portion of the gain or loss on the hedging instrument is recognised in other comprehensive income in the cash flow hedge reserve, while any ineffective portion is recognised immediately in the statement of profit or loss in finance costs. Amounts recognised as other comprehensive income are transferred to profit or loss when the hedged transaction affects profit or loss, such as when the hedged financial income or financial expense is recognised. In the current period and prior periods, the Group had no direct derivative financial instrument, but recorded its share of the joint venture's cash flow hedge revaluation through other comprehensive income.
11g) Commitments
2018 2017
US $'000 US $'000
Not later than 1 year Exploration commitments i) 381 144
Operating leases 114 114
Contracts ii) 27,031 10,252
Total 27,526 10,510
Later than 1 year but not later than 5 years
Exploration commitments i) 250 250
Operating leases 304 428
Contracts ii) 38,424 40,377
Total 38,978 41,055
Later than 5 years
Exploration commitments i) ‐ 100
Contracts ii) 2,726 6,292
Total 2,726 6,392
For
per
sona
l use
onl
y

Notes to the consolidated financial statements for the year ended 30 June 2018
98
Note 11: Investment in joint ventures (continued) i) The JV must meet minimum expenditure commitments in relation to option agreements over exploration tenements and to maintain those tenements in good standing. The commitments exist at balance sheet date but have not been brought to account. If the relevant mineral tenement is relinquished the expenditure commitment also ceases. ii) The Group has contractual commitments regarding purchasing agreements for consumables and energy at its operations.
Note 12: Trade and other payables
2018 2017
US $'000 US $'000
Current
Trade payables and accrued expenses 7,457 9,307
Total current 7,457 9,307
Non‐current
Trade payables and accrued expenses 559 551
Total non‐current 559 551
The amounts are unsecured and non‐interest bearing and generally on 30 to 60 day terms. The carrying amounts approximate fair value.
Note 13: Provisions
2018 2017
Note US $'000 US $'000
Current Employee benefits 13a 630 412
Total current 630 412
Non‐current Employee benefits 13a 1,087 1,172
Provision for rehabilitation 13b 10,133 9,553
Other provisions 111 178
Total non‐current 11,331 10,903
13a) Employee benefits
2018 2017
US $'000 US $'000
Annual leave 261 185
Long service leave 222 ‐
Borax Argentina S.A. defined benefit pension plan i) 1,225 1,300
Former employee termination costs 9 99
Total 1,717 1,584
For
per
sona
l use
onl
y
Notes to the consolidated financial statements for the year ended 30 June 2018
99
Note 13: Provisions (continued)
i) The Group had a defined benefit pension plan in Argentina. During the 2015 financial year, the Group decided to discontinue this plan. The remaining liability reflects the obligation with respect to former employees.
13b) Rehabilitation provision Reconciliation of the carrying amount for provision for rehabilitation is set out below:
2018 2017
US $'000 US $'000
Balance at the beginning of year 9,553 9,458
Arising during the year 1,111 1,040
Disposed during the year (630) ‐
Foreign currency translation ‐ (945)
Unwinding of discount 99 ‐
Balance at the end of year 10,133 9,553
The Group has recognised a provision for rehabilitation obligations associated with Borax Argentina S.A.'s operations. Recognition and measurement Provisions are recognised when the Group has a present obligation (legal or constructive) as a result of a past event, it is probable that an outflow of resources embodying economic benefits will be required to settle the obligation and a reliable estimate can be made of the amount of the obligation. When the Group expects some or all of a provision to be reimbursed, for example, under an insurance contract, the reimbursement is recognised as a separate asset, but only when the reimbursement is virtually certain. The expense relating to a provision is presented in the statement of profit or loss, net of any reimbursement.
Employee benefits Wages, salaries, annual leave and sick leave liabilities for wages and salaries, including non‐monetary benefits, annual leave and accumulating sick leave expected to be settled within 12 months of the reporting date are recognised in respect of employees' services up to the reporting date. They are measured at the amounts expected to be paid when the liabilities are settled. Based on past experience, the Group does not expect the full amount of annual leave classified as current liabilities to be settled within the next 12 months. However, these amounts must be classified as current liabilities since the Group does not have an unconditional right to defer the settlement of these amounts. Expenses for non‐accumulating sick leave are recognised when the leave is taken and are measured at the rates paid or payable. Long service leave The Group recognises a liability for long service leave measured as the present value of expected future payments to be made in respect of services provided by employees up to the reporting date using the projected unit credit method. Consideration is given to expected future wage and salary levels, experience of employee departures, and periods of service. Expected future payments are discounted using market yields at the reporting date on the applicable corporate bond with terms to maturity and currencies that match, as closely as possible, the estimated future cash outflows.
For
per
sona
l use
onl
y

Notes to the consolidated financial statements for the year ended 30 June 2018
100
Note 13: Provisions (continued)
Environmental protection, rehabilitation and closure costs Provision is made for close down, restoration and environmental rehabilitation costs (which include the dismantling and demolition of infrastructure, removal of residual materials and remediation of disturbed areas) in the financial period when the related environmental disturbance occurs, based on the estimated future costs using information available at the statement of financial position date. The provision is discounted using a current market‐based pre‐tax discount rate that reflects the time value of money and risk specific to the liability. The unwinding of the discount is included in interest expense. At the time of establishing the provision, a corresponding asset is capitalised, where it gives rise to a future benefit, and depreciated over future production from the operations to which it relates. The provision is reviewed on an annual basis for changes to obligations, legislation or discount rates that impact estimated costs or lives of operations. The cost of the related asset is adjusted for changes in the provision resulting from changes in the estimated cash flows or discount rate and the adjusted cost of the asset is depreciated prospectively.
Significant judgements and estimates The Group has recognised a provision for rehabilitation obligations associated with Borax Argentina S.A.'s operations. In determining the present value of the provision, assumptions and estimates are made in relation to discount rates, the expected cost to dismantle and remove the plant from the site and the expected timing of those costs.
Note 14: Equity and reserves 14a) Issued capital
2018 2017 2018 2017
No. shares No. shares US $'000 US $'000
Fully paid ordinary shares 260,710,716 210,520,500 527,364 243,184
Reconciliation of the movement in ordinary share capital is set out below:
2018 2017 2018 2017
No. shares No. shares US $'000 US $'000
Balance at the beginning of year 210,520,500 209,479,867 243,184 242,248
Options and performance rights exercised i) 529,488 1,040,633 113 936
Shares issued, net of transactions costs ii) 49,660,728 ‐ 284,067 ‐
Balance at the end of year 260,710,716 210,520,500 527,364 243,184
i) Represents performance rights and options exercised under the Company’s share‐based payments plans and executive service agreements. Refer to Note 18 for share‐based payments. ii) Transaction costs (net of tax) for the Shares issued during the year were US$2,828,672. Recognition and measurement Ordinary shares are classified as equity. Transaction costs arising on the issue of ordinary shares are recognised in equity as a reduction of the share proceeds received.
For
per
sona
l use
onl
y

Notes to the consolidated financial statements for the year ended 30 June 2018
101
Note 14: Equity and reserves (continued) 14b) Reserves
Share‐based
payments
Interest rate swap
hedge
Foreign currency
translation Other Total
US $'000 US $'000 US $'000 US $'000 US $'000
Balance as at 1 July 2016 3,225 (5,222) (109,635) (181) (111,813)
Translation losses on foreign operations ‐ ‐ (1,571) ‐ (1,571)
Fair value taken to equity ‐ 1,473 ‐ ‐ 1,473
Other comprehensive income/(loss) ‐ 1,473 (1,571) ‐ (98)
Share‐based payments 704 ‐ ‐ ‐ 704
Decrease in wealth tax ‐ ‐ ‐ 15 15
Disposal of subsidiary ‐ ‐ 6,285 ‐ 6,285
Balance as at 30 June 2017 3,929 (3,749) (104,921) (166) (104,907)
Share‐based
payments
Interest rate swap
hedge
Foreign currency
translation Other Total US $'000 US $'000 US $'000 US $'000 US $'000
Balance as at 1 July 2017 3,929 (3,749) (104,921) (166) (104,907)
Translation losses on foreign operations ‐ ‐ (5,089) ‐ (5,089)
Fair value taken to equity ‐ 1,732 ‐ ‐ 1,732
Other comprehensive income/(loss) ‐ 1,732 (5,089) ‐ (3,357)
Share‐based payments 1,341 ‐ ‐ ‐ 1,341
Balance as at 30 June 2018 5,270 (2,017) (110,010) (166) (106,923)
Nature and purpose of reserves Share‐based payments reserve The share‐based payments reserve represents the fair value of share‐based remuneration provided to employees. Foreign currency translation reserve The foreign currency translation reserve records exchange differences arising on translation of foreign controlled subsidiaries with a functional currency other than USD, and the Group's share of equity accounted foreign currency translation reserves of the joint venture. Equity of the Parent entity is translated at historical rates of exchange prevailing on the date of each transaction.
Interest rate swap hedge reserve The interest rate swap hedge reserve records the revaluation of derivative financial instruments in the joint venture that qualify for hedge accounting. This represents the Group's share of equity accounted interest rate swap hedge reserves.
For
per
sona
l use
onl
y

Notes to the consolidated financial statements for the year ended 30 June 2018
102
Note 15: Net debt
2018 2018 2017 2017
Current Non‐current Current Non‐current
US $'000 US $'000 US $'000 US $'000
Loans and borrowings
Working capital facility 728 ‐ 872 73
Bank overdraft 9 ‐ 5 ‐
Total Loans and borrowings 737 ‐ 877 73
Cash and cash equivalents
Cash at bank and on hand 8,066 3,459
Short term deposits 308,624 48,173
Total cash and cash equivalents 316,690 51,632
Net cash 315,953 50,682
The effective interest rate on USD denominated short term deposits was 1.57% p.a. (2017: 0.77% p.a.). Short term deposits held at 30 June 2018 relate to project financing, rental and other security deposits. Deposits relating to cash held had an average maturity of 91 days (2017: 76 days). Cash and short‐term deposits are disclosed in the cash flow statement, net of bank overdrafts.
2018 2017
US $'000 US $'000
Total cash and cash equivalents 316,690 51,632
Bank overdrafts (9) (5)
Total cash and cash equivalents, net of overdrafts 316,681 51,627
Loans and borrowings The working capital facility is USD denominated and has been drawn down under a 6 month bank facility. It accrues interest at the rate of 4.2% p.a. The carrying amounts of the loans and borrowings approximate fair value. Fair value has been determined using a discounted cash flow valuation technique based on contractual and expected cash flows and current market interest rates (Level 2). Bank overdrafts The bank overdraft with Patagonia Bank is Argentinean Peso denominated and has an indefinite term. The overdraft facility accrues interest at the rate of 30.00% p.a. Recognition and measurement Cash and cash equivalents Cash and short‐term deposits in the statement of financial position comprise cash at banks and on hand and short‐term deposits with a maturity of three months or less, which are subject to an insignificant risk of changes in value. Loans and borrowings After initial recognition, interest bearing loans and borrowings are subsequently measured at amortised cost using the EIR method. Gains and losses are recognised in profit or loss when the liabilities are derecognised as well as through the EIR amortisation process. Amortised cost is calculated by taking into account any discount or premium on acquisition and fees or costs that are an integral part of the EIR. The EIR amortisation is included in finance costs in the statement of profit or loss.
For
per
sona
l use
onl
y

Notes to the consolidated financial statements for the year ended 30 June 2018
103
Note 16: Financial risk management The Group’s financial instruments comprise deposits with banks, financial assets, amounts receivable and payable, and interest‐bearing liabilities. The main purpose of these financial instruments is to provide finance for Group operations. Risk management policies Key management of the Group meet on a regular basis to analyse exposure and to evaluate treasury management strategies in the context of the most recent economic conditions and forecasts. The Board of Directors has overall responsibility for the establishment and oversight of the Group's risk management framework. Management is responsible for developing and monitoring the risk management policies and reports to the Board. Financial risks The main risks the Group is exposed to through its financial instruments are interest rate risk, foreign currency risk, credit risk and liquidity risk. There is a minor exposure to price risk through the financial assets. These risks are managed through monitoring of forecast cashflows, interest rates, economic conditions and ensuring adequate funds are available. Interest rate risk The Group's exposure to interest rate risk, which is the risk that a financial instrument's value will fluctuate as a result of reasonably possible changes in market interest rates arises in relation to the Group's bank balances. This risk is managed through the use of variable rate term deposits. Interest rate sensitivity With all other variables held constant, the Group’s profit after tax and equity are affected through the impact of floating and/or fluctuating interest rates on cash and receivables as follows:
2018 2017
US $'000 US $'000
Cash and cash equivalents 316,690 51,632
Receivables 68,219 63,884
Standby letters of credit (SBLC) ‐ 9,792
384,909 125,308
Effect on profit and equity as a result of a: 1% +/‐ reasonably possible change in interest rates 2,694 877
The assumed movement in basis points for the interest rate sensitivity analysis is based on the currently observable market environment. Liquidity risk Liquidity risk is the risk that the Group will not be able meet its financial obligations as they fall due. This risk is managed by ensuring, to the extent possible, that there is sufficient liquidity (through cash and cash equivalents and available borrowing facilities) to meet liabilities when due, without incurring unacceptable losses or risking damage to the Group's reputation.
For
per
sona
l use
onl
y

Notes to the consolidated financial statements for the year ended 30 June 2018
104
Note 16: Financial risk management (continued) Undiscounted contractual maturities of financial liabilities:
Within 12 months 1 to 5 years
Over 5 years Total
US $'000 US $'000 US $'000 US $'000
Payables 7,457 559 ‐ 8,016
Loans and borrowings 737 ‐ ‐ 737
Total as at 30 June 2018 8,194 559 ‐ 8,753
Payables 9,307 551 ‐ 9,858
Loans and borrowings 877 73 ‐ 950
Total as at 30 June 2017 10,184 624 ‐ 10,808
Foreign currency risk The group is exposed to fluctuations in AUD and ARS arising from the purchase of goods and services, and loans and receivables. The Group does not currently undertake any hedging of foreign currency items. Foreign currency sensitivity The following tables demonstrate the sensitivity to a reasonably possible change in the AUD and ARS exchange rates relative to the US Dollar, with all other variables held constant. The impact on the Group’s profit after tax and equity is due to changes in the fair value of monetary assets and liabilities.
2018 2017
US $'000 US $'000
Australian dollar cash and cash equivalents 13,866 498
Australian dollar receivables 25 136
13,891 634
United States dollar receivables (Borax SA only) 3,828 5,198
3,828 5,198
Effect on profit as a result of a:
10% +/‐ reasonably possible change in United States dollar (vs ARS) 268 364
10% +/‐ reasonably possible change in the Australian dollar 972 44
Effect on equity as a result of a:
10% +/‐ reasonably possible change in United States dollar (vs ARS) 268 364
10% +/‐ reasonably possible change in the Australian dollar 972 44
Credit risk Credit risk is the risk that a counterparty will not meet its obligations under a financial instrument or customer contract, leading to a financial loss. The Group is exposed to credit risk from its operating activities (primarily trade receivables) and from its financing activities, including deposits with banks and financial institutions, foreign exchange transactions and other financial instruments. Credit risk is managed and reviewed regularly by key management. It arises from exposures to certain financial instruments and deposits with financial institutions. Key management monitor credit risk by actively assessing the rating quality and liquidity of counterparties. Only banks and financial institutions with an ‘A’ rating are utilised.
For
per
sona
l use
onl
y
Notes to the consolidated financial statements for the year ended 30 June 2018
105
Note 16: Financial risk management (continued) The maximum exposure to credit risk, excluding the value of any collateral or other security, at balance date to recognised financial assets, is the carrying amount, net of any provisions for impairment of those assets, as disclosed in the statement of financial position and notes to the financial statements. The Group does not have any material credit risk exposure to any single receivable or group of receivables under financial instruments entered into by the Group, other than bank balances and short‐term deposits, VAT tax credits, receivables from joint venture (Note 7), and Standby Letters of Credit (SBLC's) (Note 16a). Trading commodity price risk The Group’s prospects and share price will be influenced by the price obtained for the commodities that it produces and those that it targets in its exploration programs, namely lithium chemicals, boron chemicals and mineral products and, to a lesser extent, other minerals.
The prices of lithium chemicals have fluctuated widely in recent years and are affected by factors beyond the control of the Group including, but not limited to, the relationship between global supply and demand for lithium chemicals which may be affected by, but not limited to, development and commercial acceptance of lithium based applications and technologies and/or the introduction of new technologies that may not be based on lithium, forward selling by producers, the cost of production, new mine developments and mine closures, advances in various production technologies for such minerals and general global economic conditions. The prices of lithium and other commodities can also be affected by the outlook for inflation, interest rates, currency exchange rates and supply and demand issues. Also, major lithium producers may attempt to sell lithium products at artificially low prices in order to drive new entrants out of the market. These factors may have an adverse effect on the Group's production, development and exploration activities, as well as its ability to fund its future activities. All sales contracts are agreed in USD or USD equivalent prices and forward contracts are agreed for periods of 3‐12 months. The Group is also affected by the market forces and market price cycles of boron chemicals and mineral products. In relation to boron chemicals and mineral products the market price is determined largely by the market supply and demand balance which is influenced heavily by the rate of GDP growth. There are two significant manufacturers of boron chemicals and minerals in the global market, so the supply side is relatively consolidated. Boron chemicals and mineral products are used in applications such as ceramic and glass manufacturing, insulation and fertiliser manufacturing. Although there is a cyclic profile in these markets they are considered steady growth markets linked strongly to urbanisation and food production, so volatility is not considered high. In terms of inputs, the major input is ore mined from the Company's own assets so input cost risk is managed through control of costs such as diesel fuel, labour and gas via forward contracts. All sales contracts are typically agreed in USD or USD equivalent prices and forward contracts are agreed for periods of 3‐12 months. Trading commodity price sensitivity The following table shows the effect of changes in commodity prices:
2018 2017
US $'000 US $'000
Effect on profit as a result of a: 10% +/‐ reasonably possible change in boron chemicals 268 333
Capital management Capital includes equity attributable to the equity holders of the Parent. The primary objective of the Group’s capital management is to ensure that it maintains a strong credit rating and healthy capital ratios to support its business and maximise shareholder value. The Group manages its capital structure and adjusts it in light of changes in economic conditions. To maintain or adjust the capital structure, the Group may return capital to shareholders or issue new shares.
For
per
sona
l use
onl
y

Notes to the consolidated financial statements for the year ended 30 June 2018
106
Note 16: Financial risk management (continued)
No changes were made in the objectives, policies or processes for managing capital during the financial year. The change in the gearing ratio in the current year reflects the increase in cash as a result of the TTC placement and entitlement offer during the year.
2018 2017
Note US $'000 US $'000
Trade and other payables 12 8,016 9,858
Loans and borrowings 15 737 950
Less: cash and short‐term deposits 15 (316,690) (51,632)
Net cash (307,937) (40,824)
Equity 502,104 218,020
Capital and net cash 194,167 177,196
Gearing ratio (159%) (23%)
Fair values No financial assets or liabilities are readily traded on organised markets in a standardised form, other than shares in listed entities.
The aggregate values and carrying amounts of financial assets and liabilities are disclosed in the statement of financial position and notes to the financial statements. Fair values are materially in line with carrying values. The shares in listed entities comprise listed investments for which a Level 1 fair value hierarchy has been applied (quoted price in an active market).
The Group’s financial instruments consist mainly of deposits with banks, local money market instruments, short‐term investments, accounts receivable and payable, and loans to and from subsidiaries and joint ventures. The totals for each category of financial instruments, measured in accordance with AASB 139 as detailed in the accounting policies to these financial statements, are as follows: 16a) Financial assets
2018 2017
Note US $'000 US $'000
Cash and cash equivalents 316,690 51,632
Financial assets at amortised cost (loans and receivables):
Trade and other receivables ‐ current 7 52,449 23,710
Trade and other receivables ‐ non‐current 7 34,240 58,464
Standby letters of credit i) ‐ 9,792
Total financial assets 403,379 143,598
i) The USD SBLC's were short term deposits used as security for borrowings by the joint venture which were phased out during the year ended 30 June 2018. Such deposits earned rates of between 1.03% p.a and 1.93% p.a. and were generally held for a term of 3 months at a time. Such SBLC's were provided due to a working capital requirement for Sales de Jujuy S.A. which arose principally due to delays in the production start‐up. The carrying value approximates fair value.
For
per
sona
l use
onl
y
Notes to the consolidated financial statements for the year ended 30 June 2018
107
Note 16: Financial risk management (continued) Recognition and measurement The Group assesses, at each reporting date, whether there is objective evidence that a financial asset or a group of financial assets is impaired. An impairment exists if one or more events that has occurred since the initial recognition of the asset (an incurred ‘loss event’) has an impact on the estimated future cash flows of the financial asset or the group of financial assets that can be reliably estimated. Evidence of impairment may include indications that the debtors or a group of debtors is experiencing significant financial difficulty, default or delinquency in interest or principal payments, the probability that they will enter bankruptcy or other financial reorganisation and observable data indicating that there is a measurable decrease in the estimated future cash flows, such as changes in arrears or economic conditions that correlate with defaults. Financial assets The Group initially recognises financial assets on the trade date at which the Group commits to purchase or sell the asset. Financial assets are derecognised when the rights to receive cash flows from the financial assets have expired or have been transferred and the Group has transferred substantially all the risks and rewards of ownership. Financial assets are initially measured at fair value. If the financial asset is not subsequently accounted for at fair value through profit or loss, then the initial measurement includes transaction costs that are directly attributable to the asset’s acquisition or origination. Subsequent measurement The subsequent measurement of financial assets depends on their classification as described below: Financial assets at fair value through profit or loss Financial assets at fair value through profit or loss include financial assets held for trading and financial assets designated upon initial recognition at fair value through profit or loss. Financial assets are classified as held for trading if they are acquired for the purpose of selling or repurchasing in the near term. Derivatives, including separated embedded derivatives are also classified as held for trading unless they are designated as effective hedging instruments as defined by AASB 139. The Group has not designated any financial assets at fair value through profit or loss. Financial assets at fair value through profit or loss are carried in the statement of financial position at fair value with net changes in fair value presented as finance costs (negative net changes in fair value) or finance income (positive net changes in fair value) in the statement of comprehensive income. Loans and receivables Loans and receivables are non‐derivative financial assets with fixed or determinable payments that are not quoted in an active market. After initial measurement, such financial assets are subsequently measured at amortised cost using the effective interest rate (EIR) method, less impairment. Amortised cost is calculated by taking into account any discount or premium on acquisition and fees or costs that are an integral part of the EIR. The EIR amortisation is included in finance income in the statement of comprehensive income. The losses arising from impairment are recognised in the statement of comprehensive income in finance costs for loans and cost of sales for receivables.
For
per
sona
l use
onl
y

Notes to the consolidated financial statements for the year ended 30 June 2018
108
Note 16: Financial risk management (continued) 16b) Financial liabilities
2018 2017
Note US $'000 US $'000
Financial liabilities
Financial liabilities at amortised cost:
Trade and other payables ‐ current 12 7,457 9,307
Trade and other payables ‐ non‐current 12 559 551
Loans and borrowings ‐ current 15 737 877
Loans and borrowings ‐ non‐current 15 ‐ 73
Total financial liabilities 8,753 10,808
Recognition and measurement Non‐derivative liabilities The Group initially recognises financial assets and non‐financial assets and liabilities on the date when they originate. Other financial liabilities are initially recognised on the trade date. The Group derecognises a financial liability when its contractual obligations are discharged or cancelled or expire. Non‐derivative financial liabilities are initially recognised at fair value less any directly attributable transaction costs. Subsequent to initial recognition, these liabilities are measured at amortised cost using the effective interest method.
Note 17: Key management personnel
Compensation of Key Management Personnel of the Group:
2018 2017
US $ US $
Short‐term employee benefits 1,709,621 1,563,730
Post‐employment benefits 77,979 95,655
Other long‐term benefits 43,810 30,839
Share‐based payments 835,633 448,249
Total compensation 2,667,043 2,138,473
Transactions with Directors and Key Management Personnel There were no Key Management Personnel (KMP) related party transactions during the year. Detailed disclosures on compensation for Key Management Personnel are set out in the Remuneration Report included in the Directors' Report.
Note 18: Share‐based payments Options and performance rights Employee & Officer Share Option Plan (EOSOP) Under the Employee & Officer Share Option Plan (EOSOP), awards are made to executives and other key talent who have an impact on the Group’s performance. EOSOP awards are delivered in the form of options over shares which vest over varying periods subject to the employee remaining in service.
Performance Rights & Option Plan (PROP) Under the Performance Rights & Option Plan (PROP), awards are made to executives who have an impact on the Group’s performance and are delivered in the form of options and rights.
For
per
sona
l use
onl
y

Notes to the consolidated financial statements for the year ended 30 June 2018
109
Note 18: Share‐based payments (continued) Performance Rights (PR’s) awarded under the PROP vest over a period of 3 years and are subject to the following Total Shareholder Return (TSR) outperformance conditions, and continuous service until the vesting date.
TSR performance condition (absolute, 50%) Proportion of PROP which vest
If TSR falls below 7.5% return per annum None of the options vest
If TSR lies between 7.5% and 10% return per annum 50% of the options vest
If TSR lies between 10% and 12.5% return per annum 75% of the options vest If TSR lies at or above the 12.5% return per annum 100% the options vest
TSR performance condition (relative, 50%)1 Proportion of PROP which vest
Greater than 75th percentile 100% of the options vest
Equal to or greater than 50th percentile 50% of the options vest Less than 50th percentile None of the options vest 1 TSR performance condition over the measurement period relative to the constituent companies of the ASX 300 Resources Index subject to the
following thresholds.
Movements in the year are:
Grant date Vesting date Expiry date
Exercise price
(AU $) 2017 No.
Granted No.
Exercised No.
Forfeited / lapsed
No. 2018 No.
3 Jun 2013 1 Jun 2016 31 May 2018
1.50 100,000 ‐ (100,000) ‐ ‐
Total options 100,000 ‐ (100,000) ‐ ‐
21 Nov 2014 31 Aug 2017 30 Sep 2017 ‐ 150,039 ‐ (141,787) (8,252) ‐
21 Jan 2015 31 Aug 2017 30 Sep 2017 ‐ 306,551 ‐ (287,701) (18,850) ‐
6 Nov 2015 31 Aug 2018 30 Sep 2018 ‐ 632,698 ‐ ‐ ‐ 632,698
29 Jan 2016 31 Aug 2018 30 Sep 2018 ‐ 170,269 ‐ ‐ (45,718) 124,551
23 Nov 2016 31 Aug 2019 30 Sep 2019 ‐ 118,721 ‐ ‐ ‐ 118,721
31 Mar 2017 31 Aug 2019 30 Sep 2019 ‐ 367,995 1,101 ‐ (32,670) 336,426
24 Nov 2017 31 Aug 2020 30 Sep 2020 ‐ 197,769 ‐ ‐ 197,769
2 Mar 2018 31 Aug 2020 30 Sep 2020 ‐ ‐ 634,443 ‐ (26,970) 607,473
Total performance rights 1,746,273 833,313 (429,488) (132,460) 2,017,638
Total options and performance rights 1,846,273 833,313 (529,488) (132,460) 2,017,638
Weighted average exercise price (AU $) 0.081 ‐ 0.280 ‐ ‐
2017 Opening Vested Exercised
2018 Closing
Total vested and exercisable (No.)
100,000 429,488 (529,488) ‐
Weighted average exercise price (AU $) 1.500 ‐ 0.280 ‐
During the year, 833,313 PR’s were granted pursuant to the Company's PROP for nil consideration. PR’s are exercisable at AU $0.00 each with 1,101 vesting on 31 August 2019, and 832,212 vesting on 31 August 2020.
For
per
sona
l use
onl
y

Notes to the consolidated financial statements for the year ended 30 June 2018
110
Note 18: Share‐based payments (continued) All PR’s granted are over ordinary shares, which confer a right of one ordinary share per PR. The PR’s hold no voting or dividend rights. At the end of the financial year there are 1,338,327 PR’s on issue to KMP (2017: 1,118,109). At the date of issue, the weighted average share price of options and PR’s granted in the current year was AU $5.95 (2017: AU $3.14). The options and PR’s outstanding at 30 June 2018 had a weighted average exercise price of AU $0.00 (2017: AU $0.08) and a weighted average remaining contractual life of 1.28 years (2017: 1.25 years). The weighted average fair value of options and PR’s granted during the year was AU $4.69 (2017: AU $1.63). The fair value of options and PR’s granted is deemed to represent the value of the employee services received over the vesting period. The fair value of equity settled options and PR’s are estimated at the date of grant using either a Binomial Option Valuation Model or Monte Carlo Simulation with the following inputs:
Year of issue 2016 ‐ PROP 2016 ‐ PROP 2016 ‐ PROP 2016 ‐ PROP
Grant date 6/11/2015 6/11/2015 29/01/2016 29/01/2016
Number issued 316,348 316,350 85,132 85,137
Fair value at grant date (AU $) 1.08 1.37 1.48 1.89
Share price (AU $) 1.79 1.79 2.50 2.50
Exercise price (AU $) ‐ ‐ ‐ ‐
Expected volatility 50.00% 50.00% 50.00% 50.00%
Option life 3 years 3 years 3 years 3 years
Expected dividends nil nil nil nil
Risk‐free interest rate 1.97% 1.97% 1.88% 1.88%
Year of issue 2017 ‐ PROP 2017 ‐ PROP 2017 ‐ PROP 2017 ‐ PROP
Grant date 23/11/2016 23/11/2016 31/03/2017 31/03/2017
Number issued 59,361 59,360 184,548 184,548
Fair value at grant date (AU $) 3.15 2.64 1.42 1.03
Share price (AU $) 4.27 4.27 2.78 2.78
Exercise price (AU $) ‐ ‐ ‐ ‐
Expected volatility 47.00% 47.00% 47.00% 47.00%
Option life 3 years 3 years 3 years 3 years
Expected dividends nil nil nil nil
Risk‐free interest rate 1.85% 1.85% 1.82% 1.82%
Year of issue 2018 ‐ PROP 2018 ‐ PROP 2018 ‐ PROP 2018 ‐ PROP
Grant date 24/11/2017 24/11/2017 2/03/2018 2/03/2018
Number issued 98,885 98,884 317,222 317,221
Fair value at grant date (AU $) 5.31 4.73 4.85 4.35
Share price (AU $) 6.20 6.20 5.88 5.88
Exercise price (AU $) ‐ ‐ ‐ ‐
Expected volatility 47.00% 47.00% 47.00% 47.00%
Option life 3 years 3 years 3 years 3 years
Expected dividends nil nil nil nil
Risk‐free interest rate 1.87% 1.87% 2.01% 2.01%
Historical volatility has been the basis for determining expected share price volatility as it is assumed that this is indicative of future movements.
For
per
sona
l use
onl
y
Notes to the consolidated financial statements for the year ended 30 June 2018
111
Note 18: Share‐based payments (continued) The total expense arising from share‐based payment transactions recognised during the period as part of employee benefit expense was US $1,341,000 (2017: US $704,014). Of this amount, US $104,797 (2017: US $94,808) was recharged to SDJ SA. Recognition and measurement The cost of equity‐settled transactions is determined by the fair value at the date when the grant is made using an appropriate valuation model. That cost is recognised, together with a corresponding increase in other capital reserves in equity, over the period in which the performance and/or service conditions are fulfilled in employee benefits expense. The cumulative expense recognised for equity‐settled transactions at each reporting date until the vesting date reflects the extent to which the vesting period has expired and the Group’s best estimate of the number of equity instruments that will ultimately vest. The statement of profit or loss, expense or credit for a period represents the movement in cumulative expense recognised as at the beginning and end of that period and is recognised in employee benefits expense. No expense is recognised for awards that do not ultimately vest, except for equity‐settled transactions for which vesting is conditional upon a market or non‐vesting condition. These are treated as vesting irrespective of whether the market or non‐vesting condition is satisfied, provided that all other performance and/or service conditions are satisfied. When the terms of an equity‐settled award are modified, the minimum expense recognised is the expense had the terms not been modified if the original terms of the award are met. An additional expense is recognised for any modification that increases the total fair value of the share‐based payments transaction or is otherwise beneficial to the employees as measured at the date of modification. The dilutive effect of outstanding options is reflected as additional share dilution in the computation of diluted earnings per share (further details are given in Note 6). Significant judgements and estimates The Group measures the cost of equity‐settled transactions with employees by reference to the fair value of the equity instruments at the date at which they are granted. Estimating fair value for share‐based payment transactions requires determination of the most appropriate valuation model, which is dependent on the terms and conditions of the grant. This estimate also requires determination of the most appropriate inputs to the valuation model including the expected life of the share option, volatility and dividend yield and making assumptions about them.
For
per
sona
l use
onl
y

Notes to the consolidated financial statements for the year ended 30 June 2018
112
Note 19: Information relating to subsidiaries
The consolidated financial statements of the Group include:
Entity Name
Country of incorporation & principal place of
business
% equity interest held by the Group
2018 2017
Borax Argentina Holding No 1 Pty Ltd Australia 100.00 100.00
Borax Argentina Holding No 2 Pty Ltd Australia 100.00 100.00
Borax Argentina S.A. Argentina 100.00 100.00
Orocobre Brasil Representacoes E Assessoria Comercial LTDA Brazil 100.00 100.00
La Frontera S.A. Argentina 85.00 85.00
Olaroz Lithium S.A. Argentina 100.00 ‐
El Trigal S.A. Argentina 100.00 ‐
Basis of consolidation The consolidated financial statements comprise the financial statements of the Group and its subsidiaries as at 30 June 2018. Control is achieved when the Group is exposed, or has rights, to variable returns from its involvement with the investee and has the ability to affect those returns through its power over the investee. Specifically, the Group controls an investee if and only if the Group has: ‐ Power over the investee (i.e. existing rights that give it the current ability to direct the relevant activities of the
investee), ‐ Exposure, or rights, to variable returns from its involvement with the investee, and ‐ The ability to use its power over the investee to affect its returns. The Group re‐assesses whether or not it controls an investee if facts and circumstances indicate that there are changes to one or more of the three elements of control. Consolidation of a subsidiary begins when the Group obtains control over the subsidiary and ceases when the Group loses control of the subsidiary. Assets, liabilities, income and expenses of a subsidiary acquired or disposed of during the year are included in the consolidated financial statements from the date the Group gains control until the date the Group ceases to control the subsidiary. When necessary, adjustments are made to the financial statements of subsidiaries to bring their accounting policies into line with the Group's accounting policies. All intra‐Group assets and liabilities, equity, income, expenses and cash flows relating to transactions between members of the Group are eliminated in full on consolidation.
Note 20: Investment in associates Reconciliation of the movement in investment in associates is set out below:
2018 2017
US $'000 US $'000
Balance at the beginning of year 21,476 ‐
Acquisition during the year 10 21,476
Loss from equity accounted investment in associates (1,532) ‐
Balance at the end of year 19,954 21,476
For
per
sona
l use
onl
y

Notes to the consolidated financial statements for the year ended 30 June 2018
113
Note 20: Investment in associates (continued)
The Group had a 34.3% interest in Advantage Lithium Corp. (“AAL”), a lithium explorer and developer and a publicly listed company on the Toronto Stock Exchange. The following tables illustrate the summarised financial information of the Group’s investment in AAL.
2018
US $'000
Statement of profit or loss
Corporate expenses (4,636)
Depreciation (10)
Foreign currency gain 29
Loss before interest (4,617)
Finance income 150
Loss for the year (4,467)
Group’s share of loss for the year (1,532)
2018
US $'000
Statement of financial position 1
Current assets 8,445
Non‐current assets 34,657
Total assets 43,102
Current liabilities 398
Total liabilities 398
Contributed equity 53,808
Reserves 4,657
Accumulated losses (15,761)
Total equity 42,704
On 28 March 2017, Orocobre Ltd received 46,325,000 shares worth CAD $0.62 from AAL as part of the disposal of South American Salar Minerals Pty Ltd (See Note 4 for additional information). Orocobre has appointed 2 Directors to the Board of AAL and has entered into a separate arrangement to develop Cauchari with AAL. AAL's key assets relate to those purchased from Orocobre (see Note 4), has no significant liabilities and at 30 June 2018 the share price of AAL was CA $0.81. (2017: CA $0.38). The principal place of business of AAL is in Vancouver, Canada. The associate requires it’s Parent’s consent to distribute its profits. The Parent does not foresee giving such consent at reporting date. See Note 11 for the Group’s accounting policy on Investment in joint ventures and associates. 1 The statement of financial position is based on AAL’s translated balance sheet as at 30 April 2018.
For
per
sona
l use
onl
y

Notes to the consolidated financial statements for the year ended 30 June 2018
114
Note 21: Parent entity information The following information relates to the parent entity. The ultimate parent entity within the Group is Orocobre Limited. The individual financial statements for the parent entity show the following aggregate amounts below:
2018 2017
US$000's US$000's
Current assets 363,342 87,130
Non‐current assets 185,757 213,854
Total assets 549,099 300,984
Current liabilities 2,814 1,250
Non‐current liabilities 2,007 433
Total liabilities 4,821 1,683
Contributed equity 527,364 243,184
Reserves (43,281) (44,622)
Accumulated profits 60,195 100,739
Total equity 544,278 299,301
Profit/(loss) for the year (40,544) 10,403
Total comprehensive profit/(loss) for the year (40,544) 10,403
Orocobre Limited had no contingent liabilities at year end. As set out in Note 26 the Company has an operating lease commitment for US $58,140 (2017: US $177,511). The loss for the period includes impairment of the investment in Borax Argentina S.A. of $36,323,962.
The parent entity has several employees. A portion of the costs associated with these employees are borne by a subsidiary of the parent entity and are not included in the above disclosures.
Recognition and measurement The financial information for the parent entity, Orocobre Limited, has been prepared on the same basis as the consolidated financial statements, except as set out below: Investments in subsidiaries, associates and joint venture entities Investments in subsidiaries, associates and joint venture entities are accounted for at cost in the financial statements of Orocobre Limited.
For
per
sona
l use
onl
y

Notes to the consolidated financial statements for the year ended 30 June 2018
115
Note 22: Reconciliation of profit for the year to net cash used in operating activities
2018 2017
US $'000 US $'000
Profit after income tax from continuing operations
1,920 4,632
Profit after income tax from discontinued operation
‐ 14,784
Profit after income tax 1,920 19,416
Adjustments for:
Non‐cash employee benefits expense 1,341 460
Depreciation of property, plant and equipment 1,782 1,747
Gain on sale of assets (2,435) (16)
Gain on disposal of subsidiary (non‐cash) ‐ (11,069)
Loss on disposal of assets 374 ‐
Share of net gains of joint ventures (19,758) (21,480)
Share of net losses of associates 1,532 ‐
Impairment loss 8,046 8,105
Unwinding of discount on rehab provision 99 ‐
Fair value adjustment of loans receivable ‐ 625
Non‐cash finance income (3,843) (1,413)
Non‐cash finance costs ‐ 427
Unrealised foreign exchange gain 145 896
Changes in operating assets and liabilities:
(Increase)/decrease in receivables (3,339) (2,212)
(Decrease)/increase in payables 432 (982)
(Decrease)/increase in provisions 66 (3)
(Decrease)/increase in provisions – taxation ‐ 1,108
(Increase)/decrease in inventory (336) (2,022)
Net cash used in operating activities (13,974) (6,413)
Note 23: Auditors’ remuneration The auditor of Orocobre Limited is Ernst & Young.
2018 2017
US $ US $
Audit and review of financial statements (Ernst & Young)
‐ Australia 89,546 92,202
‐ Argentina 56,171 67,764
Total auditors' remuneration 145,717 159,966
For
per
sona
l use
onl
y

Notes to the consolidated financial statements for the year ended 30 June 2018
116
Note 24: Related party disclosures The following table provides the total amount of transactions with related parties for the relevant financial year:
2018 2017
Note US $ US $
Amounts owed by joint ventures
Current
Loans and borrowings recoverable from joint ventures 24a 37,250,000 12,500,000
Interest recoverable from joint ventures 24a 7,135,183 3,460,492
Other recoverable from joint ventures 339,000 ‐
Total current 44,724,183 15,960,492
Non‐current
Loans and borrowings recoverable from joint ventures 24a 22,589,535 47,339,534
Interest recoverable from joint ventures 24a 905,086 584,492
Loans and borrowings recoverable from joint venture partners 24b 7,815,471 6,580,000
Total non‐current 31,310,092 54,504,026
Sales to joint venture associates 1 24c 148,896,000 ‐
Amounts owed by joint venture associates 1
Current
Loans and borrowings recoverable from joint venture associates 12,416,667 ‐
Interest recoverable from joint venture associates 4,043,304 ‐
Total current 24c 16,459,971 ‐
Non‐current
Loans and borrowings recoverable from joint venture associates 1,523,200 ‐
Interest recoverable from joint venture associates 23,526 ‐
Total non‐current 24c 1,546,726 ‐
1 No comparative is provided for the joint venture associate as it wasn’t a related party in 2017. See Note 24c for further details.
24a) Loans and borrowings recoverable from joint ventures See Note 11e for the breakdown of loans and borrowings recoverable from the joint venture.
Note ‐ each loan component can be repaid earlier than the stated timeframe.
24b) Loans and borrowings recoverable from joint venture partners The loan to the joint venture partner is non‐interest bearing and will be repaid when the joint venture pays dividends, at 33.3% of dividend distributions to the joint venture partner. 24c) Amounts recoverable from joint venture associates In January 2018, Toyota Tsusho Corporation (‘TTC’) purchased 15% of Orocobre Limited shares. It also owns 27.32% of Sales de Jujuy Pte Ltd, the key joint venture company of the Group with Orocobre who owns 72.68% (Note 11). TTC is considered to have significant influence over Orocobre.
For
per
sona
l use
onl
y

Notes to the consolidated financial statements for the year ended 30 June 2018
117
Note 24: Related party disclosures (continued)
TTC is the exclusive sales agent for 100% of the production of Sales de Jujuy S.A., a subsidiary of the joint venture company, in exchange for commission. As agent, TTC provides services to the Group including: identifying and pursuing prospective customers, negotiating product sales and sales terms on behalf of the Group; maintaining liaison and communication with customers; marketing the products and securing the maximum volume of orders from the customers at the most favourable terms and conditions. TTC finances SDJ S.A. to the extent of reducing sales payment terms below 30 days, in exchange for a payment of interest using a rate of LIBOR + 2.0% over the applicable period upon request by SDJ S.A. It also provides shareholder loans to the joint venture as described in Note 11. In 2018, TTC, through its subsidiaries, purchased 100% of the product of Sales de Jujuy S.A. and on sold such product to end users.
Note 25: Summary of other significant accounting policies Other significant accounting policies adopted in the preparation of these consolidated financial statements are set out below. These policies have been consistently applied to all the years presented, unless otherwise stated. Where necessary, comparative information has been restated to conform with changes in presentation in the current year. a) Goods and Services Tax (GST) Revenues, expenses and assets are recognised net of the amount of GST (or overseas Value‐Added Tax (VAT)), except: ‐ When the GST incurred on a sale or a purchase of assets or services is not payable to or recoverable from the taxation
authority, in which case the GST is recognised as part of the revenue or the expense item or as part of the cost of acquisition of the asset, as applicable, and
‐ When receivables and payables are stated with the amount of GST included. The net amount of GST recoverable from, or payable to, the taxation authority is included as part of receivables or payables in the statement of financial position. Commitments and contingencies are disclosed net of the amount of GST (or VAT) recoverable from, or payable to, the taxation authority. b) Foreign currency translation The Group’s consolidated financial statements are presented in US Dollars, which is the Parent’s presentation currency. For each entity, the Group determines the functional currency and items included in the financial statements of each entity are measured using that functional currency. The Group uses the direct method of consolidation and on disposal of a foreign operation, the gain or loss that is reclassified to profit or loss reflects the amount that arises from using this method. Transactions and balances Transactions in foreign currencies are initially recorded by the Group’s entities at their respective functional currency spot rates at the date the transaction first qualifies for recognition. Monetary assets and liabilities denominated in foreign currencies are translated at the functional currency spot rates of exchange at the reporting date. Differences arising on settlement or translation of monetary items are recognised in profit or loss with the exception of monetary items that are designated as part of the Group’s net investment of a foreign operation. These are recognised in other comprehensive income until the net investment is disposed of, at which time, the cumulative amount is reclassified to profit or loss. Tax charges and credits attributable to exchange differences on those monetary items are also recorded in other comprehensive income.
For
per
sona
l use
onl
y

Notes to the consolidated financial statements for the year ended 30 June 2018
118
Note 25: Summary of other significant accounting policies (continued)
Non‐monetary items that are measured in terms of historical cost in a foreign currency are translated using the exchange rates at the dates of the initial transactions. Non‐monetary items measured at fair value in a foreign currency are translated using the exchange rates at the date when the fair value is determined. The gain or loss arising on translation of non‐monetary items measured at fair value is treated in line with the recognition of gain or loss on change in fair value of the item (i.e., translation differences on items whose fair value gain or loss is recognised in other comprehensive income or profit or loss are also recognised in other comprehensive income or profit or loss, respectively). Group companies On consolidation, the assets and liabilities of foreign operations are translated into US dollars at the rate of exchange prevailing at the reporting date and their statements of profit or loss are translated at the average exchange rate for each month of the financial year. The exchange differences arising on translation for consolidation purposes are recognised in other comprehensive income. On disposal of a foreign operation, the component of other comprehensive income relating to that particular foreign operation is recognised in profit or loss. Any goodwill arising on the acquisition of a foreign operation and any fair value adjustments to the carrying amounts of assets and liabilities arising on the acquisition are treated as assets and liabilities of the foreign operation and translated at the spot rate of exchange at the reporting date. c) New and amended standards adopted by the Group The accounting policies adopted are consistent with those of the previous financial year. New accounting standards effective during the year had no material impact on the Group. d) New accounting standards and interpretations not yet adopted Certain new accounting standards and interpretations have been published that are not mandatory for this reporting period and have not been early adopted by the Group. The Group’s assessment of the impact of these new standards and interpretations is set out below:
For
per
sona
l use
onl
y

Notes to the consolidated financial statements for the year ended 30 June 2018
119
Note 25: Summary of other significant accounting policies (continued)
Title of
standard
Nature of change Impact Mandatory
application date
AASB 15 Revenue from Contracts with
Customers
The AASB has issued a new standard for the recognition of revenue. This will replace AASB 118 which covers revenue arising from the sale of goods and the rendering of services, and AASB 111 which covers construction contracts. The new standard is based on the principle that revenue is recognised when control of a good or service transfers to a customer. The standard permits either a full retrospective or a modified retrospective approach for the adoption.
The Group does not believe that there will be a
material financial impact to either the
statement of profit or loss or the statement of
financial position once this accounting
standard is adopted aside for the potential for
some slight timing differences to arise on the
recognition of sales in Borax. This will be
assessed based on actual sales in Borax with
any difference impacting the following months
revenue.
Additional disclosures will be required for
revenues for Borax Argentina S.A. although
these are not anticipated to be
onerous. Specifically, it is expected that
revenues will be required to be reported at a
slightly more granular level (via grouping of
product types) and similarly by destination
(grouping by region and/or customer).
Management are currently assessing the most
practical and appropriate presentation to
ensure compliance under the new standard.
Mandatory for financial years commencing on or after 1 January 2018, and available for early adoption. Expected date of adoption by the Group: 1 July 2018 for FY19.
AASB 9 Financial Instruments
AASB 9 addresses the classification, measurement and derecognition of financial assets and financial liabilities, introduces new rules for hedge accounting and a new impairment model for financial assets.
The Group does not believe that there will be a material financial impact to either the statement of profit or loss or the statement of financial position once this accounting standard is adopted. There may be some classification and measurement differences on transition for some financial assets held by the Group from amortised costs to fair value. Whilst our assessment is ongoing, we do not believe there will be material impacts on the basis that for impacted financial assets there is no material difference between fair value and amortised cost.
Mandatory for financial years commencing on or after 1 January 2018, and available for early adoption. Expected date of adoption by the Group: 1 July 2018 for FY19.
AASB 16 Leases
AASB 16 was issued in February 2016. It will result in almost all leases for lessees being recognised on the balance sheet, as the distinction between operating and finance leases is removed. Under the new standard, an asset (the right to use the leased item) and a financial liability to pay rentals are recognised. The only exceptions are short‐term and low‐value leases.
The Group will perform its assessment of
adopting this standard in the coming year.
Mandatory for financial years commencing on or after 1 January 2019, and available for early adoption. Expected date of adoption by the Group: 1 July 2019 for FY20.
For
per
sona
l use
onl
y
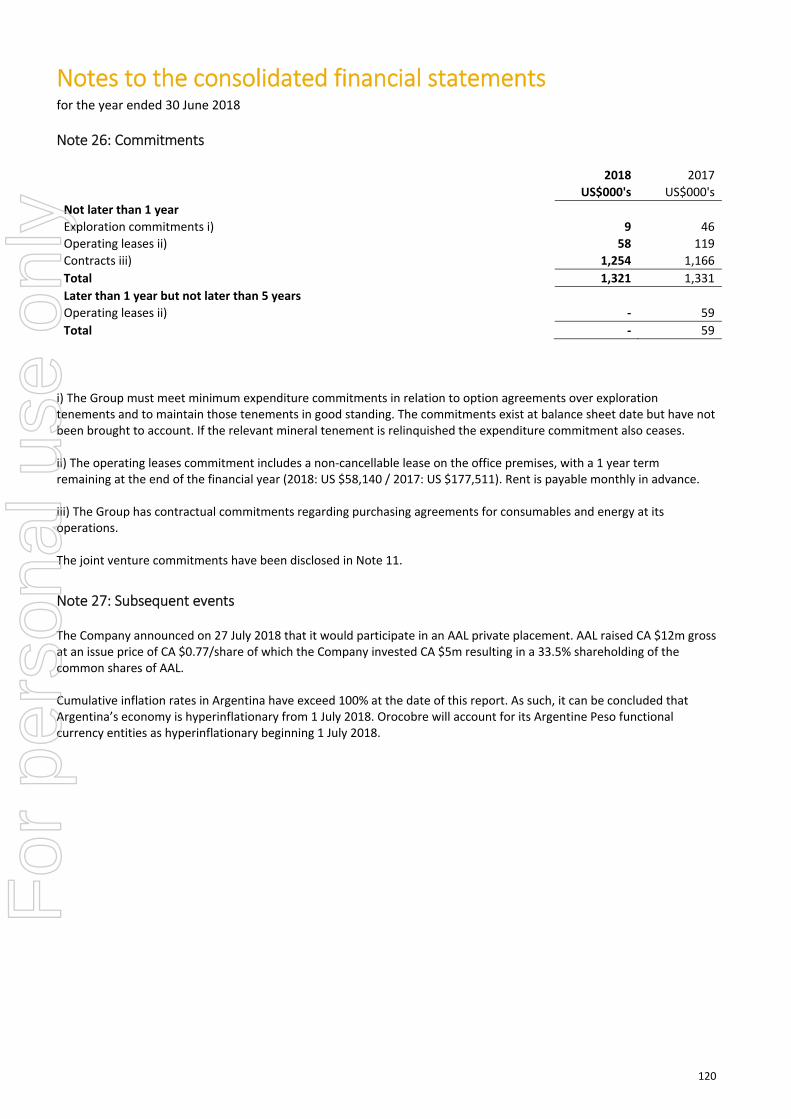
Notes to the consolidated financial statements for the year ended 30 June 2018
120
Note 26: Commitments
2018 2017
US$000's US$000's
Not later than 1 year Exploration commitments i) 9 46
Operating leases ii) 58 119
Contracts iii) 1,254 1,166
Total 1,321 1,331
Later than 1 year but not later than 5 years
Operating leases ii) ‐ 59
Total ‐ 59
i) The Group must meet minimum expenditure commitments in relation to option agreements over exploration tenements and to maintain those tenements in good standing. The commitments exist at balance sheet date but have not been brought to account. If the relevant mineral tenement is relinquished the expenditure commitment also ceases. ii) The operating leases commitment includes a non‐cancellable lease on the office premises, with a 1 year term remaining at the end of the financial year (2018: US $58,140 / 2017: US $177,511). Rent is payable monthly in advance. iii) The Group has contractual commitments regarding purchasing agreements for consumables and energy at its operations. The joint venture commitments have been disclosed in Note 11.
Note 27: Subsequent events The Company announced on 27 July 2018 that it would participate in an AAL private placement. AAL raised CA $12m gross at an issue price of CA $0.77/share of which the Company invested CA $5m resulting in a 33.5% shareholding of the common shares of AAL. Cumulative inflation rates in Argentina have exceed 100% at the date of this report. As such, it can be concluded that Argentina’s economy is hyperinflationary from 1 July 2018. Orocobre will account for its Argentine Peso functional currency entities as hyperinflationary beginning 1 July 2018.
For
per
sona
l use
onl
y

Directors’ Declaration
OROCOBRE ANNUAL REPORT 2018 121
In accordance with a resolution of the directors of Orocobre Limited, I state that:
1. In the opinion of the Directors:
a) the financial statements and notes of Orocobre Limited for the financial year ended 30 June 2018 are in accordance with the Corporations Act 2001, including:
i. giving a true and fair view of the consolidated entity’s financial position as at 30 June 2018 and of its performance for the year ended on that date; and
ii. complying with Accounting Standards and the Corporations Regulations 2001;
b) the financial statements and notes also comply with International Financial Reporting Standards as disclosed in Note 1; and
c) there are reasonable grounds to believe that the Company will be able to pay its debts as and when they become due and payable.
2. This declaration has been made after receiving the declarations required to be made to the directors by the Chief Executive O�cer and Chief Financial O�cer in accordance with section 295A of the Corporations Act 2001 for the financial year ended 30 June 2018.
Robert Hubbard R P SevilleChairman Managing Director
Dated this: 28th day of August 2018
For
per
sona
l use
onl
y

A member firm of Ernst & Young Global LimitedLiability limited by a scheme approved under Professional Standards Legislation
Ernst & Young111 Eagle StreetBrisbane QLD 4000 AustraliaGPO Box 7878 Brisbane QLD 4001
Tel: +61 7 3011 3333Fax: +61 7 3011 3100ey.com/au
Independent auditor's report to the members of Orocobre Limited
Report on the Audit of the Financial Report
Opinion
We have audited the financial report of Orocobre Limited (the Company) and its subsidiaries(collectively the Group), which comprises the consolidated statement of financial position as at 30June 2018, the consolidated statement of profit or loss, consolidated statement of comprehensiveincome, consolidated statement of changes in equity and consolidated statement of cash flows for theyear then ended, notes to the financial statements, including a summary of significant accountingpolicies, and the directors' declaration.
In our opinion, the accompanying financial report of the Group is in accordance with the CorporationsAct 2001, including:
a) giving a true and fair view of the consolidated financial position of the Group as at 30 June 2018and of its consolidated financial performance for the year ended on that date; and
b) complying with Australian Accounting Standards and the Corporations Regulations 2001.
Basis for Opinion
We conducted our audit in accordance with Australian Auditing Standards. Our responsibilities underthose standards are further described in the Auditor’s Responsibilities for the Audit of the FinancialReport section of our report. We are independent of the Group in accordance with the auditorindependence requirements of the Corporations Act 2001 and the ethical requirements of theAccounting Professional and Ethical Standards Board’s APES 110 Code of Ethics for ProfessionalAccountants (the Code) that are relevant to our audit of the financial report in Australia. We have alsofulfilled our other ethical responsibilities in accordance with the Code.
We believe that the audit evidence we have obtained is sufficient and appropriate to provide a basis forour opinion.
Key Audit Matters
Key audit matters are those matters that, in our professional judgment, were of most significance inour audit of the financial report of the current year. These matters were addressed in the context ofour audit of the financial report as a whole, and in forming our opinion thereon, but we do not providea separate opinion on these matters. For each matter below, our description of how our auditaddressed the matter is provided in that context.
We have fulfilled the responsibilities described in the Auditor’s Responsibilities for the Audit of theFinancial Report section of our report, including in relation to these matters. Accordingly, our auditincluded the performance of procedures designed to respond to our assessment of the risks of materialmisstatement of the financial report. The results of our audit procedures, including the proceduresperformed to address the matters below, provide the basis for our audit opinion on the accompanyingfinancial report.
For
per
sona
l use
onl
y

A member firm of Ernst & Young Global Limited Liability limited by a scheme approved under Professional Standards Legislation
A member firm of Ernst & Young Global Limited Liability limited by a scheme approved under Professional Standards Legislation A member firm of Ernst & Young Global Limited Liability limited by a scheme approved under Professional Standards Legislation
Impairment assessment of property, plant and equipment
Why significant How our audit addressed the key audit matter
Australian Accounting Standards, require the Group to assess at each reporting date whether there is any indication that an asset or cash generating unit (“CGU”) may be impaired. If any such indication exists, the recoverable amount of the asset or CGU must be determined. Impairment indicators were present at 30 June 2018 in respect of the Borax Argentina CGU and impairment testing was undertaken. The principal indicators of impairment were lower boron prices, reduction in production levels and other market factors.
The impairment testing process is complex and judgmental and is based on assumptions and estimates that are affected by expected future performance and market conditions.
At 30 June 2018, the consolidated entity has recognised an impairment expense of $8.0 million pertaining to the Borax Argentina CGU. Details of the group’s impairment testing are set out in Note 3 of the financial report.
We evaluated the impairment assessment performed by the Group with reference to forecast financial performance and market conditions.
We evaluated key assumptions including forecast sales revenue, operating and capital expenditure, discount rates, and tested the mathematical accuracy of the valuation model.
We recalculated the recoverable amount and noted that this was below the carrying value.
We recalculated the impairment charge recognised.
We considered other market based data which supported the recoverable amount determined.
We evaluated the adequacy of the Group’s financial report disclosures.
Accounting for investments in joint ventures
Why significant How our audit addressed the key audit matter
The Group has a 72.68% interest in Sales de Jujuy Pte Ltd which in turn owns 91.5% of Sales de Jujuy S.A. who is the owner and operator of the Olaroz lithium project. The Group has determined that the investment is a joint venture and applies the equity method of accounting.
There is inherent risk in applying equity accounting as the accounting policies in the joint venture must be assessed for consistency with the Group’s accounting policies, intercompany balances must be eliminated and foreign currency movements must be appropriately accounted for given the underlying operations are based in Argentina.
Details of the Group’s investment in joint ventures is included in Note 11 of the financial report.
We determined the scope of audit work required to be undertaken by the auditors of the joint venture in Argentina for the purposes of the audit of the Group.
We considered the results of the audit and the conclusions the joint venture auditor reported to us. We reviewed the documentation supporting audit procedures performed in areas we selected as most relevant for the Group audit.
We assessed the accounting policies of the joint venture for consistency with the Group’s policies, and assessed the accounting for transactions between the joint venture and the Group.
We evaluated the gain and equity movements of the joint venture recorded by the Group and the calculation of foreign currency movements.
We evaluated the adequacy of the Group’s disclosures included in the financial report.
For
per
sona
l use
onl
y

A member firm of Ernst & Young Global LimitedLiability limited by a scheme approved under Professional Standards Legislation
Information Other than the Financial Report and Auditor’s Report Thereon
The directors are responsible for the other information. The other information comprises theinformation included in the Company’s 2018 Annual Report, but does not include the financial reportand our auditor’s report thereon.
Our opinion on the financial report does not cover the other information and accordingly we do notexpress any form of assurance conclusion thereon, with the exception of the Remuneration Report andour related assurance opinion.
In connection with our audit of the financial report, our responsibility is to read the other informationand, in doing so, consider whether the other information is materially inconsistent with the financialreport or our knowledge obtained in the audit or otherwise appears to be materially misstated.
If, based on the work we have performed, we conclude that there is a material misstatement of thisother information, we are required to report that fact. We have nothing to report in this regard.
Responsibilities of the Directors for the Financial Report
The directors of the Company are responsible for the preparation of the financial report that gives atrue and fair view in accordance with Australian Accounting Standards and the Corporations Act 2001and for such internal control as the directors determine is necessary to enable the preparation of thefinancial report that gives a true and fair view and is free from material misstatement, whether due tofraud or error.
In preparing the financial report, the directors are responsible for assessing the Group’s ability tocontinue as a going concern, disclosing, as applicable, matters relating to going concern and using thegoing concern basis of accounting unless the directors either intend to liquidate the Group or to ceaseoperations, or have no realistic alternative but to do so.
For
per
sona
l use
onl
y

A member firm of Ernst & Young Global LimitedLiability limited by a scheme approved under Professional Standards Legislation
Auditor's Responsibilities for the Audit of the Financial Report
Our objectives are to obtain reasonable assurance about whether the financial report as a whole is freefrom material misstatement, whether due to fraud or error, and to issue an auditor’s report thatincludes our opinion. Reasonable assurance is a high level of assurance, but is not a guarantee that anaudit conducted in accordance with the Australian Auditing Standards will always detect a materialmisstatement when it exists. Misstatements can arise from fraud or error and are considered materialif, individually or in the aggregate, they could reasonably be expected to influence the economicdecisions of users taken on the basis of this financial report.
As part of an audit in accordance with the Australian Auditing Standards, we exercise professionaljudgment and maintain professional scepticism throughout the audit. We also:
· Identify and assess the risks of material misstatement of the financial report, whether due tofraud or error, design and perform audit procedures responsive to those risks, and obtain auditevidence that is sufficient and appropriate to provide a basis for our opinion. The risk of notdetecting a material misstatement resulting from fraud is higher than for one resulting fromerror, as fraud may involve collusion, forgery, intentional omissions, misrepresentations, or theoverride of internal control.
· Obtain an understanding of internal control relevant to the audit in order to design auditprocedures that are appropriate in the circumstances, but not for the purpose of expressing anopinion on the effectiveness of the Group’s internal control.
· Evaluate the appropriateness of accounting policies used and the reasonableness of accountingestimates and related disclosures made by the directors.
· Conclude on the appropriateness of the directors’ use of the going concern basis of accountingand, based on the audit evidence obtained, whether a material uncertainty exists related toevents or conditions that may cast significant doubt on the Group’s ability to continue as a goingconcern. If we conclude that a material uncertainty exists, we are required to draw attention inour auditor’s report to the related disclosures in the financial report or, if such disclosures areinadequate, to modify our opinion. Our conclusions are based on the audit evidence obtained upto the date of our auditor’s report. However, future events or conditions may cause the Group tocease to continue as a going concern.
· Evaluate the overall presentation, structure and content of the financial report, including thedisclosures, and whether the financial report represents the underlying transactions and eventsin a manner that achieves fair presentation.
· Obtain sufficient appropriate audit evidence regarding the financial information of the entities orbusiness activities within the Group to express an opinion on the financial report. We areresponsible for the direction, supervision and performance of the Group audit. We remain solelyresponsible for our audit opinion.
We communicate with the directors regarding, among other matters, the planned scope and timing ofthe audit and significant audit findings, including any significant deficiencies in internal control that weidentify during our audit.
We also provide the directors with a statement that we have complied with relevant ethicalrequirements regarding independence, and to communicate with them all relationships and othermatters that may reasonably be thought to bear on our independence, and where applicable, relatedsafeguards.
For
per
sona
l use
onl
y
A member firm of Ernst & Young Global LimitedLiability limited by a scheme approved under Professional Standards Legislation
From the matters communicated to the directors, we determine those matters that were of mostsignificance in the audit of the financial report of the current year and are therefore the key auditmatters. We describe these matters in our auditor’s report unless law or regulation precludes publicdisclosure about the matter or when, in extremely rare circumstances, we determine that a mattershould not be communicated in our report because the adverse consequences of doing so wouldreasonably be expected to outweigh the public interest benefits of such communication.
Report on the Audit of the Remuneration Report
Opinion on the Remuneration Report
We have audited the Remuneration Report included in the directors' report for the year ended 30June 2018.
In our opinion, the Remuneration Report of Orocobre Limited for the year ended 30 June 2018,complies with section 300A of the Corporations Act 2001.
Responsibilities
The directors of the Company are responsible for the preparation and presentation of theRemuneration Report in accordance with section 300A of the Corporations Act 2001. Ourresponsibility is to express an opinion on the Remuneration Report, based on our audit conducted inaccordance with Australian Auditing Standards.
Ernst & Young
Kellie McKenziePartnerBrisbane28 August 2018
For
per
sona
l use
onl
y

Additional Information
127
For
per
sona
l use
onl
y

Resources & Reserves
Olaroz Resource Estimate
In 2011, the Company defined a measured and indicated resource of 1,752 million cubic metres of brine at 690 mg/L lithium, 5,730 mg/L potassium and 1,050 mg/L boron at the Olaroz Project, which is equivalent to 6.4 million tonnes of LCE and 19.3 million tonnes
of potash (potassium chloride) based on 5.32 tonnes of lithium carbonate being equivalent to 1 tonne of lithium and 1.91 tonnes of potash being equivalent to one tonne of potassium.
Details of the measured and indicated resources are given in the table below.
Concentration Tonnes of contained metal
Resource category Area (km2)
Thickness (m)
Mean specific yield %
Brine volume
Cubic kmsLithium mg/L
Potassium mg/L
Boron mg/L
Lithium million tonnes
Potassium million tonnes
Boron million tonnes
Measured resource 93 54 8.5% 0.42 632 4,930 927 0.27 2.08 0.39
Indicated resource 93 143 10.0% 1.33 708 6,030 1,100 0.94 8.02 1.46
Measured and indicated resource
93 197 9.6% 1.75 690 5,730 1,050 1.21 10.0 1.85
Olaroz Defined Exploration Target
As part of the bore field development during Stage 1 operations, five production bores have been drilled, or extended, beyond the resource with the deepest being to 450m. All the holes have intersected thick sand sequences beneath the 197m deep resource.
These results are highly significant as this thick sand sequence has been
shown to extend laterally beneath much of the defined brine resource. Sands of this type have free draining porosity of between 20% and 25% based on previous test work and the sand unit could hold significant volumes of lithium-bearing brine which could be added to the resource base by future drilling. In addition, due to the thickness of the sand,
any production bore drilled into this unit will be high yielding compared to bores only in the top 200m.
The exploration target described below is between 1.6 and 7.5 million tonnes of lithium carbonate equivalent, located between 197m and 323m depth, based on the first two deeper production bores.
Area km2
Thickness m (to 323m
depth)
Mean specific yield %
Brine volume million
m3 Li mg/l
Contained Li million
metric tonnes
Lithium carbonate
metric tonnes K mg/l
Contained K million metric tonnes
Potash million metric tonnes B mg/l
Boron million metric tonnes
Upper Assumption Estimate
80 126 20% 2,000 700 1.4 7.5 5400 10.9 20.8 1,200 2.4
Lower Assumption Estimate
80 126 6% 605 500 0.3 1.6 4000 2.4 4.6 900 0.5
Additional exploration targets have been identified to the north and the south of the defined target area.
OROCOBRE ANNUAL REPORT 2018 128
For
per
sona
l use
onl
y

It must be stressed that an Exploration Target is not a Mineral Resource. The potential quantity and grade of the Exploration Target is conceptual in nature, and there has been insufficient exploration to define a Mineral Resource in the volume where the Exploration Target is outlined. It is uncertain if further exploration drilling will result in the determination of a Mineral Resource in this volume. Re-interpretation of the geophysical surveys has indicated the Olaroz Salar may be over 600m deep with potential for further Exploration Targets to be developed beneath the current 323m.
Deeper drilling will be undertaken during the Stage 2 development to further evaluate the exploration target and to assist longer term development planning.
Cauchari Project (Orocobre 25%: AAL 75% & Operator)
Based on the results of the 2017/2018 drilling programme, the resource at Cauchari has been increased. Independent consultants FloSolutions S.A.C. advised there is now an Inferred Resource of 1,200 million cubic metres of brine at 450 mg/l lithium and 4,028 mg/l potassium. This is equivalent to 3.0 Mt LCE (based on 5.32 tonnes of lithium carbonate is equivalent to 1 tonne of lithium) and 9.5 Mt of potassium chloride (based on 1 tonne potassium chloride is equivalent to 1.91 tonnes of potassium). The resource estimate includes both the NW and SE Sectors. This is an expansion of six times the previous estimate of 0.47 Mt of Lithium Carbonate Equivalent. The average grade of the entire resource has increased to 450 mg/l Li and 4,028 mg/l K. Locally higher grades were encountered in the NW Sector in areas such as production hole CAU07 (601 mg/l during 48 hour pumping
test) and in the Deep Sand unit in CAU11 (515 mg/l during 48 hour pumping test). The results of the estimation are summarized in Table 1 below.
The brine resource is calculated over the NW and SE Sectors of the Cauchari project and covers an area of 92.6 km2. The brine resource in the NW Sector extends from the brine level below the Archibarca fan to a depth of up to 300 m. The brine resources in the SE Sector extend from the phreatic brine level to a constant depth of 300 m and continue locally as a separate resource volume in the Deep Sand unit between approximately 400 m and 480 m depth (as defined by Deep Sand drilling intercepts in holes CAU11, CAU12 and CAU13). None of the boreholes completed to date have intercepted bedrock (basement) and the resource remains open at depth. A significant exploration target has been defined below the current inferred resources as further discussed below (Table 3).
Table 1: Cauchari Project Lithium and Potassium Resource Estimate; May 22, 2018
Inferred Resources (lithium cut-off concentration: 300 mg/l)
Parameter NW Sector SE Sector Total
Resource area (km2) 35.2 57.4 92.6
Aquifer volume (km3) 6.5 13.9 20.4
Mean specific yield (Sy) 9% 4% 6%
Element Li K Li K Li K
Mean concentration (mg/l) 465 3,920 443 4,078 450 4,028
Mean grade (g/m3) 44 373 20 184 28 244
Total Resource (tonnes) 288,000 2,420,000 280,000 2,560,000 568,000 4,980,000
Lithium Carbonate (tonnes) 1,530,000 1,490,000 3,020,000
Potash (tonnes) 4,600,000 4,900,000 9,500,000
1. JORC definitions were followed for mineral resources. 2. The Competent Person for this Mineral Resource estimate is Frits Reidel, CPG. 3. A lithium cut-off concentration of 300 mg/L has been applied to the resource estimate. 4. Lithium is converted to lithium carbonate (Li2CO3) with a conversion factor of 5.32. 5. Potassium is converted to potash with a conversion factor of 1.91 6. Numbers may not add due to rounding.
129
For
per
sona
l use
onl
y

Results of the brine chemistry analysis carried out to date indicate that the Cauchari brine is similar in composition to the brine in the adjacent Olaroz Salar from which Orocobre is successfully producing lithium carbonate using conventional lithium processing technology. Table 2 provides a summary of the Cauchari brine characteristics. The lower average lithium concentration of the total inferred resource compared to that of drill holes such as CAU07, CAU11 (and other results released during the Phase II drilling program) reflects the presence of lower
concentration brine near surface in the SE Sector such as around holes CAU12, 13 and 14. The brine characteristics and hydraulic characteristics in the upper SE Sector are distinct from those in the NW Sector and the Deep Sand unit. Pumping tests from the NW Sector and Deep Sand have produced excellent flows with lithium concentration >500 mg/l lithium, as reported by the company on the 7th of February and 6th of March 2018. There is a reasonable prospect that the Cauchari brine from these areas could be successfully processed using
similar technology to the Olaroz plant.
Table 2: Cauchari brine chemistry characteristics
Samples Ratio NW Sector & Deep Sand Upper SE Sector
Mg/Li 2.7 2.5
SO4/Li 29.4 69.6
Resource Estimation Methodology
The updated lithium resource estimate for the Cauchari Project is based on the results of seven diamond holes and five rotary holes drilled during the Phase II campaign in 2017/2018 and results of four diamond drill holes of the Phase I campaign in 2011. Figure 1 shows a location map of the boreholes completed during the 2011 and 2017/2018 drilling campaigns. Brine sample collection during the 2017/2018 program consisted of bailed and packer samples in the diamond holes,
and packer and pumped samples in the rotary holes. A total of 449 brine samples (including 164 QA/QC samples) were analyzed by Norlabs (Jujuy, Argentina) as the primary laboratory and by Alex Steward Assayers (Mendoza, Argentina) and the University of Antofagasta (Chile) as secondary QA/QC laboratories. Additional brine QA/QC analyses were carried out on centrifuged samples collected by Corelabs in Houston, TX.
OROCOBRE ANNUAL REPORT 2018 130
For
per
sona
l use
onl
y

Figure 1 – Cauchari 2018 Resource Outlines – Phase II & Historical Drill Holes (June 27, 2018)
HQ core was retrieved during the diamond core drilling from which some 172 primary undisturbed samples were prepared for laboratory drainable porosity and other physical parameter determinations by Geo Systems Analysis (GSA) in Tucson, AZ. Laboratory QA/QC porosity analyses are being undertaken by Corelabs.
The lithium resource was estimated using SGEMs software with ordinary kriging and applying a 300 mg/l lithium concentration cut-off. The resource estimate was prepared in accordance with the guidelines of National Instrument 43-101 and uses best practice methods specific to brine resources, including a reliance on core
drilling and sampling methods that yield depth-specific chemistry and drainable porosity measurements. The resource estimation was completed by independent qualified person Mr. Frits Reidel of Santiago based hydrogeology firm FloSolutions with extensive experience in the estimation of lithium brine resources in Argentina.
OlarozLithiumFacility
Orocobre Olaroz Property
Argentina
5KM
LAC Resource
SE Resource1,490,000 tonnes LCE57.4km2
CAU07-07M
CAU16
CAU21D
CAU07-07M
CAU18CAU20D
CAU17
CAU09
CAU13 CAU14
CAU26D
CAU22D
CAU25D
CAU27D
CAU11-11MCAU15
CAU23D
CAU24D
CAU19DCAU06-06M
CAU08
CAU10
CAU12
Olaroz Plant
SAS 2011 Drill Holes
2018 Drill Program
Phase 3 Drill Targets
2017 DDH Program
2017 Rotary Holes
Cauchari JV Property
Ganfeng/LAC Property
LEGEND
SECTION LINE
NW Resource 1,530,000 tonnes LCE35.2km2
Total Resource 3,020,000 tonnes LCE
NW
SE
131
For
per
sona
l use
onl
y
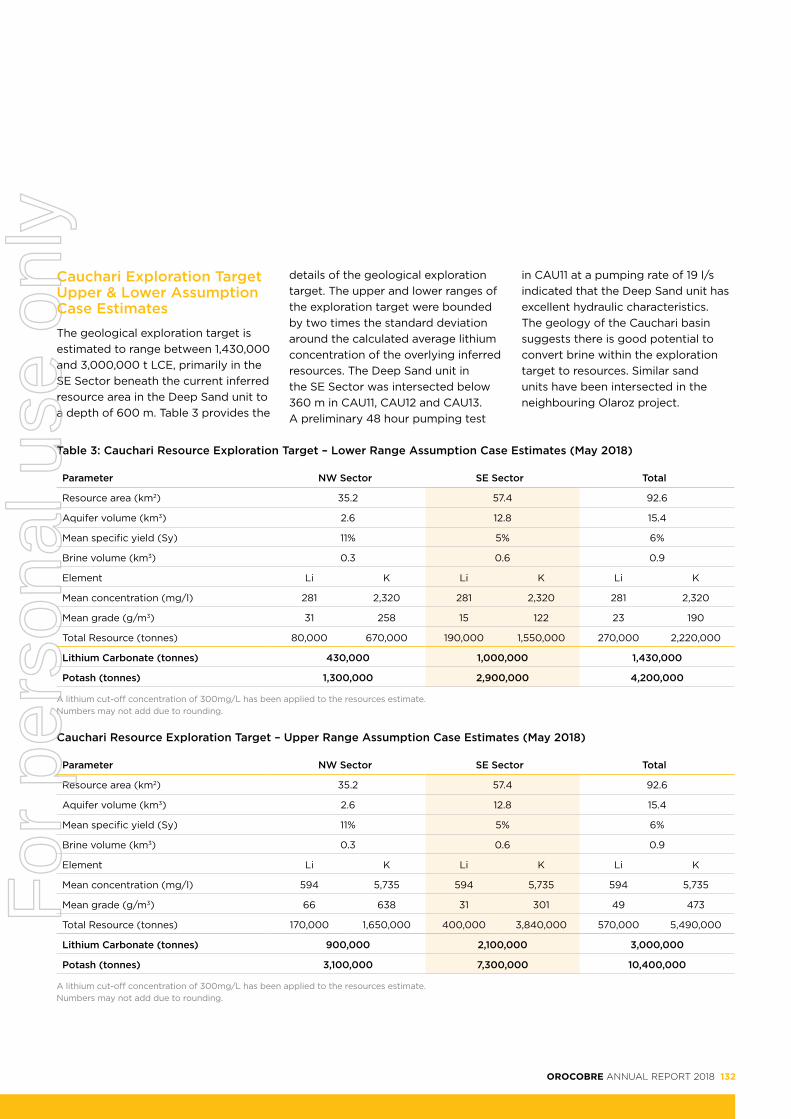
Cauchari Exploration Target Upper & Lower Assumption Case Estimates
The geological exploration target is estimated to range between 1,430,000 and 3,000,000 t LCE, primarily in the SE Sector beneath the current inferred resource area in the Deep Sand unit to a depth of 600 m. Table 3 provides the
details of the geological exploration target. The upper and lower ranges of the exploration target were bounded by two times the standard deviation around the calculated average lithium concentration of the overlying inferred resources. The Deep Sand unit in the SE Sector was intersected below 360 m in CAU11, CAU12 and CAU13. A preliminary 48 hour pumping test
in CAU11 at a pumping rate of 19 l/s indicated that the Deep Sand unit has excellent hydraulic characteristics. The geology of the Cauchari basin suggests there is good potential to convert brine within the exploration target to resources. Similar sand units have been intersected in the neighbouring Olaroz project.
Table 3: Cauchari Resource Exploration Target – Lower Range Assumption Case Estimates (May 2018)
Parameter NW Sector SE Sector Total
Resource area (km2) 35.2 57.4 92.6
Aquifer volume (km3) 2.6 12.8 15.4
Mean specific yield (Sy) 11% 5% 6%
Brine volume (km3) 0.3 0.6 0.9
Element Li K Li K Li K
Mean concentration (mg/l) 281 2,320 281 2,320 281 2,320
Mean grade (g/m3) 31 258 15 122 23 190
Total Resource (tonnes) 80,000 670,000 190,000 1,550,000 270,000 2,220,000
Lithium Carbonate (tonnes) 430,000 1,000,000 1,430,000
Potash (tonnes) 1,300,000 2,900,000 4,200,000
A lithium cut-off concentration of 300mg/L has been applied to the resources estimate. Numbers may not add due to rounding.
Cauchari Resource Exploration Target – Upper Range Assumption Case Estimates (May 2018)
Parameter NW Sector SE Sector Total
Resource area (km2) 35.2 57.4 92.6
Aquifer volume (km3) 2.6 12.8 15.4
Mean specific yield (Sy) 11% 5% 6%
Brine volume (km3) 0.3 0.6 0.9
Element Li K Li K Li K
Mean concentration (mg/l) 594 5,735 594 5,735 594 5,735
Mean grade (g/m3) 66 638 31 301 49 473
Total Resource (tonnes) 170,000 1,650,000 400,000 3,840,000 570,000 5,490,000
Lithium Carbonate (tonnes) 900,000 2,100,000 3,000,000
Potash (tonnes) 3,100,000 7,300,000 10,400,000
A lithium cut-off concentration of 300mg/L has been applied to the resources estimate. Numbers may not add due to rounding.
OROCOBRE ANNUAL REPORT 2018 132
For
per
sona
l use
onl
y

The potential quantity and grade of the exploration target is conceptual in nature, and there has been insufficient exploration to define a Mineral Resource in the volume where the Exploration Target is outlined. It is uncertain if further exploration drilling will result in the determination
of a Mineral Resource in this volume. The exploration target is where, based on the available geological evidence, there is the possibility of defining a mineral resource. Importantly the exploration target is not to be considered a resource or reserve. It must be stressed the
exploration target is based on a series of assumptions and future drilling is required to determine the brine grade and formation drainable porosity values to establish whether a resource can be defined.
Table 4: Cauchari Project – Drillhole Locations
Exploration Hole Number Sector
Total Depth
(m)
Depth Installed Well (m)
Assay Interval
(m)
Lithium (mg/l avg)
Potassium (mg/l avg)
Drilling Method
Coordinates Gauss Kruger Argentine*
Zone3 Posgar
Elevation Mean Sea Level (m)+ Azimuth Dip
Easting Northing
CAU07 NW 343.00 329 135-343 601 4,853 Rotary 3421200 7383987 3964 0 -90
CAU08 SE 400.00 400 50-400 517 5,319 Rotary 3423938 7374503 3941 0 -90
CAU09 SE 400.00 400 60-400 662 6,137 Rotary 3423778 7377785 3940 0 -90
CAU10 SE 429.00 340 50-340 682 6,516 Rotary 3425532 7379306 3940 0 -90
CAU11 SE 480.00 478 50-476 515 4,577 Rotary 3421752 7372571 3941 0 -90
CAU12 SE 413.00 207 25-169 305 3,048 Diamond 3421708 7374690 3941 0 -90
CAU13 SE 449.00 252 39-281 435 4,088 Diamond 3422774 7376298 3940 0 -90
CAU14 SE 598.00 455 tbc tbc tbc Diamond 3425670 7377021 3942 0 -90
CAU15 NW 240.50 210 102-234.5 407 3196 Diamond 3419292 7373396 3941 0 -90
CAU16 NW 321.50 255 14-298 436 3608 Diamond 3419925 7379892 3941 0 -90
CAU17 NW 237.50 238 178-203 571 4,488 Diamond 3419965 7387431 3991 0 -90
CAU18 NW 359.00 359 165-320 476 3,775 Diamond 3422571 7386977 3964 0 -90
* Gauss Kruger Zone 3, using the POSGAR Datum. Locations confirmed by surveyor.
Phase III Drilling & Further Resource Expansion
The Phase III resource definition drilling program is currently underway at the Cauchari project site. The Phase III program will include additional diamond holes in the NW and SE Sectors to upgrade the resource classification by Q2 CY19 to support
the Project’s Definitive Feasibility Study. The Phase III drilling program is designed to provide a combined borehole density sufficient to upgrade the current inferred resources to the Indicated and Measured categories. The Phase III drilling is also aimed at further defining resources in the Deep Sand unit.
133
For
per
sona
l use
onl
y

Borax Argentina S.A.
JORC Compliance Program
Following the upgrading of the Porvenir historical estimate to a JORC compliant Measured and Indicated resource in 2014, the Tincalayu resource upgrade was completed in FY15.
Resources
Porvenir Resource Estimate Summary
A measured and indicated resource of 2.3 million tonnes at 20.4% B2O3 is estimated at the current 16% mining cut- off grade. The resource extends to a maximum depth of 2.9m and
is easily exploited by low cost strip mining. A measured and indicated resource of 6.9 million tonnes of 14.9% B2O3 is estimated at a 9% B2O3 mining cut-off grade.
The resource estimate was prepared by Murray Brooker, an independent consultant employed by Hydrominex Geoscience Pty Ltd. Murray Brooker is a geologist and hydrogeologist and is a Member of the Australian Institute of Geoscientists. Murray has sufficient relevant experience to qualify as a competent person as defined in the 2012 edition of the Australasian Code for Reporting of Exploration Results, Mineral Resources and Ore Reserves. He is also a “Qualified Person” as defined by Canadian Securities Administrators’ National Instrument 43-101. The information is extracted from the report entitled
Amended Announcement to Porvenir Historical Estimate Upgraded to JORC Compliant Resource, 29 April, 2014 and is available to view on the Company website www.orocobre.com.
The Company is not aware of any information or data that materially affects the information included in the original market announcement and that all material assumptions
and technical parameters underpinning the estimates in the relevant market announcement continue to apply and have not materially changed. The company confirms that the form and context in which the Competent Person’s findings are presented have not been materially modified from the original market announcement. A previous announcement was made on the 21/08/12 regarding the superseded historical resource at Porvenir, which is the subject of re-estimation. The company is not in possession of any new information or data relating to historical estimates that materially impacts on the reliability of the estimates or the company’s ability to verify the historical estimates as mineral resources, in accordance with the JORC Code. The supporting information provided in the initial market announcement of 21/08/12 continues to apply and has not materially changed.
Classification Cut-Off Grade Tonnes Grade% B203 Tonnes B203
Measured 9% 4,907,877 14.5 710,672
Indicated 9% 1,942,433 16.0 310,517
Measured & Indicated 9% 6,850,000 14.9 1,020,000
Classification Cut-Off Grade Tonnes Grade% B203 Tonnes B203
Measured 16% 1,474,341 20.0 295,117
Indicated 16% 804,595 21.0 168,776
Measured & Indicated* 16% 2,278,937 20.4 463,992
OROCOBRE ANNUAL REPORT 2018 134
For
per
sona
l use
onl
y

Tincalayu Resource Estimate Summary
An Indicated and Inferred resource of 6.5 million tonnes at 13.9% B2O3 at a marginal cut-off of 5.6% B2O3, which increases to 17.8 million tons of 11.0% B2O3, at a marginal cut-off grade of 2.8 % B2O3.
The resource estimate was prepared by Murray Brooker, an independent consultant employed by Hydrominex Geoscience Pty Ltd. Murray Brooker is a geologist and hydrogeologist and is a Member of the Australian Institute of Geoscientists. Murray has sufficient relevant experience to qualify as a competent person as defined in the 2012 edition of the Australasian Code for Reporting of Exploration Results,
Mineral Resources and Ore Reserves. He is also a “Qualified Person” as defined by Canadian Securities Administrators’ National Instrument 43-101. The information is extracted from the report entitled Tincalayu Historical Estimate Upgraded to JORC Compliant Resource, 18 November 2014 and is available to view on the Company website www.orocobre.com.
The Company is not aware of any information or data that materially affects the information included in the original market announcement and that all material assumptions and technical parameters underpinning the estimates in the relevant market announcement continue to apply and have not materially changed.
The company confirms that the form and context in which the Competent Person’s findings are presented have not been materially modified from the original market announcement.
A previous announcement was made on the 21/08/12 regarding the superseded historical resource at Tincalayu, which is the subject of re-estimation. The company is not in possession of any new information or data relating to historical estimates that materially impacts on the reliability of the estimates or the company’s ability to verify the historical estimates as mineral resources, in accordance with the JORC Code. The supporting information provided in the initial market announcement of 21/08/12 continues to apply and has not materially changed.
Current Production 30 Ktpa Expanded Production 100 Ktpa
Cut-Off Tonnes (Mt) Soluble B203 (%) Cut-Off Tonnes (Mt) Soluble B203 (%)
Global Resource (Not Limited to a Pit Shell) – with Marginal Cut-Off
Indicated 5.6 6.9 13.9 2.8 6.9 13.8
Inferred 5.6 9.9 10.2 2.8 13.8 8.5
Indicated + Inferred 5.6 16.8 11.7 2.8 20.7 10.3
Maximum DCF In-Pit Resource – with Marginal Cut-Off
Indicated 5.6 5.1 14.7 2.8 6.8 13.8
Inferred 5.6 1.4 11.0 2.8 11.0 9.3
Indicated + Inferred 5.6 6.5 13.9 2.8 17.8 11.0
135
For
per
sona
l use
onl
y

Historical Borax Argentina S.A. Resources
Mine/Project Material Historical Estimate Tonnes Grade % B203 Tonnes B203
Current Soft Rock Mines
Sijes – Hydroboracite Hidroboracite Measured 3,099,998 22.8 706,800
Sijes – Colemanite Colemanite Inferred 200,000 20.0 40,000
Total and Average 3,299,998 22.6 746,800
Undeveloped Ulexite Deposits in Salt Lake Sediments
Ratones Ulexite Indicated 364,663 18.0 65,639
Footnotes: The historical estimates are in equivalent categories to those used by the JORC and CIM reporting codes. However, these estimates did not satisfy either current JORC or CIM/NI 43-101 requirements for the reporting of resources and were considered to be historical resources (see Orocobre ASX/TSX announcement August, 2012).
A qualified person did not do sufficient work to classify the historical estimates as current mineral resources or mineral reserves, and the Company did not treat the historical estimates as current mineral resources or mineral reserves. It is uncertain whether following evaluation and/or further exploration any of the historical estimates will ever be able to be reported as current estimates in accordance with the JORC code or NI 43-101.
There is no new information that impacts on these historical estimates. Note that material mined in 2012-2014 is not accounted for as depletion in the figures above, with approximately 35,000 tonnes at Sijes the estimated annual production of mineralised material at the time this information was originally released in 2012.
Relevant reports from which the above summary of historical estimates is drawn include the following:
Sijes
• July 1998; Borax Argentina S.A.; Environmental and Operational Studies, Phase 1, Initial Geotechnical Appraisal; Knight Piesold Limited, England. Includes a Historical estimates Chapter;
• July 1998; Borax Argentina S.A.; Environmental and operational Studies, Phase 2; Geotechnical Appraisal; Knight Piesold Limited, England;
• May 1999; Borax Argentina S.A.; Hidroboracite Project, Raul Gutierrez Solis; August 1999, Borax Argentina S.A.; Sijes, Monte Amarillo 2 Mine.
• Historical Estimation, Mine Design & Planning Report. Knight Piesold Limited, England.
Ratones
• The project was acquired by Borax circa 1987. The previous owners had conducted an estimate of contained mineralised material. This has not been validated by Borax, who consider the status of this material to be of the indicated category.
OROCOBRE ANNUAL REPORT 2018 136
For
per
sona
l use
onl
y

Properties
Borax also owns the tenure on all or parts of the lithium projects being progressed by other lithium exploration companies, including Lithium Americas Corporation Ltd. (TSX:LAC) at Salar de Cauchari,
Nextview New Energy Lion Hong Kong Ltd at Diablillos, and Galaxy Resources Ltd (ASX:GXY) at Sal de Vida. As one of the conditions to extract brines, these companies are required to make payments to Borax
either as fixed annual payments or a royalty related to production. The terms of these agreements are detailed below.
CompanyProject
Affected
Area of Properties (hectares)
Date of Contract
Type of Contract*
Remaining Payments
Royalty Payable on Brine
ExtractionPeriod of Usufruct Comments
Lithium Americas Corporation / Ganfeng
Cauchari 4,130 19-May-11 Usufruct $5,400,000 None 18-May-41 $200,000 per annum payable until 18 May 2041 irrespective of
production.
Nextview New Energy Lion Hong Kong Ltd *
Diablillos 698.35 14-Jan-10 Royalty N/A 1.0% NSR Revenue Based
Royalty
–
Nextview New Energy Lion Hong Kong Ltd *
Centenario and
Ratones
630 14-Jan-10 Royalty N/A 1.0% Indefinite –
Nextview New Energy Lion Hong Kong Ltd *
Los Ratones
600 14-Jan-10 Royalty N/A 1.0% Indefinite –
Lithea Inc. Pozuelos 2,488 14-Jan-10 Purchase N/A 1.0% Indefinite Royalty can be purchased by Lithea
for $1,000,000. Borax Argentina S.A. has the right to mine
borates.
Advantage Lithium
Cauchari 27,771 24-Nov-16 Royalty N/A 1.0% Gross Royalty on Production
LSC Lithium Salinas Grandes
32,727 6-Jun-17 Royalty N/A 2.0% Mine Mouth Royalty
*Usufruct – legal right afforded to a person or party that confers the temporary right to use and derive income or benefit from someone else’s property.
137
For
per
sona
l use
onl
y
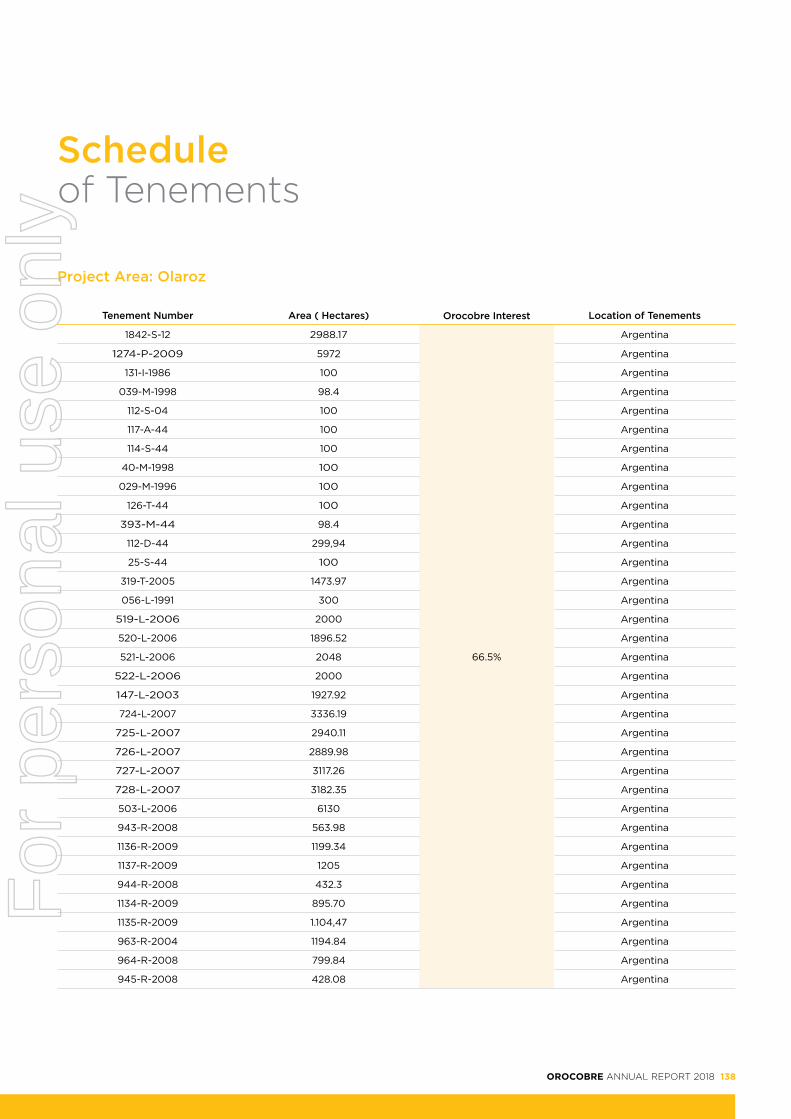
Schedule of Tenements
Project Area: Olaroz
Tenement Number Area ( Hectares) Orocobre Interest Location of Tenements
1842-S-12 2988.17
66.5%
Argentina
1274-P-2009 5972 Argentina
131-I-1986 100 Argentina
039-M-1998 98.4 Argentina
112-S-04 100 Argentina
117-A-44 100 Argentina
114-S-44 100 Argentina
40-M-1998 100 Argentina
029-M-1996 100 Argentina
126-T-44 100 Argentina
393-M-44 98.4 Argentina
112-D-44 299,94 Argentina
25-S-44 100 Argentina
319-T-2005 1473.97 Argentina
056-L-1991 300 Argentina
519-L-2006 2000 Argentina
520-L-2006 1896.52 Argentina
521-L-2006 2048 Argentina
522-L-2006 2000 Argentina
147-L-2003 1927.92 Argentina
724-L-2007 3336.19 Argentina
725-L-2007 2940.11 Argentina
726-L-2007 2889.98 Argentina
727-L-2007 3117.26 Argentina
728-L-2007 3182.35 Argentina
503-L-2006 6130 Argentina
943-R-2008 563.98 Argentina
1136-R-2009 1199.34 Argentina
1137-R-2009 1205 Argentina
944-R-2008 432.3 Argentina
1134-R-2009 895.70 Argentina
1135-R-2009 1.104,47 Argentina
963-R-2004 1194.84 Argentina
964-R-2008 799.84 Argentina
945-R-2008 428.08 Argentina
OROCOBRE ANNUAL REPORT 2018 138
For
per
sona
l use
onl
y

Project Area: Cauchari
Tenement Number Area ( Hectares) Orocobre Interest Location of Tenements
2055-R-2014 495.4
South American Salars S.A. (SASSA) is the holder of all Cauchari tenements.
Pursuant to the terms of the Cauchari Joint Venture SASSA
is owned as to 75% by Advantage Lithium Corporation
and as to 25% by La Frontera S.A.
Orocobre holds 85% of La Frontera SA
Argentina
2054-R-2014 444.26 Argentina
2059-R-2014 885.10 Argentina
2058-R-2014 1770.01 Argentina
2053-R-2014 1997.09 Argentina
1155-P-2009 1500 Argentina
968 R 2008 703.34 Argentina
1081 P 2008 1995 Argentina
1.119-P-2009 2493.07 Argentina
1082 P 2008 1468 Argentina
1101 P 2008 2483.9 Argentina
966 R 2008 117.37 Argentina
965 R 2008 1345 Argentina
951-R-2008 795 Argentina
1083 P 2008 1445.68 Argentina
1.118-P-2009 2395.70 Argentina
1130-P-2009 1239.96 Argentina
952-R-2008 487.58 Argentina
1084 P 2008 1526.78 Argentina
1156-P-2009 66.17 Argentina
1086 P 2008 1716.63 Argentina
1085 P 2008 1197.90 Argentina
139
For
per
sona
l use
onl
y

Project Area: Salinas Grandes
Tenement Number Area ( Hectares) Orocobre Interest Location of Tenements
184-Z-1996 300
LSC Lithium Inc owns the Salina Grandes Project properties.
La Frontera Minerals S.A. (Orocobre 85%) holds a 2%
Mine Mouth Royalty over production from Salinas Grandes
Argentina
817-I-2007 1142.55 Argentina
604-T-2006 1162,89 Argentina
788-M-2007 1162 Argentina
183-Z-2004 494 Argentina
184-D-1990 100 Argentina
19391 2411.97 Argentina
18199 500 Argentina
67 100 Argentina
18834 495.82 Argentina
17734 200 Argentina
60 100 Argentina
1104 100 Argentina
13699 100 Argentina
18808 100 Argentina
266 100 Argentina
18183 2778 Argentina
12790 100 Argentina
19891 100 Argentina
62 100 Argentina
17681 400 Argentina
8170 300 Argentina
18481 97.04 Argentina
1112 100 Argentina
13487 100 Argentina
14329 100 Argentina
57 100 Argentina
68 100 Argentina
17538 95.43 Argentina
14589 100 Argentina
18924 300 Argentina
18925 99.94 Argentina
19206 869 Argentina
OROCOBRE ANNUAL REPORT 2018 140
For
per
sona
l use
onl
y

Project Area: Salinas Grandes (continued)
Tenement Number Area ( Hectares) Orocobre Interest Location of Tenements
11577 100
LSC Lithium Inc owns the Salina Grandes Project properties.
La Frontera Minerals S.A. has a 2% Mine Mouth Royalty
Argentina
11578 100 Argentina
11579 100 Argentina
11580 100 Argentina
1111 100 Argentina
18833 270 Argentina
17321 186 Argentina
53 100 Argentina
19742 2490.07 Argentina
19744 2499.97 Argentina
19766 1000 Argentina
48 100 Argentina
203 100 Argentina
204 100 Argentina
54 100 Argentina
63 100 Argentina
50 100 Argentina
1105 100 Argentina
65 100 Argentina
70 100 Argentina
206 100 Argentina
86 300 Argentina
17744 500 Argentina
18533 97.03 Argentina
17580 100 Argentina
141
For
per
sona
l use
onl
y

Project Area: Tincalayu
Tenement Number Area ( Hectares) Orocobre Interest Location of Tenements
1271 300
100% (Borax Argentina S.A.)
Galaxy Lithium SA holds an usufruct to extract brines from
1215, 5596, 13848, and 17335
Argentina
1215 300 Argentina
1495 200 Argentina
7772 471 Argentina
5596 300 Argentina
5435 300 Argentina
8529 900 Argentina
13572 647 Argentina
13848 (Diana) 100 Argentina
17335 (Valerio) 274,32 Argentina
Project Area: Sijes
Tenement Number Area ( Hectares) Orocobre Interest Location of Tenements
8587 799
100% (Borax Argentina S.A.)
Argentina
11800 488 Argentina
11801 400 Argentina
11802 3399 Argentina
14121 10 Argentina
5786 200 Argentina
OROCOBRE ANNUAL REPORT 2018 142
For
per
sona
l use
onl
y

Project Area: Cauchari (Exar)
Tenement Number Area ( Hectares) Orocobre Interest Location of Tenements
394 300
100% Borax Argentina S.A.
Exar SA holds a usufruct over all tenements for
the extraction of brines
Argentina
336 100 Argentina
347 100 Argentina
354 160 Argentina
340 100 Argentina
444 100 Argentina
353 300 Argentina
350 100 Argentina
89 100 Argentina
345 100 Argentina
344 100 Argentina
343 100 Argentina
352 100 Argentina
351 100 Argentina
365 100 Argentina
122 100 Argentina
221 100 Argentina
190 100 Argentina
116 100 Argentina
117 300 Argentina
389 100 Argentina
306 24 Argentina
402 119 Argentina
195 100 Argentina
220 100 Argentina
259 100 Argentina
43 100 Argentina
341 100 Argentina
42 100 Argentina
438 100 Argentina
160 100 Argentina
378 100 Argentina
339-C 100 Argentina
377-C 100 Argentina
191-R 100 Argentina
143
For
per
sona
l use
onl
y

Project Area: Diablillos
Tenement Number Area ( Hectares) Orocobre Interest Location of Tenements
1175 100
100% Potasio y Litio de Argentina S.A. (PLASA) is the holder of all
Diablillos tenure.
Borax holds an usufruct for the extraction of borates
from the Diablillos tenements
Orocobre Lithium S.A. (Orocobre 100%) holds a 1% net revenue royalty overall
production by PLASA from the tenements.
Argentina
1176 100 Argentina
1164 100 Argentina
1172 100 Argentina
1165 100 Argentina
1166 100 Argentina
1179 100 Argentina
1180 200 Argentina
1182 100 Argentina
1195 100 Argentina
1206 100 Argentina
1168 100 Argentina
1163 100 Argentina
1167 100 Argentina
1170 100 Argentina
1174 100 Argentina
1171 100 Argentina
7021 100 Argentina
1181 100 Argentina
12653 200 Argentina
1173 100 Argentina
1169 100 Argentina
1178 100 Argentina
12652 200 Argentina
OROCOBRE ANNUAL REPORT 2018 144
For
per
sona
l use
onl
y

Shareholder & ASX Information
The following additional information is required by the Australian Securities Exchange Limited (ASX) and is not disclosed elsewhere in this report.
145
For
per
sona
l use
onl
y

The following information is provided as at 31 July 2018.
Distribution of Shareholders
Range of Units Snapshot Fully Paid Ordinary Shares (Total) as of 31 Jul 2018 | Composition: CA, ORD
Range Total Holders Units % of Issued Capital
1 – 100 594 27,066 0.01
101 – 1,000 3,214 1,785,841 0.68
1,001 – 10,000 4,958 17,307,510 6.64
10,001 – 100,000 859 20,987,621 8.05
100,001 – 500,000 66 13,722,289 5.26
500,001 – 1,000,000 8 6,311,522 2.42
1,000,001 – 9,999,999,999 18 200,568,867 76.93
Rounding 0.01
Total 9,717 260,710,716 100.00
Unmarketable Parcels
Minimum Parcel Size Holders Units
Minimum $500.00 parcel at $4.62 per unit 109 631 30923
Shareholder Information
OROCOBRE ANNUAL REPORT 2018 146
For
per
sona
l use
onl
y

The following table details the 20 largest individual shareholder accounts as of 15 August 2018.
20 Largest Holder Accounts – Ordinary Shares
Top Holders Snapshot – Ungrouped Fully Paid Ordinary Shares (Total) as of 15 Aug 2018 | Composition: CA, ORD
Rank Name Units % of Units
1. J P MORGAN NOMINEES AUSTRALIA LIMITED 53,994,709 20.71
2. HSBC CUSTODY NOMINEES (AUSTRALIA) LIMITED 44,355,408 17.01
3. TOYOTA TSUSHO CORPORATION 39,106,607 15.00
4. CITICORP NOMINEES PTY LIMITED 12,215,768 4.69
5. CANADIAN REGISTER CONTROL 10,469,473 4.02
6. NATIONAL NOMINEES LIMITED 6,005,191 2.30
7. RICHARD SEVILLE & ASSOCIATES PTY LTD <THE SEVILLE SUPER FUND A/C> 4,997,000 1.92
8. LITHIUM INVESTORS LLC 4,555,772 1.75
9. BNP PARIBAS NOMS PTY LTD <DRP> 3,421,435 1.31
10. MR DENIS GRENVILLE HINTON + MRS ROSLYN SUSANNA HINTON 3,042,281 1.17
11. BNP PARIBAS NOMS (NZ) LTD <DRP> 2,700,884 1.04
12. MERRILL LYNCH (AUSTRALIA) NOMINEES PTY LIMITED 2,435,017 0.93
13. HSBC CUSTODY NOMINEES (AUSTRALIA) LIMITED - A/C 2 2,223,772 0.85
14. BNP PARIBAS NOMINEES PTY LTD <IB AU NOMS RETAILCLIENT DRP> 1,864,892 0.72
15. WARBONT NOMINEES PTY LTD <UNPAID ENTREPOT A/C> 1,826,643 0.70
16. FAIRGROUND PTY LTD 1,677,227 0.64
17. BNP PARIBAS NOMINEES PTY LTD <AGENCY LENDING DRP A/C> 1,618,271 0.62
18.MR ROBERT BRUCE WOODLAND + MRS ERIKA WOODLAND <R WOODLAND EXHIBIT S/F A/C>
1,562,000 0.60
19. AUST EXECUTOR TRUSTEES LTD <CHARITABLE FOUNDATION> 1,093,398 0.42
20. FORSYTH BARR CUSTODIANS LTD <FORSYTH BARR LTD-NOMINEE A/C> 1,015,406 0.39
Totals: Top 20 holders of FULLY PAID ORDINARY SHARES (TOTAL) 200,181,154 76.78
Total Remaining Holders Balance 60,529,562 23.22
NOTE: Shareholders may have several accounts which could affect their overall gross holdings.
The following are substantial shareholder accounts listed in the Company’s register as of 15 August 2018.
Substantial Shareholders
Rank Shareholder Name Number of shares held % of Total Capital
1. J P MORGAN NOMINEES AUSTRALIA LIMITED 53,994,709 20.71
2. HSBC CUSTODY NOMINEES (AUSTRALIA) LIMITED 44,355,408 17.01
3. TOYOTA TSUSHO CORPORATION 39,106,607 15.00
147
For
per
sona
l use
onl
y

The following securities were on issue as at 28 August 2018.
Securities on Issue
Number Class
260,710,716 Ordinary (ORE)
757,249ASX Code OREAS–Performance Rights exercisable at $0.00, 30 days after the later of 31 August 2018 or the date of release of the Company’s financial results for FY2018.
455,147ASX Code OREAS–Performance Rights exercisable at $0.00, 30 days after the later of 31 August 2019 or the date of release of the Company’s financial results for FY2019.
805,242ASX Code OREAS–Performance Rights exercisable at $0.00, 30 days after the later of 31 August 2020 or the date of release of the Company’s financial results for FY2020.
The following unlisted options were exercised in accordance with the terms of their grant.
ASX Code Expiry Date Exercise Date Exercise PriceNumber of
Performance Rights
OREAU 31-May-18 8-Dec-17 $1.50 100,000
The following unlisted Performance Rights were exercised in accordance with the terms of their grant.
ASX Code Expiry Date Exercise Date Exercise PriceNumber of
Performance Rights
OREAS 30-Sep-17 21-Sep-17 $0.00 315,573
OREAS 30-Sep-17 26-Sep-17 $0.00 113,915
The following unlisted Performance Rights lapsed in accordance with the terms of their grant.
ASX Code Expiry Date Lapse Date Exercise PriceNumber of
Performance Rights
OREAS 30-Sep-17 21-Sep-17 $0.00 8,252
OREAS 30-Sep-17 26-Sep-17 $0.00 18,850
OREAS 30-Sep-18 FY 2018 $0.00 45,718
OREAS 30-Sep-19 FY 2018 $0.00 32,670
OREAS 30-Sep-20 FY 2018 $0.00 26,970
OROCOBRE ANNUAL REPORT 2018 148
For
per
sona
l use
onl
y

Voting Rights
Each ordinary share is entitled to one vote when a poll is called, otherwise each member present at a meeting has one vote on a show of hands. There are no voting rights attached to the Performance Rights, but voting as detailed above will attach to the ordinary shares issued when the Performance Rights are exercised.
Registers of Securities are held at the following addresses
Computershare Investor Services Pty Limited Level 1, 200 Mary Street Brisbane QLD 4000, Australia
Computershare Investor Services Inc 100 University Avenue, 8th Floor Toronto ON M5J 2Y1, Canada
Stock Exchange Listing
Quotation has been granted for all the ordinary shares of the Company on all Member Exchanges of the Australian Stock Exchange Limited, other than those classified as restricted securities and detailed below. Ordinary shares of the Company are also listed on the Toronto Stock Exchange (TSX).
Restricted Securities
The Company currently has no restricted securities.
Use of Cash & Convertible Assets
During the period from admission to the official list of the Australian Stock Exchange to 30 June 2018, the Company has used cash and assets readily convertible to cash in a manner consistent with its business activities. The Company is involved in mineral exploration, development and production in Argentina.
Technical Information, Competent Persons’ & Qualified Persons’ Statements
The resource model and brine resource estimate on the Salar de Olaroz was undertaken by John Houston, an independent consultant employed by John Houston Consulting, who is a Chartered Geologist and a Fellow of the Geological Society of London. John Houston has sufficient relevant experience to qualify as a competent person as defined in the 2004 edition of the Australasian Code for Reporting of Exploration Results, Mineral Resources and Ore Reserves. He is also a “Qualified Person” as defined by Canadian Securities Administrators’ National Instrument 43-101.
The Feasibility Study on the Olaroz project was prepared by John Houston and Michael Gunn an independent consultant employed by Gunn Metals, together with Sinclair Knight Merz and the Orocobre technical group. Mr. Houston and Mr. Gunn prepared the technical report entitled “Technical Report – Salar de Olaroz Lithium-Potash Project, Argentina” dated May 13, 2011 (the “Olaroz Report”) under NI 43-101 in respect of the Feasibility
Study, and each of Messrs. Houston and Gunn was a Qualified Person under NI 43-101, and independent of the company, at the date such report was prepared. Mr Gunn is a Member of the Australian Institute of Mining and Metallurgy and is consulting mineral processing engineer with approximately forty years’ experience.
The information relating to the Olaroz project is extracted from the report entitled “NI 43-101 Technical Report – Salar de Olaroz Lithium-Potash Project, Argentina”, dated 13 May 2011 and can be viewed at www.orocobre.com.
The Company is not aware of any information or data that materially affects the information included in the original market announcement. All material assumptions and technical parameters underpinning the estimates in the relevant market announcement continue to apply and have not materially changed. However, it is noted that in addition to the original resource the company has defined an exploration target detailed in the announcement dated 23 October 2014, “Olaroz Project Large Exploration Target Defined Beneath Current Resource” that immediately underlies the resource. The Company confirms that the form and context in which the Competent Person’s findings are presented have not been materially modified from the original market announcement for the resource estimate.
This information in regard to the Olaroz Project, with the exception of the information pertaining to the defined exploration target in 2014, was prepared and first disclosed under the JORC Code 2004. It has not been updated since to comply with the
149
For
per
sona
l use
onl
y

JORC Code 2012 on the basis that the information has not materially changed since it was last reported.
The exploration target defined underlying the resource at Olaroz was defined by Murray Brooker, an independent consultant employed by Hydrominex Geoscience Pty Ltd. Murray Brooker is a geologist and hydrogeologist and is a Member of the Australian Institute of Geoscientists. Murray has sufficient relevant experience to qualify as a competent person as defined in the 2012 edition of the Australasian Code for Reporting of Exploration Results, Mineral Resources and Ore Reserves. He is also a “Qualified Person” as defined by Canadian Securities Administrators’ National Instrument 43-101. The exploration target is defined as between 1.6 and 7.5 million tonnes of lithium carbonate equivalent between 197m and 323m depth. The basin is potentially 600m deep and additional targets exist to the north and the south of the defined exploration target. It must be stressed that an exploration target is not a mineral resource. The potential quantity and grade of the exploration target is conceptual in nature, and there has been insufficient exploration to define a Mineral Resource in the volume where the Exploration Target is outlined. It is uncertain if further exploration drilling will result in the determination of a Mineral Resource in this volume.
The information in this report that relates to exploration reporting at the Cauchari JV project has been prepared by Mr Frits Reidel. Frits Reidel is a Certified Professional Geologist and member of the American Institute of Professional
Geologists. Frits Reidel is General Manager and Principal with FloSolutions Chile and is independent of Orocobre. Frits has sufficient relevant experience to qualify as a competent person as defined in the 2012 edition of the Australasian Code for Reporting of Exploration Results, Mineral Resources and Ore Reserves. He is also a “Qualified Person” as defined in NI 43-101. Frits Reidel consents to the inclusion in this report of this information in the form and context in which it appears. The resource information in relation to the Cauchari JV project between Orocobre and Advantage Lithium is extracted from the report entitled NI43-101 Technical Report Lithium and Potassium Resources Cauchari Project, dated 27 June 2018. The report is available to view on the Company website www.orocobre.com.
The information in this report that relates to resources at the Borax Tincalayu site has been prepared by Mr Murray Brooker. Murray Brooker, an independent consultant employed by Hydrominex Geoscience Pty Ltd is a geologist and hydrogeologist and is a Member of the Australian Institute of Geoscientists. Murray has sufficient relevant experience to qualify as a competent person as defined in the 2012 edition of the Australasian Code for Reporting of Exploration Results, Mineral Resources and Ore Reserves. He is also a “Qualified Person” as defined by Canadian Securities Administrators’ National Instrument 43-101. The information in this report is extracted from the announcement titled Tincalayu Upgraded to JORC Compliant Resource, dated 18 November 2014 and the NI-43-101 Report titled “Technical Report on
the Tincalayu Borax Mine”, dated 31 December 2014, both available to view on the Company website www.orocobre.com.
The Company confirms that it is not aware of any new information or data that materially affects the information included in the references above and that all material assumptions and technical parameters underpinning the resource estimates continue to apply and have not materially changed. The Company also confirms that the form and context in which the Competent Person’s findings are presented have not been materially modified. The Company also confirms that the form and context in which the Competent Person’s findings are presented have not been materially modified.
An announcement was made on the 21 August 2012 regarding the superseded historical resource at Tincalayu. The Company is not in possession of any new information or data relating to historical estimates that materially impacts on the reliability of the estimates or the company’s ability to verify the historical estimates as mineral resources, in accordance with the JORC Code. The supporting information provided in the initial market announcement on 21 August 2012 continues to apply and has not materially changed. Additional information relating to the Company’s projects is available on the Company’s website www.orocobre.com.
OROCOBRE ANNUAL REPORT 2018 150
For
per
sona
l use
onl
y

Caution Regarding Forward Looking Information
This report contains “forward-looking information” within the meaning of applicable securities legislation. Forward- looking information may include, but is not limited to, the results of the Olaroz Feasibility Study, the estimation and realisation of mineral resources at the Company’s projects, the viability, recoverability and processing of such resources, costs and timing of development of the Olaroz project, the forecasts relating to the lithium, potash and borate markets including market price whether stated or implied, demand and other information and trends relating to any market tax, royalty and duty rates, timing and receipt of approvals for the Company’s projects, consents and permits under applicable legislation, adequacy of financial resources, the meeting of banking covenants contained in project finance documentation for the Olaroz project, production and other milestones for the Olaroz project, the Olaroz project’s future financial and operating performance including production, rates of return, operating costs, capital costs and cash flows, potential operating synergies between the Company’s projects and the Olaroz project, other matters related to the development of the Olaroz and Cauchari, the performance of the relocated borax plant, including without limitation the plant’s estimated production rate, financial data, the estimates of mineral resources or mineralisation grade at the Tincalayu mine, the economic viability of such mineral resources or mineralisation, mine life and
operating costs at the Tincalayu mine, the projected production rates associated with the borax plant.
Forward-looking information is subject to known and unknown risks, uncertainties and other factors that may cause actual results to be materially different from those expressed or implied by such forward- looking information, including but not limited to the risk that further funding may be required, but unavailable, for the ongoing development of the Company’s projects; the possibility that required concessions may not be obtained, or may be obtained only on terms and conditions that are materially worse than anticipated; changes in government regulations, policies or legislation; fluctuations or decreases in commodity prices; the possibility that required permits or approvals may not be obtained; uncertainty in the estimation, economic viability, recoverability and processing of mineral resources; fluctuations or decreases in commodity prices general risks associated with the feasibility of the Company’s projects; risks associated with construction and development of the Olaroz project; unexpected capital or operating cost increases; risks associated with weather patterns and impact on production rate and the uncertainty of meeting anticipated program milestones at the Company’s projects; general risks associated with the operation of the borax plant; a decrease in the price for borax resulting from, among other things, decreased demand for borax or an increased supply of borax or substitutes.
The Company believes that the assumptions and expectations reflected in such forward-looking information are reasonable. Assumptions have been made regarding, among other things: the Company’s ability to carry on its exploration and development activities, the timely receipt of required approvals, the prices of lithium potash and borates, the ability of the Company to operate in a safe, efficient and effective manner and the ability of the Company to obtain financing as and when required and on reasonable terms. Readers are cautioned that the foregoing list is not exhaustive of all factors and assumptions which may have been used.
There can be no assurance that forward- looking information will prove to be accurate, as actual results and future events could differ materially from those anticipated in such information.
Accordingly, readers should not place undue reliance on forward-looking information. The Company does not undertake to update any forward-looking information, except in accordance with applicable securities laws.
151
For
per
sona
l use
onl
y

OROCOBRE ANNUAL REPORT 2018 152
For
per
sona
l use
onl
y

Corporate Directory
Directors
Mr Robert Hubbard (Non-Executive Chair)
Mr Richard P. Seville (Managing Director & CEO)
Mr Federico Nicholson (Non-Executive Director)
Mr Fernando Oris de Roa (Non-Executive Director)
Mr Courtney Pratt (Non-Executive Director)
Mr John W. Gibson, Jr. (Non-Executive Director)
Ms Leanne Heywood (Non-Executive Director)
Mr Masaharu Katayama (Non-Executive Director)
Secretaries
Mr Neil Kaplan
Mr Rick Anthon
Registered Office
Level 1, 349 Coronation Drive Milton, Queensland 4064 Australia
Phone: (+617) 3871 3985 Fax: (+617) 3720 8988 Email: [email protected] Website: www.orocobre.com
ACN
112 589 910
Auditors
Ernst & Young Australia Level 51, 111 Eagle Street Brisbane, Queensland 4000 Australia
Legal Advisers
Saravia Frias Cornejo Abogados Rivadavia 378 (A4400BTH) Salta Argentina
McCarthy Tetrault LLP Suite 5300 TD Bank Tower Toronto Dominion Centre 66 Wellington Street West Toronto ON M5K1E6 Canada
Jones Day Riverside Centre Level 31, 123 Eagle Street Brisbane City, Queensland 4000 Australia
Share Registries
Computershare Investor Services Pty Limited Level 1, 200 Mary Street Brisbane QLD 4000 Australia
Computershare Investor Services Inc 100 University Avenue, 8th Floor Toronto ON, M5J 2Y1 Canada
153
For
per
sona
l use
onl
y

OROCOBRE ANNUAL REPORT 2018 154
For
per
sona
l use
onl
y

orocobre.com
For
per
sona
l use
onl
y