Embed Size (px)
DESCRIPTION
http://www.energyfromthorium.com/pdf/ORNL-TM-3352.pdf
Citation preview

ORNL-TM-3352
ENGINEERING DEVELOPMENT STUDIES FOR MOLTEN-SALT BREEDER REACTOR
PROCESSING NO. 10 :
L. E. McNieere

This report was prepared as an account of work sponsored by the United States Government. Neither the United States nor the United States Atomic Energy Commission, nor any of their employees, nor any of their contractors, subcontractors, or their employees, makes any warranty, express or implied, or assumes any legal liability or responsibility for the accuracy, completeness or usefulness of any information, apparatus, product or process disclosed, or represents that its use would not infringe privately owned rights.
.

ORNL-TM-3352
Contkact No. W-7405~eng-26’
CREMICAL TFXRNOLOGY DIVISION
ENGINEERING DWFMENT STUDIES FOR MOLTEN-SALT BREEDERREACTOR PROCESSING NO. 10
L. E. McNeese
December 1972
’ NOTICE ThIa report was prepared .I an account of work sponroucd by the United States Government. Neither the United States nor the United States Atomic Energy Commission. nor any of their employees, nor my of their coottactozs, 8ubcontractorr. or their employees, nukes soy warranty. express or Implied, or assumes my lesal IiabiIity or responsibility for the .cc”racy. eom-
:
p1eteness o~.usefuIulnesa of any informrtion. ~pparrtus, : qroduct or process disclosed. or represents that Its use /
would not InfrInge privately owned rights.
OAK RIDGE NATIONAL LABORATORY ; . Oak Ri,dge, Terinessee 37830
operated by UNION CARBIDE CORPORATION.'
for'the i ' U.S. ATOMIC ENERGY COMIQSSION
DWRM.mON OF THIS DOCUMENT IS UNL-JiJjTm

ii \
Reports previou4.y issued in this series are as follows: w
ORNL-TM-3053 Period ending December 1968 *
ORNL-TM-3137 Period ending March 1969
ORNL-TM-3138 Pertod ending June 1969 s
ORNL-TM-3139 Period ending September 1969 z ORNL-TM-3140 Period ending December 1969 ORNL-TM-3141 Period ending March 1970 -' ORNL-TM-3257 Period ending June 1970
ORNL-TM-3258 Period ending September 1970 ORNL-TM-3259 Period ending December 1970
.
.

. . . 111
bd
t
CONTENTS Page
SUMMARIES.......................... a.. v
1. INTRODUCTION. . . . . . . . . . , . . . . : . . . . . . . . . 1
2. FROZEN-WALL FLUORINATOR DEVELOPMENT: EXPERIMENTS ON INDUCTION HEATING IN A CONTINUOUS FLUORINATOR SIMULATION. ........ 2
2.1 Modification of Power Generation and Transmission Systems. 2
2.2 Experimental Results ... : . : ............. 4
3. SEMICONTINUOUS REDUCTIVE EXTRACTION EXPERIMENTS IN A MILD- STEEL,FACILITY ......................... ..12
3.1 Replacement of the Salt Feed-and-Catch~'Tank. ....... 12 3.2 Preparation for Mass Transfer Experiment ZTR-1 ...... 13
i 3.3 Mass Transfer Experiment ZTR-1 .............. 15 3.4 Variation of Reductant Inventory in the Bismuth Phase.
in the Treatment Vessel. ................. 16 3.5 Operation of the Argon Purification.System ........ 19
4. DEVELOPMENT OF THE METAL TRANSFER PROCESS: INSPECTION OF EXPERIMENTMTE-2 ...................... ..2 1
4.1 Description of Equipment .................. 21 4.2 Inspection of Equipment. ................... 23
5. DEVELOPMENT OF THE METAL TRANSFER PROCESS: AGITATOR TESTS FOR EXPERIMENTMIE-3 ........................ 34
5.1 Description of Equipment ................... 34 5.2 Experimental Results ; ................... 40
6. DISTRIBUTION OF RADIUM BETWEEN LiCl and,Li-Bi SOLUTIONS'. ... 46
6.1.. Description of Equipment .. ,, ............... 46 6.2 Experimental Results .................... 47
7. DEVELOPMENT OF MECHANICALLY AGITATED SALT-METAL CONTACTORS. , - 52
7.1 Studies for Determination of Limiting Agitatdr Speeds. .. 53 7.2 Determination of Metal Flow Rate Across Contactor ~.
Partition. .............. .'.: ......... 57
7.3 Conclusions. ............ : .......... 59

8.
9.
10.
11.
.
iV
CONTENTS (continued) Page
ANALYSIS OF MULTICOMPONENT MASS TRANSFER BETWEEN MOLTEN SALTS AND LIQUID BISMUTH DURING COUNTERCURRENT FLOW IN PACKEDCOLUMNS. . . . , . . . . . . . . . :. . .A . , . . . . 6i
8.1 Mathematical Models. . . , . . . . . . , . . . . ,, . . . . 61
8.2 Calculated Mass Transfer Rates for the Case of Binary Exchange with Uniform Bulk Concentrations, . . . . . . '. . 64
8.2.1 Effect of Diffusion Coefficientsof Transferring Ions in Electrolyte Phase . . . . . . . . i . . . . 65
8.2.2 Effect of Individual Mass Transfer Coefficient in Electrolyte Phase . . . . . . . . . . . . . . . . . 67
8.2.3 Effect of Individual Mass Transfer Coefficient in Solvent Phase . . . . . . . . . . . . . . . . . . . 67
8.2.4 Effect of Equilibrium Constant. , . . . . . . . . . 70 8.2.5 Effect of Concentration of Nontransferring Ions
in the Electrolyte Phase. . . . . . . . . . . . . . 70 8.3 Calculated Mass Transfer Rates in an Extraction Column
Having Nonuniform Bulk Concentrations. . . . . . . . . . . 73 8.3.1 Binary Exchange . . . . . . . i . . . . . . . . . . 74 8.3.2 Multicomponent Exchange . . . . . . . . . . . . . . 78 c
8.4 Summary. :. . . . . . . . . . . . . . . . . . . . . . . .81
ENGINEERING STUDIES OF URANIUM OXIDE PRECIPITATION. . . . . . . 83 Q
9.1 Description of Facility. . . . . . . . . . . . . . . . . ..83 9.2 Precipitator Vessel Design . . . . ; . . . . . . . ; . . . 85
STUDY OF THE PURIFICATION OF SALT BY CONTINUOUS METHODS . . . . 90
10.1 Tests for Determining the Presence of Suspended Iron Particles in Salt Samples . . . . . . . . . . . . . . . . 90
10.2 Tests of Various Sampler Types. . . . . . . . . . . . . . 92 10.3 Correlation of Flooding Data. . . . . .' . . . . . . . . . 93
REFERENCES...........................95
I
. Fs
_--. ‘ / Aiifi .

v
SUMMARIES
-FROZEN-WALL FLUORINATOR DEVELOPMENT: EXPERIMENTS ON INDUCTION HEATING IN A CONTINUOUS FLUORINATOR SIMULATION
Twenty-one additional runs were.made in the continuous fluorinator simulator to determine heat generation rates in nitric acid, in the pipe surrounding the acid column, and in the induction coil. Three additional
induction coil designs were tested, and the effect of bubbles in the acid
on the heat.generation rate was determined. Results of the tests estab- lished conditions that will allow induction heating .to be used in a con-
tinuous fluorinator experiment in which the fluorinator vessel is pro- tected from corrosion by alayer of frozen salt. Equations were developed for predicting heat generation rates in the molten salt, the induction
coil, and the fluorinator vessel. These equations predict a high effi-
ciency for heating molten salt in a fluorinator for one of the four coil designs tested.
SEMICONTINUOUS REDUCTIVE EXTRACTION EXPERIMENTS IN A MILD-STEEL FACILITY
The new salt feed-and-catch tank was installed in the.system, and iron oxide was partially removed from it and from the system by contacting the equipment with hydrogen. Reductant was added to the.bismuth, about 20 liters of salt (72-16-12 mole % LiF-BeF2-ThFti) was charged to the sys- tem to replace salt 'that had been discarded with the original salt feed-. and-catch tank, and both phases were circulated through the system in order to complete the removal of oxides. After.the addition of a small amount of zirconium to restore the system inventory. to about 15 g, both phases were treated with a 30% HF--l-I2 stream in order to remove oxides
from the salt.
About Ig-equiv of reductant, in the form of thorium and Li-Bi ~alloy, was added to the treatment vessel, for the purpose of establishing a zirconium distribution coefficient value in the range .of 1 to 5. After the bismuth and salt had been transferred to their respective feed tanks, 97 Zr tracer was added to the salt, Mass transfer experiment ZTR-1 was

vi
then carried out using bismuth and salt flow rates of 216 ml/min and 99 ml/min, respectively. Counting of the flowing-stream samples showed that no transfer of the 97 Zr tracer had occurred. The reductant that had been added to establish the proper DZr value had apparently been
oxidized by RF and FeF2 which were present in the salt in the treatment vessel.
DEVELOPMENT OF THE METAL TRANSFER PROCESS: INSPECTION OF EXPERIMENT MTE-2
The equipment-used for metal transfer process experiment MTE-2, com- pleted previously, was disassembled and inspected. Some blistering and cracking of the 20-mil-thick nickel aluminide coating had occurred during
,the 2370-hr period that the vessel had been held at 650~~. The vessel was sectioned in a manner such that the salt and bismuth phases could be observed. The salt and bismuth phases appeared to be clean, and the interfaces were free of contamination. A black material which covered the vessel wall in the fluoride compartment is thought to be a mixture of salt and finely divided bismuth.
Deposits containing unusually high concentrations of rare earths were observed on the lip and overflow spout of the Li-Bi alloy container and in the bottom layer of the Th-Bi solution, The total quantities of rare earths in these deposits were only 5 to 10% of the rare-earth in-
ventories in the system. .
The inside of the carbon steei vessel appeared to be in good condi-
tion except for corrosion on items that were constructed of thin carbon steel. The carbon steel pump; .I which us'ed bismuth check valves, was in good condition at the completion of the experiments (i.e., after being operated to circulate a total of 702 liters of LiCl).
DEVELOPMENT OF THE METAL TRANSFER PROCESS: AGITATOR TESTS FOR EXPERIMENTMTE-3
Equipment was-constructed in order to test the shaft seal design
that is 'proposed for use in metal transfer experiment MTE-3. The system will also allow us to measure the extent to which bismuth is entrained
,, -. 4 Lid
t
v
c
,- -. 8 LJ

vii
in salt in a mechanically agitated system, and to evaluate a vapor- 1 deposited tungsten coating as a means for protecting carbon steel from
corrosion by molten salt and bismuth,
&
f
s
Several shaft seals were tested for various time periods at agita- tor speeds ranging from 150 to 750 rpm. It was found that the seal life
could be increased and that the seal leakage rate was decreased consid- erably by lubricating the seal with mineral oil. A seal design which
allowed satisfactory operation for 71 days was judged to be acceptable for use in experiment MTE-3.
Unfiltered salt samples taken during a 745-hr period in which salt
and bismuth were mechanically agitated showed that the concentration of bismuth in the salt'increased from 8 ppm to 200 ppm as the agitator
sbeed was increased from 150 rpm to 750 rpm. During this period, the
concentration of nickel in the bismuth increased from 2O.ppm to 1000 ppm, which indicated that the bismuth had penetrated the tungsten coating on the interior of the test vessel,. Inspection of the coating after completion of the test revealed cracks in the coating in a number of
places. Also,:it appeared that the coating had not been applied over the entire surface of the drain line at the base of the test vessel. It was concluded that protection of a vessel from attack by bismuth via a tungsten coating would be difficult because of the tendency for such a
coating to crack.
.
5
LJ
DISTRIBUTION OF RADIUM BETWEEN LiCl AND Li-Bi SOLUTIONS
Data on the distributiori of radium between molten LiCl and Li-Bi
solutions containing 13 to 35 mole $ lithium were obtained previously .during metal transfer experiment MTE-2. Additional data were obtained by diluting a portion of the Li-Bi solution from the experiment (con- taining radium) and equilibrating the resulting solution with LiCl at
650~~. All of the radium distribution data could be,correlated'well in the manner used previously for correlating distribution data for a large number of elements if radium was assumed to be divalent in the LiCl
phase.. It was found that the distribution characteristics for radium
I -

. viii
are quite similar to those of the divalent rare-earth and alkaline- earth fission products (Sm, Eu, Sr, and Ba); in fact, the data for radium and barium are almost identical.
f DEVELOPMENT OF MECBANICALLY AGITATED SALT-METAL..CONTACTORS
Efforts involving the development of mechanically agitated salt- metal contactors'of the Lewis cell type were continued. Preliminary
tests were carried out in contactors of-several sizes and with differ- ent agitator configurations in order to determine the factors that will
limit the agitator speed in stirred-interface contactors. The agitator speed was found to be limited by the transfer of the 1owAdensity (water)
phase via entrainment in the circulating high-density (mercury) phase. The limiting agitator speed was essentially independent. of the size and shape of the contactor but was strongly dependent on the agitator diam-
eter. A test made with a low-melting alloy and water, which resulted in a density difference of 7.1 rather than 12.6, indicated that the limiting
agitator speed is not highly dependent on the difference in densities of the two liquid phases. It is believed that entrainment of salt in the bismuth.in metal transfer experiment MTE3will occur at essentially the same agitator speed as was observed with the mercury-water system
(300 rpm), and that the experiment should be operated initially with agitator speeds well below this value. .
Two tests were -carried'out for determining the rate at which bismuth circulates between the two sides of a compartmented salt-metal contactor
containing a captive bismuth phase. These tests, in which mercury and water were used rather than bismuth and salt, indicated mercury flow
rates of 11.2 and 19.3liters/minfor agitators (speed, 195 rpm in each case) having straight and canted blades respectively. It was concluded that the bismuth circulation rate in metal transfer experiment MTE-3
will be adequate and much greater than the minimum desired value of 0.5 liter/min.
: :
L) .
Y
ol .Y-- I :
Lid

P
ix .
ANALYSIS OF MULTICOMPONENT MASS TRANSFER BETWEEN MOLTEN SALTS AND LIQUID BISMUTH DURING COUNTER-
CURRENT FLOW IN PACKED COLUMNS
The transfer of materials between a molten salt'and liquid bismuth results in a condition where the fluxes of the transferring ions are
dependent on both concentration'gradients and elec,trical potential gradi- ents. This greatly complicates the mass transfer process and makes the design of continuous reductive extraction columns difficult. Calculations were completed for both binary and multicomponent mass transfer in order to determine the conditions under which the presence of an electric potential gradient significantly alters the mass transfer rate, Cdn-
ditions which typify molten-salt --bismuth and aqueous-organic systems
were examined.
The effect of the electric potential gradient was found to be of
greater importance when the electrolyte is a molten salt than when it is an aqueous solution. In the latter case, the nontransferring coions
redistribute in the electrolyte phase in a manner which suppresses the effect of the electric potential gradient. However, it was shown that
significant errors in calculate$ mass transfer rate values will result under some operating conditions in both cases.
*_ Two cases involving reductive extraction of uranium from a molten fluoride salt phase into a liquid bismuth phase containing reductant indicate that neglect of the effect of an electric potential gradient probably.causes essentially no error in calculated,mass transfer rates for reductive extraction operations of interest in MSBR processing.
.ENGINEERING STUDIES OF URANIUM OXIDE PRECIPITATION
Studies of the chemistry of protactinium and uranium oxide precip-
itation have indicated that oxide precipitation may be an attractive. alternative process to fluorination-- reductive extraction for isolating
protactinium and removing uranium from the fuel salt of an MSBR. .An
experimental facility has been-designed and equipment is being installed in order to study the kinetics of uranium oxide precipitation, to investi- gate the size distribution and settling characteristics of oxide precip- itate, and to gain experience with oxide precipitation systems.
. .
X
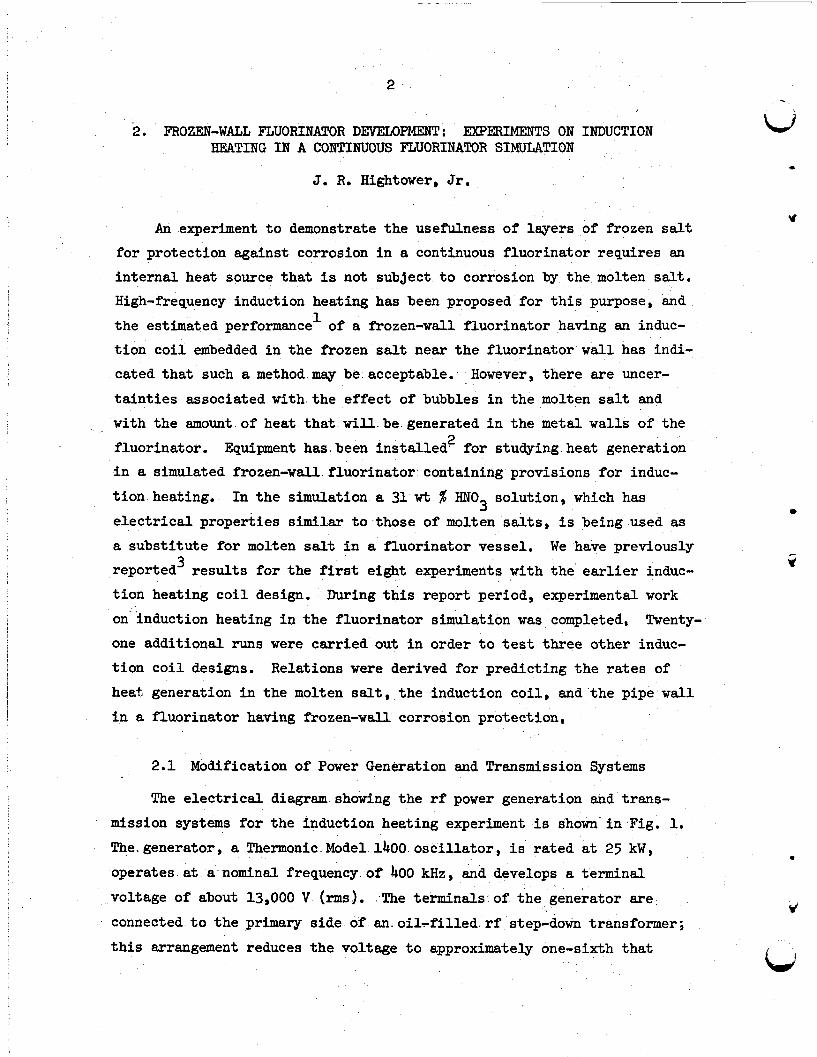
The experimental facility will allow for batch precipitation studies to be made in a b-in.-diam vessel containing approximately 2 liters of 72-16-12 mole % LiF-BeF2-ThF4 salt that also contains UF4 at an initial
concentration of about 0.3 mole-%. Oxide will be supplied to the pre- cipitator in the form of a water-argon gas mixture that will be introduced through a 1-in.-diam draft tube to promote contact of the salt and oxide. The salt will be decanted to a receiver vessel after allowing the oxide
to settle for a short time, The facility also includes a system for supplying hydrogen-HE gas mixtures that will be used for converting oxides
to fluorides at the conclusion of an experiment. The off-gas system includes caustic scrubbers for-removing HF from the precipitator off-gas
stream in order that additional information relative to the extent of precipitation of oxides can be obtained.
STUDY OF THE PURIFICATION OF SALT BY CONTINUOUS METHODS .
Salt purification studies were continued on the continuous reduc- tion of iron fluoride by countercurrent contact of the'salt (72.0-14.4- 13.6 mole % LiF-BeF2-ThF4) with hydrogen in a packed column. Tests carried
out to investigate the possibility that iron particles in the molten salt might be the cause of occasional high iron analyses showed that iron particles are not present. Sampling tests with various sampler designs showed that iron particles, if present, do not remain in the salt during one pass through the experimental system; that iron analyses below 100 . ppm are unreliable with sample sizes of 1 g or less; and that salt samples taken in nickel samplers are more sub,ject to iron contamination during removal than samples taken in copper samplers. Comparison of flooding data
taken during the countercurrent flow of molten salt and argon indicate that flooding occurs at throughput values below those predicted by the
Sherwood correlation.

1
u 1. INTRODUCTION
z A'molten salt breeder reactor (MSBR) will be fueled with a molten
0 fluor!ide mixture that will circulate through the blanket and core regions of the reactor and through the primary heat exchangers. We are
developing processing methods for use in a close-coupled facility for
removing fission products, corrosion products, and fissile materials from the molten fluoride mixture.
Several operations associated with MSBR processing are under study.
The remaining parts of this report discuss:
(1) experiments conducted in a simulated continuous fluo- rinator for studying induction heating in molten salt,
I (2) experiments conducted in a mild-steel reductive extrac-
tion facility to increase our understanding of the rate at which materials are extracted from molt,en salt into bismuth in a packed column,
i (3) the results of inspection of equipment used in experi- ment MTE-2 for demonstrating the metal transfer proc- ess for the removal of rare earths from MSBR fuel car-
3 rier salt,
(4) .results'of agitator tests carried out for evaluating various shaft seals for use in metal transfer experi- ment WE-3, *
(5) studies on the distribution of radium between LiCl and Li-Bi solutions,
(6) development of mechanically agitated salt-metal contactors,
(7); analysis of multicomponent mass transfer between molten salts and liquid bismuth during countercurrent flow in packed.columns,
I)
(8) design of a facility for conducting engineering studies related to the precipitation of uranium oxide from molten fluoride mixtures, and
(9) studies of.the purification of.salt by continuous methods.
This work was carried out in the Chemical Technology Division during the period January through March 1971.
” ^
2' --.,
2. FROZEN-WALL FLUORIMATOR DEVELOPMENT: EXPERIMENTS ON INDUCTION w HEATING IN A CONTINUOUS FLUORINATOR SIMULATION
e J. R. Hightower, Jr,
An experiment to demonstrate the usefulness of layers of frozen salt for protection against corrosion in a continuous fluorinator requires an internal heat source that is not sub3ect to corrosion by the molten salt. High-frequency induction heating has been proposed for this purpose, and the estimated performance' of a frozen-wall fluorinator having an induc- tion coil embedded in the frozen salt near the fluorinator wall has indi-
.cated that such a method msy be.acceptable: However, there are uncer- tainties associated with the effect of bubbles in the molten salt and with the amount of heat that~will.be.generated in the metal walls of the fluorinator. Equipment has.been installed2 for studying.heat generation in a simulated frozen-wall.fluorinator containing provisions for induc- tion heating.. In the simulation a 3l,wt$ HN03 solution, which has electrical properties similar to.those of molten salts, is being used as a substitute for molten salt in a fluorinator vessel. We have previously reported3 results for the first eight experiments with the earlier induc- tion heating coil design. During this report period, experimental work on induction heating in the fluorinator simulation was completed, Twenty- one additional runs were carried out in order to test three other induc- tion coil designs. Relations were derived for predicting the rates of heat generation in the molten salt, the induction coil, and the pipe wall in a fluorinator having frozen-wall corrosion protection,
.
5
2.1 Modification of Power Generation and Transmission Systems
The electrical diagram showing the rf power generation and trans- mission systems for the induction heating experiment is shown in Fig. 1.
The.generator, a Thermonic.Modell~OO.os~illator, is rated at 25 kW, operates at a-nominal frequency.of 400 kHz, and develops a terminal
.
voltage of about 13,000 V (rms.). IThe terminals:of the generator are,
connected to the primary side of-an..oiLfilled.rf step-down transformer;
this arrangement reduces the voltage to approximately one-sixth that
u'
' LJ

3
t
?
ORYL 01s. 7l-aaia
1 COARSE TlJul*s COIL
1 J 6 REFLECTED
RESISTAYCL
LQUIVALCNT CIRCUIT
Fig. 1. Fig. 1. Electrical Diagram for Induction Heating ExperPments. Electrical Diagram for Induction Heating ExperPments.

4
of the input.in.order to not.exceed the voltage ratings of.the coaxial transmission cables. -The coaxial cables (Model T-20-D and Model T-10-D
made by L. C. Miller Company) are connected in series and allow trans- mission of power to a point about 30 ft from the generator. During the current report period, the lo-ft segment (Model T-10-D) of the cable. was replaced with-a 5-ft-long coaxial conductor, This conductor was
made of 3/8-in.-dism copper tubing enclosed within l/2-in.-dism poly- ethylene tubing, which was, in turn, placed inside 3/b-in.-diam copper tubing. The new section of the transmission line operated satisfac- torily,
Lid
.
Y
In order to obtain a high current through the inductioncoil and to :minimize.the current in the coa+l.cable,.additional inductances and capacitances were incorporated into:the.circuit with the induction coil to form a psrallel RLC resonant circuit.? Two capacitors (General Electric, Cat. No. .lgF234);.each=having a'capacitance of 0.0105 uF, were, used. These capacitors -were.rated for a maximum current of 196 A at 540 kHz -and a maximum voltage of 5500 V,. For the induction heating\coils tested, it was possible-to achieve.conditions near resonance byisubsti- tuting coils of different sizes for-the resonance and coarse-tuning -coils.(see Fig. 1). Resonance was then approached more closely by adjusting the slide-bar on the fine-tuning loop. It was not possible to obtain precisely resonant conditions because the operating frequency of the generator was affected by each tuning adjustment, However, with
the circuit adjusted as close to resonance as possible, we were able to drive up tc‘ 250 A through one induction coil (Coil III) with a current of only 190 A in the coaxial cable. When the resonant circuit was not used and the coaxial cable was connected directly to the induction coil
leads, we could drive only about 160 A through the induction coil.
.
5
_.
2.2 Experimental Results t
To date, 29 runs.have.been made with the continuous fluorinator
.simulation.to determine heat-generation rates in the nitric acid, in r/
the pipe surrounding the acid, and in the four induction coils. Each
induction coil had a length of 5 ft and.an inside diameter of 5.6 in., hd

5
bill4 and was made of a number of smaller coil sections connected in parallel electrically, The characteristics of the individual induction coil
designs are shown in Table 1. Coil IV was chosen as the best design
because it produced.the highest heat generation rate in the nitric acid for a given current in the induction co'il.
f
Table 1. Characteristics of Coils Tested in Continuous Fluorinator Simulation
Coil Length of No.. of No. of Conductor Small Turns in Adjacent
Small Diameter Section Small Sections Coil ,Material Sections (in.) (in.) Section Wound
I Monel 17 l/4 3 6-l/4 Opposing
II Stainless 18 318 3 6 Assisting Steel
III Stainless 18 3/8 3 6 Opposing Steel
IV Copper 10 u4 4 n-314 Opposing \
Tablet 2 gives the experimentally determined heat generation rates
in the acid, coil, and simulated vessel wall, along with the run condi- tions, Coil currents ranging from 100 to 250 A and'osfillator frequen- cies ranging from 390 to 4~6~k~z were used in these experiments, Heat
generation rates as high as 1559 W were developed in the acid.
The experimentally determined heat generation rates were used to
calculate correction factors ~for use with design equations that were derived for induction coils having idealized geometries. The design equations, which define these correction factors, are listed below. The
rate of heat generation in liquid inside an induction coil is given by
the relation
(1)

Table 2. Results of Heat Generation Measurements
RLKl No.
Average Total Heat Acid Coil Oscillator Generation Rate
Current Freq. Gas (WI (A) W-M Holdup Acid Pipe Coil
CFS-1 I .2 I
I z I
I 2 I 7 1,
8’ I 9 II
10 II
11 II 12 II 13 II
24.1 24.6 26.5 25.6 28.1 29.1 26.7 46.5 28.9 26.6 51.4 21.9 lg.6 20.3 17.4 19.3 18.5
21.3
14 II 14.9 15 III 15.7 16 III 18.5 17 III 18.5 .18 III 19,3 19 III 19.0 20 III 19.0 21 III 20.0 22 III 22.2 23 III 20.9 24 III 24.9 25 111 25.3 26 III 24.8 27 111 23.3 28 IV 29.7 29 IV 27.2
412 0 242 140 130 412 0 409 167 150 412 0 316 279 1442 100 412 0 141 116 150 412 o .378 263 150 412 0 383 309 160 412 0 448 308 150 412 0 393 282
412 150 0 377 273 1.356 _ 120 412 0 235 178 870
150 412 0 402 275 1442 140 402 0 201 128 1179 165 393 0 195 206 1327 189 E 0 227 253 1094 200 0 207 304 1946 200 422 0 370 313 2335 160 422.5 0 > 250 201 1253 ' 1.60 422.5 0 1282 200 422.5' 0 > 466 338 2061 200 422.5 0 2083 200 422.5 0 1946 150 $02,3 0 215 166 1150 149 402.3 0 370 220 150 402.8 0 360 318 1374 150 402.8 0.130 365 254 1408 150 403.8 0.171 325 235 1202 150 402.8 0.180 304 188 1099 149 402.8 0 412 186 1030 149 402,8 0 382 204 1195 250 424,8 o 1134 626 3606
250 426.1 0,17 9% 688 249 425.8 0.107 1159 599 z;: 252 426.0 0,106 1292 9% 3617 241 425.9 0 1243 533 3434 241 425.3 0,167 1080 601 '3228 115 .' 416.6 0 1559 530 962 119 442.1 0.164 1378 560 962
/ - u
.
-. i b

! , 7
where
pR = heat generation rate in liquid, W, -1
n = average number of turns per meter over length of coil, m , N= number of small coil sections, a = radius of fluid zone, m, L= length of coil, rn,-
f = frequency, Hz, . * = specific conductivity of liquid,.G -1 -1
gQ m -;
% = magnetic permeability of the liquid, N A ,
'TOT = total coil current (rms); A,
k= correction factor, dimensionless.
Equation (1) is based on an approximate relation' for the rate of heat
generation in an infinitely-long cylinder positioned inside an infinitely
! / 5 :
long induction coil, and is valid for (a/p,) ~1~4.
The rate at which heat is generated in the pipe surrounding the coil is given by the relation
P
(2)
where -. P = heat generation rate in pipe, W,
P -1 -1 gP
= specific conductivity'of pipe, s2 m ,
"P = inside radius of pipe, m,
pP = (2?rfg&'2,
w
P
= magnetic permeability of pipe, N A -2 , = correction factor, dimensionless, . . . .
and I n, N, L, and f are defined above. Equation (2) is valid only TOT' for (a,/p,) > 10,
The rate at which heat is generated in the'induction coil is given
by the relation
pC
bNT2 flpc l/2
I2 TOTL ' (3) = Kl7$-- I ] m
1
1
I 0

where 'p =
;=
dc = Rc = NT = Ns =
P, = fl = Kl =
and ITyJ and L are defined above.
The effect of bubbles in the nitric acid on the heat generation rate
heat generation rate in coil, W, inside diameter of coil, m, cpnductor diameter, m,
length of small coil section, m, number of turns in small coil section, number of small coil.sections,
specific resistivity of coil metal, Q-m, frequency, kHz, proportionality. constant, (fl/kHzem3)1'2,
was investigated with 'coils III and IV, Eight runs were made with air
flow rates up'to 2.16 scfm, which produced bubble volume fractions in the acid as high as 18%. In the range of bubble volume fractions examined,
the value of the correction factor k, defined by Eq. (l), varied approxi- . <' .
mately linearly with the bubble volume fraction as shown in Fig. 2; this :. _ I variation can be represented by the relation' J
k= kO(l - 1.079E) ., (4) .
where c k= correction factor, defined by Eq. (11,
kO = constant, E = bubble volume fraction.
The effect of bubbles in the liquid on the rate of heat generation is
slight, as would be expected if the bubbles remained near the center of the liquid zone.
Values for kg, k , and Kl; defined by P
respectively, were determined for the four
Table 3). .The values of the constants for
Eqs. (4), (2), and (3), .
induction coils tested (see coil II are smaller than the
corresponding constants for the other coils; the largest relative varia-
tion occurs in the values of kg, which is proportional to the heat genera-
tion rate in the liquid. The low heat generation rate with this induction

0.8
-i]yo 0.6
0.4
0.2
0
.
l COIL m k,=O.l78 X COIL m k, -0.261
\o
I I I I I I I I I
0.02 0.04 0.06 0.08 0.10 0.12 0.14 0.16 0.18 0.20
e,BUBBLE VOLUME FRACTION
Fig. 2. Effect of Bubble Volume Fraction on Correction Coefficient for Calculating Heat Generation Rate in Nitric Acid.

10
Table 3. Correction Factors for Heat Generation Rate Equations
Coil kO k P
Kl = (Q/kHz*m3)1'* Y
I 0.130 0.624 1,915 x 10-g
II 0.089 0.447 1.755 x lo-g III 0.178 0.623 -1.885 x 10~’
IV 0.261 0.586 2.15 x ioeg
coil design is apparently the result of having all of the small coil
sections wound in the same direction since the remaining characteristics of the coil are similar to those for the other coils. Coil II would require the largest current in order to produce a given heat generation rate in molten salt; however, it might have a high efficiency for
heating the salt if the diameter of the molten region were sufficiently large.
The value of k. for coil I was smaller than that for coil III,
although the two coils have essentially the same design and comparable values were observed for the other constants; This variation in k. values is-probably due to changes in experimental technique and operating
Conditions incorporated after tests with coil I were carried out. The new technique consisted in using alcohol-in-glass thermometers to measure
the acid temperatures, since the temperatures indicated by thermocouples used in the runs with coil I were affected to some extent by the rf power
generation. Also, the coil designs tested after coil I resulted in higher heat generation rates in the acid which, in turn, led to smaller relative errors in the measured heat generation rates in the acid,
The difference between the k. value for coil IV and the$ko values for coils I and II is probably due, in large part, to the different
spacing of the small coil sections. Coil IV had 4-in.-long small coil sections, with 11.7 turns in each section (see Table l), and the sec-
.
t
,--- tions were separated by a space of 2 in. in which turns were not present. CIld

11
The smaller sections in the other three coils were placed closer together
so that the coil turns were spaced uniformly over the length of the acid column; the total number of turns was about the same for each coil. In
the case of coils I and III this spacing compressed the magnetic field between each of th'e small coil sections, thereby effecting a decrease in
the axial component of the field. It is the axial component that pro- vides the proper eddy currents for heat generation,
T
Although any one of the four coils could be used to generate heat
in the proposed fluorinator, coil IV would require the lowest coil current to produce the required heating and, for this reason, would be the most desirable. Calculations have shown that, for a 5-in.-diam
molten-salt zone, a 5.56-in.-ID coil made from l/4-in:nickel tubing
(using a coil IV design in which each small section has 9.5 turns over a 3.75-in. length, with a 2.25-in.,space between small sections), and a 6-g/16-in.-ID nickel fluorinator vessel, an efficiency of heating the
salt (with no bubbles) of about 49% would be achieved with a total
f
.
current of less than.150 A. With coil III, the efficiency of heating the salt would be about 58%, but a coil current of 267 A would be required.

12
3. SEMICONTINUOUS REDUCTIVE EXTRACTION EXF'ERIMENTS IN A MILD-STEEL FACILITY .
B. A. Hannaford C. W. Kee I L. E. McNeese
We have continued operation of a facility in which semicontinuous
reductive extraction experiments can be carried out in a mild-steel sys- tem. 4 Initial work with the facility was directed toward obtaining data
on the hydrodynamics of the countercurrent flow of molten salt and bis- muth in a 0.82-in.-ID, 24-in.-long column packed with l/k-in. molybdenum
Raschig rings. We were able to show that flooding data obtained with
this column are in agreement with predictions from a correlation5 based
on studies of the countercurrent flow of mercury and aqueous solutions in packed columns. We have carried out several experiments for deter- mining the mass transfer performance of the packed column in which a
-salt stream containing UF4 was countercurrently contacted with bismuth containing reductant over a range of operating conditions. 0’ It was
found that the rate of uranium transfer to the bismuth was controlled by the diffusive resistance in the salt film under conditions such that the concentration of reductant in the bismuth remained high.throughout the column. The extraction data could be correlated in terms of the height of an overalltransfer unit based on the salt phase. In order to measure mass transfer rates under more closely controlled conditions where the controlling resistance is not in the salt phase, preparations
were begun for experiments in which the rate of exchange .of zirconium isotopes will be measured between salt and bismuth phases otherwise at
chemical equilibrium. Difficulty wasencountered at the beginning of
the first run of this typebecause of'a salt leak in the'vicinity of the
salt feed-and-catch vessel. 8
3.1 Replacement of the Salt Feed-and-Catch Tank
A new salt feed-and-catch tank of the initial design8 was fabricated and installed in the system.- Thermal insulation was remove'd from all transfer lines to allow their inspection, and lines that were more than
; i . . . ':
_ L)
*
t
J

I) i
F
P
F
.
13
moderately oxidized were replaced. .The salt transfer line from the
feed tank to the salt jack-leg was rerouted to a point 11 in. higher than in the original design in order to improve control of the salt feed rate and to prevent' the backflow of bismuth into the salt feed
tank during column upsets.
.
After its installation, the new salt feed-and-catch tank was stress
relieved by the same technique used for the originax feed-and-catch tanks; that is, the rate of heating to the.operating temperature (650~~) was maintained at less than 60°C/hr. The bismuth feed-and-catch tank,
which.had-been allowed to cool-during the time required to fabricate and install the new salt tank, was heated to the operating temperature (550°C)
at the same controlled rate. Both the salt and bismuth feed-and-catch
tanks were subjected to a pressure-proof test at the operating tempera- ture after frozen bismuth seals had been established in the freeze valves
in order to isolate the feed tanks (rated at 50 psig) from the receiver tanks (rated at 25 psig). After the pressure tests had been successfully completed, the salt feed-and-catch tank and the newly installed salt- transfer lines were contacted with a hydrogen stream for 13 hr at 600~~ in order to remove accumulations of iron oxide from the internal sur-
faces of the system.
3.2 Preparation for Mass Transfer Experiment ZTB-1
After the system had been treated'with hydrogen for removal of most of the iron oxide, itwas necessary to (1) add reduc.tant to the bismuth
phase, (2). increase the salt inventory in the system to about 20 liters,
,and (3) circulate the- salt and bismuth phases through the system in order to remove impurities that might have been introduced during the maintenance operations. -It was also necessary to increase the zirconium inventory in the system, to remove impurities from the salt phase by
hydrofluorination, and finally,.to add a sufficient amount of reductant to the bismuth phase to produce-a zirconium distribution ratio of about
1. Thes'e operations &e discussed in the remainder of this section.
A 103-g quantity of thorium was suspended in the bismuth phase in. the treatment vessel in a perforated container as described earlier7 in

14
order to increase the‘reductant concentration in the bismuth to about
0.002 equiv per g-mole of bismuth. During dissolution of the thorium, the treatment vessel was held at 650°c, and argon was fed to the draft tube in the!vessel at the rate of 2.5 std ft3/hr. Only 5 g of thorium remained undissolved after a period of 41 hr; analyses of bismuth sam- ples for uranium and thorium showed that about 80% of the thorium had
dissolved during the first 24 hr. About 18 liters of salt (72-16-12
mole % LiF-BeF2-ThF ) was then charged to the treatment vessel in order .4 to replace salt that had been discarded when the original salt feed- and-catch tank was replaced. The salt and bismuth phases were equili- brated in the treatment vessel for about 20 hr before they were trans-
ferred to their respective feed tanks. Bismuth and salt were then circulated through the system in order to complete the removal of oxides that had not been removed from the internal surfaces of the system after
the previous treatment with hydrogen. In addition, column pressure drop measurements were made during a period when only salt was. flowing through
the column. The observed pressure drop was about 2 in. H20 at the salt flow rate of 70 ml/min, which is in agreement with data obtained soon after the column was installed. It was concluded that the flow charac- teristics of the column had not changed during runs made to date.
The zirconium mass transfer experiments require that a significant quantity of zirconium be present in the salt and bismuth phases to ensure that only a negligible change will occur in the zirconium distribution ratio during the transfer of 97 Zr tracer from the salt to the bismuth . phase. A 5.2-g quantity of Zircaloy-2 was dissolved in the bismuth to increase the zirconium inventory of the system to about 15 g.
The salt and bismuth were then contacted in the treatment vessel with a 30% HF--hydrogen stream having a flow rate of about 16 std ft3/ hr at 650~~ in order to remove oxide (from the salt) that might have
accumulated during the previous transfer of the salt and bismuth through the facility. Treatment of the salt and bismuth with the HF-H2 stream was interrupted after about 2 hr'by'a restriction caused by deposition
of material on the sintered-Monel filter in the off-gas stream from the
treatment vessel. The filter,which has an external surface area of
t
*
Y
l
f
,-- w

iw. i
t
.
f
15
about 20 in. 2 , is used. for removing.particulates which would otherwise
cause restrictions in valve ports in the off-gas system.. The filter
was removed and replaced by a,4-in .-dism, 8-in.-long cylinder of com- pacted copper mesh. Analyses of the black solids removed from the
Monel filter showed that the material consisted primarily'of carbon, along with substantial amounts of thorium, uranium, and lithium. After the treatment with HF-H2, the salt and bismuth were contacted with srgon at about 3 std ft3/hr'for a 20-hr period in order to remove HF from the
salt. The bismuth and salt were. subsequently sampled, and a perforated basket containing 48 g of thorium metal was suspended in the bismuth
phase. After a period of 66 hr at a temperature of about 620°c, only
'25 g of the thorium had dissolved. In order to add reductant to the
bismuth phase more rapidly, 240 g of Li-Bi alloy containing 1.75 wt % lithium was added to the treatment vessel. The total quantity of
reductant added during these periods was about l‘g-equiv, The resulting
zirconium distribution ratio should have been about 5 if.it is assumed
that all of the added reductant was present in‘the bismuth as uranium, zirconium, thorium, and lithium. However,, the resultsof experiment
ZTR-1, described in the following section, indicate that this .assumption
is not valid.
3.3 Mass Transfer Experiment ZTR-1
At the conclusion of a 22-hr equilibration period which followed the final.additioti of reductant to the treatment vessel, the salt was
transferred to the salt feed tank. 'The transfer of bismuth from the treatment vessel was only about 50% complete when a failure of the
transfer line inside the vessel at the weld which joins the molybdenum tubing to the mild-stee1transfe.r line made it necessary-to cease this operation. The affected portion of the transfer line was replaced at a later date; however, the~intended duration of experiment ZTR-1 was reduce,d in order that the run could be carried out,with the smaller amount of bismuth that was available in the bismuth feed tank.
\ A 6.7-m@; quantity oft 96 Zr02 that had been irradiated for 12 hr at
a thermal neutron flux of, about 2 x 10 14 -2 neutrons cm set -' was

‘, .
16
transferred to.a 0.75-in .-diam steel capsule after an 18-hr decay period to facilitate addition of the 97 Zr tracer to the salt phase. Periodic
salt samples taken after immersion of the capsule indicated that mixing of the tracer with the salt phase was complete after 2 hr. In-order to verify that most of the tracer had entered the salt phase, the steel addition capsule was counted for 97 Zr activity. The counting results
for the bulk salt and for the capsule showed that greater than 99% of the tracer.had been transferred to the salt phase.
The volumetric flow rates for bismuth and salt during experiment
ZTR-1 were 216 and 99 ml/min respectively; these values are equivalent to about 90% of the 'combined column flow capacity at flooding. Seven
.j .sets of flowing stream samples were taken over a 29-min period. Counting
:-- of the 97m-97 Zr activities in the samples showed that no measurable transfer of 97 Zr tracer from the salt to the bismuth'phase had occurred
during the experiment. It was later found that the lack of transfer was
due to an unexpectedly low distribution coefficient for zirconium, which resulted in essentially no zirconium being present in the bismuth phase. Wet-chemical analyses of post-run, equilibrated samples for lithium and uranium implied a zirconium distribution coefficient value of about
0.001; i more precise value (0.'023) was obtained by counting the samples for g7Nb-g7Zr activity . It was concluded that essentially all of the reductant that had been added to the system had been consumed by one or more side reactions, for example, the reduction of FeF2 in the salt phase to metallic-iron, or the reaction of reductant with RF that was desorbed from the graphite crucible. It‘is also possible that a fraction of the lithium in the Li-Bi alloy reacted with air or water vapor during its addition to the treatment vessel.
3.4 Variation of Reductant Inventory in the Bismuth Phase in the Treatment Vessel
During this report period, we observed a considerably greater varia- tion in the reductant inventory in the bismuth phase in the treatment
vessel than had been expected; consequently, we have begun to give addi- tional attention to this subject.- Reductant can be removed from the
LJ
I
*
.
(1
u
. : ! u
.

17 Ld
I bismuth phase by a number of side-reactions, including:. (1.) reaction
of reductant with materials.3.n the salt phase such as FeF 2, HF, or
T
oxygen-containing compounds; and (2) reaction of reduced metals (uranium,
thorium, zirconium) with the graphite crucible in the treatment vessel. Information related to the variation of reductant inventory in the bis-
muth phase, as well as the inventory of uranium in the system, will be reported here and in future reports covering work in this experimental
facility so that the phenomena responsible for the observed effects can be identified.
.
t
L4
Data on the variation of inventories of reductant, uranium, and
zirconium during this report period are summarized in Table 4. At the beginning of the period, the treatment vessel contained 17.7 liters of bismuth and 1;4 liters of salt (72-16-12.mole % LiF-BeF2-ThF4). After
a 118-day period in which the salt and bismuth were held in the treat- ment vessel, the reductant inventory in the bismuth had decreased from
0.80 g-equiv to 0.058 g-equiv. The average rate of decrease in reduc-
tant concentration during this period this period was 0.26 meq/hr.' The
addition of 1.69 g-equiv of thorium metal to the bismuth phase resulted in approximately the expected change in the reductant concentration in *
the bismuth based on uranium and zirconium analyses. Following the addition of salt to the system to.increase the salt volume to about 21.5 liters, samples taken from the treatment vessel showed that the reductant inventory had ~decreased,slightly to 1.33 g-equiv; a decrease
was expected because of the probability of introducing small amounts of oxidants during the addition of salt to the system. Subsequently,
-the salt and bismuth phases were circulated through the system (run m-13) in order to remove oxides which may have been introduced during
the installation of new carbon steel lines and equipment. Analyses of bismuth samples showed that ~&bout half of the reductant'was removed from the bismuth during this operation. Next, zirconium metal (0.23 g-equiv)‘ was dissolved in ~the bismuth phase inorder to achieve the desired zirconium inventory inthe sysCem, Follcwing this addition,
the salt and bismuth,were contacted with an HF-H2 mixture. At this
point, the salt phase should have contained all of the uranium and

Table 4. Summary of Reductant, Uranium, and Zirconium Inventory Data for Treatment Vessel
Salt Phase Bismuth Phase Total Total
1.
Operation Sequence
Material remaining in treatment vessel at time of salt feed tank failure
Salt we w
4,760
Uranium Zirconium Bi Uranium Zirconium Total Reductanta Combined Phases Inventory Inventory wt Inventory Inventory (U, Zr, Th, Li) Uranium Zirconium (g-equiv) (g-equiv) (9) bwuiv) (g-cquiv) (g-equiv) (g-ewiv) (g-equiv)
0.152 0.0313 171,200 0.601 0.10 0.80 0.753 0.13
2.
3.
4.
5.
6.
7.
8.
Following 118-day equilibration period
4,760 0.702' 0.13'
Following addition of 4,760 0.003a so a 1.69 g-equiv of Th reductant
Following addition of 72,560 0.061 0.007a 67,800 g of LIF-BeF2- ThF4 (72-16-12 mole X) containing 0.114 equiv of Zr
171,200 0.058 so a 0.058 0.76a o.13a
171,200 0.757 0.16 1.65 8.76 0.16
171,200 0.700 0.24" 1.33 0.760 0.24a c1 aJ
Following equil- ibration run HR-13
63,670 0.337 0.092' 168,250 0.435 0.152a 0.74 0.772 0.24a
Following addition of 63,670 0.7ab 0.47a 168,250 e0 a QO a QO 0.76' 0.47a 0.23 g-equiv of Zr and RF-H2 treatment
Following addition of 63,670 0.76b 0.478 168,250 %o a %O a '*0 '0.763 0.47a 1.04 g-equiv of (Th + Li) reductant
Following tracer experiment ZTR-1
63,670 0.72 0.62 168,250 <0.003 *o a CO 0.72 0.62
aInferred value based on material balance and/or equilibrium considerations. The best value for uranium inventory was taken to be 0.76 g-equiv. b Chemical analysis resulted in inventory in one phase equal to 0.76 g-equiv f 4%; this value was taken to be the more accurate measure*
a C”. i B

LiJ a
f
ri
* s
LJ
19
. . zirconium, and samples showed a uranium concentration'in the salt that
was within about- k$'of the expected value. We then added to the bismuth
a quantity of reductant. (0.43 g-equiv of thorium, 0.61 g-equiv of lith- ium) theoretically sufficient to produce a zirconium distribution coef- ficient of about 5, in the absence of reductant-consuming side reactions.
However, analyses of bismuth and salt before and after tracer experiment * ZTR-1 showed that the reductant had been consumed almost entirely before the experiment was performed, as discussed earlier.
The material balance for uranium throughout the report period was excellent, as shown in Table 4; the zirconium balance was satisfactory in view of the greater difficulty encountered in analyzing samples for
zirconium at low concentrations.
3.5 Operation of the Argon Purification System 4 The argon purification system, described earlier, was modified by
the addition of a parallel'purificationsystem (Englehard Deoxo Puri-
fiers, Models D and C in series). The purpose of this modification was to evaluate the effectiveness of Englehard units relative to that of the regular purification train, which consists of a bed of molecular sieves followed by a bed of uranium turnings at 650~~.
The Delphi trace oxygen analyzer indicated-an oxygen concentration of 3.6 ppm in the argon stream leaving the Deoxo 'units, as compared
with a value of 1.6 ppm measured in the argon stream leaving the regular
purification train. The comparison was not completely conclusive, how- ever,.because of the possibility of.slight air inleakage and the possi-
.bility of catalyst poisoning in the Deoxo units. The Delphi analyzer had also shown symptoms indicative of silver cathode poisoning, although it had been restored to service by heating the cathode grids to 800~~
p in air to remove suspected surface contamination. Recurring failure of the Delphi analyzer militated against our obtaining a reliable compari- son of the two purification systems. Prior to the first evidence of
maloperation, the Delphi analyzer indicated that the regular purification system was reducing the-oxygen level from about 0.75. ppm in the inlet
argon stream to about 0.2 ppm in the outlet stream.
Measurements of the same argon streams showed water contents of ~0.1 ppm; the concentrations were,usually ~0.01 ppm. It was observed, however, that the water concentration indicated by each of the Pana-
metrics probes tended to diminish over a period of many weeks. This suggested that the calibration was shifting downscale with time, since a new probe installed in the same location would generally indicate a significantly higher concentration (i.e., 2 ppm vs 0.01 ppm).
Despite the difficulties experienced in measuring the level of oxygen and water in the purified argon, the concentrations were estab- lished to lie within .limits which were acceptably low.
.
?
c
l

21
4. DEVELOPMENT OF THE METAL TRANSFER PROCESS: INSPECTION OF EXPERIMENT MTE-2
E, L, Youngblood L. E. McNeese
It has been found that rare earths distribute selectively into mol-
ten LiCl from bismuth solutions-containing rare earths and thorium, and an improved rare-earth removal process based on this observation has
been devised. 9 Work that will demonstrate all phases-of the improved rare-earth removal method, which is known as the metal transfer process, is presently under way. ~
We previously 10 carried out anengineering experiment (MTE-1) for studying the removal of rare -earths from single-fluid MSBR fuel salt by this process; During' the experiment, approximately 50% of the lanthanum
and 25% of neodymium originally present in the fluoride salt were removed at about the expected rate. Surprisingly, however, the lanthanum and
P
neodymium removed from the fluoride salt did not accumulate in the Li-Bi solution used for removing these materials from LiCl. It is believed that reaction of impurities in the system.with the rare earths caused
this unexpected behavior.
A second engineering experiment (M!TE-2) was recently completed. 11,12
A brief description of the equipment used-for this -experiment and the results of an inspection carried out after compleeion of the experiment are presented inthe remainder of this section. ,
.4.1 Description of Equipment
Experiment MTE-2 was performed in a vessel constructed of G-in.
.
0
sched 40 carbon steel pipe: The outside of the vessel was spray coated with-a 20-mil thickness of nickel aluminide for protection against oxi- / dation. The vessel, shown schematically in Fig. 3, was divided into two '! compartments by a partition (constructed.of l/&in.-thick carbon steel . plate) ‘that extended to within l/2 in. of the bottom of the vessel. The two compartments were interconnecte.d by a 2-in,-deep'pool of bismuth
LJ LJ that was saturated with thorium. that was saturated with thorium. One compartment contained a 3.6-b.- One compartment contained a 3.6-b.- deep pool of fluoride salt (72-16-12 mole % LiF-BeF2-ThF4 to which 'j' mCi deep pool of fluoride salt (72-16-12 mole % LiF-BeF2-ThF4 to which 'j' mCi
-
. .
’ ,’ ' ,'

22
O R N L O W 0 70-12503-Rl .
CARBON-STEEL PAR TIT 10 N
\ 72-16-12 MOLE O h -
FUEL CARRIER SALT
Th-B i
-CARBON-STEEL PUMP WITH MOLTEN Bi CHECK VALVES
c 6 - i n . C A R B O N - S T E E L PIPE
24 in.
/-LiCl
r L i - B i
Fig. 3. Carbon S t e e l Vessel Used for Metal Transfer Experiment MTE-2.

w ‘ i
5
23
of lfr7 Nd and sufficient LaF3,were added to produce a 0.3 mole % concen-
tration) above the Th-Bi phase. The other compartment contained a 4.2-
in.-deep pool of molten LiCl above the Th-Bi phase. The LiCl compart-
ment also contained a cup (1.94 in. in diameter, 8.25 in. high) which was initially filled to a depth of 4 in. with a 35 at. % Li-Bi solution.
The 'cup was constructed of 0.031-in .-thick carbon steel sheet metal and
was held in place by a holder made of 2-in. sched 40 carbon steel pipe.
Alumina spacers were used to electrically insulate the cup from the holder.
During operation, LiCl was circulated through the cup containing
the Li-Bi solution via a pump constructed of 1-1/2iin.-diam carbon steel pipe (0.083-in. wall thickness). The pump used molten bismuth as check
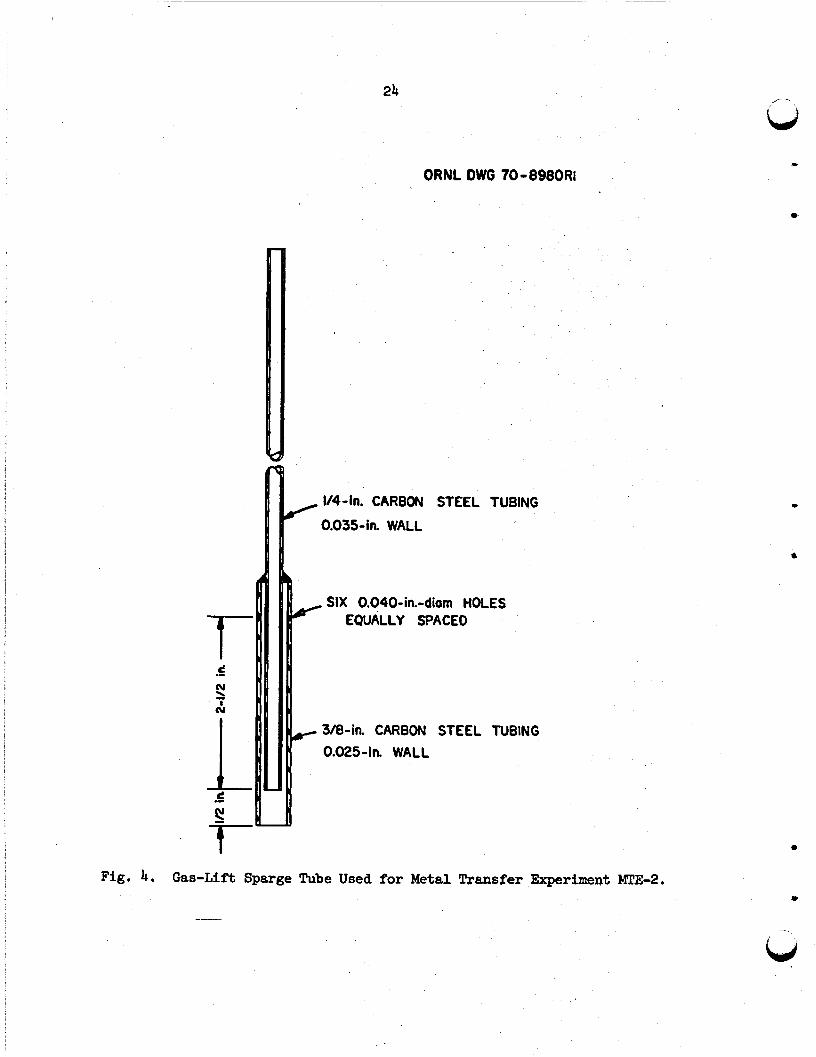
valves. 9 During the 3.3-month period in which the experiment was in operation, 702 liters of LiCl was circulated through the cup containing the Li-Bi solution. Gas-lift sparge tubes were used in both compartments
of the vessel and in the cup containing the 'Li-Bi solution to improve contact between the salt and metal phases. The sparge tubes were con- structed of l/b-in. carbon steel tubing which was placed inside 3/8-in.
tubing as shown in Fig. 4. Thermowells, constructed of l/4-in.-diam carbon steel tubing, extended into the salt and bismuth phases for
temperature measurements. The lower section of the vessel was maintained
at the operating temperature (650 to 66OOC) by an 8-kW furnace. The upper 6 in. of the vessel was wrapped with a cooling coil through which
water was circulated in order to maintain the flange at about 100°C.
The equipment.performed satisfactorily during operation. At the
completion of the experiment, the vessel was cooied to room temperature,
with &he salt and bismuth phases in place, and was cut apart for inspec-
tion.
4.2 Inspection of Equipment
The vessel was removed from the furnace and the exterior of the
vessel, shown in Fig. 5, was visually inspected. Some blistering and I
cracking of the 20-mil-thick nickel aluminide coating had occurred during the 2370-hr period that the vessel had been held at about 650'~. However,
..
24
ORNL DWG TO-8980Rl
, , - -
U
.
l/4-in. CARBON STEEL TUBING
0.035-h WALL
- SIX 0.040-in.-diam HOLES P EQUALLY SPACED
318-h CARBON STEEL TUBING
111 0.025-in. WALL
Fig. 4. Gas-Lif't Sparge Tube Used for Metal Transfer Experiment MTE-2.

25
f
t
f
. . , _” il.ea*_ . . , _” il.ea*_
PHOTO l&i4 t- -: PHOTO l&i4 t- -: ., :._ .x ., :._ .x
Fig. 5. Fig. 5. Photograph Showing External Air Oxidation of the Exterior Photograph Showing External Air Oxidation of the Exterior of the Carbon Steel Vessel Used for.Experiment MTE-2. The exterior of of the Carbon Steel Vessel Used for.Experiment MTE-2. The exterior of the vessel had been coated with 20 mils of nickel aluminide to retard the vessel had been coated with 20 mils of nickel aluminide to retard air oxidation. air oxidation.
Li ,

26
the external oxidation that had occurred did not cause difficulty with the experiment.
To facilitate inspection of its interior, the vessel was cut in such a manner that the lower 11 in. on each side'of.the partition could be removed to expose the salt and metal phases. A view of the fluoride compartment is shown in-Fig. 6. The fluoride salt and Th-Bi phases appeared.to be clean and free from any accumulation of material at the
salt-metal interface; however, the vapor region of the fluoride compart- ment was covered with a black powder.having the composition (by weight)
of: 2.4% Li, 2.2% Be, 70.2% Bi, 1.1% Th, 0.02% Fe, and 19.9% F. The deposit'was greatest (about l/8 in. thick) in the cooler portions of
the compartment near the upper flange. Some of the powder had also discolored the surfaces of the salt that had contacted the vessel wall. The black powder is thought to be a mixture of salt and metallic.bis-
muth that had been entrained into the gas space by the argon sparge.
A view of the LiCl compartment (with some of the LiCl removed) and the Li-Bi container is shown in Fig. 7. The vapor region in the LiCl compartment was covered with a white powder consisting of LiCl containing 0.6 wt 3 Bi. This material is believed to have resulted from vaporiza- tion and from entrainment of LiCl and smaller amounts of bismuth in the
argon stream fed to the gas spargers. The LiCl and Th-Bi phases appeared to be clean, with no accumulation of impurities at the salt-metal inter- face as had been seen in metal transfer experiment MTE-1. 2
There were only two areas in the system where deposits containing unusually high concentrations of rare earths were found. A l/8-in.-
'thick layer of gray material (shown in Fig. 8) had deposited on the lip and overflow spout of the Li-Bi container.' This deposit had the following composition (by weight): 23% LiC+, 59% Bi, 10% La, and 2% Th. The lan- thanum contained in the deposit was equal to 5 to 10% of the lanthanum .- inventory in the system. The mechanism by which the material was depo- sited on the rim of the lithium-bismuth cup has not been determined; however, it may have resulted from the Li-Bi solution wetting the con- tainer wall and subsequently flowing,up it. The lanthanum could then
L
.
--. LJ

27
f .
F Fig. 6. Salt and Biskth Phases from the Fluoride Salt Compartment
on Completion of Metal Transfer Experiment MTE-2.

20
PHOTO 102035
Fig. 7. View of LiCl Compartment Following Metal Transfer Experiment MTE-2.

29
. , ! -
t
i
Fig. 8. View'of Upper Section of the.Li-Bi Container Showing Metallic Deposit on the Rim After Completion of Metal Transfer Experiment MTE-2.
.
.
5
30
have been deposited from the LiCl that was in contact with the metal film. The lanthanum concentration in the bottom layer of the Th-Bi solution was approximately eight times higher than that observed in filtered samples taken during the run; however, this does not, represent a significant fraction of the total lanthanum in the system. The bottom layer of the Th-Bi phase also contained 20 wt % thorium and is assumed ,to have been a mixture of thorium bismuthide particles and bismuth. 'The
higher lanthanum concentration in this material is not surprising since it has been shownpreviously 13 that rare earths distribute prefer- . ' I.
entially to the solid phase via formation of compounds of the type ThLaBiy.
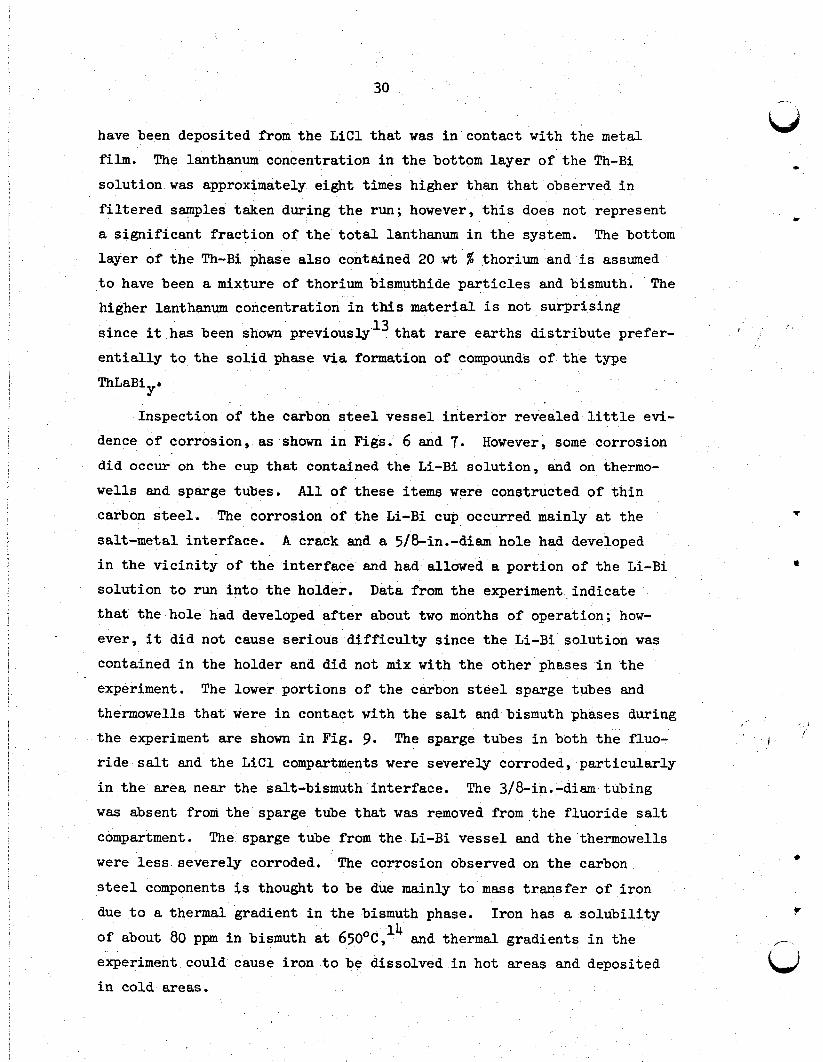
Inspection of the carbon steel vessel interior revealed little evi- dence of corrosion, as shown in Figs.' 6 and 7. However, some corrosion
did occur on the cup that contained the Li-Bi solution, and on thermo- wells and sparge tubes. All of these items were constructed of thin carbon steel. The corrosion of the Li-Bi cup occurred mainly at the salt-metal interface. A crack and a 5/8-in.-diam hole had developed in the vicinity of the interface and had-allowed a portion of the Li-Bi solution to run into the holder. Data from the experiment indicate that the hole had developed after about two months of operation; how- ever, it did not cause serious difficulty since the Li-Bi solution was contained in the holder and did not mix with the other phases in the
experiment. The lower portions of the carbon steel sparge tubes and
thermowells that were in contact with the salt and bismuth phases during the experiment are shown in Fig. 9. The sparge tubes in both the fluo- ride salt and the LiCl compartments were severely corroded, particularly
in the area near the salt-bismuth interface. The 3/8-in.-diam tubing was absent from the sparge tube that was removed from the fluoride salt
compartment. The sparge tube from the Li-Bi vessel and the thermowells
were less severely corroded. The corrosion observed on the carbon. steel components is thought to be due mainly to mass transfer of iron
due to a thermal gradient in the bismuth phase. Iron has a solubility of about 80 ppm in bismuth at 650°c, 14 and thermal gradients in the experiment could. cause iron to be dissolved in hot areas and deposited
in cold areas.
I
I
u
J , .I’
1

Fig. 9. Carbon Steel Sparge Tubes and Thermowells Removed After Completion of Metal Transfer Experiment MTE-2.

is acceptable.
32 .
The carbon steel pump, which used bismuth check valves., was in good ib) ,'
condition at the completion. of the experiment. Figure 10 shows a view i' w of the lower portion of the pump after it had been sectioned to show the
bismuth check valves. Little evidence of corrosion could be found by visual examination of the pump. There was no appreciable loss of bis- muth from the check valves by its entrainment in the LiCl during the experiment. The bismuth in the top check valve contained 130 ppm of Li, less than 56 ppm of Th, and less than 20 ppm of La after 702 liters of LiCl had been circulated through the pump.
While carbon steel is not being considered as a material of con-
struction for an MSBR processing plant , it appears to be suitable for use in experiments such as MTE-2, where a limited amount of corrosion

Fig. 10. Lower Portioti pf the Carbon Steel Pump Us&in Metal Transfer Experiment MTE-2. The pump has been sectioned to show the bismuth check valves.

34 :
5: DEVELOPMENT OF THE METAL TRANSFER PROCESS: AGITATOR TESTS FOR EXPERIMENT MTE-3
E. L. Youngblood W. F. Schaffer; Jr.
_ u *
Mechanical agitators will be used to promote contact of the salt and metal phases in metal transfer experiment MTE-3, which is currently
being designed and constructed. 15 The shaft seals for the agitators must t i '
be capable of operating in.a dry argon atmosphere and must have a low leakage rate in order to prevent air and moisture from entering the exper- iment. Equipment has been constructed in order to test the shaft seal design that is proposed for use in metal transfer experiment MTE-3. The system will also allow us to measure the extent to which bismuth is
entrained in salt in a mechanically agitated system and to evaluate a
vapor-deposited tungsten coating as a means for protecting carbon steel from corrosion by molten salt and bismuth.
5.1 Description of Equipment
Figure 11 shows the test equipment before installation of the elec-
trical heaters and.thermal insulation. The agitator drive assembly (shown
in Fig. 12) consisted of a l-l/k-in.-diam stainless steel shaft held in position by two ball bearings that were separated by a distance of 4 in. After passing through the ball bearings, the shaft diameter.was reduced
to 1 in.; the shaft passed through two Bal-Seals (product of Bal-Seal
Engineering Co.) before entering the test vessel. The seals were con- strutted of graphite,-impregnated Teflon and were spring-loaded in order to hold the sealing surface against the shaft. The portion of the shaft
that was in contact with the seals was plated with chromium and polished
to a 10: to 12-pin. surface that would produce satisfactory sealing.
The region between the two seals was pressurized with,argon in order to reduce the rate of air inleakage past the seals. A 4-in.-long cooling
water jacket was located below the shaft seal as a means of protecting the seals from damage by heat from the lower portion of the system (which operates at 650°c),. A thermowell was provided for measuring the temper-
ature in the vicinity of the seals.
I i
t
1
,--
LiJ
- -

35
t
? Fig. 11. Agitator Test System Used for Testing the Shaft Seal Proposed for Use in Metal Transfer-Experiment MTE-3.

Fig. 12. Agitator Drive Unit and Seal Assembly.
. b (1

The agitator used for the test,.shown in Fig. 13, was machined from i a single bar of molybdenum. The agitator shaft was 12.31 in. long and
had a diameter of 0.5 in, Separate blade assemblies were located in the salt and bismuth phases. Each assembly had a diameter of 1.12 in. and
a height of 0.5 in.; each blade was 0.13 in. thick. The upper end of
the agitator was threaded to facilitate its attachment to the drive unit.
The vessel used to contain the salt and bismuth for the agitator
test was constru&ted of 3-in-. sched 80 carbon steel pipe (ASTM A 106 Grade B). A standard pipe cap was used for the bottom of the vessel. The overall length of the vessel was 20.8 in. Four baffles (3 in. long, l/2 in.' wide) were welded to the inside of the vessel beginning at a
point 2-l/4 in. above the bottom of the vessel. A l/b-in. sched 40 pipe was attached to the side of the vessel to allow sampling of the salt and bismuth phases, and a l/b-in. pipe was attached to the bottom to allow the salt and bismuth to drain from the vessel. The lower 10 in. of the vessel interior was coated with tungsten in order to evaluate the effec-
tiveness of this type of coating for reducing corrosion in systems con- taining bismuth.
In applying the tungsten coating, the inside.of the vessel was first plated with nickel (approximately 1 mil thick) by electrodeposition. The
,nickel layer was bonded to the vessel by maintaining the vessel in vacuum at 800'~ for 4 hr.. Heaters were then installed on the vessel, and the tungsten coating was vapor deposited from a H2-WF6 mixture. 16 The temper-
'ature of the vessel varied from about 400 to-650'~ along its length during the coating operation; consequently, the coating thickness varied from 0.004 to 0.020 in., with the thickest deposit'being located near the bottom of the vessel. .Figure 14 shows a view of the interior of the i'
vessel after the coating had.been applied. Examination of the coating
with a borescope revealed no obvious signs of cracking or blistering. 1
The exterior of the carbon steel vessel was spray coated with a 20- mil,layer of nickel aluminide in an effort to retard air oxidation. How- :
ever, before the nickel aluminide was applied, half of the vessel was first sprayed with stainless steel to determine whether such a coating
would provide improved protection against oxidation. During operation,
. /

38
* - _.
Y
-. ,,.
w

39
Fig. 14. In&de of Test Vessel Showing Tungsten Coating. .

40
the lower section of the vessel was heated with tubular electric heaters. The upper section of the e.quipment was equipped with a cooling coil in order to maintain the shaft seal temperature at about 50°C. The agitator was driven by a-l/4-hp variable-speed motor that was coupled directly
to the drive unit.
5.2 Experimental Results
The shaft seals used in the first test were Bal-Seal No. R304A- (SZ)G120. The agitator was initially operated at ,200 rpm for 100 hr with
no salt or bismuth in the system. During the first 50-hr period them
0
.
vessel was held at room temperature; during the remaining 50 hr, temper- atures for the vessel and the seal were maintained'at 6509,and about 50°C respectively. Throughout the test, the .seal leakage rate was deter- mined by pressurizing the region between the two seals with argon and measuring the rate of decrease in pressure when the argon supply was shut
off. The seal leakage rate during the first 100 hr, as measured at 1 atm and ambient temperature, was about 3 cm3/hr. The internal pressure
in the region between the seals was 15 to 20 psig initially.
After the initial testing of the seal, 3549 g of purified bismuth
and 915 g of fluoride,salt (72-16-12 mole %. LiF-BeF2-ThF4 to which 0.3 mole $ LaF 3 had been added) were charged to the system. The salt-bismuth
'interface was located at a point about 1 in. above the lower agitator blades, and the.salt-gas interface was located about 1 in. above the
upper agitator blades. During the following one-month period, the agi- tator speed was increased.stepwise from 150 to 750 rpm; the salt and
bismuth phases were maintained at 650'~. The operating time at each
speed is summarized in Table 5. During most of the test period, the
seal leakage rate remained constant at about 10 cm3/hr; however, near
the end of this period it increased to greater than 100 cm3/hr.
After a total operating period of 845 hr, the salt and bismuth
were drained from the system and the sealswere removed for inspection. The upper seal was found to be badly deteriorated, while the Teflon
had worn through to the spring in some areas. The lower seal, although slightly worn, appeared to be in good condition. Evaluation of various
1:
LJ

Li 3
41
Table 5. Operating Time During Tests of Ral-Seal No., R304A-(SZ)G120 Shaft Seals
2 Agitator Speed Operating Time (mm) ml
No Salt or 3ismuth in System
200 100
Salt and Bismuth in System
150 50 200 48 300 148
500 360
750 139 Total 845.
f
t seals wascontinued without the use of salt and bismuth in the system.
Short tests were made at agitator speeds of 100 to 500 rpm using Ral- Seals having a light expander spring; however, these seals leaked exces- sively and were replaced with EM-Seals (No. R3-6A-(1;OOO)G) having a moderate expander spring and a thicker cross section than the seals used initially. The leakage.rate using these seals was satisfactory, and testing was continued at ambient temperature for 70 days using agitator
.speeds of 150 to 300 rpm. During the first 31 days of operation, the rate gradually increased from 0.3 cm3/hrto 2.cm3/hr. At that time, 1 cm3 of mineral oil was injected into the region between seals to determine whether this would reduce the seal leakage rate and increase
the seal life. After the oii had been injected, the leakage rate decreased to 0.05 cm3/hr; During the next.24 days of operation, however, it grad-
ually increased to G.4.cm3/hr. ~A second injection of 1 cm3 of oil between the seals resulted in a decrease in the leakage rate to 0.02 lm3/hr, and confirmed that the use of oil is effective in reducing the seal leakage rate.

42 : u
After 71 days of operation the seals were removed for inspection. Although both seals showed some wear, a sufficient wall thickness remained to allow a considerably longer operating time, Basedon these test
results, it was determined that this type of seal is acceptable for use in metal transfer experiment MTE-3.
t
. :'
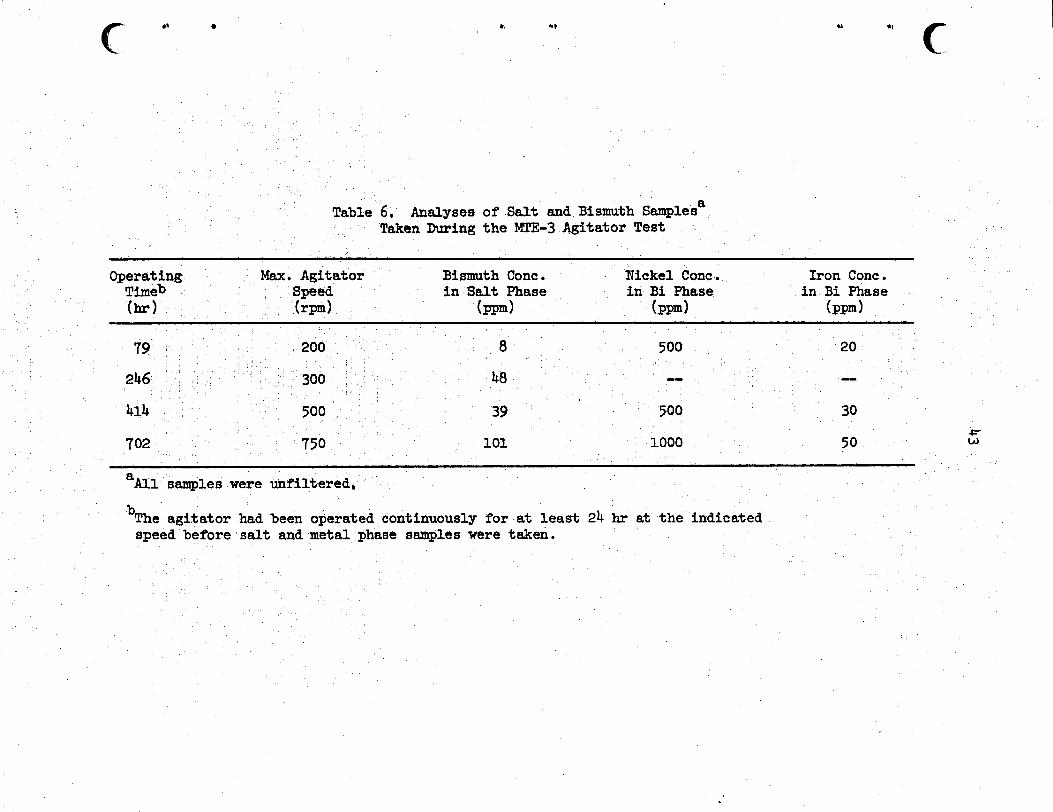
At intervals throughout the period during which salt and bismuth were present in the system, unfiltered‘samples of the salt phase were taken to determine the extent of bismuth entrainment in,the salt. Also,
unfiltered bismuth samples were taken for nickel and iron analyses in order to determine whether the tungsten coating was intact: During the test, the bismuth content of the salt increas-ed from 8 ppm to 101 ppm as shown-in Table 6; however, there was no indication that large quan-
tities of bismuth were being entrained in the salt. The purified bismuth dharged to the experiment contained 10 ppm of iron and less than 20 ppm
of nickel. During the test the concentration of‘nickel in the bismuth increased to about 1000 ppm (shown in Table 6), which indicated that
the bismuth had penetrated the tungsten coating. The concentration of iron in the bismuth phase increased-from 20 ppm to 50 ppm (the approx-
imate solubility of iron in bismuth at 650~~ during the test. The tungsten and molybdenum concentrations in the bismuth remained below 20 ppm and 10 ppm, respectively, throughout the test..
After completion.of the agitator test, the equipment was disassembled for inspection (see Fig. 15). During operation, the vessel and agitator :i'
had been maintained at 500 to 650”~ for a period of 1150 hr, and salt and 'bismuth had been present in the system for 1005 hr. Visual examination
revealed no evidence of corrosion. The portion of the agitator submerged in the'bismuth phase had been wet by the bismuth. Also, droplets of salt
and bismuth could be seen clinging to the agitator shaft at points above the salt surface. The upper portions of the shaft and the drive unit * were covered with a black material that may have formed as the result
of decomposition of oil from the shaft seals.
The tungsten coating on the inside of the vessel was examined by CI
members of the Metals and Ceramics Division. 17 The nickel plate and tung-
sten coating were found to be intact and adherent in two samples taken cd
,
c l r . * ., .\ ., c
Table 6, Analyses of Salt and Bismuth Samples" Taken During the MTE-3 Agitator Test
Operating Max. Agitator Timeb Speed (Id (rpm)
Bismuth Cont. Nickel Cow. Iron Cont. in Salt Phase '. in Bi Phase in Bi Phase
(mm) (Ppm) (Ppm)
79 ~ 200 a 20 500
246 me mm 300 48
* 414 500 39’ 500 30
101 -702 750 1000 50 I5
&Al.1 samples Were unfiltered.
b The agitator had been operated continuously for at least 24 hr at the indicated speed before wilt and metal phase samples were takeri.

. 1
. . - - . “ . . . . I ” . r . . , l ” _ “ .
PHOiO 1099-71 . .
f
c I * . 4 c , 4 cl?

45
;
c
from the main vessel. However, cracks in the coating were noted in
several places, and there was evidence thatbismuth had penetrated these cracks and had attacked the nickel substrate. The cracks are thought to be the result of thermal cycling since the coefficients of
thermal expansion of the tungsten coating and -iron vessel are consid- erably different. In samples taken from the l/k-in. drain line at the bottom of the vessel, the tungsten coating was not in contact with the
metal substrate and the nickel layer was absent. 'The carbon steel was also attacked to a depth of about 2 mils in that area. Although the nickel and tungsten coatings were fairly adherent in the l/b-in. sample
line attached to the side of the vessel, numerous cracks were found in the tungsten coating. It was concluded from examination of the vessel
that complete protection of a vessel of.this type from exposure to bis- muth by tungsten coating will be difficult because of the tendency of
such a coating to crack. However, although considerable dissolution of the nickel coating had occurred, attack on the carbon steel base metal was relatively minorin the- samples examined,
The nickel aluminide coating on the.exterior of the vessel appeared to be in good condition after the test; however, the vessel was not held at elevated temperature for a sufficiently long period to determine whetherthe use of the stainless steel coating under the nickel aluminide on half of,the vessel was beneficial.

: 46..
c_i 6. DISIRIBWION OF RADIUM BE!CWEER LiCl AND Li-Bi SOLUTIONS
v E. L. Youngblood L. E. McNeese
Radium is present at trscer levels in metal trsnsfer process experi-
merits as a decsy product of thorium. Radium would be expected to have
distribution characteristics similar to those for divalent rare-earth fission products (Sm 8nd Eu) and alkaline-earth fission products (Sr and Ba). Thus, it is of interest to obtain information concerning the behavior of radium in metal trsnsfer systems.
'!
Data relative to the distribution of radium between molten LiCl and .lithium-bismuth solutions containing from 13 to 35 mole %J lithium, obtained
_ during metel transfer experiment WE-2, were reported previously. 12 After
the czmpletion of metal transfer experiment MIX-2, a portion of the Li-Bi solution from'the experiment (containing radium) was diluted with bismuth and contacted with purified LiCl 8t 650~~ in order to,obtain 8ddition8l distribution data for radiuuett lower concentrations of lithium in bismuth. These data are discussed In the remainder of this Section,
* . 6.1. Description of Equipment
The distribution coefficient measurements were made in a [email protected]
vessel constructed of 2-l/8-in.-diam carbon steel tubing. A thermowell and 8 gas-lift sp8rge tube, also constructed of carbon steel, were installed
in-the vessel for temperature measurement and for contacting the salt and m&l phases. The carbon steel vessel conttining the LiCl and LiiBi phases
w8s enclosed in a heated, $-in.-diam stainless.steel vessel which was maintained under an argon atmosphere. Semples of the salt and metal phases
could be taken by the method described previously. 18 Before the LiCl and
the Li-Bi solution contsining radium were charged to the system, the &-bon steel vessel snd bismuth were contacted with hydrogen at 650~~ for 12 hr to remove oxide impurities. TChe LiCl wss purified in a separate
vessel by contact with bismuth that had been saturated with thorium 8t : 650~~.
t
.

u f
5
5
i
47
I Initially, 272.4 g of Li-Bi solution from metal transfer experiment
MTE-2 was charged to the system along with 484.0 g of purified bismuth and 97.0 g of purified LiCl. The system was then heated to 650~~ and
maintained at that temperature during the subsequent operations. Samples
were taken periodically of the LiCl and Li-Bi phases for determination of the radium concentrations in the phases. The radium content of the
samples was determined by counting the 0.9-MeV gamma radiation emitted by the 228 AC after a decay Deriod.of about 24 hr to ensure that the 228Ac
(half-life, 6.13 hr) was in secular equilib.rium with the 228Ra.
6.2 Experimental Results
Samples of the LiCl and Li-Bi phases were taken 23 hr and 70 hr
after the temperature-of the system had reached 650'~. The concentration
of lithium in the Li-Bi solution.was then lowered by the addition of 193.0 g of purified bismuth, and additional measurements were made over
a period of 408 hr. Distribution coefficients* were calculated from the data obtained. The results are given in Table 7.
In previous studies of the distribution of materials between fluorides,
chlorides or bromides, and bismuth solutions, Ferris et al. 1g'20 have -- determined that distribution coefficient data can.be'correlated in terms of the lithium concentration in the 'bismuth phase according to the following relation:
where log DM = n leg DLi + log .KM , ~.
DM = .distribution ratio for material
= %(Bi)'%(salt)' 1
%(Bi) = concentration of material M in bismuth phase, mole fraction,
%l(salt) = concentration of halide of,material M in halide salt, mole fraction,
n = valence of material M in halide salt, distributioncoeff&ient for lithium,
constant dependent on material M.
+ Distribution coefficient is defined as the ratio of the mole fraction of radium in the metal phase to -the mole fraction in the salt phase at equilibrium.
;..

-_ -
Table 7. Data for Radium Distribution Between LiCl, and Lithium-Bismuth Solutions at 650~~
Equilibration Lithium Cont. Radium Content
LiCl Li-Bi Time (.hr )
in Bismuth Phase Phase . Phase Distribution (mole fraction) (counts min-1 g-l) (counts min-I- g-l) Coefficient.
23 0.05 24.0 764 0.15
803 0.12 70 0.049’ 19.6,
193 .O g'of bismuth added to the Li-Bi phase 96 0.032 12.2 $36 0.08 z
239 0.035 13.0 784 0.08
408 0.035 12.4 821 0.07'

Thus, at a given temperature, a plot of the logarithm of the distribution
coefficient for radium vs the logarithm of the mole fraction of lithium in the bismuth phase should give a straight line having a‘slope equal to the valence of radium in the LiCl phase.. Figure 16 shows radium dis- tribution data from this experiment and previously reported data from metal transfer experiment NTE-2, along with the line having a slope of
2vthat best fits the data. It is seen that the distribution data can be
;
z
correlated quite satisfactorily by assuming that radium is divalent in the LiCl phase.
It should be noted that only about 30% of the distribution data from
metal transfer experiment MTE-2 is'based on LiCl samples taken from the
Li-Bi alloy container, while the remainder is based on samples taken from
the main LiCl pool. We believe that the LiCl and Li-Bi phases in the Li-Bi
container were essentially at equilibrium at all times; however, during the early stages of the experiment, the main LiCl pool and the Li-Bi phase
would not have been at equilibrium with respect to the distribution of radium. Forthis reason, the data based on LiCl samples from the Li-Bi alloy container and from the main LiCl pool during the latter part of
the experiment were weighted more heavily in correlating the information than data based on LiCl samples taken from the main LiCl pool early in the experiment. The distribution coefficient data for radium at 650~~ in the LiCl--Li-Bi system can be represented by the following relation:
log D = 2 log NLi-+ 1.757 , (6)
where D .= radium distribution coefficient, and
NLi = the -mole fraction of lithium in the bismuth phase.
A comparison of the relation summarizing the -radium distribution data .20,21 and previously reported distribution data for Sm, Eu, Ba, and Sr is
shown in Fig. 17. As expected, the distribution characteristics for radium are quite similar to those of the divalent rare-earth and alkaline- hearth fission products; in fact, the data for-radium and barium are almost
identical.
i I 1 .
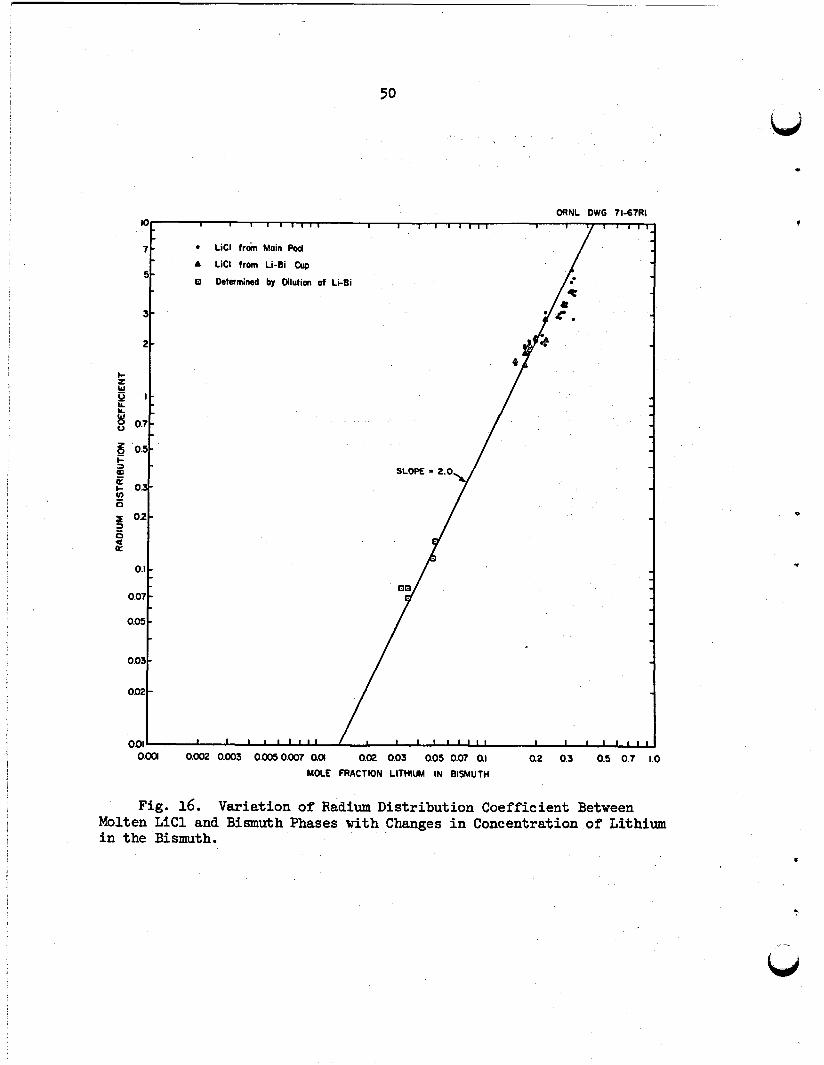
50
7-
5-
3-
2-
I- E P I-
1 0.7-
6 ‘0.5-
5
E c OJ- E 0
f O2
I: a
0.1 -
0.07 -
0.05 -
0.03 -
om-
ORNL OWG 71-67RI 1
. LiCl train Main Pod
A LiCl from Li-Bi Cup
D DctWmined by Oilution of Li-Bi
0.01’ I 1 I,,,,,, I I I I11111 I I I I,,,,
O.OOl 0.002 0.003 0.005 0.007 cka 0.02 0.03 0.05 0.07 QI a2 0.3 0.5 0.7 I.0
MOLE FRACTION LITHIUM IN BISMUTH
Fig. 16. Variation of Radium Distribution Coefficient Between Molten LiCl and Bismuth Phases with Changes in Concentration of Lithium in the Bismuth.

51
?-
s-
l
J-
2.
Lo-
5 ox- B 0,: !i - 0
e” 2-
0’ 02-
E k s
0.1 -
0.07 -
o.os-
0.0s -
on2 -
0.01 o.oa
MOLE FRACTW Llfb~~ IN BISMUTH
Fig. 17. Variation of the Distribution Coefficients for Sr, Ba, Ra, Eu, and Sm in the LiCl-Bi Alloys with Changes in the Concentration of Lithium in the Bismuth Area.~
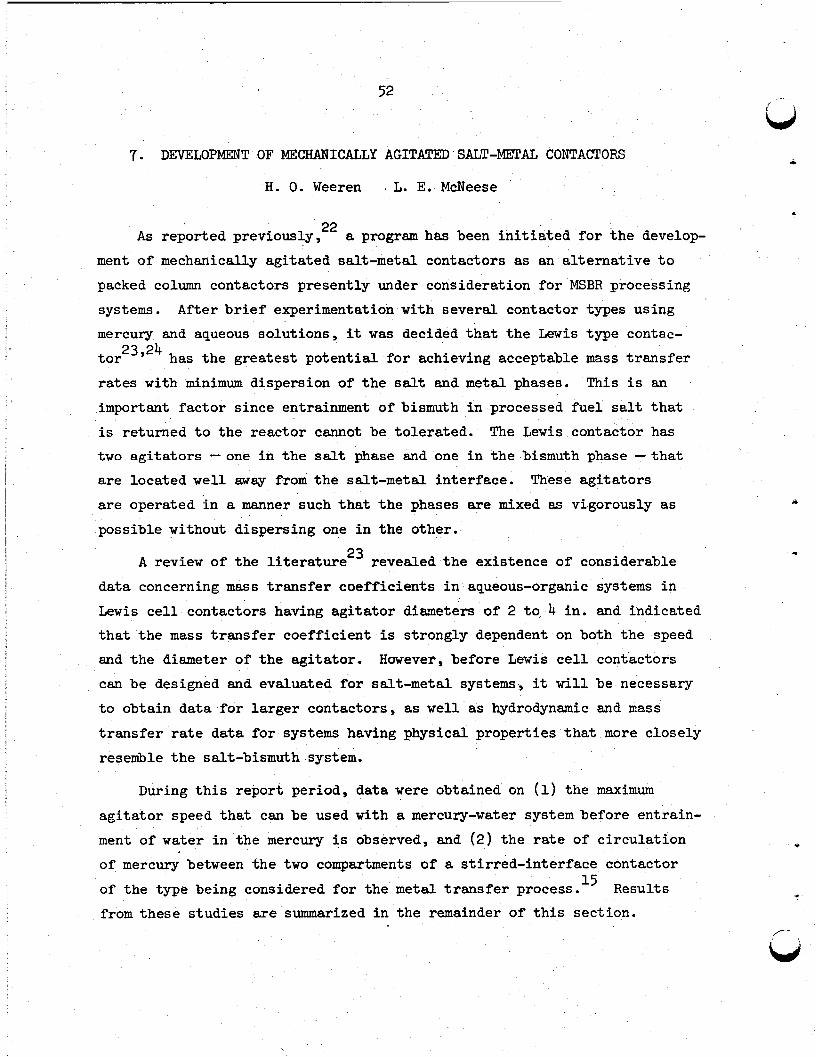
7. DEVELOPMENT OF MEXHANICALLY AGITATED SALT-METAL CONTACTORS
H. 0. Weeren , L. E.-McNeese
As reported previously, 22 a program has been initiated for the develop- ment of mechanically agitated salt-metal contactors as an alternative to
packed column contactors presently under consideration forMSBR processing
systems. After brief experimentation with several contactor types using mercury and aqueous solutions, it was decided that the Lewis type contac- tor23 24 has the greatest potential for achieving acceptable mass transfer rates with minimum dispersion of the salt and metal phases. This is an
important factor since entrainment of bismuth.in processed fuel salt that is returned to the reactor cannot be tolerated. The Lewis contactor.has two agitators -one in the salt phase and one in the bismuth phase -that are located well away from the salt-metal interface. These agitators are operated in a manner such that the phases are mixed as vigorously as
.possible without dispersing one in the other.
A review of the literature 23 revealed the existence of considerable
data concerning mass transfer coefficients in aqueous-organic systems in Lewis cell contactors having agitator diameters of 2 to 4 in. and indicated that the mass transfer coefficient is strongly dependent on both the speed
and the diameter of the agitator. However, before Lewis cell contactors
can be designed and evaluated for salt-metal systems, it will be necessary to obtain data for larger contactors, as well as hydrodynamic and mass
transfer rate data for systems having physical properties that more closely resemble the salt-bismuth system.
During this report period, data were obtained on (1) the maximum
agitator speed that can be used with a mercury-water system before entrain- ment of water in the mercury is observed, and (2) the rate of circulation of mercury between the two compartments of a stirred-interface contactor
of the type being considered for the metal transfer process. 15 Results from these studies are summarized in the remainder of this section.
i
c
f /-- u

53
7.1 Studies for Determination of Limiting Agitator Speeds
Preliminary tests were carried out in contactors of several sizes and,with different agitator configurations in order to determine the factors that kill limit the agitator speed in stirred-interface contactors.
The contactors used in these tests contained two compartments and were of the type .shown schematically in Fig. 18. Aqueous solutions and mercury or a low-melting alloy were used to simulate molten salt and bismuth during the studies. It was found that the common factor that limited the agitator speed was the transfer of water between the two compartments via entrainment in the circulating metal phase. For a given contactor
and agitator configuration, this'phenomenon was found to begin at a defi- nite agitator speed; below this speed, no entrainment was observed. The tests were carried out in compartmented, cylindrical contactors having diameters of 5.5 and 10 in. and in a oompartmented, rectangular contactor
measuring 12 x 24 in. In each case, the vessel contained no baffles and a single four-bladed paddle was 'used in the metal phase on one side of
. the contactor.
The limiting agitator speed was found to be essentially independent of the size and shape of the contactor vessel but strongly dependent on the diameter of,the agitator. Data obtained during these studies are summarized in Fig. 19, where it is seen that the -allowable agitator speed
is inversely proportional to the 1.43 power of the agitator diameter. Since the Lewis correlation 24 25 indicates that the mass transfer coeffi- cient is dependent on the agitator diameter to-the'3.7 power, it appears
that at speeds slightly below the limiting agitator speed the mass transfer coefficient will be dependent on the agitator diameter to the 0.94 power.
Thus, it should be advantageous to- operate a contactor having the largest -possible agitator diameter.
.
.
LJ
.It should be noted that the d&a shown in Fig. 19 are valid only for the operating conditions under which they were obtained. The use of baffles., canted agitator blades rather than straight blades, an agitator
on each side of a contactor, or other changes in the cell design could
make a considerable difference in the limiting agitator speed. The
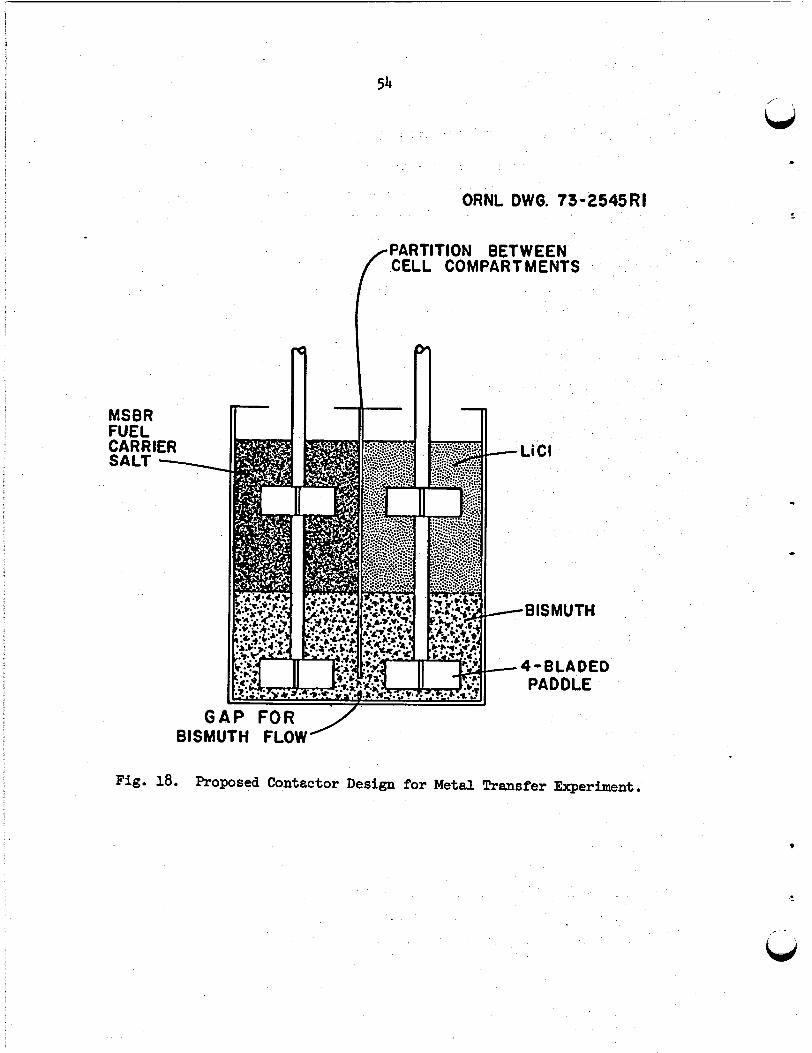
MSBR FUEL CARRIER SALT \
ORNL DWG. 7302545Rl 1
f PARTITION 6ETWiEN CELL COMPARTMENTS
4-BLADED PADDLE
GAP FOR BISMUTH FLOW
Fig. 18. Proposed Contactor Design for Metal !Crassfer Experiment.
.

ORNL 73-2544 R2
10
’
i 9- 8- 9- 8- f- ,. f-
8 8-
i5
Fi Fi
! .,
0 0 CYLINDRJCAL CYLINDRJCAL CONTACTOR 5.5 IN. DIAM.
3 3 A CYLlNORlCAL A CYLINDRICAL CONTACTOR IO IN. DIAM. m m2 2-
+’ RECTANGULAR +, RECTANGULAR CONTACTOR 12 in. I 24 in.
LiMltlNG AGITATOR SPEED (rpm)
Fig. lg. Correlation of Limiting Agitator Speed with Blade Diameter in Several Contactors.

following observations relative to this point were noted during the .studies:
(1)
w
The limiting agitator speed was relatively independent of the vertical position of the paddle in the mercury phase as -.
(2)
(3)
(4)
(5)
long as the paddle was located well below the mercury-water interface. However; when the paddle was located near the interface; the limiting speed was decreased appreciably.
The limiting agitator speed was appreciably higher when the
bismuth phase in each compartment of the contactor was agitated than when the bismuth in only one compartment was agitated.
For example, the difference in limiting agitator speeds for a 3-in.-diam agitator blade was about 60 rpm. The limiting agitator speed was essentially unaffected by the degree of agitation of the aqueous phase.
The size of the opening below the partition that separated the two contactor compartments could be increased from 0.25 in.
to 0.75 in. without appreciably affecting the limiting agitator speed. On the other hand, the limiting agitator speed was reduced considerably as the separation distance was increased above 0.75 in.
The use of baffles or the location of the agitator at an off- center position increased the limiting agitator speed: This effect was more important with small-diameter agitators, where'
the variation in limiting agitator speed was about 30$, than with large-diameter agitators, where the difference was only about 10%.
When the agitator blades were canted rather than being vertical
and when the direction of rotation was such that the agitator lifted the mercury phase, a considerably higher agitator speed .could be attained without entrainment of water between the two compartments of the contactor. 'The limiting agitator speed under these conditions was about twice that shown in Fig. 19
for both 1.5- and 3-in.-diam agitators, but was only about

57
LJ 10% higher than the value shown for a 9-in.-diam agitator.
i The limiting agitator speed was found to be affected signif- icantly and unpredictably by baffles in the contactor.
A test was carried out using a low-melting alloy (Cerrolow 105) and water in a.heated contactor having a diameter of 5.5 in. in order to
determine the effect of.chsnges in the properties of the liquid phases on the contactor performance. The alloy (42,9-i1.7-8.0-5.0-18.3-4.0 .ti
% Bi-Pb-Sn-Cd-In-Hg) has a specific gravity of 8.1 and a liquidus tem- perature of about 38*~. At an operating temperature of ~o*c, the limiting agitator speed was essentially identical to the limiting speed observed with.the mercury-water system. Thus, it appears that the limiting agitator speed is not highly dependent on the difference in densities'of the two
liquid phases. This observation increases our confidence inpredicting
the performance of a bismuth-salt system at 650~~ by extrapolating data obtained with a mercury-water 'system.
It was concluded that these data constitute sufficient information
for designing the salt-metal contactor for experiment MTE-3 and for
,
suggesting the limiting agitator speed to be used with molten salt and bismuth in the contactor at 650~~. It is believed that entrainment of salt in the bismuth will occur at essentially the same .agitator speed as was observed with the mercury+ater system (300 rpm) and that experi-
ment MTE-3 should-be operated initially with agitator speeds well below this value.
-7.2. Determination of Metal Flow Rate Across Contactor Partition
l
.
LJ
Proper operation of the'salt-metal contactor proposed for use with metal transfer experiment I@E-3 will require a bismuth circulation rate
of 0.5 liter/min or higher-between the two parts of the contactor. Two tests were carried out with agitator speeds of 195 rpm to obtain data
relative to this point.
In the first test, the agitator consisted of a four-bladed paddle
having vertical blades; in the second test, the blades were. canted at
45* in a manner such that the mercury was lifted toward the metal surface.

58 I
During each test, only one side.of the contactor cell was agitated. Ld
The
experimental technique consisted of temporarily preventing circulation of mercury between the two halves of the contactor, establishing a temper- ature differential between the mercury pools in the two compartments, and allowing resumption of the circulation of metal between the compartments. The rate of change of the.temperature of the mercury in one compartment was then measured in' order to determine the rate of mercury flow between the compartments. Results of previous tests had shown that the rate of
conductive heat transfer across the contactor partition and the rate of heat loss to the surroundings were negligible as compared with the rate of convective heat transfer resulting from circulation of the mercury phase between the two compartments.
A mathematical analysis was carried out to aid in interpretation of the experimentaImeasurements made for the purpose of determining the
rate of flow of mercury between the two contactor compartments. In
making the analysis,.the following assumptions were made:
(1) Only mercury is present in the contactor.
(2) Equal quantities of mercury are present in the two compartments.
(3) The mercury in compartment 1 is initially at temperature TR, and the temperature in compartment 2 is at temperature Th.
(4) Mercury circulates between the two compartments at a constant rate.
A heat balance on the mercury in compartment 1 yields the relation
where
VPC dT1 -= FptiT P dt P2
- FpC T P 1'
(7)
v= volume of mercury in each compartment, cm3,
P = density of mercury, g/cm3, C P
= heat capacity of mercury, cal/g*OC,
T1 = temperature of mercury in compartment 1 at time t, OC,
T2 = temperature of mer&ry in compartment 2 at time t, OC, i t = time, secI
F = mercury flow rate, g/set.
,- V‘
: t i i I
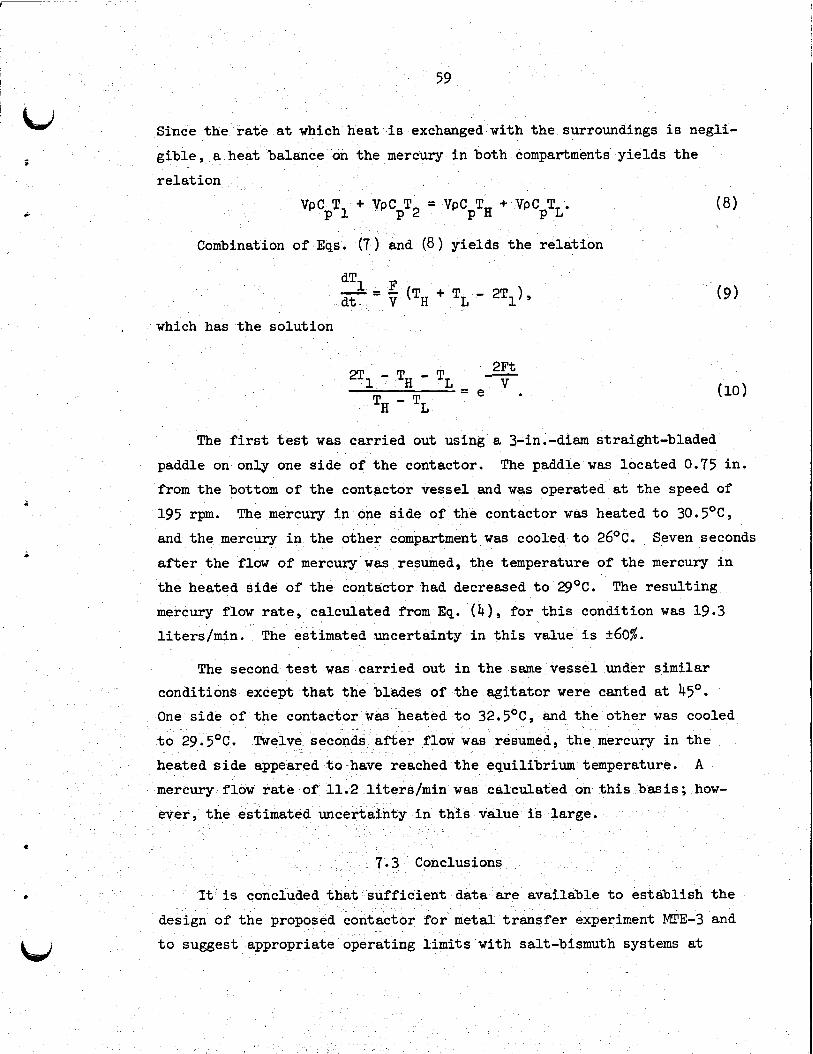
/ b,
i
2
i
59
Since the rate at which heat is exchanged with the surroundings is negli- gibie, a heat balance on the mercury in both compartments yields the relation
VpCpTl + VPC T P2
= VpCpTH + VpC T . PL
Combination of Eqs. (7) and (8) yields the relation
(8)
5 - TH - TL '= 2Ft
TH - TL
e-T . (10)
The first test was carried out using a 3-in.-diam straight-bladed paddle on only one side of the contactor. The paddle was located 0.75 in. from the bottom of the contactor vessel and was operated at the speed of
195 z-pm. The mercury in one side of the contactor was heated to 30.5OC, and the mercury in the other compartment was cooled to 26Oc. Seven seconds after the flow of mercury was resumed, the temperature of the mercury in
the heated side of the contactor had decreased to 29OC.' The resulting mercury flow rate, calculated from Eq. (4), for this condition was 19.3 liters/min. The estimated uncertainty in this value is 560%.
The second test was carried out in the same vessel under similar conditions except that the blades of .the agitator were canted at 45’. One side of the contactor was heated to 32.5'C, and the other was cooled
to 2g.5Oc. !lkelve seconds after flow was resumed, the mercury in the heated side appeared to~have reached the equilibrium temperature. A mercury flow rate of 11.2 liters/min was calculated on this basis; how- ever, the estimated uncertainty in this value is large.
7.3 Conclusions
ftis concluded that sufficient data are available to establish the design of the proposed contactor for metal transfer experiment MTE-3 and
LiJ to suggest appropriate operating limits with salt-bismuth systems at

60
650~~. Mass transfer coefficients remain to be, determined under conditions ‘L)
that more closely resemble a salt-metal system; however, the-hydrodynamic performance of stirred interface contactors is now partially understood. For a given,vessel size, the maximum degree of agitation (and hence the
highest mass transfer rates) can be obtained by using the largest practical agitator blade, canted agitator blades, and no baffles. For such a vessel, the degree of agitation that can be achieved will be limited by
carry-over of the light phase between the contactor compartments. carry- over will probably occur in the salt-bismuth system at the approximate
agitator speed observed with the mercury-water system (300 rpm). There- fore, agitator speeds well below thrs value should be used initially for metal transfer experiment MIX-3.
i I i .

61
8. ANALYSIS OF MULTICOMPONENT MASS TRANSFER BETWEEN MOLTEN SALTS AND LIQUID BISMUTH DURING
COUNTERCURRENT FLOW IN PACKED COLUMNS
C. P. Tung * J. S. Watson /
Reductive extraction, an important operation in the removal of prot-
actinium and rare earths from MSBR fuel salt, involves the exchange of
metal ions in the salt phase with neutral (reduced) metal atoms in the bismuth'phase. Since no net electric current flows between the salt
and metal phases, the rate at which metal ions are reduced must equal
the rate at which metal atoms are oxidized (taking into consideration differences in the charges of the ions involved). In the bismuth phase,
the fluxes of the transferring atoms are dependent only on concentration gradients. In the salt phase, however, electric potential gradients are
generated near the salt-metal interface as the result of differences in
the mobilities and/or charges of the various diffusing ions. This results in a condition where the fluxes of the transferring ions are
dependent on,both concentration gradients and electric potential gradi- ents. These effects greatly complicate the mass transfer process and make difficult the design of continuous (differential) reductive extrac- tion columns. We have previously 25, carried out a mathematical analysis
l
of mass transfer during reductive extraction processes to aid in under- standing the results from present and proposed experiments in packed 1 columns and to aid in using these data for design of larger reductive extraction systems. During this report period, calculations were corn-
pleted for both binary and multicomponent mass transfer preparatory to
determining the conditions -under which the presence of an electric potential gradient significantly alters the mass transfer rate. In the
remainder of this section, examples are given for cases that represent either molten-salt--bismuth or aqueous-organic systems.
. 8.1 Mathematical Models
The mathematical~model being considered represents a modification of the two-film model frequently used for solvent extraction applications.
*Present address: Institute of Nuclear Energy Research, P. 0. Box No. 3, Lung-tan, Taiwan, Republic of China.

62
One liquid phase is considered to be an electrolyte (molten salt or an aqueous solution), while the other is considered to be a solvent (bismuth
or an organic phase). The behavior of materials in the solvent phase is similar in the two cases in that the transferring components are assumed
to be present in an uncharged or neutral state. However, the behavior of materials in the electrolyte phase differs for the two cases. In repre- senting a molten salt, it was assumed that the concentration of electro-
lyte coions (ions which have a charge opposite to that of the transferring
ions) is constant throughout the electrolyte phase since the equivalent volumes bf the fluorides or chlorides of interest are essentially equal. In representing an aqueous phase, it wasassumed that the concentration of coions varies across'the electrolyte film adjacent to the solvent-
electrolyte interface. In each case, there was no net transfer of coions across the solvent-electrolyte interface.
u *
t
As shown previously, 2? the rates .at which components transfer bet- .
ween an aqueous phase and an organic phase are defined by the relations
D J si 6 = si ('SiI - 'siB) ,
S :
J C-D r grad Cei +
ZiCeiF ei ei RT grad 0 1 ,
J = ei J si '
E Jei Zi = r;3Jsi Zi = 0 , L
i i
= Qi ,
(111
(12)
(13)
(14)
t

i
/ hdi
63
\-- Jeizi i / D
$y grad + . ei
'c- 1 L -.z,: c t (16) ei+Z ’ y” y i
where
J= flux of transferring component, D= diffusion coefficient of transferring component, 6 = thickness of solvent or electrolyte film adjacent to solvent-
electrolyte interface,
c = concentration of component in solvent or electrolyte,
C - concentration'of component i in the solvent phase, siB '-
's-j1 = concentration of component'i in the soivent phase. at the solvent- electrolyte interface,
z .= valence (electric charge) of ion,
4 = electric potential in ele,ctrolyte film,
F= Faraday constant, R = gas constant, *
T= absolute temperature, and Q .= equilib rium constant.
The subscript i refers to.the ith transferring component, the sub- - script r refers to a reference transferring component, and the subscripts e and s denote the electrolyte and solvent phases respectively.
Similarly;the rates at .which' components transfer'between a molten, salt and a bismuth phase are defined by Eqs.. (l)-(5), and the relation
?J ei 'i &a Dei
L grad 41 = -1 ; RT- . (4.7) j
/ zi* cei i
In presenting the calculated mass transfer rate data for the molten-
salt--bismuth and the .aqueous-organic"systems, the transfer rates will

64
be normalized to the transfer rate that would be observed under the same conditions in the absence of electric potential effects. The rates at. which components transfer between an electrolyte and a solvent phase in the absence of electric potential effects are-defined by Eqs. (l)-(5)
and the following relation:
J ei Z-D ei grad Cei . (18)
8.2 Calculated Mass Transfer Rates for the Case of Binary Exchange with Uniform Bulk Concentrations
The extent to which an electric potential gradient alters the rates at which components transfer between electrolyte and solvent phases having uniform bulk concentrations depends upon (1) the valences of the
transferring and nontransferring ions in the electrolyte phase, (2) the diffusion coefficients of the transferring components in the electrolyte and solvent phases, (3) the resistance to transfer of components through
the electrolyte and solvent films adjacent to the electrolyte-.solvent interface, (4) the equilibrium constants for the transferring components, (5) the relative concentrations of the transferring components in the electrolyte and solvent phases, (6) the concentration of nontransferring ions in the electrolyte phase, and (7) the behavior of the nontransferring ions.
Because of the large number of variables involved, it is not possi- ble to portray in a simple manner the complete solution to the set of equations that defines the effect of the electric potential gradient on
the rates at which components transfer between the electrolyte and sol- vent phases. Instead, results for selected cases involving two trans- ferring components will be given in order to show the importance of the various factors. In each case, the rate at which a component transfers between a solvent and an aqueous or molten salt phase in the presence of an electric potential gradient will be compared to the rate at which the
component would transfer in the absence of an electric potential gradient. In the remainder of this chapter, the term relative flux value' (RF'V) will be used to denote-the ratio of the -flux of a transferring component in
--. w
i
t
t
0
t

65
.LJ the presence of an electric potential gradient to the flux in the absence
. of an electric potential gradient.
In all cases involving binary exchange with uniform bulk concentra-
i tions, the valences of the transferring and nontransferring ions were assumed to be.unity. The concentrations of components 1 and 2 in the
solvent phase.were assumed to be 0.1 and 0.05 g-mole/cm3, respectively,
and the concentrations of components 1 and 2 in the electrolyte phase were assumed to be 0.05 and 0.01 g-mole/cm3.
8.2.1 Effect of Diffusion Coefficients of Transferring .Ions in Electro- lyte Phase
The effect of the diffusion coefficients of the transferring ions .I in the electrolyte phase during binary exchange is shown in Fig. 20, where the RFV (for either component) is given as a function of the ratio
of the diffusion coefficient of component 1 in the electrolyte phase to the diffusion coefficient of.component 2 in the,electrolyte phase. In
obtaining these results, the equilibrium constant was assumed to be
unity, and the thickness of the solvent film was assumed to be negligible (negligible resistance to transfer in the solvent film). It should be noted that the RFV is affected by the relative values of the diffusion coefficients for the transferring species except in the case where the diffusion coefficients (as well as the valences) are equal. The effect of an electric.potential gradient on the mass transfer rate is greater
in the case of a uniform concentration of coions in.the electrolyte phase (molten salt solution).than for the.case of a nonuniform concen-
tration of coions in the electrolyte phase (aqueous solution) because
the mobile coions in the aqueous electrolyte distribute across the electrolyte film in a-manner which suppresses or reduces the effect
of the electric potential gradient. If the ratio of the diffusion
coefficient for component 1 to that of component 2 is 0.~25, neglect of
the effect of an electric potential gradient would result in errors in the calculated mass transfer rate of 23 and 50% for,aqueous and molten
salt electrolyte phases respectively.

ORNL O;w6 74-677 i
I I 1 I1IIII I I I I III
MOLTEN SALT
AOUEOUS SOLUTION
I I , IllIll I I I I III
RATIO t?~3DlFF%O~7CO:FFICIENTS OF :RANSFht:HS IO
ELECTROLYTE ( De, ‘De2 )
Fig. 20. Effect on Relative Values of Diffusion Coefficients for Transferring Ions in Electrolyte Phase on Relative Flux Value. The resistance to mass transfer in the solvent phase was negligible (zero film thickness in solvent phase);
l
1
-,
U

8.2.2 Effect of Individual Mass‘Transfer Coefficient in Electrolyte Phase
.The effect of the individual mass transfer coefficient in the elec- trolyte phase is shown in Fig. 21,where the RFV (for either component) is given as a function of the ratio of the individual mass transfer coeffi- cient for component 1 in the electrolyte phase to the individual mass
transfer coefficient of component 2 in the electrolyte phase. The mass
transfer coefficients for components 1 and 2 in the solvent phase were
assumed to be equal to the mass transfer coefficient of component 2 in the.electrolyte phase. The equilibrium constant was assumed to be unity.
The error caused by neglect of the effect of an electric potential gra-
dient is greater in the case of the molten salt electrolyte than in the case of an aqueous electrolyte and becomes significant for the case where
the individual.mass transfer coefficient for component 1 in the electro-
lyte phase is small relative to the other individual mass transfer coef- ficient values.
8.2.3 Effect of Individual Mass Transfer Coefficient in Solvent Phase
The effect of the individual mass transfer coefficient in the sol- vent phase is shownin Fig. 22, where the RFV (for either component) is given as a function of the ratio of the individual mass transfer coef-
ficientfor component 1 or 2 in the solvent phase-.(assumed to be equal) to the individual mass transfer coefficient for component 2 in the
.electrolyte phase. In obtaining these results, it was assumed that the
equilibrium constant was unity and that the ratio of the individual mass transfer coefficient'forcomponent l'in the electrolyte phase to that for component 2 was equal%0 5.
When the transfer coefficient 'in the solvent. film is very high, as on the right side of Fig. 22, the transfer rate is controlled by the
resistance in the' electrolyte film. As in the .earlier cases, the effects of an electric potential gradient are more evident in the case of a
molten salt electrolyte than in the case of an aqueous electrolyte. At / very high values of the solvent film transfer coefficient, mass transfer resistance is solely in the electrolyte film, and the influence of an

68 - i) ,. . . ..,
.
ORNL DWG 74-681 IO I i I I IIIII I 1 I III1
7.0 -
5.0 -
3.0 -
5 MOLTEN SALT
a 0.7 - IL
g 0.5 -
5
i 0.3 -
i
0.11 I I I I l l l l l I I I illI
0.1 0.3 0.5 0.7 I 3 5’7 IO INDIVIDUAL MASS TRANSFER COEFFICIENT (Def/8e )
018
Fig. 21. Effect of Indivi,dual Mass Transfer Coefficient for Component 1 in the Electrolyte Phase on Relative Flux Value. The individkl mass transfer coefficient for component 2 in the electrolyte phase was assumed to be equal to the individual mass transfer coefficients for components 1 and 2 in the solvent phase.
t

69
C
LO-
7-
5-
3-
I-
I.7 -
I.5 -
1.3 -
).I - 0.1
ORNL DWG 74-660RI I I I I,,,,, I I l Illlll I I I Illll
MOLTEN SALT J
I I I I IllIll I I 1 Illlll I I I III,,
0.3 0.5 1.0 3.0 5.0 7.0 IO 30 50 70 100 INDIVIDUAL MASS TRANSFER COEFFICIENT RATIO (3 )
a2 c
Fig. 22. Effect of Individual Mass Transfer Coefficient for Component 1 or 2 in Solvent Phase on Relative Flux Value. The individual mass transfer coefficients in the solvent phase were assumed to be equal. The ratio of the mass transfer coefficient in the electrolyte phase for component 1 to that for component 2 was assumed to be 5.
,

70 ,- / Lui
electric potential gradient approaches an asymptotic value. As the sol- vent phase transfer coefficient decreases, the effects of electric fields 1
decrease since the transfer rate is no longer controlled by the electro- lyte film. Eventually, for very low values of the solvent film transfer coefficient (left side of Fig. 221, the transfer rate is controlled by
the film resistance in the solvent and is not significantly affected by electric fields.
1
8.2.4 Effect of Equilibrium Constant
The effect of the equilibrium constant on the RFV is shown in Fig. 23'. In obtaining these results, it was assumed that the individual mass
transfer coefficients in the solvent phase were equal to the individual
mass transfer coefficient for component 2 in the electrolyte phase. It was also assumed -that the individual mass transfer coefficient for com- ponent 2 in the electrolyte phase was five times that for component 1.
Changes in the equilibrium constant result in changes in the interfacial concentrations in both phases. For very small values for the equilibrium
constant, the equilibrium concentrations of the transferring species on the solvent side of the interface become small relative to the concen-
trations on the electrolyte side of the interface. In this case, the resistance to transfer between the phases is principally in the solvent film;theelectric potential gradient has essentially no effect, as shown in the left-hand portion of Fig. 23. For high values of the equilibrium constant, the primary resistance to mass transfer is in the electrolyte film and the effect of the electric potential gradient becomes important.
8.2.5 Effect of Concentration of Nontransferring Ions in.the Electrolyte Phase -
The effect of the concentration of nontransferring ions in the elec- trolyte phase?during binary exchange is shown in Fig. 24, where the RFV
is given as a function of the fraction of the electrolyte concentration
that cannot exchange between the phases. In making these calculations,
the bulk concentrations of the transferring ions in the electrolyte and solvent phases remained constant at the values given earlier, and the
*

c t, .
IO ORNL OW6 74-675 I I I I I I I I I I I
I
MOLTEN SALT
AQUEOUS SOLUTION
x 203 n I& go.5. I- s io.3 ’ a:
0.1 I I I I I I I I 1 I I
0.1 0.3 0.5 0.7 1.0 EOUILldk CSi!N&JTl~Q) 30 50 70 I00
Fig. 23. Effect of Equilibrium Constant on Relative Flux Value. The individual mass transfer coefficients in the solvent phase.were assumed to be equal to the individual mass transfer coefficient for component 2 in the electrolyte phase. The individual mass transfer coefficient in the electrolyte phase for component 2 was assumed to be five times that for component 1.

1.4
F 1.1 a ii a
72.
ORNL OWG 74-679 RI
I. 81 0
I I I I .2 .4 .6 .8 1.0
Ce(ltans) /~e(Totol~
Fig. 24. Effect of Concentration of Nontransferring Ion on Relative Flux Value.
t
- u

73.
a, bulk concentration of a nontransferring component in the electrolyte phase was varied in a manner which produced nontransferring ion fraction
values ranging from 0 to 0.5. The valence of the nontransferring ion
was ‘+l. As in the case of the coion, the value of the diffusion coef-
ficient of the nontransferring ion is unimportant. The nontransferring
ion behaves as a supporting electrolyte (as does the coion) and suppresses the effect of the electric potential gradient.
As shown in Fig. 24, the RFV value decreases steadily as the con-
centration of the nontransferring ion (relative to the total electrolyte concentration) is increased. As in the earlier cases, the effect of the
electric potential gradient is more pronounced in the case where the
electrolyte is a molten salt solution than in the case where the electro- lyte is an aqueous solution.
8.3 Calculated Mass Transfer Rates in an Extraction Column Having Nonuniform Bulk Concentrations
The rates at which components transfer between the solvent and electrolyte phases in a packed column involve many independent variables, and no attempt will be made to show the effect of each of these varia- bles. Instead, results will be presented for two operating conditions. The first is a simple binary exchange process in which the electrolyte that enters one end 'of the column contains component 1 but not compo- nent 2, while the solvent that enters the opposite end of the column
contains component 2 but not component 1, Results are presented for
the cases of an aqueous electrolyte'and a molten salt electrolyte, and for the case where there is no effect of an electric potential gradient. The second operating condition considered corresponds to an actual
reductive extraction operation involving a molten fluoride mixture and liquid bismuth.containing reductant. In this 'case, four cations are
considered (Li+, Be 2+ , -Th4+m,+nd Li3+), However,'only Li+, Th 4+ , and
&3+ are allowed to transfer between the.electrolyte and solvent phases. Results are presented for the case where.the electrolyte is a molten
salt and for the case where there is no effect of an electric potential
gradient.

8.3.1 Binary Exchange
74 \
kid .
Table 8 shows the operating conditions for,the cas.e of binary
exchange in a packed column. The valences of the transferring ions and‘ the coion were assumed to be unity. The-equilibrium constant for the transferring ions was assumed to be unity. It was assumed that the column was of such length that the total interfacial area between the solvent and electrolyte phases was 2000 cm2,
Table 8. .Operating Conditions for the Case of Binary Exchange in a Packed Column
Quantity Phase Electrolyte Solvent
Flow rate, cm3/sec Film thickness, cm
Inlet concentrations, g-mole/cm3
50 50 2 -4 x 10 1 x 10 -4
3
Component 1 Component 2
Diffusion coefficients, cm2/sec
2 x 10 -3 0 ‘ 0 1 x 10 -3
Component 1 1 x 10⁻⁵ 2 x 10 -5
Component 2 1 x 10 -6 4 x 10'5
In making the calculations, the column was divided into 50 axial increments of equal length and the electrolyte film in a given increment of column length was divided into 20 increments of equal thickness.
Calculated values for the concentration profiles for the two transferring components are shown in Figs. 25-27 for the cases where the electrolyte phase consists of an aqueous solution or a molten-salt solution and for
the case where the electric potential gradient has no effect. The con- centrations of the transferring ions have been normalized to their maxi-
mum values to facilitate presentation of the results.
It is apparent from Fig. 27 that an electric potential gradient has the effect of decreasing the rate at which materials transfer between LJ

i
ORNL iWG 74-672
A ELECTROLYTE PHASE OSOLVENT PHASE 9--I--I
LO&&A
u- ~~~~ 0 0.2 -0.4 0.8 1.0
Fig. 25. Concentration Profiles for the Case of Binary~Exchange in a Packed Column Where the Electroltie Phase Is an Aqueous Solution

76
ORNL DWG 74-676
0 ELECTROLYTE PHASE ASOLVENT PHASE g--p--n
, , 1 , , 1 , 1 , , , , , , ( , , , , , ,)#g
0.6
-I ;;
/ OAL w- 6-l
“““““‘I~““““‘~ 0.2 0.4
c ,2,/c Et 0.0 1.0
Fig. 26. Concentration Profiles for the Case of Binary Exchange in a Packed Column Where the Electrolyte Phase Is a Molten-Salt Solution.

ORNL DWG 74-656
0 CASE I A CASE II + NO ELECTRIC a--I--in
0.6
Fig. 27. Comparison of Concentration Profiles for Component 2 for the Case of Binary Exchange in a Packed Column. Results are shown for the cases where the electrolyte is an aqueous solution or a molten-salt solution, and for the case where the effects of the electric potential gradient are not significant.
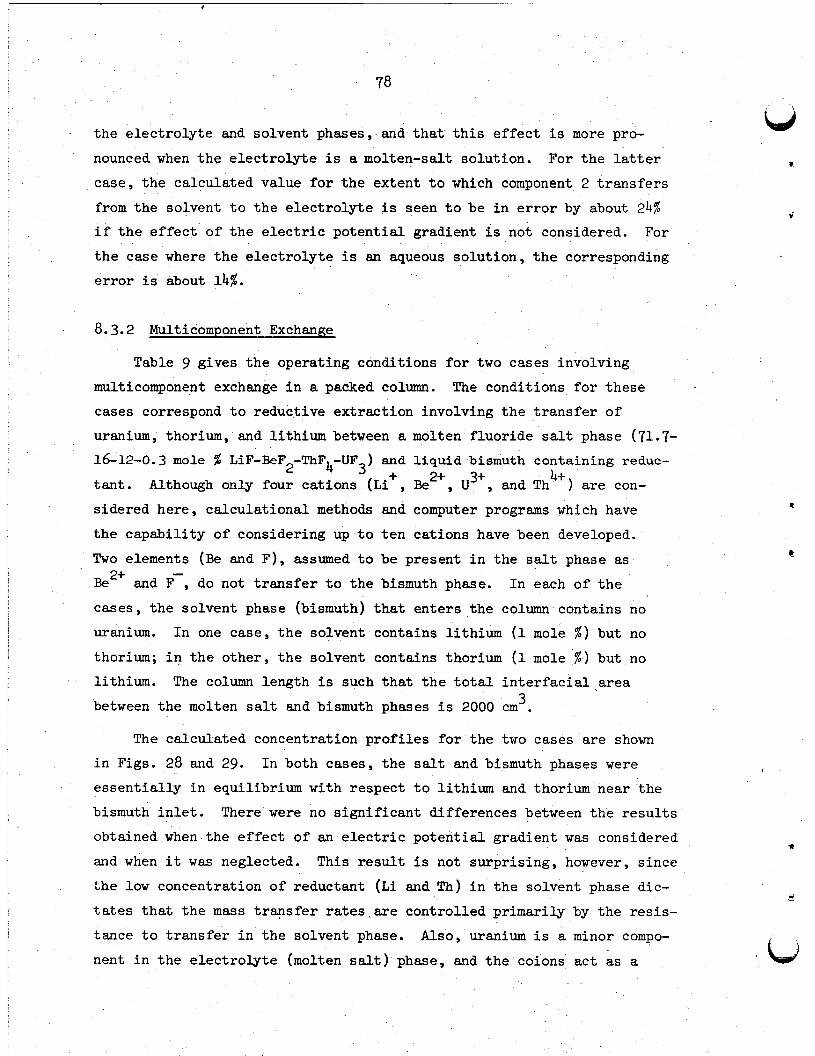
78
‘L
the electrolyte and solvent phases, and that this effect is more pro- nounced when the electrolyte is a molten-salt solution. For the latter case, the calculated value for the extent to which component 2 transfers
from the solvent to the electrolyte is seen to be in error by about 24% if the effect of the electric potential gradient is not considered. For the case where the electrolyte is an aqueous solution, the corresponding error is about 14%.
w
t
9
8.3.2 Multicomponent Exchange
Table 9 gives the operating conditions for two cases involving
multicomponent exchange in a packed column. The conditions for these . cases correspond to reductive extraction involving the transfer of uranium, thorium, and lithium between a molten fluoride salt phase (71.7- 16-12-0.3 mole % LiF-BeF2-ThF4-UF3) and liquid bismuth containing reduc-
tant. Although only four cations (Li+, Be 2+ , u3+, and Th4+ ) are con-
sidered here, calculational methods and computer programs which have a
the capability of considering up to ten cations have been developed. Two elements (Be and F), assumed to be present in the salt phase as t
Be2+ and F-, do not transfer to the bismuth phase. In each of the cases, the solvent phase (bismuth) that enters the column contains no uranium. In one case, the solvent contains lithium (1 mole %) but no thorium; in the other, the solvent contains thorium (1 mole %> but no lithium. The column length is such that the total interfacial.area
between the molten salt and bismuth phases is 2000 cm3.
The calculated concentration profiles for the two cases are shown in Figs. 28 and 29. In both cases, the salt and bismuth phases were essentially in equilibrium with respect to lithium and thorium near .the
bismuth inlet. There were no significant differences between the results obtained when the effect of an electric potential gradient was considered and when it was neglected. This result is not surprising, however, since the low concentration of reductant (Li and Th) in the solvent phase dic- tates that the mass transfer rates.are controlled primarily by the resis-
tance to transfer in the solvent phase. Also, uranium is a minor compo- nent in the electrolyte (molten salt).phase, and the coions act as a

79
- ORNL DWG 74-659
aSOLVENT PHASE AELECTROLYTE PHASE
C (2) /C MAX
Fig. 28. Concentration Profiles for U, Th, Li, and Be in the Molten Salt and Bismuth Phases in a Packed Column. The bismuth phase entering the column contained only lithium-at the concentration of 1 mole %.

80
ORNL DWG 74-660
0 ELECTROLYTE PHASE ASOLVENT PHASE
1.0 9--1--2-x1
I
1
I
dfll Li
0.8 - rh at
0.6 - .J 2
0.4 -
0.2 -
r OO
I* 0.2 0.4 0.6 0.8 1.0
C (2)/C MAX
Fig. 29. Concentration Profiles of U, Th, Li, and Be in the Molten Salt and Bismuth Phases in a Packed Column. The bismuth phase entering the column contained on* thorium at the concentration of 1 mole %.
f

.
t
LJ
81
Table 9. Operating Conditions for the Cases of Multicomponent Exchange in a Packed Column'.
.Quantity Phase
Electrolyte Solvent
Flow rate, cm3/sec 50 50
Film thickness, cm 1 x 10⁻³ '1X10 -3
Inlet concentrations, g-mole/cm3
Li 3.745 x lo-* 4.6 x IO-~&
Be 8.637 x 10⁻³ 0 Th 6.627 x 10 -3 4.6 x lo-58
U 1.560 x lo -4 0
I Diffusion coefficients, cm*/sec Li 3 x 10⁻⁵ 3 x 10⁻⁵
Be --- -^-
Th .l x 10-5 1 x 10⁻⁵
U 2 x 10 -5 -2 x 10⁻⁵
&Only lithium (or thorium) was present in the inlet solvent.
supporting electrolyte which suppresses the effect of an electric poten-
tial gradient.
8.4 Summary
A mathematical analysis has been carried out and computer programs
have been developed which allow determination of the importance of the
-electric potential gradient that is generated in an electrolyte during the transfer of materials between an electrolyte.and a solvent phase. The effect of the electric potential gradient was found to be of greater
importance when the electrolyte is a molten salt than when it is an aqueous solution. In the latter case, the nontransferring coions redis-
tribute in the electrolyte phase in a manner which suppresses the effect of the electric potential gradient. However, it was shown that

82
significant errors in calculated mass transfer rate values will result under some operating conditions in both cases.
Lid.
? Two cases involving reductive extraction of uranium from a molten
fluoride salt phase into a liquid bismuth phase containing reductant
indicate that neglect of the effect of an electric potential gradient probably causes essentially no error in calculated mass transfer rates
for reductive extraction operations of interest in MSBR processing.
i
c
i
I

I 83
9. ENGINEERING STUDIES OF URANIUM OXIDE PRECIPITATION
M. J. Bell* L. E. McNeese
Studies of the chemistry of protactinium and uranium oxide pre- ' 5 cipitation by Baes et al; have indicated that oxide precipitation may -s be an attractive alternative process to fluorination--reductive extrac-
tion for isolation of protactinium and removal of uranium from the fuel salt of an MSBR, 26 27 Calculations made by Bell and McNeese indicate
that protactinium removal times of 3 to 5 days can be obtained for a reasonable range of flowsheet variables, and that uranium removal effi- ciencies of greater than 99% can be realized with relatively few equi-
librium stages. 28 ,a Engineering studies of uranium oxide precipitation '
are planned in order to study the kinetics of uranium oxide precipitation, to investigate the size distribution and settling characteristics of the oxide precipitate , and to gain experience with oxide precipitation
systems. During this report period, an experimental facility was designed
and installation of equipment was initiated. The facility is described
in the-remainder of this section.
9.1 Description of Facility
A schematic diagram of the major components of the proposed oxide precipitation facility is shown in Fig, 30. This facility will allow
-batch precipitation studies to be made in a vessel containing approx- imately 2 liters of 72-16-12 mole % LiF-BeF2-ThF4 salt that has an initial UF4 concentration oft-about 0.3 mole %. Oxide will-be supplied to the precipitator.inthe form of a water-argon gas mixture that will
be introduced through a draft tube to promote contact of the salt and
;
Y
oxide. The method proposed for separation of the salt and oxide phases
.is decantation of the salt to a receiver vessel after the oxide has been allowed to settle for a short period. The facility also includes a
system for. supplying hydrogen-HF gas mixtures that will be used for converting the-oxides to fluorides at the conclusion of an experiment.
*Present address: Directorate of Regulatory Standards, Washington, DC 20545
; ’ ,

ORNL DWb 72-64
FEED AND Rf~~~~~R
PR E;;;‘sFzOR
Fig. 30. Conceptual Design of a Single-Stage Uranium Oxide Precipitation Facility.
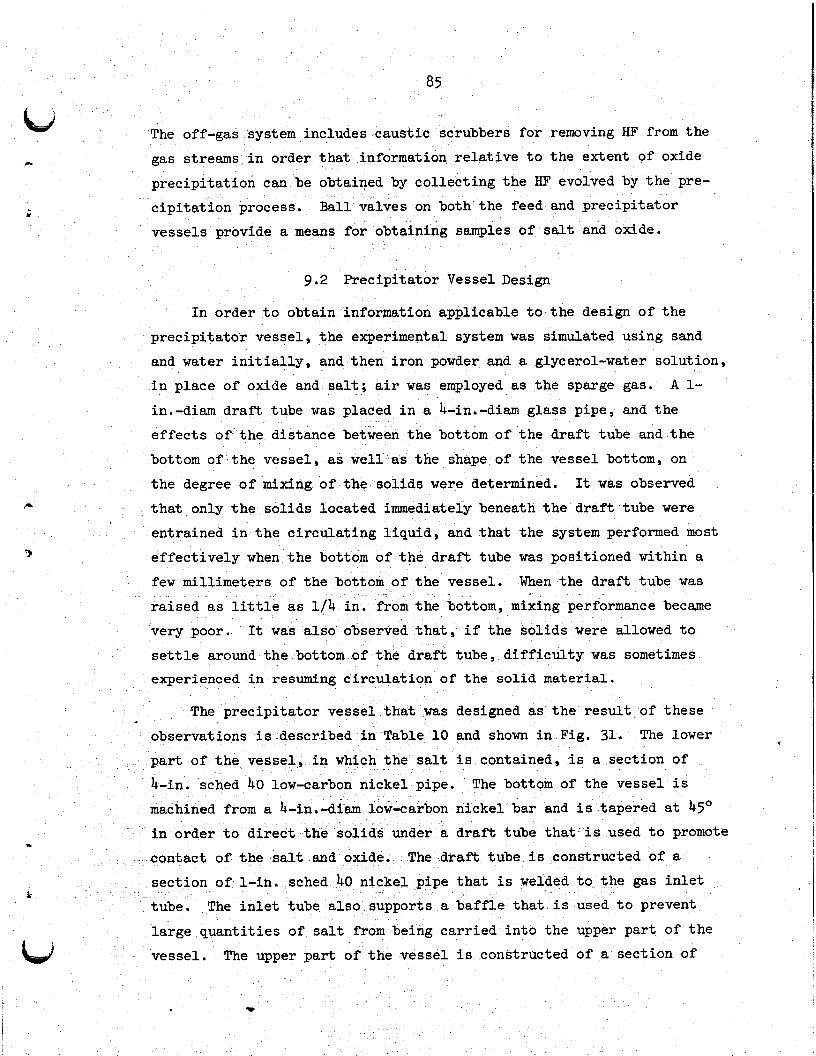
85
The off-gas system includes caustic scrubbers for removing HF from the gas streams in order. that information relative to the extent of oxide precipitation can be obtained by collecting the HF evolved by the pre- cipitation process. Ball valves on both the feed and precipitator
vessels provide a means for obtaining samples of salt and oxide.
9.2 Precipitator Vessel Design
In order to obtain information applicable to the design of the
precipitator vessel, the experimental system was simulated using sand and water initially, and then iron powder and a glycerol-water solution, in place of oxide and salt; air was employed as the sparge gas. A l-
in.-diam draft tube was placed in a &in.-diam glass pipe, and the effects of the distance between the bottom of the draft tube and the bottom of the vessel, as well as the shape of the vessel bottom, on
the degree of mixing of the solids were determined. It was observed
that only the solids located immediately beneath the draft tube were entrained in the circulating liquid, and that the system performed most
effectively when the bottom of the draft tube was positioned within a
few millimeters of the bottom of the vessel. When the draft tube was raised as little as l/4 in. from the bottom, mixing performance became very poor. It was also observed that, if the solids were allowed to
settle around the bottom of the draft tube, difficulty was sometimes experienced in resuming c'irculation of the solid material.
. The precipitator vessel that was designed as the result of these observations isdescribed in Table 10 and shown inFig. 31. The lower
part of the vessel, in which the salt is contained, is a section of b-in. sched 40 low-carbon nickel pipe. ,The bottom of the vessel is
machined from a 4-in.-diam low-carbon nickel bar and is tapered at 45' in order to direct the solids under a draft tube that is used to promote contact of the salt and-oxide. The draft tube is constructed of a
section of l-in. sched 40 nickel pipe that is welded to the gas inlet tube. The inlet tube also supports a baffle that is used to prevent
large quantities of salt from-being carried into the upper part of the vessel. The upper part of the vessel is constructed of a section of
. 0
-.
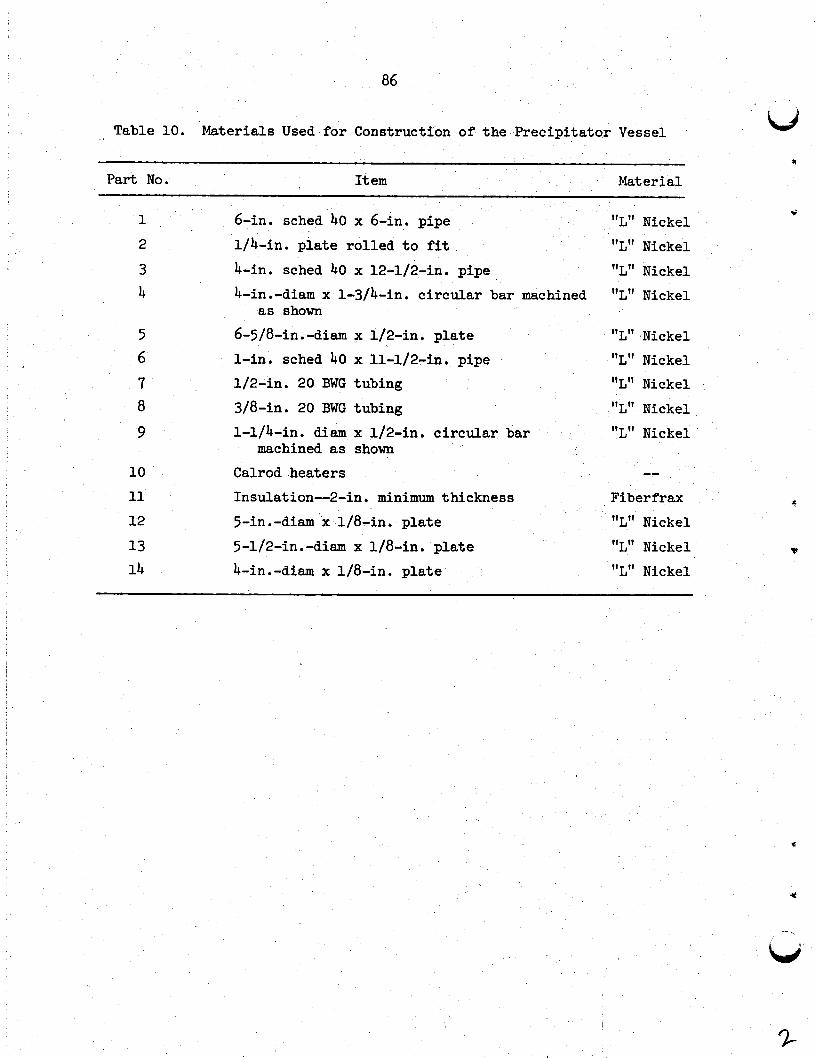
86
Table 10. Materials Used for Construction of the Precipitator Vessel - .
Part No. Item Material
6 -in. sched 40 x 6-in. pipe l/4-in. plate rolled to fit
4 -in. sched 40 x 12-l/&in. pipe
10 Calrod.heaters 11 Insulation--e-in. minimum thickness
12 5-in.-diam'x.l/8-in. plate
13 5-l/2-in.-diam x l/8-in. plate 14 4-in.-diem x l/8-in. plate
4-in.-diam x l-3/4-in. circular bar machined as shown
6-5/8-in.-diam ?t l/2-in. plate l-in. sched 40 x 11-l/2-in. pipe l/2-in. 20 BWG tubing
3/8 -in. 20 BWG,tubing
l-l/4-in. diem x l/2-in. circular bar machined as shown
'IL" Nickel
"L" Nickel "L" Nickel "L" Nickel
"L" .Nickel "L" Nickel "L" Nickel
"L" Nickel
"L" Nickel
--
Fiber&ax
"L" Nickel L
"L" Nickel "L'* Nickel
*

GAS INLET- LINE
ORNL DWG 72-6653Rl
Fig. 31. Schematic Diagram of the Precipitator Vessel for a Sing1 Stage Uranium Oxide Precipitation Facility. The numbers correspond to the materials list shown in Table 10.
.e-

88
‘6 -in. sched 40 low-carbon nickel pipe and serves as a deentrainment
section. Nickel plates welded to the draft tube in this section of the vessel serve as heat shields and flow diverters. The gas inlet tube is used to introduce either argon-water mixtures or hydrogen-HF mixtures
into the vessel and, in addition, functions as one of the sampling noz- I zles. The upper end of this tube is fitted with a l/2-in. nickel-plated ball valve through which samples of the salt and oxide are obtained.
Li
The vessel is heated with tubular resistance heaters and insulated with
3 in. of Fiberfrax. hozzles on the.upper flange of the vessel are used for thermowells, an off-gas line, and service lines for introducing salt
to the vessel. The nozzles are described in more detail in Table 11.
The feed-and-receiver tank was fabricated from a 19-in.-long section
:
of b-in. sched 40 low-carbon nickel pipe and has heads made from l/2-in. nickel plate. It also is heated with tubular resistance heaters and is insulated with 3 in. of Fiberfrax. The equipment is being installed in

u: P
Table 11. Nozzle Schedule for Prkcipitator Vess+
I Nozzle Service Number of Ndzzles Description Material
A Gas and sample inlet 1 .I l/2-in. tube x l/2-in:pipe Monel .
B Thermowells 2 l/2-in. tube x l/2-in. pipe Monel .
C Gas vent 1. l/2-in. tube x l/2-in. pipe Monel
D Salt transfer 1 3/8+in. tubir "L" Nickel

90 r‘->
10. STUDY OF TIE PURIF'ICATIOM OF SALT BY CONTINUOUS METHODS LJ
R. B. Lindauer f
We have previously described equipment for studying the purifica- *
tion of salt by continuous methods. 30 Initial work with this system
was directed at the measurement of the flooding rates in a 1.25-in.- dism, 'I-f-t-long column packed with l/4-in. nickel Raschig rings. Flooding data were obtained during the countercurrent flow of molten salt (66-34 mole $ LiF-BeF2) and hydrogen or argon. 31 The objective
of the present work is to study the continuous reduction of iron fluo- ride in molten salt by countercurrent contact of the salt with hydrogen in a packed column. We have previously reported on two iron fluoride
reduction runs that were carried out at 700°C with salt having the composition 66-34 mole % LiF-ReF2 (ref. 32) and nine runs that were carried out at 7OO'C with salt having the composition 72.0-14.4-13.6 mole' $ LiF-BeF2-ThF4. 33 c
Iron analyses from samplestaken during the last series of nine iron fluoride reduction runs have shown considerable scatter (Pig. 32).
c
Also shown in this figure are the analyses for ten samples taken.after the last reduction run when.the soluble iron (fluoride) concentration should have remained constant. Suspected reasons for the inconsis-
'tencies are: presence of iron particles suspended in the salt, con- tamination of the sample during analysis, and analytical difficulties at.low iron concentrations. Several tests were carried out during this
report period in order to resolve these questions; the results and con- clusions are discussed in the remainder of.this chapter.
10.1 Tests for Determining the Presence of Suspended Iron Particles in Salt Samples
Tests were made to investigate'the possibility that iron particles, *
suspended in the molten salt, might-be the cause of the occasional high iron analyses such as those after runs 4,.10, and 11 reported previously. 30 *
It is believed that any metal particles which were suspended in the salt ,,--- would deposit on metal specimens suspended in the salt.. Therefore, _. _ Lad
_-_._--,- :r. 1

c
*. 3 ., >
t
‘, ‘, 0 BATCH SAMPLES AFTER RUN -NICKEL PI A FLOWING-STREAM SAMPLES DURING .RUN X COPPER FILTER SAMPLER + COPPER DIP SAMPLER (NO FILTER)
3- 0
0 BATCH SAMPLES AFTER RUN -NICKEL PI A FLOWING-STREAM SAMPLES DURING .RUN X COPPER FILTER SAMPLER + COPPER DIP SAMPLER (NO FILTER)
OR#L DWG 74-661
LTER SAMPLER
0
0 E
I I I I I I t I I 3 4 5 6 7 8 9 IO II
’ I REDUCTION RUN NO. I 2 ‘3 ‘4 5 6
SAMPLER TEST NO. I
Fig. 32. Iroh Analyses During Recent Iron Fluoride'Reduction Runs and Sampler Tests.

92 ,,r--
specimens of nickel were suspended in the salt in the feed tank at varying depths for 5 to 15 min. Leaching these specimens with HCl dissolved a negligible amount of iron. To further substantiate the absence of iron particles in the salt, four dip (unfiltered) samples were taken. The iron concentrations in these 'samples ranged from 65 to 75 ppm, which is equivalent to the concentration in the filtered
samples having the lowest'iron content. Such resultsshow conclusively that iron particles are not suspended in the salt.
10.2 Tests of Various Sampler Types
The samplers used during the iron fluoride reduction runs carried out to date have consisted of l/4-in.-OD nickel samplers to which a
porous metal filter is attached. The sample size is about 1 g. Removal of the salt sample from these samplers (via a steel tubing cutter fol- lowed by crushing) is somewhat difficult and provides a possible source
/of iron contamination. Therefore, following the last reduction run, both filtered and nonfiltered samples were taken in copper samplers, some of which allow removal of a larger (4-g) sample. The copper tubing is more easily crushed, and samples are less likely to be contaminated with iron during this 'operation. Averages of the iron concentrations for the samples takenafter run 11 are shown in Table 12.
s
ii-
Table 12. Average Reported Iron Concentrations for Various Sampler Types
Type of Sampler
l/&in.-diam Ni (filtered)
l/k-in.-diam Cu (filtered)
Average Iron Cont.. Number (wd of Samples
262 2
109 2 l
3/&in .-diam Cu (filtered) 102 3 318-h .-diam Cu (unfiltered) 68 4

93
e
. i
The following conclusions have been drawn from these data:
(1) If particles of iron are produced during the reduction of iron fluoride in the column, the iron does not remain suspended in the salt for one pass through the system (column, piping, receiver tank).
(2) Iron analyses below 100 ppm are unreliable with sample sizes of 1 g or less.
(3) Samples taken with nickel samplers are.more subject to contamination during removal than are samples from copper samplers.
10.3 Correlation of Flooding Data
Typical flow data obtained in the present 1.25-in.-diam, 7-ft-long
packed column are compared in Fig..33 with a flooding velocity corre- 34 lation developed by Sherwood. The following nomenclature is used in
the figure:
GL = mass velocity of salt, lb/hr*ft2,
G V
= mass velocity of gas, lb/hr*f't2,
a V
= ft2/ft3 of packing,
uL = salt viscosity,-cP,
E: = packing void fraction,
. Qc = standard gravitational acceleration, ft-lb/lbF.hr 2‘ ,
% . = gas density, lb/ft3,
= salt density; lb/ft3. Pv
The liquid deentrainment section at the top of the colm‘had insuffi-
cient capacity to permit flooding .of -the column without danger of plug- ging the,column gas outlet with salt, and these .data represent near-
maximum flow rates-at which the column was still operable. However, the operating conditions are believed to be sufficiently close to
c flooding conditions to determine-that actual flooding conditions would fall significantly below values predicted by the Sherwood correlation.
/
,’

94
to-’ _ ORNL DWG 74-6 1 I , 1 ,,,I( I I11111~ I I lllll
t \
- i
A LiF-BcF2AND ARGON X LiF-BeF2AND HYDROGEN 0 LiF-BcFpThFq AND ARGON
m-2 + LiF-BcFpThFq AND HYDROGEN
Fig. 33. Comparison of Actual Column Data with Sherwood Flooding Correlation.

k,
I
- .
1
95
11. REFERENCES
1. L. E. McNeese, Engineering Development Studies for Molten-Salt ,Breeder Reactor Processing No. 7, ORNL-TM-3257 (February l972), pp. 16-29.
2. L. E. McNeese, Engineering Development Studies for Molten-Salt Breeder Reactor Processing No. 8, ORNL-TM-3258 (May l972), pp. 24-30.
3. L.'E. McNeese, Engineering Development Studies for Molten-Salt Breeder Reactor Processing No. 9, ORNL-TM-3259 (December l972), pp. 30-32.
4; L. E. McNeese, Engineering Development Studies for Molten-Salt Breeder Reactor Processing No. 1, ORNETM-3053 (November 1970), pp. l-14.
5; L. E. McNeese, Engineering Development Studies for Molten-Salt Breeder Reactor Processing No: 6, ORNL-TM-3141 (December 19711, pp. 73-79.
6. L..E. .McNeese, Engineering Development Studies for Molten-Salt Breeder Reactor Processing No. 7, ORNL-TM-3257 (February l972), pp. 52-58;
"\\ 7. L. E. McNeese, Engineering Development Studies for Molten-Salt Breeder Reactor Processing No. 8, ORNL-TM-3258 (May l972), pp. 64-89.
3 8. L. E. McNeese, Engineering Development Studies for Molten-Salt Breeder Reactor Processing No. 1, ORNL-TM-3053 (November 1970), p. 6.
9. L. E. McNeese, Engineering Development Studies for Molten-Salt Breeder Reactor Processing No. 5, ORNL-TM-3140 (October 1971), pp. 2-15.
10. L. E. McNeese, Engineering Development Studies for Molten-Salt Breeder Reactor Processing No. 7, ORNL-TM-3257 (February 1972), pp. 29-46.
11. L. E. McNeese, Engineering Development Studies for Molten-Salt.Breeder Reactor Processing No. 8, ORNL-TM-3258 (May 19721, pp. 58-63.
12. L. E. McNeese, Engineering Development Studies for Molten-Salt Breeder Reactor Processing No.~9; ORNL-TM-3259 (December 1972), pp. 167-95.
13.
14.
15.
F. J. Smith, J. Less-Common Metals a, 7: 3-79 (1972).
J. A. Lane, H. G. MacPherson, and F. Maslan, Fluid Fuel Reactors, p. 728, Addison-Wesley Publishing Co., Inc., Reading, Mass., 1958.
L. E. McNeese, Engineerina~Development Studies for Molten-Salt Breeder Reactor Processing No. 9, ORNL-TM-3259 (December 1972), pp. 196-204.
J. I. Federer, ORNL, personal communication, March 1971. 16.
17* J. R. DiStefano and J. I. Federer, ORNL, personal communication, February 1972.
I

96
18. L. E. McNeese, Engineering Development Studies for Molten-Salt Breeder Reactor Processing No. 8, ORNL-TM-3258 (May 1972), p. 61.
,--- Li
f 19. L. M. Ferris et al., MSR Program Semiann. Proar. Rept. Feb. 28; 1970,
ORNL-4548, p. 289. r
20. L. M/Ferris et al., MSR Program Semiann. Progr. Rept. Aug. 31, 1970, ORNL-4622, p.204.
21. D. M. Moulton and J. H. Shaffer, MSR Program Semisnn. Progr. Rept. Feb. 28, 1970, ORNL-4548, p. 171;
22. L. E. McNeese, Engineering Development Studies for Molten-Salt Breeder Reactor Processing No. 9, ORNL-TM-3259 (D ecember 1972), pp. 205-15.
23. J. B. Lewis, Chem. Eng. Sci. 3, 248-59 (1954).
24. J. B. Lewis, Chem. Eng. Sci. 2, 260-78 (1954).
25. L. E. McNeese, Engineering Development Studies for Molten-Salt Breeder Reactor-Processing No. 9, ORNL-T&3259 (December 1972), ppg 238-50.
26. R. G. Ross, C. E. Bamberger, and C. F. Baes, 'Jr., MSR Program Semiann. Progr. Rept. Aug. 31, 1970, 0~~~4622, pp. 92-95.
27. C. E. Bamberger and C. F. Baes, Jr., J. Nucl. Mater. 35, 177 (1970).
roEram Semiann. Pronr. Rept. Aug. 28. M. J. Bell and L. E. McNeese, MSR P 31, 1970, ORNL-4622, pp. 202-8.
29. M. J. Bell and L. E. McNeese, MSR Program Semiann. Progr. Rept. Feb. 28, lg71t ORNL-4676, pp. 237-40;
30. L. E. McNeese, Engineering Development Studies for Molten-Salt .Breeder Reactor Processing No. 6, ORNL-TM-3141 (December 19711, pp. 59-72.
31. L. E. McNeese, Engineering Development Studies for Molten-Salt Breeder Reactor Processing No. 7, ORNL-TM-3257 (February 1972), pp. 46-52.
3" L. L. E. McNeese, Engineering Development Studies for Molten-Salt Breeder Reactor Processing No. 8, ORNL-TM-3258 (May 1972), pp.' 97-106.
33. L. E. McNeese, Engineering Development Studies for Molten-Salt Breeder Reactor Processing No. 9, ORNL-TM-3259 (December 19721, pp. 256-57. i
34. A. S. Foust et&., Principles of Unit Operations, p. 270, Wiley, New York, 1960. d

.INTERNAL DISTRIBUTION
1. C. F. Baes, Jr. 38. W. R. Huntley 2. C. E. Bamberger 39. C. W. Kee 3. M. R. Bennett 40. A. D, Kelmers 4. E. S. Bettis 41. J< A. Klein
R. E. Blanc0 2: 3. 0. Blomeke
42. W. R. Laing 43. R. E. MacPherson
7. E. G. Bohlmann 44. H. E. McCoy 8. J. Braunstein 45-63. L. E. McNeese 9. M. A. Bredig 64. A. P. Malinauskas
10. R. B. Briggs 65. A. 5. Meyer 11. H. R. Bronstein 66. R. L. Moore 12. R. E. Brooksbank 67. J. P. Nichols 13. K. B. Brown 68. H. Postma 14. J. Brynestad 69. M. W. Rosenthal 15. S. Cantor 70. 16.
A. D. Ryan D. W. Cardwell H. C. Savage
17. W. L. Carter Ti: W. F. Schaffer, Jr. 18. H. D. Cochran, Jr. 73. C. D. Scott 19. W. H. Cook 74. M. J. Skinner 20. R. M. Counce 21. J. L..Crowley 7'2:
F. J. Smith G. P. Smith
22. F. L. Culler 77. I, Spiewak 23. J. M. Dale 78. Martha Stewart 24. J. H. DeVan 0. K. Tallent 25. J. R. DiStefano ii;: L. M. Toth 26. W. P. Eatherly 81. D. B. Trauger 27. J. R. Engel. 82. W. E. Unger 28. D. E: Ferguson 83. J; S. Watson 2
.2g. L. M. Ferris 84. R. G. Wymer 30. L. 0. Gilpatrick 85. E. L.- Youngblood 31. J. C. Griess I 86-87. Central Research Library
i;: W. R. Grimes
89-8981: Document Reference Section
R. H. Guymon Laboratory Records 34. B. A. 'Hannaford Laboratory Records, RC 35. J, R. Hightower, Jr. ;i: Y-12 Document Reference 36. B. F. Hitch Section 37. R. W. Horton 94. ORNL Patent Office
EXTERNAL DISTRIBUTION .
95. D. F. Cope, USAEC, RDT Site Office, ORNL, Oak Ridge, Tennessee 37830 96. .Deslonde R. deBoisblanc, Ebasco Services, 2.Rector Street; New
.York, New York 10606
Go K. 0. Laughon, USAEC;-RRD, Washington, DC 20545
. C. L. Matthews, USAEC, RDT Site Office, ORNL, Oak Ridge, Tennessee 37830
99. T. A. Nemzek, Director, USAEC,.RRD, Washington 20545

-_
98
100. D. J. Royer, Continental Oil Co., Ponca City, Oklahoma 74601 101. A. M. Weinberg, Institute for Energy Analysis, Post Office
Box 117, Oak Ridge, Tennessee 37830 102. E. A. Womack, USAEC, RRD, Washington, DC 20545
103-104. TIC, Oak Ridge, Tennessee 105. Research &d Technical Support Division, AEC, OR0 P