Embed Size (px)
DESCRIPTION
http://www.energyfromthorium.com/pdf/ORNL-TM-3257.pdf
Citation preview
OAK RIDGE NATIONAL LABORATORY LIBRARIES
OA ’ 11111111:1;111l llllll1J((i 11111llllllllll lIllllll/ lllllllll LA RATo RY Y
‘UNIG N 0 N U C L E A R D I V I S I O N 4 4 5 b 05bb2q0
i 3 * $ j ./,( L i J I
ORNL - TM - 325Z?
U . S . A T O M I C E N E R G Y COMMISSION I !
ENGI \ I E E R I ~ S DEVELOPMENT sn DIES FOR MOLTE,. BREEDER REACTOR PROCESSING NO. 7
L. E. McNeese
NOTICE T h i s document contains informat ion of a prel iminary nature and was prepared pr imari ly for internal use a t the Oak Ridge Nat iona l Laboratory. I t i s subject to rev is ion or correct ion and therefore does not represent a f ina l report.
-SA ,T
8 ORNL-TM-3257
Contract No W-7405-eng-26
ENGINEERING DEVELOPMENT STUDIES FOR MOLTEN-SALT BREEDER REACTOR PROCESSING NO. 7
La E. McNeese
.
FEBRUARY 1972
OAK RIDGE NATIONAL LABORATORY O a k Ridge, Tennessee 37830
operated by UNION CARBIDE CORPORATION
f o r the U.S. ATOMIC ENERGY COMMISSION
ii
Reports previously issued in this series are as follows:
0 ~ ~ - 4 3 6 5 OWL- 4 366 ORNL-TM-3053
ORNL-TM-3137
OWL-TM-3138
ORNL-TM-3139
OWL-TM-3140
ORNL-TM-3141
Period ending July 1968 Period ending September 1968 Period ending December 1968 Period ending March 1969 Period ending June 1969 Period ending September 1969 Period ending December 1969 Period ending March 1970
'tr
iii
CONTENTS
Page
c
1.
2.
3.
4.
5.
6.
INTRODUCTION . . c . . . . . . . . . . . . . . . . . . ANALYSIS OF THE FLUORINATION--REDUCTIVE EXTRACTION AND METAL TRANSFER FLOWSKEET . . e . . . . . . . . . . . . . 2.1 Distribution of Rare-Earth and Alkaline-Earth Elements Be-
2,2
tween Molten Salt and Bismuth Containing Reductant . . . Isolation of Protactinium Using Fluorination--Reductive Extraction . . . . e . . . e . . e e e .
2.3 Removal of Noble Metals with the Fluorination--Reductive Extraction Flowsheet . . . . . . . . . . .
2.4 Halogen Removal in the Uranium Removal System . . . . DEVELOPMENT OF A FROZEN-WALL FLUORINATOR: DESIGN CALCULATIONS FOR INDUCTION HEATING OF A FROZEN-WALL FLUORINATOR . . . , 3.1 Effects of Wall Temperature, Current, Frequency, and Fluori-
nator Diameter on the Thickness of the Frozen Film . . . 3.2 Control of Frozen Film Thickness, and Approximate Dynamics
ofFreezing. . . . . . . . . . . . . 3.3 Power Requirements for an Experimental Fluorinator . DEVELOPMENT OF THE METAL TRANSFER PROCESS . . . e . . . 4.1 Equipment and Materials Used for Experiment MTE-1 . . . e
4.2 Experimental Procedure . . . . . 4.3 Experimental Results . e . . . . 4.4 Postoperational Equipment Examination . . . . . . . . . 4.5 Design and Testing of a Carbon-Steel Pump Having Molten-
Bismuth Check Valves . . . . . . . . . * . . . . . * * . STUDY OF THE PURIFICATION OF SALT BY CONTINUOUS METHODS . , . 5.1 Batch Treatment of Salt for Oxide Removal . . . . . . e . 5.2 Measured Flooding Rates During Countercurrent Plow of Molten
Salt and Hydrogen or Argon . . . . . . . . . . . . . . . *,
SEMICONTINUOUS REDUCTIVE EXTRACTION EXPERIMENTS IN,A MILD-STEEL FACILITY.. . . . . * . . . . . . . . . . . . . . . . . . . . .
V
1
2
2
3
10
12
16
16
23
26
29
29
33
35
45
46
46
48
49
52
iv
CONTENTS (Continued)
Page
6.1 Preparation for Mass Transfer Experiments , . . . . 52
6.2 Mass Transfer Experiment UTR-1 . , . 53
6.3 Mass Transfer Experiment UTR-2 . . . . 56
MEASUREMENT OF AXIAL DISPERSION COEFFICIENTS IN PACKED COLUMNS 58
7 .1 Experimental Results . . . . . e . 60 T 0 2 Comparison of Results with a Published Correlation . 88
90 8. REFERENCES.. . . . . . . . . . . . . . . . . . . . . . . . . .
V
SUMMARIES
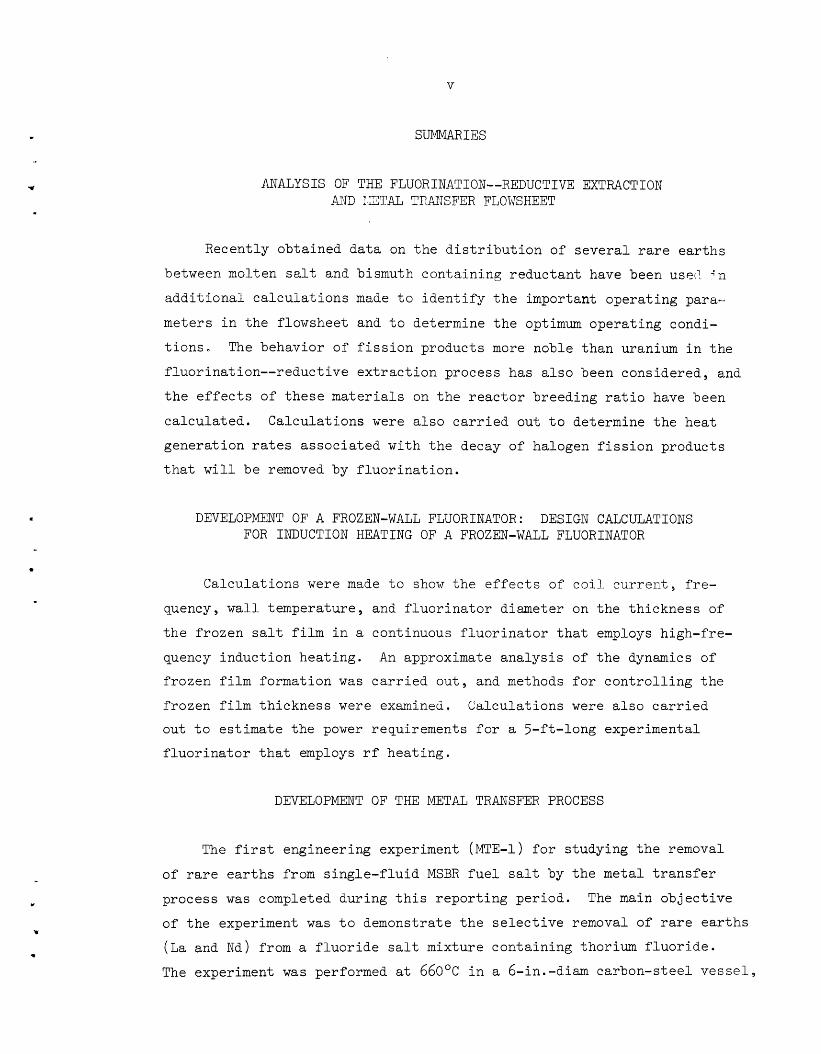
ANALYSIS OF THE FLUORINATION--REDUCTIVE EXTRACTION AND ZTAL TPAJEFER FLOWSHEET
Recently obtained data on the distribution of several rare earths
between molten salt and bismuth containing reductant have been use(? in
additional calculations made to identify the important operating para--
meters in the flowsheet and to determine the optimum operating condi-
tions.
fluorination--reductive extraction process has also been considered, and
the effects of these materials on the reactor breeding ratio have been
calculated. Calculations were also carried out to determine the heat
generation rates associated with the decay of halogen fission products
that will be removed by fluorination.
The behavior of fission products more noble than uranium in the
DEVELOPMENT OF A FROZEN-WALL FLUORINATOR: DESIGN CALCULATIONS FOR INDUCTION HEATING OF A FROZEN-WALL FLUORINATOR
Calculations were made to show the effects of coil. current, fre-
quency, wall temperature, and fluorinator diameter on the thickness of
the frozen salt film in a continuous fluorinator that employs high-fre-
quency induction heating. An approximate analysis of the dynamics of
frozen film formation was carried out, and methods for controlling the
frozen film thickness were examined. Calculations were also carried
out to estimate the power requirements for a 5-ft-long experimental
fluorinator that employs rf heating.
DEVELOPMENT OF THE METAL TRANSFER PROCESS
The f i r s t engineering experiment (MTE-1) for studying the removal
of rare earths from single-fluid MSBR fuel salt by the metal transfer
process was completed during this reporting period.
of the experiment was to demonstrate the selective removal of rare earths
(La and Nd) from a fluoride salt mixture containing thorium fluoride.
The experiment was performed at 660°c in a 6-in.-diam carbon-steel vessel,
The main objective
v i
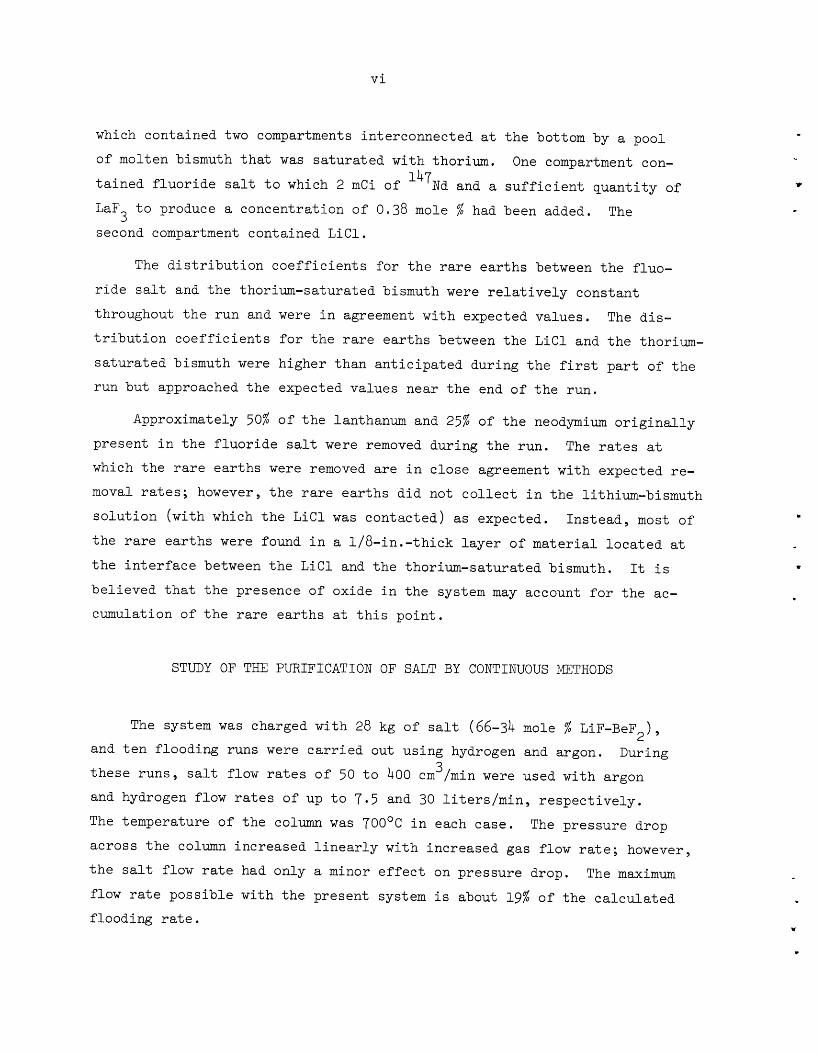
which contained two compartments in te rconnec ted a t t h e bottom by a pool
of molten bismuth t h a t was s a t u r a t e d wi th thorium.
t a i n e d f l u o r i d e sa l t t o which 2 m C i o f 147Nd and a s u f f i c i e n t q u a n t i t y of
LaF
second compartment contained L i C 1 .
One compartment con-
t o produce a concent ra t ion of 0.38 mole % had been added. The 3
The d i s t r i b u t i o n c o e f f i c i e n t s f o r t h e rare e a r t h s between t h e f luo-
r i d e sa l t and t h e thorium-saturated bismuth were r e l a t i v e l y cons tan t
throughout t h e run and were i n agreement wi th expected va lues .
t r i b u t i o n c o e f f i c i e n t s f o r t h e r a r e e a r t h s between t h e L i C l and t h e thorium-
s a t u r a t e d bismuth were h igher than a n t i c i p a t e d during t h e f i r s t p a r t of t h e
run bu t approached t h e expected va lues near t h e end of t h e run .
The d i s -
Approximately 50% o f t h e lanthanum and 25% of t h e neodymium o r i g i n a l l y
present i n t h e f l u o r i d e sa l t were removed during t h e run .
which t h e r a r e e a r t h s were removed a r e i n c lose agreement wi th expected re -
moval rates; however, t h e r a r e e a r t h s d i d not c o l l e c t i n t h e l i thium-bismuth s o l u t i o n (with which t h e L i C l was contac ted) as expected.
t h e r a r e e a r t h s were found i n a 1 /8- in . - th ick l a y e r of material l o c a t e d at
t h e i n t e r f a c e between t h e L i C l and t h e thorium-saturated bismuth.
be l i eved t h a t t h e presence of oxide i n t h e system may account f o r t h e ac-
cumulation of t h e r a r e e a r t h s at t h i s po in t .
The rates a t
Ins t ead , most of
It i s
STUDY OF THE PURIFICATION OF SALT BY CONTINUOUS mTHODS
The system w a s charged with 28 kg of sa l t (66-34 mole % LiF-BeF2),
and t e n f looding runs were c a r r i e d out us ing hydrogen and argon. During t h e s e runs , sa l t flow r a t e s of 50 t o 400 cm 3 /min were used wi th argon
and hydrogen flow rates of up t o 7 .5 and 30 l i t e r s / m i n , r e s p e c t i v e l y .
The temperature of t h e column was 700°C i n each case .
across t h e column increased l i n e a r l y wi th increased gas flow r a t e ; however,
t h e sa l t flow r a t e had only a minor e f f e c t on p res su re drop. The maximum flow r a t e poss ib l e wi th t h e present system i s about 19% of t h e c a l c u l a t e d
f looding rate.
The p res su re drop
I
8
w
c
v i i
SEMICONTINUOUS REDUCTIVE EXTRACTION EXPERIMENTS I N A MILD-STEEL FACILITY
U
.
I
H
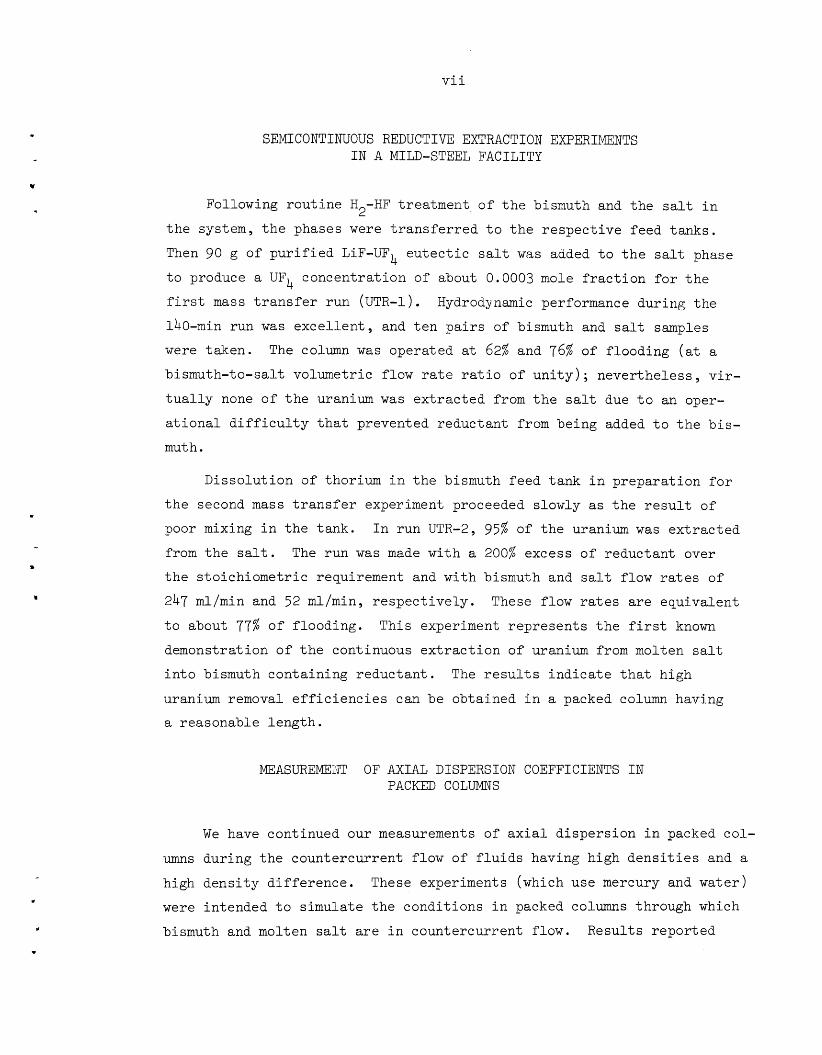
Following rou t ine H -HF t rea tment o f t h e bismuth and t h e sal t i n
t h e system, t h e phases were t r a n s f e r r e d t o t h e r e spec t ive feed tanks .
Then 90 g of p u r i f i e d LiF-UF4 e u t e c t i c sa l t w a s added t o t h e sal t phase
t o produce a UF4 concent ra t ion of about 0.0003 mole f r a c t i o n f o r t h e
f i r s t mass t r a n s f e r run (UTR-1)
140-min run w a s e x c e l l e n t , and t e n p a i r s of bismuth and sal t samples
were taken .
bismuth-to-salt volumetric flow r a t e r a t i o of u n i t y ) ; neve r the l e s s , v i r -
t u a l l y none of t h e uranium was ex t r ac t ed from t h e sa l t due t o an oper-
a t i o n a l d i f f i c u l t y t h a t prevented reductan t from being added t o t h e b i s -
muth.
2
Hydrodynamic performance during t h e
The column was operated at 62% and 76% of f looding ( a t a
Disso lu t ion of thorium i n t h e bismuth feed t ank i n p repa ra t ion f o r
t h e second mass t r a n s f e r experiment proceeded slowly as t h e r e s u l t of
poor mixing i n t h e tank .
from t h e s a l t . The run w a s made wi th a 200% excess of reductan t over
t h e s to i ch iomet r i c requirement and w i t h bismuth and sa l t flow r a t e s of
247 ml/min and 52 ml/min, r e spec t ive ly .
t o about 77% of f looding .
demonstration of t h e continuous e x t r a c t i o n of uranium from molten sal t
i n t o bismuth conta in ing r educ tan t . The r e s u l t s i n d i c a t e t h a t high
uranium removal e f f i c i e n c i e s can be obtained i n a packed column having
a reasonable l eng th .
I n run UTR-2, 95% of t h e uranium was ex t r ac t ed
These flow r a t e s a r e equiva len t
This experiment r ep resen t s t h e f i r s t known
MEASUREMENT OF AXIAL DISPERSION COEFFICIENTS I N PACKED COLUMNS
We have continued our measurements of a x i a l d i spe r s ion i n packed col-
umns dur ing t h e countercur ren t f low of f l u i d s having high d e n s i t i e s and a
high d e n s i t y d i f f e rence . These experiments (which use mercury and water )
were intended t o s imula te t h e condi t ions i n packed columns through which
bismuth and molten sal t a r e i n countercur ren t flow. Resul t s repor ted
v i i i
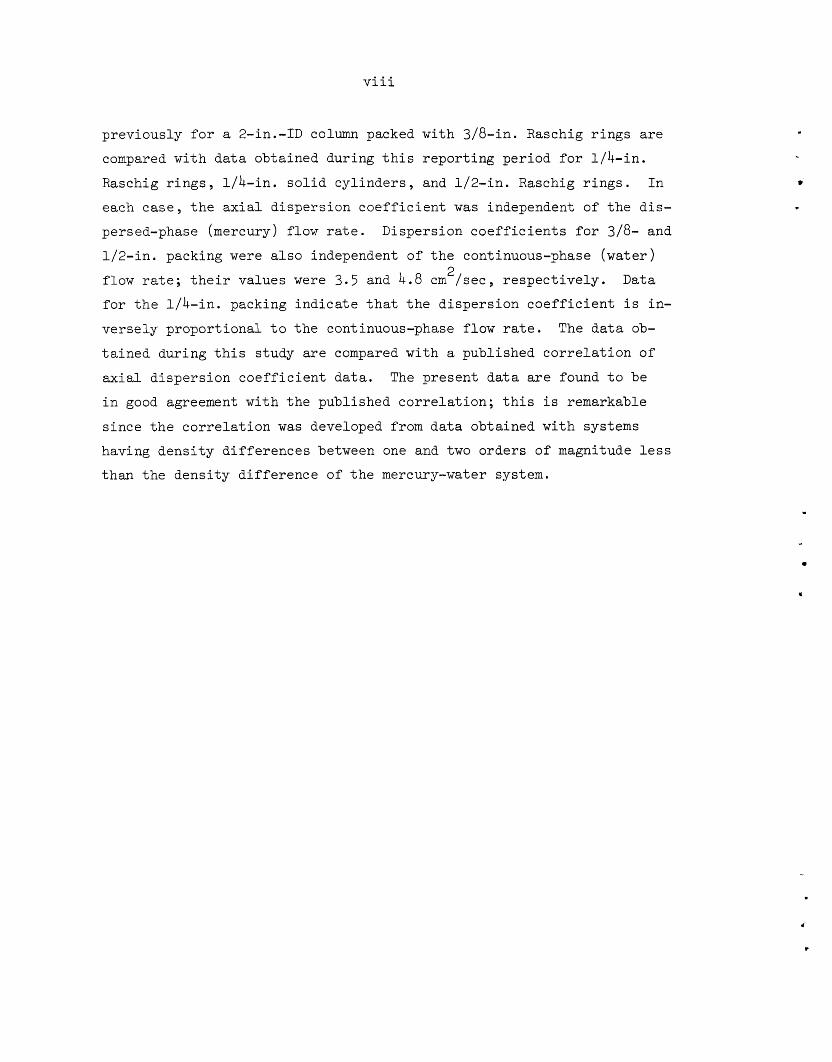
p rev ious ly f o r a 2-in.-ID column packed wi th 3/8-in. Raschig r i n g s a r e
compared with d a t a obtained during t h i s r epor t ing per iod f o r l / b - i n .
Raschig r i n g s , 1/b- in . s o l i d c y l i n d e r s , and 1/2- in . Raschig r i n g s .
each c a s e , t h e a x i a l d i spe r s ion c o e f f i c i e n t was independent of t h e d i s -
persed-phase (mercury) flow r a t e . Dispersion c o e f f i c i e n t s f o r 3/8- and
1/2- in . packing were a l s o independent of t h e continuous-phase (wa te r )
flow rate; t h e i r va lues were 3.5 and 4.8 cm / s e e , r e spec t ive ly . Data
f o r t h e 1/b- in . packing i n d i c a t e t h a t t h e d i spe r s ion c o e f f i c i e n t i s in-
ve r se ly p ropor t iona l t o t h e continuous-phase flow r a t e . The d a t a ob-
t a i n e d dur ing t h i s s tudy a r e compared wi th a publ ished c o r r e l a t i o n o f
axial d i spe r s ion c o e f f i c i e n t d a t a . The p resen t d a t a are found t o be
i n good agreement wi th t h e publ ished c o r r e l a t i o n ; t h i s i s remarkable
s i n c e t h e c o r r e l a t i o n was developed from d a t a obtained wi th systems
having d e n s i t y d i f f e rences between one and two o rde r s of' magnitude less
than t h e dens i ty d i f f e r e n c e of t h e mercury-water system.
I n
2
V
a
. d'
t
1
1. INTRODUCTION
s
A molten-sal t b reeder r e a c t o r (MSBR) w i l l be fue led with a molten
f luo r ide mixture t h a t w i l l c i r c u l a t e through t h e b lanket and core reg ions
of t h e r e a c t o r and through t h e primary hea t exchangers.
ing processing methods f o r use i n a close-coupled f a c i l i t y f o r removing
f i s s i o n products , cor ros ion products , and f i s s i l e materials from t h e
molten f l u o r i d e mixture .
We a r e develop-
Severa l opera t ions a s soc ia t ed wi th MSBR processing a r e under s tudy.
The remaining p a r t s of t h i s r e p o r t descr ibe :
f o r opera t ion wi th t h e combined flowsheet t h a t u t i l i z e s both f luor ina t ion- -
reduct ive e x t r a c t i o n and t h e meta l t r a n s f e r process , and r e s u l t s of calcu-
l a t i o n s showing t h e e f f e c t of noble-metal removal t i m e on r e a c t o r breeding
performance and t h e hea t genera t ion rates a s soc ia t ed with decay of t h e
halogen f i s s i o n products ; ( 2 ) r e s u l t s of c a l c u l a t i o n s t h a t show t h e sen-
s i t i v i t y of t h e f rozen f i l m th ickness i n a continuous f l u o r i n a t o r heated by high-frequency induct ion hea t ing t o c o i l c u r r e n t , frequency, w a l l temp-
e r a t u r e , and f l u o r i n a t o r diameter ; ( 3 ) r e s u l t s of t h e f i r s t engineer ing
experiment f o r demonstrating t h e meta l t r a n s f e r process f o r removal of
ra re-ear th f i s s i o n products from f l u o r i d e sa l t mixtures ; ( 4 ) s t u d i e s of t h e continuous p u r i f i c a t i o n of sa l t ; ( 5 ) experiments made i n a mi ld-s tee l reduct ive e x t r a c t i o n f a c i l i t y t o demonstrate t h e e x t r a c t i o n of uranium
from molten sa l t by countercur ren t con tac t with bismuth conta in ing reduc-
t a n t ; and ( 6 ) measurements of a x i a l d i spe r s ion i n packed columns during
t h e countercur ren t flow of mercury and water . T h i s work was c a r r i e d out
i n t h e Chemical Technology Divis ion during t h e per iod Apr i l through June
1970
(1) optimized condi t ions
2
2 . ANALYSIS OF THE FLUORINATION--REDUCTIVE EXTRACTION AND METAL TRANSFER FLOWSHEET
M. J. B e l l L. E . McNeese
A flowsheet t h a t uses f luor ina t ion- - reduct ive e x t r a c t i o n and t h e
metal t r a n s f e r process f o r removing pro tac t in ium and t h e rare e a r t h s 1 from t h e f u e l sa l t of a s ing le - f lu id MSBR has been descr ibed previous ly .
Calcu la t ions t o ident i f 'y t h e important opera t ing parameters i n t h i s flow-
shee t and t o determine t h e optimum opera t ing condi t ions have been cont inued
us ing r e c e n t l y obta ined d a t a on t h e d i s t r i b u t i o n of s e v e r a l rare e a r t h s
between molten sal t and bismuth conta in ing r educ tan t . The behavior of
f i s s i o n products more noble than uranium i n t h e f luor ina t ion- - reduct ive
e x t r a c t i o n process has a l s o been considered, and t h e e f f e c t s of t hese
m a t e r i a l s on t h e r e a c t o r breeding r a t i o have been determined by means of
c a l c u l a t i o n s . Calcu la t ions were a l s o c a r r i e d out t o determine t h e hea t
genera t ion r a t e s a s soc ia t ed wi th t h e decay o f halogen f i s s i o n products
t h a t w i l l be removed by f l u o r i n a t i o n . These items a r e d iscussed i n d e t a i l
i n t h e remainder o f t h i s s e c t i o n .
2 .1 D i s t r i b u t i o n of Rare-Earth and Alkaline-Earth Elements Between Molten S a l t and Bismuth Containing Reductant
F e r r i s and co-workers2 have continued t o measure t h e equi l ibr ium
d i s t r i b u t i o n of f i s s i o n product and a c t i n i d e elements between molten
sal t and bismuth conta in ing r educ tan t . They have found t h a t , a t a given
temperature , t h e d i s t r i b u t i o n c o e f f i c i e n t f o r element M , def ined as
- mole f r a c t i o n of M i n bismuth phase - 'M mole f r a c t i o n of M i n sa l t phase '
can be expressed as
+€ l o g DM = n l o g XLi + log % , .
3
where
= the mole fraction of lithium in the bismuth phase, 'Li n = the valence of M in the salt phase, and +$ log KM = a constant.
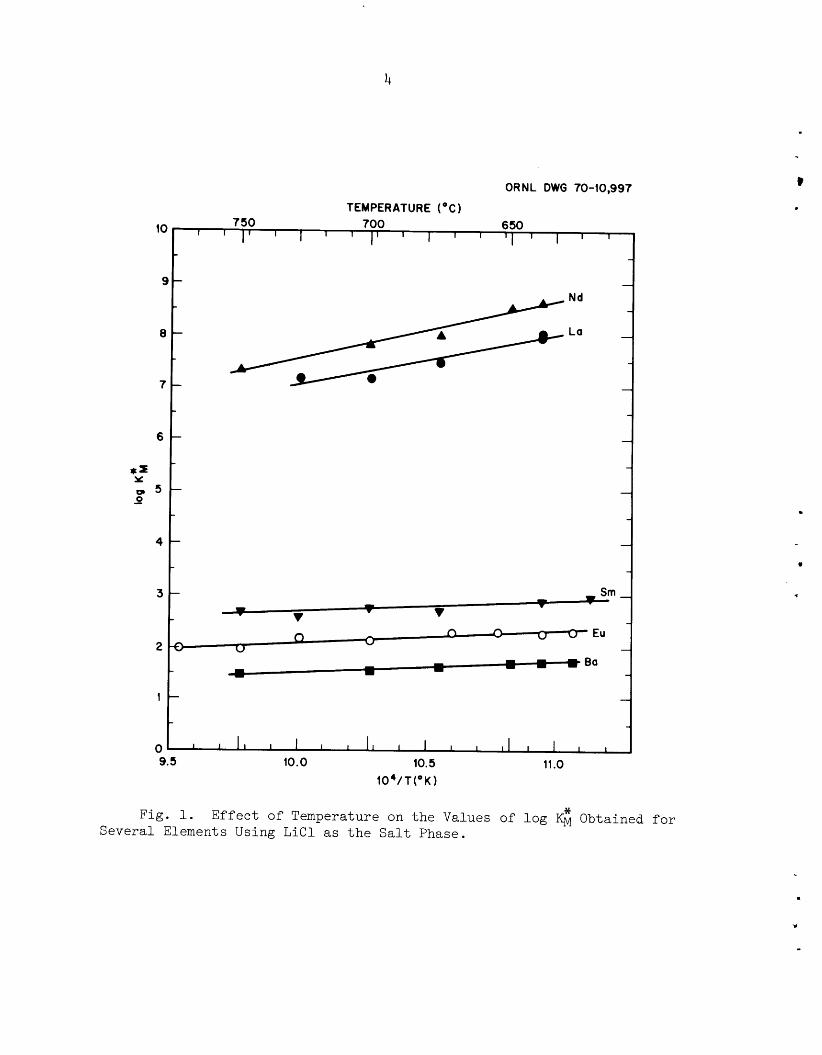
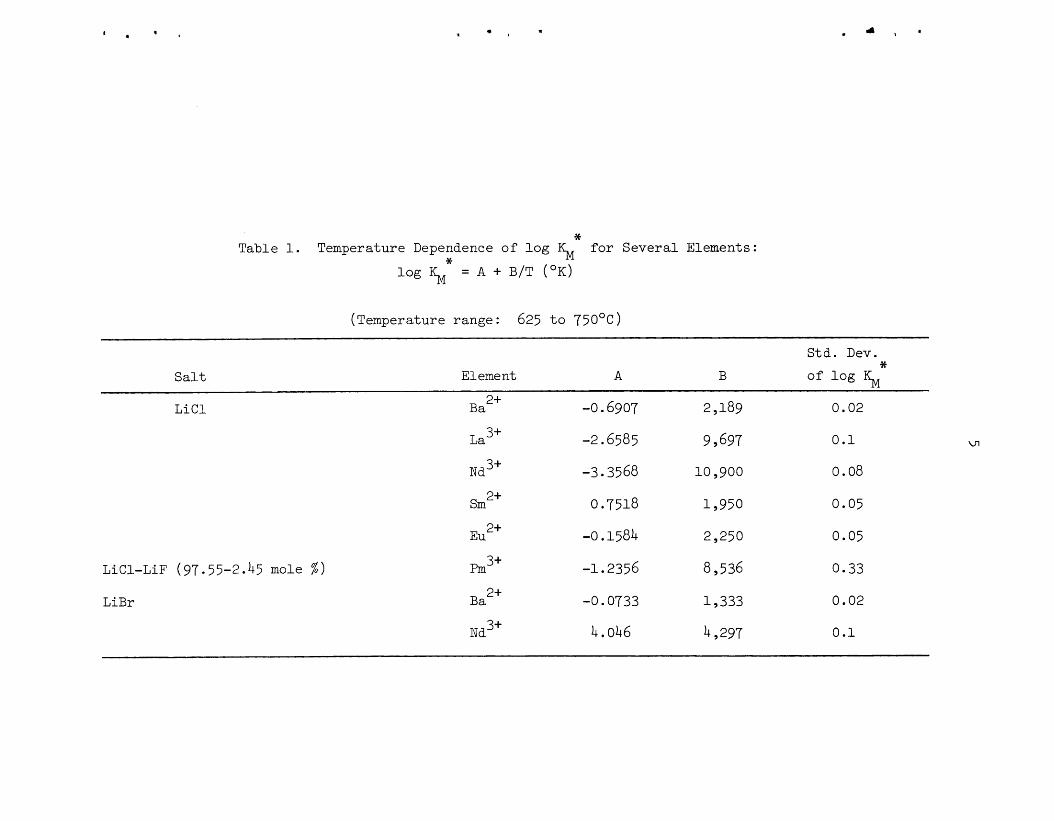
+% Plots of the log K&
over the temperature range 625-750'~~ as shown in Fig. 1. Thus, the temp- +$ +%
erature dependence of log 5 can be expressed as log % Val- ues of the constants A and B used in the present flowsheet calculation are
shown in Table 1 for several elements. These data indicate that the dis-
tribution of the rare earths is relatively insensitive to temperature and
that the distribution coefficients for a given element are about the same,
regardless of whether lithium chloride or lithium bromide is used as the salt phase.
values vs reciprocal absolute temperature are linear
= A + B/T.
2.2 Isolation of Protactinium Using Fluorination--Reductive Extraction
e
m
Calculations were made for selecting optimum operating conditions for
the protactinium isolation system.
sumed to be those resulting in the minimum partial fuel cycle cost.
partial fuel cycle cost includes the following components of the fuel cycle
cost which are associated with the isolation of protactinium:
and uranium inventories in the protactinium decay tank, (2) the loss of
bred uranium resulting from inefficient protactinium isolation, (3) the
Optimum conditions were tentatively as-
The
(1) bismuth
cost of 7 Li reductant required to extract uranium and protactinium from
the fuel salt, and (4) the cost of BeF2 and ThF4, which must be added to the system in order to maintain a constant fuel salt composition.
terest rate of 14% per annum was used to compute inventory charges, and An in-
-
the value of 233U was taken to be $12/g. The following costs were used
for chemicals : bismuth, $5/lb; ThF4 , $6.50/lb; BeF2 , $7.50/lb; and 7Li metal , $55/lb.
Values that were obtained for the partial fuel cycle cost include
only those charges directly related to the isolation of protactinium and
include no contribution either for fluorination of the fuel salt to remove
4
io 750 700 650 I I I I I ' 1 1 1 I 1 1 1 1 I ' 1
5
8
7
6
*: - 5 0 -
4
3
2
1
0 9.5 10.0 10.5
I O ~ / T ( O K )
11.0
Fig . 1. Effec t of Temperature on t h e Values of l o g KM * Obtained f o r Severa l Elements Using L i C l as t h e S a l t Phase.
c
8
.
5
c 1
.. cI1 -P
d
a,
rl w
rl cd k
a,
m
k
0
k
8 t
* 3.2
bo-
0
ha
0
+ a, 0
4
d a, II
rd
d*
"3
E nh
o
0
Or
l
k =s -9 cd k a, a
B
fl rl a, d
'B
%
n
u
0 0
Ln
t- O
-9 Ln
cu u
.. a, ho d cd k a, k
=s -P
d k
a, F4
B
8 W
;*s a, -
rl
rd
-P
k
mo
a
4
-P d
a,
rl w 8 -P
rl cd cn
cu 0
0
o\
a3
cu rln
t- 0
o\
\o
0 I
t N cd F9
rl u
*rl d
rl 0
t- o\
m
Ln
a3 Ln
u
cu I
+ M cd 4
03
0
0
0
0
0
rl
o\,
co \o
Ln
M
M I .
+ M rd z
Ln
0
0
0
In
rl o\,
a3 rl Ln
t- 0
+ cu a cn
Ln
0
0 . 0
Ln
cu
A- a
Ln
rl 0 I .
+ cu =s w
cr) M
0 . \D
M
Ln n
a3
u
Ln
M
cu rl I .
+ n
N
a,
Ln
A- cu . I In
Ln . t- o\ W
cu 0
0
M
M
rl 2
M
M
r? 0
0 I .
+ cu cd a
6
uranium o r f o r removal of f i s s i o n products (notab ly zirconium) i n t h e pro tac t in ium i s o l a t i o n system.
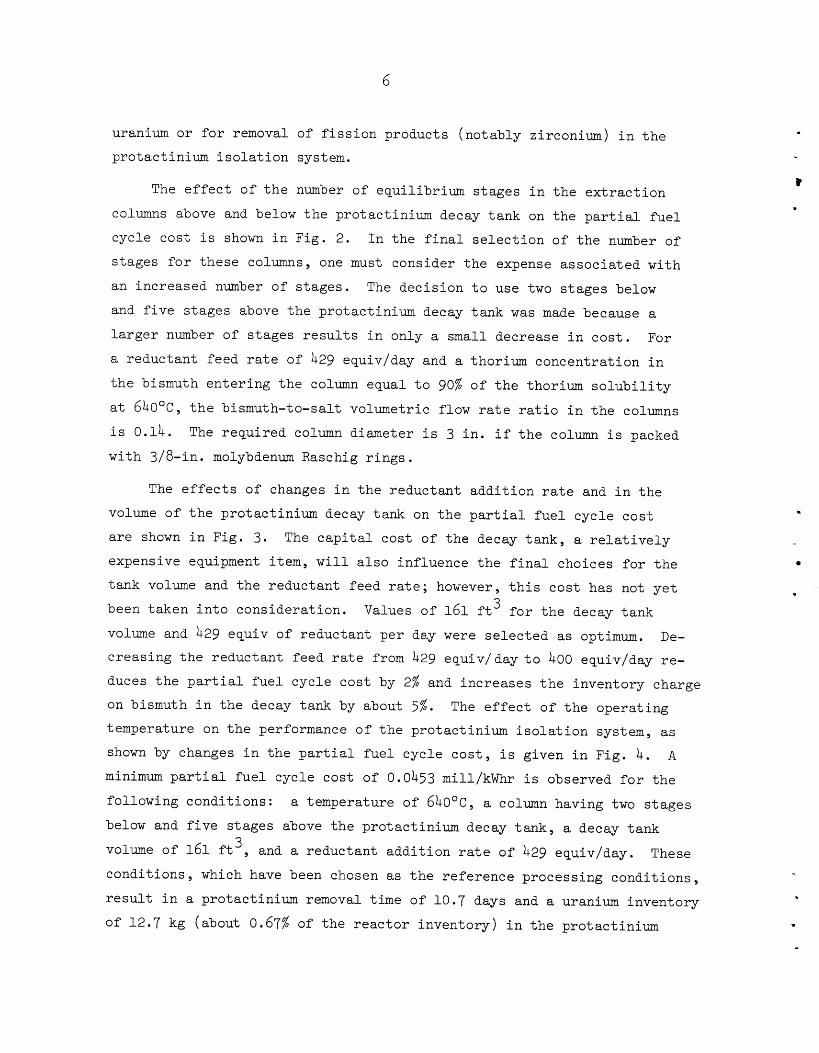
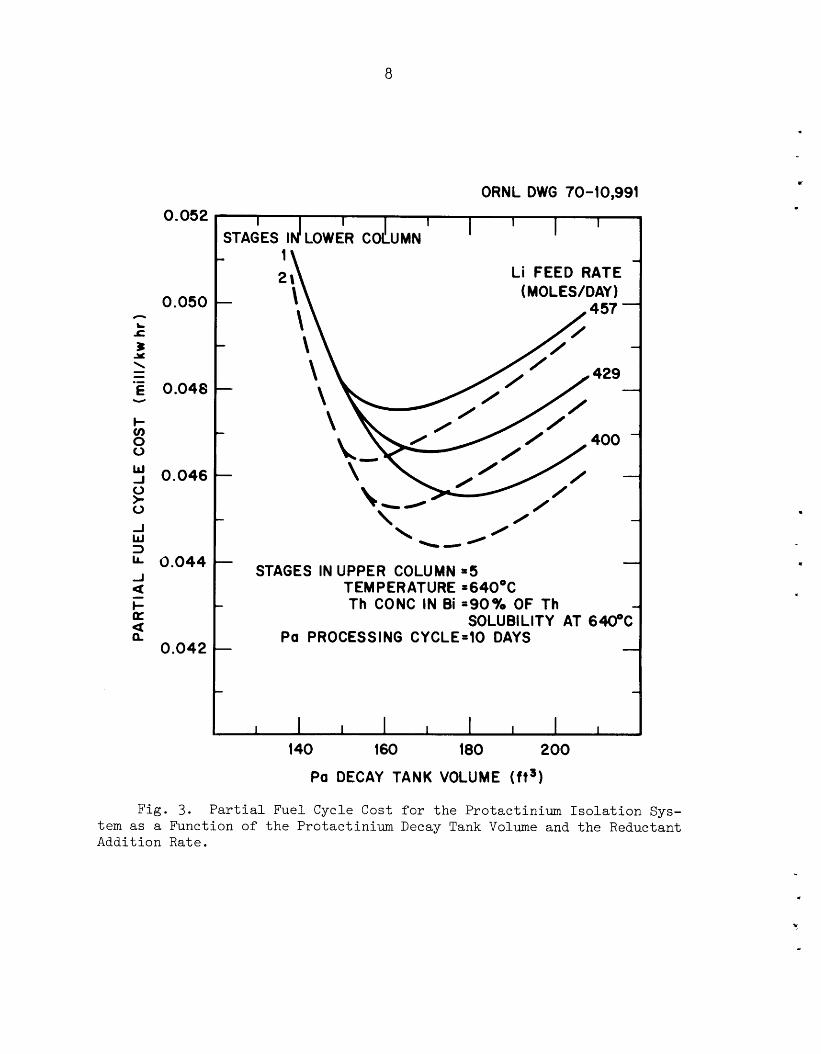
The e f f e c t o f t h e number of equi l ibr ium s t ages i n t h e e x t r a c t i o n
calumns above and below t h e pro tac t in ium decay t ank on t h e p a r t i a l f u e l
cyc le cos t i s shown i n Fig. 2. I n t h e f i n a l s e l e c t i o n of t h e number of
s t ages f o r t hese columns, one must consider t h e expense a s soc ia t ed wi th
an increased number of s t ages . The dec i s ion t o use two s t ages below
and f i v e s t ages above t h e pro tac t in ium decay t ank was made because a
l a r g e r number of s t ages r e s u l t s i n only a small decrease i n c o s t .
a reductan t feed r a t e of 429 equiv/day and a thorium concent ra t ion i n
t h e bismuth e n t e r i n g t h e column equal t o 90% of t h e thorium s o l u b i l i t y
a t 640°C, t h e bismuth-to-salt volumetric flow r a t e r a t i o i n t h e columns
i s 0.14. The r equ i r ed column diameter i s 3 i n . i f t h e column i s packed wi th 3/8-in. molybdenum Raschig r i n g s .
For
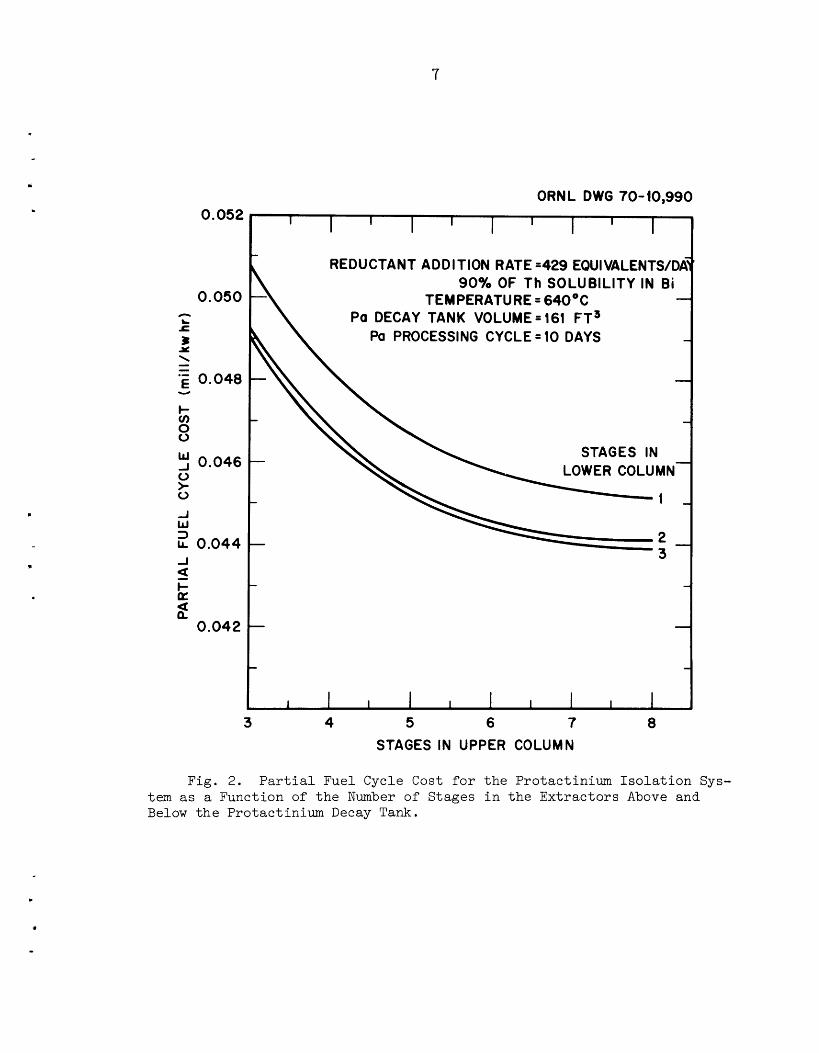
The e f f e c t s of changes i n t h e reductan t add i t ion ra te and i n t h e
volume o f t h e pro tac t in ium decay tank on t h e p a r t i a l f u e l cyc le c o s t
are shown i n Fig. 3. expensive equipment i tem, w i l l a l s o inf luence t h e f i n a l choices f o r t h e
tank volume and t h e reductan t feed r a t e ; however, t h i s cos t has not y e t
been t aken i n t o cons ide ra t ion .
volume and 429 equiv of reductan t pe r day were s e l e c t e d as optimum. De- c r eas ing t h e reductan t feed r a t e from 429 e q u i v / d a y t o 400 equiv/day re -
duces t h e p a r t i a l f u e l cyc le cos t by 2% and inc reases t h e inventory charge
on bismuth i n t h e decay tank by about 5%. temperature on t h e performance o f t h e pro tac t in ium i s o l a t i o n system, as
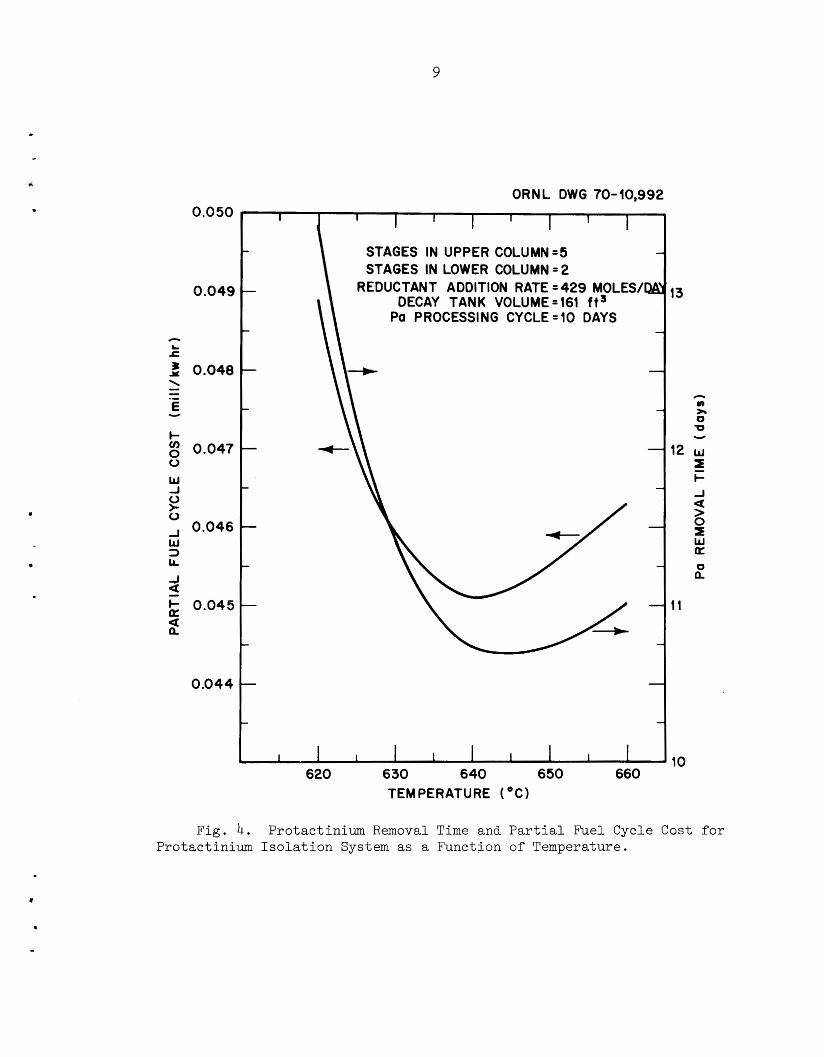
shown by changes i n t h e p a r t i a l f u e l cyc le c o s t , i s given i n Fig. 4 . A minimum p a r t i a l f u e l cyc le cos t of 0.0453 mill/kWhr i s observed f o r t h e
fol lowing condi t ions :
below and f i v e s t ages above t h e pro tac t in ium decay t ank , a decay t ank
volume o f 161 f t 3 , and a reductan t a d d i t i o n r a t e of 429 equiv/day.
cond i t ions , which have been chosen as t h e r e fe rence process ing cond i t ions ,
r e s u l t i n a pro tac t in ium removal t i m e o f 10.7 days and a uranium inventory
of 12.7 kg (about 0.67% of t h e r e a c t o r inventory) i n t h e pro tac t in ium
The c a p i t a l cos t of t h e decay t ank , a r e l a t i v e l y
Values o f 161 f t 3 f o r t h e decay tank
The e f f e c t o f t h e opera t ing
a temperature of 640°C, a column having two s t a g e s
These
u
'1
.
7
ORNL DWG 70-10,990 I
. 0.052
0.050 h L c
Y \
L
*E 0.048 I- v) 0 0
- - U
0.046 0 > 0
1 w 0.044
1
I- Qf
5
2 0.042
I I I I I I I 1 I 1 REDUCTANT ADDITION RATE =429 EQUIVALENTS/I
90% OF Th SOLUBILITY IN Bi TEMPERATURE = 64OoC
Pa DECAY TANK VOLUME=161 FT3 Pa PROCESSING CYCLE = 10 DAYS
STAGES IN LOWER COLUMh
3 4 5 6 7 8 STAGES IN UPPER COLUMN
Fig. 2. Partial Fuel Cycle Cost for the Protactinium Isolation Sys- tem as a Function of the Number of Stages in the Extractors Above and Below the Protactinium Decay T a n k .
8
0.052
0.050 n L r
Y s 1: *E 0.048 - Y
5 0.046 0 > 0 -I w 3
-J Q I-
0.044
- a
0.042 2
ORNL DWG 70-10,991
' I ' I ' I T STAGES ' J I LOWER COLUMN
L i FEED RATE (MOLES/DAY)
- STAGES IN UPPER COLUMN =5
TEMPERATURE =64OoC Th CONC IN Bi =9OayO OF Th
SOLUBILITY AT 640% - Pa PROCESSING CYCLE=10 DAYS
I 1 I 1 I I I I I
140 160 180 200
Pa DECAY TANK VOLUME ( f t3 )
U
.
Fig. 3. Partial Fuel Cycle Cost for the Protactinium Isolation Sys- tem as a Function of the Protactinium Decay Tank Volume and the Reductant Addition Rate.
8
v
9
ORNL DWG 70-10,992 I I I I I I I I 1 0.050
0.049
h L r 2 0.048
E
I-
0 W -I 0 > 0
W 3 L L
\ - .- Y
0.047
-I 0.046
a! E 0.045 a n
0.044
STAGES IN UPPER COLUMN=5 STAGES IN LOWER COLUMN = 2
REDUCTANT ADDITION RATE = 429 MOLESA DECAY TANK VOLUME=161 f t 3
Pa PROCESSING CYCLE =10 DAYS
I I I I 1 I I 1 I I 620 630 640 650 660
TEMPERATURE ( " C )
13
h cn )r 0 U Y
12 w r I- -I
-
a zi r W
O
a
n
11
10
Fig. 4. Protactinium Removal Time and Partial Fuel Cycle Cost for Protactinium Isolation System as a Function of Temperature.
f
10
decay t ank . The components of t h e p a r t i a l f u e l cyc le cos t are as fol lows:
bismuth inventory charge, 0.0097 mill/kWhr; uranium inventory charge,
0.003 mill/kWhr; l o s s i n 233U due t o i n e f f i c i e n t pro tac t in ium i s o l a t i o n ,
0.0013 mill/kWhr; 7 L i metal consumption, 0.0151 mill/kWhr; and BeF2 and
ThF a d d i t i o n , 0.0163 mill/kWhr. 4
2 .3 Removal of Noble Metals w i th t h e Fluorinat ion-- Reductive Ex t rac t ion Flowsheet
Previous c a l c u l a t i o n s of f i s s i o n product i nven to r i e s and poisoning
i n an MSBR have assumed t h a t most of t h e noble meta ls (Se , Nb, Mo, Tc, Ru, Rh, Pd, Ag, Sb, and Te) have been removed f r o m t h e f u e l sa l t on a
shor t (50-sec) cyc le by being p l a t e d out on metal su r f aces o r by being
t r a n s p o r t e d t o t h e off-gas system as a flsmoke.f' A s a r e s u l t of t h e s e as-
sumptions, t h e neutron poisoning by these ma te r i a l s was n e g l i g i b l e ; how-
eve r , t h e hea t l oad on t h e off-gas system w a s increased by about 1 0 Mw. A more conserva t ive assumption with regard t o both neutron poisoning and
hea t genera t ion i n t h e process ing p l a n t would be t h a t a s i g n i f i c a n t f r a c t i o n of t h e s e m a t e r i a l s w i l l remain i n t h e f u e l sa l t and w i l l be re-
moved i n t h e process ing p l a n t . Accordingly, we have made c a l c u l a t i o n s
t o e s t ima te t h e neutron poisoning caused by t h e s e m a t e r i a l s i n t h e event
t h a t t hey remain i n t h e f u e l sa l t . These c a l c u l a t i o n s assumed a chemical
process ing system i n which pro tac t in ium was removed by f luor ina t ion- -
r educ t ive e x t r a c t i o n on a 10-day cyc le and t h e r a r e e a r t h s were removed
on a 25-day cyc le by t h e metal t r a n s f e r process .
meta ls ( i . e . , Se, Nb, Mo, Tc, Ru, Sb, and Te) form v o l a t i l e f l u o r i d e s
dur ing f l u o r i n a t i o n and can be separa ted with varying degrees of d i f -
f i c u l t y from UF by so rp t ion on materials such as NaF. The remaining
m a t e r i a l s ( G a , Ge, Rh, Pd, Ag, Cd, I n , and Sn) are r e l a t i v e l y so lub le
i n bismuth and w i l l be e x t r a c t e d i n t o t h e bismuth wi th t h e same removal
t ime as Pa.
Many of t h e noble
6
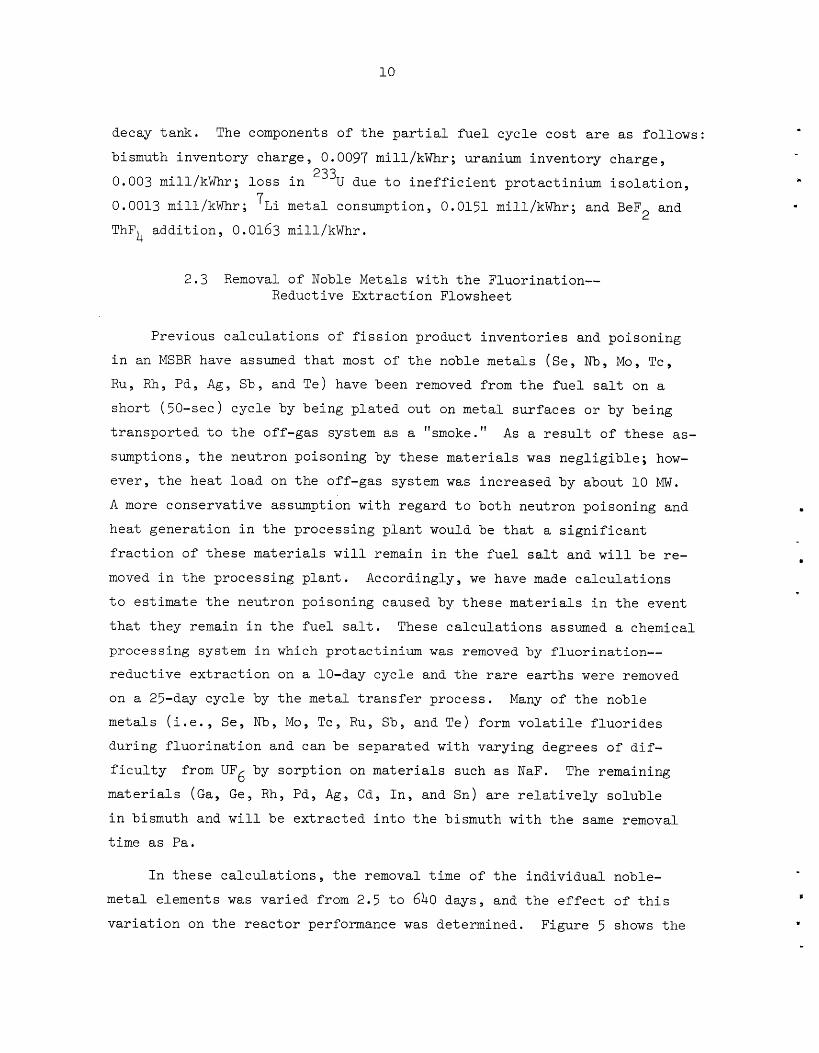
I n t h e s e c a l c u l a t i o n s , t h e removal t ime of t h e ind iv idua l noble-
metal elements w a s va r i ed from 2.5 t o 640 days, and t h e e f f e c t of t h i s
v a r i a t i o n on t h e r e a c t o r performance w a s determined. Figure 5 shows t h e
R
.
1
1
11
I I
I I
I In
0
In
0
N
In
9 0
0
0
2 pc
0
I 0
0
0
I I
I
Fi 0
0
0
* 0
0
(u
N 0
3 2 I! * N
.
12
e f f e c t of t h e removal time f o r important noble metal elements which form
v o l a t i l e f l u o r i d e s on t h e f u e l y i e l d of an M S B R . The elements t h a t have
t h e most e f f e c t on neutron poisoning a r e Tc, Ru, and M o ; Se , Sb, Nb, and
Te have v i r t u a l l y no e f f e c t . The curves i n F ig . 5 a r e r e l a t i v e l y f l a t
f o r removal times s h o r t e r t han about 100 days, i n d i c a t i n g t h a t t h e r e -
moval e f f i c i e n c y f o r an ind iv idua l element may be as l o w as 10% without
s e r i o u s l y impair ing r e a c t o r performance.
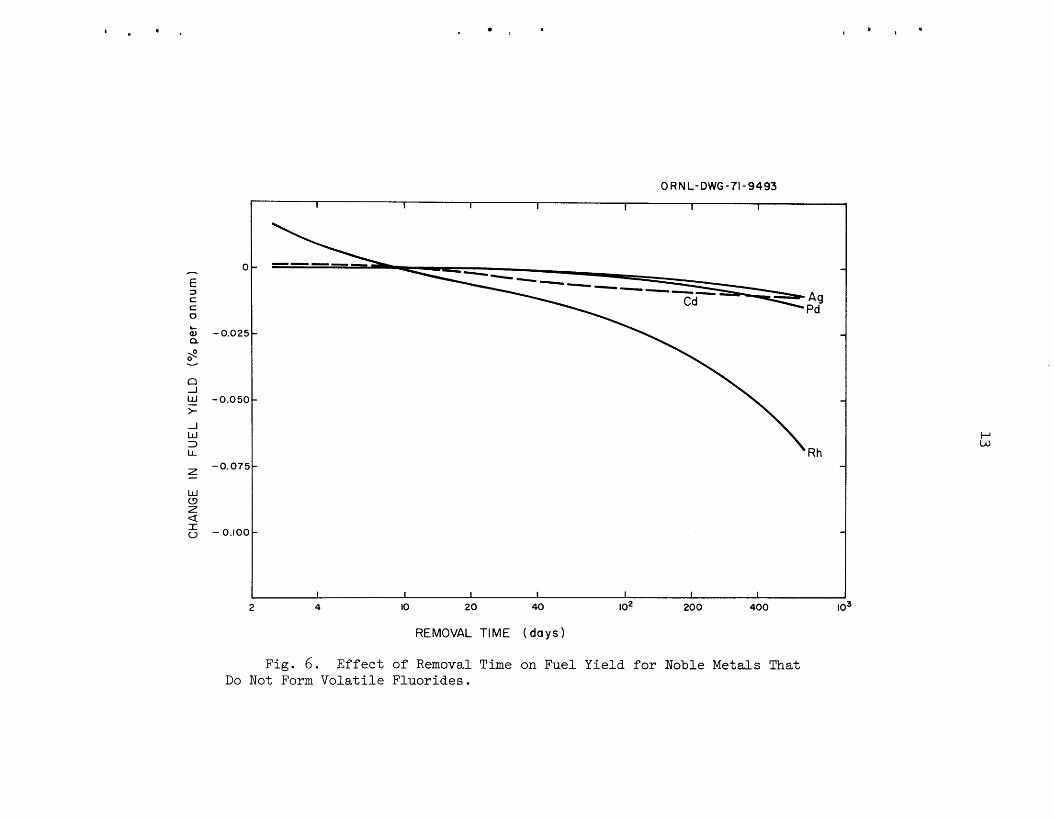
removal time on t h e f u e l y i e l d f o r elements wi th nonvo la t i l e f l u o r i d e s .
Here, a r e l a t i v e l y l a r g e decrease i n f u e l y i e l d i s a s soc ia t ed with long
removal t imes f o r Rh, while t h e elements Cd, Pd, and Ag have only a small
e f f e c t . Negl ig ib le e f f e c t s were observed f o r G a , G e , I n , and Sn. I n
t h e s e c a l c u l a t i o n s , a 10-day removal t i m e for a l l noble metals was t aken
as t h e r e fe rence condi t ion .
soning ( Y ) f o r t h e noble metals i s 0.0010 absorp t ion pe r f i s s i l e absorp-
t i o n . The p r i n c i p a l i so topes con t r ibu t ing t o t h i s poisoning are:
Y = 0.00085; '13 Cd, Y = 0.00005; 99Tc, Y = 0.00003; and lo3Rh, Y = 0.00002.
Figure 6 shows t h e e f f e c t of
For t h i s cond i t ion , t h e t o t a l neutron poi-
lo5Rh ,
If t h e noble metals a r e removed on a 10-day cyc le , t h e i r combined
thermal power w i l l be 0.98 MW.
system w i l l depend on t h e f r a c t i o n s o f noble-metal f l u o r i d e s t h a t are
c o l l e c t e d i n t h i s system and t h e i r res idence t ime.
sources among noble metals having v o l a t i l e f l u o r i d e s a r e given i n Table 2. The maximum amount o f hea t t h a t could be produced i n t h e UF
t i o n system, assuming t h a t t h e s e i so topes were c o l l e c t e d wi th 100% ef-
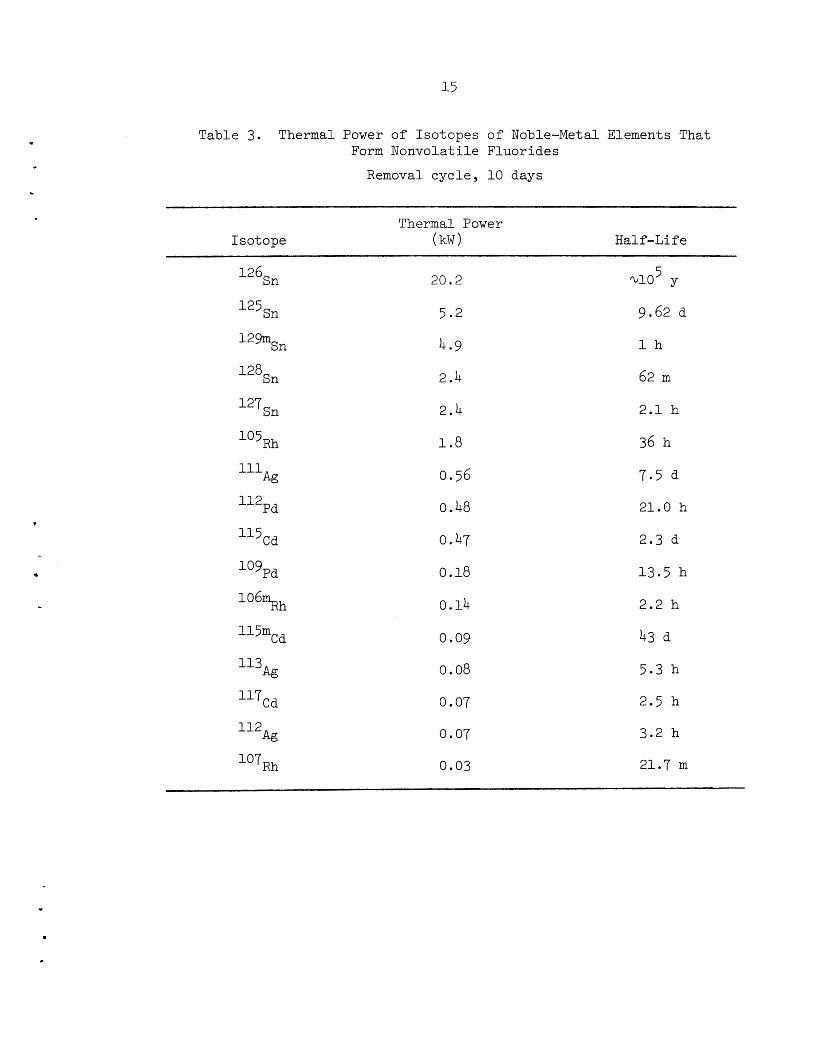
f i c i e n c y and r e t a i n e d i n d e f i n i t e l y would be 0.95 MW. S imi l a r d a t a are
shown i n Table 3 f o r t h e noble-metal f i s s i o n products whose f l u o r i d e s
are not v o l a t i l e . These i so topes w i l l add a maximum of 30 kW of hea t
t o t h e bismuth stream i n t h e pro tac t in ium i s o l a t i o n system.
The hea t load on t h e f l u o r i n a t o r off-gas
The important hea t
6 separa-
2.4 Halogen Removal i n t h e Uranium Removal System
I n t h e f luor ina t ion- - reduct ive e x t r a c t i o n flowsheet f o r removal of
uranium and i s o l a t i o n of pro tac t in ium from M S B R f u e l s a l t , t h e halogen
f i s s i o n products w i l l be removed as v o l a t i l e f l u o r i d e s and w i l l e n t e r
t h e UF sepa ra t ion system wi th a 10-day removal t i m e . These materials 6
a
CI
E 3 c c 0
a, Q
L
8 u
LI1 -1
> -1 W 3 LL
w
z W c3 Z
I 0
a
0
- 0.025
-0.05C
-0.07:
- 0.1oc
0 RNL-DWG-71-9493 I I I I I I I
2 4 IO 20 40 io2 200 400 io3
REMOVAL TIME ( d a y s )
Fig. 6 . E f f e c t of Removal Time on Fuel Yield f o r Noble Metals That Do Not Form V o l a t i l e Fluorides .
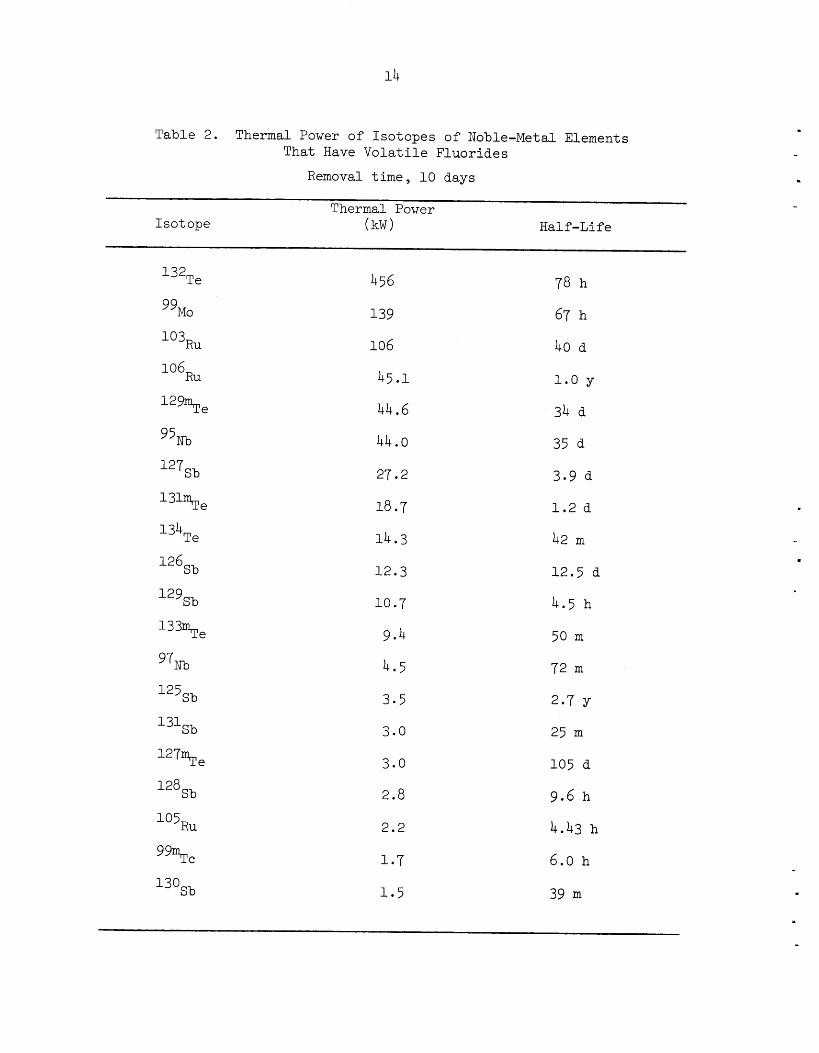
Table 2. Thermal Power of I so topes o f Noble-Metal Elements That Have V o l a t i l e F luor ides
Removal t ime, 1 0 days
Thermal Power I so tope (kW) Half - L i f e
139
106
4 5 . 1
44.6
44.0
27.2
18.7
14 .3
12 .3
10.7
9.4
4 . 5
3 .5
3.0
3.0
2.8
2.2
1 .7
1 . 5
78 h
67 h
40 d
1 . 0 y
34 d
35 d
3.9 d
1.2 d
42 m
12 .5 d
4 . 5 h
50 m
72 m
2.7 y
25 m
105 d
9.6 h
4.43 h
6 .0 h
39 m
.
1.5
. Table 3. Thermal Power of Isotopes of Noble-Metal Elements That Form Nonvolatile Fluorides
Removal cycle, 10 days
Thermal Power Isotope (kW) Half-Life
126Sn
125Sn
127Sn
lo5Rh
Ag 111
'13Ag
l17Cd
Ag 112
lo7Rh
20.2
5-2
4.9
2.4
2.4
1.8
0.56
0.48
0.47
0.18
0.14
0.09
0.08
0.07
0.07
0.03
5 %lo y
9.62 d
l h
62 m
2.1 h
36 h
7.5 d
21.0 h
2.3 d
13.5 h
2.2 h
43 d
2.5 h
3.2 h
21.7 m
16
w i l l con ta in a number of i so topes which could c o n t r i b u t e as much as 0 .3 MW t o t h e hea t load on t h e fluorinator--UF The p r i n c i p a l hea t sources i n t h i s group are given i n Table 4. With t h e ex- cep t ion o f 13’1, a l l of t h e important m a t e r i a l s a r e i so topes of i od ine
wi th h a l f - l i v e s of l e s s than 1 day.
and bromine would be c o l l e c t e d i n t h e uranium removal system i s 1 g/day.
c o l l e c t i o n system. 6
The maximum r a t e a t which iod ine
3. DEVELOPMENT OF A FROZEN-WALL FLUORINATOR: DESIGN CALCULATIONS FOR INDUCTION HEATING OF A FROZEN-WALL FLUORINATOR
J. R , Hightower, Jr . C . P. Tung
We are cont inuing t o s tudy rf induct ion hea t ing of molten sa l t as
a method f o r providing a cor ros ion- f ree hea t source f o r an experimental
continuous f l u o r i n a t o r i n which a f i l m of sa l t i s f rozen on t h e walls
t o p r o t e c t aga ins t cor ros ion .
hea t ing may be s u i t a b l e f o r ba tch f l u o r i n a t o r s , and we have made calcu-
t i o n s and experiments
used wi th a continuous f l u o r i n a t o r .
A previous study3 showed t h a t induct ion
4 which i n d i c a t e t h a t induct ion hea t ing can a l s o be
This s e c t i o n summarizes r e s u l t s of c a l c u l a t i o n s t h a t show t h e ef-
f e c t s of c o i l c u r r e n t , frequency, w a l l temperature , and f l u o r i n a t o r
diameter on t h e th i ckness of t h e frozen sa l t f i l m i n a continuous f l u o r i -
na to r employing high-frequency induct ion hea t ing . Methods f o r cont ro l - l i n g t h e th i ckness of t h e f rozen f i l m a r e a l s o d iscussed . S ince t h e ef-
f i c i e n c y of hea t ing t h e s a l t cannot be r e l i a b l y c a l c u l a t e d , an experiment
t h a t uses an aqueous e l e c t r o l y t e as a s u b s t i t u t e f o r molten s a l t w i l l be
c a r r i e d out i n order t o measure hea t ing e f f i c i e n c y i n equipment similar
t o t h e f l u o r i n a t o r .
3 . 1 E f f e c t s of Wall Temperature, Curren t , Frequency, and F luo r ina to r Diameter on t h e Thickness of t h e
Frozen Film
I n t h e proposed f l u o r i n a t o r conf igu ra t ion (des igna ted previous ly 4 as
conf igu ra t ion I ) , t h e induct ion c o i l s are embedded i n t h e f rozen sa l t film
c
8
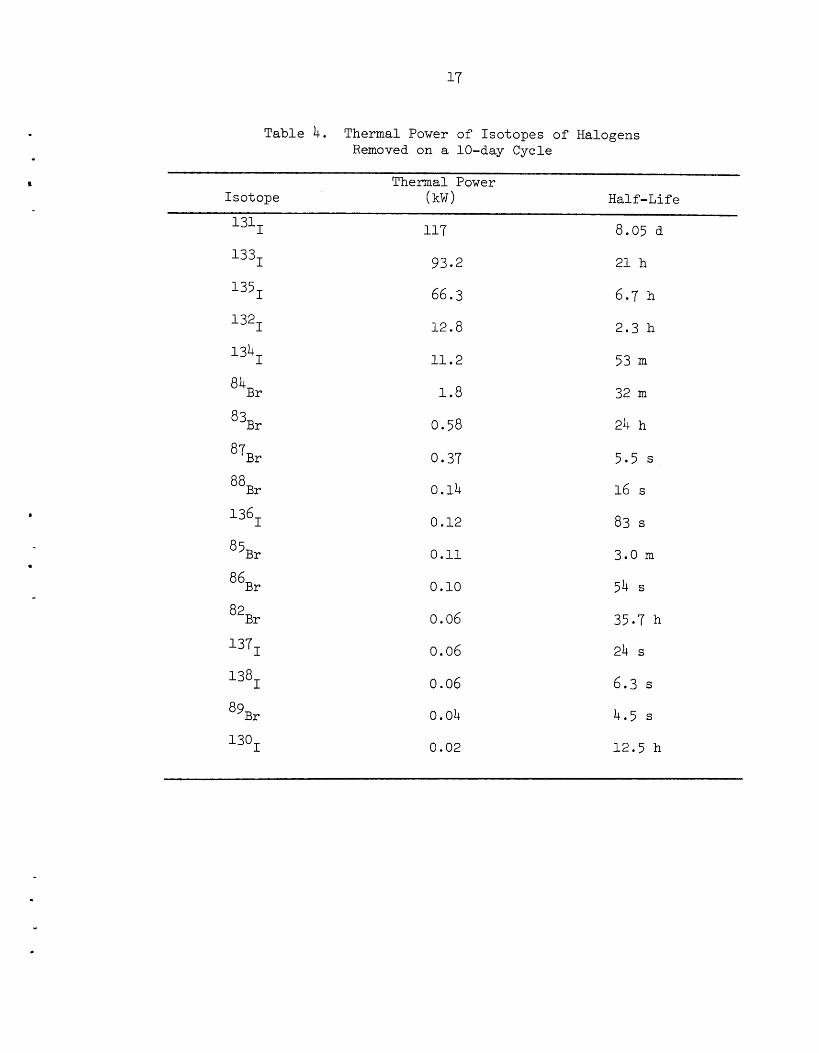
Table 4. Thermal Power of Isotopes of Halogens Removed on a 10-day Cycle
Thermal Power Isotope (kW) Half-Life 1 3 1
133,
117 8.05 d
93.2 21 h
66.3 6.7 h
134,
B r 84
3Br
87Br
88Br
136,
5Br
86Br
12.8
11.2
1 .8
0.58
0.37
0.14
0.12
0.11
0.10
2 .3 h
53
32 m
24 h
5.5 s
16 s
83 s
3.0 m
54 s
82Br 0.06 35.7 h
138,
89Br
130,
0.06 24 s
0.06 6.3 s
0.04
0.02
4 . 5 s
12 .5 h
”
.
18
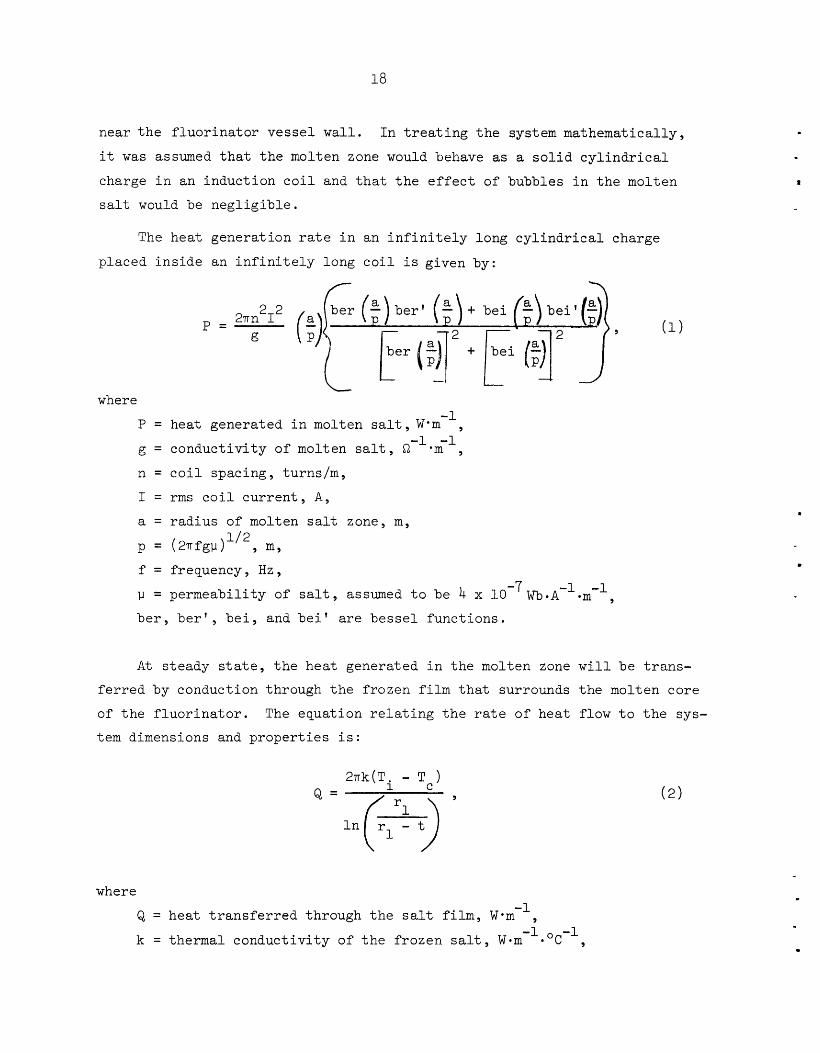
near t h e f l u o r i n a t o r v e s s e l w a l l . I n t r e a t i n g t h e system mathematical ly ,
it was assumed t h a t t h e molten zone would behave as a s o l i d c y l i n d r i c a l
charge i n an induct ion c o i l and t h a t t h e e f f e c t of bubbles i n t h e molten
s a l t would be n e g l i g i b l e .
The hea t genera t ion r a t e i n an i n f i n i t e l y long c y l i n d r i c a l charge
placed i n s i d e an i n f i n i t e l y long c o i l i s given by:
P =
where -1
-1 -1 P = heat generated i n molten s a l t , W*m , g = conduct iv i ty of molten s a l t , R * m , n = c o i l spac ing , turns/m,
I = r m s c o i l c u r r e n t , A ,
a = r a d i u s of molten sa l t zone, m,
f = frequency, Hz,
1-1 = permeabi l i ty of s a l t , assumed t o be 4 x 10⁻⁷~*A-1.m--1,
b e r , b e r ' , b e i , and b e i ' a r e b e s s e l func t ions .
A t s teady s t a t e , t h e hea t generated i n t h e molten zone w i l l be t r a n s -
f e r r e d by conduction through t h e f rozen f i l m t h a t surrounds t h e molten core
of t h e f l u o r i n a t o r . The equat ion r e l a t i n g t h e r a t e of hea t flow t o t h e sys-
t e m dimensions and p r o p e r t i e s i s :
2~k(T. - T,)
where
Q = heat t r a n s f e r r e d through t h e sa l t f i l m , W - m - l ,
k = thermal conduc t iv i ty of t h e f rozen s a l t , W a r n 9 -1. oc-l
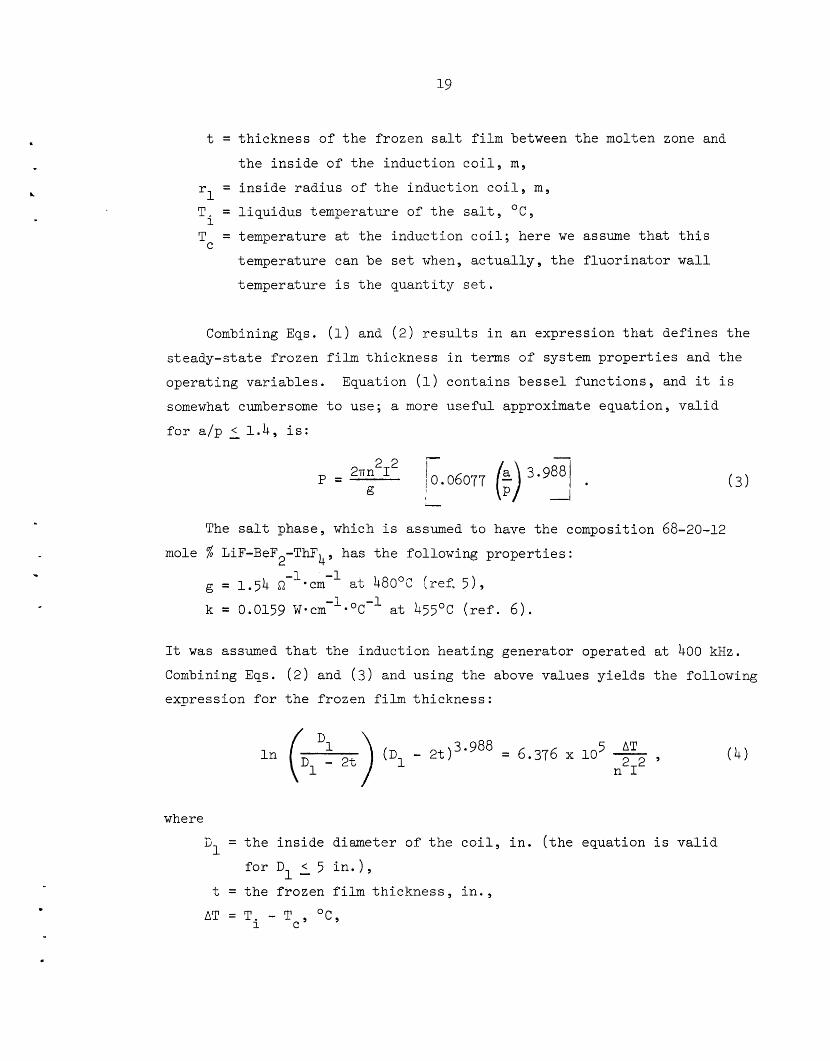
w
t = thickness of the frozen salt film between the molten zone and
the inside of the induction coil, m,
= inside radius of the induction coil, m, r
Ti = liquidus temperature of the salt, 'C,
Tc = temperature at the induction coil; here we assume that this
temperature can be set when, actually, the fluorinator wall
temperature is the quantity set.
1
Combining Eqs. (1) and (2) results in an expression that defines the
steady-state frozen film thickness in terms of system properties and the
operating variables.
somewhat cumbersome to use; a more useful approximate equation, valid
for alp < 1.4, is:
Equation (1) contains bessel functions, and it is
-
The salt phase, which is assumed to have the composition 68-20-12
mole % LiF-BeF2-ThF4, has the following properties: -1 -1 = 1.54 *cm at 480%' (ref. 51,
k = 0.0159 W*~rn-~*'C-l at 455'C (ref. 6)*
It was assumed that the induction heating generator operated at 400 kHz.
Combining Eqs. (2) and (3) and using the above values yields the following
expression for the frozen film thickness:
where
Z1 = the inside diameter of the coil, in. (the equation is valid
for D < 5 in.), 1 - t = the frozen film thickness, in.,
AT = Ti - Tc, OC,
20
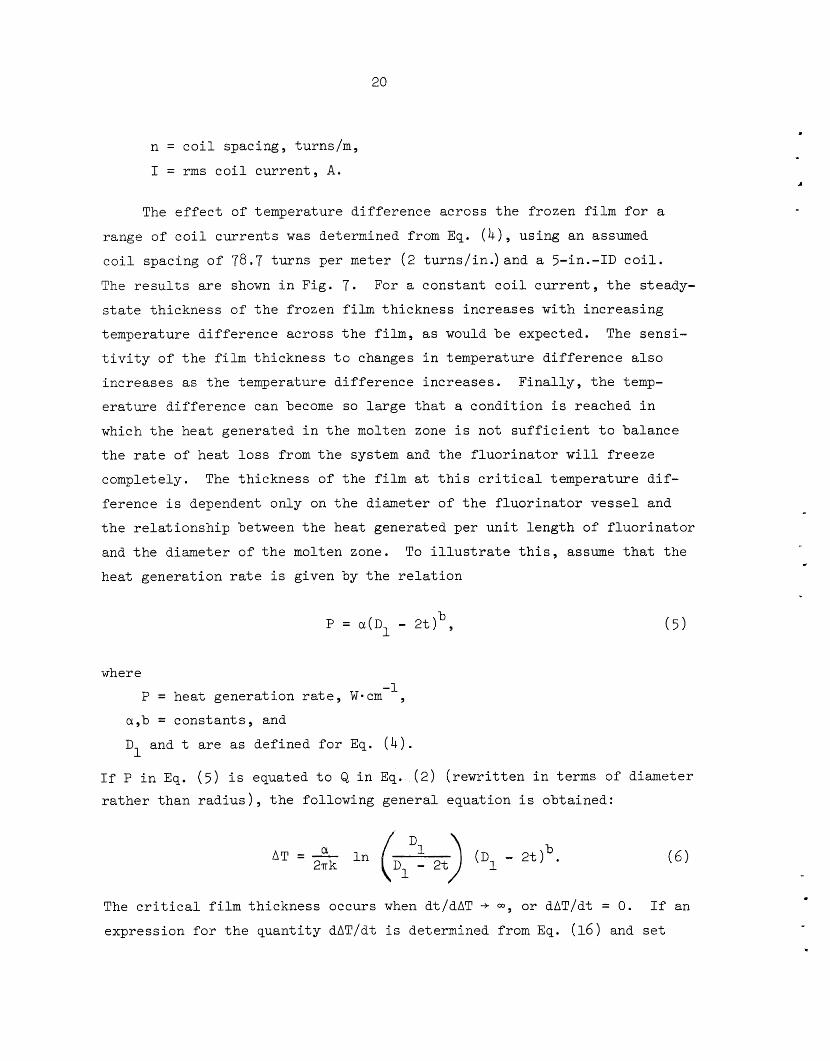
n = c o i l spacing, turns/m,
I = r m s c o i l c u r r e n t , A.
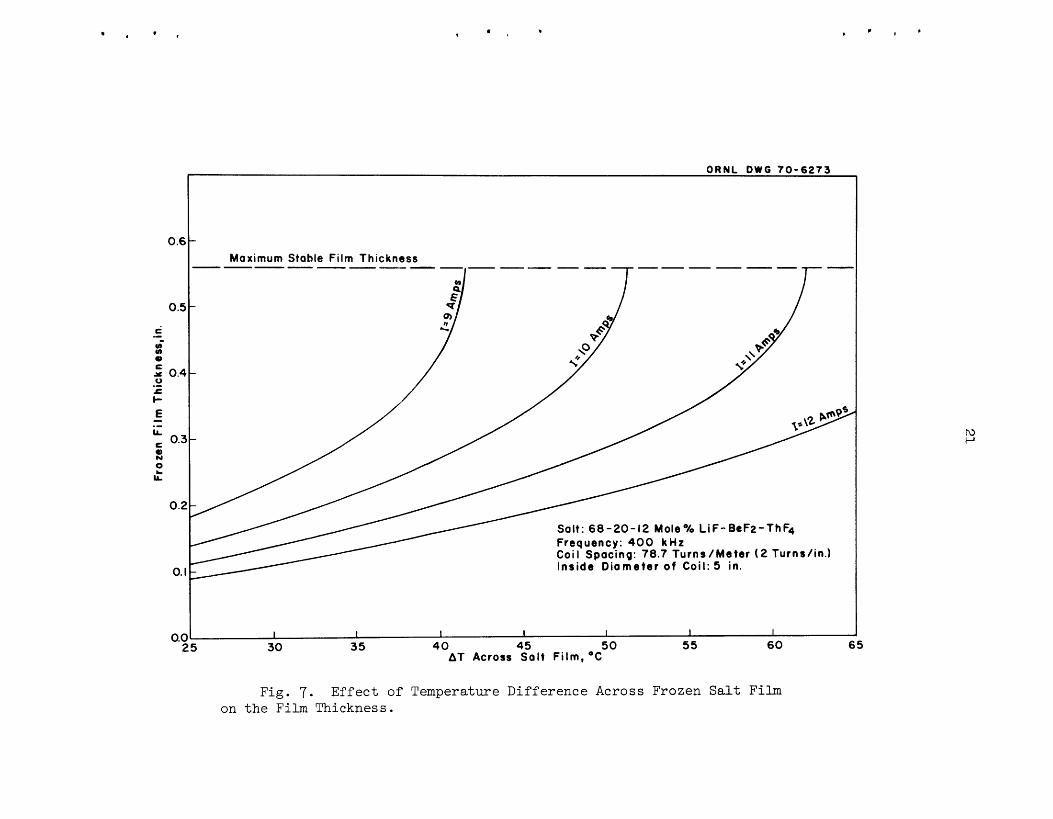
The e f f e c t of temperature d i f f e rence across t h e f rozen f i l m f o r a range of c o i l c u r r e n t s was determined from Eq. (b), us ing an assumed
c o i l spacing o f 78.7 t u r n s per meter ( 2 t u r n s / i n . ) a n d a 5-in.-ID c o i l .
The r e s u l t s a r e shown i n F ig . 7 . s t a t e t h i ckness of t h e f rozen f i l m t h i ckness inc reases wi th inc reas ing
temperature d i f f e rence across t h e f i l m , as would be expected.
t i v i t y o f t h e f i l m t h i ckness t o changes i n temperature d i f f e r e n c e a l s o
inc reases as t h e temperature d i f f e rence inc reases . F i n a l l y , t h e temp-
e r a t u r e d i f f e r e n c e can become so l a r g e t h a t a condi t ion i s reached i n
which t h e hea t generated i n t h e molten zone i s not s u f f i c i e n t t o ba lance
t h e r a t e of hea t l o s s from t h e system and t h e f l u o r i n a t o r w i l l f r e e z e
completely.
fe rence i s dependent only on t h e diameter o f t h e f l u o r i n a t o r v e s s e l and
t h e r e l a t i o n s h i p between t h e hea t generated pe r u n i t l eng th of f l u o r i n a t o r
and t h e diameter of t h e molten zone.
heat genera t ion r a t e i s given by t h e r e l a t i o n
For a cons tan t c o i l c u r r e n t , t h e steady-
The sens i -
The th ickness of t h e f i l m at t h i s c r i t i c a l temperature d i f -
To i l l u s t r a t e t h i s , assume t h a t t h e
P = a(Dl - 2 t ) b ,
where -1 P = heat genera t ion r a t e , W-cm ,
a,b = cons tan t s , and
D and t a r e as def ined f o r Eq. ( 4 ) . 1
If P i n Eq. ( 5 ) i s equated t o Q i n Eq. ( 2 ) r a t h e r t han r a d i u s ) , t h e fol lowing genera l
/' n
( 5 )
( r e w r i t t e n i n terms of diameter
equat ion i s obtained:
The c r i t i c a l f i l m t h i ckness occurs when dt/dAT -f 0 3 , or dAT/dt = 0.
express ion f o r t h e q u a n t i t y dAT/dt i s determined from Eq. (16) and s e t
If an .
0.6
0.5
i
e 5 0.4
I- E
- (b (I)
0 s .-
- .- LL
0.3 s 2 IL
0.2
0. I
0.5 L
ORNL D W G 7 0 - 6 2 7 3
Maximum Stable Film Thickness
Salt: 68-20-12 Moleo/o L iF -BtFz -ThFd Frequency: 400 k H z Coil Spacing: 78.7 Turns /Meter ( 2 TurnsIin.1 Inside D iameter o f Coil: 5 in.
I I I I 1 I I 5 30 35 4 0 45 50 5 5 60 6 5
A T Across Salt Fi lm, OC
Fig. 7. E f fec t of Temperature Difference Across Frozen Salt Film on t h e Film Thickness.
22
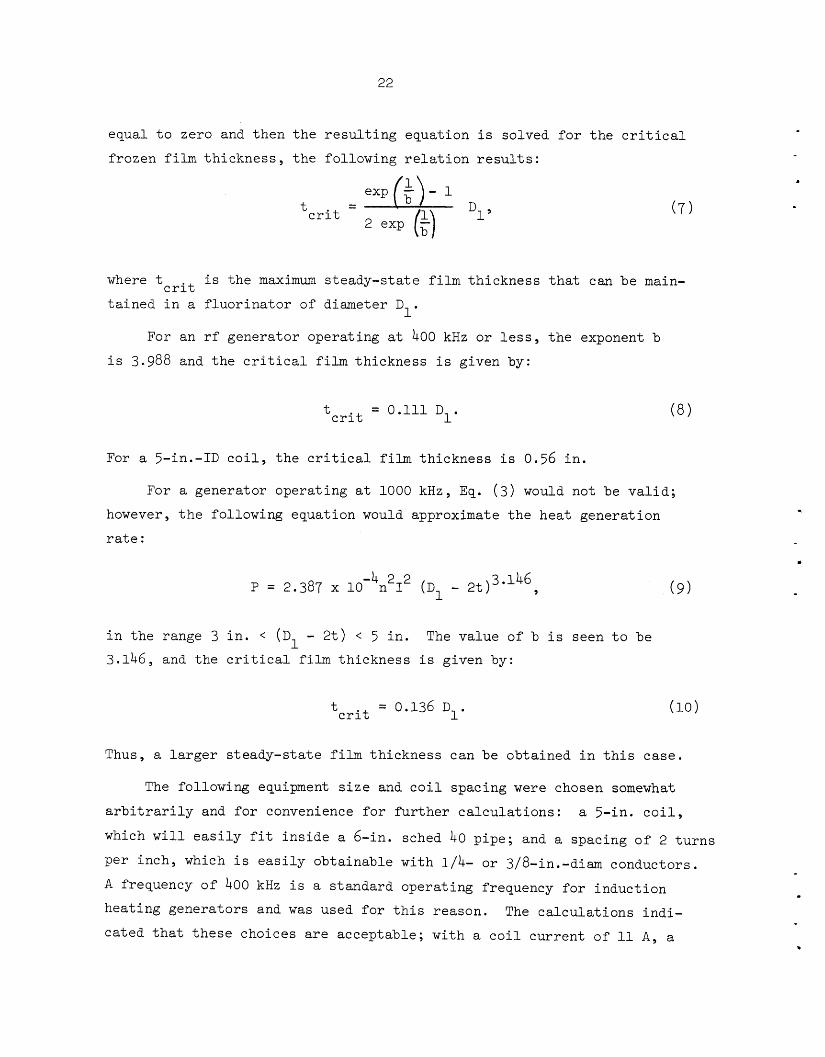
equal t o zero and then t h e r e s u l t i n g equat ion i s solved f o r t h e c r i t i c a l
f rozen f i l m t h i c k n e s s , t h e fol lowing r e l a t i o n r e s u l t s :
%it Dl ,
where t i s t h e maximum s teady-s ta te f i l m t h i ckness t h a t can be main-
t a i n e d i n a f l u o r i n a t o r of diameter D c r i t
1.
For an rf genera tor opera t ing a t 400 kHz or l e s s , t h e exponent b
i s 3.988 and t h e c r i t i c a l f i l m t h i ckness i s given by:
= 0.111 D1. t c r i t
For a 5-in.-ID c o i l , t h e c r i t i c a l film th i ckness i s 0.56 i n .
For a genera tor opera t ing a t 1000 kHz, Eq. ( 3 ) would not be v a l i d ;
however, t h e fol lowing equat ion would approximate t h e hea t genera t ion
r a t e :
9 ( 9 ) -4 2 2 3.146 P = 2.387 x 10 n I (D1 - 2 t )
i n t h e range 3 i n . < (D1 - 2 t ) < 5 i n . 3.146, and t h e c r i t i c a l f i l m t h i ckness i s given by:
The va lue of b i s seen t o be
t c r i t = 0.136 D1.
Thus, a l a r g e r s teady-s ta te film th i ckness can be obta ined i n t h i s case .
The fol lowing equipment s i z e and c o i l spacing were chosen somewhat
a r b i t r a r i l y and f o r convenience f o r f u r t h e r c a l c u l a t i o n s : a 5-in. c o i l ,
which w i l l e a s i l y f i t i n s i d e a 6-in. sched 40 p ipe ; and a spacing o f 2 t u r n s
pe r i nch , which i s e a s i l y obta inable wi th 1/4- or 3/8-in.-diam conductors .
A frequency of 400 kHz i s a s tandard opera t ing frequency f o r induct ion
hea t ing genera tors and was used f o r t h i s reason.
ca ted t h a t t h e s e choices a r e acceptab le ; w i t h a c o i l cu r ren t of 11 A , a The c a l c u l a t i o n s ind i -
.
23
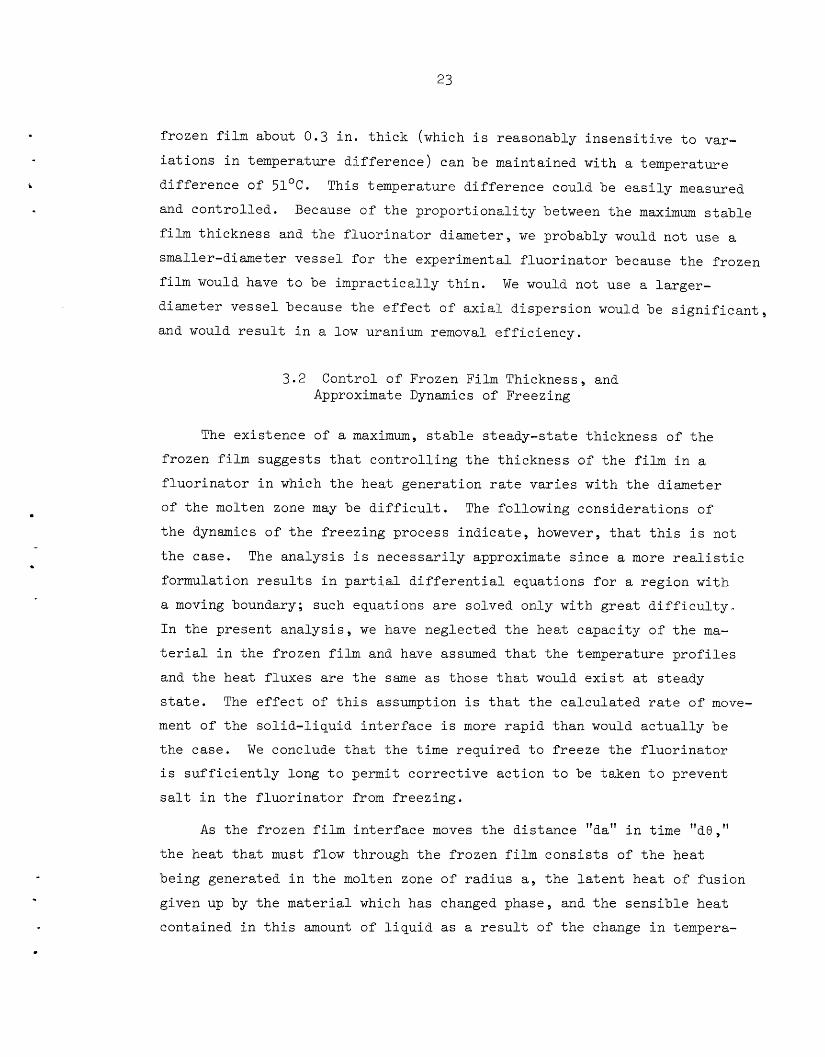
f rozen f i l m about 0.3 i n . t h i c k (which i s reasonably i n s e n s i t i v e t o var-
i a t i o n s i n temperature d i f f e r e n c e ) can be maintained with a temperature
d i f f e rence of 51OC.
and con t ro l l ed .
f i l m t h i ckness and t h e f l u o r i n a t o r diameter , we probably would not use a
smaller-diameter v e s s e l f o r t h e experimental f l u o r i n a t o r because t h e f rozen
f i l m would have t o be imprac t i ca l ly t h i n .
diameter v e s s e l because t h e e f f e c t o f a x i a l d i spe r s ion would be s i g n i f i c a n t ,
and would r e s u l t i n a low uranium removal e f f i c i e n c y .
This temperature d i f f e rence could be e a s i l y measured
Because of t h e p r o p o r t i o n a l i t y between t h e maximum s t a b l e
We would not use a l a rge r -
3 .2 Control o f Frozen Film Thickness, and Approximate Dynamics of Freezing
The ex i s t ence of a maximum, s t a b l e s t eady- s t a t e t h i ckness of t h e
frozen f i l m suggests t h a t c o n t r o l l i n g t h e th i ckness of t h e f i l m i n a
f l u o r i n a t o r i n which t h e hea t genera t ion r a t e v a r i e s wi th t h e diameter
of t h e molten zone may be d i f f i c u l t . The fol lowing cons idera t ions of
t h e dynamics o f t h e f r eez ing process i n d i c a t e , however, t h a t t h i s i s not
t h e case . The a n a l y s i s i s n e c e s s a r i l y approximate s i n c e a more r e a l i s t i c
formulat ion r e s u l t s i n p a r t i a l d i f f e r e n t i a l equat ions f o r a reg ion w i t h
a moving boundary; such equat ions a r e solved only wi th g r e a t d i f f i c u l t y "
I n t h e present a n a l y s i s , we have neglected t h e hea t capac i ty of t h e ma-
t e r i a l i n t h e f rozen f i l m and have assumed t h a t t h e temperature p r o f i l e s
and t h e hea t f l uxes a r e t h e same as those t h a t would e x i s t a t s teady
s ta te . The e f f e c t of t h i s assumption i s t h a t t h e c a l c u l a t e d r a t e of move-
ment of t h e so l id - l iqu id i n t e r f a c e i s more r a p i d than would a c t u a l l y be
t h e case . We conclude t h a t t h e t i m e r equ i r ed t o f r e e z e t h e f l u o r i n a t o r
i s s u f f i c i e n t l y long t o permit c o r r e c t i v e a c t i o n t o be taken t o prevent
sa l t i n t h e f l u o r i n a t o r from f r eez ing .
A s t h e f rozen film i n t e r f a c e moves t h e d i s t ance "daft i n time "de,"
t h e hea t t h a t must flow through t h e f rozen f i l m c o n s i s t s of t h e hea t
being generated i n t h e molten zone of r ad ius a , t h e l a t e n t hea t of fu s ion
given up by t h e material which has changed phase, and t h e s e n s i b l e hea t
contained i n t h i s amount of l i q u i d as a r e s u l t of t h e change i n ternpera-
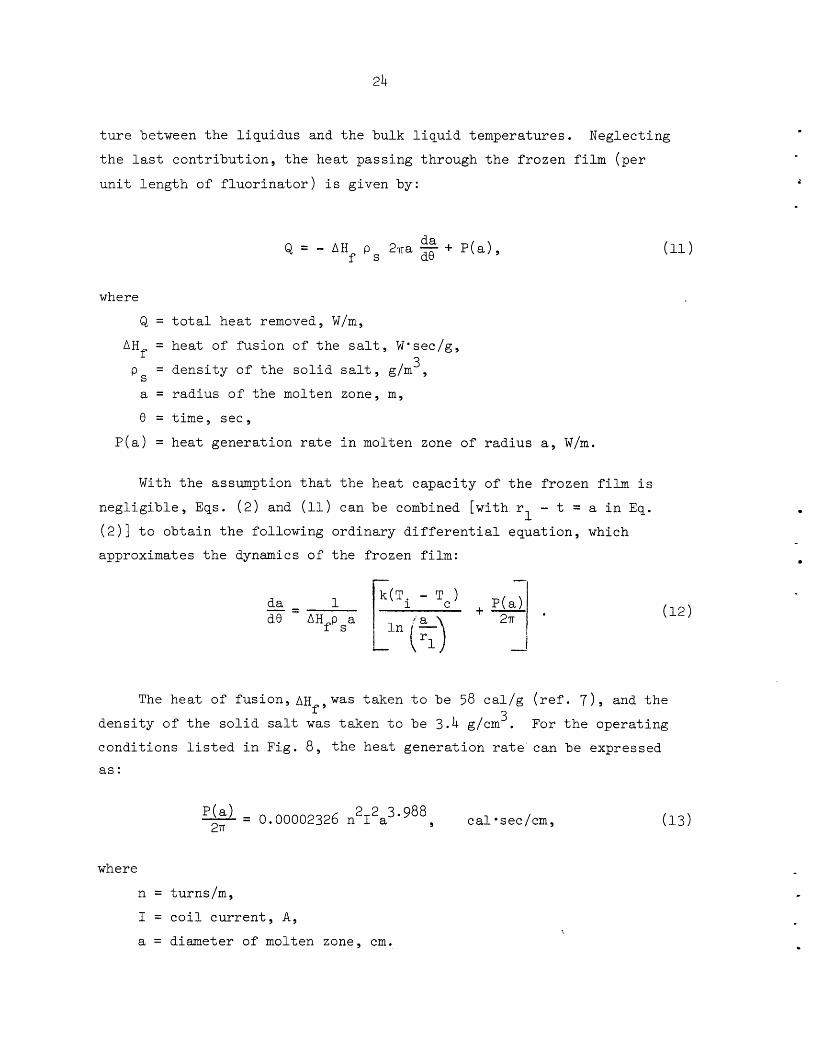
t u r e between t h e l i q u i d u s and t h e bulk l i q u i d temperatures . Neglect ing
t h e l a s t con t r ibu t ion , t h e hea t pass ing through t h e f rozen f i l m ( p e r
u n i t l e n g t h of f l u o r i n a t o r ) i s given by:
where
& =
e = P ( a ) =
to ta l . hea t removed, W/m,
hea t of fu s ion of t h e s a l t , W*sec/g,
d e n s i t y of t h e s o l i d s a l t , g/m 3
r ad ius o f t h e molten zone, m ,
t ime, s e c ,
hea t genera t ion r a t e i n molten
zone of r a d i u s a , W/m.
With t h e assumption t h a t t h e hea t capac i ty of t h e f rozen fi lm i s
n e g l i g i b l e , Eqs. ( 2 ) and (11) can be combined [wi th r - t = a i n Eq . 1 ( 2 ) ] t o o b t a i n t h e fol lowing ord inary d i f f e r e n t i a l equat ion , which
approximates t h e dynamics o f t h e f rozen f i l m :
The hea t of f u s i o n , AH w a s taken t o be 58 c a l / g ( r e f . 7 ) , and t h e
For t h e opera t ing 3 f, dens i ty of t h e s o l i d sa l t w a s t aken t o be 3.4 g/cm . condi t ions l i s t e d i n F ig . 8 , t h e hea t genera t ion ra te can be expressed as :
- - 2 2 3.988 '(a) - 0.00002326 n I a 27-r 
where
n = turns/m,
I = c o i l c u r r e n t , A,
a = diameter of molten zone, cm.
c a1 s ec /cm , (13)
W
25
m
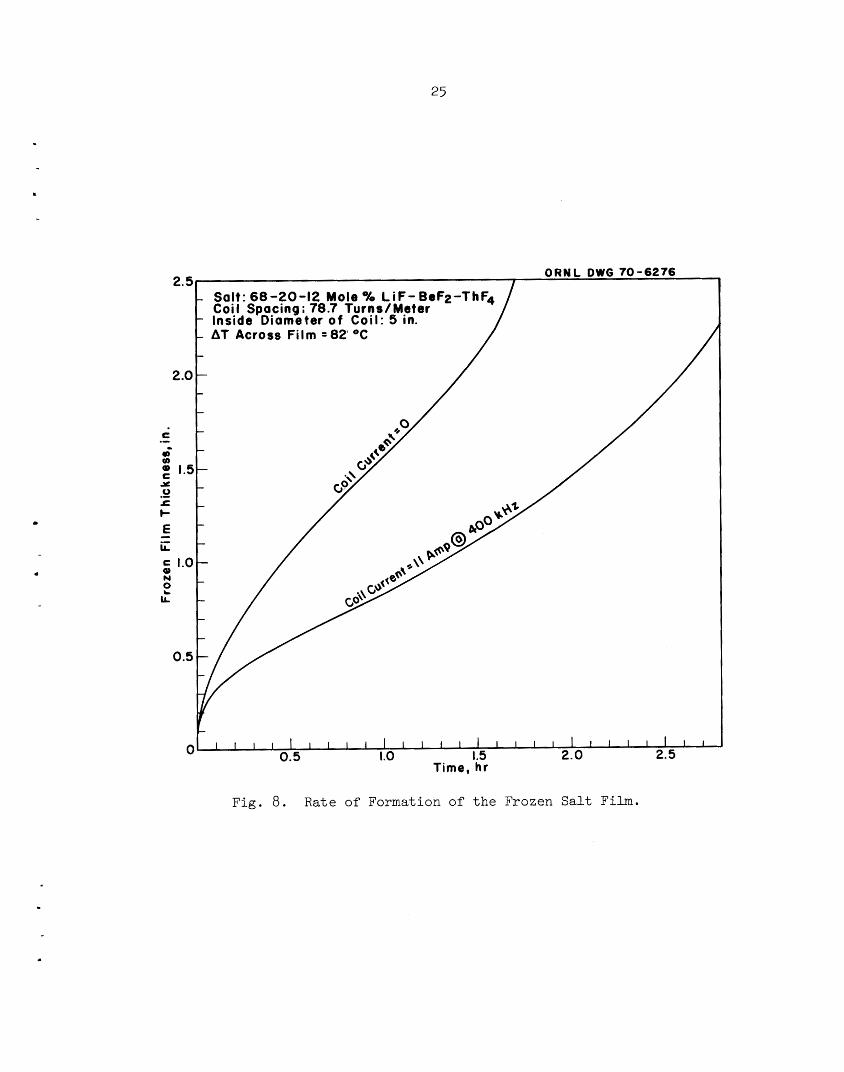
Fig. 8. Rate of Formation of the Frozen Salt Film.
L
26
S u b s t i t u t i o n of t h e values f o r t h e cons tan ts i n t o Eq. ( 1 2 ) , s u b s t i t u t i o n
of Eq. (13) i n t o Eq. ( 1 2 ) , and assumption of a 5-in.-ID c o i l f o r t h e f l u -
o r i n a t o r y i e l d an expression f o r t h e t ime requi red f o r t h e
i n t e r f a c e t o move from t h e edge of t h e c o i l t o t h e p o s i t i o n
The r e s u l t i n g equat ion i s :
e = 0.05478 a da 2 2 3.988 0*00380 AT + 0.00002326 n I a
s o l i d - l i q u i d
of r ad ius a.
(14)
A s shown i n F ig . 7 , t h e maximum s t a b l e f i l m th i ckness wi th a c o i l cu r ren t
of 11 A i s obtained w i t h a temperature d i f f e r e n c e of 62Oc.
were made wi th an assumed temperature d i f f e r e n c e of 82Oc (2OoC g r e a t e r
t han could be allowed f o r s teady-s ta te opera t ion while maintaining a
frozen f i l m ) .
spacing of 78.7 t u r n s pe r meter , and c o i l c u r r e n t s of 0 A and 11A.
r e s u l t s of t h e c a l c u l a t i o n s a r e shown i n Fig. 8 , which shows t h a t , wi th
no hea t genera t ion i n t h e molten zone, t h e t ime requi red t o f r eeze t h e
f l u o r i n a t o r completely w i l l be g r e a t e r t han 1 . 5 h r . With t h e hea t gen- e r a t i o n r e s u l t i n g from an 1 1 - A c o i l c u r r e n t , t h e time r equ i r ed f o r com-
p l e t e f r eez ing w i l l be about 2.9 h r .
f r eez ing process can be reversed by decreasing t h e temperature d i f f e r e n c e .
We conclude, on t h e b a s i s of t h i s a n a l y s i s , t h a t t h e frozen f i l m th i ckness
i n t h e f l u o r i n a t o r could be con t ro l l ed , without severe problems, by ad jus t -
i ng t h e temperature of t h e wa l l of t h e f l u o r i n a t o r .
t h e f rozen f i l m t h i ckness could be accomplished most e f f e c t i v e l y by us ing
a d i r e c t measurement of t h e f i l m th ickness i n a feedback loop t o a d j u s t
t h e w a l l temperature .
for measuring t h e th ickness of t h e frozen f i lm .
Calcu la t ions
Other condi t ions assumed i n t h e c a l c u l a t i o n were: a c o i l
The
Equation (12 ) shows t h a t t h e
Re l i ab le c o n t r o l of
We a r e a t tempting t o devise a convenient method
3 .3 Power Requirements f o r an Experimental F luo r ina to r
One of t h e purposes f o r making t h e previous a n a l y s i s was t o e s t ima te
t h e s i z e of t h e high-frequency genera tor t h a t would be r equ i r ed f o r a 5-ft-
long experimental f l u o r i n a t o r . In t h e f l u o r i n a t o r considered, t h e power
.
suppl ied by t h e genera tor would be d i s s i p a t e d as hea t i n t h e molten sa l t
i n t h e f l u o r i n a t o r , i n t h e induct ion c o i l , and i n t h e metal walls of t h e
f l u o r i n a t o r .
sa l t core and i n t h e induct ion c o i l can be made from r e l a t i o n s h i p s found
i n s tandard textbooks on induct ion hea t ing ( e . g . , r e f . 8 ) . However, no r e l a t i o n s h i p s e x i s t i n t h e l i t e r a t u r e f o r es t imat ing t h e hea t generated
i n a metal cy l inder surrounding a c y l i n d r i c a l c o i l .
we have assumed t h a t heat would be generated i n t h e f l u o r i n a t o r v e s s e l a t
t h e same r a t e as i n a v e s s e l which has an ou t s ide diameter equal t o t h e
i n s i d e diameter of t h e f l u o r i n a t o r and which is placed i n s i d e a c o i l having
t h e same spacing and ca r ry ing t h e same cu r ren t as t h e c o i l i n t h e f luo r ina -
t o r .
Est imates of t h e amount of hea t generated i n t h e molten
For our c a l c u l a t i o n s ,
We have assumed t h a t t h e f l u o r i n a t o r v e s s e l and t h e induct ion c o i l
w i l l be made from n i c k e l s ince n i c k e l e x h i b i t s exce l l en t r e s i s t a n c e t o
f l u o r i n e when molt.en sa l t i s not present and s i n c e i t s s p e c i f i c e l e c t r i c a l
r e s i s t i v i t y i s lower than t h a t of o the r a l l o y s which might be used (pro-
vid ing t h e c o i l temperature can be kept above t h e Curie t r a n s i t i o n temp-
e r a t u r e of n i c k e l , which i s 3 5 8 ' ~ ) .
c o i l m a t e r i a l r e s u l t s i n a low hea t genera t ion rate i n t h e c o i l .
A low s p e c i f i c r e s i s t i v i t y for t h e
S u f f i c i e n t power can be generated i n t h e molten sa l t t o maintain a
sa l t f i l m 0.3 i n . t h i c k i n s i d e t h e c o i l wi th a temperature d i f f e rence of
5 1 ° C between t h e l i q u i d - s o l i d i n t e r f a c e and t h e induct ion c o i l when t h e
fol lowing condi t ions a r e used: t o r vessel made from 6-in. sched 40 pipe , a c o i l spacing of 2 t u r n s pe r
inch , and a c o i l cu r ren t of 11 A a t a frequency of 400 kHz.
hea t genera t ion rates i n t h e molten s a l t , t h e induct ion c o i l , and t h e
f l u o r i n a t o r v e s s e l w a l l a r e 1661, 133, and 42.7 W / f t , r e spec t ive ly .
t o t a l hea t genera t ion ra te of a t l e a s t 9180 W would be generated i n t h e
case o f a 5-ft-long f l u o r i n a t o r .
a 5-ina-ID c o i l placed i n s i d e a f luo r ina -
The est imated
A
The reac tance of a 5-in.-ID by 5-ft-long c o i l i s very l a r g e , and a
power f a c t o r o f 0.15 was es t imated from s tandard expressions8 f o r t h i s
t ype of c o i l . With a power f a c t o r t h i s low, a genera tor t h a t has a
28
r e a c t i v e power of 61,200 V-A i s requi red .
r e n t of 11 A , more than 5500 V would have t o be impressed across t h e c o i l .
The r equ i r ed vol tage can be reduced by d iv id ing t h e c o i l i n t o a number of
s h o r t e r c o i l s t h a t have t h a t same diameter and spacing and a r e connected
i n p a r a l l e l , wi th ad jacent c o i l s wound i n opposi te d i r e c t i o n s .
c o i l i s d iv ided i n t o 10 sec t ions having 1 2 t u r n s pe r s e c t i o n , t h e es-
t imated power f a c t o r would be 0 .11 and t h e vol tage t h a t must be impressed
across each c o i l would be about 760 V (which i s s t i l l undes i rab ly h i g h ) .
I f t h e c o i l were divided i n t o 20 sec t ionshav ing 6 t u r n s per s e c t i o n , t h e
power f a c t o r would be 0.093, and t h e requi red vol tage would be about 450 V .
I n order t o ob ta in a c o i l cur-
I f t h e
Although vol tages of t h e magnitude mentioned above would be p o t e n t i a l -
l y hazardous and would complicate t h e removal of molten s a l t samples from
t h e system during ope ra t ion , t h e sampling hazard i s decreased by t h e f a c t
t h a t t h e induct ion c o i l must be e l e c t r i c a l l y i n s u l a t e d from t h e f l u o r i n a t o r
v e s s e l .
va lues ; we w i l l i n v e s t i g a t e t h i s p o s s i b i l i t y l a t e r .
a r e r equ i r ed , we do not expect t o encounter any s e r i o u s problems i n provid-
ing t h e necessary e l e c t r i c a l i n s u l a t i o n .
Use of a h igher frequency may r e s u l t i n lower r equ i r ed vol tage
Even i f high vo l t ages
I n es t imat ing t h e power requirements f o r t h e gene ra to r , we have as-
sumed t h a t t h e c o i l and pipe a r e i n f i n i t e l y long and t h a t t h e voids pro-
duced by bubbling f l u o r i n e through t h e molten sa l t w i l l not a f f e c t t h e
hea t genera t ion r a t e ; a l s o , we have e s s e n t i a l l y assumed a value f o r t h e
heat genera t ion r a t e i n t h e metal w a l l , al though it i s probably not
accura te . The e f f e c t of t h e s e assumptions w i l l probably be t o decrease
t h e e f f i c i e n c y of hea t ing t h e molten sa l t i n t h e f l u o r i n a t o r t o a va lue
lower than t h a t which we have est imated. With a 5-ft-long c o i l , t h e
magnetic f i e l d s t r e n g t h i s weaker than t h a t p red ic t ed by equat ions f o r an
i n f i n i t e l y long c o i l ; t h e r e f o r e , t h e hea t genera t ion r a t e i n t h e sa l t would
be lower than t h e ca l cu la t ed va lue . The presence of bubbles w i l l probably
cause t h e hea t genera t ion r a t e t o be lower than t h e r a t e t h a t would be ob-
t a i n e d wi th no bubbles p re sen t . The bubbles would probably reduce t h e e f -
f e c t i v e conduct iv i ty of t h e s a l t , and hence t h e hea t genera t ion r a t e , s ince
t h e hea t genera t ion r a t e i n t h e s a l t i s d i r e c t l y p ropor t iona l t o t h e con-
d u c t i v i t y of t h e s a l t .
.
.
The importance of t h e e f f e c t s mentioned above cannot be e a s i l y de-
termined by c a l c u l a t i o n s ; hence, w e p lan t o c a r r y out experiments u s ing
an aqueous e l e c t r o l y t e s o l u t i o n (probab1;y HNO ) as a s u b s t i t u t e f o r
molten s a l t . 3
W e conclude t h a t induct ion hea t ing appears t o be a reasonable means
f o r providing a cor ros ion- f ree hea t source i n a molten sa l t f l u o r i n a t o r and t h a t t h e ope ra t iona l problems which have been examined appear t o be
t r a c t a b l e r
4, DEVELOPMENT OF THE METAL TRANSFER PROCESS
E , L. Youngblood L. E , McNeese E. L. Nicholson W. F. Scha f fe r , Jr.
An improved r a re -ea r th removal process has been devised, based on t h e
observa t ion t h a t r a r e e a r t h s d i s t r i b u t e s e l e c t i v e l y i n t o molten l i t h i u m ch lo r ide from bismuth so lu t ions conta in ing r a r e e a r t h s and thorium, Work
t h a t w i l l demonstrate a l l phases of t h e improved p rocess , which i s known
as t h e metal t r a n s f e r process , i s under way. The f i r s t engineer ing experi- ment (MITE-1) f o r s tudying t h e removal of r a r e e a r t h s from s ing le - f lu id MSBR
f u e l sa l t by t h i s process was completed dur ing t h e cu r ren t r e p o r t i n g per iod .
The main o b j e c t i v e of t h i s experiment was t o demonstrate t h e s e l e c t i v e re -
moval of r a r e e a r t h s ( L a and Nd) from a f l u o r i d e sa l t mixture conta in ing
thorium f l u o r i d e
4.1 Equipment and Materials Used f o r Experiment MTE-1
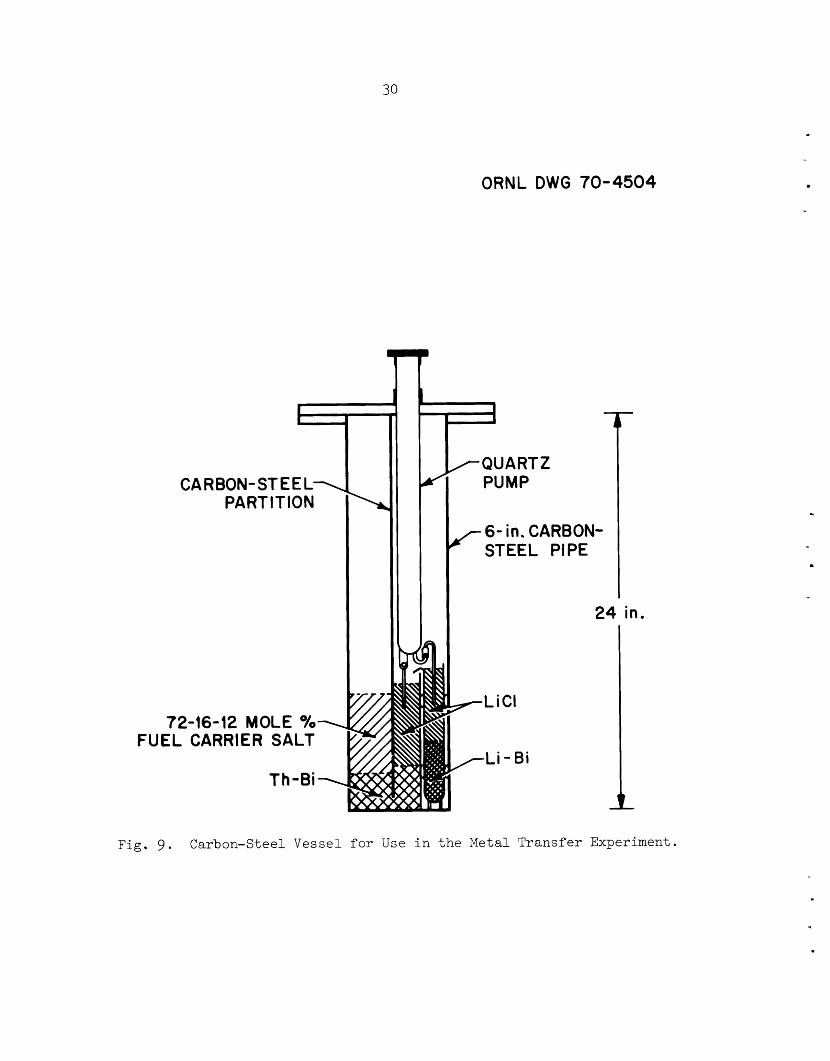
The experiment was performed i n a 6-in.-ID carbon-steel vessel (shown
i n Fig. 9 ) , which has been descr ibed p r e v i o ~ s l y . ~ The
compartments in te rconnec ted at t h e bottom by a pool of
was s a t u r a t e d wi th thorium. One compartment contained
sa l t (72-16-12 mole % LiF-BeF2-ThF4) t o which 2 m C i of
v e s s e l contained two
molten bismuth t h a t
MSBR f u e l c a r r i e r
1471'Jd and a suf-
f i c i e n t q u a n t i t y o f LaF
% had been added.
t h a t contained a lithium-bismuth s o l u t i o n , and a pump f o r c i r c u l a t i n g t h e
l i t h i u m ch lo r ide through t h e cup. The pump was cons t ruc ted of quar tz and
t o produce a lanthanum concent ra t ion of 0.38 mole
The o the r compartment contained l i t h i u m c h l o r i d e , a cup 3
30
CARBON- ST E E L- PART IT ION
72-16-12 MOLE Ye FUEL CARRIER SALT
Th-Bi
ORNL DWG 70-4504
/QUARTZ PUMP
24
T L i C I
F L i - Bi
Fig. 9 . Carbon-Steel Vessel f o r Use i n t h e Metal T rans fe r Experiment.
.
31
E
.
used sapphi re b a l l s as check valves. '
and out of t h e pump body by varying t h e argon p res su re i n s i d e t h e pump
chamber.
pump chamber and t o a c t u a t e so lenoid
pressure during a given pump cyc le .
c u r a t e c o n t r o l of t h e flow of l i t h i u m ch lo r ide through t h e l i t h i m b i s m u t h
con ta ine r .
L i t h i u m ch lo r ide was forced i n
E l e c t r i c a l probes were used t o d e t e c t t h e l i q u i d l e v e l i n t h e
va lves i n order t o change t h e argon
Use of t h i s t ype o f pump permit ted ac-
I n order t o ob ta in mixing i n t h e main bismuth pool , about 10% of t h e metal volume was forced t o flow back and f o r t h every 7 min through a 1/2-
i n . slot below t h e p a r t i t i o n between t h e f l u o r i d e and ch lo r ide compart-
ments,
gas i n t h e f l u o r i d e compartment r e l a t i v e t o t h a t i n t h e ch lo r ide compart-
ment*
as i n t h e lithium-bismuth cup i n order t o promote contac t between t h e s a l t
and metal phases ,
approximately 0 .5 i n . on a s i d e were placed i n t h e bottom of t h e v e s s e l
i n order t o ensure t h a t t h e bismuth phase w a s s a t u r a t e d wi th thorium.
The amount of thorium added i n t h i s manner was about 20 t imes t h e amount
t h a t could d i s so lve i n t h e bismuth, The e x t e r i o r of t h e carbon-steel
v e s s e l used f o r t h e experiment was spray-coated wi th n i c k e l aluminide t o
prevent a i r oxida t ion of t h e carbon s t e e l .
This flow w a s e f f e c t e d by reducing t h e pressure of t h e argon cover
Argon sparge tubes were placed i n each s i d e of t h e v e s s e l as w e l l
Lumps o f thorium metal ( a t o t a l of 501 g ) measuring
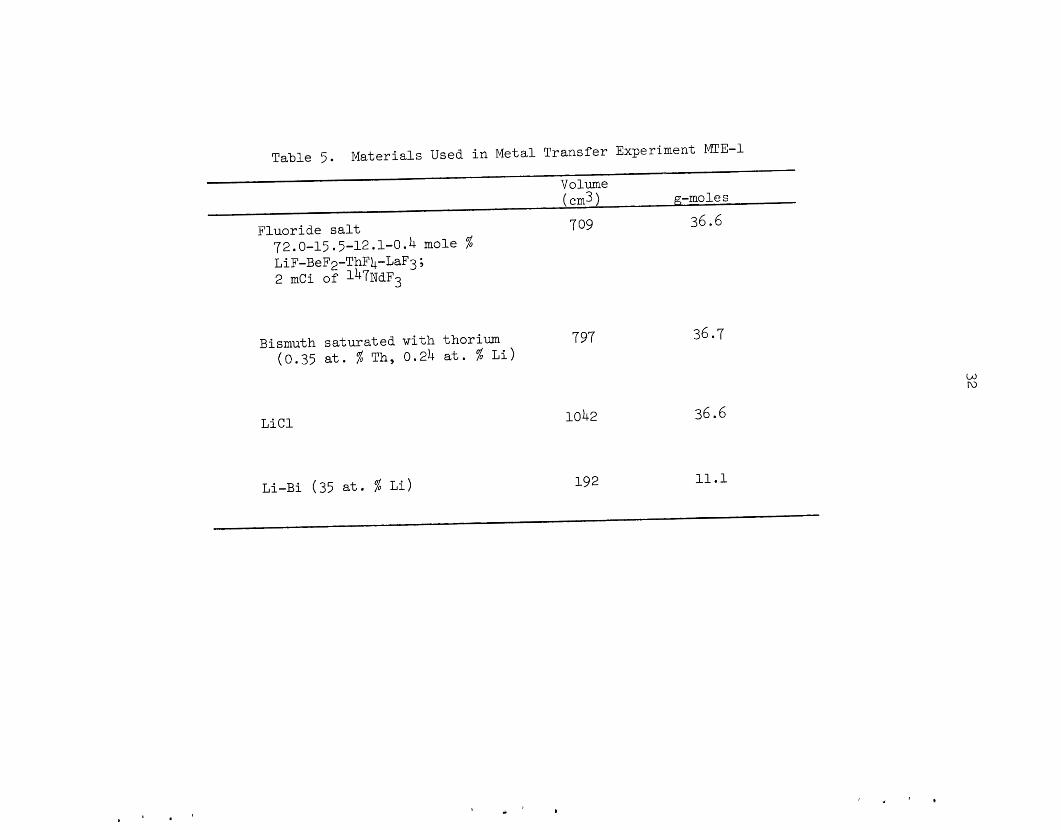
The q u a n t i t i e s of ma te r i a l s used i n t h e experiment a r e shown i n Table
Most of t h e m a t e r i a l s were p u r i f i e d t o remove oxides and o t h e r impuri- 5 . t i e s before they w e r e in t roduced i n t o the system. The l i t h ium ch lo r ide
was p u r i f i e d by con tac t with bismuth s a t u r a t e d wi th thorium a t 650Oc.
The carbon-steel v e s s e l and t h e bismuth used i n t h e experiment were f i r s t
t r e a t e d s e p a r a t e l y wi th hydrogen at 6 5 0 " ~ f o r about 1 2 hr for oxide re-
moval. The bismuth w a s t hen added t o t h e carbon-steel v e s s e l and w a s sub-
sequent ly t r e a t e d wi th hydrogen a t 6 5 0 " ~ f o r an a d d i t i o n a l 10 hr.
MSBR f u e l c a r r i e r sa l t (72-16-12 mole % LiF-BeF2-ThF4) was obtained from
t h e Reactor Chemistry Div is ion ,
e r a t i o n of t h e l i t h i u m ch lo r ide pump was p u r i f i e d by passage through a
molecular s i e v e dryer and a bed of uranium tu rn ings opera ted a t 600Oc.
P u r i f i e d
The argon used f o r cover gas and for op-
32
43
43 M
m
0
c-
0
E
c- u3
M .
u3
\D
M 0
cu 3- 0
1
rl u
.rl d
rl
rl rl . cu m
rl
33
The f i r s t quar tz pump used i n t h e experiment f a i l e d t o opera te
proper ly ; when we attempted t o opera te t h e pump t o begin t h e experiment,
we found t h a t t h e check va lves were s tuck .
cooled t o 300°C and t h e pump was rep laced wi th a second quar tz pump of
a similar design.
t h e experiment
Therefore , t h e system was
The l a t t e r pump opera ted s a t i s f a c t o r i l y throughout
4.2 Experimental Procedure
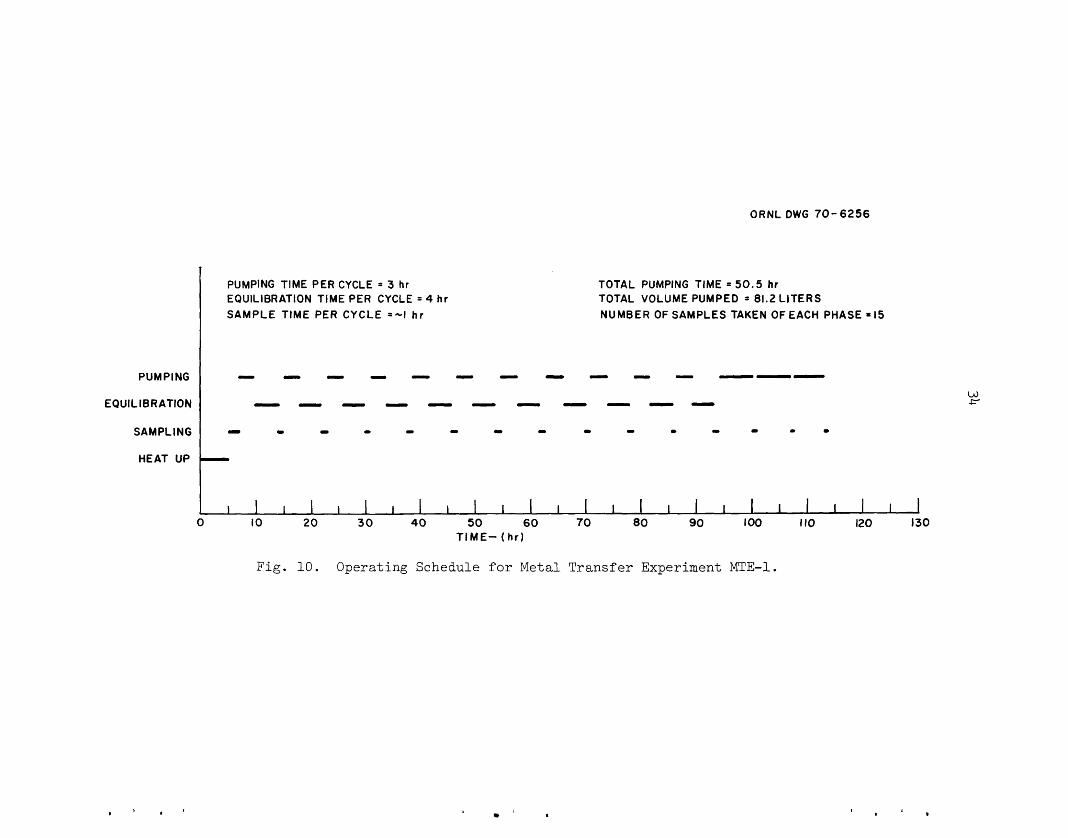
The sequence of opera t ions c a r r i e d out dur ing t h e experiment can be
descr ibed as fol lows. The l i t h i u m c h l o r i d e was pumped through t h e l i t h i m -
bismuth conta iner for 3 h r a t t h e flow r a t e of about 25 cm 3 /min. Pumping w a s t hen stopped, and t h e system was allowed t o approach equi l ibr ium
dur ing a 4-hr pe r iod .
sa l t and bismuth phases were taken.
was repea ted f o r 11 cycles . Three a d d i t i o n a l cyc les were c a r r i e d out i n which t h e pumping per iod was increased t o 6 h r and t h e e q u i l i b r a t i o n pe-
r i o d was omit ted.
t i o n of t h e main bismuth pool was forced back and f o r t h between t h e f l u -
o r i d e and t h e c h l o r i d e compartments a t a ra te equiva len t t o 10% of t h e
metal volume every 7 min. The experiment was c a r r i e d out a t 6 6 0 O c . During t h e 5-day opera t ing pe r iod , t h e pump was operated 50.5 h r and
81.2 l i t e r s of l i t h i u m c h l o r i d e was c i r c u l a t e d through t h e l i thium-bis-
muth conta iner .
prepared f o r analysis by cutting off the f i l t e r s e c t i o n w i t h tubing
c u t t e r s and c leaning t h e e x t e r n a l su r f aces wi th emery c l o t h .
a c t i v i t y i n each sample was determined by d i r e c t counting of t h e 0.53-
MeV gamma rays emi t ted by t h e sample. The lanthanum concent ra t ion i n
each sample w a s determined by neutron a c t i v a t i o n ,
A t t h e end of t h i s pe r iod , f i l t e r e d samples of t h e
A s shown i n Fig. 1 0 , t h i s sequence
During t h e pumping and e q u i l i b r a t i o n pe r iods , a por-
The f i l t e r e d samples t aken during t h e experiment were
The 14$d
ORNL DWG 70-6256
PUMPING
EQUlL 16 RATION
SAMPLING
HEAT UP
PUMPING TIME PER CYCLE = 3 hr EQUILIBRATION TIME PER CYCLE = 4 hr SAMPLE TIME PER CYCLE =-I h r
- - - - - - - - - - - - - - - - - - - - - - - - - -
0 0 0 0 0 0 0 .. m 0 0 0 0 m 0
I I I I I I I I I I I I I I I I I I I I I I I I I I
TOTAL PUMPING TIME = 50.5 hr TOTAL VOLUME PUMPED = 81.2 LITERS NUMBER OF SAMPLES TAKEN OF EACH PHASE = I 5
Fig. 10. Operating Schedule f o r Metal Transfer Experiment MTE-1.
35
4.3 Experimental Results
During the experiment the rare earths should have distributed between
the salt and metal phases in a manner depending on the concentration of
reductant in the metal phase. The relative amount of rare earth in a salt
and metal phase at equilibrium can be expressed by the distribution coef-
ficient, which is defined as:
- mole fraction of M in the bismuth phase - DM mole fraction of M in the salt phase
At equilibrium, a portion of the rare earths originally present in the
fluoride salt would have been extracted into the bismuth phase, from which it should have distributed into the lithium chloride. The lithium concen-
tration in the lithium-bismuth solution (35 at. % lithium) was sufficiently high that, at equilibrium, essentially all of the neodymium and lanthanum
would be removed from lithium chloride in contact with this metal phase.
Therefore, continued circulation of the lithium chloride through the
lithium-bismuth cup should have gradually removed the neodymium and lan-
thanum from the fluoride salt and deposited these materials in the lithium-
bismuth solution.
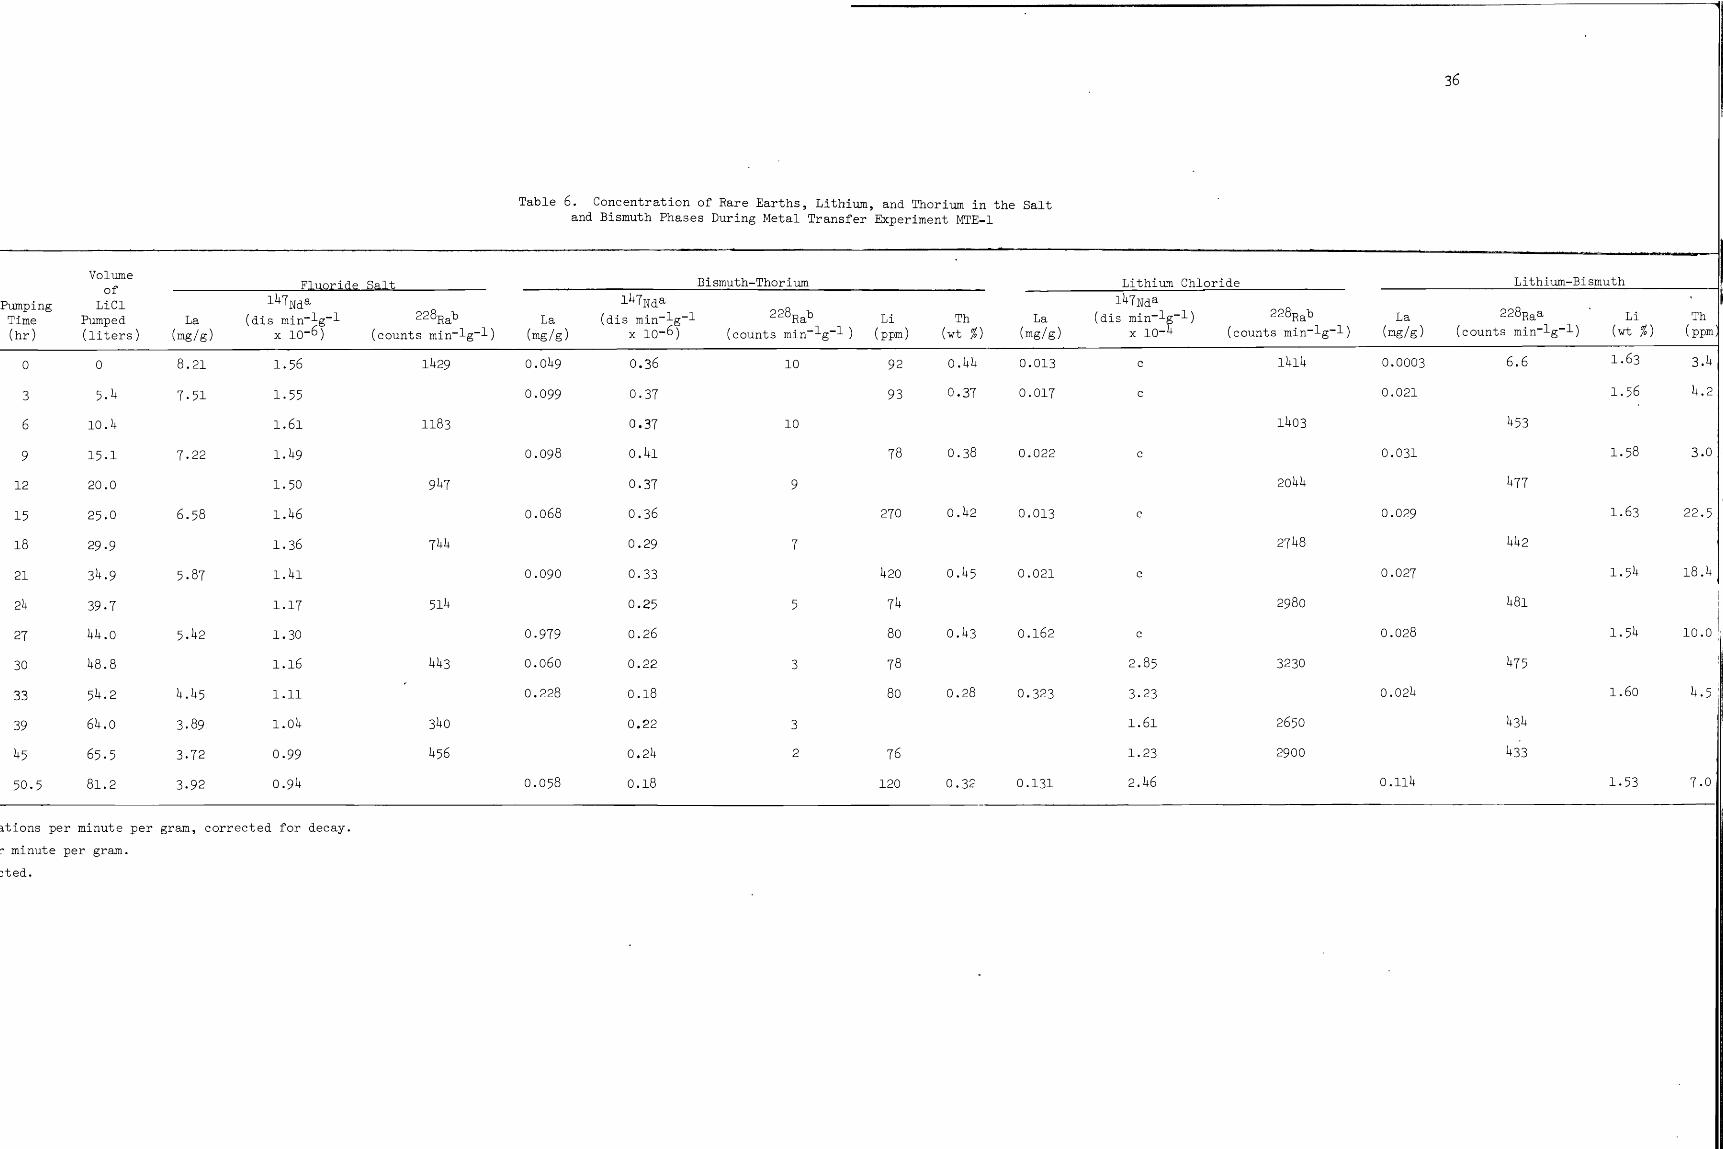
The concentrations of lanthanum, neodymium, and 228Ra, a decay product
of 232Th, were determined in the salt and bismuth phases periodically
throughout the experiment. These data are summarized in Table 6. Values
for the distribution coefficients thus obtained were relatively constant
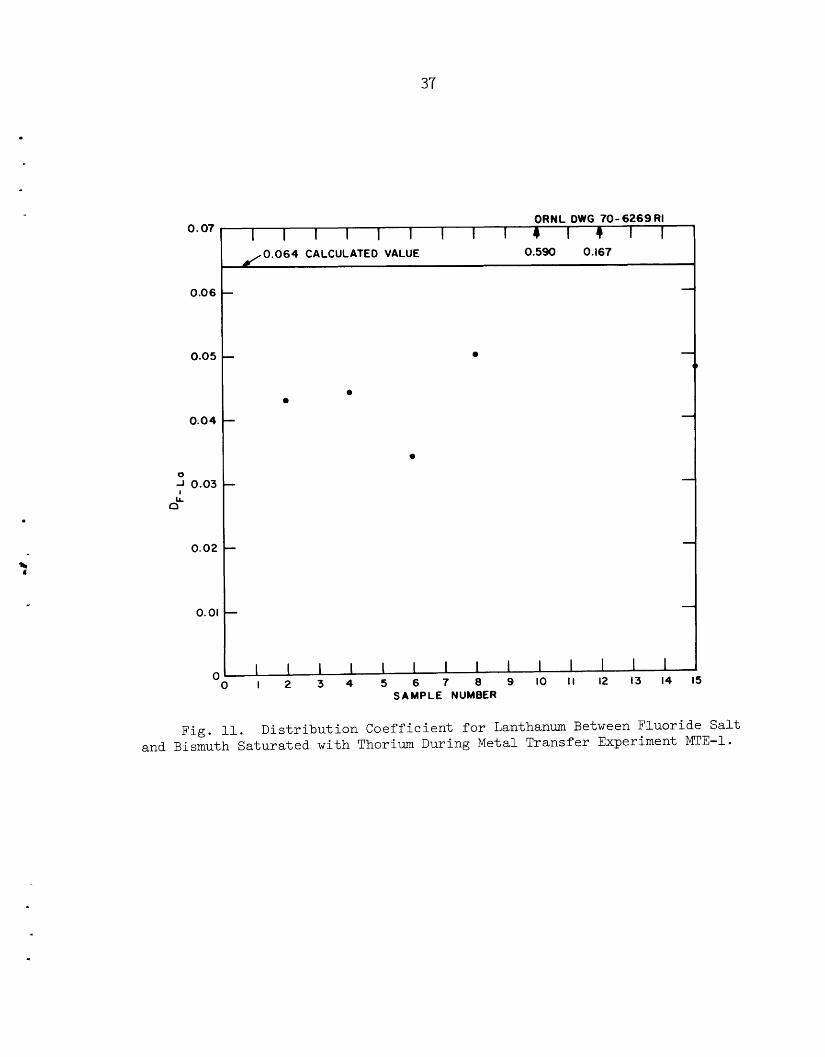
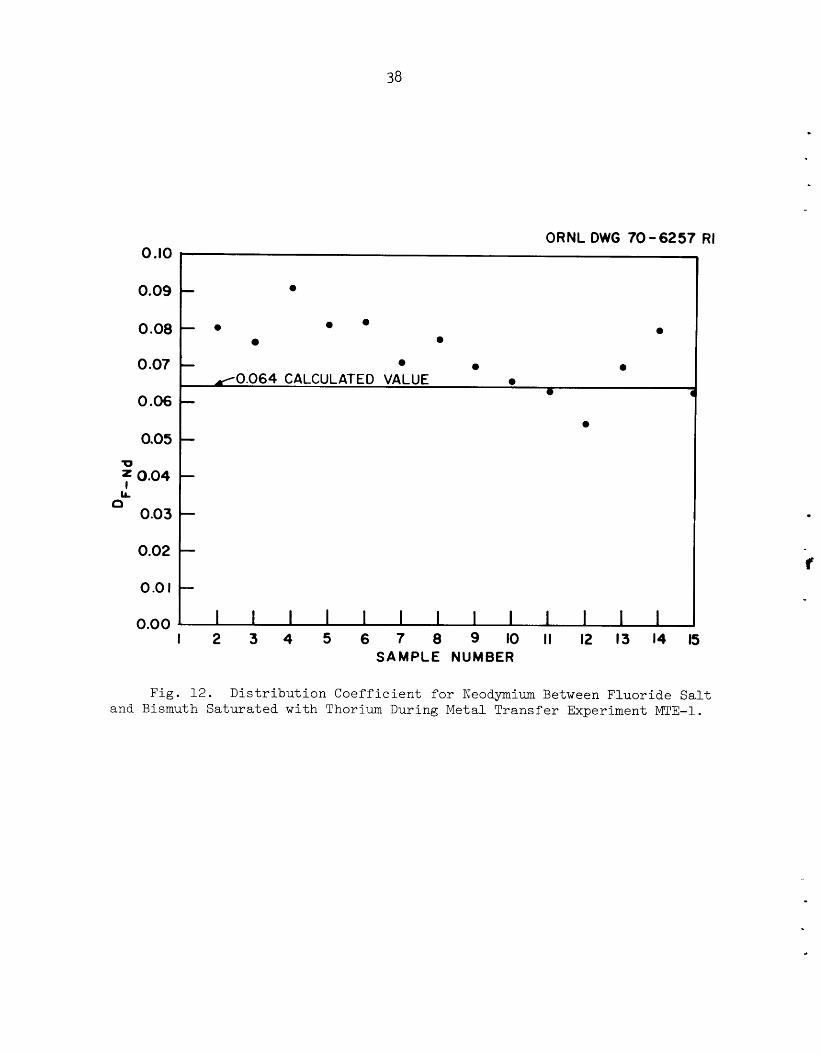
during the run. As .hewn in Figs. 11 and 12, the average values for the
distribution coefficients between the fluoride salt and bismuth for lan-
thanum and neodymium were 0.044 and 0.073, respectively.
coefficient values are in good agreement with values obtained in previous
studies .lo
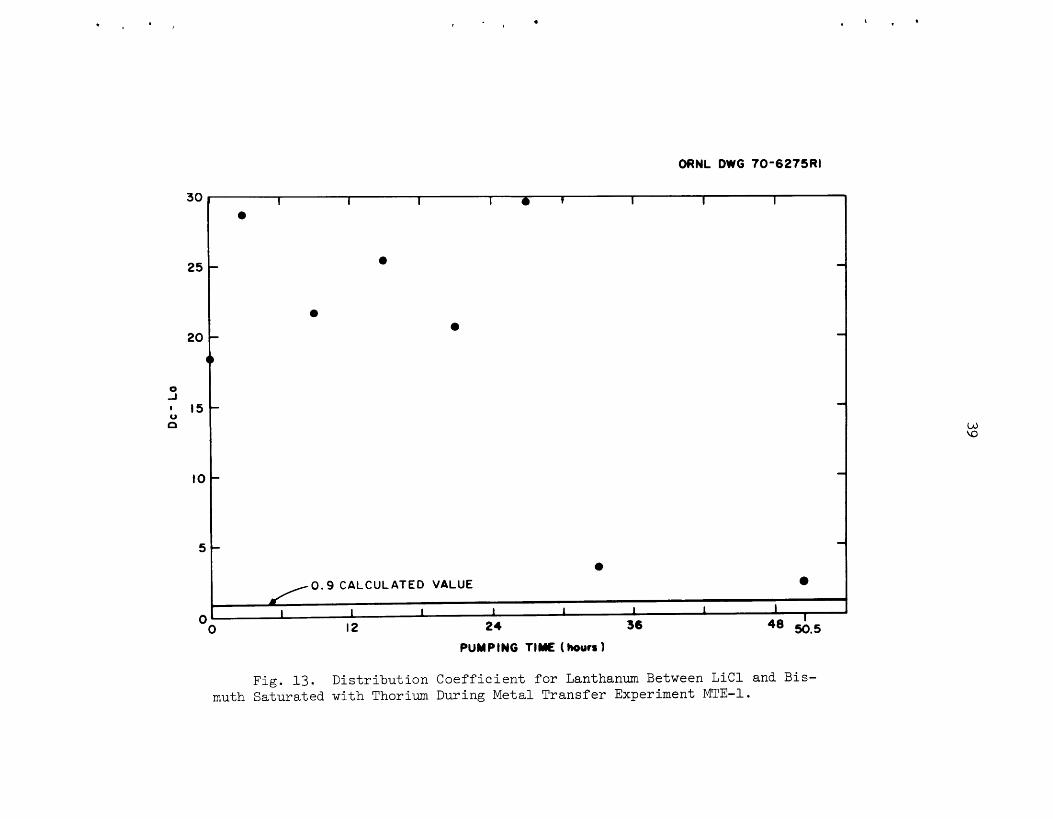
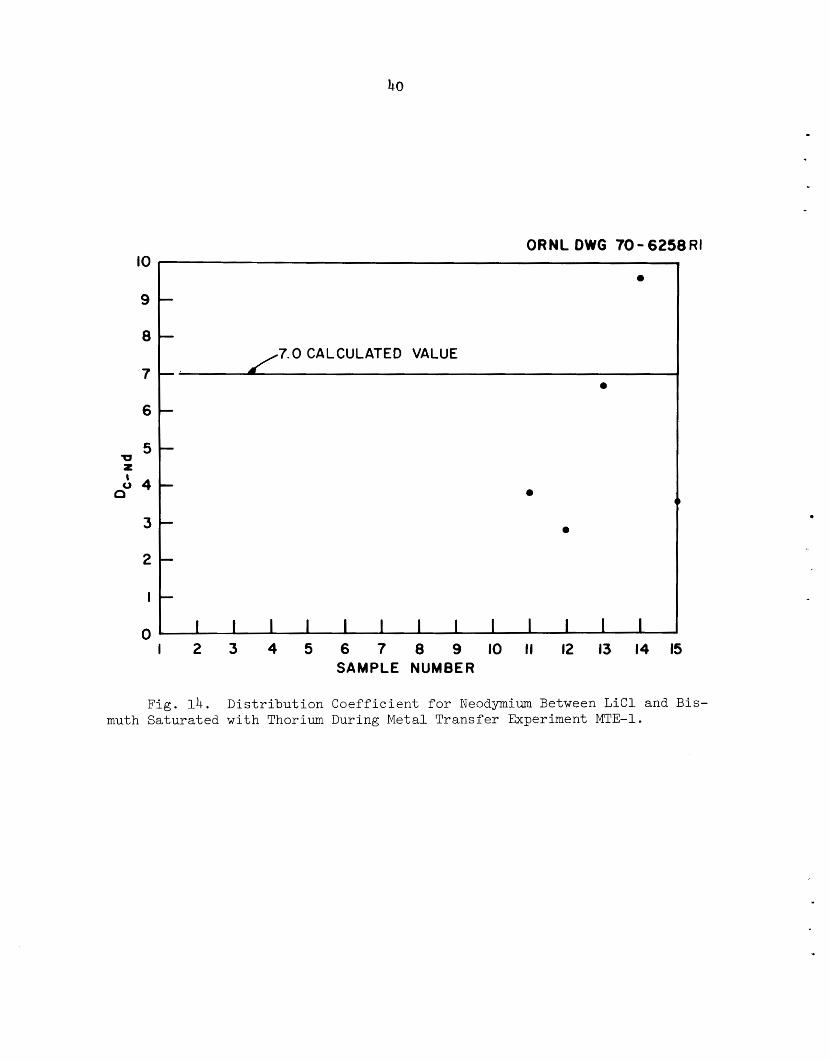
between the bismuth and lithium chloride are shown in Figs. 13 and 14. These data show considerable scatter during the first two-thirds of the
experiment because of the low concentrations of rare earths in the lithium
chloride. The neodymium concentration in the lithium chloride was too low
to be determined accurately, and the lanthanum concentration was lower than
The distribution
Distribution coefficient values for lanthanum and neodymium
37
I I I I \ 1 I6 I I b b 1 0 1 1 12 1 3 1 4 1 5 I
0.07
0.06
0.05
0.04
0 0.03
a,?
0.02
0.01
ORNL DWG 70-6269RI I I I I I I 1 I I 4 1 ? I I
0.064 CALCULATED VALUE 0.590 0.167
0 0
0
0
- SAMPLE NUMBER
Fig. 11. D i s t r i b u t i o n Coef f i c i en t f o r Lanthanum Between Fluoride S a l t and Bismuth Sa tu ra t ed wi th Thorium During Metal Transfer Experiment MTE-1.
38
0.02
ORNL OWG 70-6257 RI
~
0 .IO
0.01
0.09
- I I I I I I I I I I I I I
0.08
0.07
0.06
0.05 U
I 0.04
l i 0
0.03
- 0
0 - 0 0 . 0
0 0
0
- 0
~ 0 . 0 6 4 CALCULATED VALUE 0
- 0 -
c
Fig. 12. Distribution Coefficient for Neodymium Between Fluoride Salt and Bismuth Saturated with Thorium During Metal Transfer Experiment MTE-1.
30
25
20
0 J I 15 u D
to
5
I
I I I I I 1 I I
ORNL DWG 70-6275RI
I I I I 0 t I I I 0
e
Fig. 13. D i s t r i b u t i o n Coef f i c i en t f o r Lanthanum Between LiCl and B i s - muth Sa tura ted with Thorium During Metal Transfer Experiment MTE-1.
9 -
8 -
7 -
U : 4 Z j
a
3
0
7.0 CALCULATED VALUE
0
0
I 2 3 4 5 6 7 8 9 1011 12 13 1 4 1 5 SAMPLE NUMBER
Fig. 14. Distribution Coefficient for Neodymium Between LiCl and Bis- muth Saturated with Thorium During Metal Transfer Experiment MTE-1.
41
expected.
bismuth and lithium chloride phases was not sufficient to maintain equi-
librium during this period.
lithium chloride about midway through the run, and during the last third
of the experiment the average distribution coefficients for lanthanum
(2.8) and neodymium (5) between the bismuth and lithium chloride phases were reasonably close to expected values'' (0.9 for La and 7.0 for Nd).
These results probably indicate that the contact between the
An argon sparge tube was inserted into the
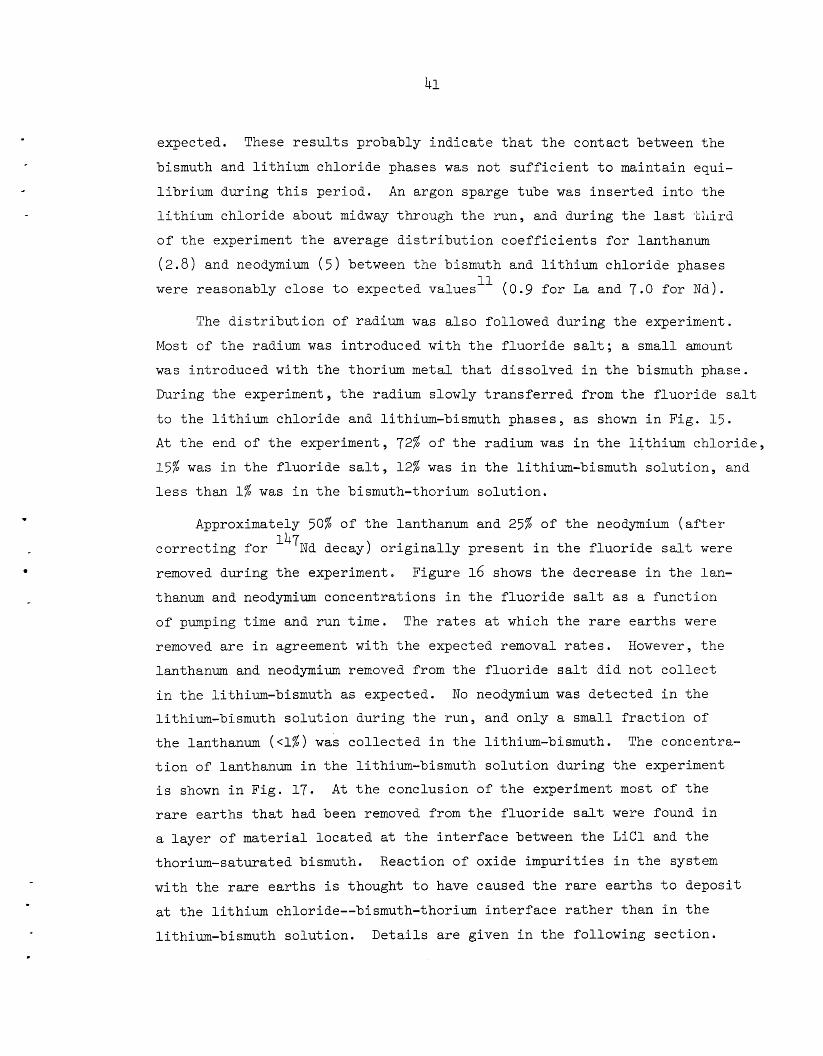
The distribution of radium was also followed during the experiment.
Most of the radium was introduced with the fluoride salt; a small amount
was introduced with the thorium metal that dissolved in the bismuth phase.
During the experiment, the radium slowly transferred from the fluoride salt
to the lithium chloride and lithium-bismuth phases, as shown in Fig. 1 5 . At the end of the experiment, 72% of the radium was in the lithium chloride, 15% was in the fluoride salt, 12% was in the lithium-bismuth solution, and less than 1% was in the bismuth-thorium solution.
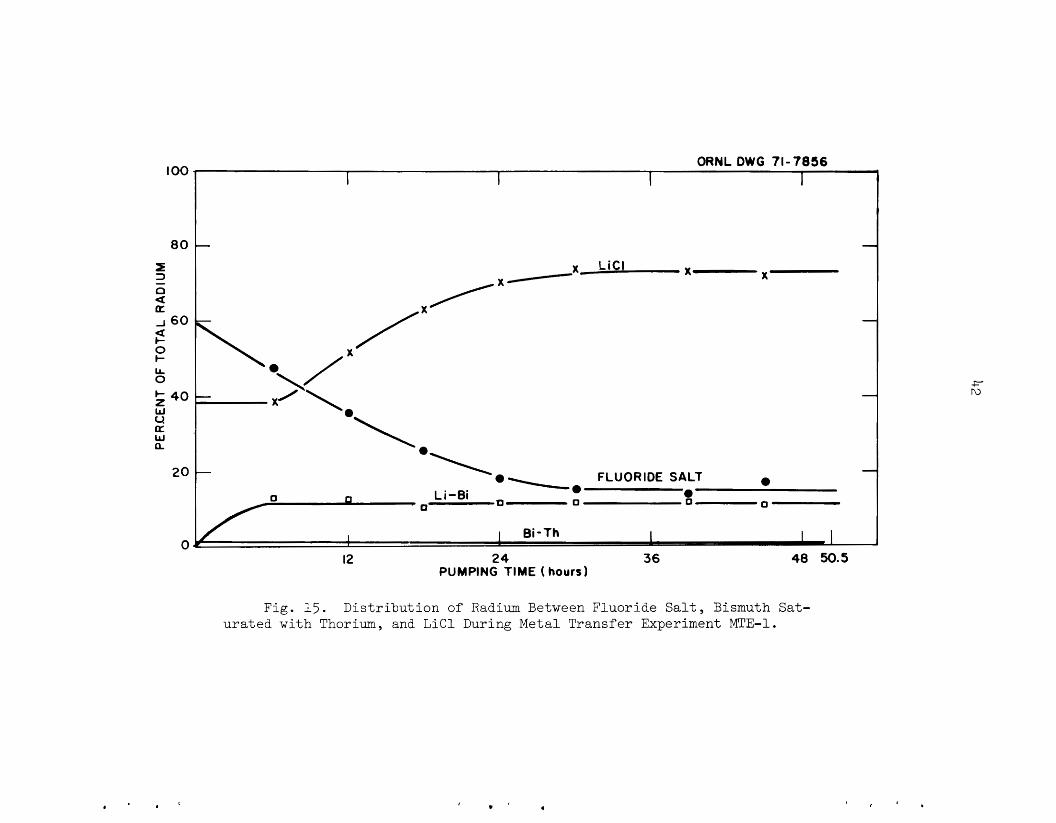
Approximately 50% of the lanthanum and 25% of the neodymium (after
correcting for 147Nd decay) originally present in the fluoride salt were
removed during the experiment, Figure 16 shows the decrease in the lan- thanum and neodymium concentrations in the fluoride salt as a function
of pumping time and run time. The rates at which the rare earths were
removed are in agreement with the expected removal rates. However, the
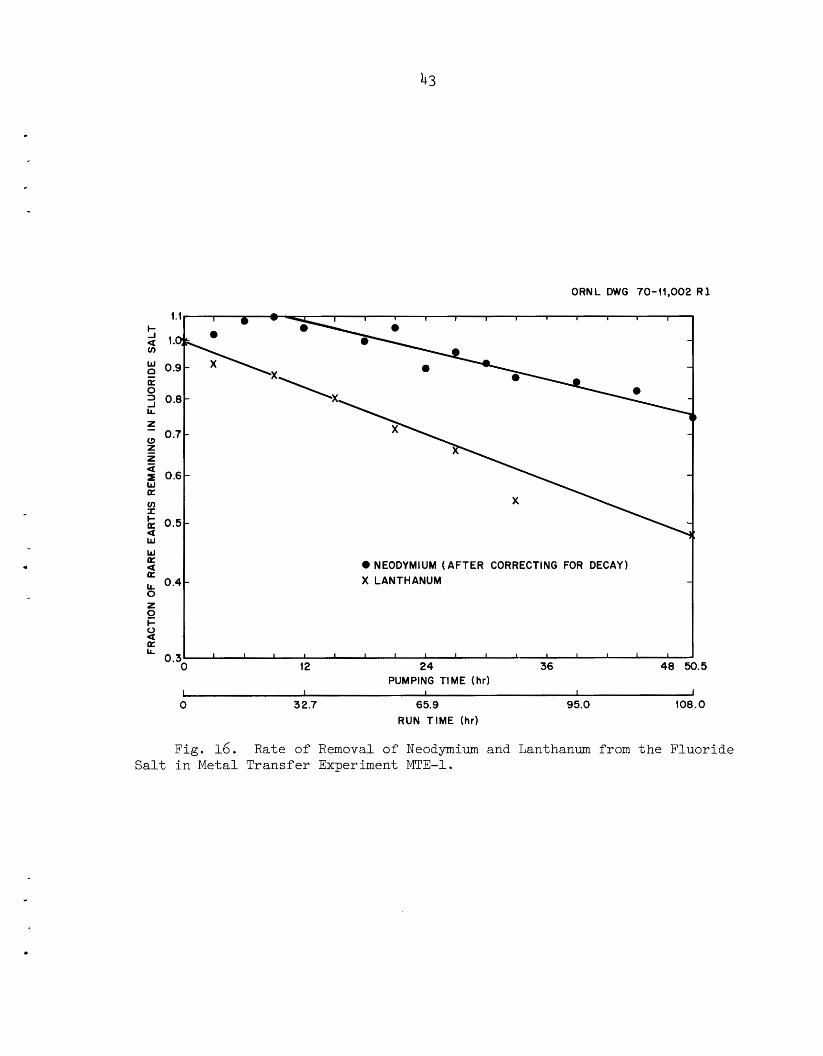
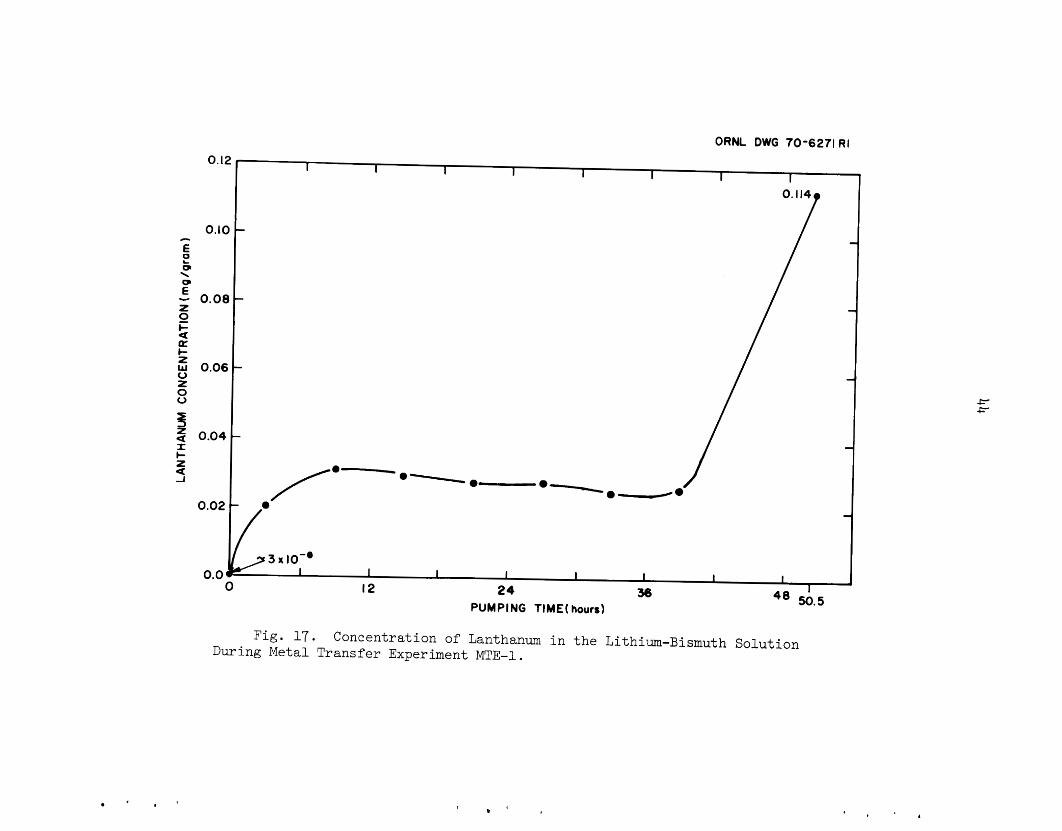
lanthanum and neodymium removed from the fluoride salt did not collect
in the lithium-bismuth as expected. No neodymium was detected in the
lithium-bismuth solution during the run, and only a small fraction of
the lanthanum (~1%) was collected in the lithium-bismuth. The concentra-
tion of lanthanum in the lithium-bismuth solution during the experiment
is shown in Fig. 17. At the conclusion of the experiment most of the
rare earths that had been removed from the fluoride salt were found in
a layer of material located at the interface between the LiCl and the
thorium-saturated bismuth. Reaction of oxide impurities in the system
with the rare earths is thought to have caused the rare earths to deposit
at the lithium chloride--bismuth-thorium interface rather than in the
lithium-bismuth solution. Details are given in the following section. .
IO0
80
f - 0
[L a 160 2 0 k LL 0
5 40 W u a W a
20
0
ORNL OWG 71-7856 I 1 1 I
- X X LiCl
\ -
a FLUORIOE SALT 0 !! 0
a\
\ -
0 0 Li-Bi ‘ 0
I 1 Bi-Th I I 12 24 36 48 50.5
PUMPING TIME (hours)
Fig. 1 5 . Distribution of Radium Between Fluoride Salt, Bismuth Sat- urated with Thorium, and LiCl During Metal Transfer Experiment MTE-1.
4
43
z I- o
(L
0
a a
ORNL DWG 70-11,002 R 1
I I I I I I I I I I I I I I I I ,
0.9- P a 0 3 0.8- iL
f 0.7 - I z a a
(3
0 .6 - W
v) I t-
W W
K
0
a 0 . 5 - a
a a iL 0.4-
0 NEODYMIUM (AFTER CORRECTING FOR DECAY) X LANTHANUM 1
Fig. 16. Rate of Removal of Neodymium and Lanthanum from t h e F luor ide S a l t i n Metal Transfer Experiment MTE-1.
44
I I
1 I
I
1 0 i i i \
I I
I I
I 0 %
rc)
2 0
45
4 .4 Pos topera t iona l Equipment Examination
A t t h e end of t h e experiment, t h e carbon-steel v e s s e l was cu t a p a r t
f o r i n spec t ion .
f l u o r i d e sa l t during t h e experiment was found i n a l / a - in . - th i ck l a y e r
of black material l o c a t e d at t h e i n t e r f a c e between t h e l i t h i u m ch lo r ide
Most of t h e L a and Nd t h a t had been removed from t h e
and t h e bismuth t h a t was s a t u r a t e d with thorium. Chemical a n a l y s i s showed
t h e b lack l a y e r t o con ta in 3.6 w t % L a , 7 .7 wt % Th, 1 2 wt % L i , 0.95 w t
% Si, 0.54 w t % Fe, 59 w t % C1, 4.4 w t % 0, with t h e remaining m a t e r i a l
being bismuth.
that could be p o s i t i v e l y i d e n t i f i e d by X-ray d i f f r a c t i o n . Thorium oxide
was expected t o be present a t t h e poin t where t h e b lack m a t e r i a l vas found,
as t h e r e s u l t of r e a c t i o n of thorium w i t h oxide impur i t i e s i n t h e system.
The chemical form of t h e r a r e e a r t h s i n t h e b l ack material was not de t e r -
minded; however, it i s be l i eved t h a t t he presence of oxide i n t h e system
i s respons ib le f o r t h e accumulation of r a r e e a r t h s a t t h e i n t e r f a c e between
t h e l i t h i u m ch lo r ide and t h e thorium-saturated bismuth r a t h e r than i n the
lithium-bismuth s o l u t i o n . Oxide impur i t i e s were probably introduced i n t o
t h e system i n two ways:
( 2 ) by exposure of t h e sa l t t o a i r dur ing i n s t a l l a t i o n of t h e second
Thorium oxide and l i t h i u m c h l o r i d e were t h e only compounds
(1) by d e t e r i o r a t i o n of t h e quar tz pumps, and
quar tz pump.
Other a r e a s i n t h e system were a l s o checked f o r accumulation of r a r e
e a r t h s . A l a y e r of m a t e r i a l approximately 1/8 i n . t h i c k was noted at t h e
bottom of t h e bismuth t h a t was s a t u r a t e d w i t h thorium. The appearance of
t h i s l a y e r was d i f f e r e n t from t h a t of the remainder of t h e metal phase.
The m a t e r i a l was pyrophoric , and sparks and yellow smoke could be produced
by sc ra t ch ing i t s su r face . It contained 20 w t % thorium and i s assumed t o
be composed of a mixture of thorium bismuthide p a r t i c l e s and bismuth. A l -
though t h e Nd and L a concent ra t ions i n t h i s l a y e r were about t e n t imes t h e
concent ra t ions of t h e r a r e earths i n f i l t e r e d samples of t h e bismuth-thorium
s o l u t i o n taken dur ing t h e run , t h e a c t u a l r a re -ea r th inventory amounted t o
only about 3% of t h e t o t a l r a r e earths i n t h e system.
thorium metal could a l s o be seen i n t he thorium-bismuth phase, which in-
d i c a t e s t h a t s u f f i c i e n t thorium was present t o main ta in t h e thorium con-
Lumps of undissolved
46
centration in the bismuth at its solubility during the run.
steel dip tubes and portions of the quartz pump were examined for 1471Vd
activity. No significant amounts of 147Nd were found on these components
or in the lithium chloride that had condensed in the upper portion of
the vessel.
no evidence of corrosion.
condition.
lithium chloride were white in appearance, and the quartz was somewhat
weaker than initially as the result of devitrification.
The carbon-
The carbon-steel vessel and other steel components showed
The quartz pump was also in reasonably good
The surfaces of the quartz that had been in contact with the
4.5 Design and Testing of a Carbon-Steel Pump Having Molten-Bismuth Check Valves
Because of the difficulties encountered with the operation of quartz
pumps for circulating the lithium chloride in metal transfer experiments,
a carbon-steel pump having molten-bismuth check valves was designed and
tested. The pump, shownschematically in Fig. 18, was operated with lithium chloride at a flow rate of about 25 cm 3 /min at 650'~ for about 2 weeks.
The pump operated satisfactorily and appears to be suitable for use in
future metal transfer process experiments.
5. STUDY OF THE PURIFICATION OF SALT BY CONTINUOUS METHODS
R. B. Lindauer L. E. McNeese
To date, the molten salt required for development work, as well as
for the MSRE, has been purified from harmful contaminants (mainly sulfur,
oxygen, and iron fluoride) by batch processes.
labor costs associated with salt purification can be reduced considerably
by the use of a continuous process for the most time-consuming operation,
which is the hydrogen reduction of iron fluoride. Equipment'* has been
installed in which molten salt and gas can be countercurrently contacted
in a packed column to obtain data for design of a full-scale continuous
salt purification facility.
It is believed that the
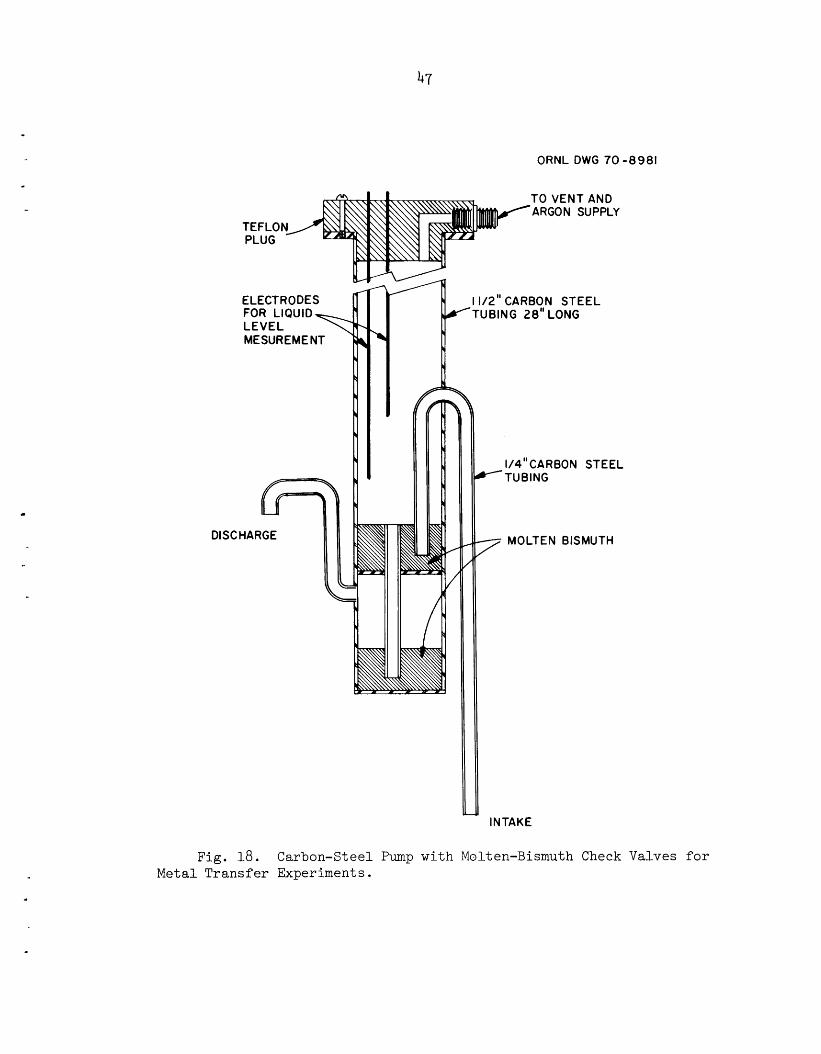
47
ORNL DWG 70-8981
ELECTRODES FOR LIQUID LEVEL MESUREMENT
r'
I
4
I
I
I
t
DISCHARGE
TO VEN 'ARGON
T AND SUPPLY
I1/2" CARBON STEEL TUBING 28" LONG
1 I/4"CARBON STEEL
-TUBING
- MOLTEN BISMUTH /
INTAKE
Fig . 18. Carbon-Steel Pump wi th Molten-Bismuth Check Valves for Metal Transfer Experiments.
48
During t h i s r e p o r t i n g pe r iod , t h e system w a s charged wi th 28 kg of
LiF-BeF2 (66-34 mole %), and t e n f looding runs were c a r r i e d out us ing
hydrogen and argon. Af te r t h e f i r s t f looding run wi th hydrogen had
been completed, t h e feed l i n e t o t h e column became plugged. Since oxide
i n t h e sa l t was be l i eved t o be causing t h e r e s t r i c t i o n , t h e sa l t was
t r e a t e d wi th a H2-HF mixture.
i n t h e s a l t was removed, as ind ica t ed by a n a l y s i s of t h e off-gas s t ream
f o r water ; however, t h e plugging r ecu r red a f t e r sa l t was aga in fed through
t h e column. The d i f f i c u l t y was apparent ly caused by plugging of t he ,1 /16 -
in.-diam ho les a t t h e bottom of t h e i n l e t sa l t d i s t r i b u t i o n r i n g . Since
no r e s t r i c t i o n was found i n t h e l/h-in.-OD feed l i n e , a 3/16-in.-diam ho le
was d r i l l e d through t h e inne r w a l l of t h e d i s t r i b u t o r r i n g t o provide an
a l t e r n a t e sa l t i n l e t and t h e feed l i n e was rep laced wi th a 3/8-in.-diam
l i n e . Af t e r t h i s modi f ica t ion , s a t i s f a c t o r y sa l t flow t o t h e column w a s
obtained. D e t a i l s of t h e opera t ions c a r r i e d out f o r t h e removal of oxide
from t h e sa l t and of t h e f looding runs are given i n t h e remainder o f t h i s
s e c t ion .
Oxide exceeding t h e amount t h a t i s so lub le
5 . 1 Batch Treatment of S a l t f o r Oxide Removal
After t h e f i r s t run , most of t h e sa l t i n t h e system (13.3 l i t e r s )
was t r e a t e d wi th a 4% HF-H2 mixture i n t h e feed t ank for 9 h r .
beginning of t h e t rea tment per iod , t h e sal t w a s hea ted t o 6 5 0 ~ ~ t o d i s s o l v e A t t h e
as much of t h e oxide as p o s s i b l e . A s oxide w a s removed from the s a l t , t h e
temperature of t h e sal t was slowly decreased t o a f i n a l va lue of 5 3 5 O C i n
o rde r t o i nc rease t h e s o l u b i l i t y of HF i n t h e sa l t and thereby inc rease
t h e r a t e of r e a c t i o n between HF and t h e oxide.
The off-gas s t ream from t h e oxide removal ope ra t ion was cont inuously
analyzed f o r water by use of a e l e c t r o l y t i c hygrometer, which waspreceded
by a NaF bed f o r removing HF.13 A t o t a l of 580 ppm of oxide was removed;
t h i s i s s l i g h t l y more than twice t h e s o l u b i l i t y o f Be0 i n t h e s a l t a t
650'C. The average HF u t i l i z a t i o n was 30%.
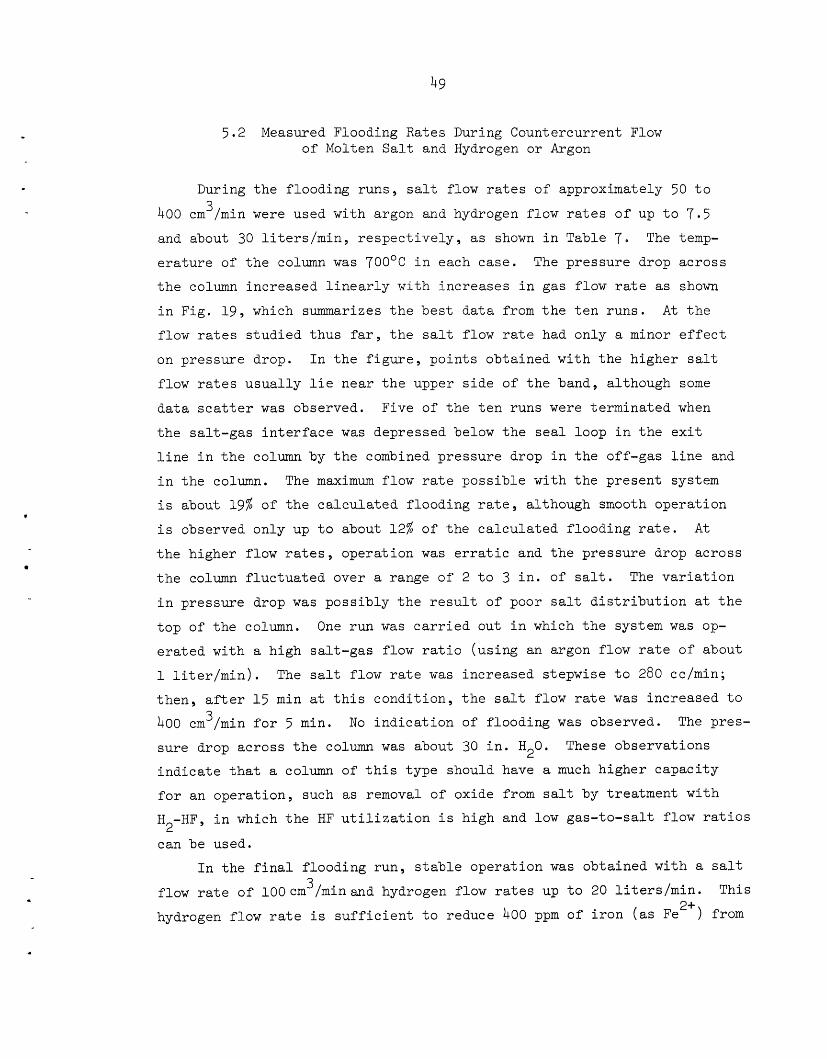
49
5.2 Measured Flooding Rates During Countercurrent Flow of Molten S a l t and Hydrogen or Argon
During t h e f looding runs , sa l t flow r a t e s of approximately 50 t o
400 cm /min were used with argon and hydrogen flow r a t e s o f up t o 7 .5 and about 30 l i t e r s / m i n , r e s p e c t i v e l y , as shown i n Table 7 . The temp-
e r a t u r e of t h e column was 7 O O 0 C i n each case .
t h e column increased l i n e a r l y wi th inc reases i n gas flow rate as shown
i n Fig. 19, which summarizes t h e b e s t d a t a from t h e t e n runs . A t t h e
flow r a t e s s tud ied t h u s f a r , t h e sa l t flow r a t e had only a minor e f f e c t
on p res su re drop.
flow r a t e s u s u a l l y l i e near t h e upper s i d e of t h e band, a l though some
d a t a s c a t t e r was observed. Five of t h e t e n runs were te rmina ted when
t h e sa l t -gas i n t e r f a c e was depressed below t h e s e a l loop i n t h e e x i t
l i n e i n t h e column by t h e combined p res su re drop i n t h e off-gas l i n e and
i n t h e column. The maximum flow r a t e poss ib l e wi th t h e present system
i s about 19% of t h e c a l c u l a t e d f looding r a t e , a l though smooth opera t ion
i s observed only up t o about 12% of t h e c a l c u l a t e d f looding r a t e .
t h e h igher flow r a t e s , opera t ion w a s e r r a t i c and t h e pressure drop across
t h e column f l u c t u a t e d over a range of 2 t o 3 i n . of s a l t . The v a r i a t i o n
i n pressure drop was poss ib ly t h e r e s u l t of poor sa l t d i s t r i b u t i o n a t t h e
t o p of t h e column.
e r a t e d with a high sa l t -gas flow r a t i o (us ing an argon flow r a t e of about
1 l i t e r / m i n ) .
t h e n , a f t e r 15 min at t h i s cond i t ion , t h e sa l t flow r a t e was increased t o 3 400 cm /min f o r 5 mine No i n d i c a t i o n of f looding was observed. The pres-
su re drop across t h e column was about 30 i n . H20.
i n d i c a t e t h a t a column of t h i s t ype should have a much h igher capac i ty
for an ope ra t ion , such as removal of oxide from sal t by t reatment w i th
H
can be used.
3
The p res su re drop ac ross
I n t h e f i g u r e , p o i n t s ob ta ined wi th t h e h igher sa l t
A t
One run w a s c a r r i e d out i n which t h e system was op-
The sal t flow r a t e w a s increased s tepwise t o 280 cclmin;
These observa t ions
HF, i n which t h e HF u t i l i z a t i o n i s h igh and low gas- to-sal t f low r a t i o s 2-
I n t h e f i n a l f looding run , s t a b l e ope ra t ion was obta ined wi th a s a l t 3 flow r a t e of 100cm /minand hydrogen flow r a t e s up t o 20 l i t e r s / m i n .
hydrogen flow rate i s s u f f i c i e n t t o reduce 400 ppm of i r o n (as Fe2+) from
This
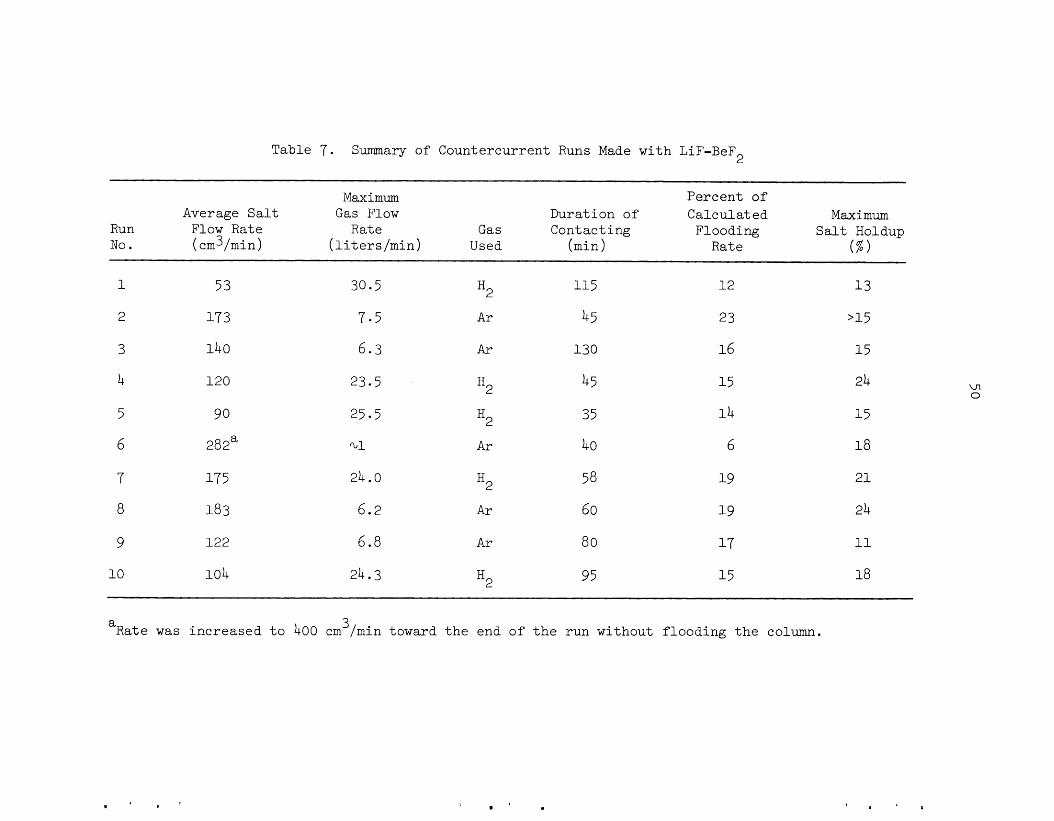
..
x
idh
j c
dm
ffi-P
c
cd .rl
M
rl
cu rl
Ln
rl rl cu X
Ln
0
M
M
Ln
Fi
Ln
A
rl
M
cu
Ln
3
4 Ln
t-
M
t- rl
cu
Ln
rl
\L)
rl
0
M
rl
2 M
ul . 0
3
rl
M
3
cu
Ln
rl
In
3 cu
x Ln
M
cu
0
cu rl
3
a3
rl
Ln
rl
Ln
o\ cv
X
M
3
cu . 3 0
rl
0
rl
rl 0
0
a,
5 M
d
*d
rd
0
0
rl CH
-P
=l 0
5 *rl 3 d 3 k
Q)
d
-P
k
0
rd
d
a,
a, d
+,
rd
k
cd
-P
d
*rl ,e \
M ti 0
0
A-
0
-P
rd
a, rn cd a, k
.rl 2 2 a, c, cd ffi
cd
D
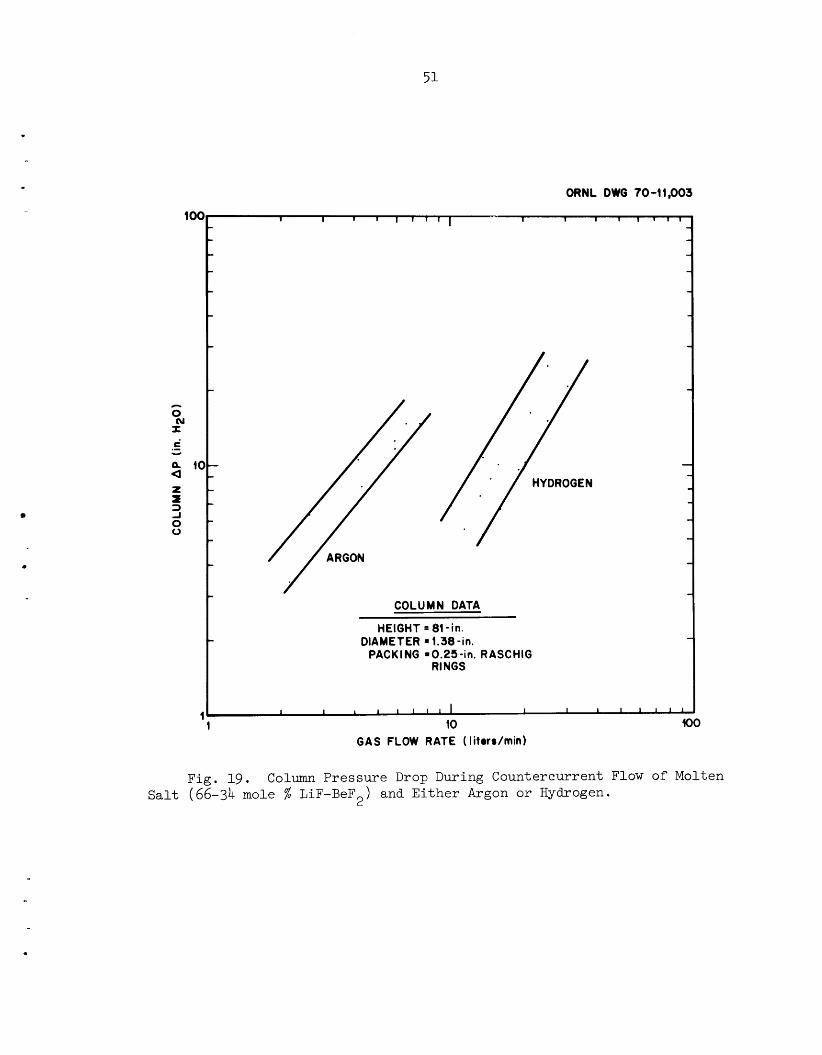
ORNL DWG 70-11,003
100- I I 1 1 1 1 1 1 I I 1 I l l 1 1 c - - - - - c - - - - - -
- - c
%l I c'
Q 10- a - 1-
Y
- - z - -I 0 0
- f c -
- - - - - - - -
COLUMN DATA
HEIGHT = 81 -in. - DIAMETER = 1.38 -in. - PACKING 80.25-in. RASCHIG
RINGS
1 I 1 I 1 1 1 1 I 1 1 I 1 1 1 1
10 IO0 1 1
Fig. 19. Column Pressure Drop During Countercurrent Flow of Molten Salt (66-34 mole % LiF-BeF ) and Either Argon or Hydrogen. 2
52
3 a 100 cm /min sal t stream, assuming t h a t t h e gas and sal t reach equi l ibr ium
at 700°C; however, t h e mass t r a n s f e r c o e f f i c i e n t i s probably not s u f f i c i e n t l y
h igh t o a l low equi l ibr ium t o be reached wi th t h e p re sen t column he ight (81 i n . ) .
6. SEMICONTINUOUS REDUCTIVE EXTRACTION EXPERIMENTS I N A MILD-STEEL FACILITY
B. A. Hannaford C. W. Kee L. E. McNeese
Following r o u t i n e H -HF t rea tment of t h e bismuth and sa l t i n t h e sys- 2 tem, t h e phases were t r a n s f e r r e d t o t h e i r r e s p e c t i v e feed t anks . o f p u r i f i e d LiF-UF4 e u t e c t i c sa l t w a s added t o t h e sa l t phase t o produce a
UF concent ra t ion of about 0.0003 mole f r a c t i o n f o r t h e f i r s t mass t r a n s f e r
run (UTR-1) .
and t e n p a i r s of bismuth and sa l t samples were taken .
e r a t e d a t 63% and 82% of f looding ( a t a bismuth-to-salt volumetr ic flow
rate r a t i o of u n i t y ) ; neve r the l e s s , v i r t u a l l y none of t h e uranium was ex-
t r a c t e d from t h e sa l t due t o an ope ra t iona l d i f f i c u l t y t h a t prevented re-
ductant from being added t o t h e bismuth.
Then 90 g
4 Hydrodynamic performance dur ing t h e 140-min run was e x c e l l e n t ,
The column was op-
Di s so lu t ion o f thorium i n t h e bismuth feed tank i n p repa ra t ion f o r t h e
second mass t r a n s f e r experiment proceeded slowly as t h e r e s u l t of poor mix-
i n g i n t h e t ank ,
s a l t . The run w a s made wi th a 200% excess of reductan t over t h e s to i ch io -
met r ic requirement and wi th bismuth and sa l t f low rates of 247 ml/min and
52 ml/min, r e s p e c t i v e l y . These flow rates a r e equiva len t t o about 83% of
f looding
I n run UTR-2, 95% of t h e uranium was e x t r a c t e d from t h e
6.1 Prepa ra t ion f o r Mass Transfer Experiments
I n p repa ra t ion f o r t h e f irst mass t r a n s f e r experiment w i t h uranium,
t h e sa l t and bismuth were t r e a t e d wi th H2-HF t o remove t r a c e s of ox ides .
The procedure was e s s e n t i a l l y t h e same as descr ibed e a r l i e r ,
t h a t t h e gas flow r a t e (30% HF-H2) was only 15 scfh .
14 except
The u t i l i z a t i o n of
53
4
HF decreased from an i n i t i a l va lue of about 30% t o 5 t o 10% dur ing most
of t h e 15-hr t rea tment per iod .
r a p i d l y t o about 1%.
i r o n f luoride, and argon sparging t o remove HF, a 400-g charge of thorium
metal was added t o t h e t rea tment v e s s e l i n order t o t ransfer zirconium
from t h e sa l t phase t o t h e bismuth phase and t o supply t h e necessary r e -
ductant i n t h e bismuth f o r t h e f i r s t mass t ransfer experiment. About
24 h r a f t e r t h e thorium metal had been added t o t h e t rea tment v e s s e l ,
t h e sal t and bismuth phases were sampled and t r a n s f e r r e d t o t h e respec-
t i v e feed t anks
A t t h e end of t h e pe r iod , it decreased
Following per iods o f hydrogen sparging t o reduce
A 270-g ba tch of LiF-UF4 e u t e c t i c sa l t was prepared by p l ac ing 51.6 g
of LiF and 231 g of UF4 i n a small g raph i t e c r u c i b l e i n which t h e materials
were melted and sparged wi th a HF-H2 mixture f o r about 6 h r a t 650 '~ . H -HF gas flow r a t e w a s t o o low dur ing t h i s per iod t o ob ta in meaningful
gas samples without u p s e t t i n g t h e off-gas p re s su re , and i n t u r n , t h e gas
flow r a t e and t h e composition of t he gas .
t h e e u t e c t i c mixture was s o l i d i f i e d and d iv ided i n t o two p a r t s .
po r t ion was added t o t h e sa l t feed tank i n p repa ra t ion f o r t h e f i r s t mass
t r a n s f e r experiment (UTR-1).
The
2
Following t h e t rea tment pe r iod ,
A 90-g
6 .2 Mass Transfer Experiment WR-1
The f i r s t uranium mass t r a n s f e r run (UTR-1) was very success fu l from
t h e s tandpoin t of hydrodynamics and demonstrated t h a t simultaneous samples
of t h e bismuth and sal t l eav ing t h e e x t r a c t i o n column can be taken e a s i l y .
However, t h e run f a i l e d t o provide mass t r a n s f e r d a t a f o r reasons descr ibed
below.
During t h e run , a uniform flow rate of each phase was maintained a t 100
ml/min (about 63% of f looding) f o r 90 min, dur ing which seven s e t s of simul-
taneous samples of t h e sa l t and bismuth streams l eav ing t h e column were
taken. Three a d d i t i o n a l sets of samples were taken during t h e 25-min per iod
i n which t h e s a l t and bismuth flow r a t e s were increased t o 130 ml/min (about
82% of f lood ing) . The flow r a t e s were determined from t h e changes i n t h e
54
bismuth and sal t volumes i n t h e feed t anks dur ing t h e run , as shown i n
Fig. 20. Analyses of t h e flowing bismuth samples f o r uranium and thorium
showed l i t t l e , if any, of t h e s e m a t e r i a l s (<2 ppm of U and <4 ppm of Yh).
A review of t h e procedure followed dur ing t h e e a r l i e r a d d i t i o n o f thorium
metal t 3 t h e t rea tment v e s s e l showed t h a t most of t h e thorium had f a i l e d
t o e n t e r t h e c r u c i b l e conta in ing t h e bismuth and sal t because a cube of
thorium had blocked t h e ho le i n t h e g r a p h i t e c r u c i b l e cover , causing t h e
thorium cubes t h a t were subsequently added t o come t o rest on t h e c r u c i b l e
cover
Uraniun ana lyses of sa l t from t h e sa l t feed t ank and from t h e sa l t
r e c e i v e r v e s s e l were i d e n t i c a l (1200 ppm), which i n d i c a t e s t h a t t h e r e
w a s no t r a n s f e r of uranium from t h e s a l t .
r e s u l t s f o r t h e bismuth samples, which a l s o showed t h a t no t r a n s f e r of
uranium t o t h e bismuth phase occurred during t h e experiment; however, t h e
uranium concent ra t ions r epor t ed f o r t h e s e t of n ine flowing s a l t samples
averaged 1092 ppm; each va lue i n t h i s set was less than t h e expected va lue
of 1200 ppm.
This confirmed a n a l y t i c a l
A p o s s i b l e explana t ion f o r t h e low uranium concent ra t ions i n t h e flow-
i n g s a l t samples was considered and d iscarded . If t h e sa l t contained as
much as 3 v o l % en t r a ined bismuth, t h e e f f e c t would be a decrease i n t h e
uranium concent ra t ion i n t h e sample t o about t h e average va lue observed
s i n c e t h e bismuth contained no uranium.
sa l t samples i n d i c a t e d bismuth concent ra t ions o f less than 80 ppm, or
l e s s t han approximately 0.003 v o l %. Simi la r ly , t h e r e was no inve r se
c o r r e l a t i o n of r epor t ed sample weights wi th i n d i c a t e d uranium concentra-
t i o n s . The entrainment d e t e c t o r ( l o c a t e d between t h e sal t o u t l e t from
t h e column and t h e sa l t sampler) a l s o provided evidence t h a t bismuth
entrainment i n sa l t l eav ing t h e column was less than (probably much less
t h a n ) 1 . 5 v o l %, t h e entrainment r a t e t h a t would be r equ i r ed i n o rde r
f o r t h e bismuth l e v e l i n t h e d e t e c t o r t o reach t h e lower probe. The b i s -
muth entrainment measurements were made while t h e column was ope ra t ing at
82% of f looding; t h e s a l t i n t h e d r a i n l i n e below t h e entrainment d e t e c t o r
w a s f rozen dur ing t h i s per iod .
However, t h e a n a l y s i s of random
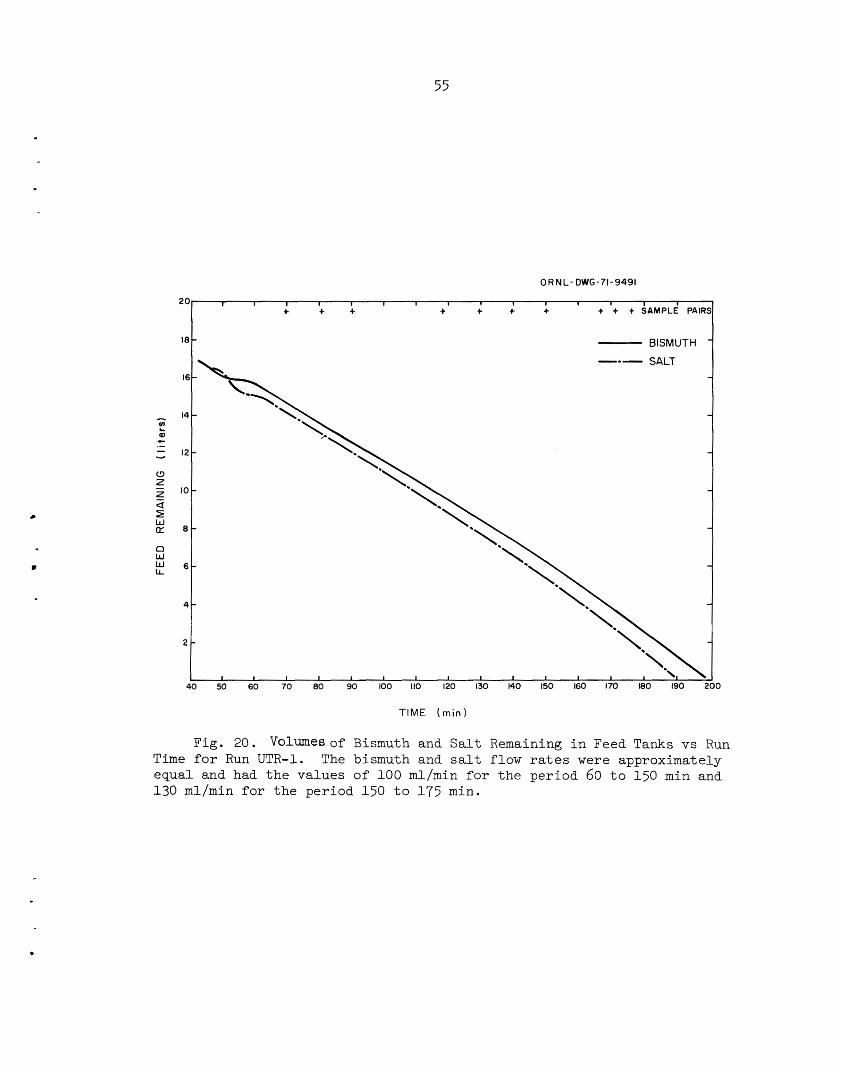
55
1 I I I 1 I I I 1 1 1 1 1 + + +
1 + + I + + t SAMPLE PAIRS 20 + +
- BISMUTH - -0- SALT
18 -
Fig. 20. Time for Run UTR-1. The bismuth and sa l t f l o w r a t e s were approximately equal and had t h e values of 100 ml/min for t h e per iod 60 t o 150 min and 130 ml/min f o r t h e per iod 150 t o 175 min.
V d U e s o f Bismuth and S a l t Remaining i n Feed T a n k s vs Run
56
Following experiment UTR-1, t h e s a l t and bismuth were r e tu rned t o
t h e i r r e s p e c t i v e f e e d tanks i n p repa ra t ion f o r experiment UTR-2.
6 .3 Mass Transfer Experiment UTR-2
Because of t h e d i f f i c u l t y encountered i n adding thorium meta l t o
t h e t rea tment v e s s e l p r i o r t o run UTR-1, t h e thorium reduc tan t for ex-
periment UTR-2 w a s added d i r e c t l y t o t h e bismuth f eed tank .
charge d isso lved very slowly i n t h e bismuth, poss ib ly because of inadequate
a g i t a t i o n of t h e meta l phase by t h e argon sparge. Pe r iod ic samples of t h e
metab phase ( t a k e n wi th a s tandard f r i t t e d sampler and wi th a g r a p h i t e
l a d l e ) showed t h a t t h e thorium concent ra t ion w a s i nc reas ing a t t h e ra te of
only about 2 ppm/hr.
sample and a l a d l e sample ind ica t ed thorium concent ra t ions of 750 ppm and
1100 ppm, r e s p e c t i v e l y . These va lues should be compared wi th t h e thorium
s o l u b i l i t y i n bismuth a t 540°C ( L e . , 880 pprn) and a material ba lance
va lue of 1165 ppm, assuming complete d i s s o l u t i o n of t h e thorium.
The 192.5-g
Af t e r 200 h r a t 540°C and 120 h r a t 6 3 0 " ~ , a f i l t e r e d
The balance of t h e LiF-UF4 e u t e c t i c (180 g ) w a s added t o t h e sa l t
f eed t ank t o b r i n g t h e uranium concent ra t ion t o about 3000 ppm.
of u n c e r t a i n t y i n t h e va lue f o r t h e thorium concent ra t ion i n t h e bismuth,
a bismuth-to-sal t f low rate r a t i o of 5 w a s used f o r experiment UTR-2.
Because
The f i r s t a t tempt t o begin run UTR-2 w a s h a l t e d by t h e f a i l u r e of bis-
muth t o t r a n s f e r from t h e bismuth feed t ank . The s i t e of t h e o b s t r u c t i o n
w a s apparent ly t h e open end of t h e feed t ank d i p tube s i n c e t h e l i n e w a s
c l ea red by back-flowing argon through t h e l i n e .
flow t o t h e column had been i n i t i a t e d , t h e bismuth flow r a t e w a s i nc reased
t o about f i v e t imes t h e s a l t flow r a t e i n order t o achieve t h e d e s i r e d run
condi t ions . The flow rates of bo th bismuth and s a l t were s t eady over a
per iod of about 40 min, as shown i n Fig. 21. During t h i s pe r iod , seven
p a i r s of samples were taken of bismuth and sa l t s t reams l e a v i n g t h e column;
t h e bismuth and sa l t flow r a t e s were 247 and 52 ml/min, r e s p e c t i v e l y , cor-
responding t o opera t ion a t about 83% of t h e column f looding rate.
v a r i a t i o n s i n t h e flow r a t e s dur ing t h i s pe r iod a r e i n d i c a t e d by t h e c l o s e
approximation t o s t r a i g h t l i n e s shown by t h e l i q u i d - l e v e l curves i n F ig . 21.
After bismuth and sa l t
The s m a l l
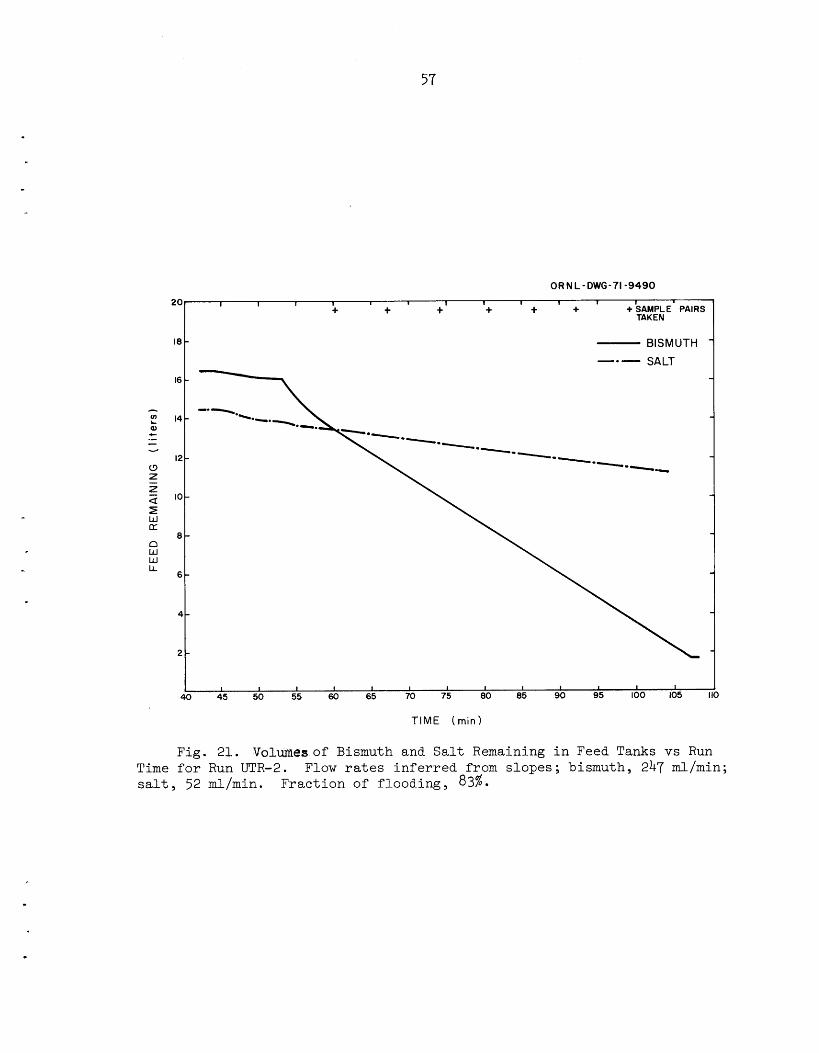
57
+ + + + + + + SAMPLE PAIRS TAKEN
ORNL-DWG-71-9490
18
16
14
12
IO
8
6
4
2
'
8
I I 1 I I I 1 I I t I I I
BlSM UTH SALT -.-
Fig. 21. Uolwnesof Bismuth and Salt Remaining in Feed Tanks vs Run Time f o r Run UTR-2. Flow rates inferred from slopes; bismuth, 247 ml/min; salt, 52 ml/min. Fraction of flooding, 83%.
58
In addition to samples of the salt and bismuth streams leaving the
column, samples were also taken from bismuth and salt feed and receiver
tanks.
uranium extracted, based on the data from the salt samples, was 95%. The scatter in the uranium analyses of" the salt and bismuth streams
leaving the column was larger than expected.
based on the average uranium concentration in salt leaving the column
would require an average uranium concentration of about 230 ppm (as com-
pared with the observed value of 174 ppm) in bismuth leaving the column. Zirconium concentrations in the bismuth samples were within about 25% of the expected values.
and lithim concentrations in the bismuth stream leaving the column and
in the bismuth receiver vessel.
fed to the column is believed to have been 659 ppm, as indicated by the amount of dissolved metals in the bismuth after the experiment.
quantity of reductant present in the bismuth during the experiment
(thorium and lithium) amounted to a stoichiometric excess of about 200%
over that required to reduce the uranium and zirconium in the feed salt.
The resulting data are tabulated in Table 8. The fraction of
A uranium material balance
Excellent agreement was observed between thorium
The thorium concentration in the bismuth
The
This experiment is important because it represents the first known
demonstration of the continuous extraction of uranium from molten salt
into bismuth containing reductant.
removal efficiencies can be obtained in a packed column having a reasonable
length,
more exactly the mass transfer performance of packed column extractors
over a range of operating conditions.
The results indicate that high uranium
Additional experiments will be carried out in order to determine
7 . MEASUREMENT OF AXIAL DISPERSION COEFFICIENTS IN PACICED COLUMNS
J. S. Watson L. E. McNeese
Axial dispersion in the continuous (salt) phase can reduce the per-
formance of packed column contactors that are proposed for the MSBR fuel
processing system. Effects of axial dispersion will be most severe where
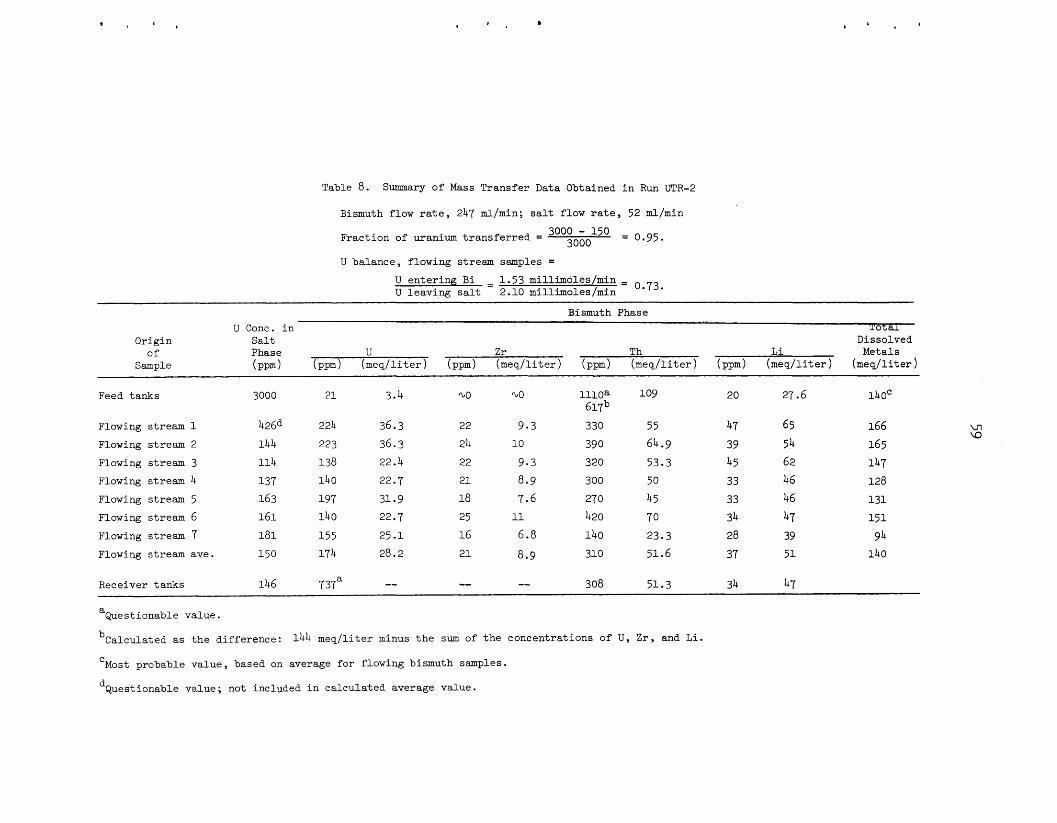
' t t
Table 8. Summary of Mass Transfer Data Obtained i n R u n UTR-2
Bismuth flow r a t e , 247 ml/min; salt flow r a t e , 52 ml/min
Fract ion of uranium t r ans fe r r ed =
U balance, flowing stream samples =
= 0.95. 3000 - 150 3000
U en ter ing B i u leaving sal t
= 1.53 mil l imoles/min= 2.10 millimoles /min
~~
Bismuth Phase -
U Conc. i n 'I'otai Origin Sa l t Dissolved
of Phase U Z r Th L i Metals Sample (ppm) (ppm) (meq/ l i te r ) (ppm) (meq/ l i te r ) (ppm) (meq/ l i te r ) (ppm) (meq/ l i te r ) (meq/ l i te r )
3.4 109 140' 3000 21 Q O QO l l l o a 61-7~ 330 39 0
320 300 27 0
420
140
310
20 27.6 Feed tanks
4 26d 1 4 4 1 1 4 137 163 161 181 150
36.3 36.3
22.7
22.7
28.2
22.4
31.9
25.1
47 39 45 33 33 34 28 37
65 54 62 46 46 47 39 51
Flowing stream 1
Flowing stream 2
Flowing stream 3 Flowing stream 4 Flowing stream 5 Flowing stream 6 Flowing stream 7 Flowing stream ave.
224
223 138 140 197 140
155 174
22
24 22
21 18
16 21
25
9.3 10
9.3 8.9 7.6
6.8
8.9
11
55 64.9 53.3 50
45 70
23.3 51.6
737a 146 308 34 47 Receiver tanks 51.3 ~~
"Questionable value.
bCalculated as t h e difference:
'Most probable value, based on average for flowing bismuth samples.
dQuestionable value; not included i n calculated average value.
1 4 4 meq/ l i ter minus t h e sum of the concentrations of U , Z r , and L i .
60
high flow rate ratios are required. An experimental program is in progress
in which axial dispersion coefficients in packed columns are measured under
conditions similar to those in the proposed reductive extraction processes;
in this program, mercury and water are used to simulate bismuth and molten
salt. The measured axial dispersion coefficients will be used to estimate
column performance in the proposed system.
persion in packed columns are also under development.
Devices for reducing axial dis-
The equipment and experimental technique used for these studies have
been described previ0us1y.l~ The technique consists of injecting a tracer
solution at a constant rate near the top of a packed column in which water
and mercury are in countercurrent flow.
stream in the continuous (water) phase as a result of axial dispersion
caused by the downflowing mercury droplets.
reach steady state, and then the concentration profile of the tracer in the
continuous phase is determined. As indicated previously, a semilogarithmic
plot of relative tracer concentration vs distance down the column produces
a straight line having a slope that is inversely proportional to the axial
dispersion coefficient.
carried out in a 2-in.-ID column having a length of approximately 4 ft. The column was packed with l/k-in.-diam solid cylinders or Raschig rings
or 1/2-in.-diam Raschig rings.
ethylene or Teflon, is not wet by either mercury or water.
The tracer tends to diffuse up-
The system is allowed to
During this reporting period, measurements were
The packing, which was made of either poly-
7.1 Experimental Results
The results of six runs made with 1/4-in. Raschig rings are shown in
Figs. 22 through 27. Data for five runs with 1/4-in. solid cylindrical
packing are shown in Figs. 28 through 32, and data obtained during 13 runs
with 1/2-in.-diam Raschig rings are shown in Figs. 33 through 45. The data
from all these runs are summarized in Tables 9-11, and are shown along with
previous data from seven runs with 3/8-in.-diam Raschig ring packing in
Fig. 46. the dispersed-phase (mercury) flow rate.
and 1/2-in. packing were also independent of the continuous-phase (water)
flow rate; their values were 3.5 and 4.8 cm3/sec, respectively. Data for
In each case, the axial dispersion coefficient was independent of
Dispersion coefficients for 3/8-
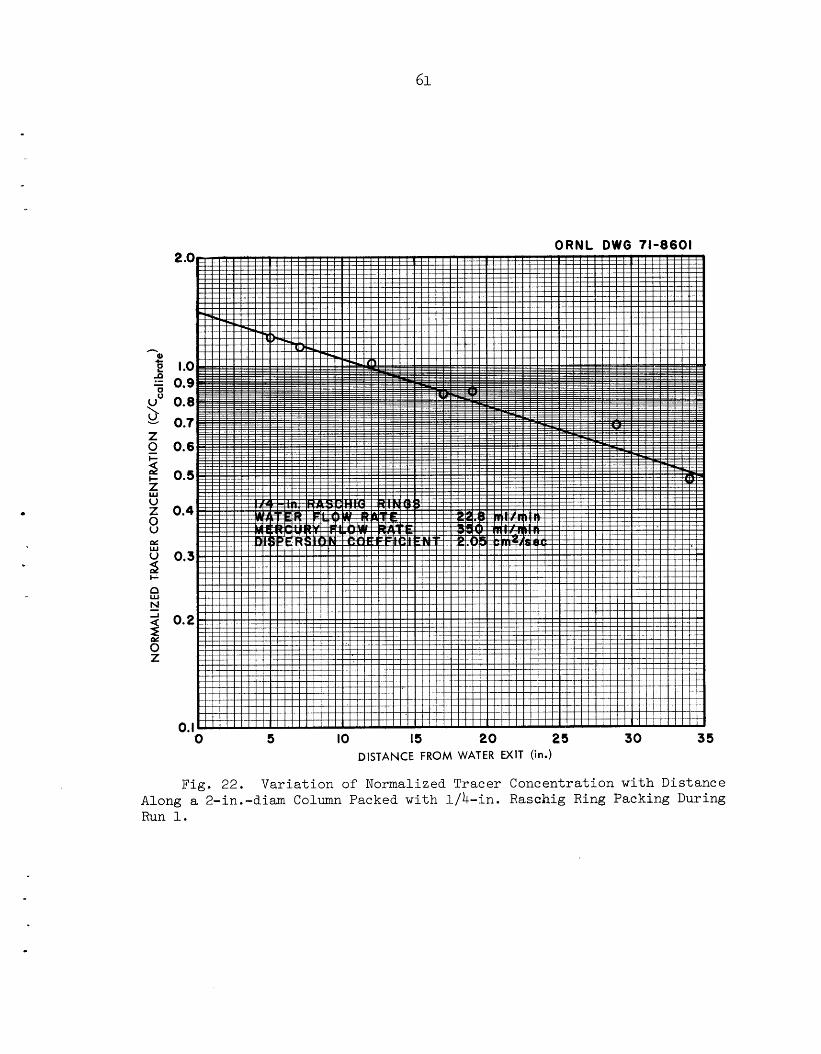
61
ORNL DWG 71-8601
20 25 30 35 0 5 IO 15 DISTANCE FROM WATER EXIT (in.)
Fig. 22. Variation of Normalized Tracer Concentration with Distance Along a 2-in.-diam Column Packed with 1/4-in. Raschig Ring Packing During Run 1.
.
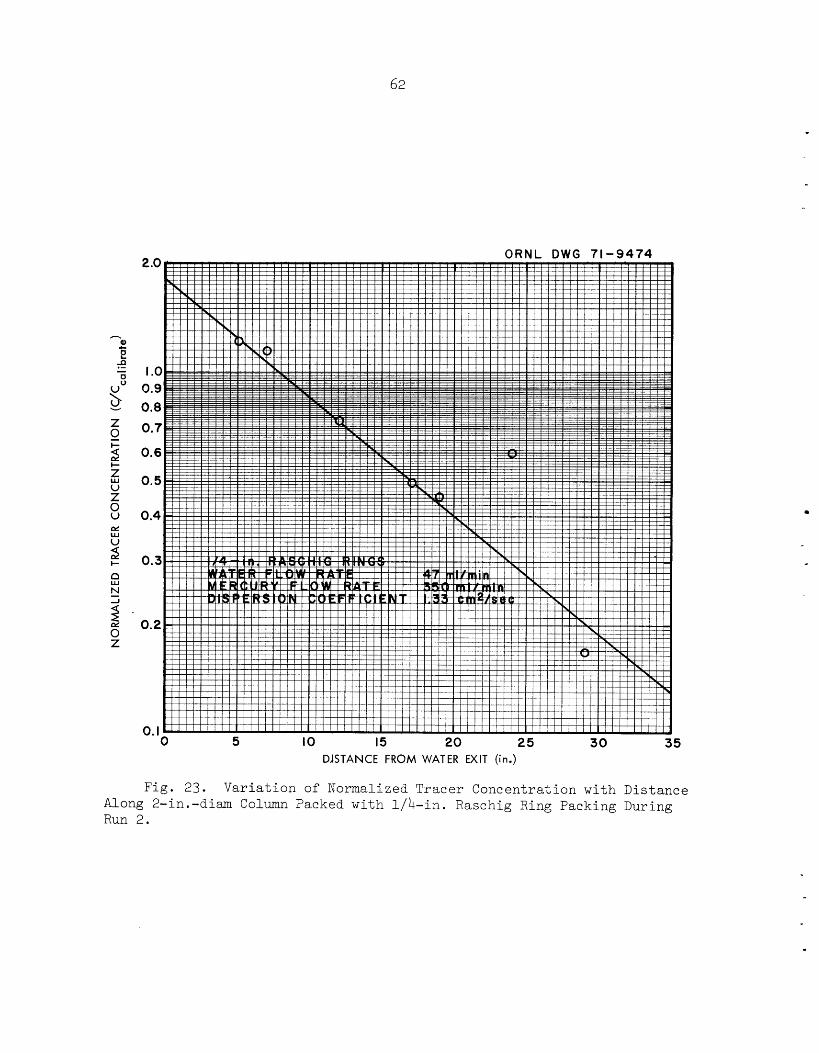
62
0 5 I O 15 20 25 3 0 35 DJSTANCE FROM WATER EXIT (in.)
Fig. 23. Variation of Normalized Tracer Concentration with Distance Along 2-in.-dim Column Packed with l/b-in. Raschig Ring Packing During Run 2.
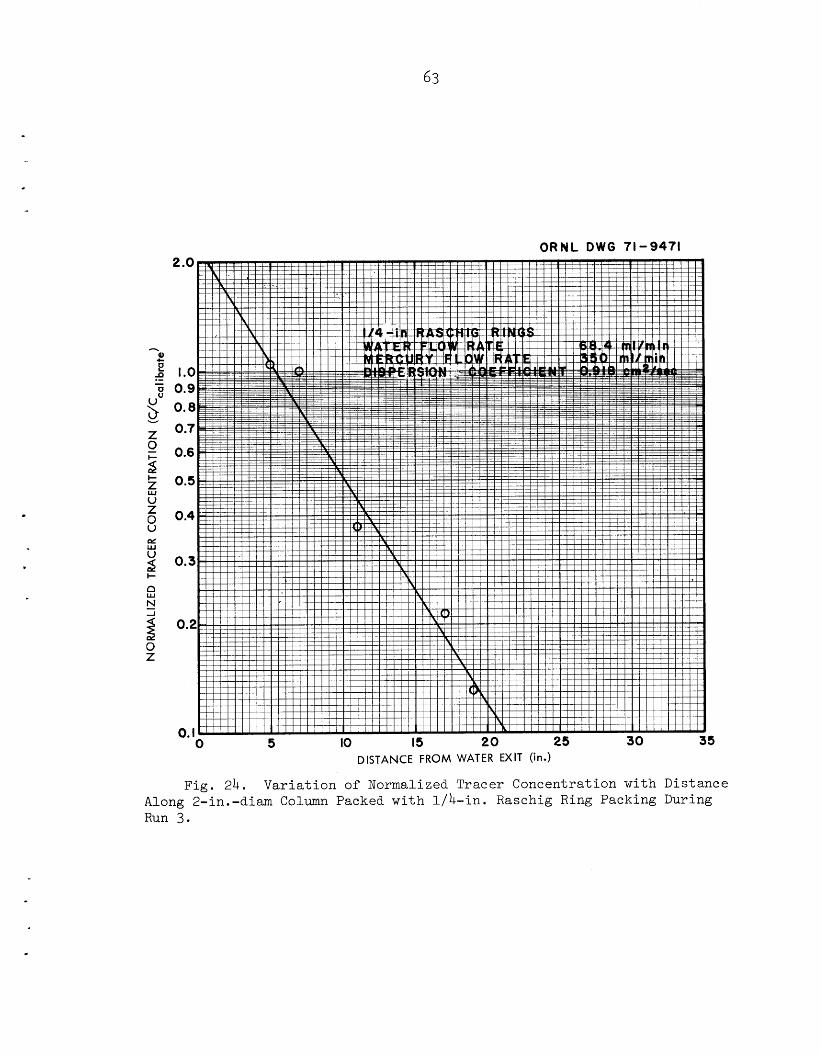
63
ORNL D W G 71-9471
.
.
2 .o
I .o 0.9 0.8 0.7
0.6
0.5
0.4
0.3
I I I f V I
I I I I
0.2 I /
0 5 IO 15 20 25 30 3 0. I
DISTANCE FROM WATER EXIT (in.)
Fig. 24. Var i a t ion of Normalized Tracer Concentration with Distal
5
nc e Along 2-in.-diam Column Packed wi th 1/4-in. Raschig Ring Packing During Run 3.
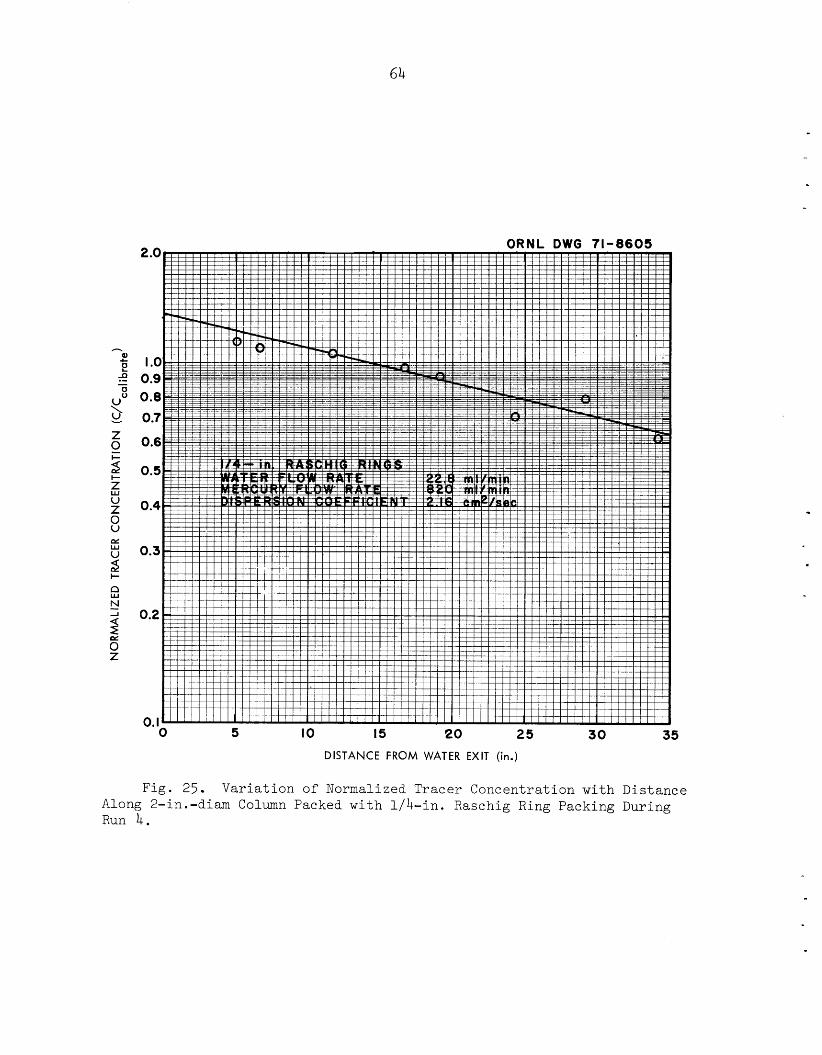
64
2 .o
I .o 0.9 0.8 0.7
0.6
0.5
0.4
0.3
0.2
0. I 0
Fig. 25
5 IO
Variation of
15 20 DISTANCE FROM WATER
Normalized Tracer
ORNL DWG 71-8605
25 EXIT (in.)
Concentration
30
with
35
Di st anc e Along 2-in.-diam Column Packed with l/h-in. Raschig Ring Packing During Run 4.
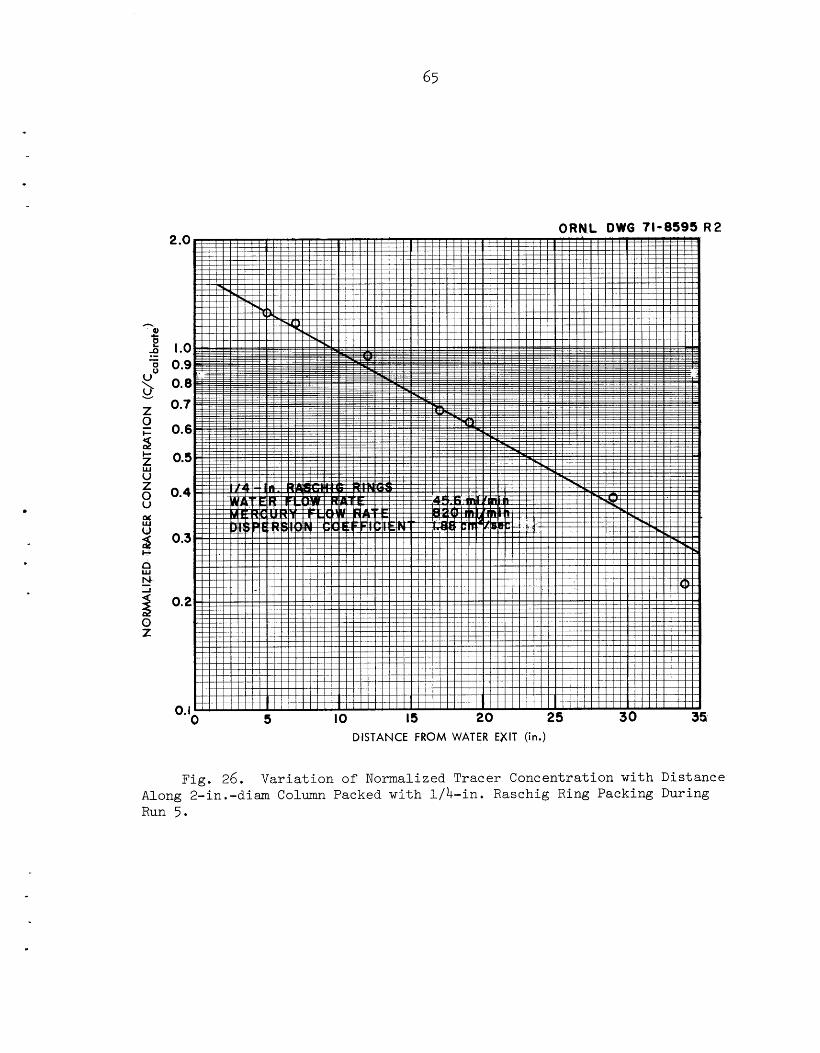
65
.
DISTANCE FROM WATER EXIT (in.)
Fig. 26. Var i a t ion of Normalized Tracer Concentration wi th Distance Along 2-in.-diam Column Packed wi th 1/4-in. Raschig Ring Packing During Run 5.
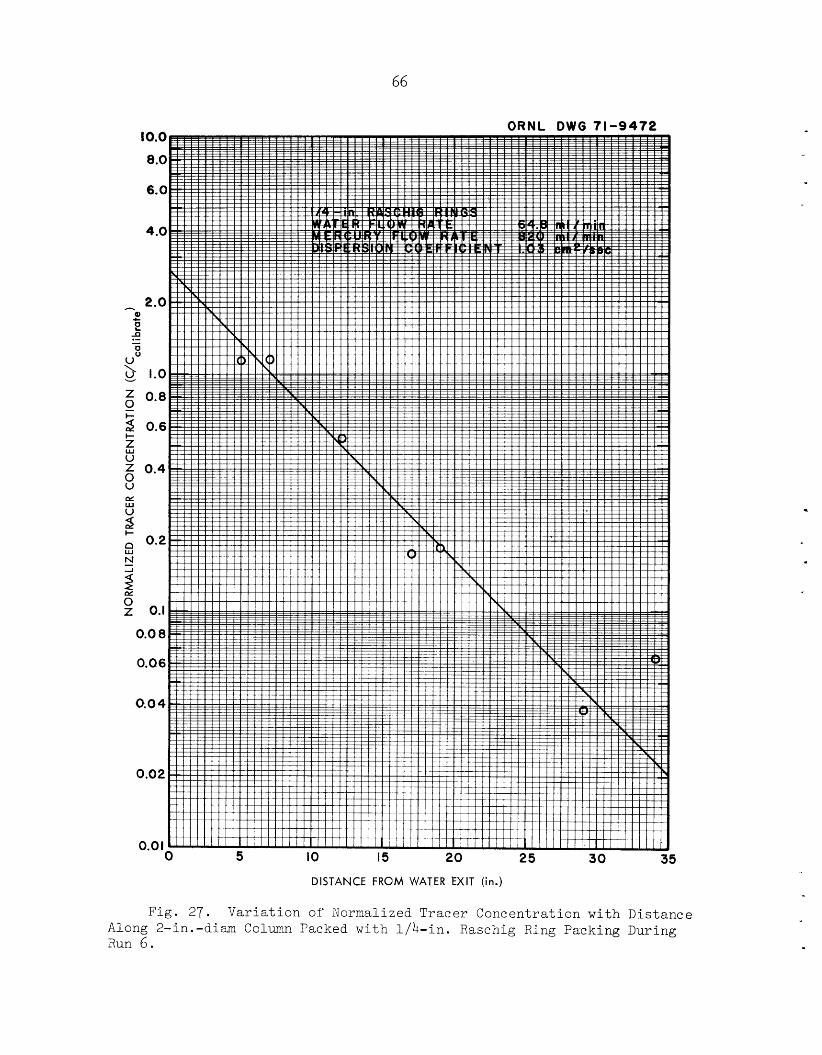
66
Fig. 27. Var ia t ion of Normalized Tracer Concentrat ion wi th Distance Along 2-in.-diam Column Packed wi th 1/4- in . Raschig Ring Packing During Run 6 .
.
.
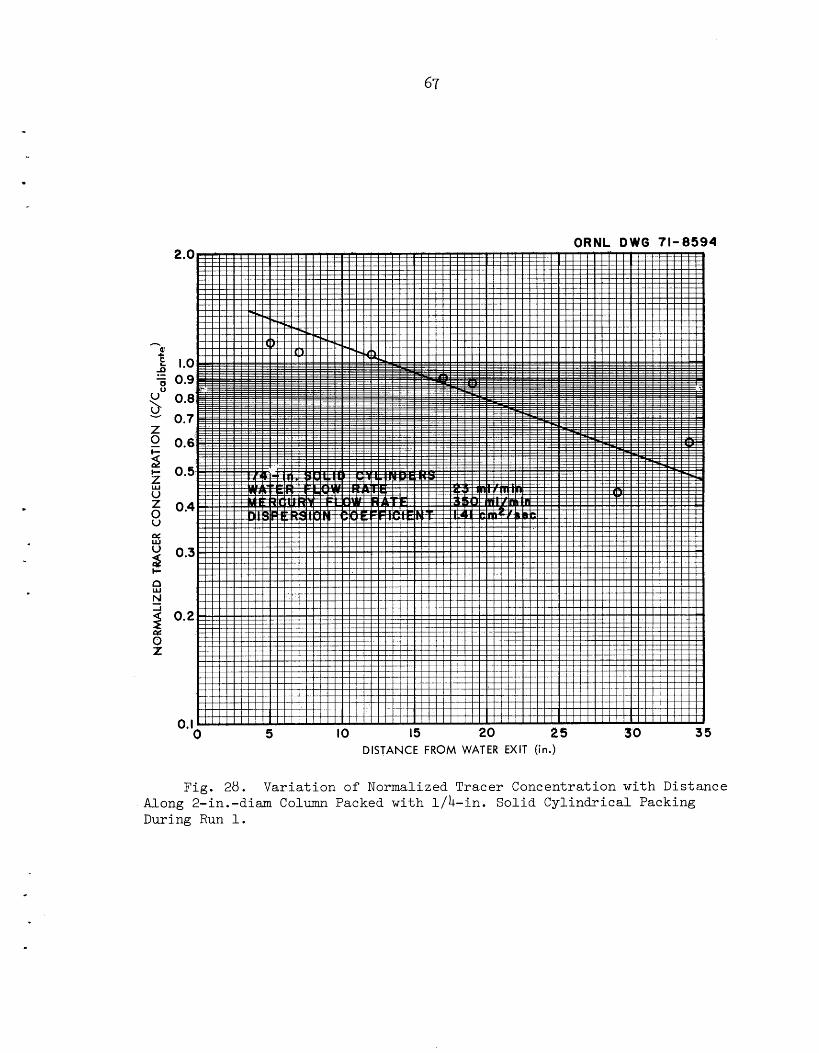
67
3 Y I-
ORNL D W G 71-8594
""0 5 IO 15 20 25 30 35 DISTANCE FROM WATER EXIT (in.)
Fig. 28. Variation of Normalized Tracer Concentration with Distance Along 2-in.-diam Column Packed with 1/4-in. Solid Cylindrical Packing During Run 1.
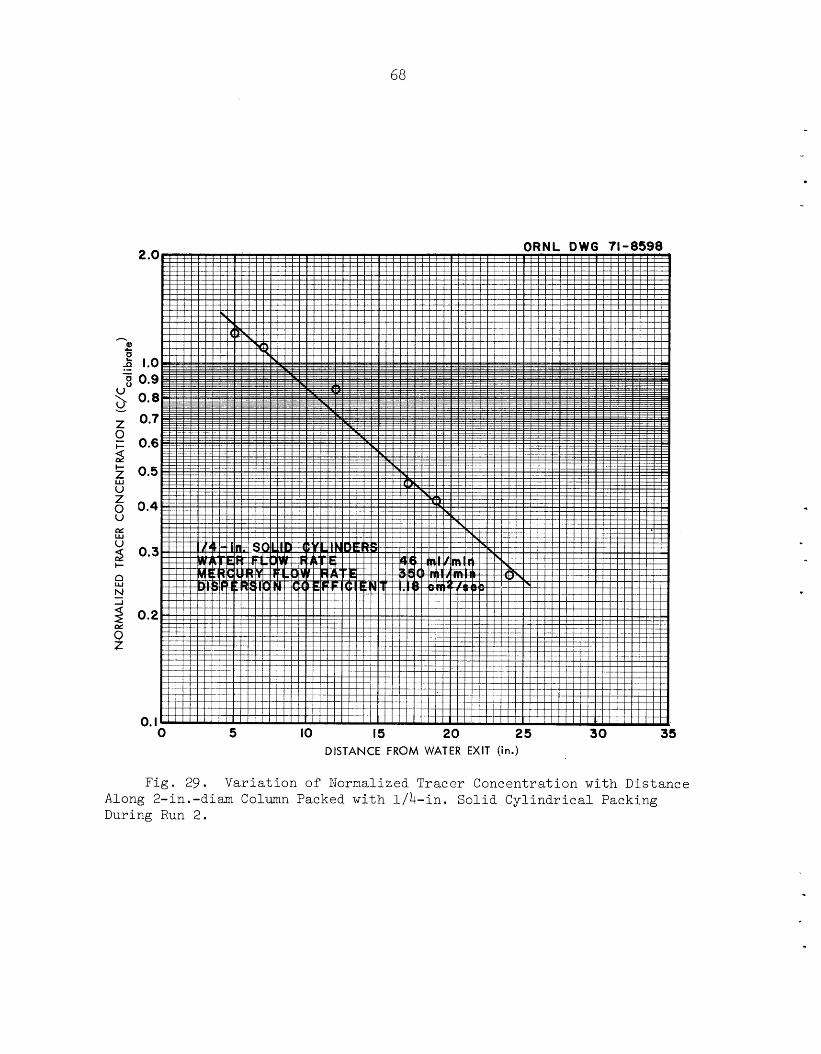
68
0 5 IO IS 20 25 DISTANCE FROM WATER EXIT (in.)
30 ~
35
Fig. 29. Variation of Normalized Tracer Concentration with Distance Along 2-in.-diam Column Packed with 1/4-in. Solid Cylindrical Packing During Run 2.
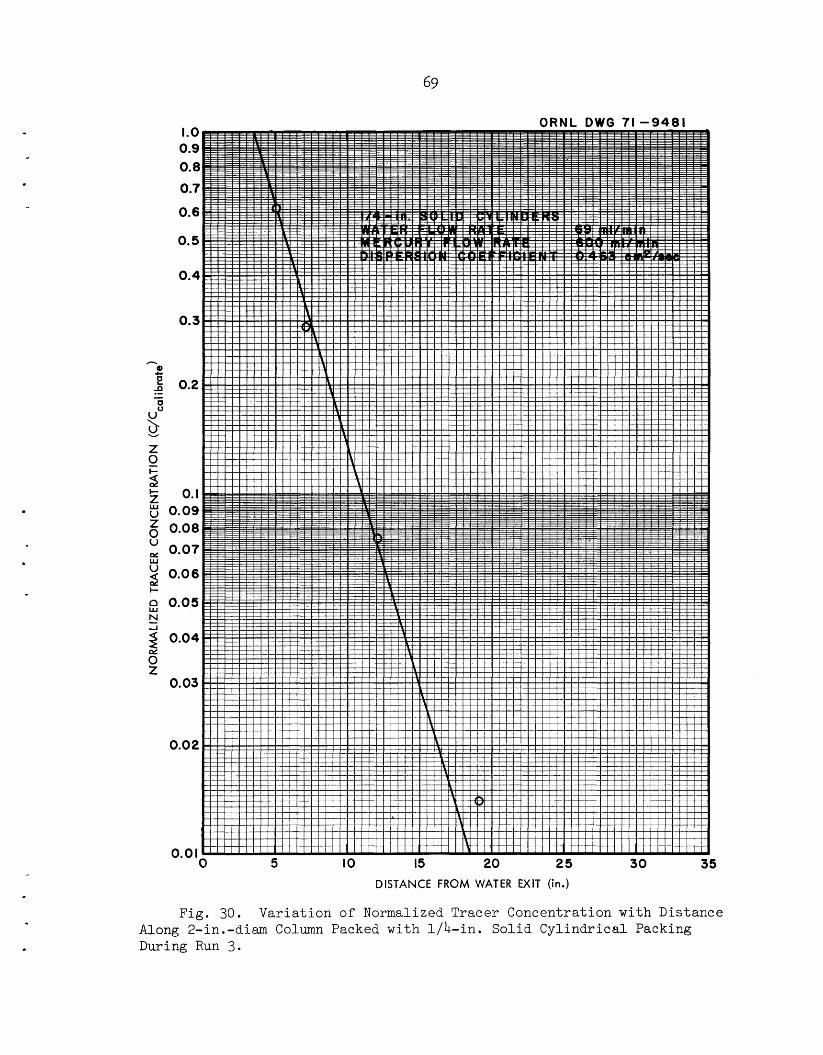
.
.
.
Z 0 5 t ou I-
V Z
. Ale D W
ORNL D W G 71-9481 1.0 0.9 0.8 0.7
0.6
0.5
0.4
0.3
0.2 ,
I I I I
~ 4 - ~ ~
L 1 .--- I 1 I '
I ~ - 1
I 1
I u I I 1
0.0 2 I I I I
11 i i i i i i i i i i i i i 1 i / / i i i I i i i i i i i i i i 18 i ikii i i I 1 1 1 i i I i i I j 1 1 1 1 i l i i I / 1 i i i i l l
0 5 IO 15 20 25 30 35 DISTANCE FROM WATER EXIT (in.)
Fig. 30. Variation of Normalized Tracer Concentration with Distance ng 2-in.-diam Column Packed with 1/4-in. Solid Cylindrical Packing ing Run 3.
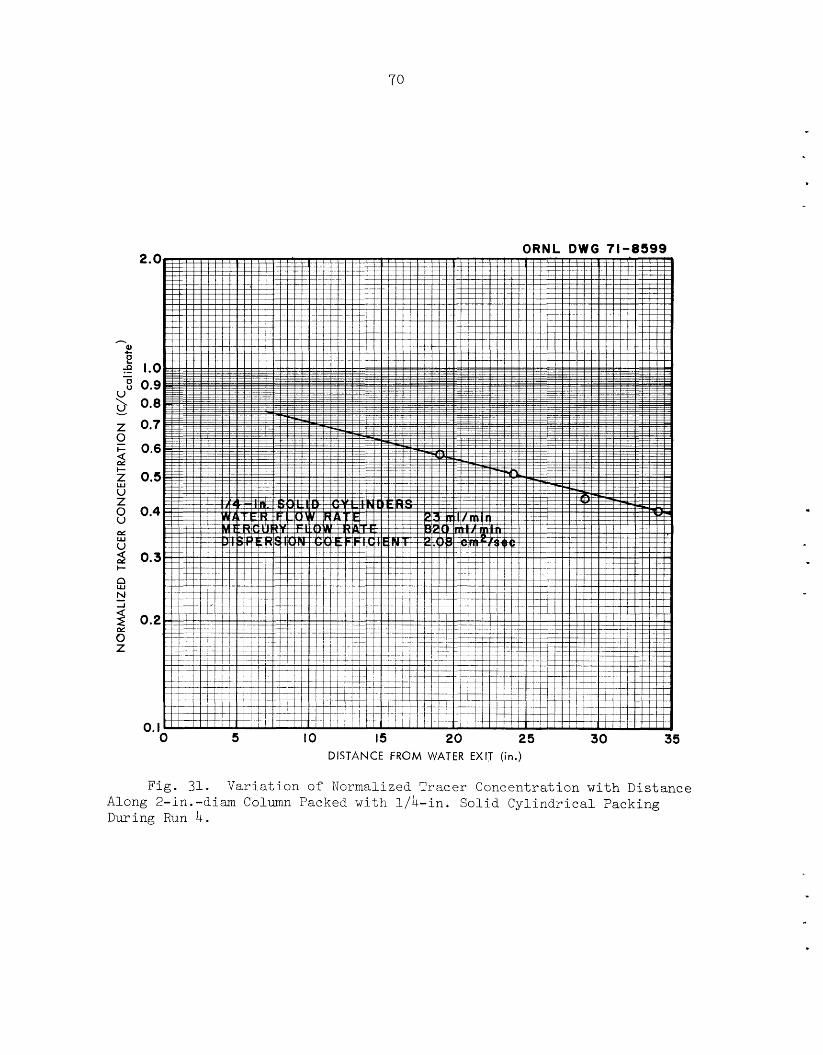
8
ORNL D W G 71-8599 2.0
t i l i i l i i 1 i i i i M - l - L l i i i i i I1 I i i i i i t i i i 1 i I i i I I i i i i i i I I I lii i i i i i i i i i M I
1.0 0.9 0.8 0.7
0.6
0.5
0.4
0.3 I I I I 1 1 1 I . . - T I 1 T -
1 1 I j 1 j ! 11 1 j j [ I [ I ! I I 1 I I 1 I 1 I ! I r > ; ! , ~ , , , , ! , , , . , , , , , ! , , ! ! , . , , . , ! , . . . . l ! l ! . l l
/ I l l I I .
0.2
0. I 0 5 I O 15 20 25 30 35
DISTANCE FROM WATER EXIT (in.)
Fig . 31. Var i a t ion of Normalized Tracer Concentration wi th Distance Along 2-in.-diam Column Packed with 1/4- in . So l id Cy l ind r i ca l Packing During Run 4 .
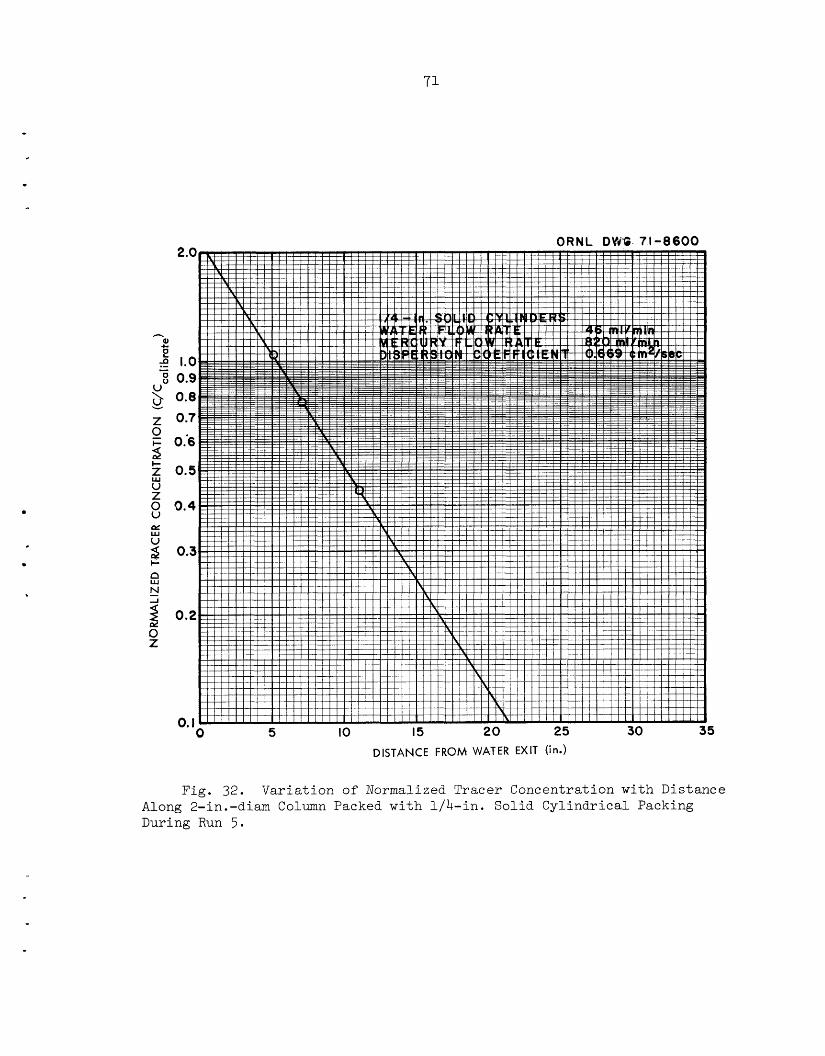
ORNL DWG. 71-8600
0 5 IO 25 30 35 20 15 -. .
DISTANCE FROM WATER EXIT (in.)
Fig. 32. Variation of Normalized Tracer Concentration with Distance Along 2-in.-diam Column Packed with 1/4-in. Solid Cylindrical Packing During Run 5.
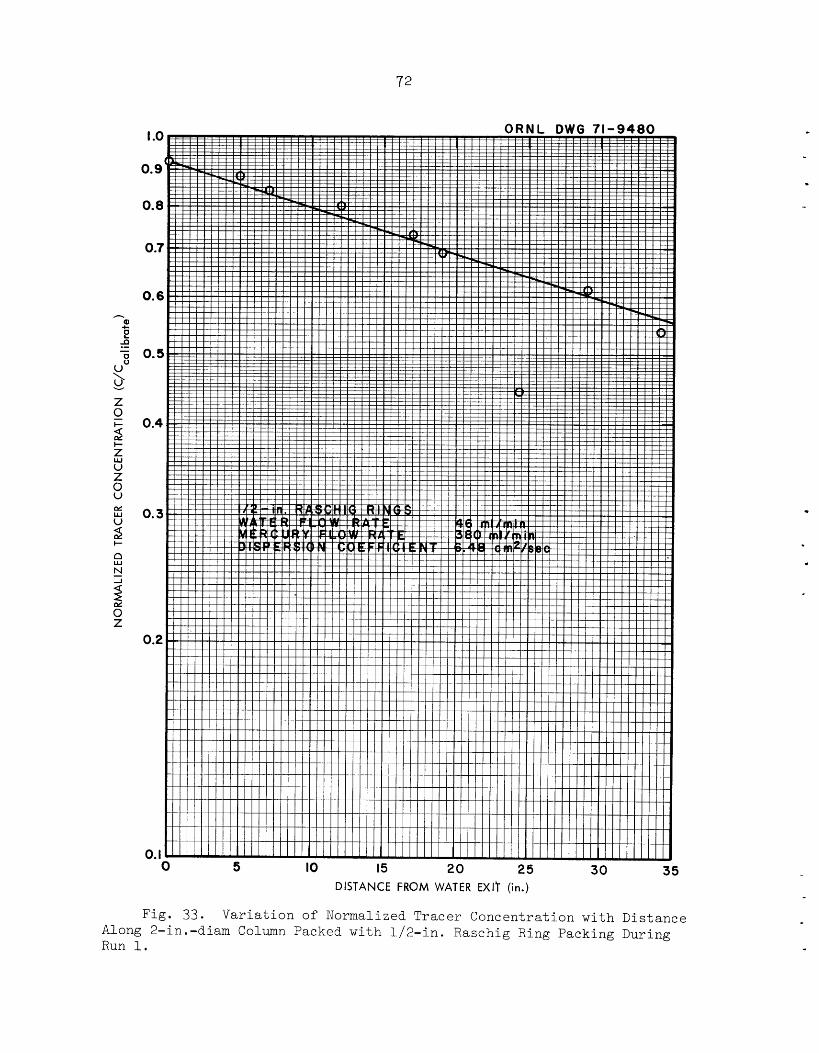
7 2
I I 1 1 ___-___ ___ ____
I l l I I I
0.1
a
I
___________________________________ ~- ~ ~ _~ ~
____________-__ ___ _______________ ~ ~ ~ ___
__________________ ___________ _~
J
Along 2-in.-diam Column Packed with 1/2-in. Raschig Ring Packing During Run 1.
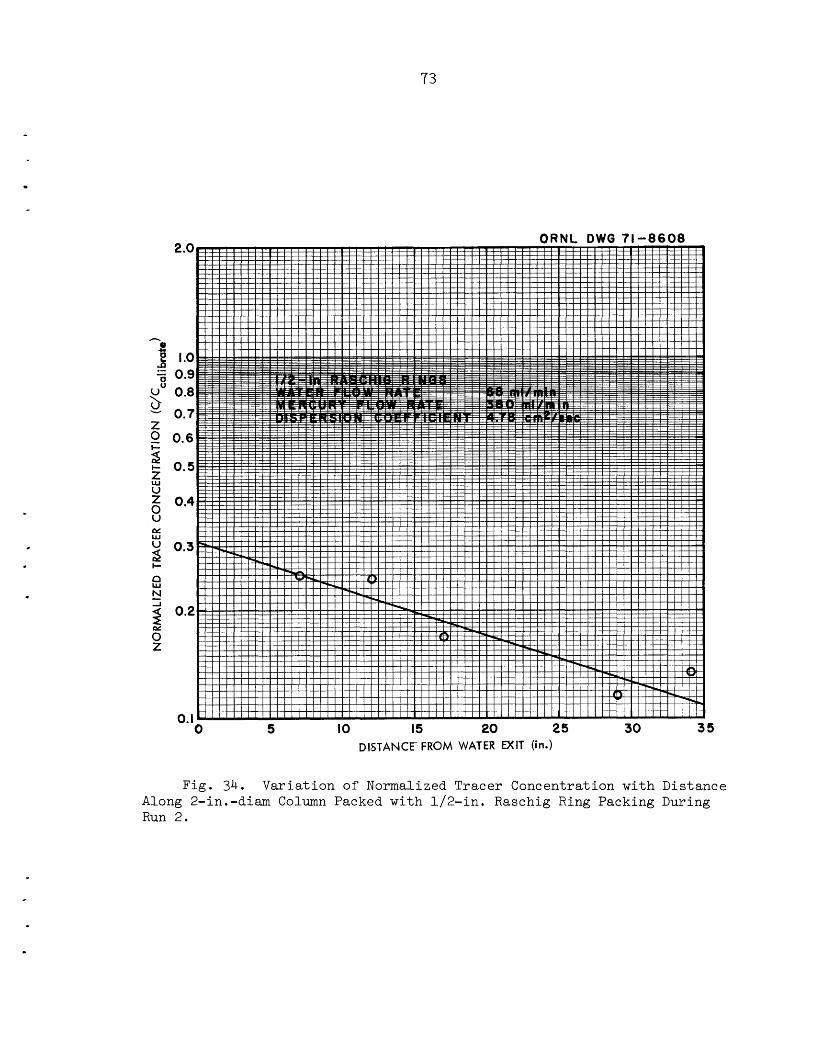
73
n 0 B - e
v" 0
2.0 ORNL DWG 71-8608
I I J I I I I I I I l l I I I I l l I I l l
I I I . I S * ! I
1 1 I I I
I
5 IO 15 25 30 35 DISTANCE- FROM WATER =IT (in.)
Fig. 34. Var i a t ion of Normalized Tracer Concentration wi th Distance Along 2-in.-diam Column Packed wi th 1/2- in . Raschig Ring Packing During Run 2.
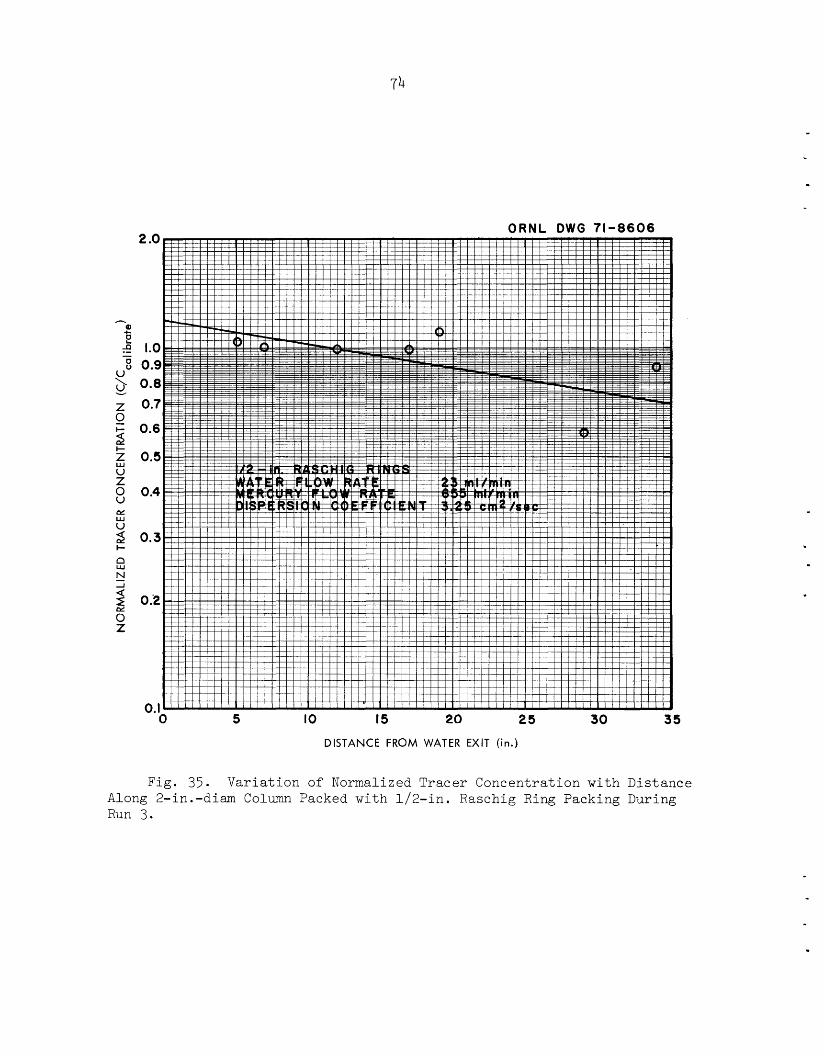
74
0.3.
ORNL D W G 71-8606
I I I 1 I 1 I I I I I I I I I I I I l l / I
1 I 1 I I I I I ~
I 1 / I I I I I I I I 1 I TT-- / I /
, , I I / I I I , / I I I I.1 ! , I . ! ! , / . , , , , , ! ! , , I , ! ! ! , , I I , ! , , , ! , ! , . , , , ! ! ! , , , _ , , , , . , l l . _ . l ~ I _ I !
n al c e 2? - 0
- .
0 5 IO 15 20 25 30
DISTANCE FROM WATER EXIT (in.)
Fig. 35. Variation of Normalized Tracer Concentration with Along 2-in.-diam Column Packed with 1/2-in. Raschig Ring Packing Run 3.
35
Di st anc e During
.
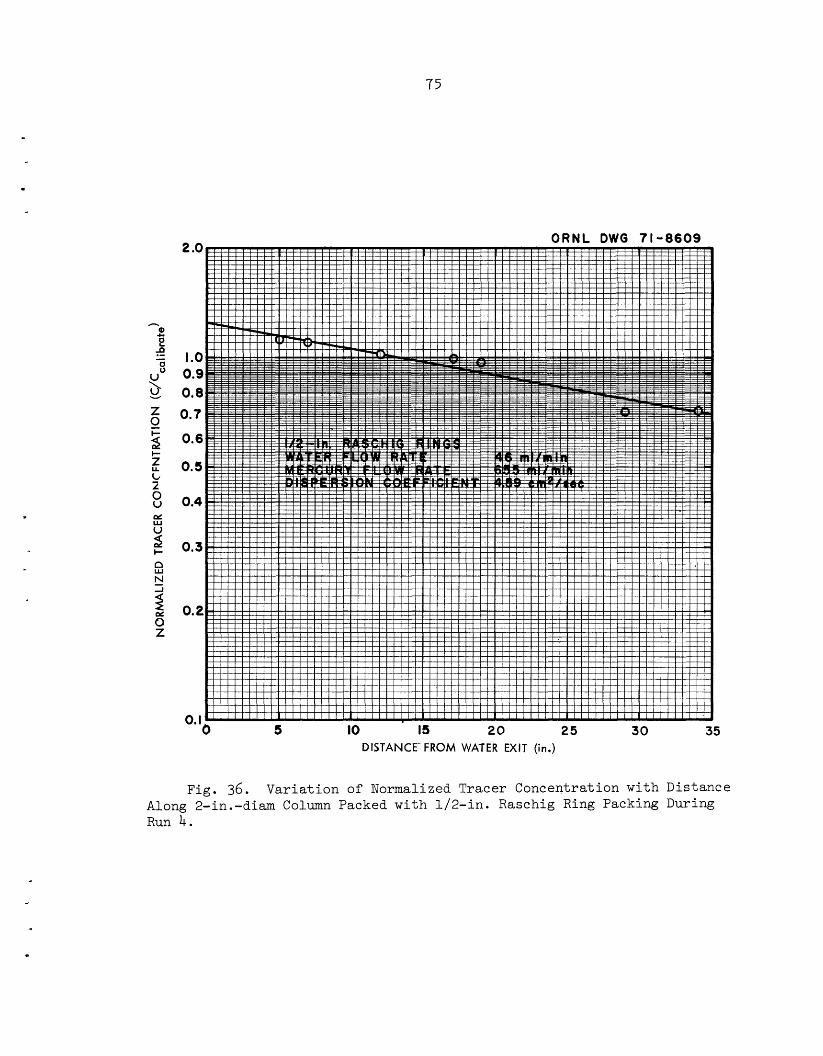
75
0.3
n al c e
I I I I I I I I I I I I I / I I I I l l 1 I
I l l I I I I I I V I 1 1 1 1 I 1 I I I 1 1 1 I 1
Z 9
t-
Fig. 36. Var i a t ion of Normalized Tracer Concentration wi th Distance Along 2-in.-diam Column Packed wi th 1/2-in. Raschig Ring Packing During Run 4.
.
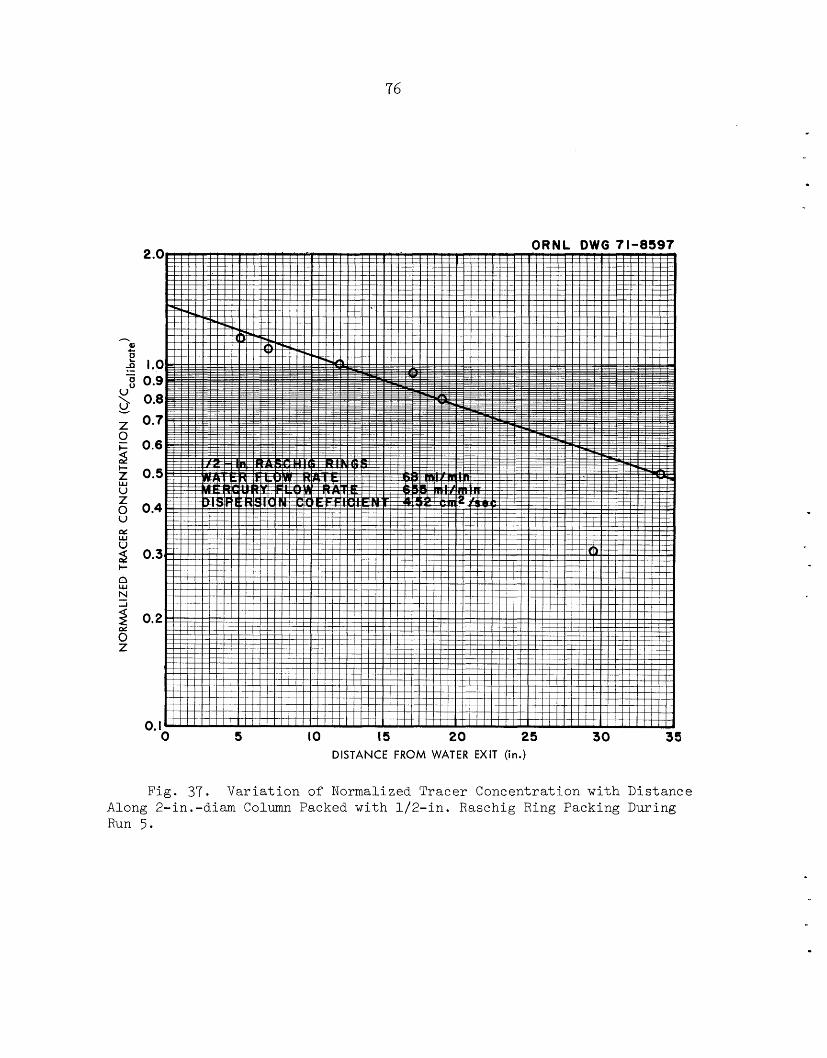
76
-. . 0 5 IO 15 20 25 30 35
DISTANCE FROM WATER EXIT (in.)
Fig . 37, Var ia t ion of Normalized Tracer Concentration wi th Dis tance Along 2-in.-diam Column Packed wi th 1/2- in . Raschig Ring Packing During Run 5.
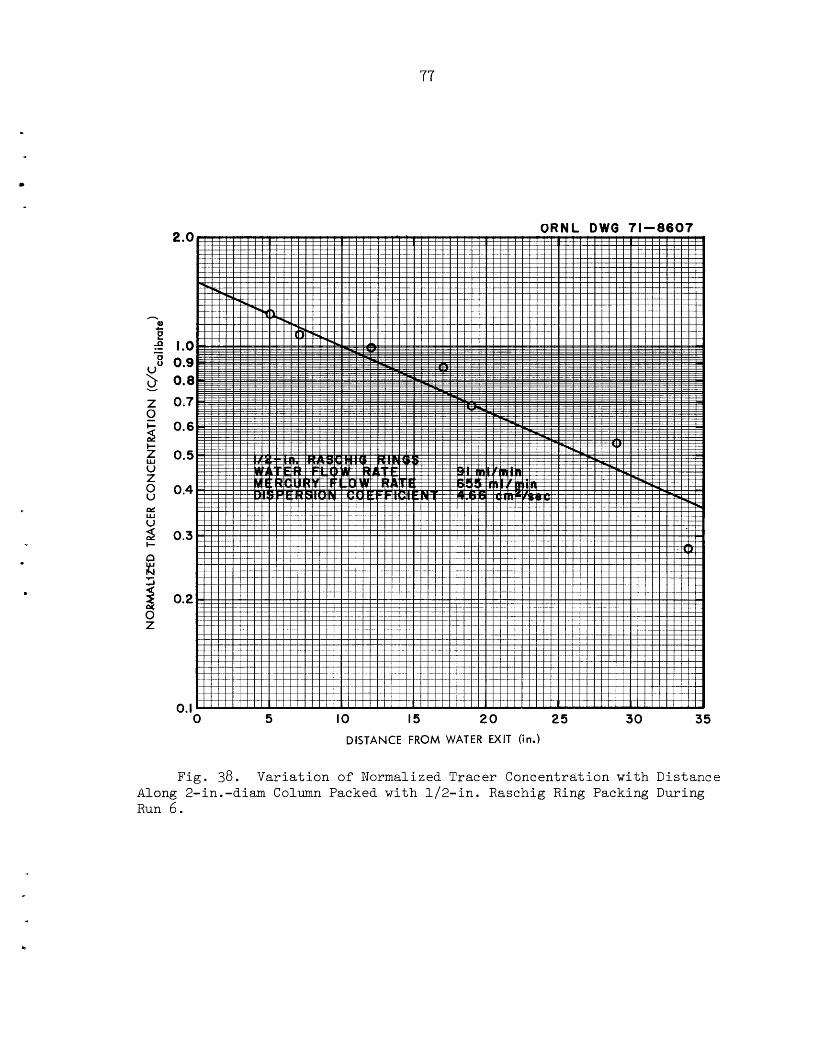
77
I 1 I I I I I I I I I I I I I I I I I
I 1 I I I I I I I l l I I I I I
I I
J
0
ORNL O W 0 71-8607 2.0
I .o 0.9 0.0 0.7
0.6
0.5
0.4
0.3
0.2
0. I 0 5 IO 15 20 25 30 35
DISTANCE FROM WATER EXIT (in.)
Fig. 38. Var i a t ion of Normalized Tracer Concentration wi th Distance Along 2-in.-diam Column Packed wi th 1/2- in . Raschig Ring Packing During Run 6 .
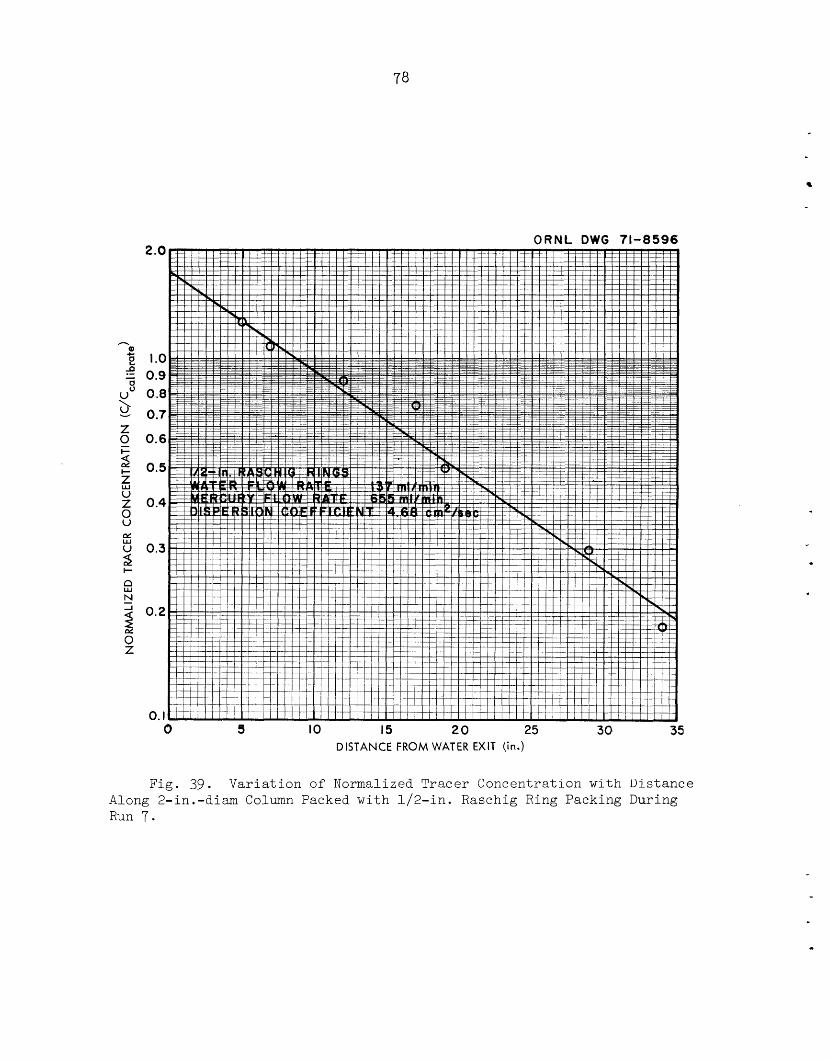
78
ORNL DWG 71-8596
5 I O 15 20 25 30 35 DISTANCE FROM WATER EXIT (in.)
Fig. 39. Variation of Normalized Tracer Concentration with Uistance Along 2-in.-diam Column Packed with 1/2-in. Raschig Ring Packing During Run 7.
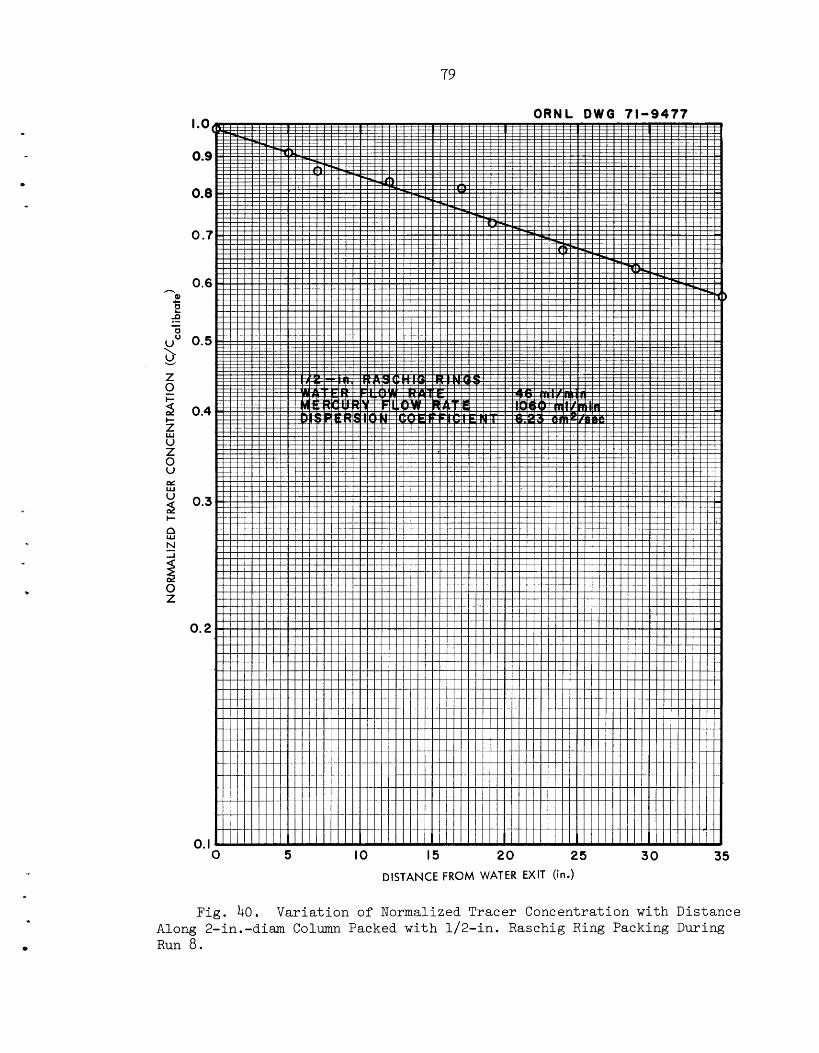
79
*-- I I
Fig. 40. Var ia t ion of Normalized Tracer Concentration with Distance Along 2-in.-diam Column Packed wi th 1/2- in . Raschig Ring Packing During Run 8.
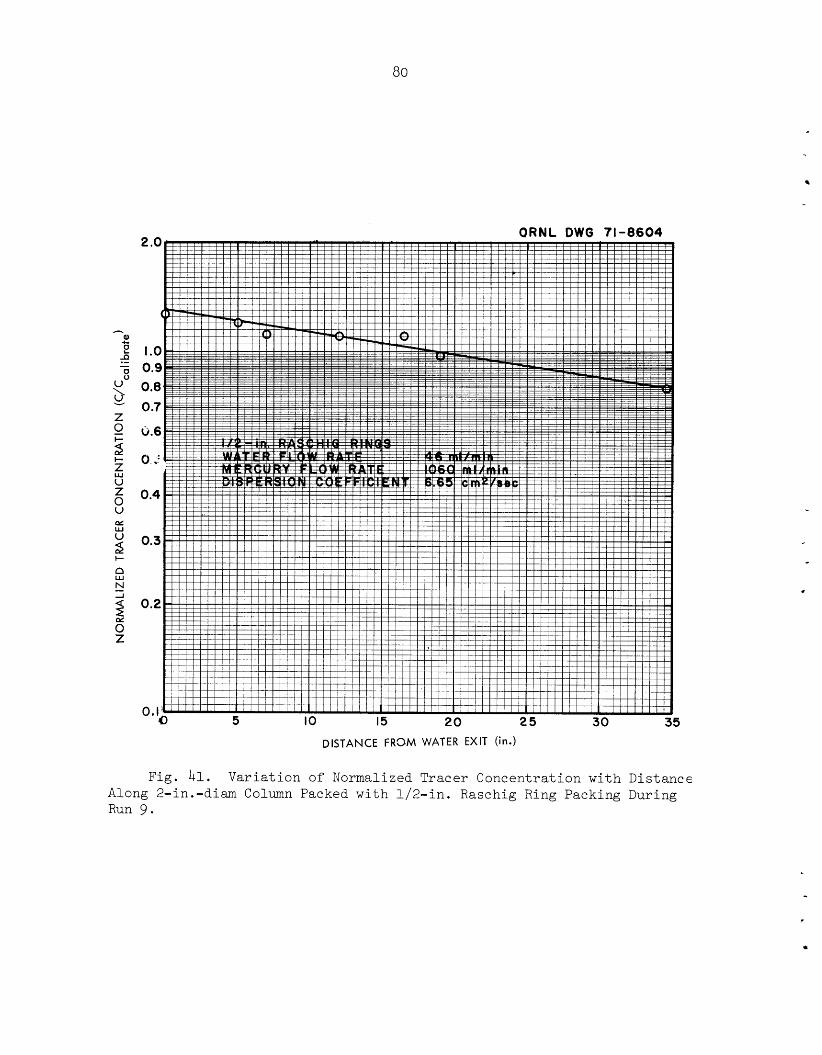
80
I
I 1
I I
I I
*
Along 2-in.-diam Column Packed with 1/2-in. Raschig Ring Packing During Run 9.
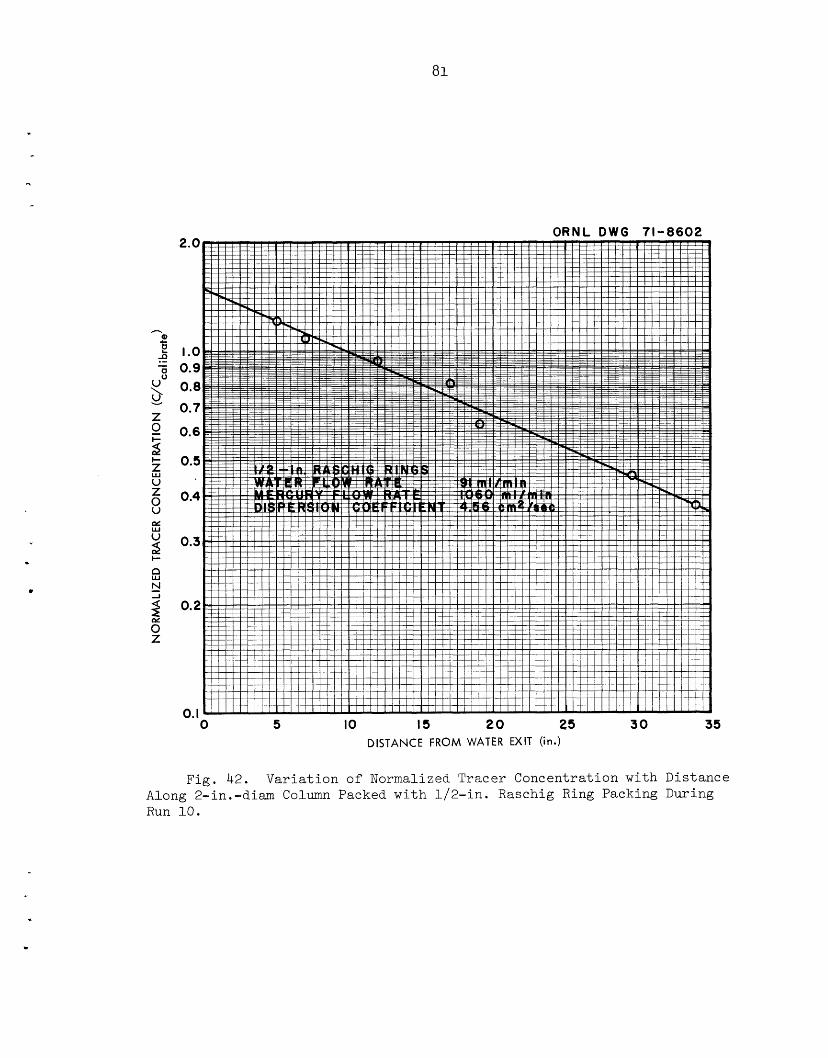
81
. 0
2.0
I .o 0.9 0.8 0.7
0.6
0.5
0.4
0.3
0.2
0. I 0 5 IO IS 2 0 25 3 0 35
DISTANCE FROM WATER EXIT (in.)
Fig. 42. Var i a t ion of Normalized Tracer Concentration with Distance Along 2-in.-diam Column Packed wi th 1/2- in . Raschig Ring Packing During Run 10.
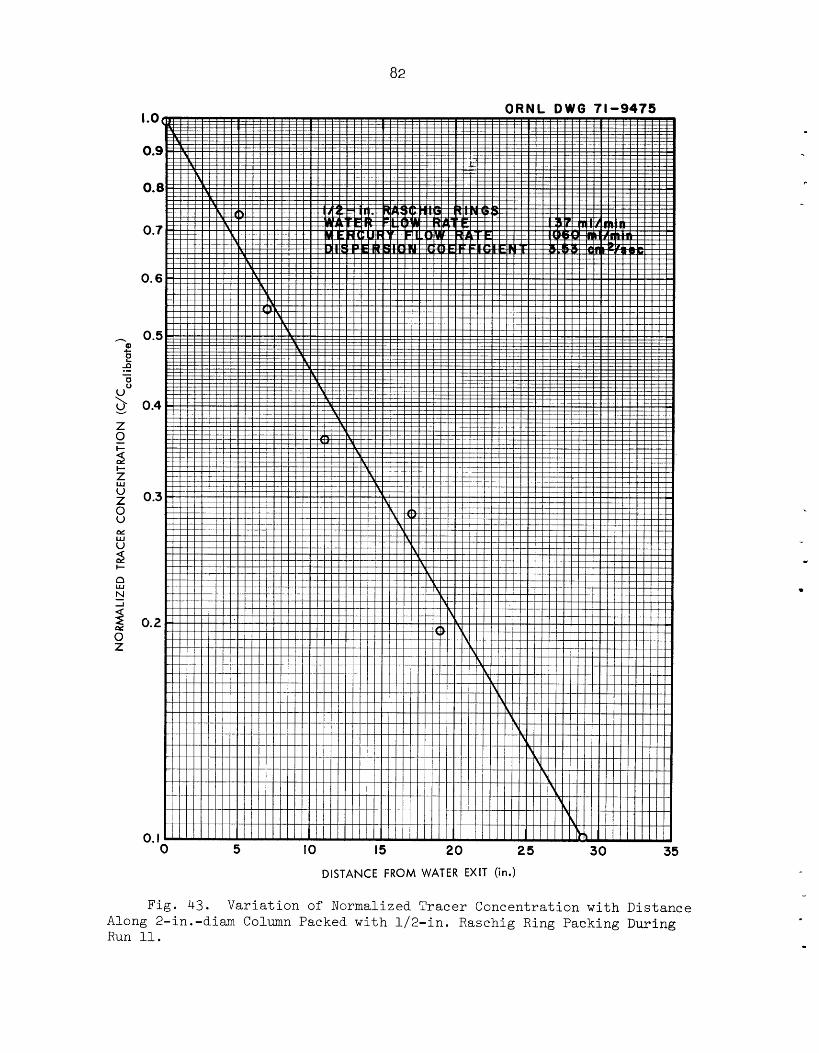
82
. - ORNL D W G 71-9475
0 5 IO I5 20 25 30 35 DISTANCE FROM WATER EXIT (in.)
Fig. 43. Variation of Normalized Tracer Concentration with Distance Along 2-in.-dim Column Packed with 1/2-in. Raschig Ring Packing During Run 11.
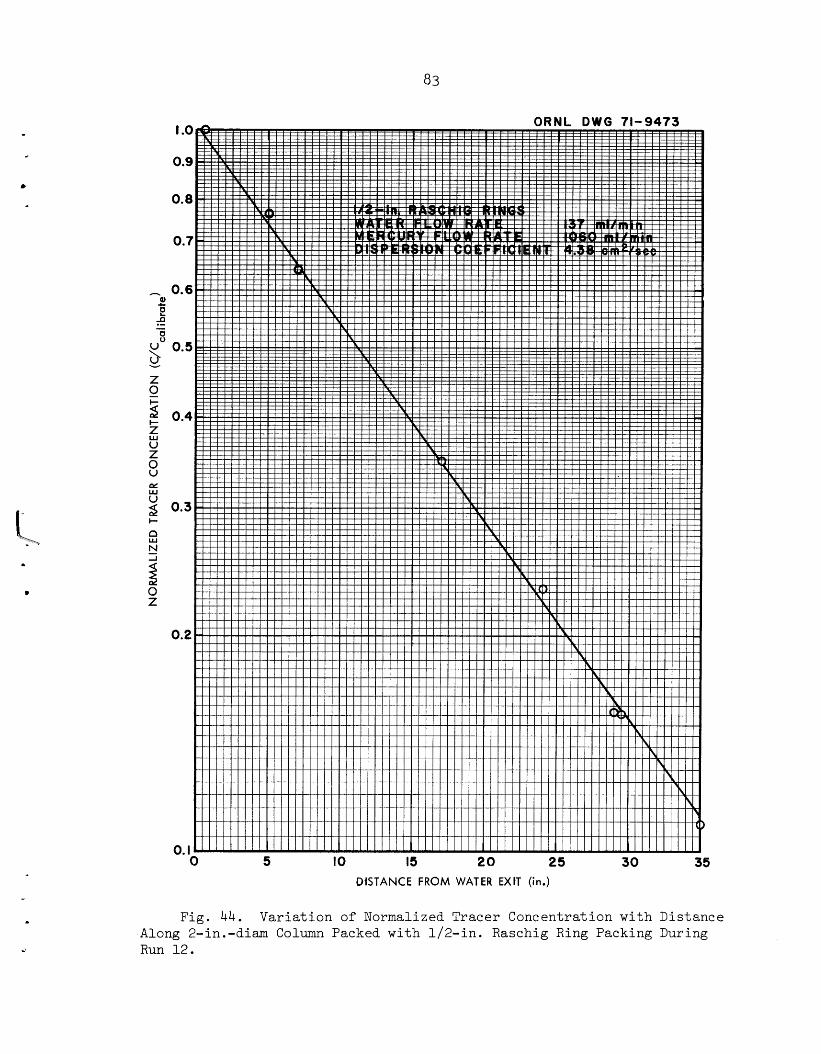
83
L c
0 5 IO IS 20 25 3 0 35 01STANCE FROM WATER EXF (in.)
Fig. 44. Var ia t ion of Normalized Tracer Concentration wi th Distance Along 2-in.-diam Column Packed with 1/2-in. Raschig Ring Packing During Run 12 .
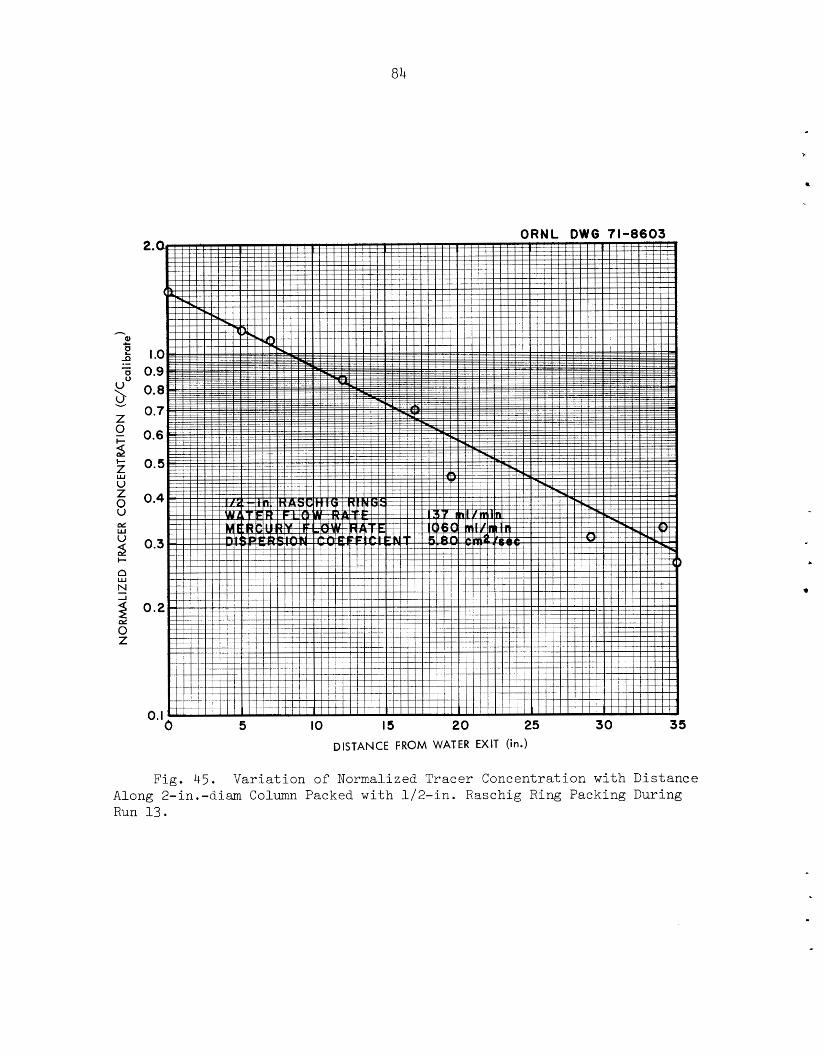
84
Along 2-in.-diam Column Packed with 1/2-in. Raschig Ring Packing During Run 13.
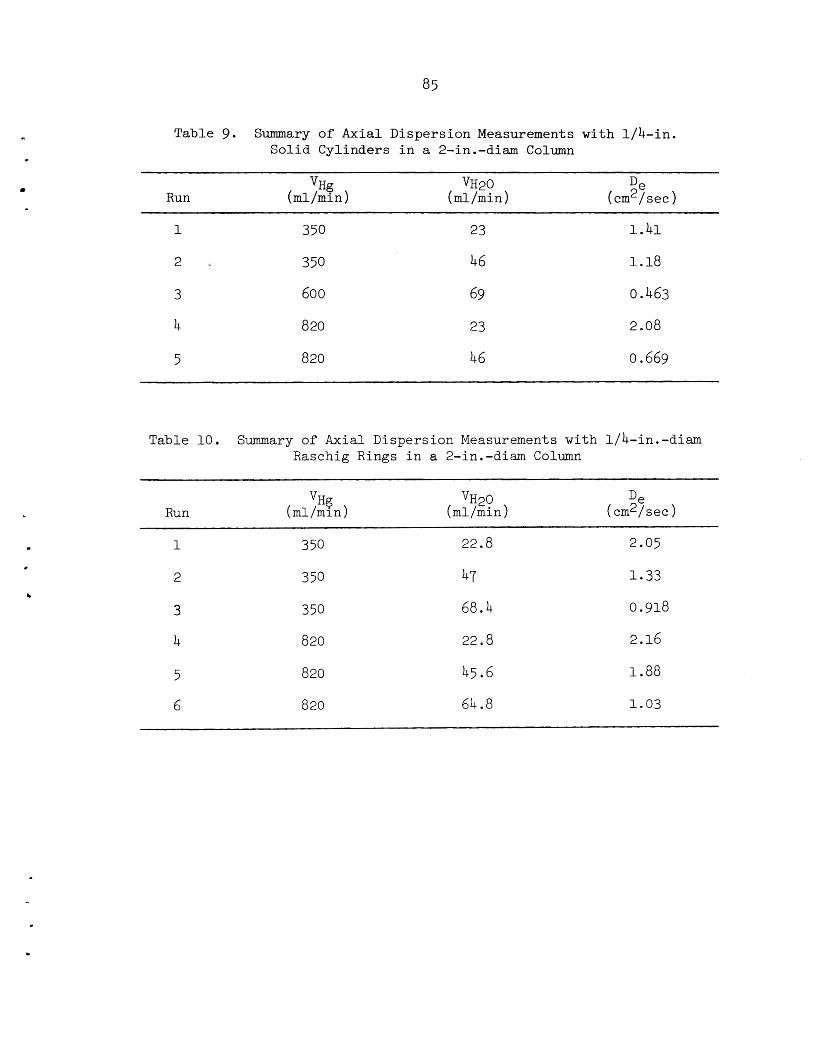
Table 9 . Summary of Axial Dispersion Measurements with 1/4-in. Solid Cylinders in a 2-in.-diam Column
vH20 De Run (ml/min ) (d/min) (cm'/sec
VHg
350
350
600
820
820
23
46
69
23
46
1.41
1.18
0.463
2.08
0.669
Table 10 Summary of Axial Dispersion Measurements with l/h-in.-diam Raschig Rings in a 2-in.-diam Column
Run vH20
(ml/min) De
(cm*/sec)
350
350
350
820
820
820
22.8
47
68.4
22.8
45.6
64.8
2.05
1.33
0.918
2.16
1.88
1.03
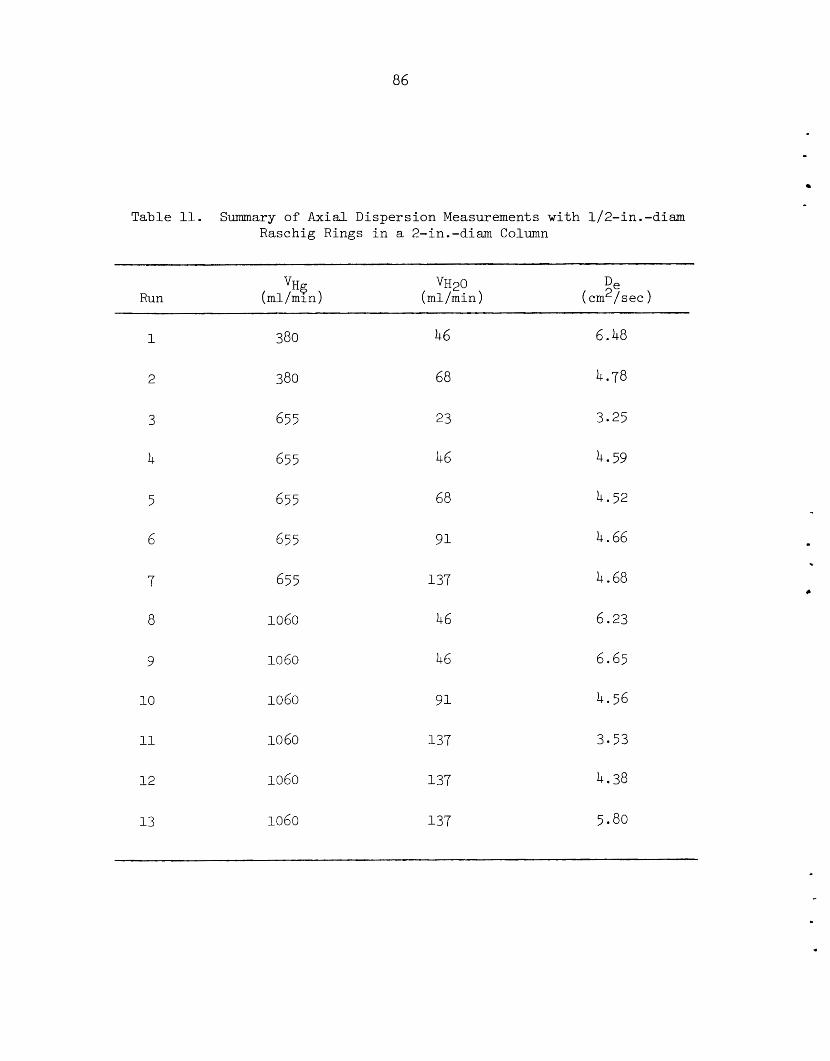
86
Table 11. Summary of Axial Dispersion Measurements with 1/2-in.-diam Raschig Rings in a 2-in.-diam Column
Run vH20
( ml /mi n ) De
(cm’/sec
7
8
9
10
11
12
13
380
380
655
655
655
655
655
1060
1060
1060
1060
1060
1060
46
68
23
46
68
91
137
46
46
91
137
137
137
~ ~~~
6.48
4.78
3.25
4.59
4.52
4.66
4.68
6.23
6.65
4.56
3.53
4.38
5.80
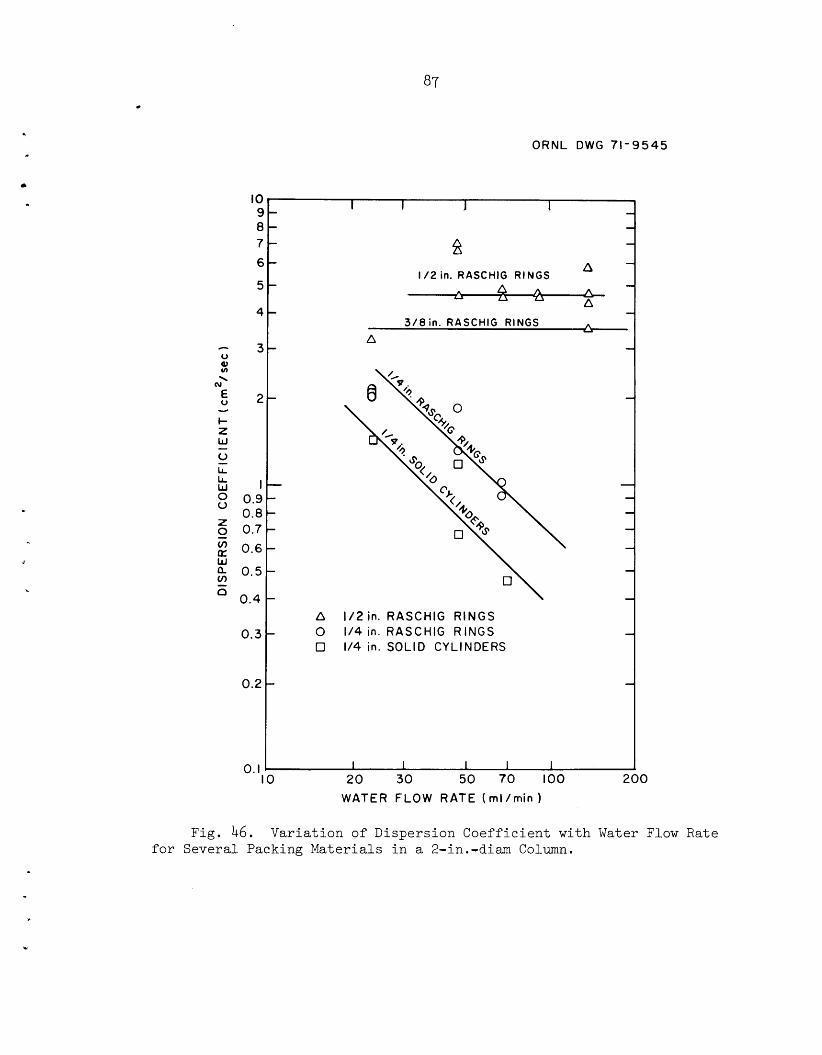
I 1 J I - - 2 -
n
A
- I / 2 in. RASCHIG R I N G S
4 A 7l -
3/8 in. R A S C H I G RINGS A A
I
-
.. O R N L DWG 71-9545
1
i
c
I O $ e 7 E
5
4
3
2
I 0.9 0.8 0.7 0.6
0.5
0.4
0.3
0.2
0. I
A 1/2in. R A S C H I G R I N G S 0 114 in. R A S C H I G R I N G S 0 114 in. S O L I D C Y L I N D E R S
I O 2 0 30 50 70 100 200 W A T E R F L O W RATE ( m l / m i n 1
Fig. 46. Variation of Dispersion Coefficient with Water Flow Rate for Several Packing Materials in a 2-ir1,~diam Column.
88
t h e 1/4- in . packing i n d i c a t e t h a t t h e d i spe r s ion c o e f f i c i e n t i s i n v e r s e l y
p ropor t iona l t o t h e continuous-phase flow r a t e . Di f fe rences between t h e
d i spe r s ion c o e f f i c i e n t s f o r t h e two l/b-in.-diam packing m a t e r i a l s a r e
probably r e l a t e d t o t h e d i f f e r e n c e i n t h e packing void f r a c t i o n s of t h e s e
m a t e r i a l s .
i n . packing and one f o r l a r g e r packing.
The d a t a appear t o po r t r ay two types of behavior , one f o r 1/4-
7.2 Comparison of Resul t s w i t h a Publ ished Cor re l a t ion
Experimental d a t a on a x i a l d i spe r s ion i n packed colwnns have been ob-
t a i n e d by Vermeulen, Moon, Hennico, and Miyauchi,16 who repor t ed a co r re l a -
t i o n f o r p r e d i c t i n g a x i a l d i spe r s ion .
which had a range of phys ica l p r o p e r t i e s and a number of packing materials;
however, as t h e au thors pointed o u t , t h e s tudy d i d not inc lude a s u f f i c i e n t l y
wide range of t h e d i f f e r e n c e i n f l u i d d e n s i t i e s t o eva lua te t h e e f f e c t of
t h i s v a r i a b l e . The d a t a obtained dur ing t h e p re sen t s tudy a f f o r d a t e s t
of t h e Vermeulen c o r r e l a t i o n f o r f l u i d s t h a t have a l a r g e d e n s i t y d i f f e r e n c e .
Thei r s tudy involved s e v e r a l f l u i d s
The p resen t d a t a are compared wi th t h e c o r r e l a t i o n of Vermeulen, Moon,
C P e Hennico, and Miyauchi i n F ig . 47, where t h e dimensionless q u a n t i t y EV d /D
i s p l o t t e d aga ins t t h e dimensionless q u a n t i t y ($v/d V )ll2V /V
ment of t h e present experimental d a t a wi th t h i s c o r r e l a t i o n i s remarkable
s i n c e t h e c o r r e l a t i o n was developed from d a t a obta ined wi th systems having
dens i ty d i f f e r e n c e s between one and two o rde r s of magnitude l e s s t han t h a t
of t h e mercury-water system. The s c a t t e r of t h e present d a t a around t h e
curve i s not s i g n i f i c a n t l y g r e a t e r t han t h a t of t h e e a r l i e r d a t a .
The agree- P C d c '
Closer examination of t h e d a t a r e v e a l s an apparent d i f f e r e n c e between
t h e c o r r e l a t i o n and t h e present d a t a wi th r ega rd t o t h e dependence of d i s -
pe r s ion c o e f f i c i e n t on t h e flow rates of t h e two phases . However, it was
not p o s s i b l e t o cover a s u f f i c i e n t l y wide range of mercury and water flow
rates t o confirm t h e suspected dependence.
P
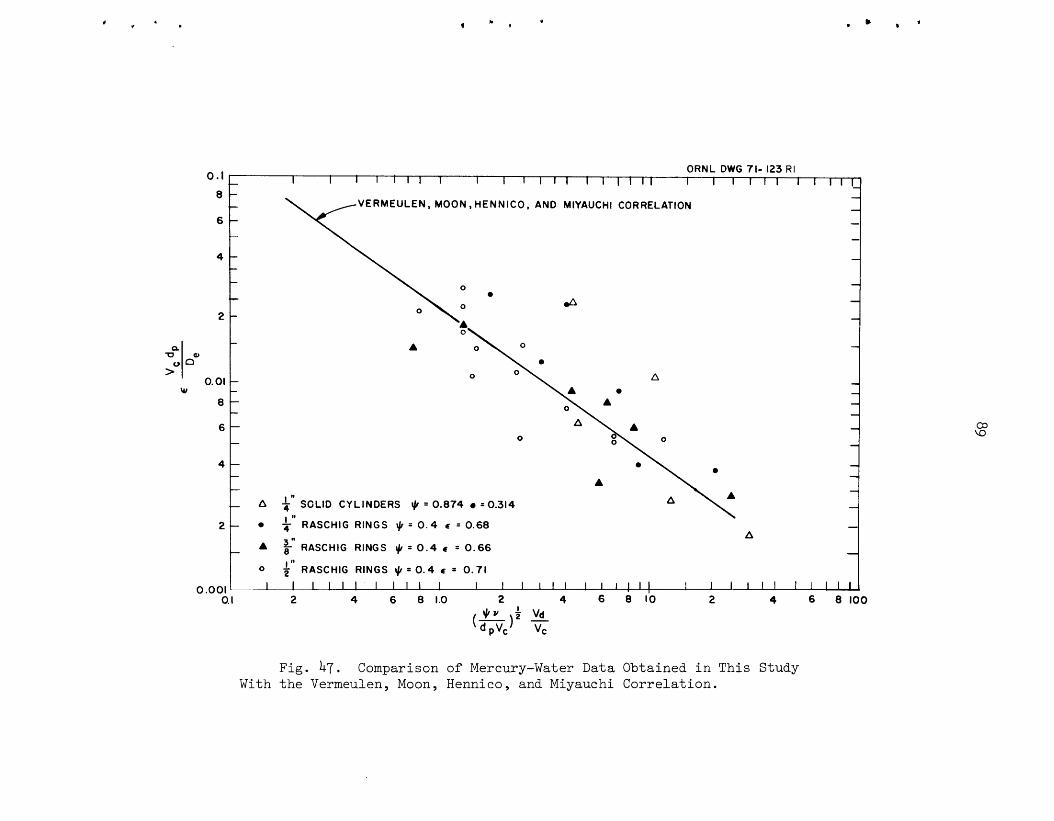
0.1 8 -
6 -
4 -
2 -
0.01
8 -
6 -
4 -
0 $I' RASCHIG RINGS JI = 0.4 c = 0.71
0 .OOl 1 I I I l l I I l l I I I I I l l I I I I I I I 1 I I l l I I I I I 0. I 2 4 6 8 1.0 2 4 6 8 1 0 2 4 6 8 100
ORNL DWG 71- 123 RI - I I I I I I I 1 1 1 I I l l I I I I I I 1 I 1 I l l I I I l l '
- VERMEULEN, MOON, H E N N I C O , AND MlYAUCHl CORRELATION - - - -
- -
- - - - c -
- - -
- -
- - - - -
- - - -
- - - - - A $" SCLlD CYLINDERS JI = 0.874 =0.314 -
Fig. 47. Comparison of Mercury-Water Data Obtained in This Study With the Vermeulen, Moon, Hennico, and Miyauchi Correlation.
8. REFERENCES
1. M. J. Bell and L. E. McNeese, "MSBR Fuel Processing Using the Flu- orination--Reductive Extraction and Metal Transfer Flowsheet ," Engineering Development Studies for Molten-Salt Breeder Reactor Processing No. 6, ORNL-TM-3141 (in press).
2. L. Me Ferris, "Measurement of Distribution Coefficients in Molten Salt--Metal Systems,'' MSR Program Semiann. Progr. Rept. Aug. 31, - 1970, ORNL-4622, p. 204.
3. R. W. Kessie et&., Process Design for Frozen-Wall Containment of Fused Salt , ANL-6377 (August 1961).
4. J. R. Hightower, Jr., C. P. Tung, and L. E. McNeese, "Use of Radio- Frequency Induction Heating for Frozen-Wall Fluorinator Development Studies," Engineering Development Studies for Molten-Salt Breeder Reactor Processing No. 6, ORNL-TM-3141 (in press).
5. S. Cantor (Ed.), Physical Properties of Molten Salt Reactor Fuel, Coolant , and Flush Salts , ORNL-TM-2316 (August 1968) , p . 14.
6. J. W. Cook, MSR Program Semiann. Progr. Rept. Feb. 28, 1969, ORNL- 4396, p. 122.
7. S. Cantor (Ed.), &. Cit. , p. 25.
&
c
8. P. G. Simpson, Induction Heatin$, McGraw-Hill, New York, 1960, p. 141.
9. E. L. Youngblood et a. , "Metal Transfer Process Development," Engineering Development Studies for Molten-Salt Breeder Reactor Processing No. 6, ORNL-TM-3141 (in press).
10. MSR Program Semiann. Progr. Rept. Feb. 28, 1969, 0 ~ ~ ~ - 4 3 9 6 , p. 284.
11. MSR Program Semiann. Progr. Rept. Feb. 28, 1970, ORNL-4548, p. 291.
12. R. B. Lindauer and L. E. McNeese, "Continuous Salt Purification Studies," Engineering Development Studies for Molten-Salt Breeder Reactor Processing No . 6, ORNL-TM-31]-\1. (in press).
13. W. S. Pappas, Anal. Chem. - 38, 615 (1966).
14. L. E. McNeese, Engineering Development Studies for Molten-Salt Breeder Reactor Processing No. 3, ORNL-3138, p. 34.
16. T. Vermeulen, J. S. Moon, A. Hennico, and T. Miyauchi, Chem. Eng. Progr. 62, 96 (1966).
’*
INTERNAL DISTRIBUTION
1. C . F. Baes 2. H. F. Bauman 3. S. E. Bea l l 4. M e J. B e l l 5. M. R . Bennett 6. R , E. Blanco 7. F. F. Blankenship 8 , G. E. Boyd g J R e B o Briggs
10 . R , E. Brooksbank 11. K. B. Brown 12 , W. L. Ca r t e r 13. H. D. Cochran, Jr. 1 4 . F. L. Cul le r 1 5 . J. R . Dis tefano 16. W. P. Ea ther ly 17 . D. E. Ferguson 18. L. M. F e r r i s 19 . J. H. Frye 20. W. R . G r i m e s 21. A. G. Gr inde l l 22. P. A. Haas 23. B. A. Hannaford 24. J. R. Hightower, Jr. 25. C . W. Kee 26. R . B. Lindauer 27. H. E. MCCOY
28-38. L. E. McNeese 39. D. M. Moulton 40. J. P. Nichols 41. E. L. Nicholson
42 . 43
44-45. 46 . 47 48 . 49 50 51 0
52 53 54 e
55 56 57 58 59 60 . 61. 62. 63 64. 65 66.
67-68. 69-70. 71-73
74 0
75 76
J. H. Pashley (K-25) A. M. Per ry M. W. Rosenthal A. D. Ryon W. F. Scha f fe r , Jr. Dunlap Sco t t J. H . Shaf fer M. J . Skinner F. J. Smith D. D. Sood Martha Stewart 0. K. T a l l e n t R . E. Thoma D. B. Trauger W. E. Unger C . D. Watson J. S. Watson A. M. Weinberg J. R . Weir M. E. Whatley J. C . White W. M. Woods R . G. Wymer E. L. Youngblood Cen t ra l Research Library Document Reference Sec t ion Laboratory Records Laboratory Records, RC Y-12 Document Reference Sec t ion ORNL Pa ten t Of f i ce
EXTERNAL DISTRIBUTION
77 78
79 80.
81. 82.
83 . 84. 85
J. A. A c c a i r r i , Cont inenta l O i l Co., Ponca C i ty , Oklahoma 74601 R. M. Bushong, UCC, Carbon Products Div is ion , 12900 Snow Road,
D. F. Cope, Atomic Energy Commission, RDT S i t e Off ice (ORNL) C . B. Deering, Black & Veach, P. 0. Box 8405, Kansas C i ty ,
A. R . DeGrazia, USAEC, RDT, Washington, D . C . 20545 Delonde R . deBoisblanc, Ebasco Se rv ices , I n c . , 2 Rector S t r e e t ,
D. El ias , RDT, USAEC, Washington, D.C. 20545 Norton Haberman, RDT, USAEC, Washington, D . C . T. R . Johnson, Argonne Nat ional Laboratory, 9700 S. Cass Avenue,
Parma, Ohio 44130
Missouri 64114
New York, N . Y . 10006
20545
Argonne, I l l i n o i s 60439
EXTERNAL DISTRIBUTION (Continued)
86. 87-68 e
89 e
90
92 93
94
95
96
97 98-99
Kermit Laughon, Atomic Energy Cornmission, RDT Site Office (ORNL) T. W. McIntosh, Atomic Energy Commission, Washington, D.C. 20545 E. H. Okrent, Jersey Nuclear Co., Bellevue, Washington 98004 R. D. Pierce, Argonne National Laboratory, 9700 S. Cass Avenue,
J. Roth, Combustion Engineering Inc., Prospect Hill Road, Windsor,
M. Shaw, Atomic Energy Commission, TTashington, D.C. 20545 N. Srinivasan, Head, Fuel Reprocessing Division, Bhabha Atomic
C, L. Storrs, Combustion Engineering Inc., Prospect Hill Road,
B. L. Tarmy, Esso Research and Engr. Co., P. 0. Box 101, Florham
J. R. Trinko, Ebasco Services, Inc., 2 Rector Street, New York,
Laboratory and University Division, OR0 Division of Technical Information Extension, ORO, AEC
Argonne, Illinois 60439
Connecticut 06095
Research Center, Trombay, Bombay 74, India
Windsor, Connecticut 06095
Park, N.J. 07932
N.Y. 10006