Embed Size (px)
Citation preview
The state of river ecosystems: a The state of river ecosystems: a degraded past, an uncertain future?degraded past, an uncertain future?
Steve OrmerodSteve Ormerod
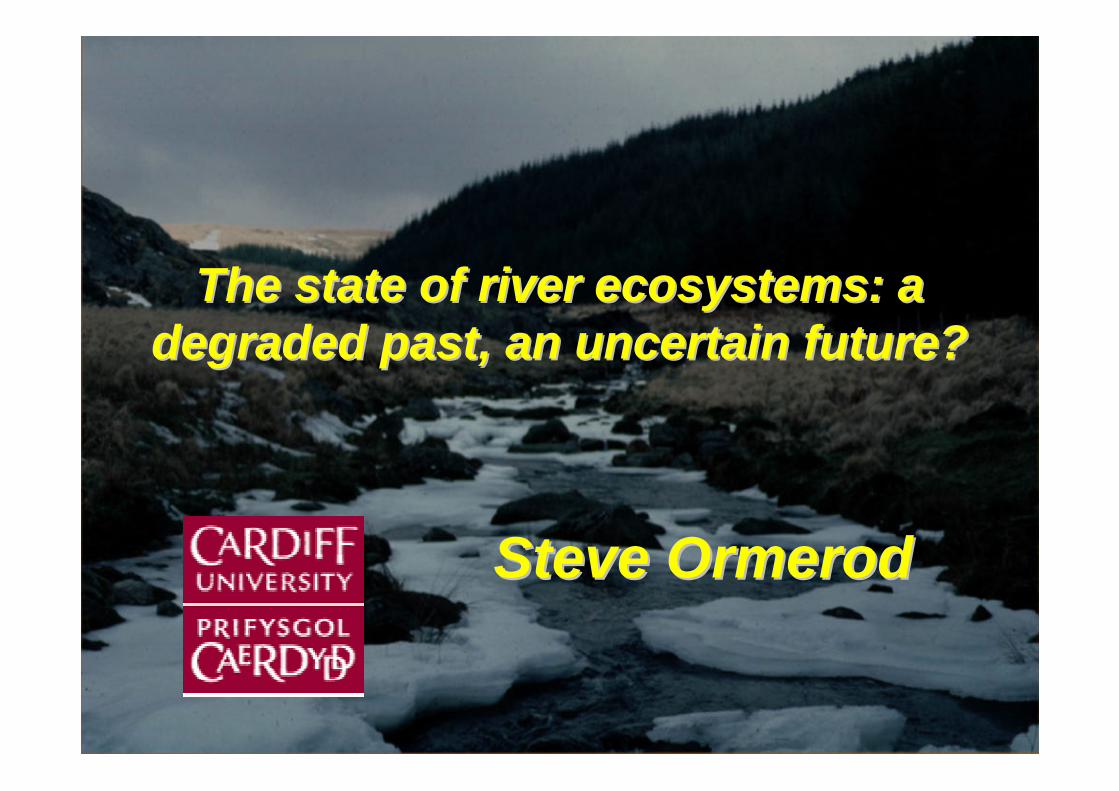
1. A crash-course in river ecology
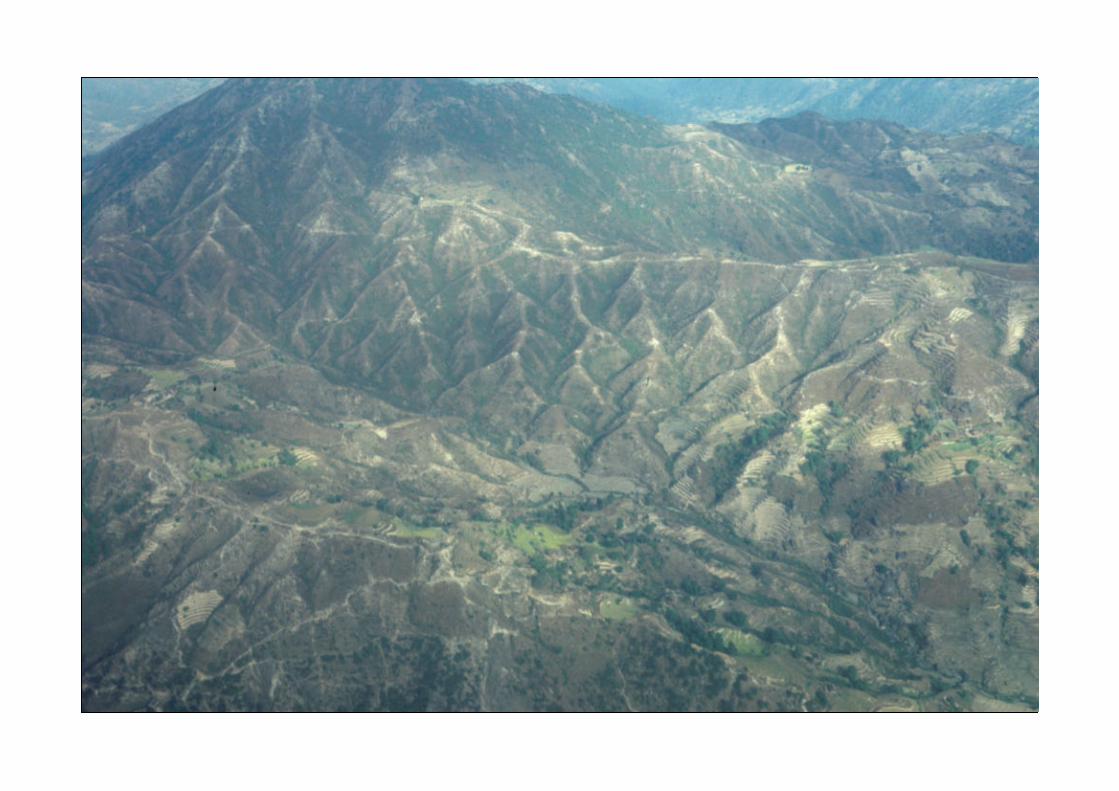
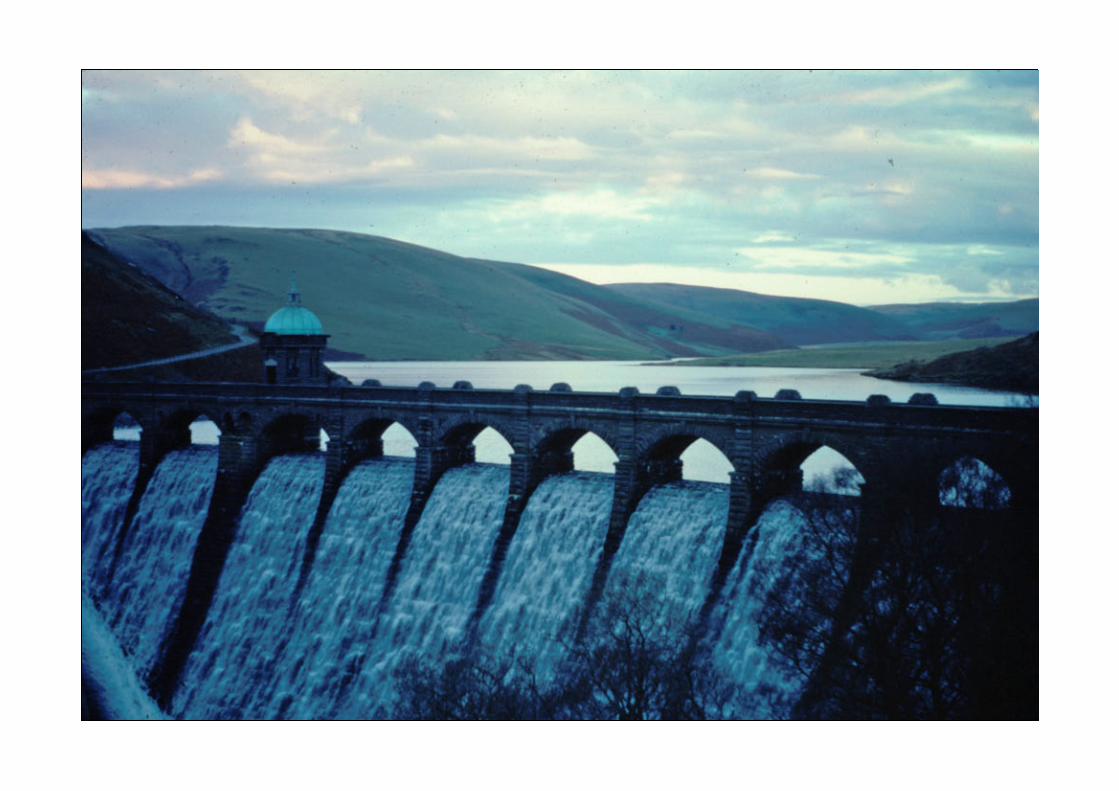
2. River modifications by people
3. Conservation challenges
4.Two linked examples of impairment• The effects of climate change• Recovery from acid rain
Conclusions
(Introduce themes for later speakers)

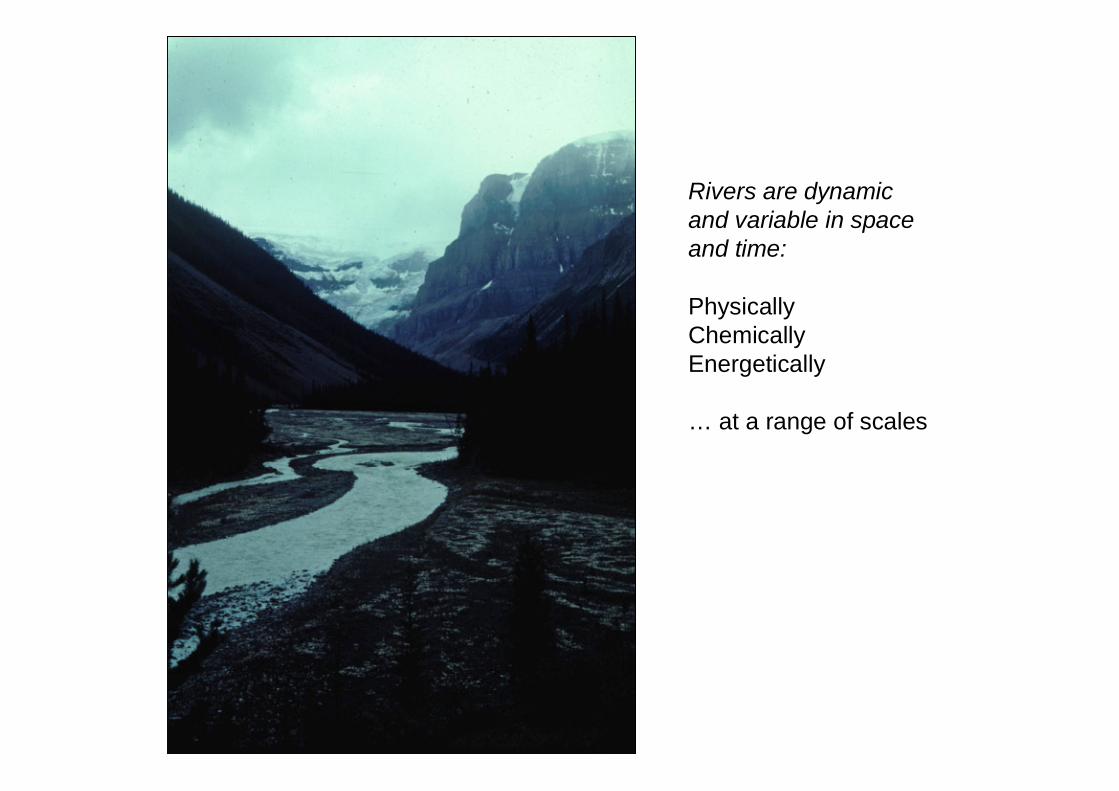
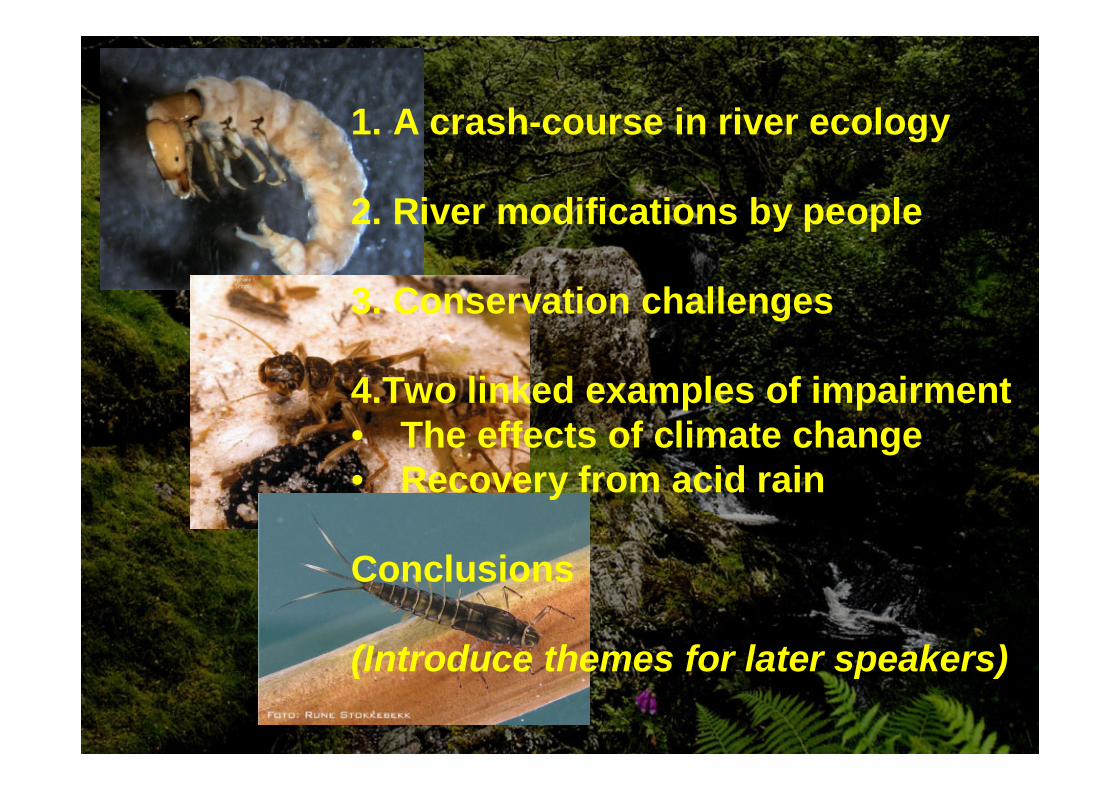
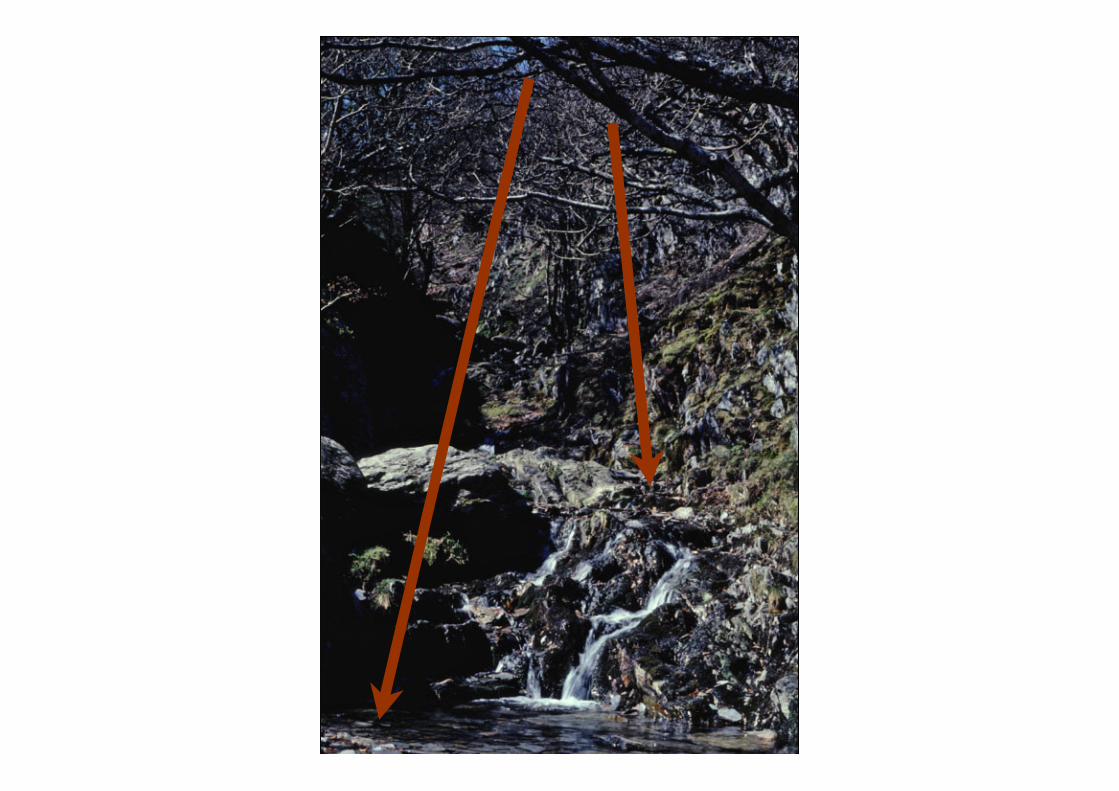
Rivers are dynamic and variable in spaceand time:
PhysicallyChemicallyEnergetically
… at a range of scales

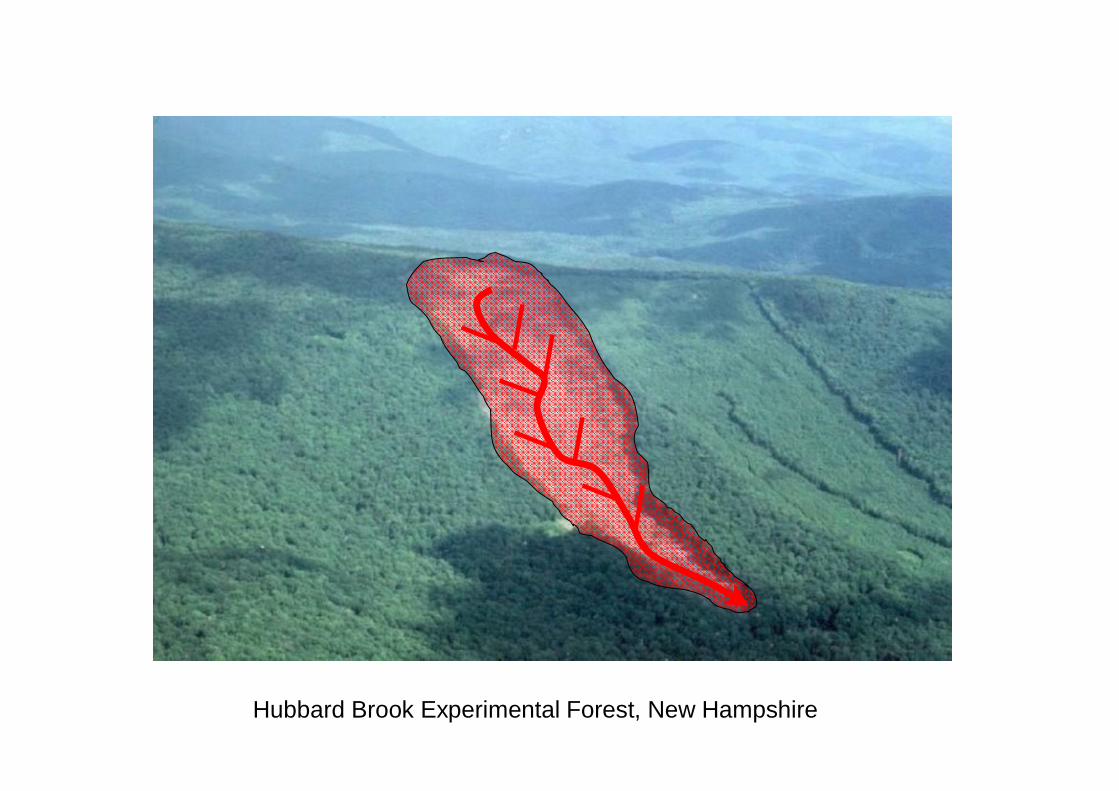
Hubbard Brook Experimental Forest, New Hampshire
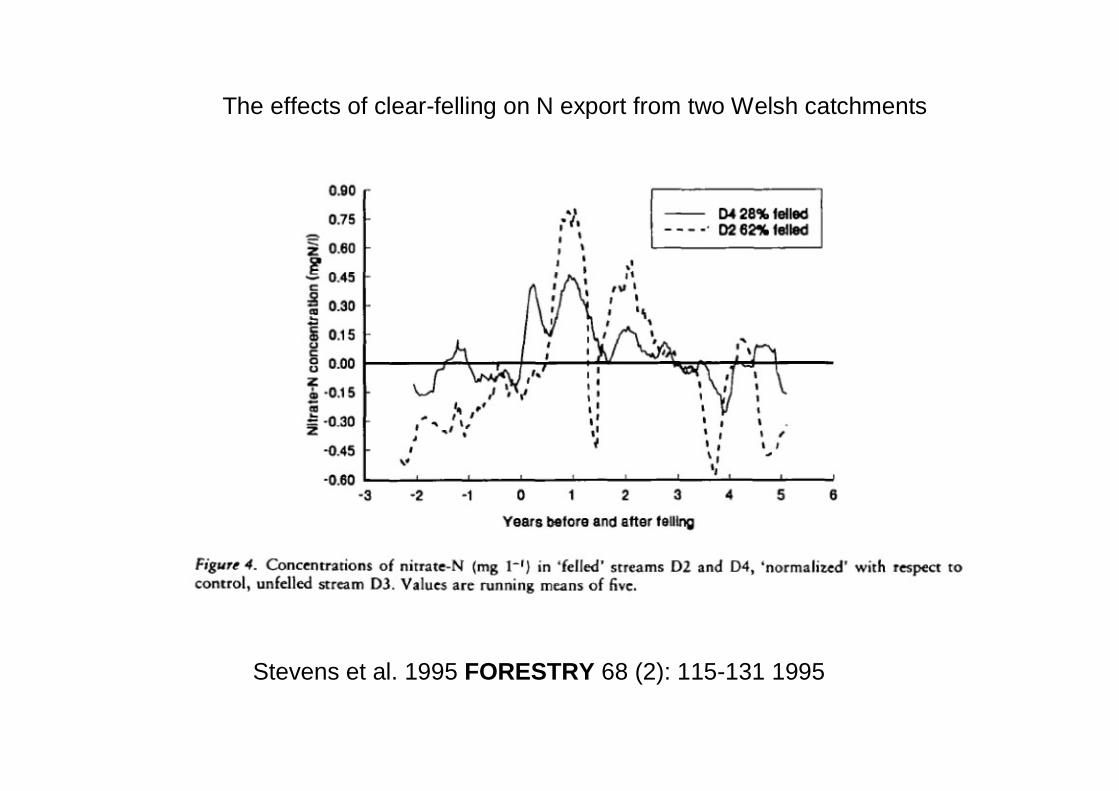
Stevens et al. 1995 FORESTRY 68 (2): 115-131 1995
The effects of clear-felling on N export from two Welsh catchments
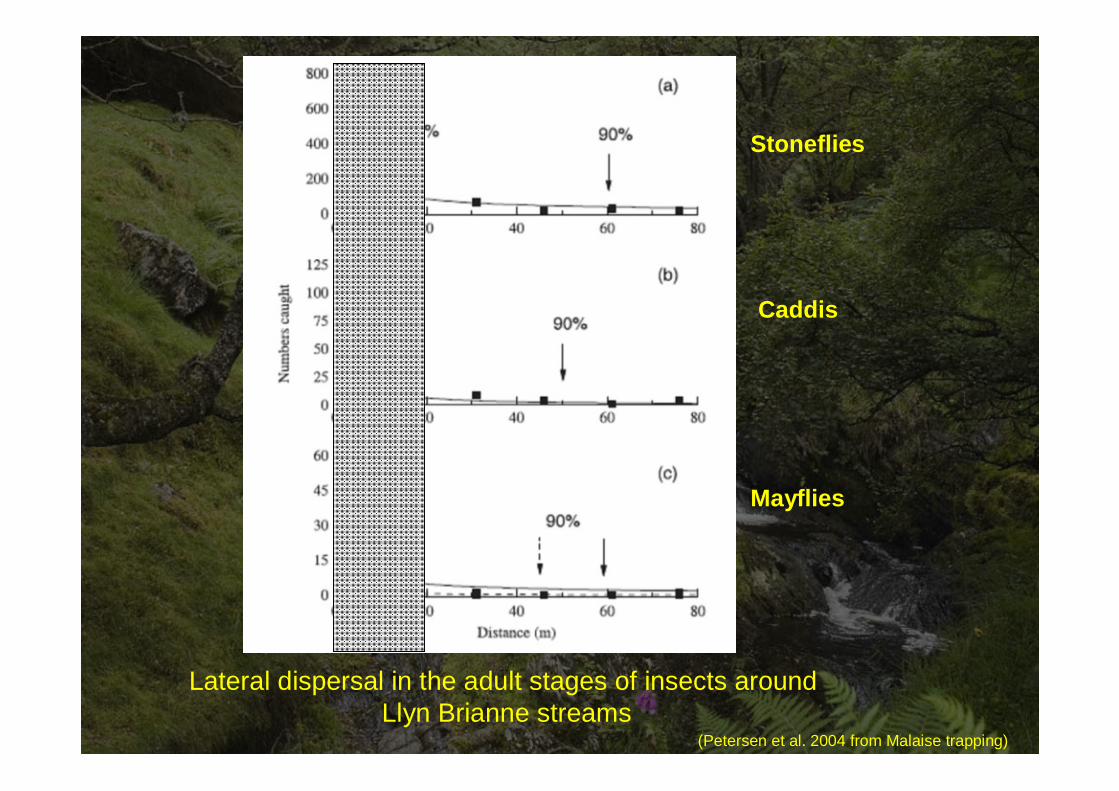
Stoneflies
Caddis
Mayflies
Lateral dispersal in the adult stages of insects around Llyn Brianne streams
(Petersen et al. 2004 from Malaise trapping)
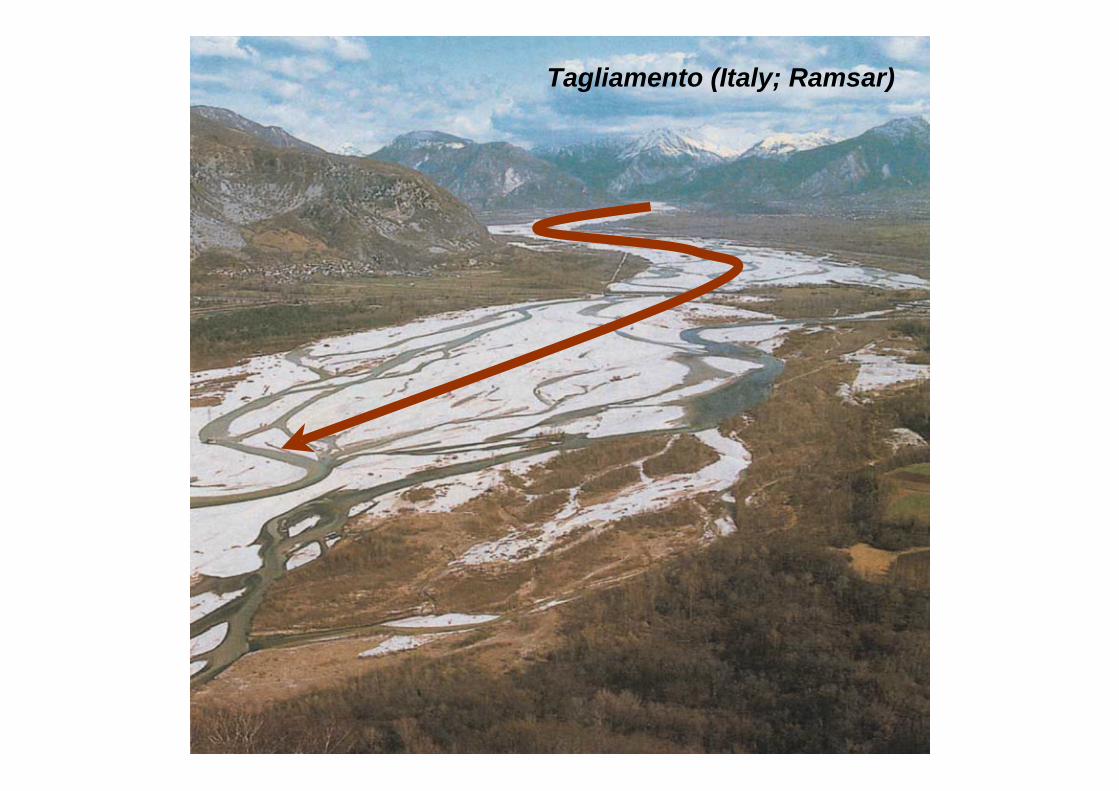
Tagliamento (Italy; Ramsar)
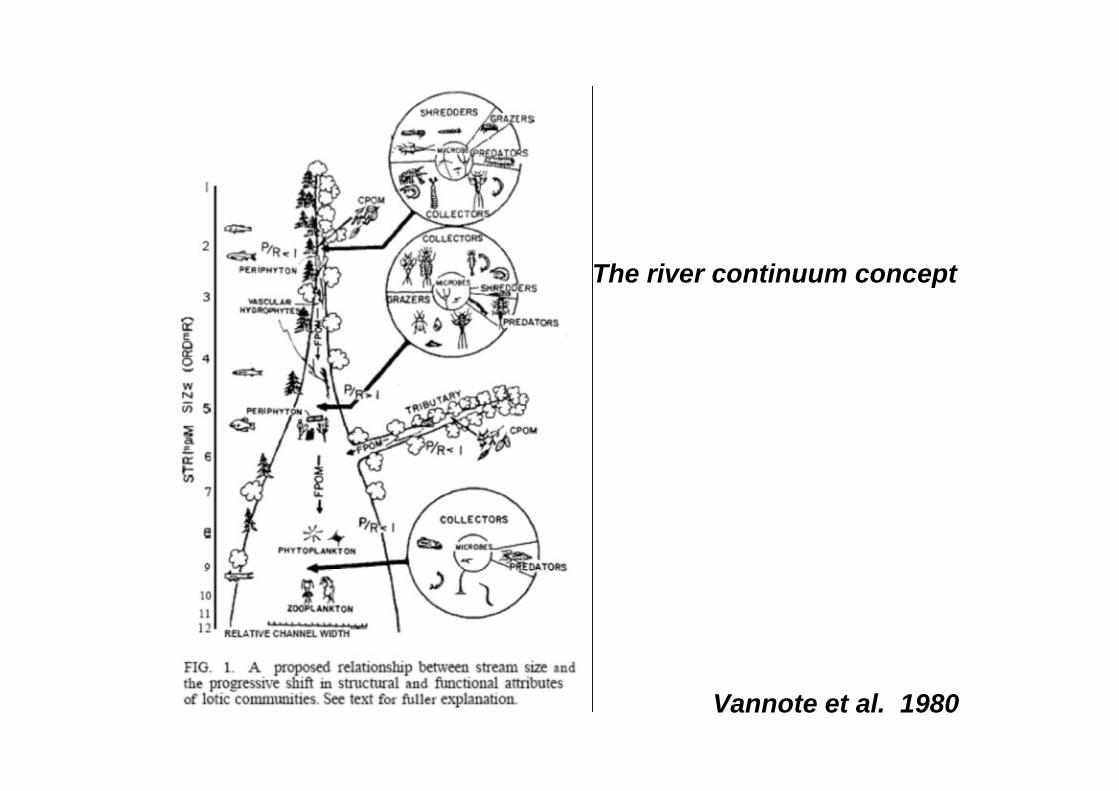
The river continuum concept
Vannote et al. 1980
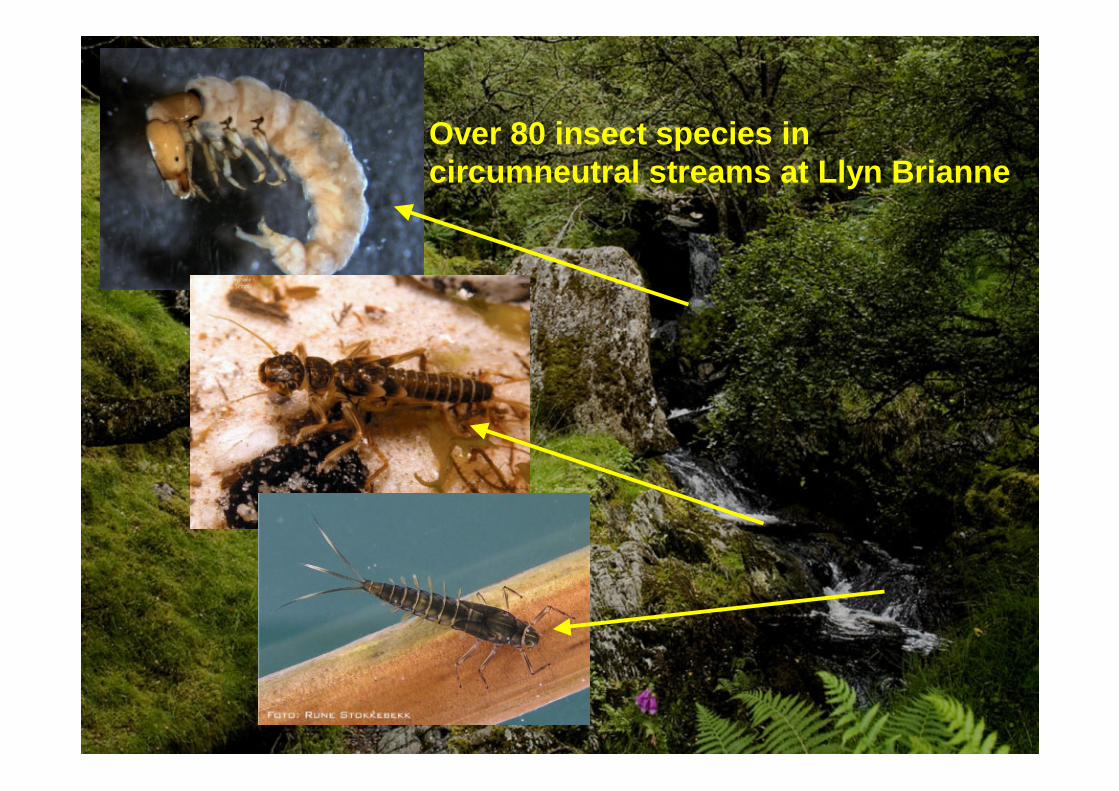
Over 80 insect species incircumneutral streams at Llyn Brianne
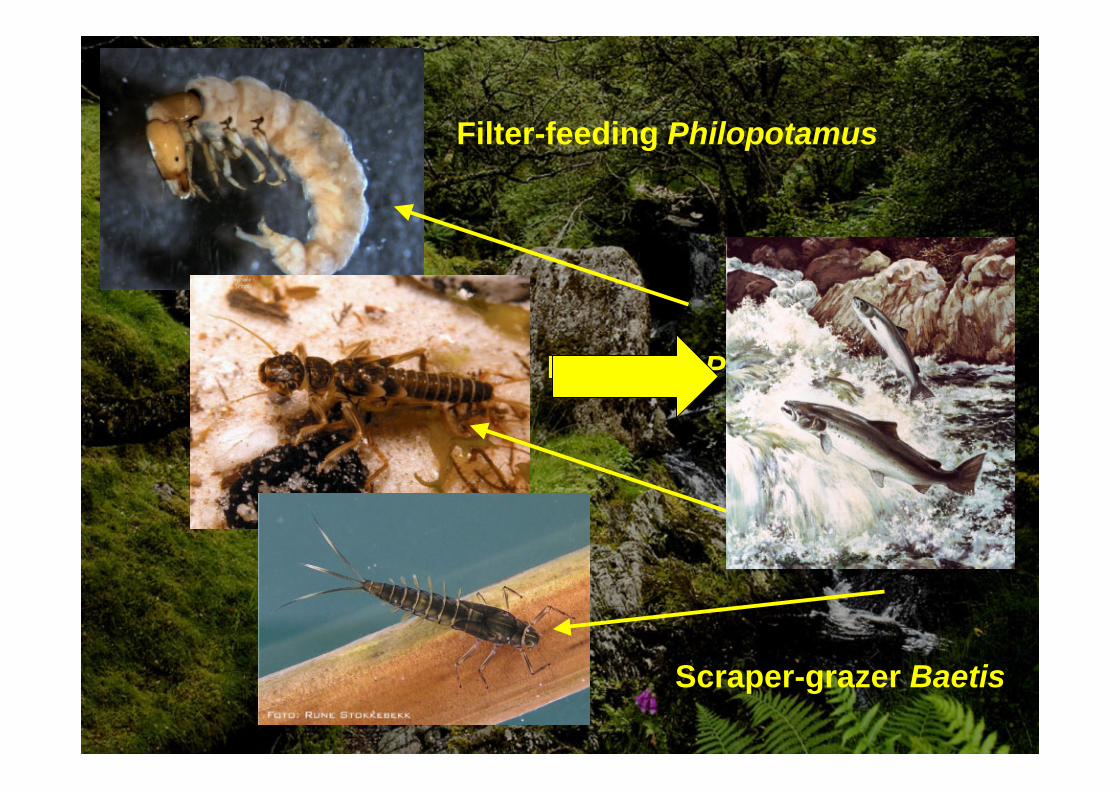
Filter-feeding Philopotamus
Predatory Perla
Scraper-grazer Baetis

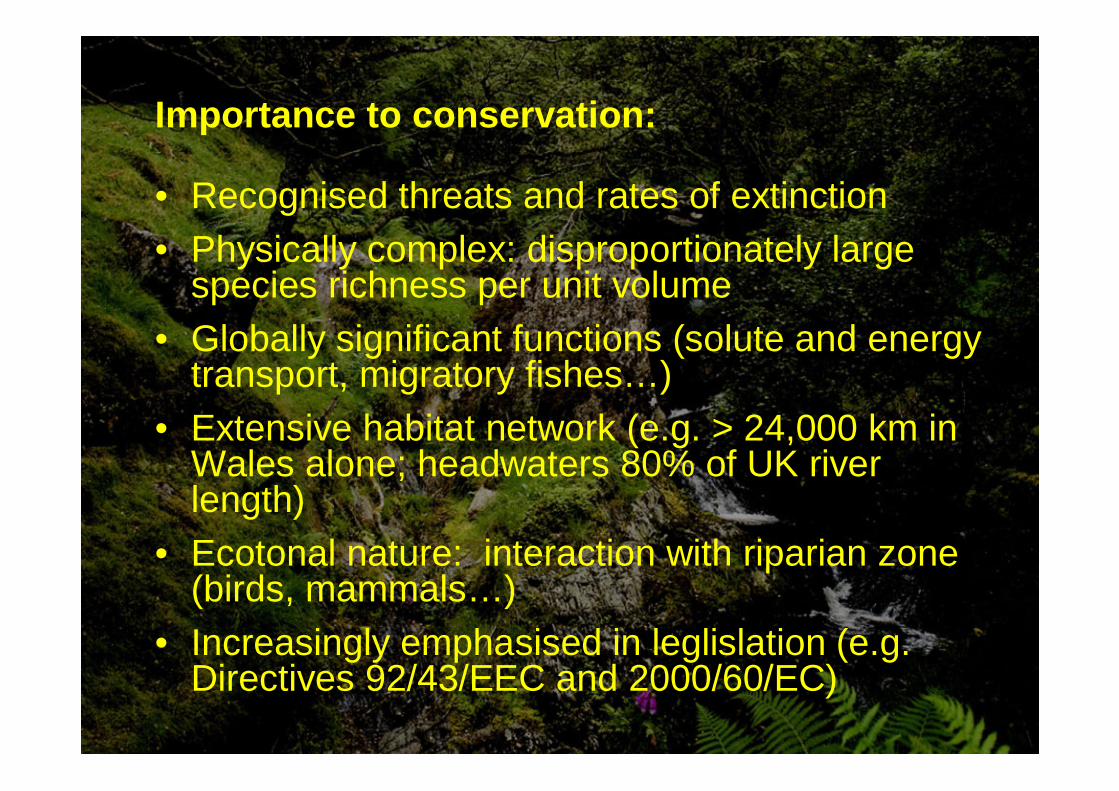
Importance to conservation:
• Recognised threats and rates of extinction• Physically complex: disproportionately large
species richness per unit volume • Globally significant functions (solute and energy
transport, migratory fishes…)• Extensive habitat network (e.g. > 24,000 km in
Wales alone; headwaters 80% of UK river length)
• Ecotonal nature: interaction with riparian zone (birds, mammals…)
• Increasingly emphasised in leglislation (e.g. Directives 92/43/EEC and 2000/60/EC)
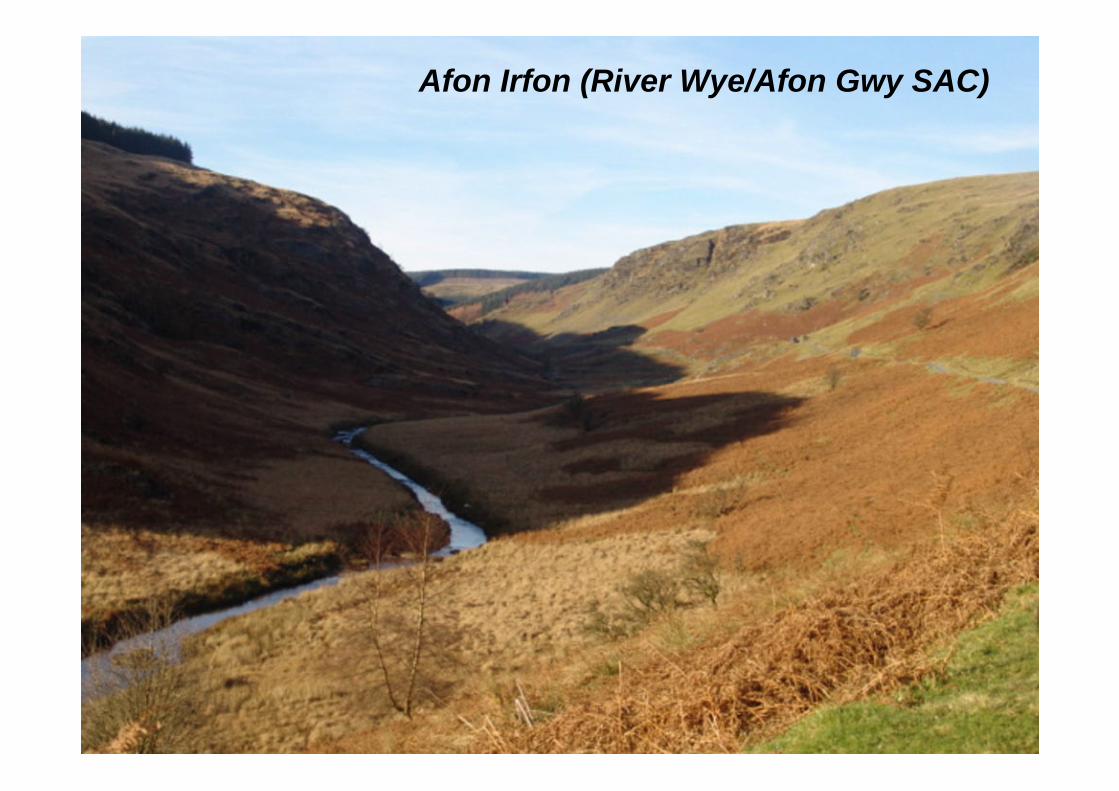
Afon Irfon (River Wye/Afon Gwy SAC)
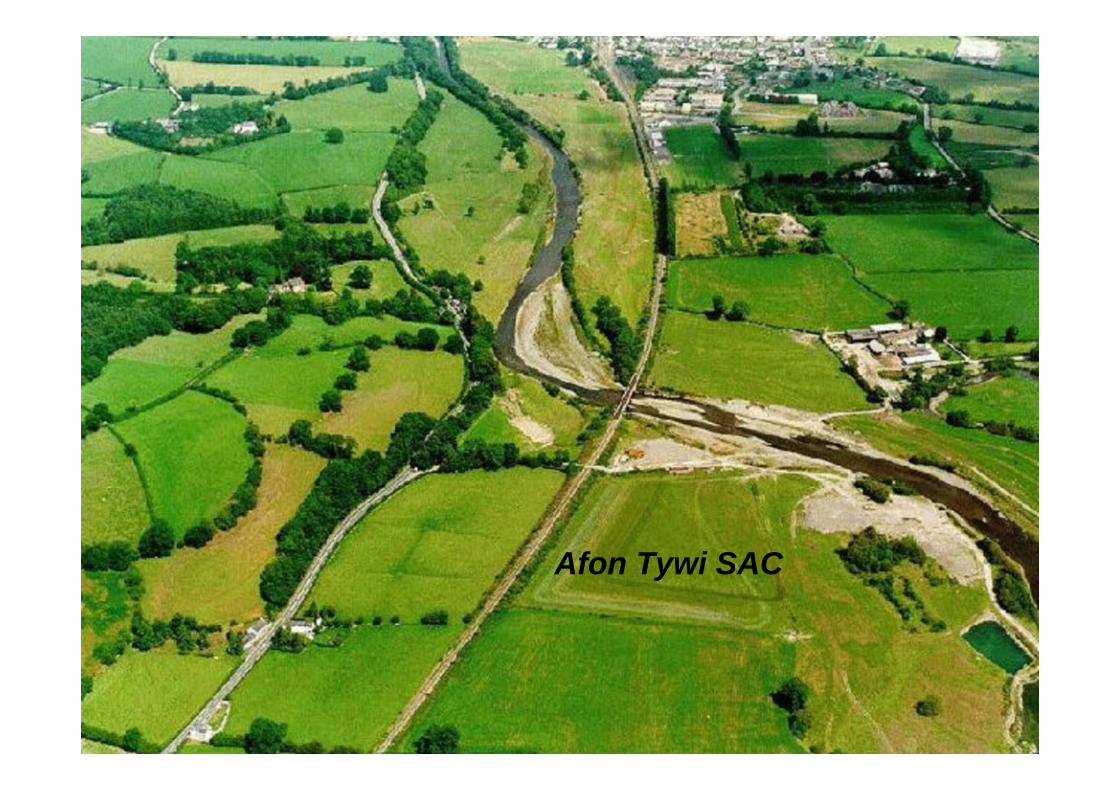
Afon Tywi SAC
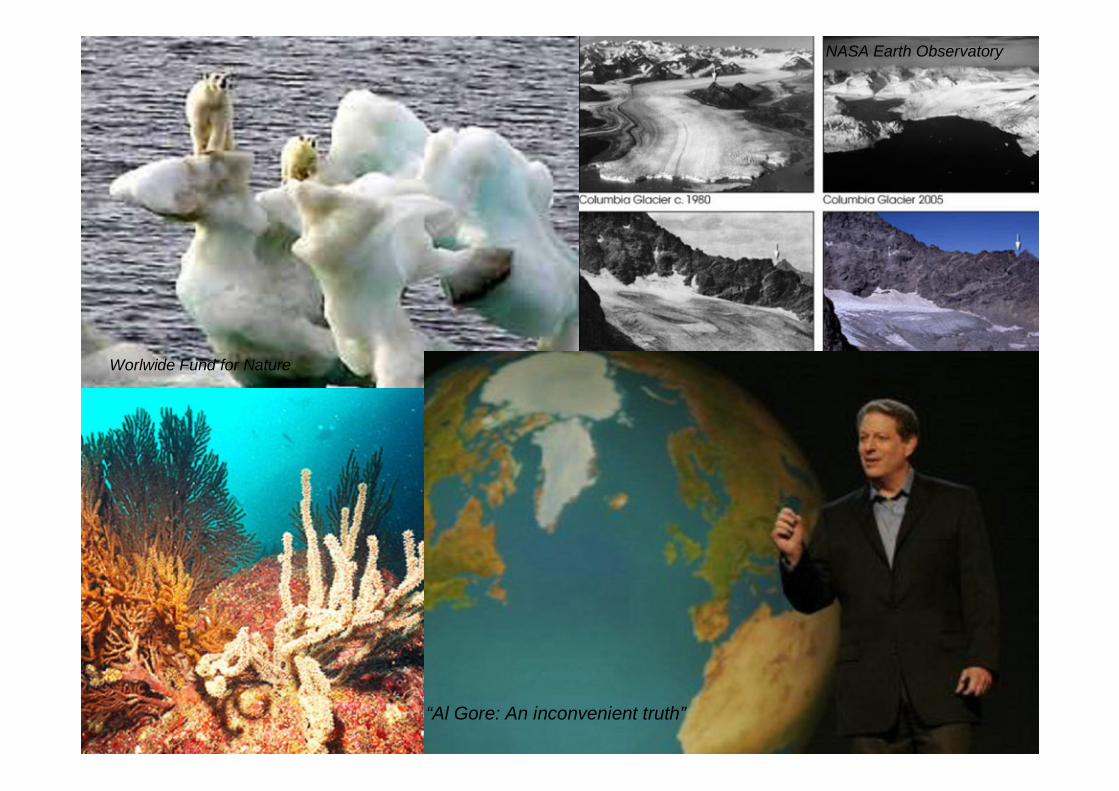
NASA Earth Observatory
“Al Gore: An inconvenient truth”
Worlwide Fund for Nature
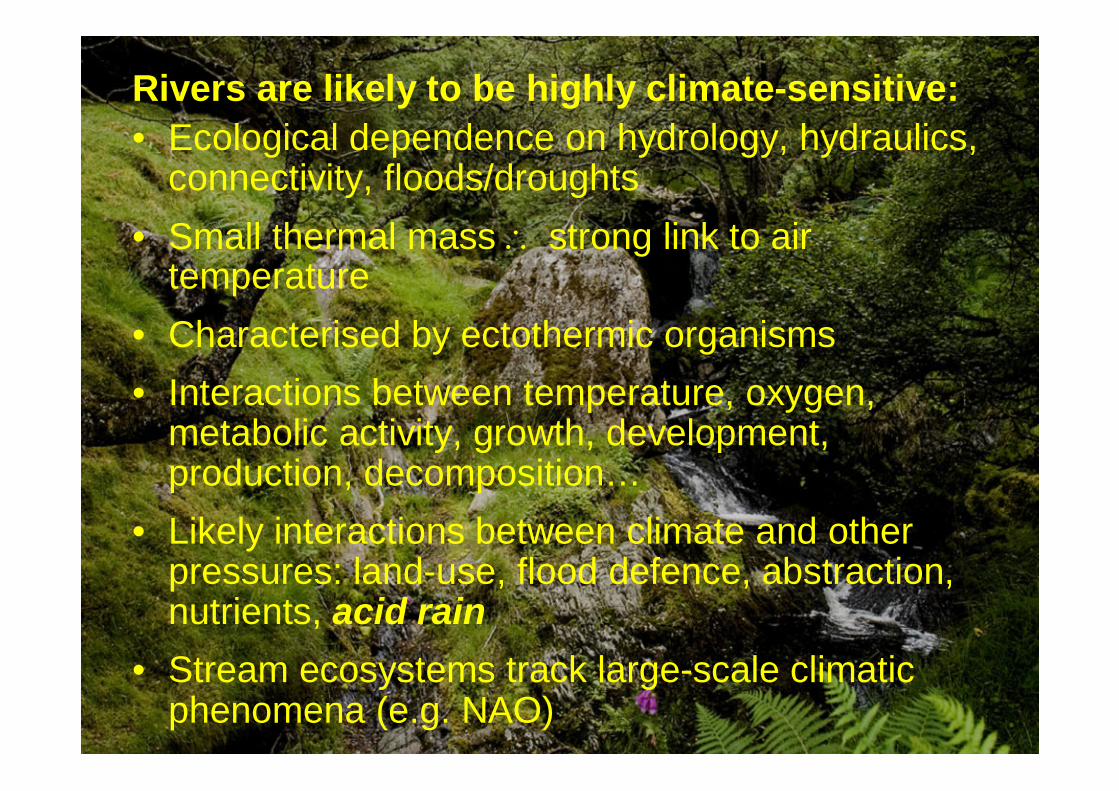
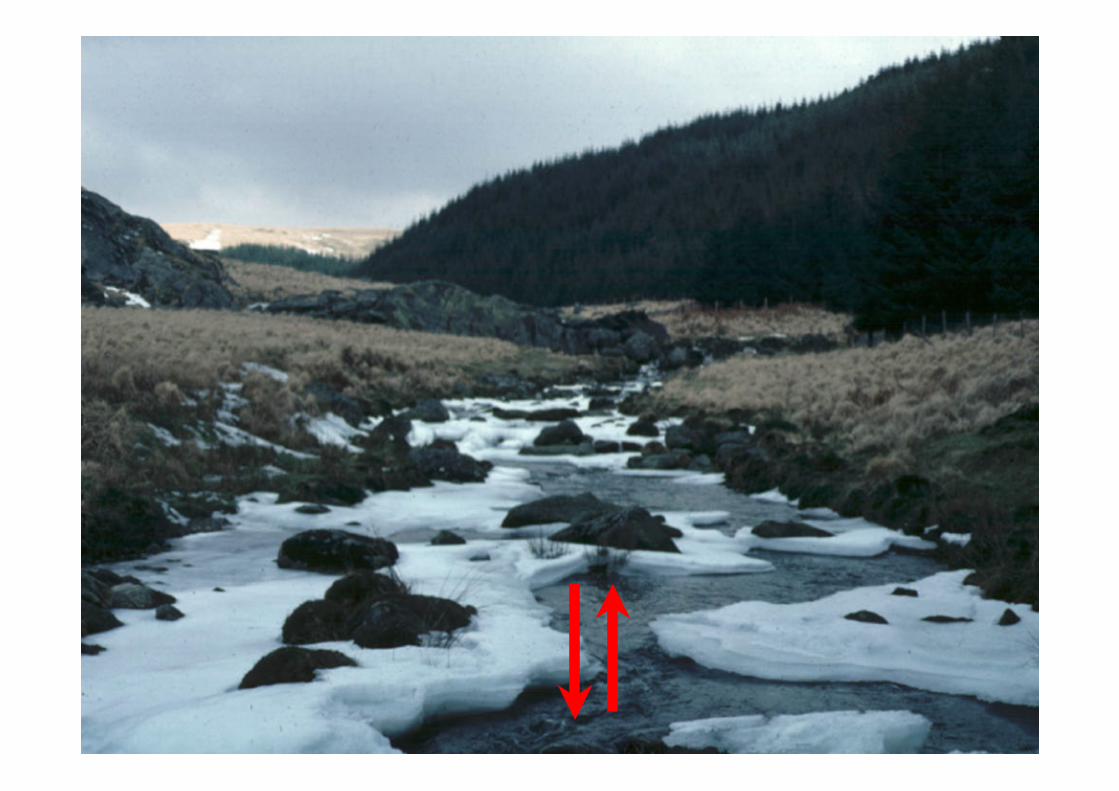
Rivers are likely to be highly climate-sensitive:• Ecological dependence on hydrology, hydraulics,
connectivity, floods/droughts• Small thermal mass strong link to air
temperature• Characterised by ectothermic organisms• Interactions between temperature, oxygen,
metabolic activity, growth, development, production, decomposition…
• Likely interactions between climate and other pressures: land-use, flood defence, abstraction, nutrients, acid rain
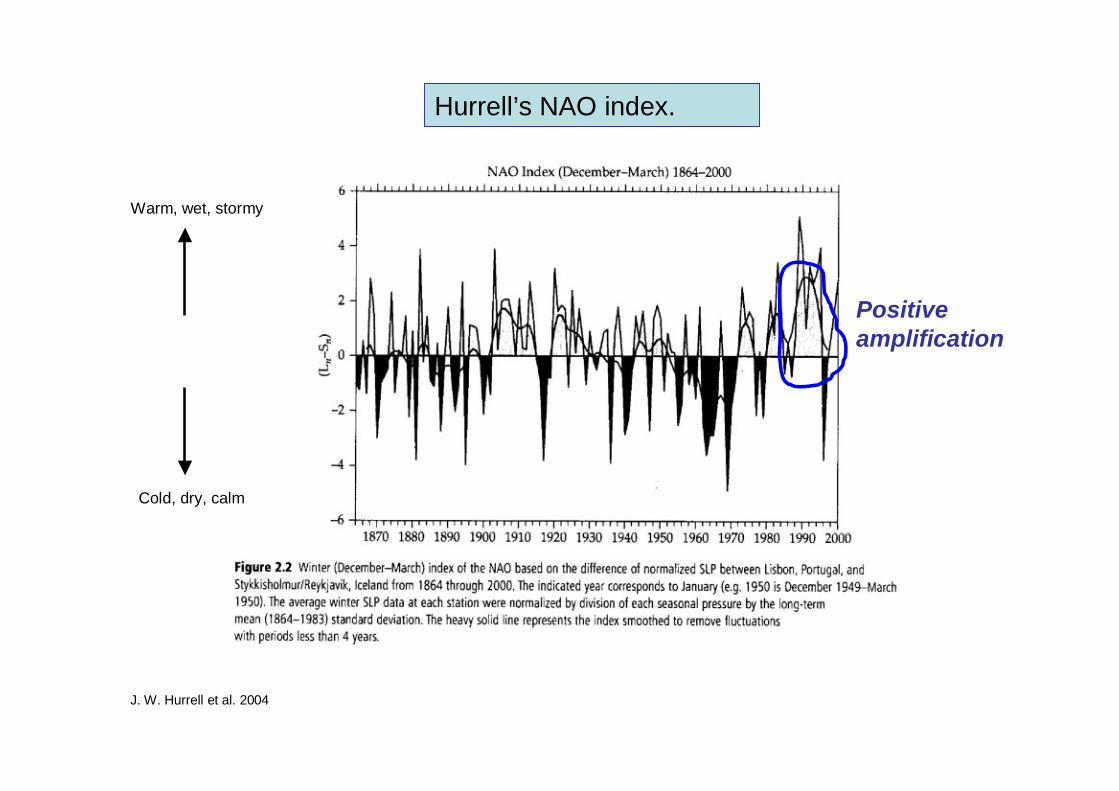
• Stream ecosystems track large-scale climatic phenomena (e.g. NAO)
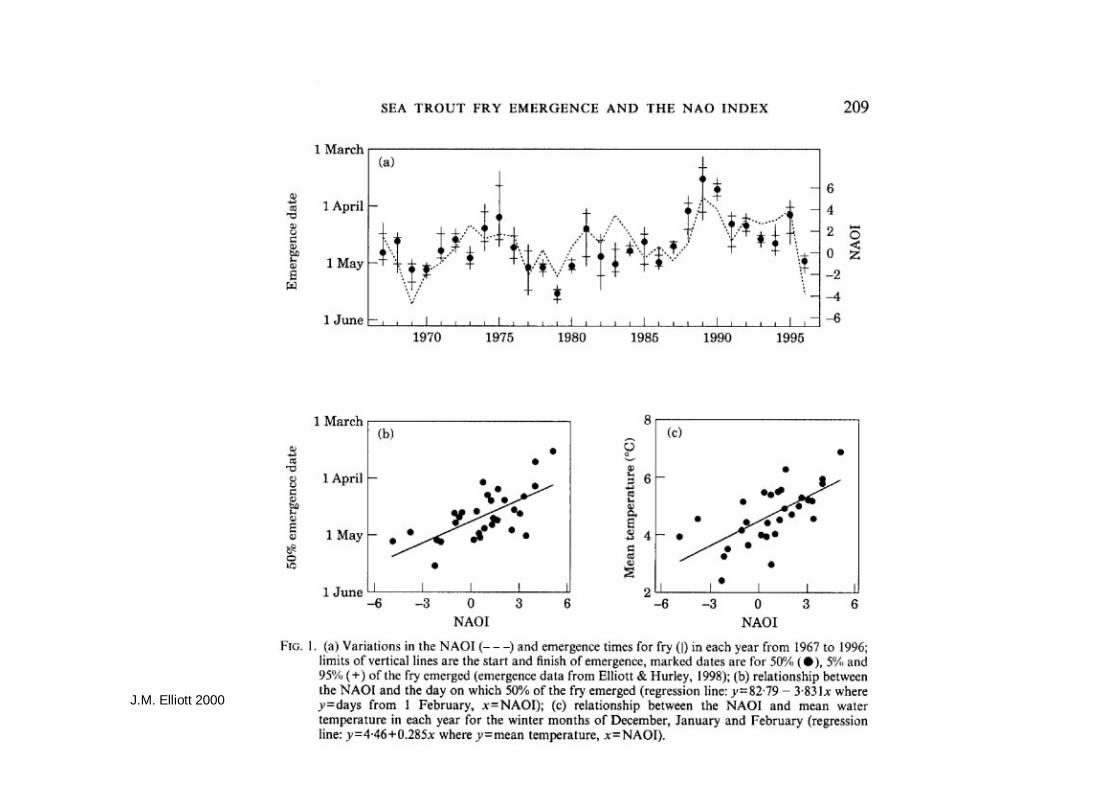
J.M. Elliott 2000
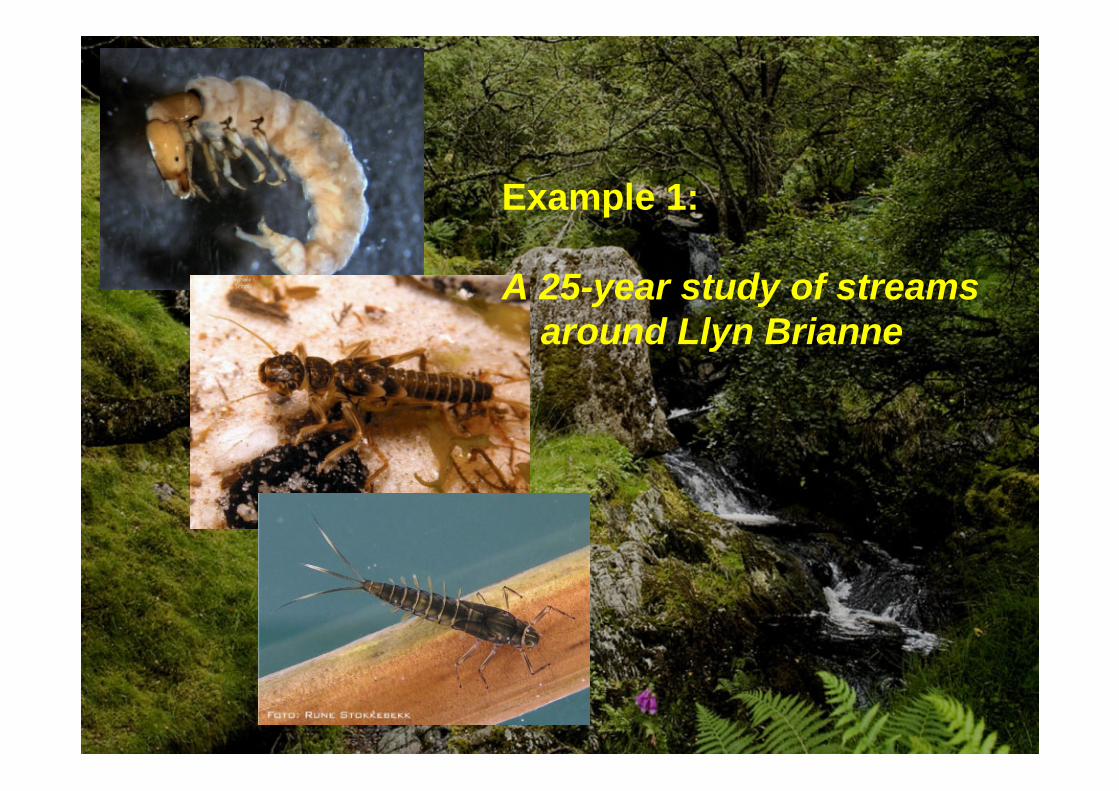
Example 1:
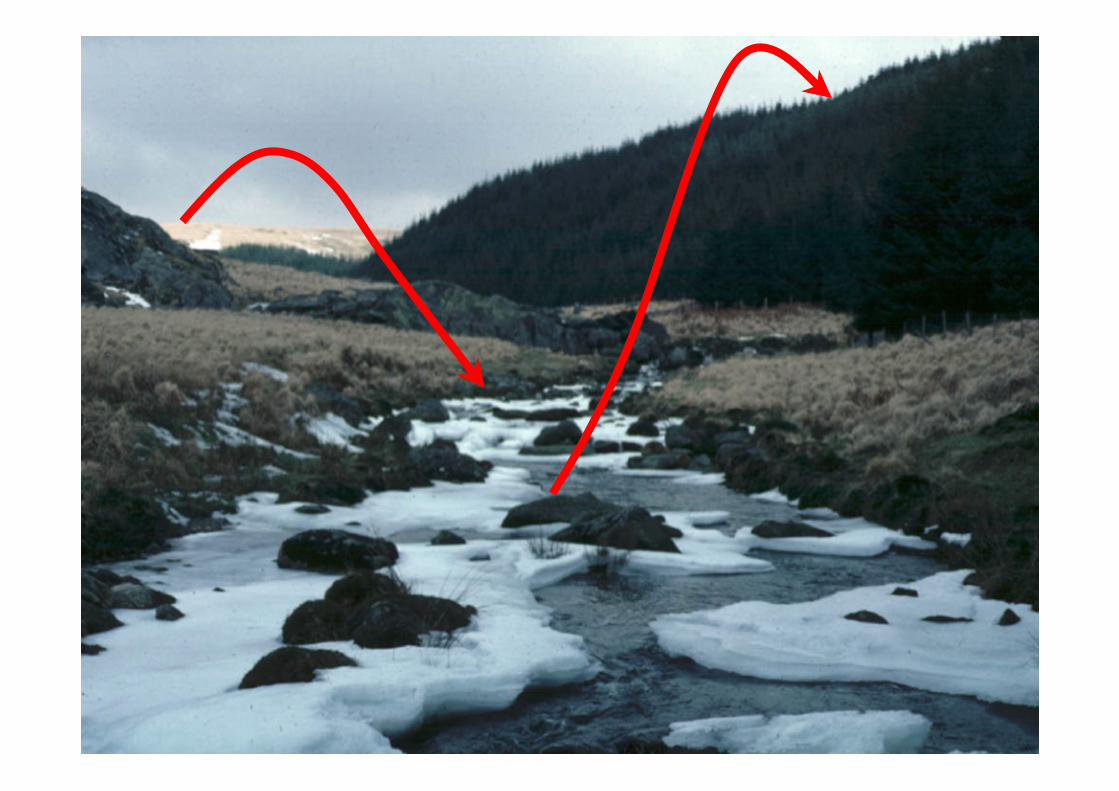
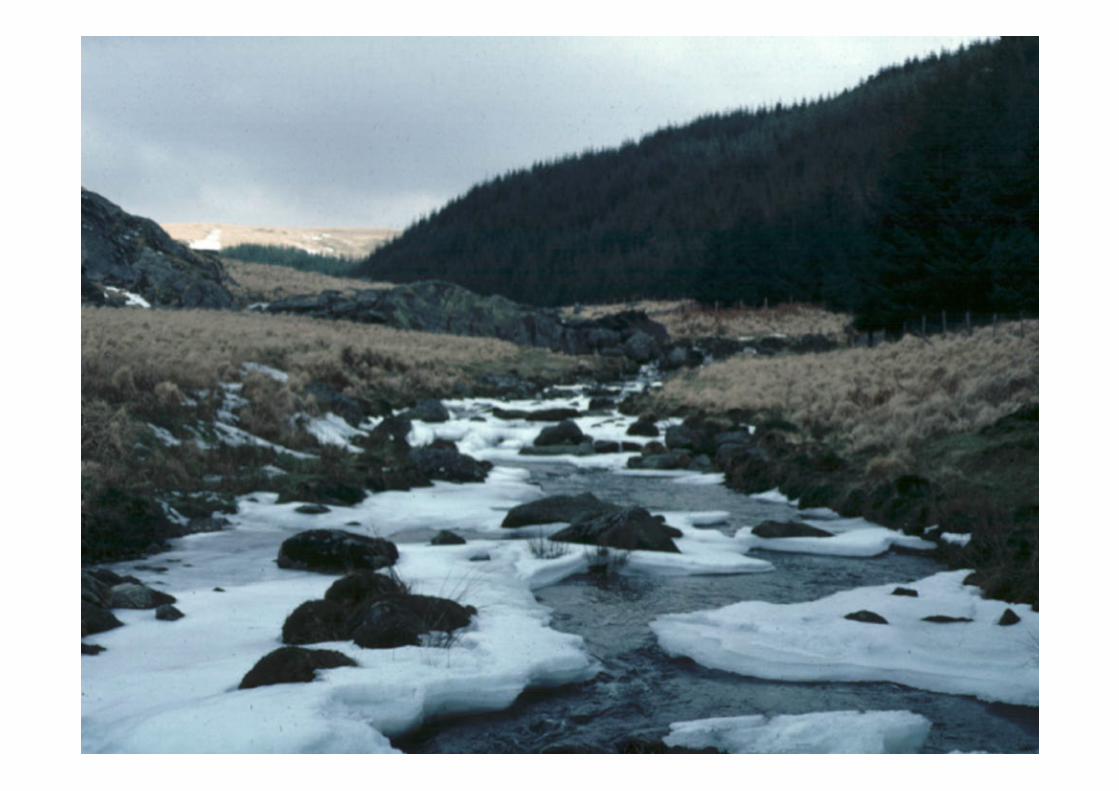
A 25-year study of streams around Llyn Brianne
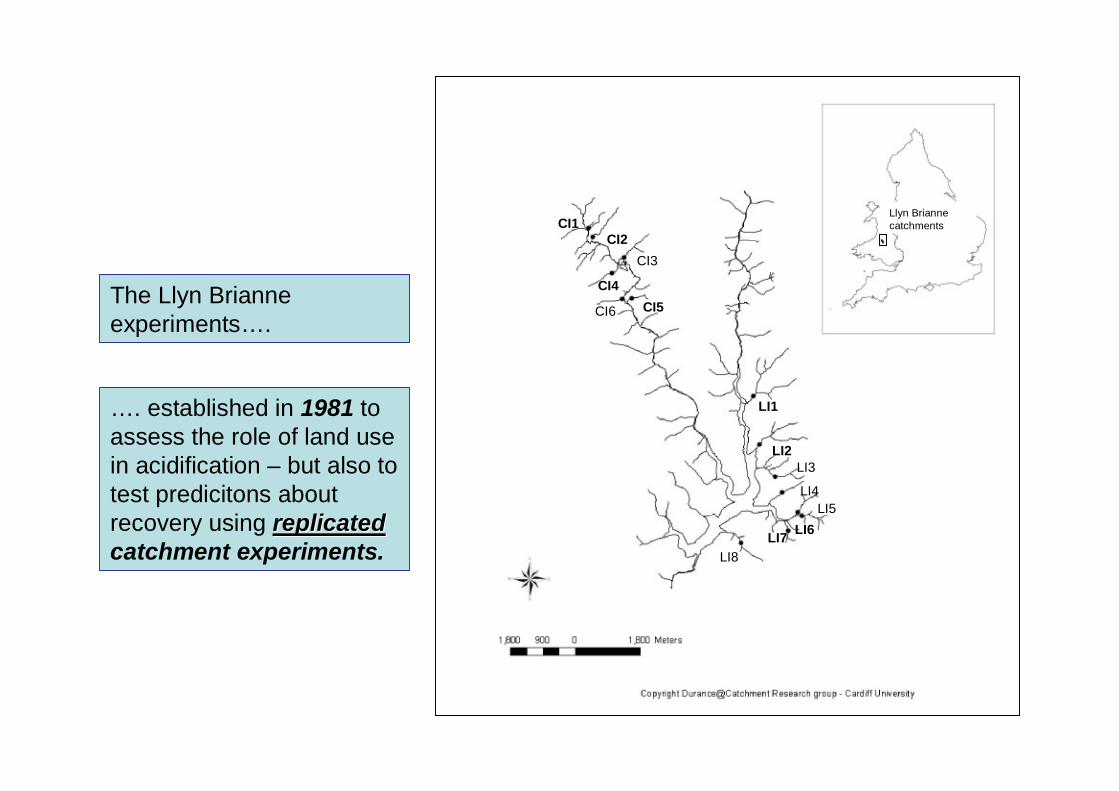
The Llyn Brianneexperiments….
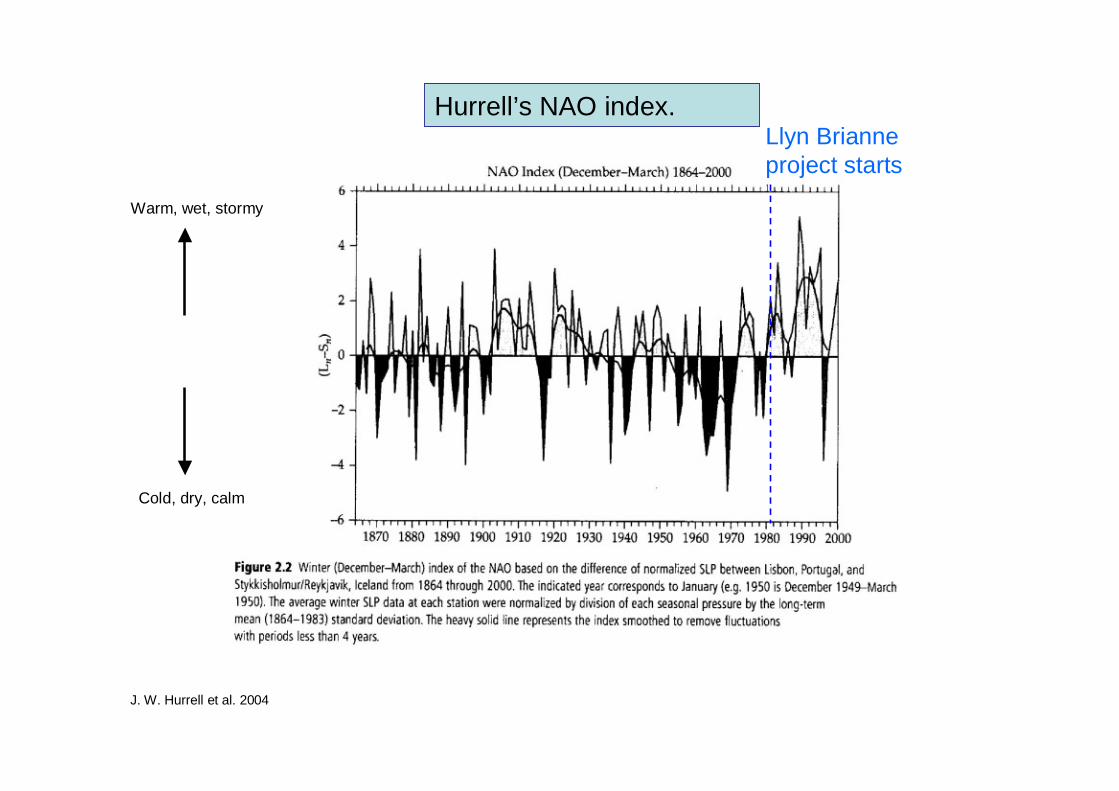
…. established in 1981 to assess the role of land use in acidification – but also to test predicitons about recovery using replicatedreplicatedcatchment experiments.
LI1
LI2LI3
LI4LI5
LI6LI7LI8
CI1CI2
CI3
CI4CI5CI6
Llyn Brianne sitesLlyn Briannecatchments
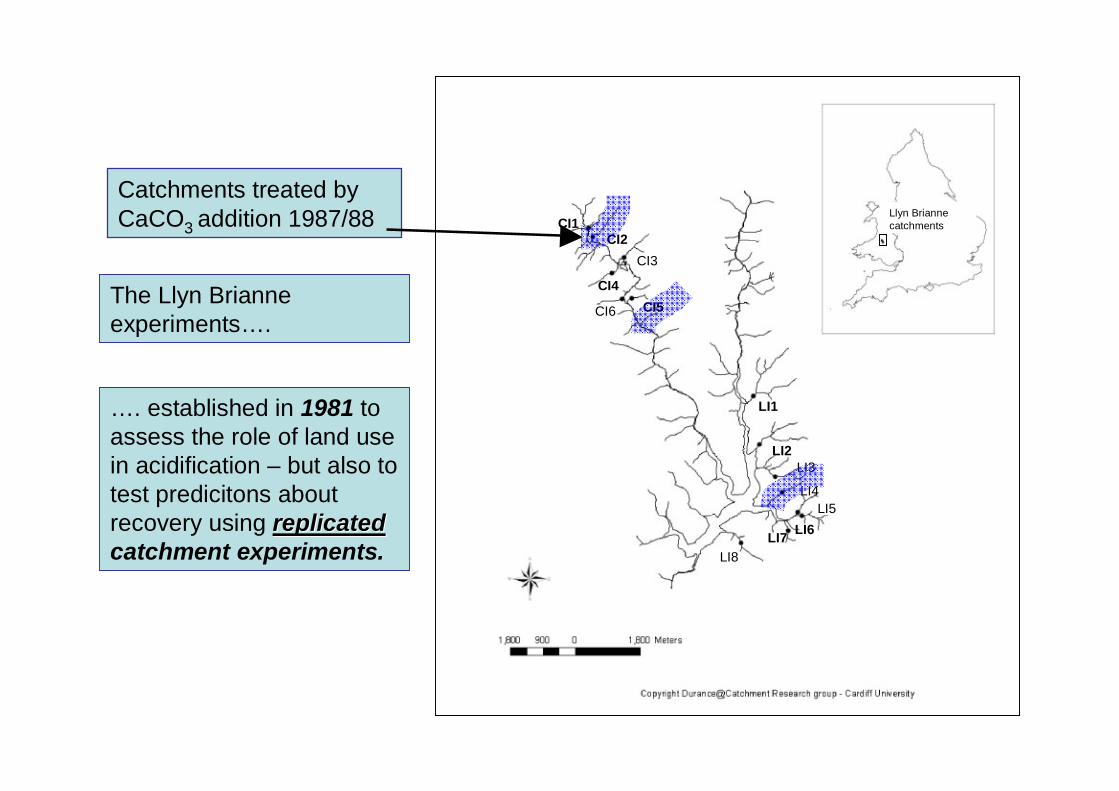
The Llyn Brianneexperiments….
…. established in 1981 to assess the role of land use in acidification – but also to test predicitons about recovery using replicatedreplicatedcatchment experiments.
Catchments treated by CaCO3 addition 1987/88
LI1
LI2LI3
LI4LI5
LI6LI7LI8
CI1CI2
CI3
CI4CI5CI6
Llyn Brianne sitesLlyn Briannecatchments
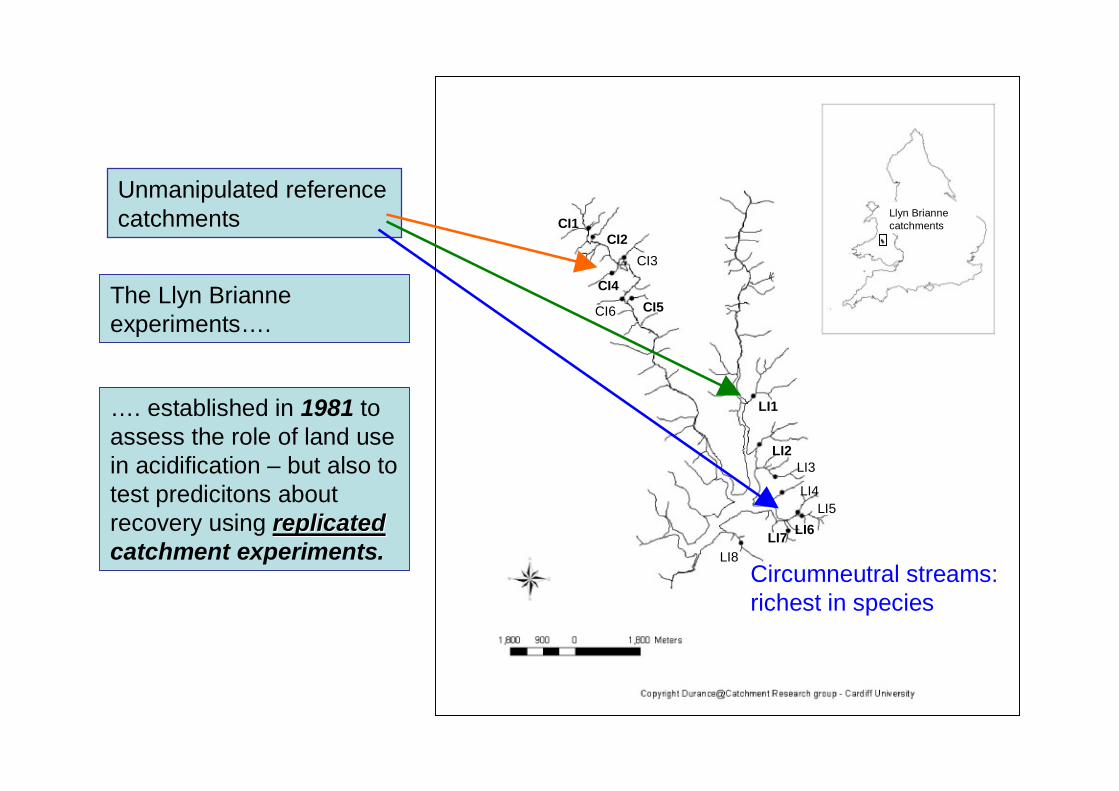
The Llyn Brianneexperiments….
…. established in 1981 to assess the role of land use in acidification – but also to test predicitons about recovery using replicatedreplicatedcatchment experiments.
Unmanipulated referencecatchments
LI1
LI2LI3
LI4LI5
LI6LI7LI8
CI1CI2
CI3
CI4CI5CI6
Llyn Brianne sitesLlyn Briannecatchments
Circumneutral streams: richest in species
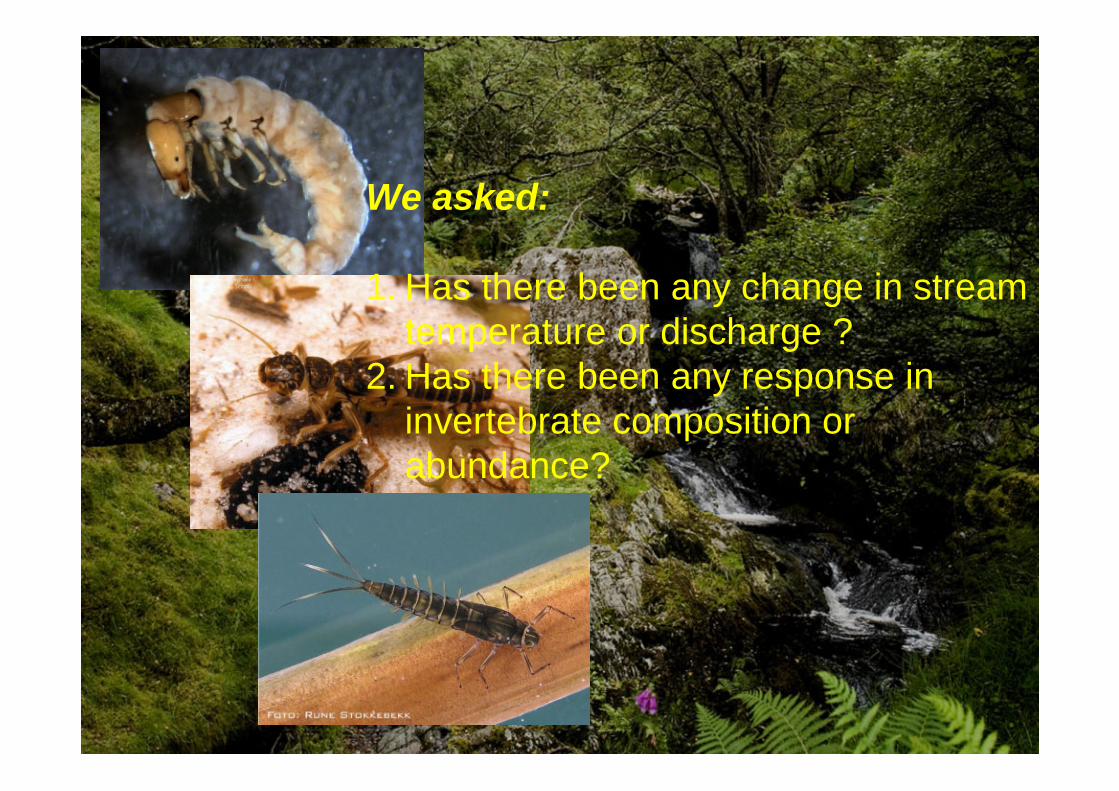
We asked:
1. Has there been any change in stream temperature or discharge ?
2. Has there been any response in invertebrate composition or abundance?

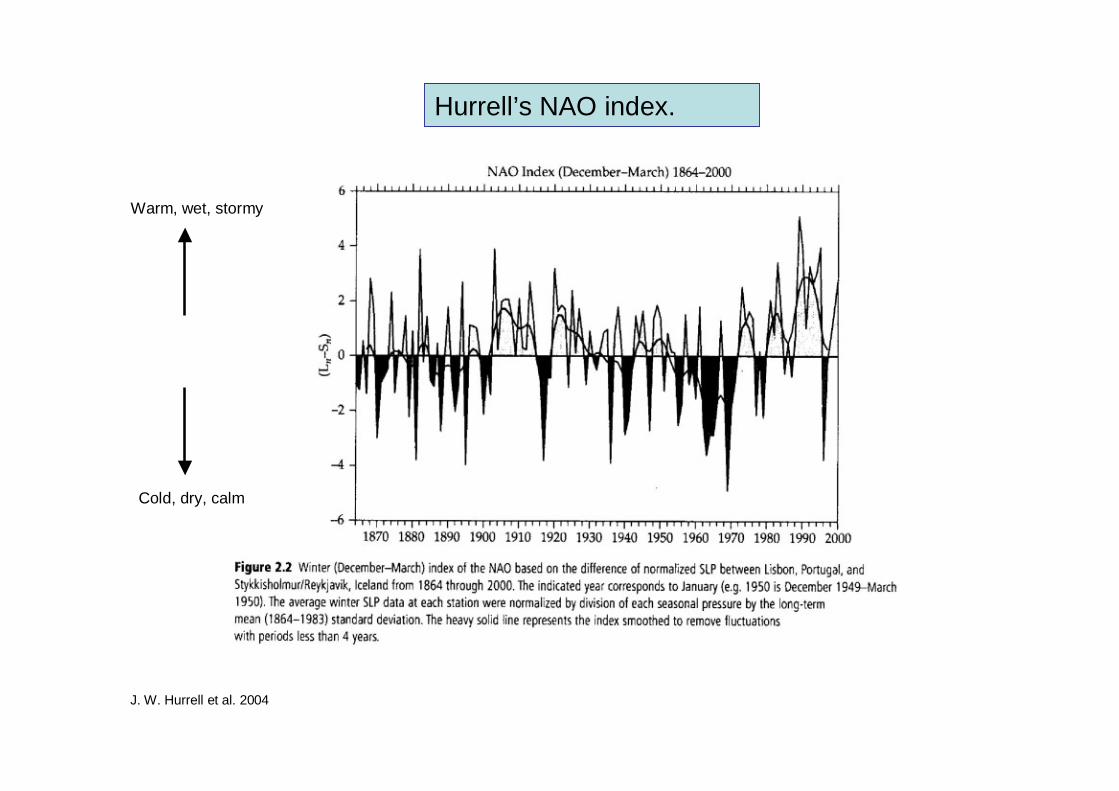
J. W. Hurrell et al. 2004
Hurrell’s NAO index.
Warm, wet, stormy
Cold, dry, calm
J. W. Hurrell et al. 2004
Hurrell’s NAO index.
Warm, wet, stormy
Cold, dry, calm
Positive amplification
J. W. Hurrell et al. 2004
Hurrell’s NAO index.
Warm, wet, stormy
Cold, dry, calm
Llyn Brianneproject starts
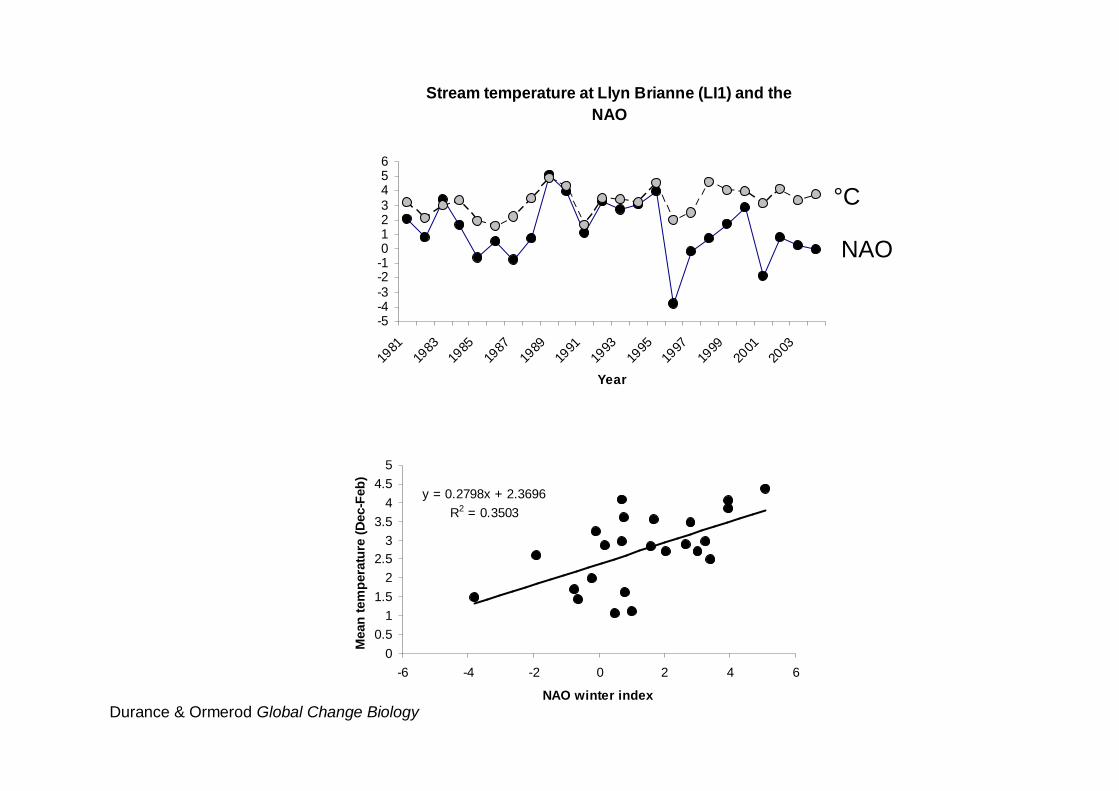
y = 0.2798x + 2.3696R2 = 0.3503
00.5
11.5
22.5
33.5
44.5
5
-6 -4 -2 0 2 4 6
NAO winter index
Mea
n te
mpe
ratu
re (D
ec-F
eb)
Stream temperature at Llyn Brianne (LI1) and the NAO
-5-4-3-2-10123456
1981
1983
1985
1987
1989
1991
1993
1995
1997
1999
2001
2003
Year
Durance & Ormerod Global Change Biology
NAO
°C
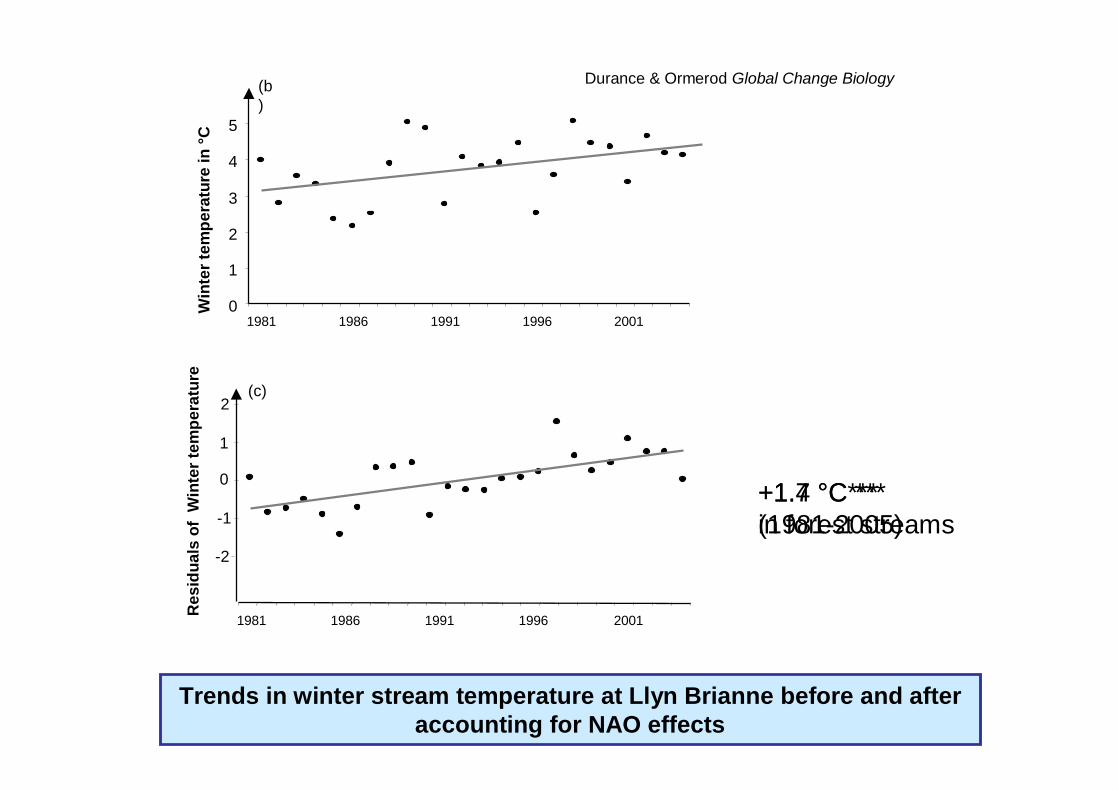
Trends in winter stream temperature at Llyn Brianne before and afteraccounting for NAO effects
0
1
2
3
4
5
1981 1986 1991 1996 2001
Win
ter t
empe
ratu
re in
°C
(b)
-2
-1
0
1
2
1981 1986 1991 1996 2001
Res
idua
ls o
f W
inte
r tem
pera
ture
(c)
+1.7 °C *** (1981-2005)
Durance & Ormerod Global Change Biology
+1.4 °C*** in forest streams
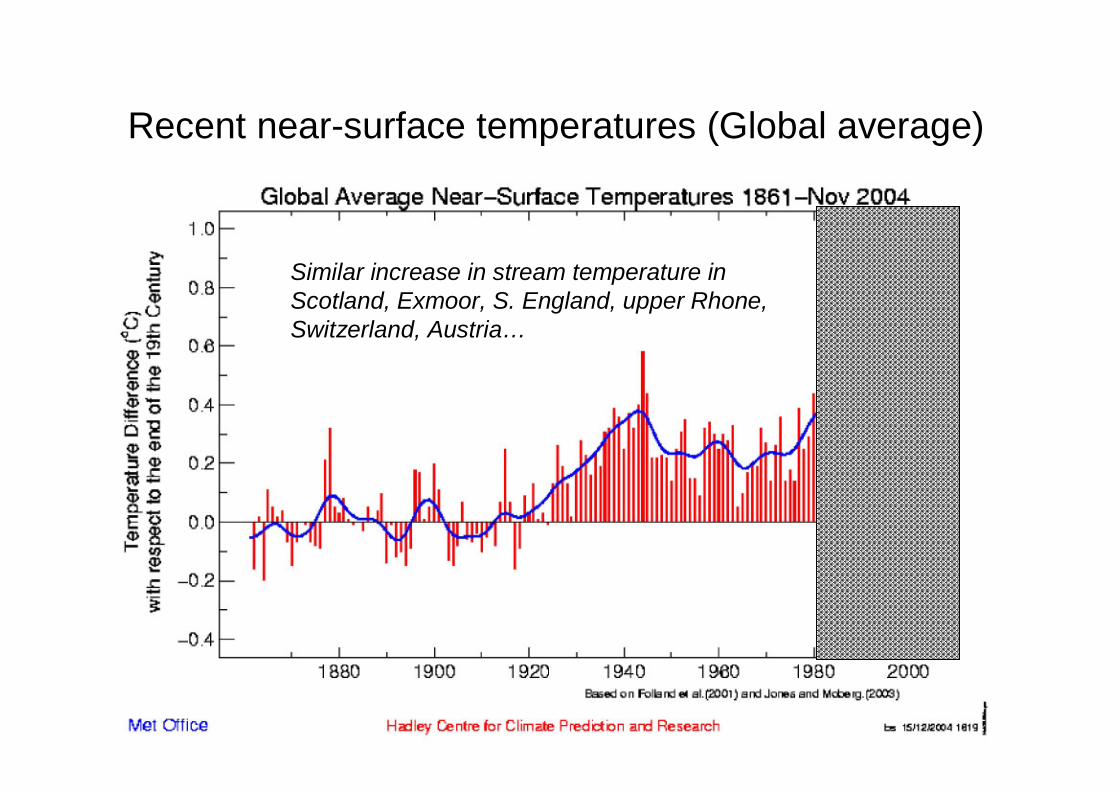
Recent near-surface temperatures (Global average)
Similar increase in stream temperature in Scotland, Exmoor, S. England, upper Rhone, Switzerland, Austria…
0.200
0.400
0.600
0.800
1.000
1.200
1.400
1.600
1.800
1981
1983
1985
1987
1989
1991
1993
1995
1997
1999
2001
2003
1990-2020
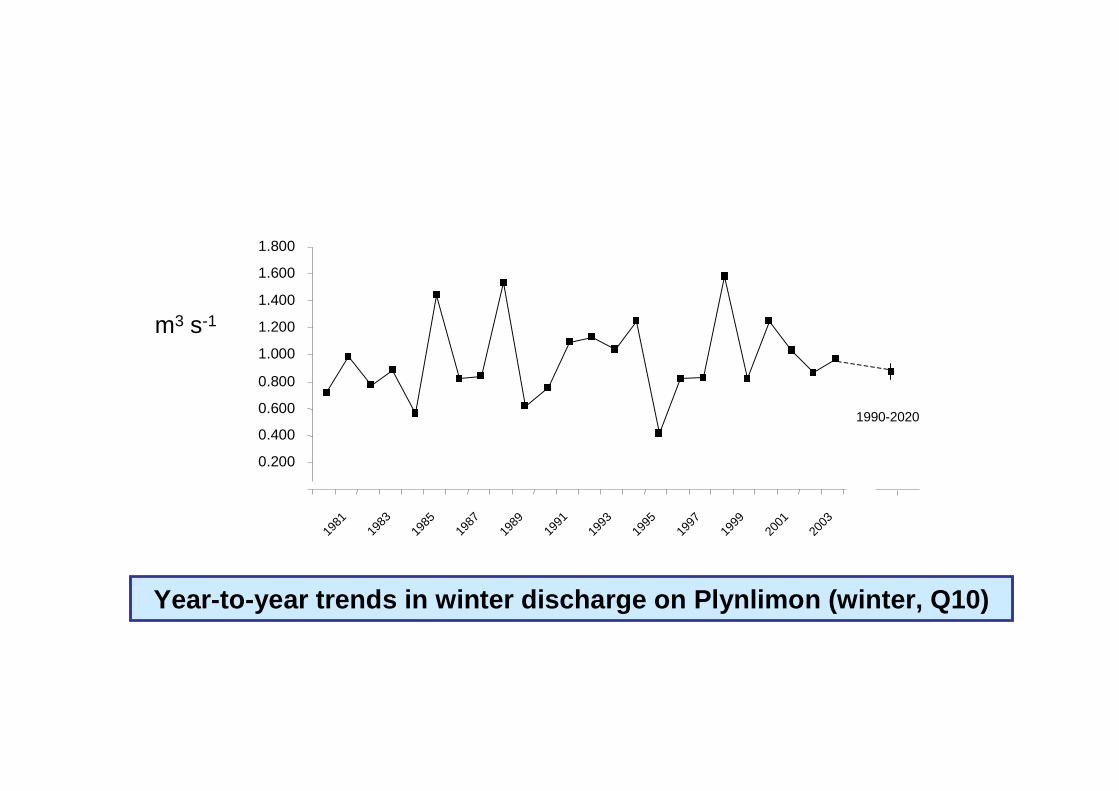
Year-to-year trends in winter discharge on Plynlimon (winter, Q10)
m3 s-1
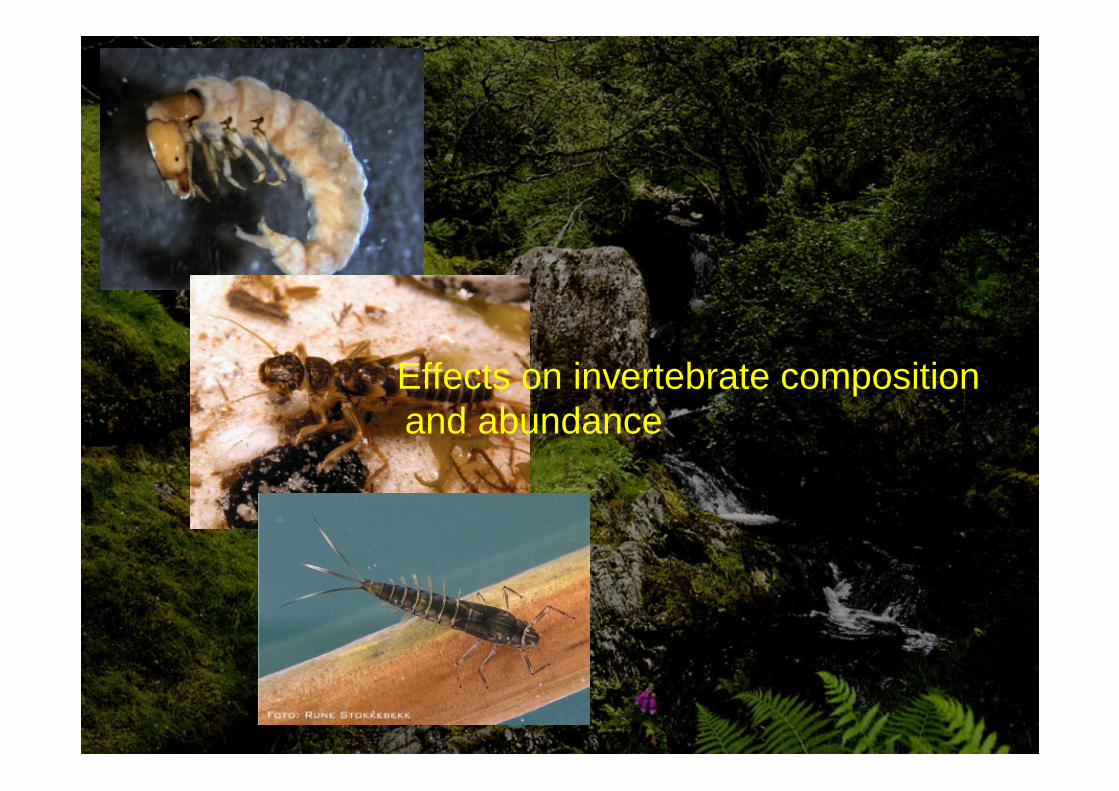
Effects on invertebrate composition and abundance
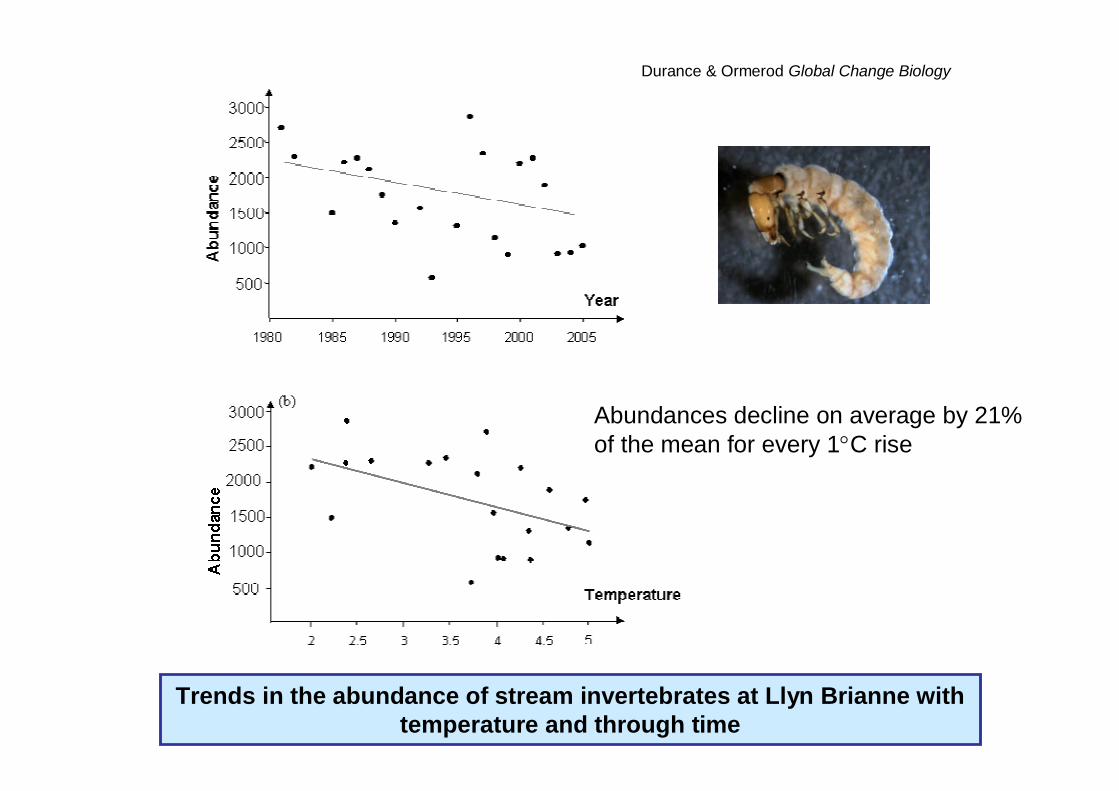
Trends in the abundance of stream invertebrates at Llyn Brianne withtemperature and through time
Abundances decline on average by 21% of the mean for every 1C rise
Durance & Ormerod Global Change Biology
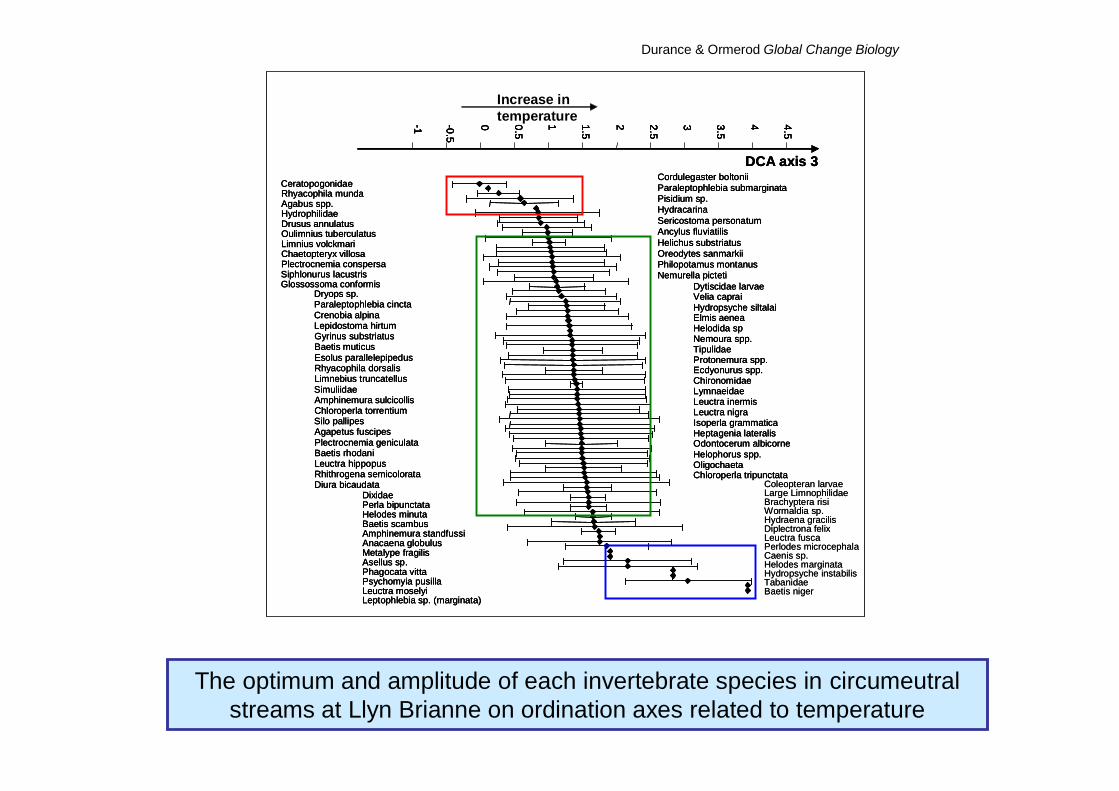
Coleopteran larvaeLarge LimnophilidaeBrachyptera risiWormaldia sp.Hydraena gracilisDiplectrona felixLeuctra fuscaPerlodes microcephalaCaenis sp.Helodes marginataHydropsyche instabilisTabanidaeBaetis niger
Cordulegaster boltoniiParaleptophlebia submarginataPisidium sp.HydracarinaSericostoma personatumAncylus fluviatilisHelichus substriatusOreodytes sanmarkiiPhilopotamus montanusNemurella picteti
CeratopogonidaeRhyacophila mundaAgabus spp.HydrophilidaeDrusus annulatusOulimnius tuberculatusLimnius volckmariChaetopteryx villosaPlectrocnemia conspersaSiphlonurus lacustrisGlossossoma conformis Dytiscidae larvae
Velia capraiHydropsyche siltalaiElmis aeneaHelodida spNemoura spp.TipulidaeProtonemura spp.Ecdyonurus spp.ChironomidaeLymnaeidaeLeuctra inermisLeuctra nigraIsoperla grammaticaHeptagenia lateralisOdontocerum albicorneHelophorus spp.OligochaetaChloroperla tripunctata
Dryops sp.Paraleptophlebia cinctaCrenobia alpinaLepidostoma hirtumGyrinus substriatusBaetis muticusEsolus parallelepipedusRhyacophila dorsalisLimnebius truncatellusSimuliidaeAmphinemura sulcicollisChloroperla torrentiumSilo pallipesAgapetus fuscipesPlectrocnemia geniculataBaetis rhodaniLeuctra hippopusRhithrogena semicolorataDiura bicaudata
DixidaePerla bipunctataHelodes minutaBaetis scambusAmphinemura standfussiAnacaena globulusMetalype fragilisAsellus sp.Phagocata vittaPsychomyia pusillaLeuctra moselyiLeptophlebia sp. (marginata)
-1 -0.5
0 0.5
1 1.5
2 2.5
3 3.5
4 4.5
DCA axis 3
Coleopteran larvaeLarge LimnophilidaeBrachyptera risiWormaldia sp.Hydraena gracilisDiplectrona felixLeuctra fuscaPerlodes microcephalaCaenis sp.Helodes marginataHydropsyche instabilisTabanidaeBaetis niger
Cordulegaster boltoniiParaleptophlebia submarginataPisidium sp.HydracarinaSericostoma personatumAncylus fluviatilisHelichus substriatusOreodytes sanmarkiiPhilopotamus montanusNemurella picteti
Cordulegaster boltoniiParaleptophlebia submarginataPisidium sp.HydracarinaSericostoma personatumAncylus fluviatilisHelichus substriatusOreodytes sanmarkiiPhilopotamus montanusNemurella picteti
CeratopogonidaeRhyacophila mundaAgabus spp.HydrophilidaeDrusus annulatusOulimnius tuberculatusLimnius volckmariChaetopteryx villosaPlectrocnemia conspersaSiphlonurus lacustrisGlossossoma conformis
CeratopogonidaeRhyacophila mundaAgabus spp.HydrophilidaeDrusus annulatusOulimnius tuberculatusLimnius volckmariChaetopteryx villosaPlectrocnemia conspersaSiphlonurus lacustrisGlossossoma conformis Dytiscidae larvae
Velia capraiHydropsyche siltalaiElmis aeneaHelodida spNemoura spp.TipulidaeProtonemura spp.Ecdyonurus spp.ChironomidaeLymnaeidaeLeuctra inermisLeuctra nigraIsoperla grammaticaHeptagenia lateralisOdontocerum albicorneHelophorus spp.OligochaetaChloroperla tripunctata
Dytiscidae larvaeVelia capraiHydropsyche siltalaiElmis aeneaHelodida spNemoura spp.TipulidaeProtonemura spp.Ecdyonurus spp.ChironomidaeLymnaeidaeLeuctra inermisLeuctra nigraIsoperla grammaticaHeptagenia lateralisOdontocerum albicorneHelophorus spp.OligochaetaChloroperla tripunctata
Dryops sp.Paraleptophlebia cinctaCrenobia alpinaLepidostoma hirtumGyrinus substriatusBaetis muticusEsolus parallelepipedusRhyacophila dorsalisLimnebius truncatellusSimuliidaeAmphinemura sulcicollisChloroperla torrentiumSilo pallipesAgapetus fuscipesPlectrocnemia geniculataBaetis rhodaniLeuctra hippopusRhithrogena semicolorataDiura bicaudata
Dryops sp.Paraleptophlebia cinctaCrenobia alpinaLepidostoma hirtumGyrinus substriatusBaetis muticusEsolus parallelepipedusRhyacophila dorsalisLimnebius truncatellusSimuliidaeAmphinemura sulcicollisChloroperla torrentiumSilo pallipesAgapetus fuscipesPlectrocnemia geniculataBaetis rhodaniLeuctra hippopusRhithrogena semicolorataDiura bicaudata
DixidaePerla bipunctataHelodes minutaBaetis scambusAmphinemura standfussiAnacaena globulusMetalype fragilisAsellus sp.Phagocata vittaPsychomyia pusillaLeuctra moselyiLeptophlebia sp. (marginata)
DixidaePerla bipunctataHelodes minutaBaetis scambusAmphinemura standfussiAnacaena globulusMetalype fragilisAsellus sp.Phagocata vittaPsychomyia pusillaLeuctra moselyiLeptophlebia sp. (marginata)
-1 -0.5
0 0.5
1 1.5
2 2.5
3 3.5
4 4.5
DCA axis 3
-1 -0.5
0 0.5
1 1.5
2 2.5
3 3.5
4 4.5
-1 -0.5
0 0.5
1 1.5
2 2.5
3 3.5
4 4.5
DCA axis 3
Increase in temperature
The optimum and amplitude of each invertebrate species in circumeutralstreams at Llyn Brianne on ordination axes related to temperature
Durance & Ormerod Global Change Biology
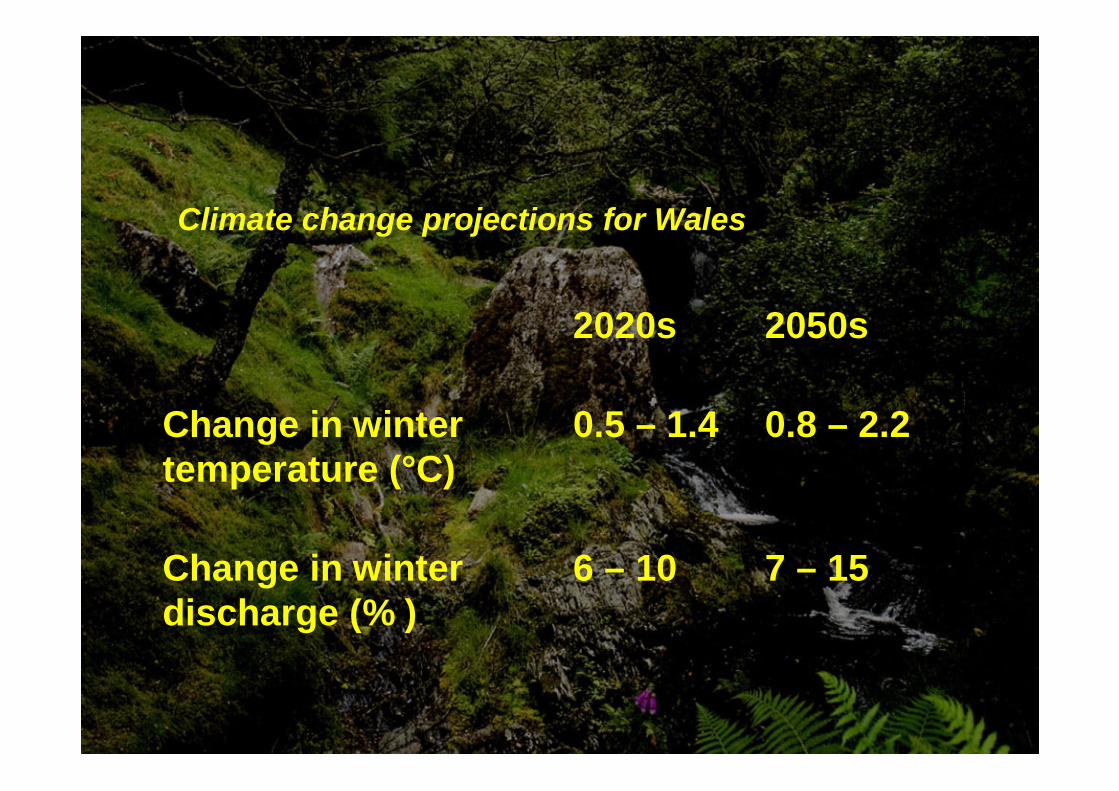
Climate change projections for Wales
7 – 156 – 10Change in winter discharge (% )
0.8 – 2.20.5 – 1.4Change in winter temperature (°C)
2050s2020s
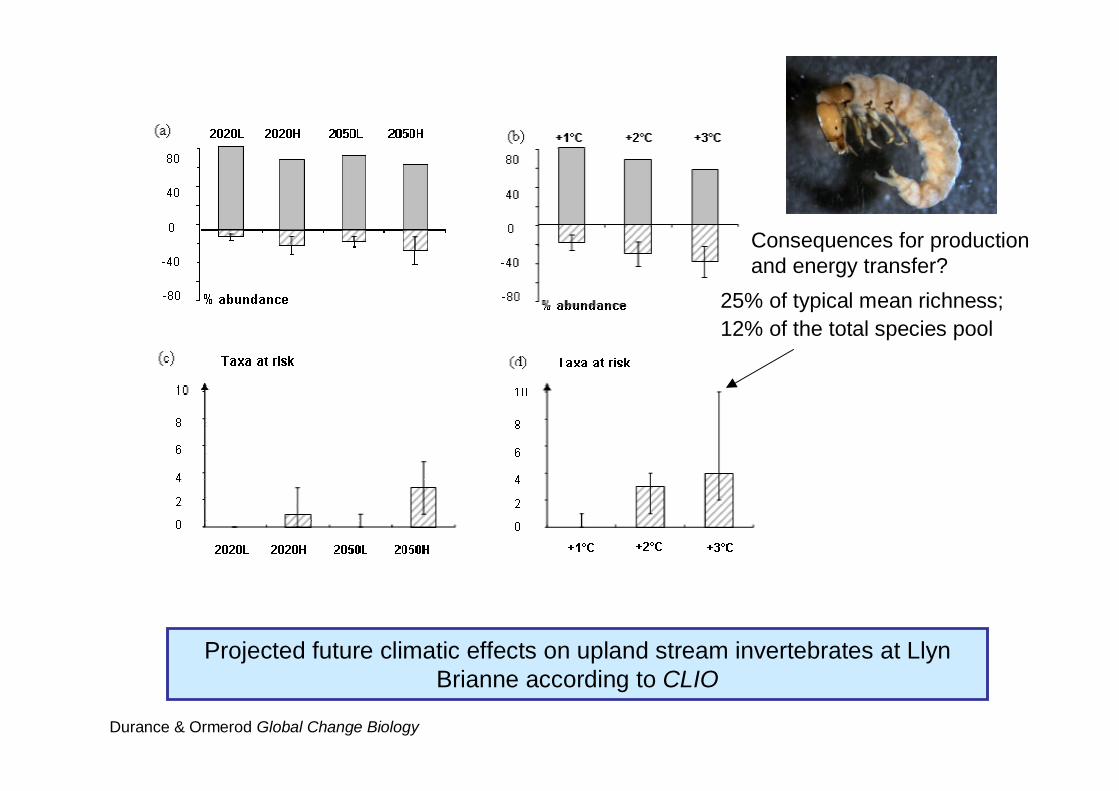
Projected future climatic effects on upland stream invertebrates at LlynBrianne according to CLIO
25% of typical mean richness; 12% of the total species pool
Consequences for productionand energy transfer?
Durance & Ormerod Global Change Biology
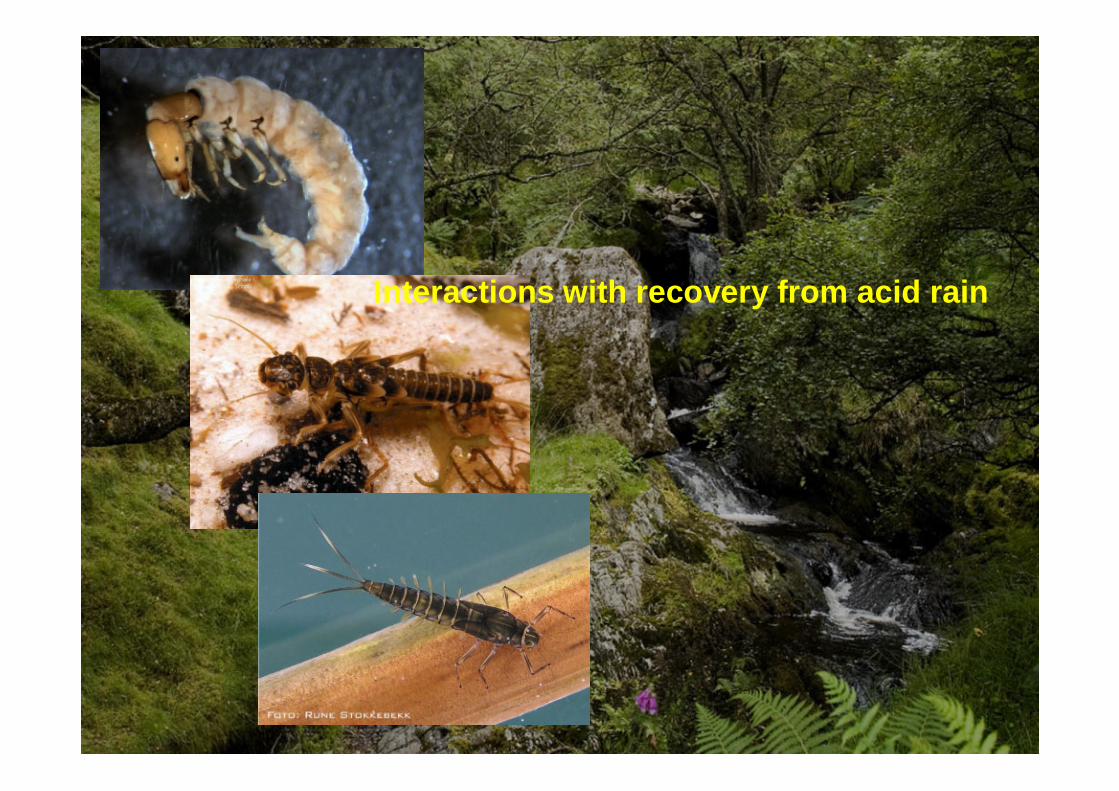
Interactions with recovery from acid rain
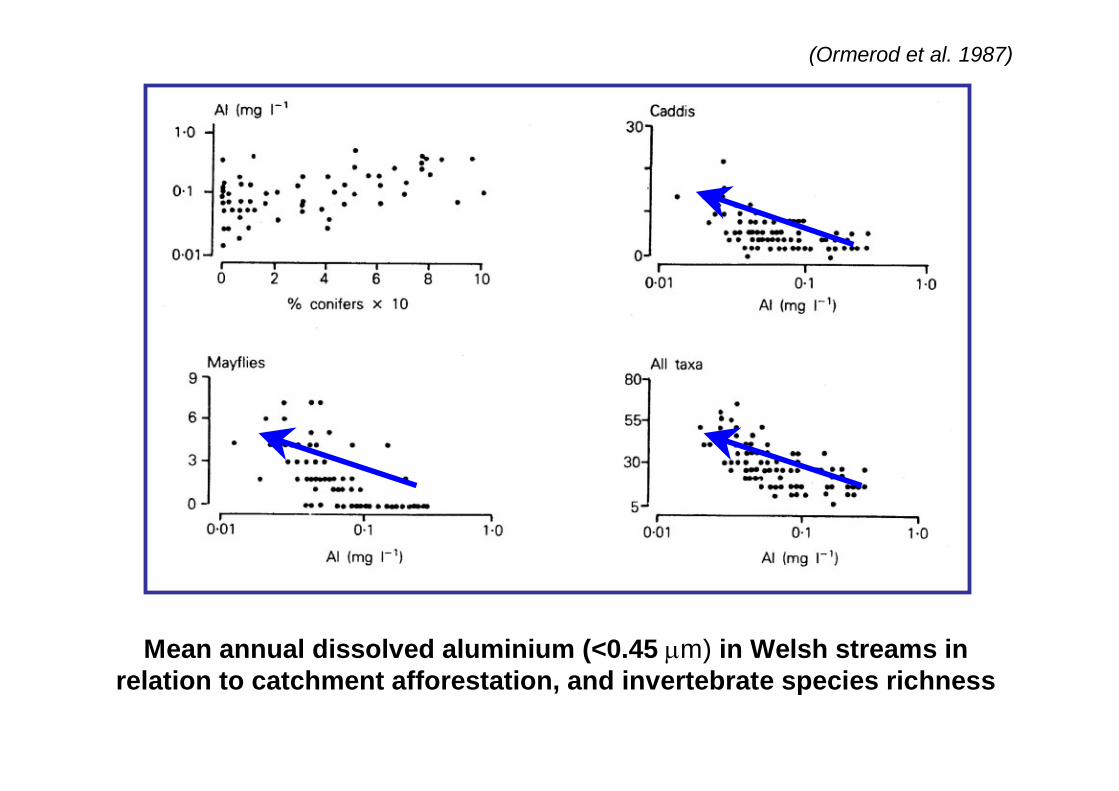
Mean annual dissolved aluminium (<0.45 m) in Welsh streams in relation to catchment afforestation, and invertebrate species richness
(Ormerod et al. 1987)
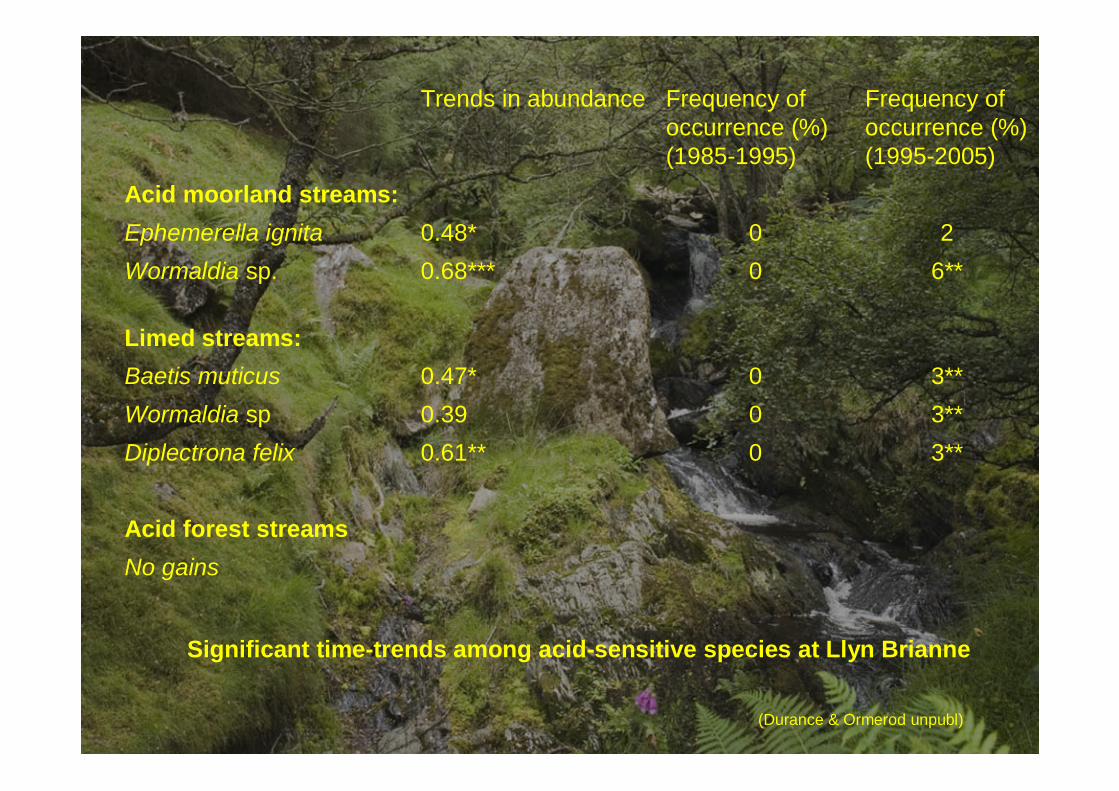
Acid forest streams
3**00.61**Diplectrona felix
No gains
3**00.39Wormaldia sp3**00.47*Baetis muticus
Limed streams:
6**00.68***Wormaldia sp.200.48*Ephemerella ignita
Acid moorland streams:
Frequency of occurrence (%)(1995-2005)
Frequency of occurrence (%)(1985-1995)
Trends in abundance
Significant time-trends among acid-sensitive species at Llyn Brianne
(Durance & Ormerod unpubl)
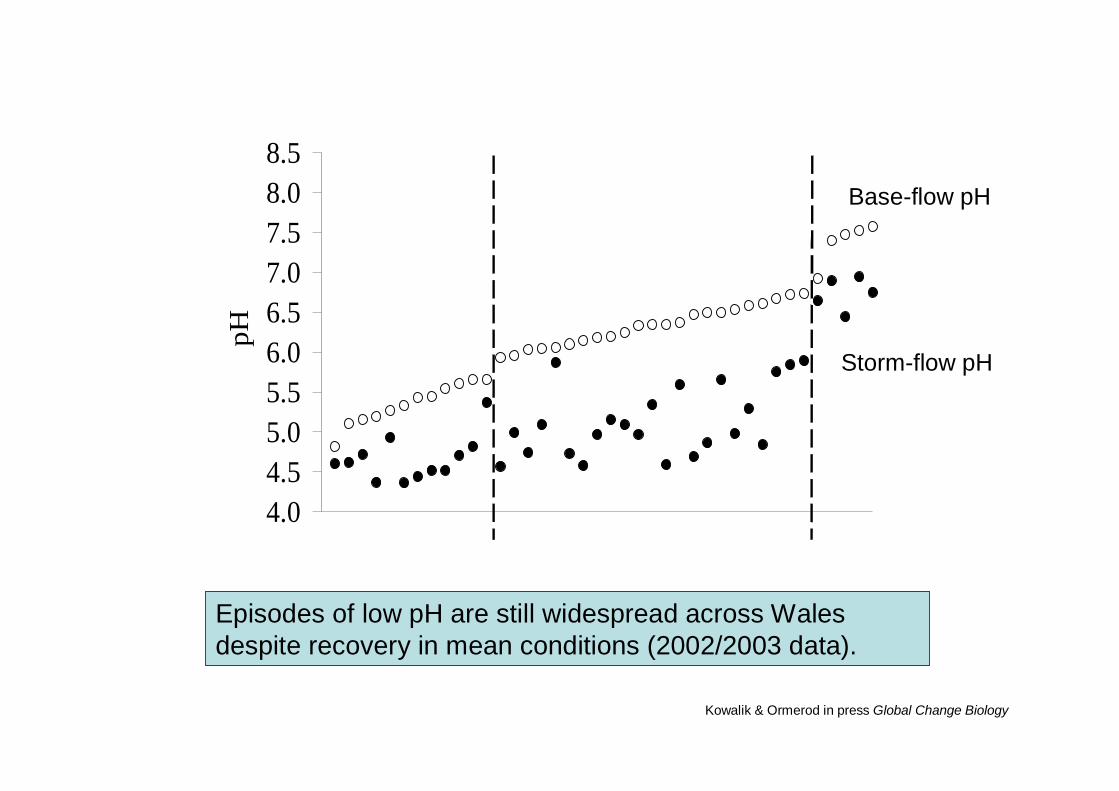
4.04.55.05.56.06.57.07.58.08.5
pH
Kowalik & Ormerod in press Global Change Biology
Episodes of low pH are still widespread across Wales despite recovery in mean conditions (2002/2003 data).
Base-flow pH
Storm-flow pH
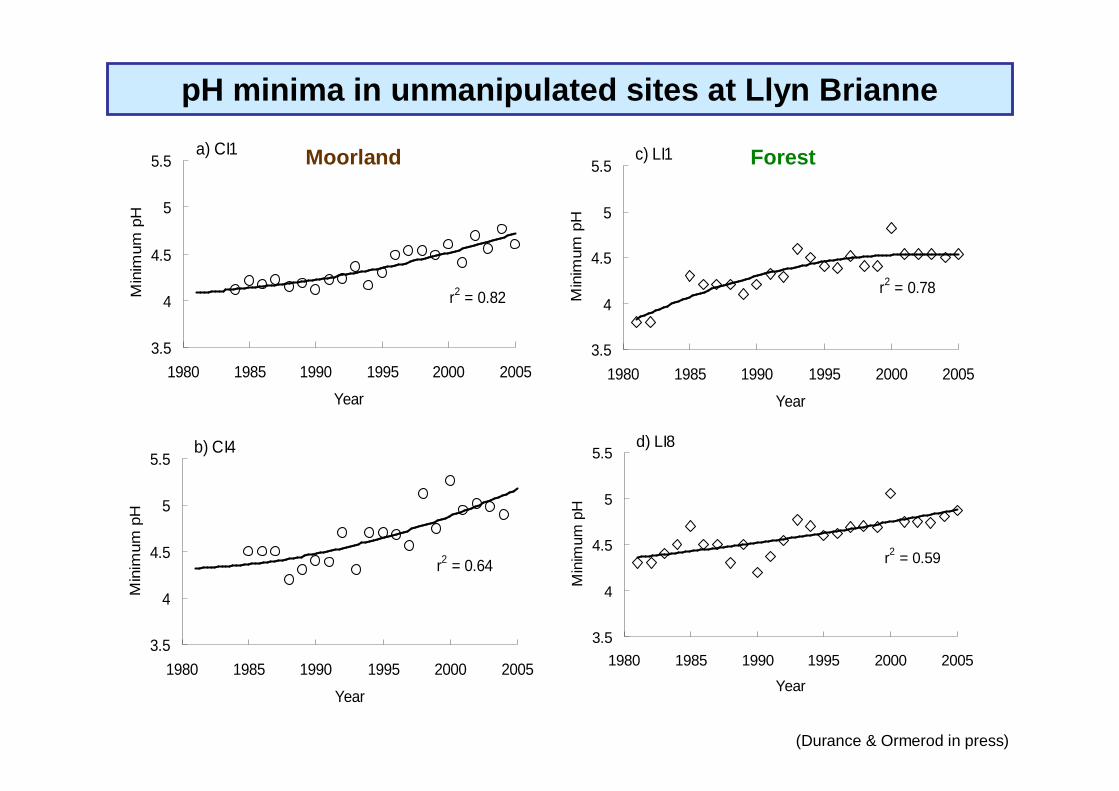
r2 = 0.82
3.5
4
4.5
5
5.5
1980 1985 1990 1995 2000 2005
Year
Min
imum
pH
a) CI1
r2 = 0.64
3.5
4
4.5
5
5.5
1980 1985 1990 1995 2000 2005
Year
Min
imum
pH
b) CI4
r2 = 0.78
3.5
4
4.5
5
5.5
1980 1985 1990 1995 2000 2005
Year
Min
imum
pH
c) LI1
r2 = 0.59
3.5
4
4.5
5
5.5
1980 1985 1990 1995 2000 2005Year
Min
imum
pH
d) LI8
ForestMoorland
pH minima in unmanipulated sites at Llyn Brianne
(Durance & Ormerod in press)
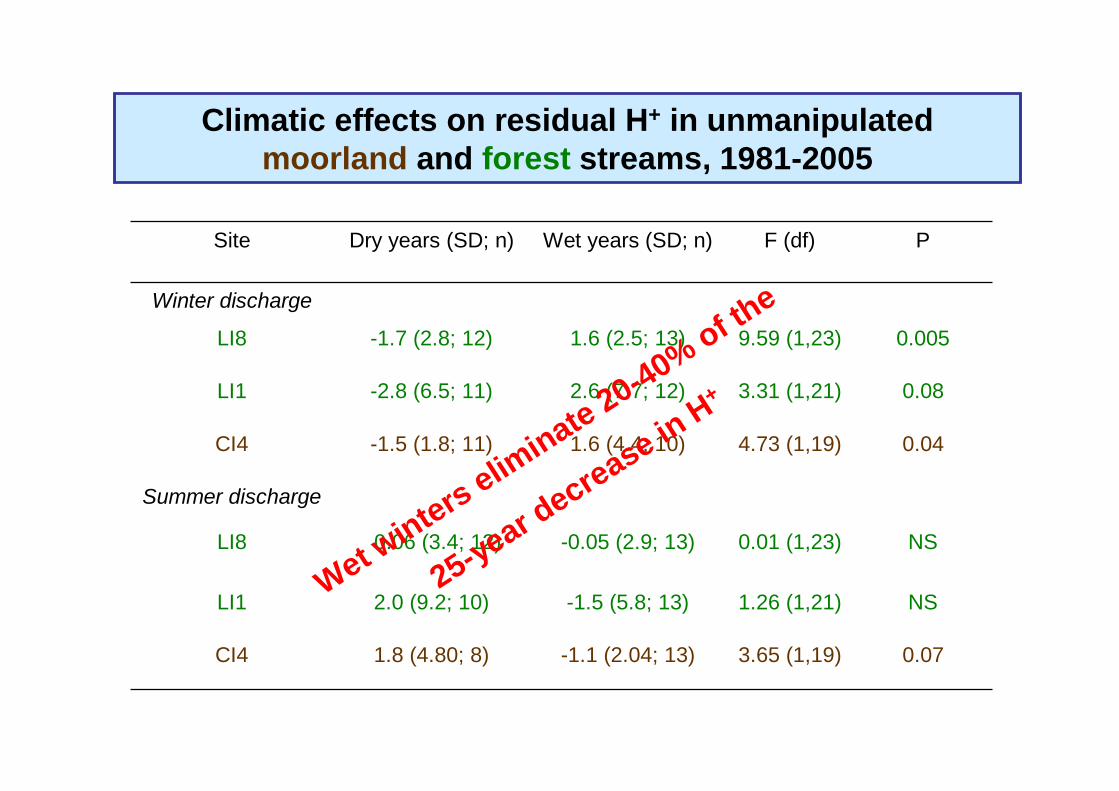
Summer discharge
Winter discharge
0.073.65 (1,19)-1.1 (2.04; 13)1.8 (4.80; 8)CI4
NS1.26 (1,21)-1.5 (5.8; 13)2.0 (9.2; 10)LI1
NS0.01 (1,23)-0.05 (2.9; 13)0.06 (3.4; 12)LI8
0.044.73 (1,19)1.6 (4.4; 10)-1.5 (1.8; 11)CI4
0.083.31 (1,21)2.6 (7.7; 12)-2.8 (6.5; 11)LI1
0.0059.59 (1,23)1.6 (2.5; 13)-1.7 (2.8; 12)LI8
PF (df)Wet years (SD; n)Dry years (SD; n)Site
Climatic effects on residual H+ in unmanipulatedmoorland and forest streams, 1981-2005
Wet winters elim
inate 20-40% of the
25-year decrease in H+
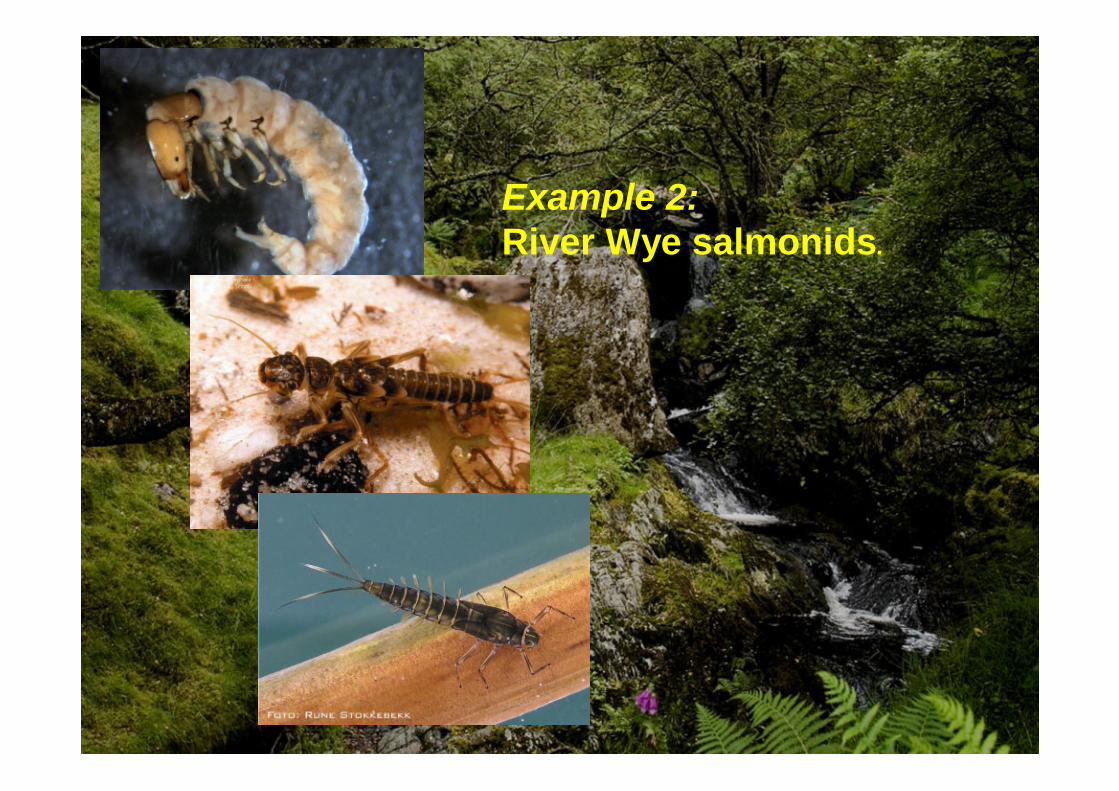
Example 2:River Wye salmonids.
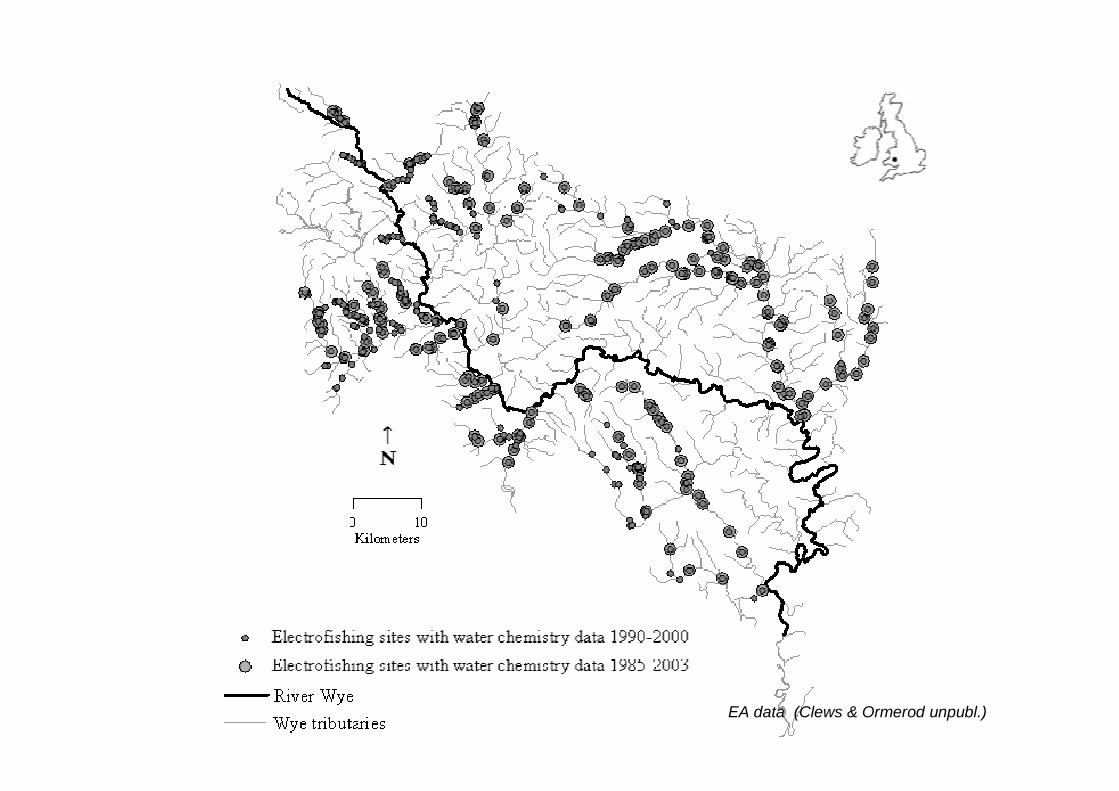
EA data (Clews & Ormerod unpubl.)
Rel
ativ
e D
ensi
ty
0.5
1.0
Trou
t juv
enile
1985
1986
1987
1988
1989
1990
1991
1992
1993
1994
1995
1997
1998
1999
2000
2002
2003
2004
Year
-1.0
-0.5
0.0
0.5
1.0
1.5
1985
1986
1987
1988
1989
1990
1991
1992
1993
1994
1995
1997
1998
1999
2000
2002
2003
2004
Year
Salm
on ju
veni
le
-1.0
-0.5
0.0
0.519
85
1986
1987
1988
1989
1990
1991
1992
1993
1994
1995
1997
1998
1999
2000
2002
2003
2004
Year
Trou
t fry
0.0
0.5
1.0
Trou
t juv
enile
N= 90 91 53 51 57 59 59 69 148 44 57 123 82 102 17 39 139 35
N= 92 93 55 53 58 60 61 72 151 47 59 126 82 105 17 39 145 35
1985
1986
1987
1988
1989
1990
1991
1992
1993
1994
1995
1997
1998
1999
2000
2002
2003
2004
Year
-1.0
-0.5
0.0
0.5
1.0
1.5
1985
1986
1987
1988
1989
1990
1991
1992
1993
1994
1995
1997
1998
1999
2000
2002
2003
2004
Year
Salm
on ju
veni
le
-1.0
-0.5
0.0
0.519
85
1986
1987
1988
1989
1990
1991
1992
1993
1994
1995
1997
1998
1999
2000
2002
2003
2004
Year
Trou
t fry
0.0
0.5
1.0
Trou
t juv
enile
N= 90 91 53 51 57 59 59 69 148 44 57 123 82 102 17 39 139 35
N= 92 93 55 53 58 60 61 72 151 47 59 126 82 105 17 39 145 35
Rel
ativ
e D
ensi
ty
-1.0
-0.5
0.0
0.5
1.0
1985
1986
1987
1988
1989
1990
1991
1992
1993
1994
1995
1997
1998
1999
2000
2002
2003
2004
Year
Trou
t juv
enile
1985
1986
1987
1988
1989
1990
1991
1992
1993
1994
1995
1997
1998
1999
2000
2002
2003
2004
Year
-1.0
-0.5
0.0
0.5
1985
1986
1987
1988
1989
1990
1991
1992
1993
1994
1995
1997
1998
1999
2000
2002
2003
2004
Year
Trou
t fry
-1.0
-0.5
0.0
0.5
1.019
85
1986
1987
1988
1989
1990
1991
1992
1993
1994
1995
1997
1998
1999
2000
2002
2003
2004
Year
Trou
t juv
enile
N= 90 91 53 51 57 59 59 69 148 44 57 123 82 102 17 39 139 35
N= 92 93 55 53 58 60 61 72 151 47 59 126 82 105 17 39 145 35
N= 92 93 55 53 58 60 61 72 151 47 59 126 82 105 17 39 145 35
1985
1986
1987
1988
1989
1990
1991
1992
1993
1994
1995
1997
1998
1999
2000
2002
2003
2004
Year
-1.0
-0.5
0.0
0.5
1985
1986
1987
1988
1989
1990
1991
1992
1993
1994
1995
1997
1998
1999
2000
2002
2003
2004
Year
Trou
t fry
-1.0
-0.5
0.0
0.5
1.019
85
1986
1987
1988
1989
1990
1991
1992
1993
1994
1995
1997
1998
1999
2000
2002
2003
2004
Year
Trou
t juv
enile
N= 90 91 53 51 57 59 59 69 148 44 57 123 82 102 17 39 139 35
N= 92 93 55 53 58 60 61 72 151 47 59 126 82 105 17 39 145 35
N= 92 93 55 53 58 60 61 72 151 47 59 126 82 105 17 39 145 35
Rel
ativ
e D
ensi
ty
0.5
1.0
Trou
t juv
enile
1985
1986
1987
1988
1989
1990
1991
1992
1993
1994
1995
1997
1998
1999
2000
2002
2003
2004
Year
-1.0
-0.5
0.0
0.5
1.0
1.5
1985
1986
1987
1988
1989
1990
1991
1992
1993
1994
1995
1997
1998
1999
2000
2002
2003
2004
Year
Salm
on ju
veni
le
-1.0
-0.5
0.0
0.519
85
1986
1987
1988
1989
1990
1991
1992
1993
1994
1995
1997
1998
1999
2000
2002
2003
2004
Year
Trou
t fry
0.0
0.5
1.0
Trou
t juv
enile
N= 90 91 53 51 57 59 59 69 148 44 57 123 82 102 17 39 139 35
N= 92 93 55 53 58 60 61 72 151 47 59 126 82 105 17 39 145 35
Rel
ativ
e D
ensi
ty
0.5
1.0
Trou
t juv
enile
1985
1986
1987
1988
1989
1990
1991
1992
1993
1994
1995
1997
1998
1999
2000
2002
2003
2004
Year
-1.0
-0.5
0.0
0.5
1.0
1.5
1985
1986
1987
1988
1989
1990
1991
1992
1993
1994
1995
1997
1998
1999
2000
2002
2003
2004
Year
Salm
on ju
veni
le
-1.0
-0.5
0.0
0.519
85
1986
1987
1988
1989
1990
1991
1992
1993
1994
1995
1997
1998
1999
2000
2002
2003
2004
Year
Trou
t fry
0.0
0.5
1.0
Trou
t juv
enile
N= 90 91 53 51 57 59 59 69 148 44 57 123 82 102 17 39 139 35
N= 92 93 55 53 58 60 61 72 151 47 59 126 82 105 17 39 145 35
1985
1986
1987
1988
1989
1990
1991
1992
1993
1994
1995
1997
1998
1999
2000
2002
2003
2004
Year
-1.0
-0.5
0.0
0.5
1.0
1.5
1985
1986
1987
1988
1989
1990
1991
1992
1993
1994
1995
1997
1998
1999
2000
2002
2003
2004
Year
Salm
on ju
veni
le
-1.0
-0.5
0.0
0.519
85
1986
1987
1988
1989
1990
1991
1992
1993
1994
1995
1997
1998
1999
2000
2002
2003
2004
Year
Trou
t fry
0.0
0.5
1.0
Trou
t juv
enile
N= 90 91 53 51 57 59 59 69 148 44 57 123 82 102 17 39 139 35
N= 92 93 55 53 58 60 61 72 151 47 59 126 82 105 17 39 145 35
Rel
ativ
e D
ensi
ty
-1.0
-0.5
0.0
0.5
1.0
1985
1986
1987
1988
1989
1990
1991
1992
1993
1994
1995
1997
1998
1999
2000
2002
2003
2004
Year
Trou
t juv
enile
1985
1986
1987
1988
1989
1990
1991
1992
1993
1994
1995
1997
1998
1999
2000
2002
2003
2004
Year
-1.0
-0.5
0.0
0.5
1985
1986
1987
1988
1989
1990
1991
1992
1993
1994
1995
1997
1998
1999
2000
2002
2003
2004
Year
Trou
t fry
-1.0
-0.5
0.0
0.5
1.019
85
1986
1987
1988
1989
1990
1991
1992
1993
1994
1995
1997
1998
1999
2000
2002
2003
2004
Year
Trou
t juv
enile
N= 90 91 53 51 57 59 59 69 148 44 57 123 82 102 17 39 139 35
N= 92 93 55 53 58 60 61 72 151 47 59 126 82 105 17 39 145 35
N= 92 93 55 53 58 60 61 72 151 47 59 126 82 105 17 39 145 35
Rel
ativ
e D
ensi
ty
-1.0
-0.5
0.0
0.5
1.0
1985
1986
1987
1988
1989
1990
1991
1992
1993
1994
1995
1997
1998
1999
2000
2002
2003
2004
Year
Trou
t juv
enile
1985
1986
1987
1988
1989
1990
1991
1992
1993
1994
1995
1997
1998
1999
2000
2002
2003
2004
Year
-1.0
-0.5
0.0
0.5
1985
1986
1987
1988
1989
1990
1991
1992
1993
1994
1995
1997
1998
1999
2000
2002
2003
2004
Year
Trou
t fry
-1.0
-0.5
0.0
0.5
1.019
85
1986
1987
1988
1989
1990
1991
1992
1993
1994
1995
1997
1998
1999
2000
2002
2003
2004
Year
Trou
t juv
enile
N= 90 91 53 51 57 59 59 69 148 44 57 123 82 102 17 39 139 35
N= 92 93 55 53 58 60 61 72 151 47 59 126 82 105 17 39 145 35
N= 92 93 55 53 58 60 61 72 151 47 59 126 82 105 17 39 145 35
1985
1986
1987
1988
1989
1990
1991
1992
1993
1994
1995
1997
1998
1999
2000
2002
2003
2004
Year
-1.0
-0.5
0.0
0.5
1985
1986
1987
1988
1989
1990
1991
1992
1993
1994
1995
1997
1998
1999
2000
2002
2003
2004
Year
Trou
t fry
-1.0
-0.5
0.0
0.5
1.019
85
1986
1987
1988
1989
1990
1991
1992
1993
1994
1995
1997
1998
1999
2000
2002
2003
2004
Year
Trou
t juv
enile
N= 90 91 53 51 57 59 59 69 148 44 57 123 82 102 17 39 139 35
N= 92 93 55 53 58 60 61 72 151 47 59 126 82 105 17 39 145 35
N= 92 93 55 53 58 60 61 72 151 47 59 126 82 105 17 39 145 35
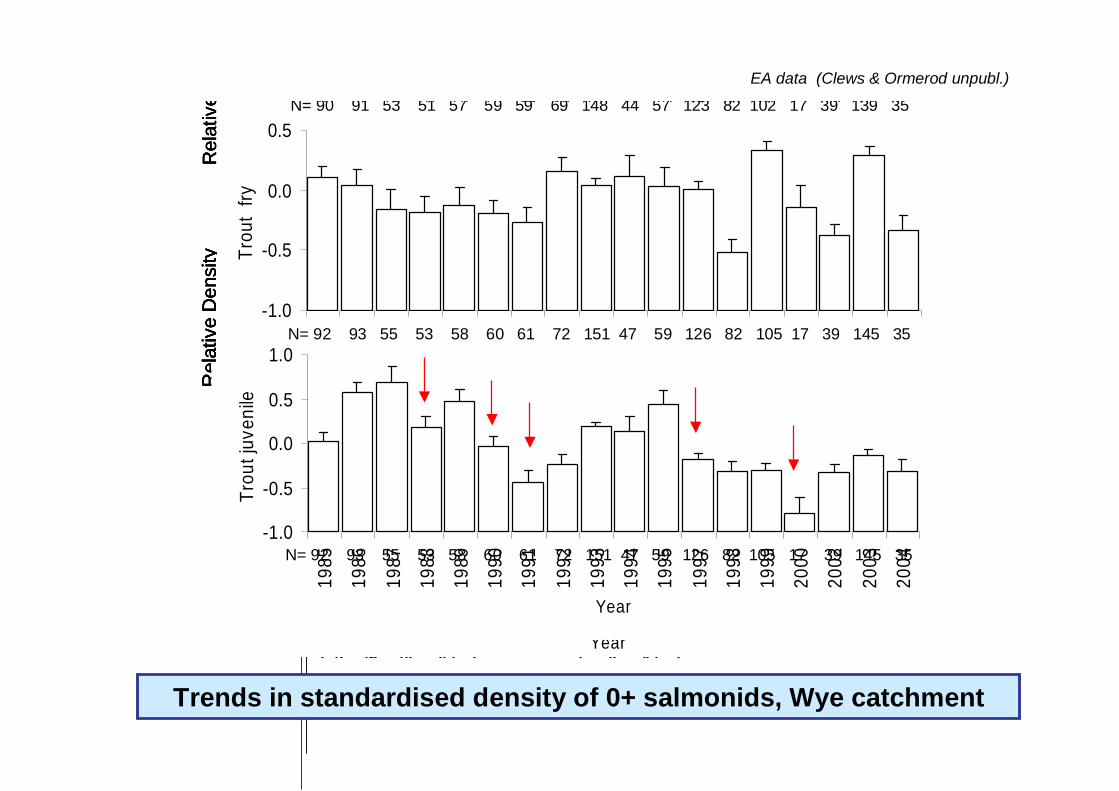
Trends in standardised density of 0+ salmonids, Wye catchment
EA data (Clews & Ormerod unpubl.)
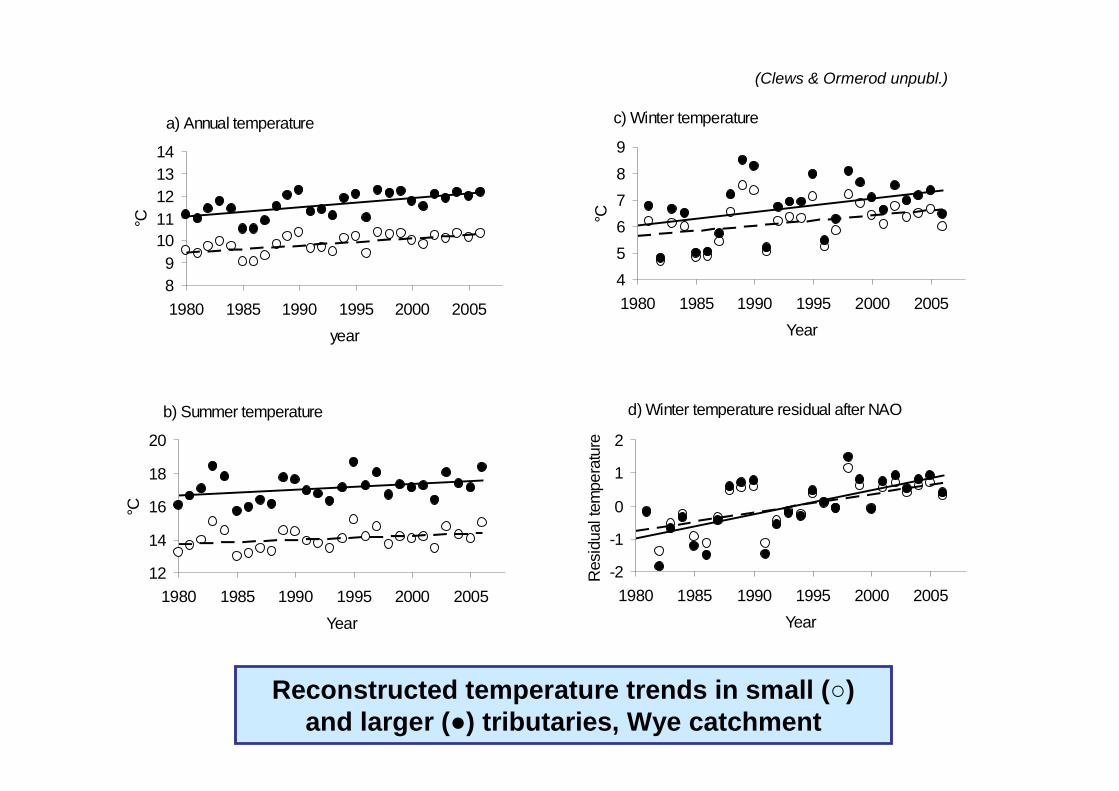
b) Summer temperature
12
14
16
18
20
1980 1985 1990 1995 2000 2005Year
°C
c) Winter temperature
456789
1980 1985 1990 1995 2000 2005Year
°C
d) Winter temperature residual after NAO
-2
-1
0
1
2
1980 1985 1990 1995 2000 2005Year
Res
idua
l tem
pera
ture
a) Annual temperature
89
1011121314
1980 1985 1990 1995 2000 2005year
°C
(Clews & Ormerod unpubl.)
Reconstructed temperature trends in small (○) and larger (●) tributaries, Wye catchment
0
5
10
15
-2 -1 0 1 2
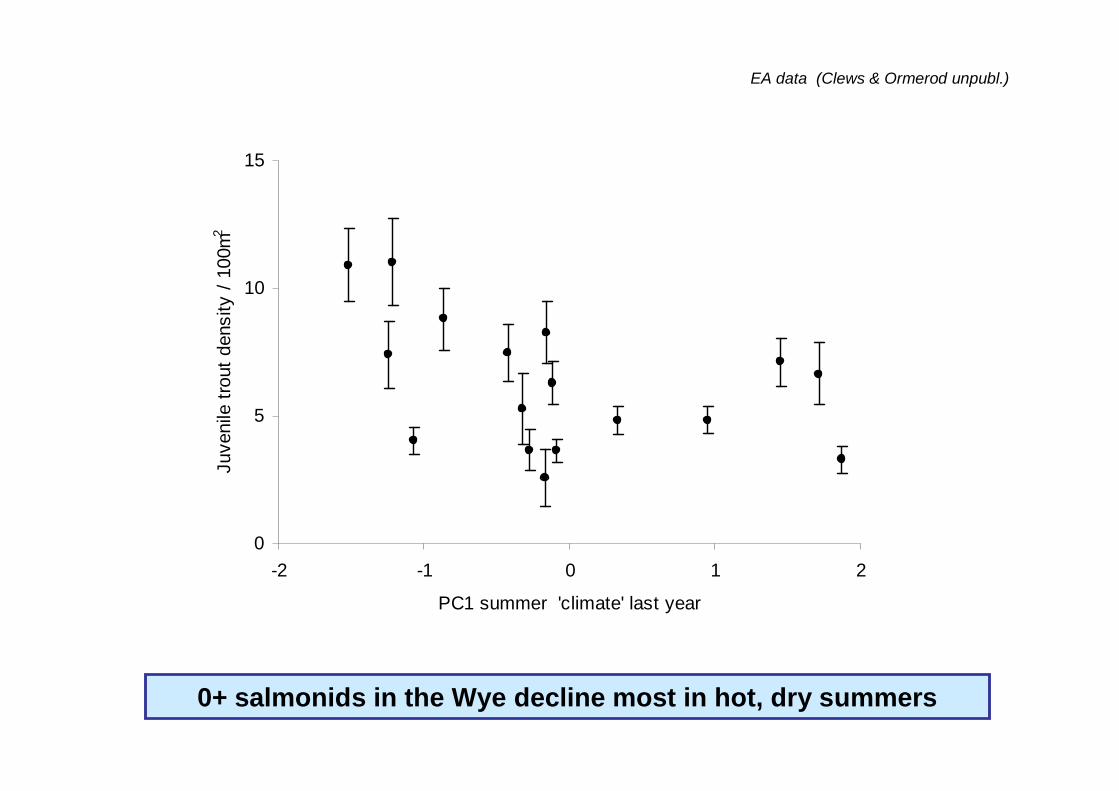
PC1 summer 'climate' last year
Juve
nile
sal
mon
den
sity
/ 10
0m2
0
5
10
15
-2 -1 0 1 2
PC1 summer 'climate' last year
Juve
nile
trou
t den
sity
/ 10
0m2
EA data (Clews & Ormerod unpubl.)
0+ salmonids in the Wye decline most in hot, dry summers
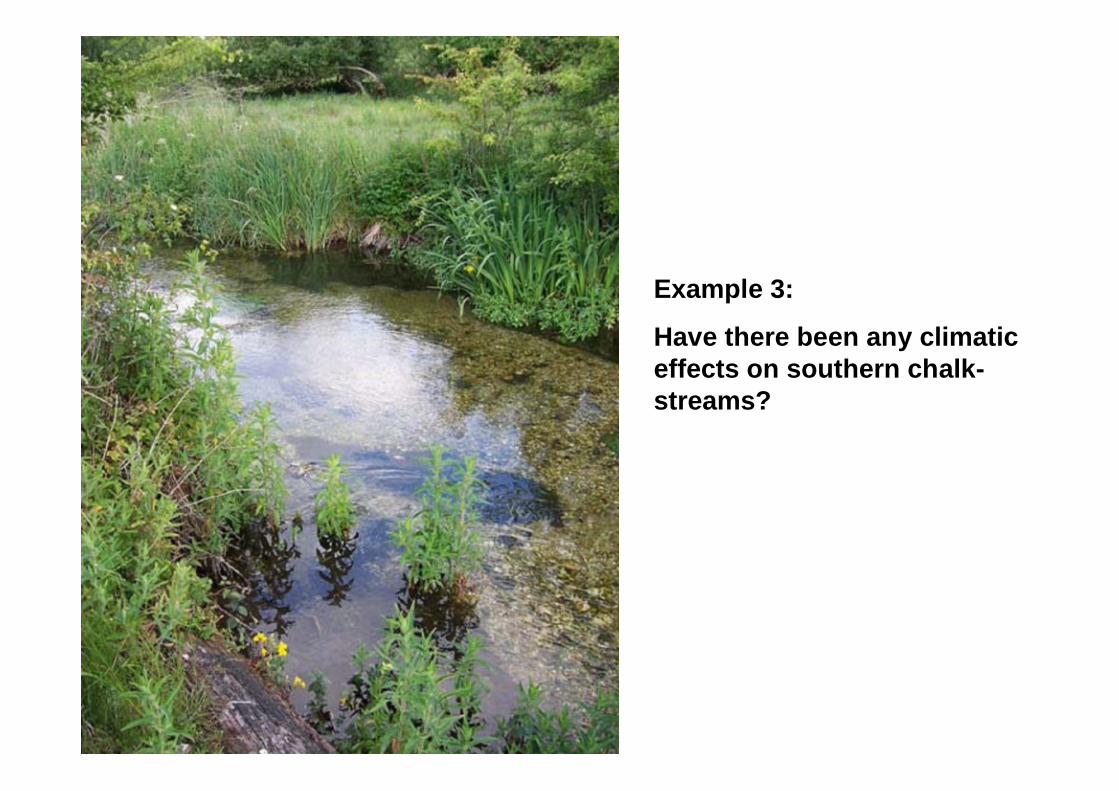
Example 3:
Have there been any climaticeffects on southern chalk-streams?
Llyn Brianne winter
0
2
4
6
8
10
12
1975 1980 1985 1990 1995 2000 2005 2010
Years
°C
Residuals after NAO effects
-1.5
-1
-0.5
0
0.5
1
1.5
1975 1980 1985 1990 1995 2000 2005 2010
Years
Res
idua
ls f
rom
NAO
Itchen winter
0
2
4
6
8
10
12
1975 1980 1985 1990 1995 2000 2005 2010
Years
°C
Residuals after NAO effects
-4
-3
-2
-1
0
1
2
3
1975 1980 1985 1990 1995 2000 2005 2010
Years
Res
idua
ls f
rom
NAO
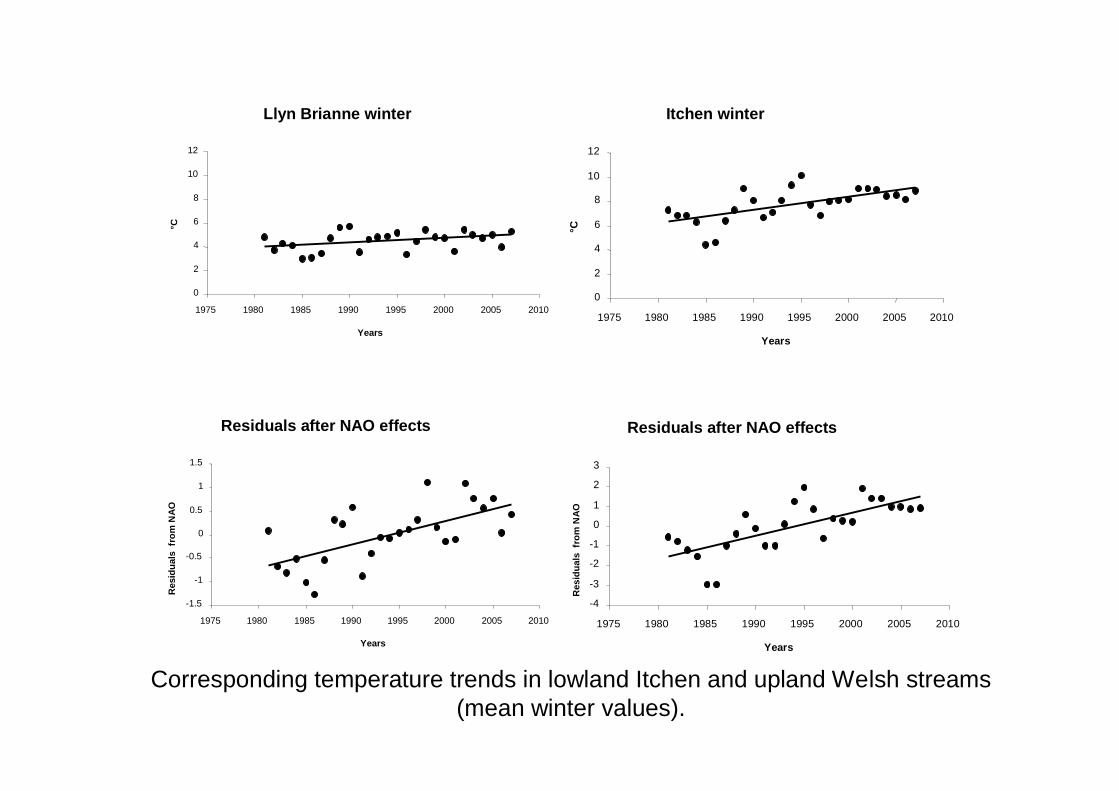
Corresponding temperature trends in lowland Itchen and upland Welsh streams(mean winter values).
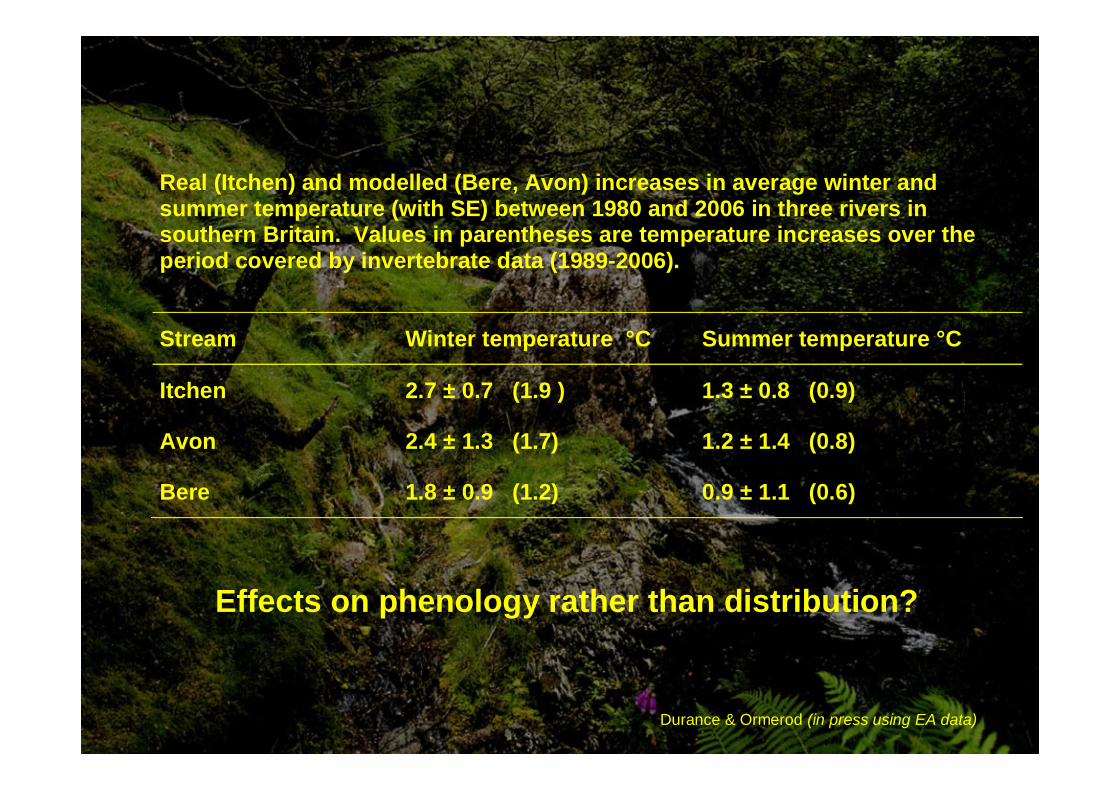
Real (Itchen) and modelled (Bere, Avon) increases in average winter and summer temperature (with SE) between 1980 and 2006 in three rivers in southern Britain. Values in parentheses are temperature increases over the period covered by invertebrate data (1989-2006).
Stream Winter temperature °C Summer temperature °C
Itchen 2.7 ± 0.7 (1.9 ) 1.3 ± 0.8 (0.9)
Avon 2.4 ± 1.3 (1.7) 1.2 ± 1.4 (0.8)
Bere 1.8 ± 0.9 (1.2) 0.9 ± 1.1 (0.6)
Durance & Ormerod (in press using EA data)
Effects on phenology rather than distribution?
Group 1
0.8
1
1.2
1.4
1.6
1.8
2
2.2
1988 1993 1998 2003
Years
Aver
age
DC
A1
scor
es
Year
DC
A1
(a)
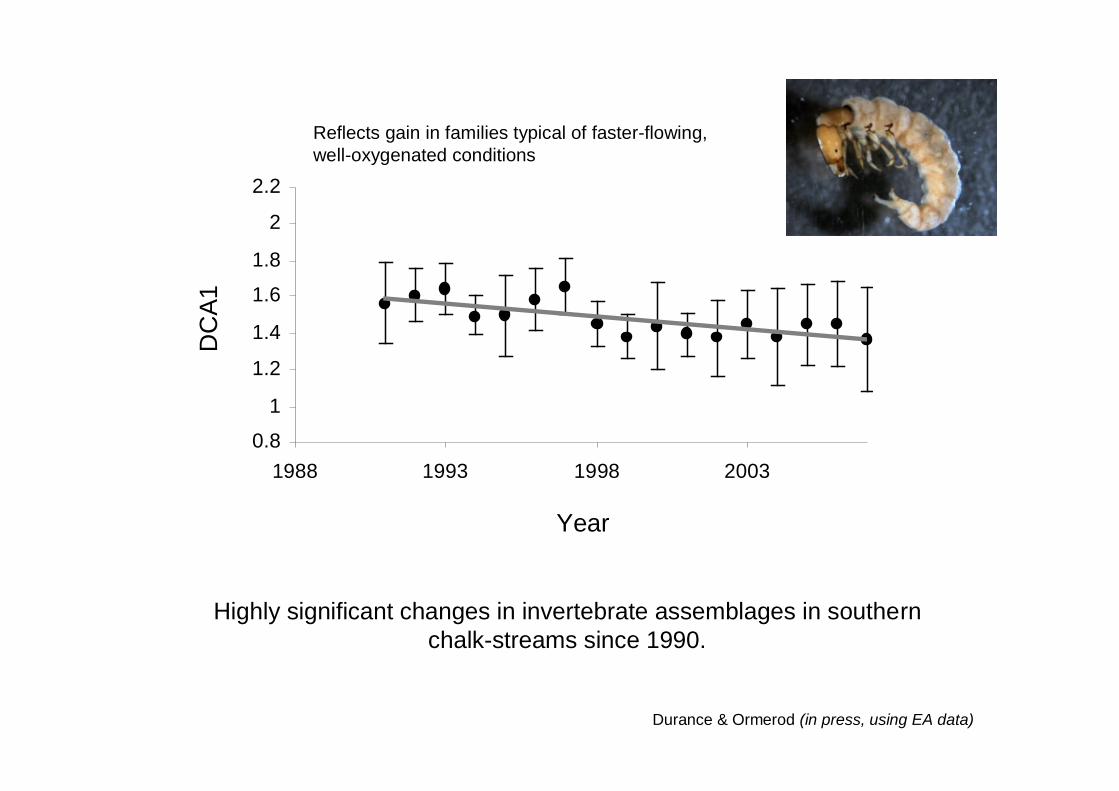
Highly significant changes in invertebrate assemblages in southern chalk-streams since 1990.
Durance & Ormerod (in press, using EA data)
Reflects gain in families typical of faster-flowing, well-oxygenated conditions
Year
mg/
l
2007
2006
2005
2004
2003
2002
2001
2000
1999
1998
1997
1996
1995
1994
1993
1992
1991
1990
2.6
2.4
2.2
2.0
1.8
1.6
1.4
1.2
1.0
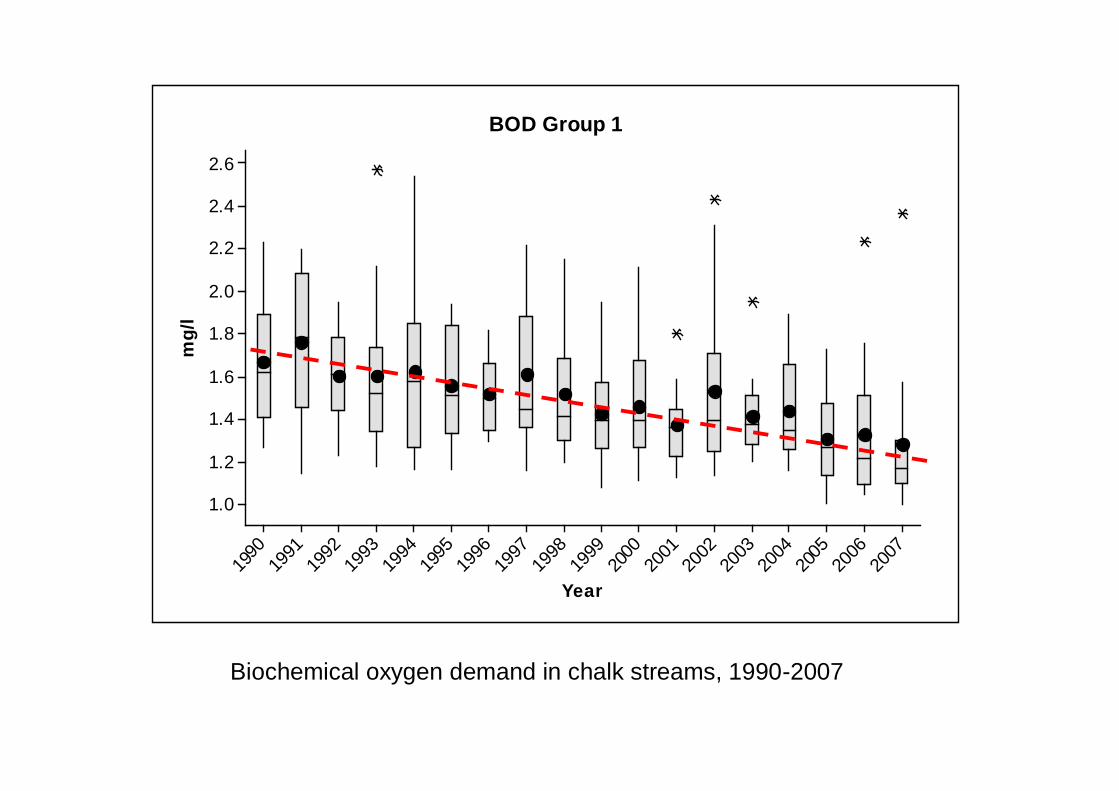
BOD Group 1
Biochemical oxygen demand in chalk streams, 1990-2007
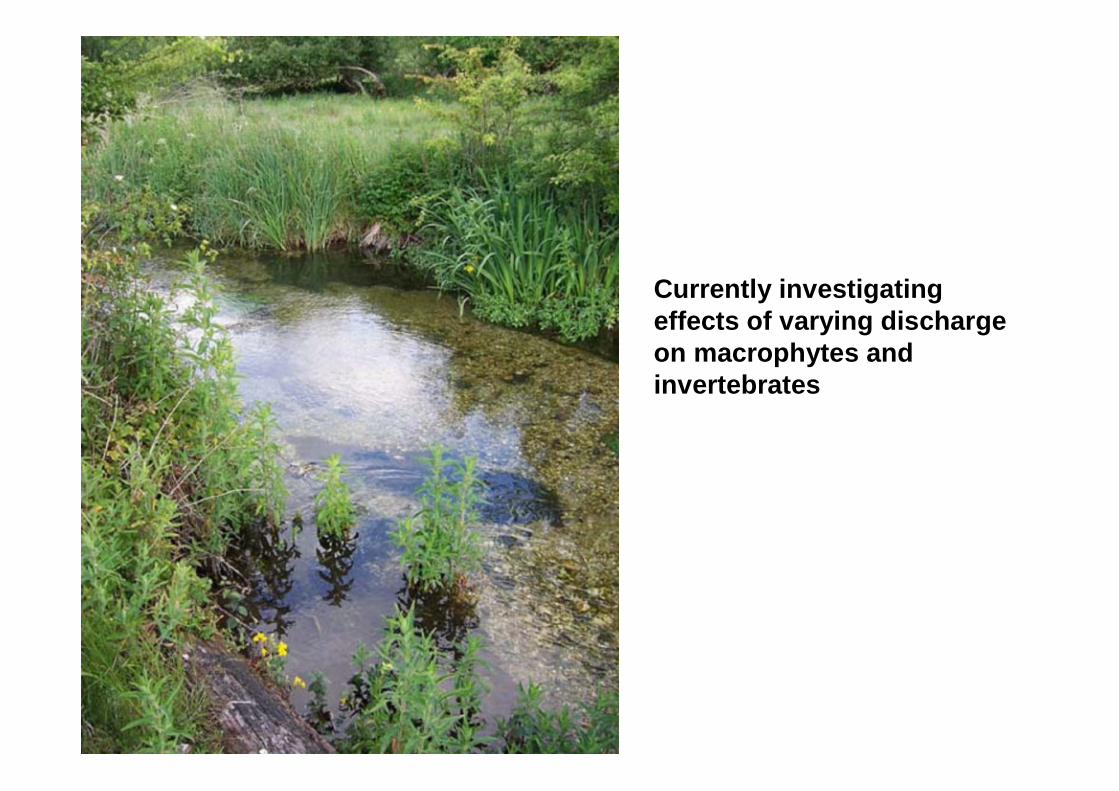
Currently investigatingeffects of varying dischargeon macrophytes andinvertebrates
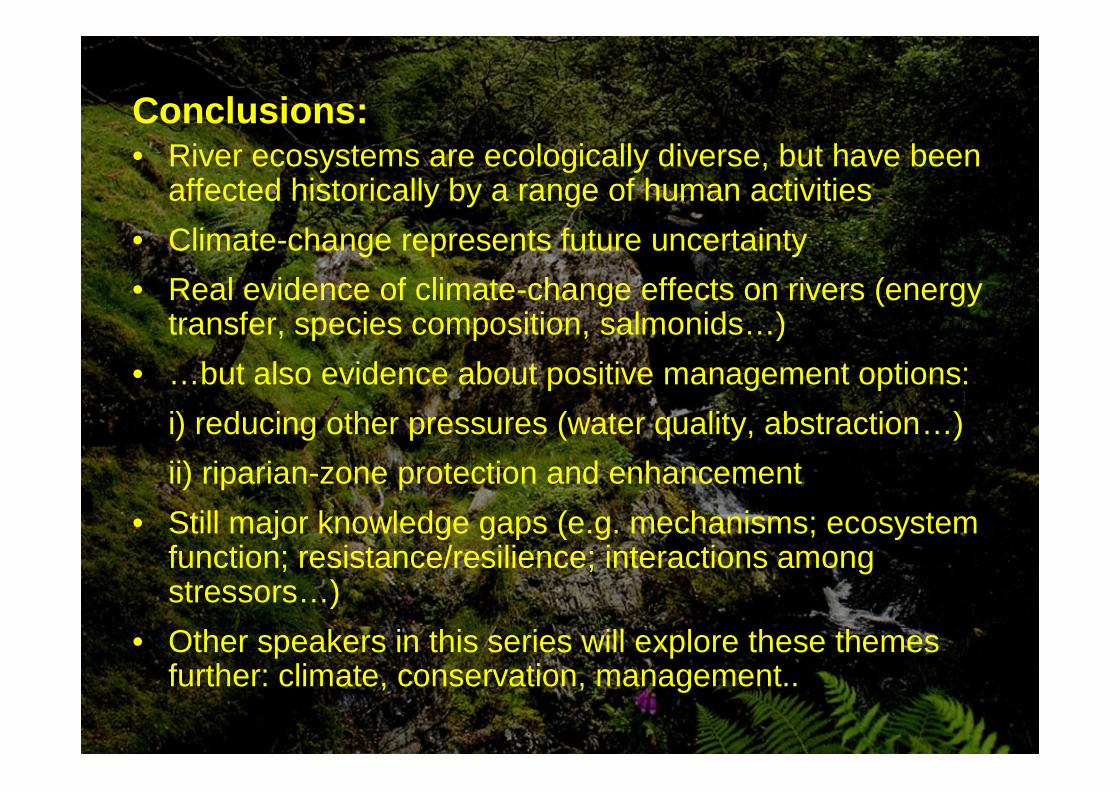
Conclusions:• River ecosystems are ecologically diverse, but have been
affected historically by a range of human activities• Climate-change represents future uncertainty• Real evidence of climate-change effects on rivers (energy
transfer, species composition, salmonids…)• …but also evidence about positive management options:
i) reducing other pressures (water quality, abstraction…)ii) riparian-zone protection and enhancement
• Still major knowledge gaps (e.g. mechanisms; ecosystem function; resistance/resilience; interactions among stressors…)
• Other speakers in this series will explore these themes further: climate, conservation, management..