Embed Size (px)
Citation preview

www.thegreenl inkgroup.com 1
Orlando City Energy Project Impact Study (2015-2030) Prepared for: Office of Sustainability & Energy, City of Orlando
Prepared by: The Greenlink Group Date: October 12, 2015

www.thegreenl inkgroup.com 2
www.thegreenl inkgroup.com 3
EXECUTIVE SUMMARY Nationally, buildings are responsible for 40% of all energy consumption. In Orlando, building consumption represents 53% of the region’s total energy use, with much of it used inefficiently. Recent studies have found that Orlando’s commercial sector improvement in energy efficiency over the course of the past decade ranked 48th of 100 cities nationally.1 While this figure places Orlando as very close to the median in energy efficiency improvements, commercial energy intensity (energy-in/GDP) in Orlando is still three times greater than the leaders in the South Atlantic region. Inefficient energy use leads to increased energy expenditures, pulling resources away from other productive uses in Orlando’s economy each year that could otherwise be used to expand economic development. Improving the energy efficiency of the Orlando economy would have spillover benefits beyond the pocketbook, however; avoided pollution will increase the health and quality of life for current residents and the overall appeal of the City Beautiful for all.
1 Cox, William Matthew. 2014. “Sustaining the City: Understanding the Role of Energy and Carbon Dioxide Emissions in Sustainable Development in Major Metropolitan Areas.” Doctoral Dissertation, Georgia Institute of Technology. Available at: https://smartech.gatech.edu/handle/1853/52316
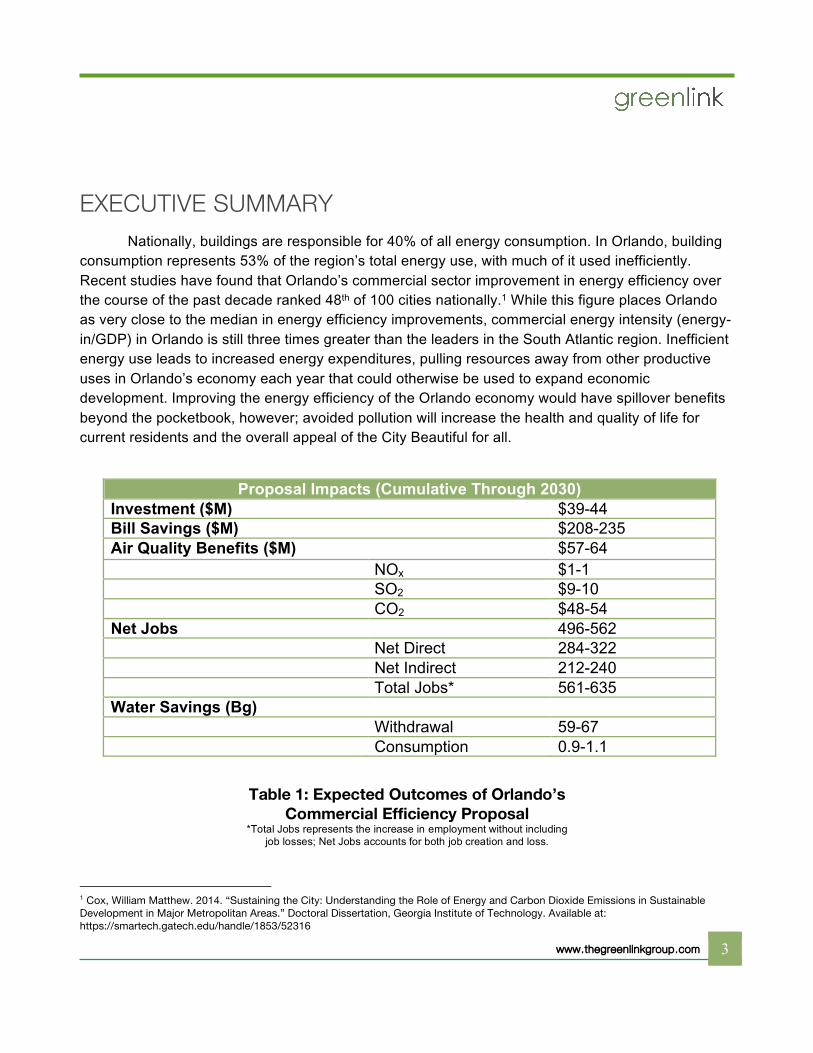
Proposal Impacts (Cumulative Through 2030) Investment ($M) $39-44 Bill Savings ($M) $208-235 Air Quality Benefits ($M) $57-64 NOx $1-1 SO2 $9-10 CO2 $48-54 Net Jobs 496-562 Net Direct 284-322 Net Indirect 212-240 Total Jobs* 561-635 Water Savings (Bg) Withdrawal 59-67 Consumption 0.9-1.1
Table 1: Expected Outcomes of Orlando’s Commercial Efficiency Proposal
*Total Jobs represents the increase in employment without including job losses; Net Jobs accounts for both job creation and loss.
www.thegreenl inkgroup.com 4
Proposed legislation to improve the energy performance of the commercial sector in the City of Orlando is under development. To capitalize on the various benefits commercial energy efficiency offers to the City of Orlando, this proposal includes benchmarking, market transparency, energy audits, and retrocommissioning. These policy options have been analyzed by the Greenlink Group to provide an assessment of energy savings, investments, job creation, air quality benefits, and water savings in the power sector. The expected benefits are presented in Table 1.
This suite of policies collectively represent a significant opportunity improve the efficient use of energy within the City of Orlando. The policies show a combined benefit-cost ratio of 6.8 and net benefits ranging from $226-255 million (2015-$) through 2030, with the bulk of the benefits accruing through energy bill savings that are returned to commercial sector building owners and tenants.
BACKGROUND
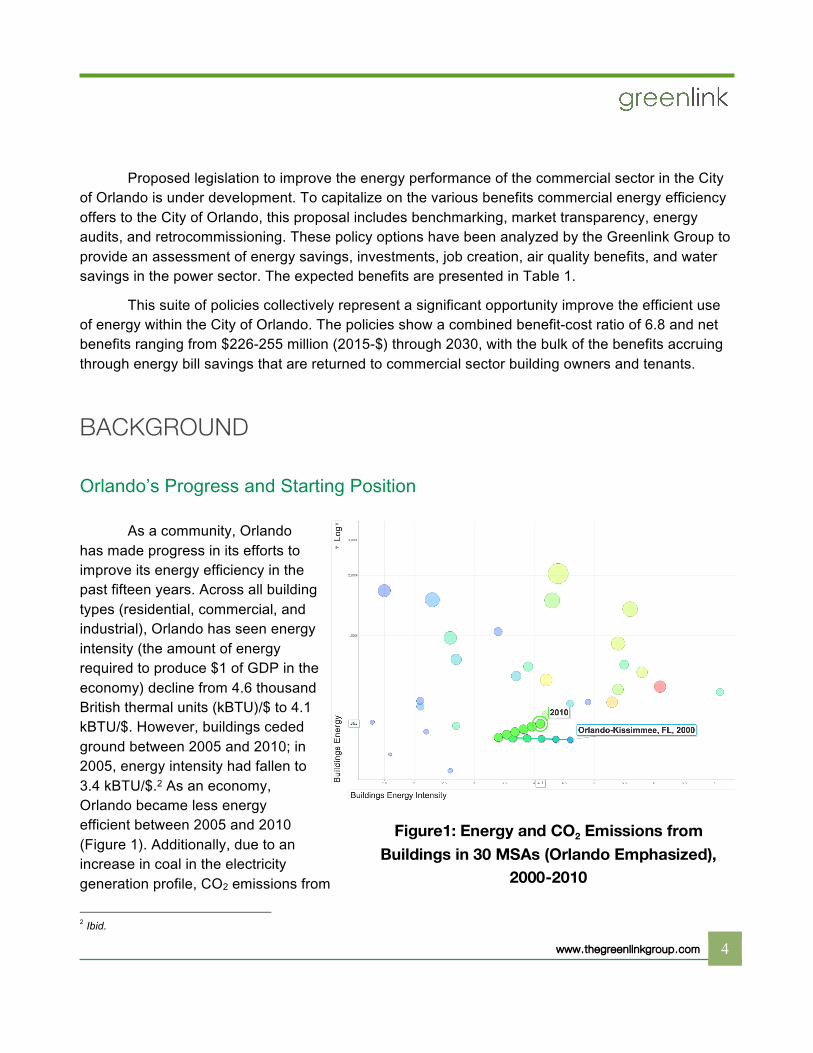
Orlando’s Progress and Starting Position As a community, Orlando has made progress in its efforts to improve its energy efficiency in the past fifteen years. Across all building types (residential, commercial, and industrial), Orlando has seen energy intensity (the amount of energy required to produce $1 of GDP in the economy) decline from 4.6 thousand British thermal units (kBTU)/$ to 4.1 kBTU/$. However, buildings ceded ground between 2005 and 2010; in 2005, energy intensity had fallen to 3.4 kBTU/$.2 As an economy, Orlando became less energy efficient between 2005 and 2010 (Figure 1). Additionally, due to an increase in coal in the electricity generation profile, CO2 emissions from
2 Ibid.
Figure1: Energy and CO2 Emissions from Buildings in 30 MSAs (Orlando Emphasized),
2000-2010

www.thegreenl inkgroup.com 5
building energy consumption increased substantially (color and circle-size represent carbon intensity and CO2 footprint, respectively – a warmer color signifies higher carbon intensity, and a larger bubble signifies a bigger CO2 footprint). Across all buildings, Orlando showed an 11% improvement in energy efficiency. Within the rest of the South Atlantic census division, Durham, NC and Palm Bay, FL showed the most dramatic movement in this figure, exceeding a 25% improvement.3
In looking specifically at the commercial sector, the Orlando region has seen an improvement
in energy efficiency, reducing the amount of energy required to produce a dollar of GDP from 2.7 kBTU/$ in 2000 to 1.8 kBTU/$ in 2010. However, nearly all of the improvements in energy performance occurred between 2000 and 2005; the difference between 2005 and 2010 was only 0.1 kBTU/$. While progress in commercial energy efficiency over the course of the decade was significant, improvements essentially stalled for the last half of it.4
Nationally, Orlando’s commercial sector ranked 46th in energy intensity and 48th in energy improvement, making it roughly average on the national stage (Table 2). Leading areas show energy intensities that are three to four times better, including Miami, with 0.5 kBTU/$ in commercial energy intensity in 2010. Of the 7 major metro regions within Florida (Miami, Tampa, Orlando, Jacksonville, Cape Coral, Sarasota, and Palm Bay), Orlando’s commercial sector ranked 3rd, behind Miami and Tampa and just ahead of Jacksonville. This demonstrates that while Orlando has been improving commercial energy efficiency, there remains an opportunity to accelerate progress in this area.
2010 Commercial
Ranks
Energy Intensity*
Carbon Intensity*
Energy Improvement a
Carbon Improvement a
Orlando 46 79 48 97 Miami 2 8 20 45
Charlotte 24 15 33 24 Atlanta 37 63 93 81 Tampa 40 77 24 32
3 Ibid. 4 Ibid.
Table 2: 2010 Commercial Energy and CO2 Rankings for Orlando *Intensity rankings shown as per-GDP for commercial buildings footprints.
aImprovement rankings show what rank the MSA scored; a “1” would be the “most improved” MSA on a percentage basis.
www.thegreenl inkgroup.com 6
PROPOSAL
How to Accelerate Commercial Energy Efficiency With the benefits of realizing improved commercial building energy efficiency (energy savings, water savings, public health, job creation, economic development, quality of life improvements, etc), the City of Orlando has crafted a legislative proposal that draws on the experience of other cities across the United States to improve performance through better information. To date, fourteen cities, one county, and two states have adopted legislation specifically focused on the information barriers that halt or slow commercial building energy efficiency; the cities include Atlanta, Austin, Berkeley, Boston, Cambridge, Chicago, Kansas City MO, Minneapolis, New York City, Philadelphia, Portland (OR), San Francisco, Seattle, and Washington, DC, and represent over 6 billion square feet of commercial floorspace. While there are variations between all of these ordinances, two basic components are constants: benchmarking and market transparency.
Benchmarking energy and water consumption is a process that allows a building owner or property manager to understand how a particular building is performing by establishing a baseline and tracking these variables over time. Without such information, it is virtually impossible for a building operator to state with any confidence how any building is trending or whether internal performance goals are being met. A building operator that benchmarks collects critical information that enables an intelligent approach to energy efficiency and on average, takes steps to improve performance.
Understanding how one building is performing is important, but does not place that building in any particular context. Market transparency policies overcome this information gap; benchmarked data is reported back to the City government and reported on an annual basis. This allows all market participants to better understand building performance within sectors and provides the City with key information that can help focus next step activities. Beyond these two components, five cities have also adopted audit and retrocommissioning: Atlanta, Austin, Boston, New York City, and San Francisco. These policies seek to further address information barriers to energy efficiency by ensuring that commercial building operators understand the opportunities to improve performance that exist within their own buildings – an audit typically identifies opportunities for retrofits that can save energy, while retrocommissioning focuses on

www.thegreenl inkgroup.com 7
repairs to existing equipment that will improve performance. These programs typically require an ASHRAE Level II energy audit, required every five to ten years. Research has been undertaken to understand the effectiveness of benchmarking and transparency policies.5 Using a dataset of 30,000 buildings, Palmer and Walls show that these programs have resulted in a 2% reduction in energy consumption per square foot in participating buildings, and speculate that this is driven largely by the “attentiveness effect”, i.e., it is due to building owners paying attention to energy consumption.6 The Orlando proposal would require buildings that are over 40,000 square feet to benchmark on an annual basis, starting with municipal buildings in 2016 and expanding to the private sector the next year. In 2018, transparency reports would be introduced. Lastly, beginning in 2020, buildings that performed in the bottom half (as rated by the ENERGYSTAR scores generated by Portfolio Manager) would undergo either an energy audit or retrocommissioning study once every five years, so long as the building remained in the bottom half of commercial buildings or failed to show a significant improvement in its performance.
ANTICIPATED IMPACTS7
Energy Savings and Expenditure Savings
Based on the building stock of Orlando, savings potentials identified and observed in other cities with similar programs, anticipated compliance rates, and the existing and future means of meeting the electricity-related energy needs, the bill savings, investments, job creation potential, and air quality benefits of the Orlando proposal were
5 Cox, M., Brown, M. A., & Sun, X. (2013). Energy benchmarking of commercial buildings: a low-cost pathway toward urban sustainability. Environmental Research Letters, 8(3), 035018; Sun, X., Cox, M., & Brown, M. A. (2014). Energy Benchmarking of Commercial Buildings: A Low-Cost Pathway toward Energy Efficiency. ACEEE Summer Study on Energy Efficiency in Buildings 6 Palmer, K. L., & Walls, M. (2015). Can Benchmarking and Disclosure Laws Provide Incentives for Energy Efficiency Improvements in Buildings?.Resources for the Future Discussion Paper, (15-09). 7 For a detailed description of the methodology used in this analysis, please consult the technical appendix
Figure 2: The Value of Energy Savings

www.thegreenl inkgroup.com 8
determined. As over 90% of energy demand in Orlando’s commercial building stock is met through the use of electricity, the analysis focuses on electricity-related savings. Each of these impact areas will be briefly covered. Energy savings start slowly due to the limited scale of the municipal portfolio relative to the sector as a whole. In total, energy savings are expected to increase rapidly through 2020. The value of energy savings approaches $23 million (2015-$) by the end of the decade; cumulative savings are $208 million by 2030 (Figure 2). While many of these energy saving opportunities may appear due to increased attentiveness towards energy and water use and incur no cost, investments in energy efficiency are also an anticipated outcome of the Orlando proposal. Through 2020, the proposal is expected to drive an investment of $16 million (2015-$), growing to just shy of $40 million cumulatively through 2030. Job Impacts In addition to the energy savings derived from these investments by building owners and tenants, labor will be used to install the equipment and make the equipment adjustments needed to see energy savings within commercial buildings. As a result, jobs (tracked here in the form of annual years of employment) in the sectors providing these services are expected to increase. At the same time, jobs in the electricity industry supported by the flow of dollars towards that need are expected to correspondingly decline. However, energy efficiency is more labor-intensive than electricity generation, and the net impact is an increase in economic development and job creation for Orlando, as shown in Figure 3. In the peak year of investment, over 100 jobs would be supported in these industries, and in total, there is a net gain of 500 job-years as a result of the proposed policy.
Figure 3: Jobs Created by Year (Top) and Cumulatively (Bottom) through 2030

www.thegreenl inkgroup.com 9
Health and Water Impacts Beyond the dollar savings and the job creation impacts, the proposal would also reduce electricity consumption, and thereby reduce the amount of air pollution and water consumption driven by usage in the commercial buildings sector. The impacts these pollutants have on public health and welfare are well documented, having led to the creation of laws like the Clean Air Act in the 1970s. These benefits have recently become quantifiable through economic studies of the public health costs associated with the emission of a ton of a particular pollutant in a particular place.8 Such an analysis was carried out for the Orlando area, taking into account planned utility plant additions, retirements, and operations, as reported and projected by the US Energy Information Administration. The calculations show that the benefits of better air quality will grow to roughly $5.5 million (2015-$) per year by 2025, with slow increases in annual benefits each year thereafter (Figure 4). In total, this represents a $57-64 million (2015-$) stream of benefits. Similarly, water withdrawals and consumption at power plants (generally used for cooling plants, then mostly condensed and returned to the watershed, with some consumed on-site) is reduced. Through 2020, commercial energy efficiency will reduce water withdrawals for power production by 4.4 billion gallons, reducing water consumption by 69 million gallons. By 2030, the same figures increase to 59 billion gallons of avoided withdrawals from Florida watersheds and avoided consumption of over 900 million gallons.9 Table 3 summarizes the anticipated impacts of the proposal. In total, the net benefits of the proposal are $226-255 million, with a benefit/cost ratio of 6.8. Commercial building owners and tenants are the primary beneficiaries of their efficiency investments, seeing a bill savings of $5.3 per $1 invested in efficiency through 2030;
8 Ibid. 9 Ibid.
Figure 4: Air Quality Benefits from Increased Commercial Efficiency

www.thegreenl inkgroup.com 10
these savings represent 75% of the quantified benefits for the proposal, with the rest accruing to the public as avoided health expenditures.
Proposal Impacts (Through 2020)
Proposal Impacts (Through 2030)
Investment ($M) $16-19 $39-44 Bill Savings ($M) $15-17 $208-235 Air Quality Benefits ($M)
$4.3-4.8 $57-64
NOx $0.1-0.1 $1-1 SO2 $0.6-0.7 $9-10 CO2 $3.6-4.1 $48-54 Total Costs $16-19 $39-44 Total Benefits $19.3-21.8 $265-299 Benefit/Cost Ratio 1.2 6.8 Net Jobs 198-224 496-562 Direct 113-128 284-322 Indirect 85-96 212-240 Total Jobs 222-251 561-635 Water Savings (Bg) Withdrawal 4.4-5.0 59-67 Consumption 0.07-0.08 0.9-1.1
CONCLUSION
The proposed commercial building efficiency policy would yield significant quantifiable benefits exceeding $200 million (2015-$) through 2030 for Orlando, with the monetary values of other benefits being additional to this total. 75% of the quantifiable benefits would accrue to the building owners and occupants. Co-benefits from the proposal would include the economic development impacts of an additional 500-550 job-years (net) and significant ecological benefits due to the avoided water withdrawals and consumption within from the electric power sector. The
Table 3: Proposal Impacts through 2020 and 2030
www.thegreenl inkgroup.com 11
analysis strongly suggests that the current proposal would produce substantial economic, social and environmental benefits for the Orlando community. The proposal also integrates into the ongoing Greenworks efforts of the City of Orlando, contributing a 1% reduction in electricity consumption and CO2 emissions by 2018. These figures are small because the proposal would have only recently been instituted by this date. At full implementation (2025), these same metrics grow to a 6.5% reduction from 2013 baselines. While this effort would not achieve the Greenworks goals on its own, it would take several steps towards achieving these goals.